Report LNG bunkering financing opportunities Explore financing opportunities, assess and develop financial mechanisms beyond the EU financial framework aiming at supporting the deployment of marine LNG technology Client: European Commission Reference: M&WPB3039-103-100R001D11 Revision: 11/Final Date: 08 June 2016
Transcript
Report
LNG bunkering financing
opportunities
Explore financing opportunities, assess and develop
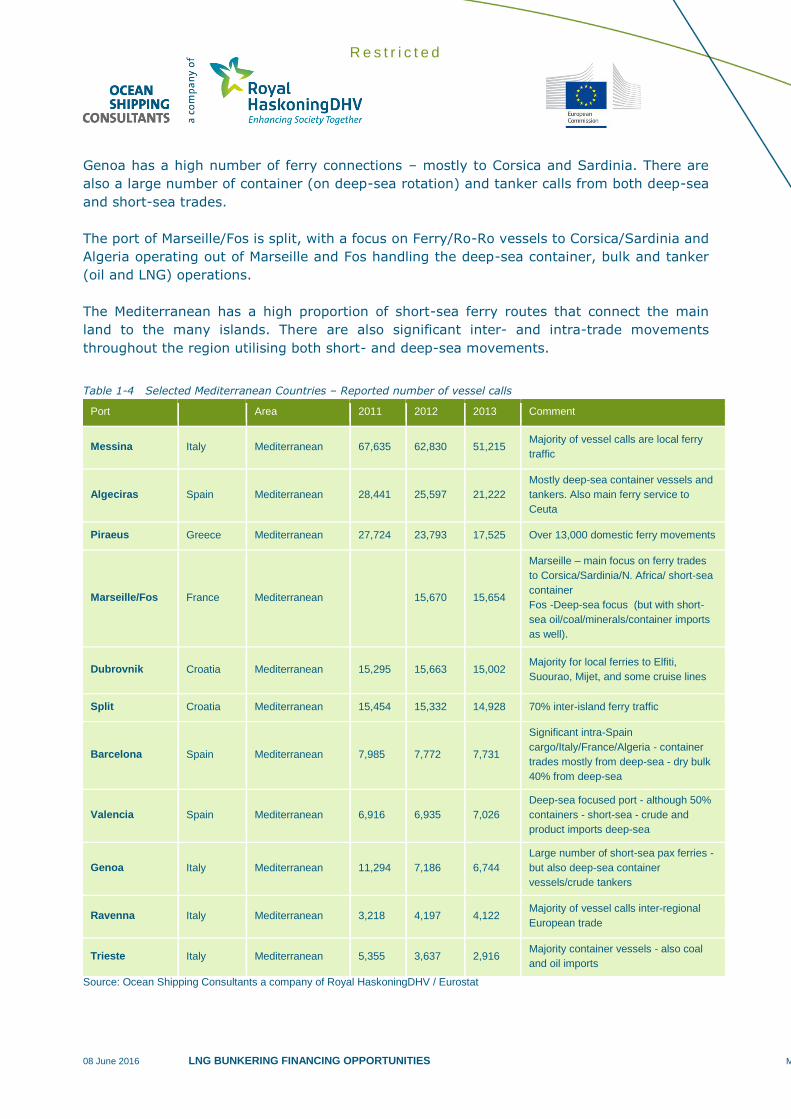
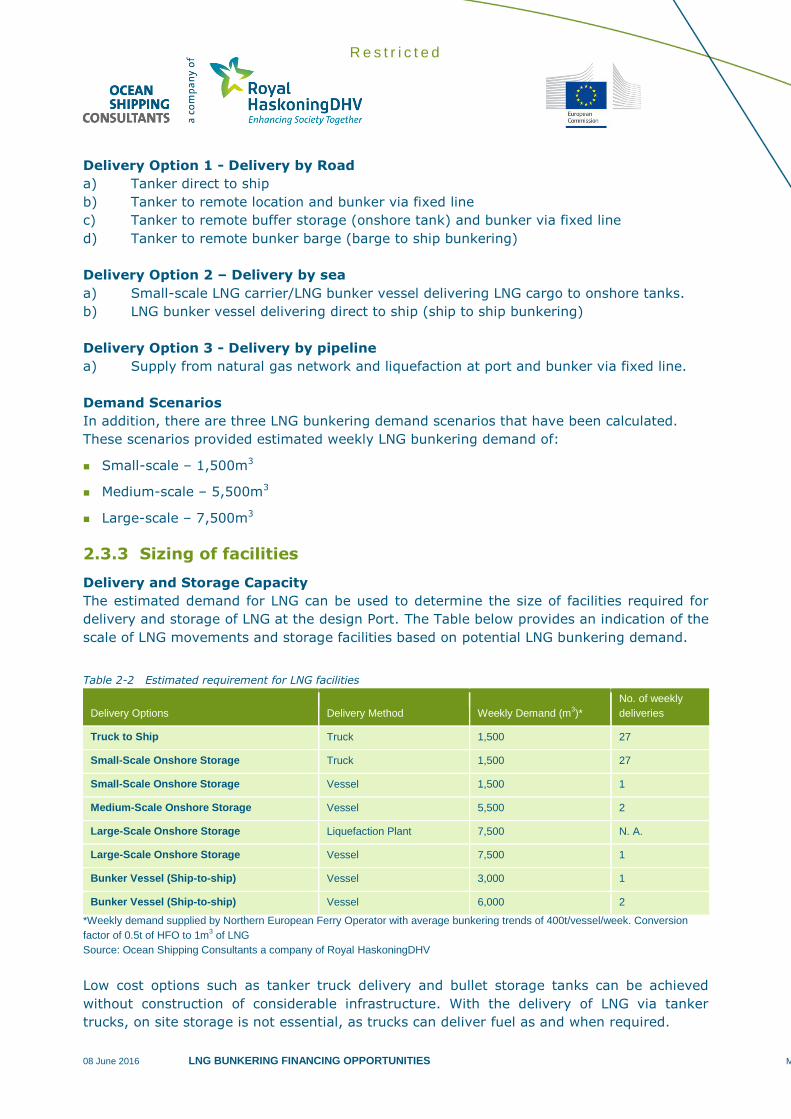
Source: Ocean Shipping Consultants a company of Royal HaskoningDHV / Eurostat
R e s t r i c t e d
08 June 2016 LNG BUNKERING FINANCING OPPORTUNITIES M&WPB3039-103-100R001D11
26
To highlight the scale and the numbers of vessels operating in European waters, Appendix A
uses a vessel tracking platform that highlights the number of vessels recorded on a single
days (February 13th 2015) for the North Sea, Baltic and Mediterranean. The sectors
highlighted are:
Container vessels
Dry bulk carriers
Crude/product tankers
Passenger Ferries/Cruise vessels
Chemical carriers
LNG/LPG carriers
General cargo vessels
RO-RO
Car carriers
Offshore
It should be noted that the vessel information provides an overview of vessels operating in
the region on a particular day. This is a representative snap shot of the number of vessels
operating in European waters. This investigation into the number of vessels operating in
European waters showed that there were approximately 8,000 vessels.
Appendix A highlights the number of vessels in each area by sector. Within each sector
vessels that are moving, at anchor, moored or not moving are represented. This also
includes in-land vessels.
1.3 LNG as a bunker fuel
LNG as a bunker fuel has significant potential to alter the configuration of the existing vessel
fuel market. LNG is seen as a more environmentally friendly fuel than heavy and distillate
fuels. As such it can be used as one of the possible solutions to enable shipowners to
become environmentally compliant in Emission Control Areas (ECAs). However, it is
understood that the financial viability of LNG as a fuel needs to be considered and
investigated to ensure that its uptake is economical for both the vessel and its owner.
Developments in the past decade on the production of unconventional gas, particularly in the
United States, have created a boost in supply of natural gas. At the same time, gas demand
in other sectors (most notably power generation and industry) has been relatively low in
many parts of the world due to the economic recession. These developments have had a
major impact on regional price levels, trade movements and the supply/demand balance.
The past decade has also seen a continuing growth of the share of LNG in the supply of
natural gas. New liquefaction plants and regasification plants continue to come online,
adding to the overall strong development of the global LNG market.
R e s t r i c t e d
08 June 2016 LNG BUNKERING FINANCING OPPORTUNITIES M&WPB3039-103-100R001D11
27
In addition to the abundant supply of gas, increased environmental awareness of ship-based
emissions has encouraged discussion and implementation of Emission Control Areas (ECAs),
where a specific stepwise approach to SOx emission reductions has been adopted. In this
context LNG as an alternative fuel for shipping has lower emissions of sulphur, NOX and PM
as well as other advantages when compared to vessels fitted with other abatement
technologies. The business cases for retrofits and newbuilds are very different however, with
a shipowner often led to choose between abatement methods as a function not only of
technical/operational factors but also remarkably on the basis of payback time calculations.
With the above into account, demand for LNG as a bunker fuel is forecast to increase
throughout the next decade and beyond. The following section highlights some of the main
vessel sectors that will benefit from LNG as a bunker fuel and examines the potential
number of LNG-fuelled vessels through to 2030.
Current Operating LNG-Fuelled Fleet
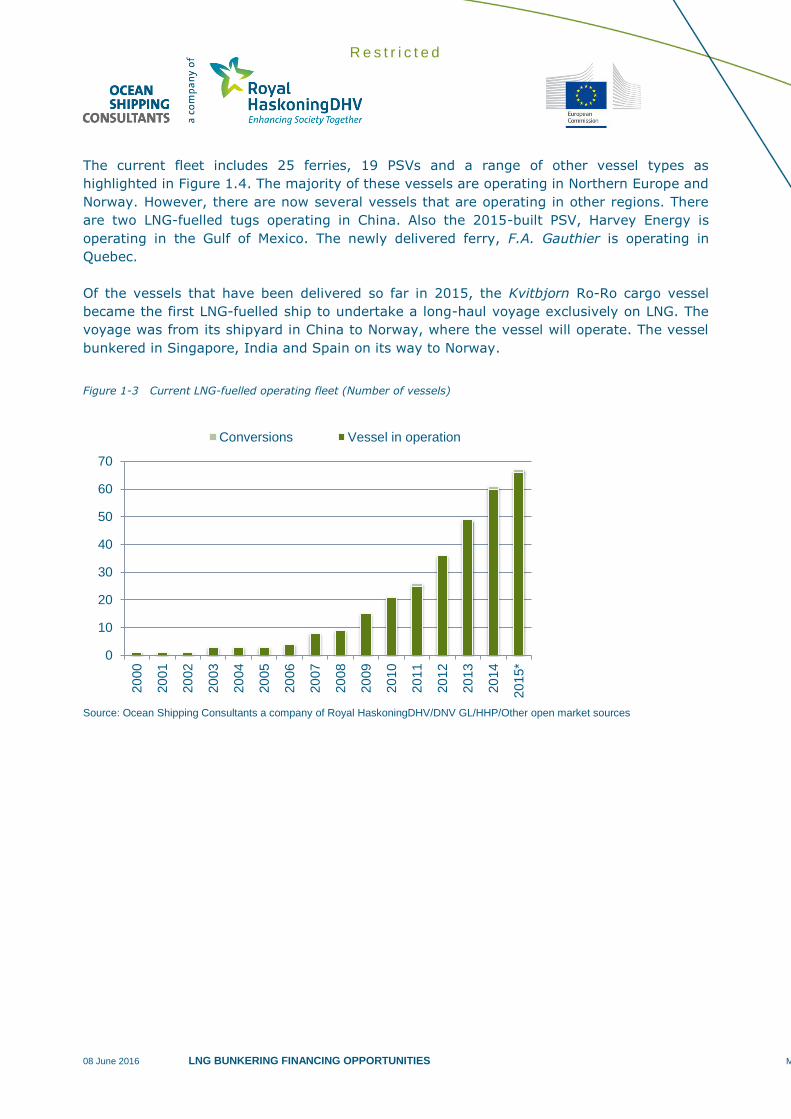
The current global fleet operating on LNG-bunkers amounts to 102 vessels (as of end-2015),
as shown in Figure 1.3. The fleet consists of the first vessel to utilise LNG as a fuel, the
2000-built ferry Glutra, to the recently delivered PSV, Stril Barents. The fleet also includes
seven inland barges that are operating in Northern Europe and three vessels that have been
converted to operate on LNG.
Figure 1.1 Glutra – 2000-built LNG-fuelled ferry
Figure 1.2 Stril Barents – 2015-built PSV
R e s t r i c t e d
08 June 2016 LNG BUNKERING FINANCING OPPORTUNITIES M&WPB3039-103-100R001D11
28
The current fleet includes 25 ferries, 19 PSVs and a range of other vessel types as
highlighted in Figure 1.4. The majority of these vessels are operating in Northern Europe and
Norway. However, there are now several vessels that are operating in other regions. There
are two LNG-fuelled tugs operating in China. Also the 2015-built PSV, Harvey Energy is
operating in the Gulf of Mexico. The newly delivered ferry, F.A. Gauthier is operating in
Quebec.
Of the vessels that have been delivered so far in 2015, the Kvitbjorn Ro-Ro cargo vessel
became the first LNG-fuelled ship to undertake a long-haul voyage exclusively on LNG. The
voyage was from its shipyard in China to Norway, where the vessel will operate. The vessel
bunkered in Singapore, India and Spain on its way to Norway.
Figure 1-3 Current LNG-fuelled operating fleet (Number of vessels)
Source: Ocean Shipping Consultants a company of Royal HaskoningDHV/DNV GL/HHP/Other open market sources
0
10
20
30
40
50
60
70
20
00
20
01
20
02
20
03
20
04
20
05
20
06
20
07
20
08
20
09
20
10
20
11
20
12
20
13
20
14
20
15*
Conversions Vessel in operation
R e s t r i c t e d
08 June 2016 LNG BUNKERING FINANCING OPPORTUNITIES M&WPB3039-103-100R001D11
29
Figure 1-4 Current LNG-fuelled operating fleet – vessel type (Number of vessels)
Source: Ocean Shipping Consultants a company of Royal HaskoningDHV/DNV GL/HHP/Other open market sources
The current LNG-Fuelled Orderbook
The current orderbook for LNG-fuelled vessels contains approximately 160 units. There are
over 86 vessels scheduled to be delivered during the remainder 2016, with a further 33
vessels during 2017, as shown in Figure 1.5.
Of the current orderbook, over 30 vessels are container ships, as highlighted in Figure 1.6.
The largest order is for six container ships from UASC, of which five will by 15,000 TEU and
one will be 18,000 TEU. These vessels will be ‘LNG Ready’, meaning that they will need an
up-grade in the future to utilise LNG. These vessels have been ordered to eventually operate
on LNG, when there is sufficient LNG-bunkering infrastructure in place. MOL have also
ordered six 20,000 TEU container vessels, these vessels will also be ‘LNG ready’.
There are 20 product tankers on order. Of these Crowley Maritime have ordered six. These
tankers will be ‘LNG ready’ – and will have the fuel tanks mounted on deck.
There are 21 ferries on order. These newbuilds have a diverse range of propulsion systems –
ranging from pure LNG operations to dual-fuel, through to hybrid systems that utilise LNG
and battery propulsion.
There are 11 bunker vessels currently on order. These vessels have been ordered by Shell,
Mitsubishi/GDF Suez/NYK, Veka Deen LNG and Anthony Veder. The bunker vessels range
from 2,250-6,500m3
0
5
10
15
20
25
R e s t r i c t e d
08 June 2016 LNG BUNKERING FINANCING OPPORTUNITIES M&WPB3039-103-100R001D11
30
Figure 1-5 Current LNG-fuelled orderbook – by year of delivery (Number of vessels)
Source: Ocean Shipping Consultants a company of Royal HaskoningDHV/DNV GL/HHP/Other open market sources
Figure 1-6 Current LNG-fuelled orderbook – by vessel type (Number of vessels)
Source: Ocean Shipping Consultants a company of Royal HaskoningDHV/DNV GL/HHP/Other open market sources
0
10
20
30
40
50
60
70
80
90
100
2016 2017 2018 2019 2020 2021
0
5
10
15
20
25
30
Conta
iner
Ferr
y
Pro
duct
Tanker
Inla
nd b
arg
e
LN
G B
unker
vessel
Gas C
arr
ier
Pro
d t
anker
PSV
Cru
ise
Pro
d/c
hem
Dre
dger
LEG
carr
ier
RO
PAX
RO
-RO
Tug
Bitum
en t
anker
ConR
o
Gen.
Carg
o
PCTC
Cable
layer
Coasta
l gas c
arr
ier
Energ
y B
arg
e
Ice B
reaker
LN
G c
arr
ier
Sem
i-subm
esib
le…
R e s t r i c t e d
08 June 2016 LNG BUNKERING FINANCING OPPORTUNITIES M&WPB3039-103-100R001D11
31
Vessel Conversions
There are only a few vessels that are either undergoing conversion or are scheduled to be
converted to operate on LNG. Tote, an American vessel owner, was the first to announce
that they would convert two ferries, the Midnight Sun and the North Star.
1.4 Future LNG-fuelled fleet
The current fleet of LNG-fuelled vessels is concentrated in niche or high-specification sectors,
such as offshore support vessels, ferries and Ro-Ro vessels. As mentioned previously, the
current newbuilds orderbook highlights that, in the longer-term, a wider range of vessel
types will be constructed, or converted, for the use of LNG as bunker fuel.
Short-sea vessels that spend the majority of their operating time in ECAs (and future ECAs)
are ideally placed to take advantage of LNG as a bunker fuel. In addition, the developing
bunkering market is forecast to enable larger long-haul vessels to utilise LNG as a fuel.
The North Sea and Baltic Sea already have a number of vessels that use LNG as a fuel. The
majority of these vessels operate on short-sea voyages. These include:
Glutra -2000-built ferry
Stril Pioneer – 2003-built PSV
Bergensfjord – 2006-built ferry
Korsfjord – 2011-built ferry
Viking Princess – 2012-built PSV
Viking Grace – 2013-built cruise ferry
Bergenfjord – 2014-built cruise ferry
Stril Barents – 2015-built PSV
Each of the main shipping sectors is considered in terms of their potential for future LNG-
fuelled vessels. Each of the vessel sectors has different operational profiles – which will
determine their applicability as an LNG-fuelled vessel. In addition, other factors are also
important, such as environmental compliance and fuel prices. It should be noted that the
life-cycle economics of a given ship design will never be replaced by only looking at the
operational profile aspects. Construction and maintenance costs also play an important role
when making the decision for an LNG-fuelled design. Nonetheless, only by looking at the
operational profile it is possible to understand how likely it is for LNG to work out as a fuel
for a given design. The main factors to take into consideration in this analysis are:
1. Type of voyages: It is important to distinguish whether the vessel will be engaged in
round-trip regular voyages or if a more irregular voyage pattern is followed as in the
case of “tramp shipping”.
2. Duration of voyages: The duration of the voyage might dictate, if long, that a large
storage capacity may be required with direct influence on the ships general arrangement,
in particular regarding the volume required for LNG storage tanks.
3. Type of Cargo: The type of cargo will influence the location of LNG fuel storage location.
It will also influence the net present value for a given project and the time for investment
pay-back, mostly influenced by the effect of different applied freight rates.
R e s t r i c t e d
08 June 2016 LNG BUNKERING FINANCING OPPORTUNITIES M&WPB3039-103-100R001D11
32
4. Type of operations: Vessels operations may influence the risk & safety case for a given
design. Tug-boats and other special service vessels are work intensive platforms above
deck. Their main dimensions are also mostly influenced by operational requirements. For
both these reasons the location and design arrangement for LNG fuel systems may not
be always easy to draft. Simultaneous operations (SIMOP’s), during LNG bunkering can
be considered a subject where some uncertainty still subsists, thus affecting the
operational analysis study for a given design and, therefore, also its business case.
5. Bunkering: LNG fuel bunkering procedures are still being harmonised. Different LNG
bunkering guidelines have been issued from Classification Societies, SGMF amongst
others. More importantly ISO issued in January 2015 the Technical Specification ISO/TS
18683:2015 providing requirements and recommendations for operator and crew
competency training, for the roles and responsibilities of the ship crew and bunkering
personnel during LNG bunkering operations. Bunkering requirements, if influenced by
typical ship operations at berth, may therefore affect the decision to opt for LNG as fuel.
Highlighted below are the different vessel types and their operational profile/characteristics
and their potential for adoption of LNG as a bunker fuel.
Ferries/RO-PAX – there are significant numbers of short-sea ferries that operate in EU
waters. These vessels are ideally placed to utilise LNG as a bunker fuel. The majority of
the vessels trade on fixed routes which enables bunkering schedules to be tailored to suit
LNG bunkering. Furthermore, aspects such as sizing of the LNG fuel storage tank can be
optimized in order to avoid ageing of LNG. A RO-PAX optimized for a given route can
easily program the tanks to be filled at a minimum threshold close to minimum levels.
This has the potential to optimize the filling times during bunkering and also reduce the
likelihood of the roll-over of the LNG during bunkering, especially for larger tanks. From
an economic perspective, predictability of bunkering is likely to favour commercially
advantageous agreements with LNG bunker suppliers.
A possible problem that can be faced by RO-PAX operators is the simultaneous operations
of LNG bunkering and Embarkation/Disembarkation of passengers.
For ferries operating in Northern European waters, such as the North Sea and the Baltic,
LNG enables vessels to meet the strict ECA requirements. There is increased interest in
LNG for these vessels in the region, with many ship-owners investigating this option,
against other abatement methods such as scrubbers. Short-sea ferries are already
amongst some of the early adopters of LNG bunkers, as already highlighted with the
Viking Grace that trades between Stockholm (Sweden) and Turku (Finland). A more
recent order has been placed by Tallink in late-2014, who has ordered a new LNG-fuelled
ferry for its Tallin-Helsinki route (the vessel is named Megastar). There are several other
examples of LNG-fuelled Ro-Ro vessels that are operating in the Baltic and North Sea
region, such the Fjord Line vessels. This has stimulated interest from other owners to
investigate LNG-powered vessels.
Cross Channel and Mediterranean ferry operations, such as those that support Corsica,
Sardinia and Sicily, as well as the Greek Island trades, could also benefit from LNG fuelled
conversion/newbuilds, especially if LNG is cheaper than conventional fuels.
R e s t r i c t e d
08 June 2016 LNG BUNKERING FINANCING OPPORTUNITIES M&WPB3039-103-100R001D11
33
Offshore (OSV/PSV/AHTS) – as with other vessel types, a major influence on the use of
LNG as a fuel will be where a vessel operates. Already there are a number of PSV vessels
utilising LNG as a bunker fuel in the North Sea.
The varying OSV operational modes represent a design challenge in order to achieve high
fuel efficiency. Full integration of the propulsion systems is needed to optimise the
performance of the thrusters and prime movers. Without having a regular operational
profile, OSVs have to rely on optimisation of fuel consumption by adoption of energy
efficiency strategies. The typical amount of time spent at sea will represent a major
design driver for LNG fuelled OSVs.
The offshore sector has had a major influence on the introduction of gas-fuelled vessels.
The cost benefits of utilising the fuel and the reduced emissions are strong positive
factors in this regard. In addition, LNG-fuelled offshore vessels have been shown to
operate satisfactorily in some of the most demanding North Sea weather conditions.
There is currently a high proportion of offshore vessels in the LNG-fuelled vessel
orderbook (approximately eight vessels), with future orders forecast to increase
significantly. This sector is currently at the fore-front of adopting gas-fuelled vessels.
Tugs – a major influence on the design of vessels will be the location of operation and
the type of work to be undertaken. The work intensive profile of the above deck typical
tug configuration will dictate the LNG fuel location. This will very likely need to be placed
below deck in order to favour structural protection. The size and autonomy of the tug will
be mostly influenced by the fact that LNG-fuelled tugs are able to operate in ports that
are within an ECA. Tugs now account for around three vessels within the LNG-fuelled
orderbook. This sector is one that is expected to significantly expand in the future within
the EU.
Cruise ships– as with ferries and Ro-Ro vessels, some cruise ships follow a regular
voyage pattern, with a number of vessels operating within the Baltic region. However,
depending on the operational profiles of the vessel, there can be extended periods
between ports. Whilst RO-PAX vessels tend to be more regular with regards to their
journey durations, cruise vessels will require the adoption of energy efficient technologies
in addition to a carefully studied LNG fuel consumption estimate in order to size LNG fuel
storage.
There is increasing awareness of environmental protection through more sustainable
forms of travel and holidaying. Increased numbers of passengers are participating in and
encouraging environmental tourism. The cruise industry is also an expanding market.
As owners and operators seek new initiatives to differentiate themselves from the
competition and reduce fuel costs, it is envisaged that gas-fuelled vessels (in this case
either newbuilds or retro-fitting of existing vessels) will enable new opportunities to both
owners and passengers. Vessels trading in and between ECAs could be a major growth
sector for the up-take of LNG as these can cover both Short- and Deep-sea routes.
Some operational aspects regarding LNG as fuel for cruise vessels remain under
development, especially those relating to bunkering operations, Embarkation
/disembarkation of passengers to/from the LNG fuelled cruise ship whilst bunkering, is an
aspect that needs to be addressed.
R e s t r i c t e d
08 June 2016 LNG BUNKERING FINANCING OPPORTUNITIES M&WPB3039-103-100R001D11
34
Containerships – container vessels could benefit from LNG as a bunker fuel, especially if
the majority of their voyages are concentrated in ECAs, such as Northern Europe/Baltic.
However, a major concern for container vessels is the reduction of cargo space due to the
size of the required fuel tanks. This is also a concern for the larger deep-sea vessels. This
would be particularly relevant for short-sea shipping feeder container vessels, but also for
larger deep-sea trade.
However, the economics of potentially cheaper LNG fuel could be a defining motivation for
owners to reduce costs, thus markedly increasing demand for LNG as a bunker fuel in the
future.
Having “LNG-ready” ships can be one option to build now and decide on LNG fuel later.
The architecture of a containership favor’s modularity and it is possible to have the
adoption of LNG later during service life, provided the ship design and relevant fuel
system safety aspects are taken into consideration at early design stages.
The particular case of LNG fuelled containerships can be favoured by the predictability of
the operational profiles. Especially for larger containerships the ports visited and the
speeds kept throughout the journeys tend to be a constant. This can have a very positive
influence on the design of the potential LNG fuel storage system, but also on the
arrangement/tailoring of service framework contracts for LNG bunkering services.
Tankers (crude/product/chemical) – Tankers are ideally placed to benefit from the
use of LNG as a bunker fuel. The Bit Viking product tanker was converted to run on LNG
during 2011, with LNG fuel tanks placed on deck, having minimal impact on the internal
general arrangement and global cargo capacity of the vessel. Even in this very specific
application, it is possible to say that in general the above deck areas for tankers offer
potentially favourable locations for LNG fuel storage. This is however a design driver that
there are no significant practical limitations to this solution, meaning larger crude tankers
could also utilise this concept. Depending on the owners/operators requirements,
potentially this option could result in either the converting of current vessels or ordering
newbuilds for both Short- and Deep-sea vessels. From a naval architecture perspective,
the addition of above deck LNG-fuel tanks has potential to reduce conversion costs as
impact on general arrangement is minimum and, provided the right weight-volume
distribution/balance is achieved it is possible to optimize cargo capacity.
Bulk carriers – as with tankers, bulkers could benefit from LNG as a bunker fuel. There
is significant deck space where fuel tanks could be located, depending on the size and
design of the hatch coverings. As such, deck-based tanks could allow limited impact on
the cargo capacity of the vessel. Unlike Tankers however, bulk carriers tend to be rather
work intensive above deck areas, especially during crane loading/unloading (LO-LO)
operations. This would require external tanks to be provided with dedicated physical
protection measures.
This sector could benefit from future converted or newbuilding vessels.
Also as with tankers, given the fact that the majority of the fleet is not deployed on fixed
itineraries (unlike cruise ships, ferries etc.), the main restriction to LNG adoption might
R e s t r i c t e d
08 June 2016 LNG BUNKERING FINANCING OPPORTUNITIES M&WPB3039-103-100R001D11
35
come from a limited infrastructure (i.e. insufficient number / spread of bunkering
locations).
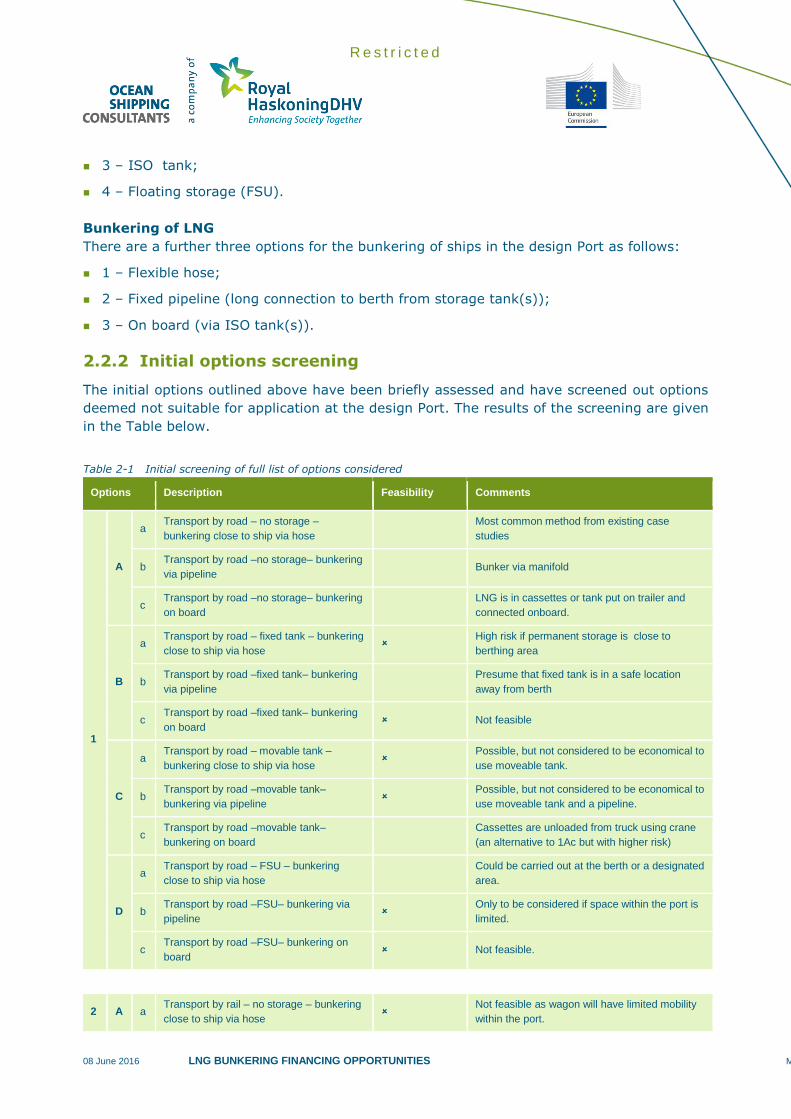
Table 1-4 Vessel sectors and their potential for adoption of LNG as a bunker fuel
Vessel type Likely factors favouring LNG as fuel Challenges to the Adoption of LNG as fuel
RO-PAX
Predictable routes typically in short-sea shipping routes
Routes inside ECA
LNG availability/planning
Possibility of LNG fuel service framework contract
Risk & Safety aspects
Simultaneous operational restrictions during bunkering
Additional construction (and life-cycle) cost of LNG-fuelled newbuilding
Offshore
(OSV/PSV/
AHTS)
LNG availability
Typically based at a specific port, close to offshore operation areas. Possibility of LNG fuel service framework contract
Operational profile not constant, with multi-purpose mission profiles
Risk & Safety aspects if OSV has work intensive operational profile, with close contact operations
Tugs
Air emissions reduction
Operation inside port areas, under increasingly stricter environmental requirements
LNG availability (if port of operations has LNG bunkering facility)
Operational profile not constant, with multi-purpose mission profiles
Risk & Safety aspects – Tugs have typically work intensive above-deck areas
Space available for LNG fuel tanks is reduced, especially if protective design arrangement needs to be taken into consideration
Cruise Ships
Predictable routes, even if typically longer than RO-PAX
Time spent inside ECA’s
Public image for cruise ships with potential gains with environmental friendly image (“sustainable tourism”)
LNG availability if operational routes favoured with LNG prepared ports
Risk & Safety aspects
Simultaneous Operations possible restrictions during bunkering
Additional construction (and life-cycle) cost of LNG-fuelled newbuilding
Containerships
Predictable operational profiles (for both deep-sea and short-sea feeder vessels)
Modular general arrangement favouring LNG-ready solutions for later adoption of LNG fuel systems
Time spent inside ECA (especially for short-sea feeder container vessels)
Space taken by LNG fuel storage systems, which reduce marginally cargo capacity, for similar displacement ships
Required freight rate calculations highly sensitive to fuel price fluctuations
LNG fuel availability, for feeder containerships, if ports have no LNG bunkering facility
Tankers
Time spent inside ECA (especially for short-sea tankers)
Typical above-deck arrangement favouring installation of LNG storage tanks with minimum impact in cargo capacity
Environmental compliance, especially if operation inside ECA’s is envisaged
Operational profile can be less predictable than other types of ships, especially for short-sea tankers
Availability of LNG fuel can be reduced in ports dealing with other dangerous cargo (such as flammable liquid cargo)
Risk & Safety management for tankers
Bulk Carriers
Time spent inside ECA (especially for short-sea bulk carriers)
Typical above-deck arrangement likely to favour installation of LNG storage tanks with minimum impact in cargo capacity, depending on hatch arrangement.
Operational profile can be less predictable than other types of ships, especially for short-sea bulk carriers
Availability of LNG fuel can be reduced in ports dealing with other dangerous cargo
If cranes are installed, general arrangement
R e s t r i c t e d
08 June 2016 LNG BUNKERING FINANCING OPPORTUNITIES M&WPB3039-103-100R001D11
36
Vessel type Likely factors favouring LNG as fuel Challenges to the Adoption of LNG as fuel
Environmental compliance, especially if operation inside ECA’s is envisaged
Particular interest for bulk carriers with self-unloading capability, since these are usually heavy polluters at berth during unloading operations
above deck can be made more complicated
Small domestic
ferries
Typically used for short distance canal or riverine crossings, spending all time within port areas in ECA’s. Reduction of air emissions is therefore a key benefit and driver
Public image of “greener” ferries, highly visible to populations
Predictable operational profile, as an advantage for possible LNG fuel service framework contract
Small riverine ferries are highly space-sensitive. LNG fuel systems take a considerable internal volume and affect therefore transport capacity
Risk & Safety aspects, depending on specific risk acceptance criteria
Inland shipping
Positive environmental benefits inland, contributing to improve the air emissions footprint along the inland waterways
Increased availability of LNG refueling points via important inland multi-modal nodes
Small inland vessels are highly space-sensitive. LNG fuel systems take a considerable internal volume and affect therefore transport capacity
Risk & Safety aspects, depending on specific risk acceptance criteria
Source: Ocean Shipping Consultants a company of Royal HaskoningDHV / EMSA
R e s t r i c t e d
08 June 2016 LNG BUNKERING FINANCING OPPORTUNITIES M&WPB3039-103-100R001D11
37
1.4.1 LNG-fuelled vessels in 2030
There have been a number of studies that have forecast the growth in the LNG-fuelled fleet.
During 2011, the Danish Maritime Authority published a report highlighting that 1,000
vessels would be operating in the Northern European SECA region through to 2020.3 In
addition, DNV forecast that 1,000 LNG-fuelled newbuilds would be delivered through to
2020.4 This would account for approximately 35% of all newbuilds to be gas fuelled. Ocean
Shipping Consultants (a company of Royal HaskoningDHV) published a study highlighting the
growth in the LNG-fuelled vessel market.5 The Report forecast 1,250 LNG-fuelled vessels by
2025.
However, the newbuilding sector has not witnessed the significant increase in new-orders for
vessels in the last year as compared to the previous couple of years. Therefore it is
anticipated that the sector will still develop, albeit not at the rate and scale as recent
forecasts have suggested.
This study will highlight the future gas fuelled vessel market through to 2030.
To provide background into the forecast for the development of the LNG-fuelled fleet a
number of assumptions for the High and Low case are highlighted below.
High Case
Global Sulphur limits are introduced in 2020 – meaning that some vessel owners
will seek, amongst the possible abatement methods, alternative fuels to enable full
compliance. This will potentially benefit the up-take of LNG as a fuel.
Additional countries implement air emission standards – as air emissions
continue to rise, a switch to LNG fuel can dramatically reduce vessel emissions.
Additional Emission Control Areas (ECAs) – Additional ECAs, such as in the
Mediterranean and around Japan, would add the obligation for SOx limits lower than
the future global cap of 0.5%. The ‘High Case’ scenario reflects the effect of this
possibility, with an optimistic anticipation of additional stricter emissions at new
specified areas.
Development of alternative fuels/propulsion – under the high case, alternative
fuels to HFO and MGO will be developed to be utilised for marine propulsion. Of
these, LNG will be a significant alternative. Developments in the regulatory
framework of these alternative fuels, together with improved risk perception of their
utilisation as marine fuels, are expected to encourage their uptake.
Rising economic growth and Increase in Shipping Trade – brings increased
demand for shipping activity as national economies expand.
Rising oil/distillate fuel prices – oil/distillate fuel prices can be affected in many
ways, but mostly if demand rises, prices will traditionally follow, or if supply is
restrained, prices can also increase. Either of these scenarios could be positive for
LNG as a fuel.
3 North European LNG Infrastructure Project, 2011
4 Shipping 2020, 2012
5 LNG as a Bunker Fuel: Future Demand Prospects & Port Design Options
R e s t r i c t e d
08 June 2016 LNG BUNKERING FINANCING OPPORTUNITIES M&WPB3039-103-100R001D11
38
Rising freight rates – this occurs as demand for vessels increases. This will occur
when today’s underutilised vessels are fully active. This usually implies that there is
growing economic activity in line with ‘High Case’ assumption of rising economic
growth.
Increase in newbuilding orders – increased vessel activity is usually a stimulus for
owners to order new or additional vessels. As such, these vessels could be ordered
with alternative fuels systems, such as LNG.
Additional research into LNG-fuelled vessels – as vessel demand rises, vessels
that can offer operating savings – such as those that can be operated on alternative
cleaner fuels (LNG) may have an advantage in the charter market. Key research
areas in LNG ship design, such as tank optimised integration, efficient engines, boil-
off gas consumption and cryogenic liquefaction are developed at a higher pace under
the ‘High Case’.
Harmonised LNG bunkering standards – this will encourage new entrants to
utilise LNG and complying with industry standards for bunkering. Harmonised LNG
bunkering guidance would help the uptake of LNG by addressing specifically the
safety/risk perception regarding LNG as fuel.
Enforcement Levels – The enforcement levels of environmental legislation, with the
application of dissuasive and effective penalties to those non-complying to air
emission regulations, are assumed under the High Case.
Low Case
Global Sulphur cap/limits delayed to 2025 – the review in 2018 allows the
deferring of stricter SOx global cap to 2025. This would have the potential impact of
delaying the investment in LNG-fuelled ships by several years.
No new ECAs – reduced economic or political determination to implement new
emission control areas. As such, this may limit the number of future LNG-fuelled
vessels to specific areas/regions that already have ECAs, leading the deep-sea trade
to opt for other compliancy strategies/technologies.
Development of alternative fuels/propulsion – alternative fuels that are either
cheaper or/and easier to handle compared to LNG may be developed and utilised.
Even though methanol has a limited regional availability this could be subject to
research and preferred against LNG for some cases. Additionally the development of
low-sulphur distillates, blends, and their increased availability, could lead to reduced
LSFO prices, with an impact on the adoption of LNG as an alternative fuel. These
developments are assumed in the ‘Low Case’.
Low economic growth – national and regional economies continue to remain at
either low or stagnant levels of activity.
Continued low fuel prices – low cost traditional fuels mean that vessel
owner/operators can utilise their vessels without investing in additional new fuel
systems. This is especially relevant if low-sulphur distillates prices are also made
available at lower prices.
Low freight rates – continued low vessel activity, with some vessels being laid-up.
Currently, the offshore and dry-bulk sectors are experiencing low freight rates. If the
tendency persists, with the low freight rates, the business case for LNG is very
difficult with expected pay back times for investment unsatisfactorily increased.
R e s t r i c t e d
08 June 2016 LNG BUNKERING FINANCING OPPORTUNITIES M&WPB3039-103-100R001D11
39
Continued over-supply of vessels – as above, the offshore and dry-bulk sectors
have significant over-supply of vessels. This is forecast to continue in to the near-
term.
Limited up-take of LNG on long-haul vessels – with significant over-supply of
vessels, particularly in the long-haul sectors, vessel renewal will be limited. Thus
reducing the impact of new LNG-fuelled vessels in the medium-term.
No standard LNG bunkering regulations/procedures – The ‘Low Case’ reflects
uncertainty and lack of harmonization in LNG-bunkering. The adoption of LNG as an
alternative fuel, on the basis of this assumption, could be excluded in favour of other
compliance technologies/abatement methods.
Environmental Concerns – The GHG emission factor of LNG/methane (when
leaked) is much higher than CO2. In the ‘Low Case’ scenario this is a fact that could
affect the uptake of LNG as an alternative fuel for shipping.
It should be noted, that these assumptions are used to help forecast the future LNG-
fuelled fleet. Any changes to the assumptions could impact on the fleet’s development.
Figure 1-7 Assumptions for High Case LNG-fuelled fleet development
Source: Ocean Shipping Consultants a company of Royal HaskoningDHV
R e s t r i c t e d
08 June 2016 LNG BUNKERING FINANCING OPPORTUNITIES M&WPB3039-103-100R001D11
40
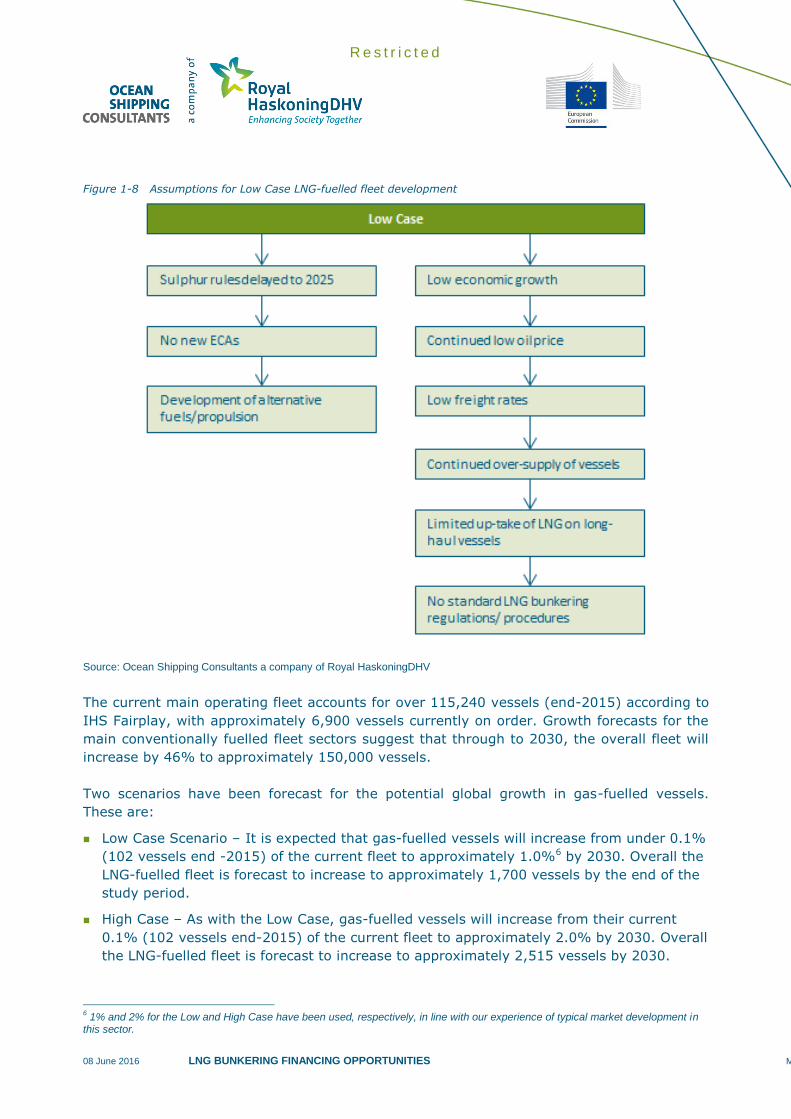
Figure 1-8 Assumptions for Low Case LNG-fuelled fleet development
Source: Ocean Shipping Consultants a company of Royal HaskoningDHV
The current main operating fleet accounts for over 115,240 vessels (end-2015) according to
IHS Fairplay, with approximately 6,900 vessels currently on order. Growth forecasts for the
main conventionally fuelled fleet sectors suggest that through to 2030, the overall fleet will
increase by 46% to approximately 150,000 vessels.
Two scenarios have been forecast for the potential global growth in gas-fuelled vessels.
These are:
Low Case Scenario – It is expected that gas-fuelled vessels will increase from under 0.1%
(102 vessels end -2015) of the current fleet to approximately 1.0%6 by 2030. Overall the
LNG-fuelled fleet is forecast to increase to approximately 1,700 vessels by the end of the
study period.
High Case – As with the Low Case, gas-fuelled vessels will increase from their current
0.1% (102 vessels end-2015) of the current fleet to approximately 2.0% by 2030. Overall
the LNG-fuelled fleet is forecast to increase to approximately 2,515 vessels by 2030.
6 1% and 2% for the Low and High Case have been used, respectively, in line with our experience of typical market development in
this sector.
R e s t r i c t e d
08 June 2016 LNG BUNKERING FINANCING OPPORTUNITIES M&WPB3039-103-100R001D11
41
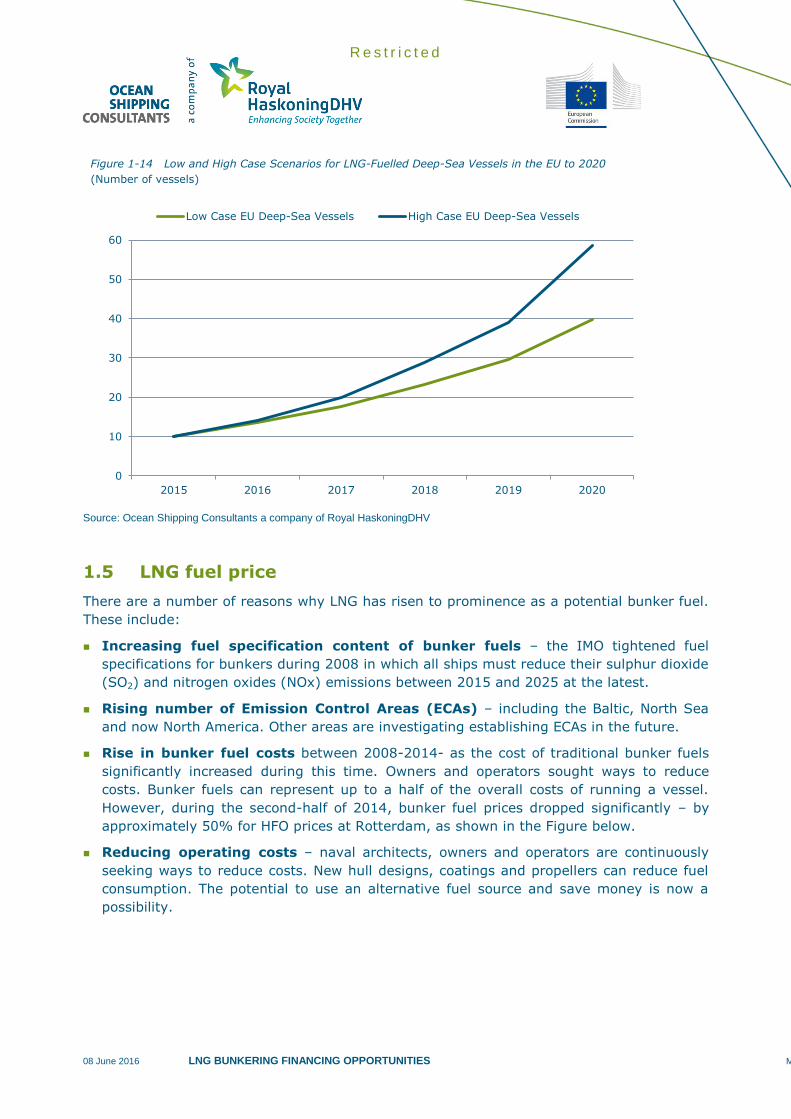
Figure 1-9 Low and High Case Scenarios for LNG-Fuelled Fleet Development to 2030
(Number of vessels)
Source: Ocean Shipping Consultants a company of Royal HaskoningDHV
Figure 1.10 highlights the forecast through to 2020, to provide a more detailed outline
of the near-term development of the fleet.
Figure 1-10 Low and High Case Scenarios for LNG-Fuelled Fleet Development to 2020
(Number of vessels)
Source: Ocean Shipping Consultants a company of Royal HaskoningDHV
The price of LNG is a major factor for shipowners in determining whether to invest.
Especially the relative price difference between marine fuel oil and LNG and the
expectations regarding the long-term price differential are of great importance.
The ship owner will choose from proven technology, as this is readily available in the
market at the moment.
In terms of political risk, the ship owner has to rely on the continuation of the ECAs,
and even expanding, as well as that no policy implications against LNG as marine fuel
are undertaken in the future.
If the points as outlined here can be solved sufficiently well, LNG as fuel for shipping can
materialize in economically viable business cases. Summarising, we see the following major
risks that the shipowners are facing, which may prevent them from making a positive
investment decision:
1. Guarantee of supply of LNG bunkering facilities (sufficient facilities in a grid of
locations).
2. Energy price differential between LNG and marine oil fuels.
5.1.3 Bunkering facility operators
The operators of LNG bunkering facilities face a different investment decision. In this study,
we look at four different bunkering facilities (for which the investment decision is similar due
to similarities in the business model, albeit that the capital expenditure involved differs
hugely between the different facilities)11:
Truck to ship facility
Ship to ship facility
Small shore storage tank facility
Large shore storage tank facility
The investment decision of operators is based on an assessment of several factors. These
include:
11
These options are further explained in Task 3.Although minor differences may exist between different types of bunkering facilities in terms of type and degree of risks, these differences are much less relevant than the risks they have in common, as discussed in this paragraph for bunkering facilities in general.
R e s t r i c t e d
08 June 2016 LNG BUNKERING FINANCING OPPORTUNITIES M&WPB3039-103-100R001D11
97
Availability of LNG is not likely to impede investments in LNG bunkering facilities. The
UK and Spain are Europe’s main importing countries of LNG, and many other
countries (such as The Netherlands, Belgium and France) have facilities to import
LNG as well12. In the absence of (nearby) LNG regasification terminals, natural gas
can be sourced on a trading hub or through bilateral contracts and liquefied at the
bunkering facility.
The main risk is the offtake risk: the operator would not make a positive investment
decision if the offtake is uncertain. In other words, the operator’s business model
depends on sufficient LNG fuelled vessels being available in the market, and beyond
that, his capacity to enter into longer term offtake contracts with shipowners.
The price level of LNG is less relevant to the bunkering facility operator than for the
ship owner, as the operator earns a premium on the commodity price, transferring all
price risk to the ship owner.
The technology risk for the operator is small, as the technology is readily available in
the market and is deemed proven.
Necessary landside infrastructure is usually provided by the port, in return for a fee
(included in the land lease / rent agreement). This is therefore no great risk to the
project.
If the points as outlined here can be resolved sufficiently well, then this is an economically
viable business case. Summarising, we see the following major risk the operators of LNG
bunkering facilities are facing, which may prevent them from making a positive investment
decision:
1. Uncertainty about offtake agreements with sufficiently large client base.
5.2 Needs analysis: combining demand and supply
We observe that both the business case for the shipowners and for the LNG bunkering
facility operators are economically viable, but that they suffer from a traditional ‘chicken-
and-egg’ problem: the business case for the demand side (shipowners) is heavily reliant on
the business case for supply (facility operators) and vice versa.
From our interviews with both demand and supply side private sector parties, it follows that
the business case for shipowners is relatively straightforward. Either shipowners do not
make a positive investment decision for LNG fuelled ships at all, as they deem the supply of
LNG insufficient, or shipowners make a positive investment decision, and are able to obtain
finance for their investment via regular routes. They indicate that no support from the EU is
necessary to obtain finance at commercial terms. Whether or not the shipowners are capable
of financing ships, the addition of LNG facilities does not impact the ships’ bankability.
Rather, shipowners indicate that the infrastructure (supply) side of the sector must be
developed further. They are quite literally waiting for a grid of bunkering facilities to be
available first before considering to ordering new LNG fuelled ships (notwithstanding other
considerations in their investment decision). Therefore, shipowners agree that the
infrastructure development needs to be assisted by the EU, rather than the shipowners
themselves. Table 5-9 highlights the relevant findings from 5 interviews carried out as part
of the validation task (Task 9). All 5 interviewees represent large, professional organisations
12
The website of Gas Infrastructure Europe provides an overview of existing and under construction infrastructure for LNG: http://www.gie.eu/index.php/maps-data/lng-map
R e s t r i c t e d
08 June 2016 LNG BUNKERING FINANCING OPPORTUNITIES M&WPB3039-103-100R001D11
98
with a deep experience in their line of business. All interviewees support the conclusions
drawn here.
Table 5-2: Relevant findings from interviews on financing support
Type of organisation View on the need for financing support
Port operator
Support from EU should be aimed at facilities; there is an egg
and hen problem. To kick-start the market, facilities should be
widely available. If supply is created, demand will follow. Any
potential EU investment / financial assistance should go to
supply infrastructure instead of ship owners, since most added
value can be reached in improving the infrastructure network.
Ferry operator
Agrees with the statements made by the Port. “In financing the
ships, no specific issues were stumbled upon. The project had already
been commercially financed, after which the existence of EIB funding
was discovered by the project. The project has since been refinanced
by the EIB at more favourable terms.”
Financial institution
This bank is involved in the financing of vessels, not so much in LNG
infrastructure. Key to unlocking the LNG as marine fuel sector lies in
infrastructure, this is the element that needs to come first. Ships won’t
be ordered speculatively. The bank has looked at this type of projects
in the past. Some parties will take demand risk that will be reduced
over time. Demand will follow supply.
Cruise operator
When the company compared the total costs of ownership of a LNG
vessel with a HFO vessel, the company ultimately decided not to
invest. The main reason for that decision is the unavailability of a well-
developed supply chain of marine LNG around the world. Asked
whether there are any obstacles/ gaps in the availability of private
financing for LNG vessels, the company representative replied that this
is not likely; its competitor recently bought new LNG vessels and they
work with the same lenders. Using LNG means losing some cabins
(since tanks are bigger). However, with a good explanation for
investors/ financiers, all in all, investors and financiers do not deny
investments in vessels based on the fact that they use LNG as a fuel.
In the company representative’s view, the availability (supply) of marine
LNG would have to improve for the market to develop. Focus of
support by the EU on the demand side (in the form of loans at attractive
conditions) would help, but is far from necessary. Availability (supply) of
marine LNG is the showstopper. LNG is quite an attractive option for an
owner of vessels, also taking into account the (capital and operational)
costs of exhaust gas treatment. If the EC wants to move the market of
marine LNG forward, investments should focus on the infrastructure
side.
Ship owner (transporting RoRo
goods short-sea)
While LNG was certainly a topic in the discussions with financiers, this
did not render the investment in LNG fuelled vessels difficult to finance.
R e s t r i c t e d
08 June 2016 LNG BUNKERING FINANCING OPPORTUNITIES M&WPB3039-103-100R001D11
99
The company’s representative is not aware of any gaps in the private
financing of infrastructure either. He stresses that implementing marine
LNG is a matter of jointly developing a collaborative project with
partners on the demand and on the supply side, so both develop
simultaneously. In that way, uncertainty in the business case is
minimised. In his view, stimulation of the supply side of the market will
cause demand to follow.
Source: Ocean Shipping Consultants a company of Royal HaskoningDHV
This view is supported by the minutes from a meeting13 of the ESSF sub-group on funding
for LNG-fuelled vessels, stating that “Shipowners can encounter some difficulties in
accessing banking resources [red: in general, not aggravated by the decision to implement
LNG facilities].” “Moreover, those [financial] instruments can promote the deployment of
LNG infrastructure in ports.”
Bunkering facility operators are in agreement with the shipowners: they indicate that, if the
chicken-and-egg situation is to be solved, it is the infrastructure that needs financial
support. Availability of supply is clearly the kick-starter of the sector. If this is translated into
a business case perspective, it means that LNG bunkering facilities will be built that will have
a very limited customer base for the first years of operations (unless there is a ‘home
customer’ for the facility, such as a ferry operator). For only if it is certain that the facilities
will become available, shipowners will make a positive investment decision to buy LNG
vessels. These first years of operations, having low revenue levels, have to be bridged. This
is essential to retain a viable business case for the bunkering facility operator. The figure
below illustrates this time gap during which the facility operator has a very low level of
revenues.
One way to bypass this problem is to use an integrated project approach towards the
development of the sector. This means that demand and supply are developed
simultaneously; the bunker facility operator and the vessel operator discuss the timeline,
volumes, capacities, terms and conditions etc. and reach a mutual commitment that enables
both sides to take a positive investment decision. Lead times of the LNG powered vessels
and bunkering facilities would then ideally be aligned to avoid or at least minimise the
aforementioned time gap. The vessel owner may even decide to participate financially in the
facility, thus gaining more control over his supply chain of fuel and strengthening the
business case for the facility (although potential conflicts of interest may arise as well).
Several parties have indicated that if the EU wishes to accelerate the development of marine
LNG, it could consider contributing to a network of bunkering facilities and thereby improve
the availability and removing the most important barrier to investing in LNG powered ships.
This approach can be taken even further by adding demand sectors for LNG other than
marine use, such as heavy-duty trucks or buses and inland water vessels. If for instance a
long-term offtake contract with the owner of a fleet of long-haul trucks can be closed then
the offtake risk for the terminal is significantly reduced. As the onshore LNG refueling
infrastructure develops further, the truck fleet owners will become less dependent on the
LNG port-facility they helped to launch and vice versa.
13
On 29 October 2014
R e s t r i c t e d
08 June 2016 LNG BUNKERING FINANCING OPPORTUNITIES M&WPB3039-103-100R001D11
100
Table 5-3 Schematic overview of the resulting time gap between the two business cases
Source: Ocean Shipping Consultants a company of Royal HaskoningDHV
For this approach to be feasible, a necessary precondition is that one or more shipowners
can commit themselves to bunkering their ship(s) at one (or a limited number of) specific
facility or facilities. This will only apply to those shipowners that operate regionally.
However, some portion of the capacity not being contracted at the completion of the facility
means that this capacity is available to the market, which contributes to a grid of LNG
bunkering facilities and enhances the availability of marine LNG. This is an approach that is
similar to the ‘anchor fleet’ approach that has been successfully applied for CNG as fuel for
road transport14.
Notwithstanding this bypass to the problem, it is recognised that this solution will not be
applicable in all situations, meaning that the time gap will remain. Potential financing
mechanisms looking to promote LNG as a marine fuel should focus on this issue.
5.3 Financing gap analysis
5.3.1 Investment considerations
In general, investors and financiers use the following set of assessment criteria when making
investment considerations. In the next paragraph, we will describe the criteria that financiers
indicate will impact their decision to invest in LNG bunkering facilities (and to a lesser
extent, vessels).
Asset type: Assets are often specialised and should have an economic life well beyond the
term of the debt.
14
As described in e.g. “Natural Gas as a Transportation Fuel: Models for Developing Fueling Infrastructure”, American Gas Foundation, September 2012.
R e s t r i c t e d
08 June 2016 LNG BUNKERING FINANCING OPPORTUNITIES M&WPB3039-103-100R001D11
101
Term: The term of financing facilities should be commensurate with the economic life of the
asset, and the project structure should encourage subsequent refinancing either in the bank
or capital markets.
Performance risk: An investor is exposed to the performance risks involved in the design,
construction and operation of the project. Suitable contractual protections, qualified and
competent counterparties and independent technical advice should be sought to ensure
adequate comfort.
Issuer financial covenants: Financial covenants, in which the issuer undertakes to comply
with certain ratios, act as a proxy measure of the issuer’s ability to service and repay its
debt and, if measured in a consistent way, can be an effective 'early warning system' which
allows investors to assess deteriorations in the risk attached to the credit quality of the
issuer and to the debt. Well-designed and appropriate financial covenants can also provide
timely performance indicators for investors.
It is however difficult to design a finite list of appropriate financial covenants as the terms
may vary considerably depending on the circumstances, including the nature of the issuer’s
business, its credit quality and the scope of financial covenants in existing bank loan and
other debt documentation (although the starting point for financial covenants will usually be
the scope of any financial covenants in the issuer’s existing bank loan and other debt
documentation, if any). Key ratios in project finance include the Debt Service Coverage Ratio
(DSCR), Loan Life Coverage Ratio (LLCR), Project Life Coverage Ratio (PLCR) and Debt to
Equity ratio.
Third Parties: Where third parties have significant obligations to the project company, their
credit standing is an important part of the credit application for the project. Third parties
may include corporate entities, banks and insurance companies.
Environmental Risk: Environmental issues may materialise due to the intrinsic nature of
project finance transactions and sector environmental risk profiles. Most investors have
adopted the ‘Equator Principles’ which seek to provide a framework for assessing and
managing social and environmental risks, in line with international best practice.
Documentation: Rights and obligations of the various parties must be clearly set out to
avoid the risk of lengthy litigation at a later stage. In respect of PFI/PPP projects the powers
of the public sector body to enter into contracts with the project company needs to be
investigated. Other issues include the transaction structure, security, step-in rights, events
of default and compensation on termination.
Interest Rates and Currency Risk: Changes in interest and currency exchange rates may
materially affect the project company cashflow. A hedging strategy should be established
and described in the credit application.
Insurance: Insurance is required by the SPV to allow for, inter alia, reinstatement of
assets, loss of earnings and third party liabilities.
Tax: With the exception of corporation tax, the project company should not be exposed to
changes in tax.
R e s t r i c t e d
08 June 2016 LNG BUNKERING FINANCING OPPORTUNITIES M&WPB3039-103-100R001D11
102
5.3.2 Criteria impacting the investment decision for LNG facilities
In interviews with financiers (and operators) we have established that the most important
factors that influence the decision whether or not to finance LNG facilities (and to a lesser
extent, vessels) are the following:
Project performance risk due to lack of demand
Financiers confirm that to kick-start the sector, investment in LNG bunkering
facilities, rather than vessels, is necessary. Without the infrastructure in place,
vessels will not be ordered speculatively. Thus, the infrastructure must be realised
first. Financiers want the offtake to be contracted up-front before they will enter into
the project. In terms of a threshold (i.e. an offtake level above which financiers are
willing to lend to the project), the following information was provided to us:
o a minimum offtake level of 50% to 60% of the total offtake; and / or
o offtake that guarantees a debt service cover ratio (DSCR) of 1.0 (i.e. 100%).
With respect to the latter, banks normally demand the project to be able to have
substantially higher cover ratios to service debt (for example 1.15), but considering
the limited age of the sector for LNG as marine fuel, a cover of 1.0 would be
acceptable. Commercial banks would potentially be willing to ‘take a market view’ on
the remainder of the offtake (i.e. that would not have to be contracted up-front).
Legislation
As mentioned in Section 1, new EU rules have been adopted during September 2014
to ensure the build-up of alternative refueling points across the EU. However, there is
still some ambiguity as to the rules/legislations/guidelines for this sector. There are
concerns that the bunkering methods utilised may differ between countries. This is a
worry for both operators and financiers. It does not create a financing gap, but it
does add to the severity of it. Transparent legislation that is common between the
member states is important for LNG bunkering projects to be financed, especially
related to realising a network of such facilities throughout Europe. It is understood
that this is a new industry and processes and procedures need time to be worked out
and ratified by the various stakeholders involved.
Technology
The parties we have interviewed differ in their statements about the technology:
some say that the technology is not new anymore, which enables commercial
financiers to lend to projects. However, others suggest the technology is still a factor
that must be considered in the investment decision, albeit that the impact on the
financing gap of this criterion is smaller than the previously stated criteria.
5.3.3 The financing gap
There clearly exists a financing gap for LNG bunkering facilities in Europe. Without a ‘home
customer’ (such as a ferry operator) or substantial guarantees regarding the offtake of LNG,
such facilities cannot be financed commercially at the moment. This is mainly due to the
uncertainty about offtake (demand), as indicated above. The uncertainty is made worse by
limited knowledge about LNG as a marine fuel at commercial banks and the limited amount
of due diligence that has been executed in this sector. This prevents commercial banks from
taking a view on the development of future market demand.
R e s t r i c t e d
08 June 2016 LNG BUNKERING FINANCING OPPORTUNITIES M&WPB3039-103-100R001D11
103
Whereas certain individual facilities could potentially be financed commercially (i.e. the ones
for which offtake has (largely) been guaranteed), the majority of facilities are less likely to
achieve this. The financing gap calls therefore for public sector participation in this sector,
especially if it wants to ensure development of a grid (network) of LNG bunkering facilities.
It is clear that potential public involvement should focus on the (temporary) lack of demand
as explained in the previous points (time gap).
5.4 Identification and assessment of financial mechanisms
5.4.1 The EU structure of financial mechanisms
For the definition of financial mechanisms as used by the European Union, we draw upon
REGULATION (EU, EURATOM) No 966/2012 OF THE EUROPEAN PARLIAMENT AND OF THE
COUNCIL of 25 October 2012 on the financial rules applicable to the general budget of the
Union and repealing Council Regulation (EC, Euratom) No 1605/200, which reads:
(39) For reasons of legal certainty, the scope of grants and financial instruments should be
clarified. A more detailed definition of the specific conditions applicable to grants, on the one
hand, and to financial instruments, on the other, should also contribute to maximising the
impact of those two types of financial support.
(40) The grant rules applicable to entities specifically established for the purpose of an
action should be adjusted so as to facilitate access to Union funding and management of
grants by applicants and beneficiaries having decided to work together within a partnership
or grouping constituted in accordance with relevant national law, in particular where the
legal form chosen offers a solid and reliable cooperation environment. In addition, in the
light of the limited financial risks for the Union and the need to avoid adding a layer of
contractual requirements to existing structural arrangements, entities affiliated to a
beneficiary through permanent capital or legal links should be entitled to declare eligible
costs without having to comply with all the obligations of a beneficiary.
Moreover, we understand that a three-level structure applies to EU financial mechanisms as
outlined in the figure below. The first level contains a set of financial mechanisms, namely
financial instruments (such as equity, debt and guarantees), investment grants and
economic incentives (such as tax exemption).
The second level of the structure considers the deployment of the mechanisms: this can
either be done by the Member States, or, in case of the financial instruments, by a financial
institution. We understand that the EIB deploys most financial instruments, alongside certain
other selected financial institutions. The EIB can either invest directly in projects, or does so
via intermediary financial institutions.
The third level of the structure is formed by financial programmes and products that are
developed and marketed (as well as administered) by the financial institutions as explained
under level 2. Financial programmes usually hold a range of financial products. Financial
products must be understood as ‘financial facilities’ that are additional sources of investment
or guarantees.
R e s t r i c t e d
08 June 2016 LNG BUNKERING FINANCING OPPORTUNITIES M&WPB3039-103-100R001D11
104
Table 5-4 EU structure of financial mechanisms
Source: EIB interview July 2015, and “The Connecting Europe Facility & its Financial instruments, catalysts for infrastructure
financing”, presentation by Matthieu Bertrand, Unit Connecting Europe – Infrastructure Investment strategies, DG Mobility and
Transport, European Commission, at CEF Workshop in NL, Ede, 29th October 2014.
R e s t r i c t e d
08 June 2016 LNG BUNKERING FINANCING OPPORTUNITIES M&WPB3039-103-100R001D11
105
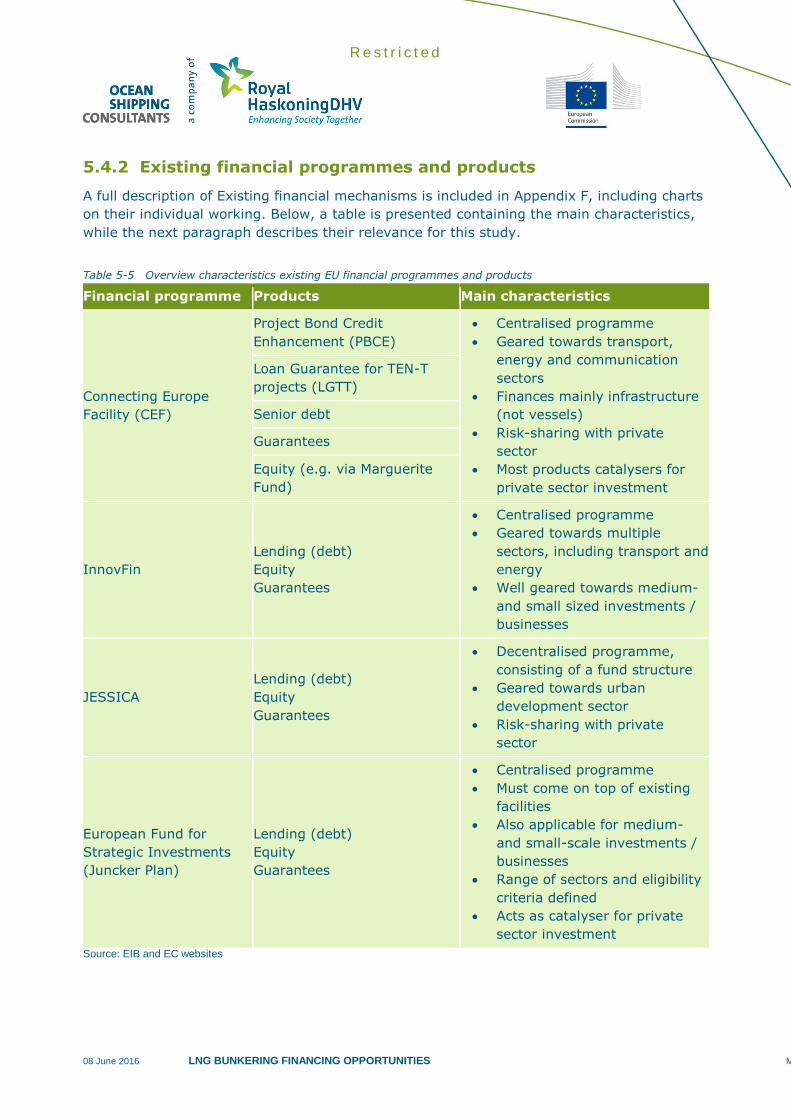
5.4.2 Existing financial programmes and products
A full description of Existing financial mechanisms is included in Appendix F, including charts
on their individual working. Below, a table is presented containing the main characteristics,
while the next paragraph describes their relevance for this study.
Table 5-5 Overview characteristics existing EU financial programmes and products
Financial programme Products Main characteristics
Connecting Europe
Facility (CEF)
Project Bond Credit
Enhancement (PBCE)
Centralised programme
Geared towards transport,
energy and communication
sectors
Finances mainly infrastructure
(not vessels)
Risk-sharing with private
sector
Most products catalysers for
private sector investment
Loan Guarantee for TEN-T
projects (LGTT)
Senior debt
Guarantees
Equity (e.g. via Marguerite
Fund)
InnovFin
Lending (debt)
Equity
Guarantees
Centralised programme
Geared towards multiple
sectors, including transport and
energy
Well geared towards medium-
and small sized investments /
businesses
JESSICA
Lending (debt)
Equity
Guarantees
Decentralised programme,
consisting of a fund structure
Geared towards urban
development sector
Risk-sharing with private
sector
European Fund for
Strategic Investments
(Juncker Plan)
Lending (debt)
Equity
Guarantees
Centralised programme
Must come on top of existing
facilities
Also applicable for medium-
and small-scale investments /
businesses
Range of sectors and eligibility
criteria defined
Acts as catalyser for private
sector investment
Source: EIB and EC websites
R e s t r i c t e d
08 June 2016 LNG BUNKERING FINANCING OPPORTUNITIES M&WPB3039-103-100R001D11
106
5.5 Relevance of the mechanisms for the sector for LNG as
marine fuel
Here, we elaborate on the relevance of the mechanisms described above for projects relating
to LNG as marine fuel. Whereas not all programmes and products described may seem
directly applicable to this sector, we believe there are relevant comparisons to be made.
The instruments and products under the Connecting Europe Facility (CEF) can directly be
applied to the projects for LNG bunkering facilities (supply side). The successful project bond
(PBCE) and loan guarantee (LGTT), but also senior debt and other forms of guarantees,
could be used to support projects for new LNG bunkering facilities. Based on our discussions
with market parties, equity seems less likely an option, as the parties indicate there is no
obvious need for more equity, and in addition, the EIB’s preferred options are debt and/or
guarantees, as providing equity could give rise to a conflict of interest.
We acknowledge that the InnovFin is not directly applicable to the LNG as marine fuel
sector (the sector is no longer deemed to be innovative / new technology), we do use it to
show that the way this programme is structured means there is a solution for programmes
of projects that involve both low CAPEX and high CAPEX projects. This is the case for the
LNG as marine fuel sector too: e.g. truck-to-ship solutions typically have a low CAPEX
requirement, whereas large LNG storage facilities require a big investment. The InnovFin
structure is flexible in providing corporate finance or project finance solutions fitting the
scope of the project at hand, which is a useful characteristic.
The purpose of introducing the JESSICA programme here (albeit that this was designed for
a different sector) lies in the fact that the programme is de-centrally managed (through
holding funds). In the LNG sector, we see that many countries have national schemes to
assist projects financially. If the EU’s assistance to projects is at least well aligned with the
national incentives, this will help the sector select the most appropriate financing options.
The newly created European Fund for Strategic Investments (EFSI) is directly relevant
for the LNG as marine fuel sector. Not only does EFSI financing come on top of other forms
of European (financial) support, also the LNG bunkering sector fits both the EC’s
requirements as well as the targeted areas. Therefore, the EFSI programme is well suited to
provide additional support for this sector. This is beneficial as the risks that cannot be
covered by commercial banks in this sector are significant. EFSI indeed allows the EIB to
offer products that absorb more risk than current products and enable investment in projects
with a higher risk and high added value.
5.6 An alternative solution: deferred equity
As we have established, one of the most pressing issues in financing bunkering facilities for
LNG is bridging the time gap between making the capital investment for the facility and the
sufficient availability of demand (and revenues). A similar gap also had to be bridged in
another project, in a different sector. We believe an interesting lesson can be learnt from
this experience. The box below elaborates on the solution for this project.
R e s t r i c t e d
08 June 2016 LNG BUNKERING FINANCING OPPORTUNITIES M&WPB3039-103-100R001D11
107
The project
The Reliance Rail consortium was the winning bidder to supply the Sydney
Metropolitan area with 78 new trains. The consortium was responsible for designing,
manufacturing, testing and commissioning the trains. The finance was highly
leveraged (gearing 94%); most of the debt was held by bondholders plus $357
million in senior debt; bonds were guaranteed by two monoline insurers, giving the
project a AAA credit rating.
What went wrong
Initially problems arose with the design and manufacture of the trains. In particular,
during the design development stage, the independent certifier was not certifying the
contractor’s completion of tasks. As a result, by 2011, the first trains were being
delivered over a year late. This resulted in large losses for Reliance Rail and the
contractors.
In addition, the global financial crisis had a significant impact on Reliance Rail’s
financing, especially given the project’s high leverage. The insurers were wiped out,
which affected the project’s credit rating; by 2012 the debt had non-investment, or
junk, status.
The global financial crisis also led to a rapid increase in bank loan margins. As a
result, financing Reliance Rail’s drawdown facility—established pre-crisis with low
margins—would have meant the banks would have lost money. The banks saw an
opportunity to withdraw the facility in what they considered to be Reliance Rail’s
insolvency, on the basis that it wouldn’t be able to repay or refinance its debt when it
became due in 2018. This would deter the directors of Reliance Rail from drawing
down the debt as they could be held personally liable for any debts incurred while the
company was insolvent. Instead, the banks wanted the government to guarantee the
$357 million senior debt or take over financing the debt itself.
The solution
The New South Wales Treasury was concerned that this risk around the bank debt
funding could unravel the whole PPP structure, forcing state government to take the
$357 million in bank debt onto its balance sheet. However, if this risk could be dealt
with, the trains would be operational by 2018 and Reliance Rail would have regular
cash flows from which to service its debt when it actually became due.
Instead of providing a guarantee, the New South Wales Government provided
deferred equity of $175 million over six years (due in 2018), conditional, among
other things, on the delivery of the rest of the trains. This plan was designed to
ensure there would be enough equity to refinance the debt in 2018, so that Reliance
Rail’s solvency could not be in dispute and Reliance Rail could draw down the $357
million of senior debt without delay. In return for the deferred equity, the
government obtained a call option to acquire the entire equity of the consortium for a
nominal sum.
This solution maintained the structure of the PPP and forced Reliance Rail to address
R e s t r i c t e d
08 June 2016 LNG BUNKERING FINANCING OPPORTUNITIES M&WPB3039-103-100R001D11
108
its management and manufacturing issues. Following the deferred equity
arrangement, many of the practical problems with manufacturing the trains were
resolved, and delivery rates began to improve. The final trains were delivered in
2014. As a result, the project will be able to generate a reliable payment stream
going forward, from which it can service its debt and deliver double-digit returns. This
means the government should have no difficulty in selling its deferred equity in
Reliance Rail in 2018, potentially at a profit, without ever having to provide the $175
million.
Obviously, the case of Reliance Rail is a different one from the case for LNG as a marine fuel,
one difference being the guaranteed off-take of the trains (once delivered). However, there
is also a striking similarity: a time gap between investment and revenue generation has to
be bridged, and the risk associated with this time gap is not acceptable for commercial
banks. In the case of LNG bunkering facilities, it is demand risk due to the uncertainty about
LNG demand taking off, in the case illustrated above it is the operational / technical risk of a
satisfactory delivery of the trains. In both cases, the government provides a safety net for
what the market perceives as the key risk in the project.
Providing a direct guarantee would have cost the NSW government $357 (on-balance sheet),
whereas the deferred equity option provided the consortium with sufficient guarantees to
draw down the necessary senior debt. Moreover, the public sector party gained a stake in
the company, providing it with a return when the project started to become profitable.
We understand that the EIB is hesitant to provide equity to projects in which they also
participate as a lender. However, in certain circumstances, in which a project can almost be
financed commercially, but needs additional reassurances to bridge the initial period of low
revenues, the provision of deferred equity (as shown in this example) can be an option.
5.7 Recommendation for characteristics for a financial
instrument for the sector for LNG as marine fuel
Summarising, we list our recommendations for the key characteristics for a financial
instrument for the sector for LNG as marine fuel.
From extensive discussions with private sector parties operating in this market, we
derive that the instrument should focus on the supply side infrastructure rather than
ship financing. These discussions included shipowners who highlighted that whether a
vessel had LNG capabilities or not, it did not impact on the ships’ bankability.
A suitable instrument should have the flexibility to offer a mix of (senior) debt,
guarantees and possibly project bonds, as well as potentially (deferred) equity.
The instrument must be flexible to finance both low and high CAPEX investments
(and provide solutions for both corporate finance and project finance).
The instrument must be able to be aligned with existing support measures by
national governments in the different member states.
The instrument must allow EFSI additional support for projects as the characteristics
of the sector are in line with EFSI’s targets.
R e s t r i c t e d
08 June 2016 LNG BUNKERING FINANCING OPPORTUNITIES M&WPB3039-103-100R001D11
109
The instrument should be able to bridge a time gap between the initial investment in
new infrastructure and the start of revenues for the project (when offtake starts).
This time gap is caused by the demand side waiting for the suppliers to move first15.
The instrument should be available cross-member states so that it benefits a grid
(network) of LNG bunkering facilities.
15
While admittedly there are several factors influencing a ship owner’s decision towards LNG, the availability of bunkering fac ilities is the main concern. The time gap refers specifically to the dynamics of what happens when infrastructure becomes available: there is a delay between the moment when ship owners become aware that infrastructure is improving by the (planned) construction of one or more bunkering facilities and the time when then they actually have an LNG fuelled vessel operational. This assumes that other factors are positive towards an investment decision for LNG, but those other factors do not specifically influence the existence or duration of the time gap. It’s likely that LNG bunkering facilities wouldn’t even be built if other factors render the business case for ship owners to use LNG unfavourable.
R e s t r i c t e d
08 June 2016 LNG BUNKERING FINANCING OPPORTUNITIES M&WPB3039-103-100R001D11
110
6 Financial modelling of typical projects (Task 5)
6.1 Introduction
In order to assess the impact that different financial instruments can have on the financial
performance and bankability of marine LNG projects, a financial model has been
constructed. In this section an overview of the model will be presented. The model utilises
CAPEX and OPEX data to establish the associated costs of construction and operation of a
dedicated LNG bunkering facility in Europe, while also providing the potential revenues, and
financial outcome metrics that could be generated from such a facility.
To provide a robust analysis of the workings of the model, its structure and working will be
explained as well as a detailed account of the underlying assumptions that underpin the
model’s working. In the next section, a selection of three different construction options for a
LNG bunkering facility and the associated financial metrics will be presented and described in
detail so as to provide a series of examples of the model in action.
6.2 The Model
6.2.1 Objective of the financial model
The objective of the LNG bunkering facility model is to determine the economic and financial
viability of a potential LNG bunkering facility and to assess how this can potentially be
improved by deploying different types of financial instruments. This model will be based on
capital expenditure and operational expenditure estimates, we well as an indication of the
level of revenues such a facility could generate. It also includes a forecasted representation
of future demand for LNG bunkering within the European market as well as providing an
overview of the number of vessels that could potentially call at the design port. Based on an
assumed financial structure, the project’s resulting NPV, IRR and other financial metrics will
be determined.
6.2.2 Terminology
The model uses DCF (discounted cash flow) analysis. A DCF analysis is a method of valuing a
project using the financial concepts of “time value of money” and utilises estimated and
discounted future cash flows to provide an estimated present value for the project. Two of
the most crucial indicators that arise from a DCF analysis that are considered essential for
determining the profitability of a project are the Net Present Value (NPV) and the Internal
Rate of Return (IRR) (apart from the ROE as explained before). These indicators are
calculated using the net discounted cash flows of the project. The initial NPV and IRR for this
task were calculated using pre-tax and pre-financing cash flows.
Net Present Value (NPV)
Net present value is defined as the sum of the present value of all incoming and outgoing
cash flows over a period of time. In financial theory the time value of money dictates that
time has an impact on the value of cash flows making future cash flows less valuable over
time, i.e. a cash flow today is more valuable than an identical cash flow tomorrow. Due to
this phenomenon cash flows are discounted back to a present value using a discount factor
R e s t r i c t e d
08 June 2016 LNG BUNKERING FINANCING OPPORTUNITIES M&WPB3039-103-100R001D11
111
known as the discount rate. The discount rate is often pegged to the weighted average cost
of capital of the firm or project in question and this will be further discussed later in this
section.
Internal Rate of Return (IRR)
The internal rate of return is an indicator most often used in financial models concerning
capital budgeting. It is used to measure and compare the profitability of investments and
can be thought of as an annualised effective compounded return rate that makes the net
present value equal zero. It can also be defined as the discount rate that makes the present
value of all future cash flows equal to the initial investment i.e., the rate that makes the
investment in the project break even. An investment should only be undertaken if the IRR is
greater than the established cost of capital for a project. It should be noted that in
comparison, NPV is considered an indicator of value or magnitude of an investment and the
two indicators are intrinsically linked. An IRR that is less than the cost of capital will also
coincide with a negative NPV and vice versa.
Return on Equity (ROE)
A measure of a company’s or project’s profitability; ROE reveals how much profit a company
generates with the money shareholders have invested.
Debt Service Cover Ratio (DSCR)
In corporate and project finance, it is the amount of cash flow available to meet annual
interest and principal payments on debt, including sinking fund payments. In general, it is
calculated by: DSCR = Net Operating Income / Total Debt Service
A DSCR of less than 1 would mean a negative cash flow. A DSCR of less than 1, say .95,
would mean that there is only enough net operating income to cover 95% of annual debt
payments.
Amounts in financial models can be expressed in different terms that have been defined in a
financial economic context. These different terms can be distinguished in the financial model,
as shown in the table below.
Table 6-1 Terminology
Type of amounts Explanation
Real Amounts excluding escalation / inflation / indexation.
Nominal Amounts including escalation / inflation / indexation.
Present Value (PV) Value at one point in time of one or more cash flows, taking into account the time value of
money (discount factor).
Net Present Value (NPV) Net amount of costs and revenues (balance) at one point in time, taking into account the
time value of money (discount factor).
Internal Rate of Return (IRR) The rate of return (discount rate) that sets NPV to zero; indicator of profitability of a project.
Return on Equity (ROE) A measure of a company’s or project’s profitability; ROE reveals how much profit a
company generates with the money shareholders have invested.
Debt Service Cover Ratio
(DSCR)
In corporate and project finance, it is the amount of cash flow available to meet annual
interest and principal payments on debt, including sinking fund payments.
R e s t r i c t e d
08 June 2016 LNG BUNKERING FINANCING OPPORTUNITIES M&WPB3039-103-100R001D11
112
6.2.3 Model structure
The structure of the model is depicted in the figure below. The model can be broken down
into four modules, each consisting of a series of blocks that represents an Excel worksheet in
the model. The four modules are (sheet title in parenthesis & quotations):
Input – Includes all possible construction and operation scenarios (“Scenario”) as well as
forecasted demand scenarios (DEMAND). All essential inputs and assumptions for the
construction and operation such as CAPEX and OPEX for the terminal are included
(“INPUT” & “ASSUMP”).
Operational Calculations – Includes all calculations for the operations of the LNG
facility on an annual basis (“OPS”). These operational calculations include such things as
volume of throughput at the facility, the number of trucks utilised, equipment
requirements for both initial acquisition and for replacement, etc.
Financial Calculations – Includes the calculations for the capital expenditures
(“CAPEX”), operating expenses (“OPEX”) and revenues (“REV”) for the selected
construction scenario. Utilises data from both the Input and Operational Calculations
module.
Model Output – Includes the calculations for the general cash flows of the facility (“CF”)
including the net present value (NPV) and the internal rate of return (IRR) for the project.
Also, the final numbers for the facility demand, capacity, and throughput as well as the
final cash flow numbers for CAPEX, OPEX and revenues are outputted to a summary page
(“Output”).
These four modules feed into the “Cockpit” of the model. From the cockpit, users have the
ability to manipulate several underlying assumptions of the model as well as select the
different building options and market-demand scenarios. Also, the cockpit has an embedded
sensitivity analysis where variations to throughput volume, tariff rates, CAPEX, OPEX, and
market share can be adjusted. The cockpit acts as the overall output sheet for the model. All
the key data figures from the Financial Calculations and Model Output modules are outputted
here and auto-update themselves whenever new selections and assumptions are made.
R e s t r i c t e d
08 June 2016 LNG BUNKERING FINANCING OPPORTUNITIES M&WPB3039-103-100R001D11
113
Figure 6-1 Model Structure
Mod
el O
utpu
tFi
nanc
ial C
alcu
latio
nsO
pera
tiona
l Cal
cula
tions
Inpu
t
CO
CK
PIT
Ass
um
ptio
ns
(AS
SU
MP
)
• Ti
min
g A
ssum
ptio
ns•
Fin
anci
al A
ssum
ptio
ns•
Thro
ughp
ut
Ass
umpt
ions
• Ca
paci
ty A
ssum
ptio
ns•
Ope
ratio
nal A
ssum
ptio
ns•
Vess
el A
ssum
ptio
ns
• O
PEX
-Ene
rgy
Assu
mpt
ions
• O
PEX
-Lab
our A
ssum
ptio
ns•
OPE
X -I
nsur
ance
Ass
umpt
ions
Ou
tpu
t
-g
rap
hs
-ra
tio
s
Inp
ut
(CA
PE
X &
OP
EX
)
• G
en
era
l
-C
AP
EX
item
s-
Sur
char
ges
-A
ntic
ipat
ed p
rice
prem
ium
s
• C
ost
in
pu
t-
Mai
nten
ance
ass
umpt
ions
-In
sura
nce
assu
mpt
ions
-A
sset
Life
times
Sce
nar
io B
usi
nes
s P
lan
EU
LN
G
Sta
ndar
d se
t of i
nput
for s
cena
rios
:
-Sto
rag
e T
an
ks –
Bu
lle
ts (
Sm
all
Vo
lum
e)
-S
tora
ge
Ta
nks
–B
ull
ets
(M
ed
ium
V
olu
me
)-
Sto
rag
e T
an
ks –
La
rge
Vo
lum
e
-P
ipe
s C
ryo
ge
nic
–S
ma
ll V
olu
me
-P
ipe
s C
ryo
ge
nic
–M
ed
ium
Vo
lum
e-
Pip
es
Cry
og
en
ic –
La
rge
Vo
lum
e
-L
oa
din
g A
rm +
Su
pp
ort
Str
uct
ure
(S
ma
ll
&
Me
diu
m)
-L
oa
din
g A
rm +
Su
pp
ort
Str
uct
ure
(L
arg
e)
-F
lex
ible
Ho
se o
r F
ixe
d M
an
ifo
ld (S
ma
ll &
M
ed
ium
)-
Fle
xib
le H
ose
or
Fix
ed
Ma
nif
old
(La
rge
Vo
lum
e)
-L
iqu
efa
ctio
n P
lan
t-
De
dic
ate
d B
un
keri
ng
Ve
sse
l (3
,000
m3)
-D
ed
ica
ted
Bu
nke
rin
g V
ess
el
(6,0
00m
3)
Co
ver
Rev
enu
es-L
NG
hand
ling
-ISP
S
-Lan
d le
ases
Mo
del
Str
uct
ure
Fla
gs
& O
per
atio
ns
("O
ps"
)
• Ti
min
g: C
onst
ruct
ion
& C
once
ssio
n•
Dem
and
and
Cap
acity
• Te
rmin
al O
pera
tions
• E
quip
men
t R
equi
rem
ents
• E
nerg
y C
onsu
mpt
ion
• V
esse
l ope
ratio
ns•
Sta
ffing
CA
PE
X
-Ini
tial I
nves
tmen
ts
-Rep
lace
men
ts
OP
EX
OPE
X -C
urre
nt Fa
ciliti
es
OPE
X -M
aint
enan
ceO
PEX
-Ene
rgy
OPE
X -L
abou
rO
PEX
-Ins
uran
ce
OPE
X -O
ther
s
Cas
h F
low
Su
mm
ary
(CF
)
Sum
mar
y of
Rev
enue
s, CA
PEX
and
OPE
X
Dem
and
• F
orec
aste
d de
man
d S
cena
rios
-H
igh,
med
ium
and
low
sce
nario
s-
Bas
ed o
n ge
ogra
phic
loc
atio
n w
ithin
EU
R e s t r i c t e d
08 June 2016 LNG BUNKERING FINANCING OPPORTUNITIES M&WPB3039-103-100R001D11
114
6.3 Scenarios
For the purposes of this study six possible main scenarios for the construction of an LNG
bunkering facility were utilised to create this model (see Section 2). These scenarios range
in physical size, annual volume capacities and construction cost. The following is a
breakdown of the six scenarios that are utilised in the model:
Option 1: Delivery by road (ship bunkered direct) - Truck-to-Ship – A low
capacity, low volume option that would only likely be selected due to the relatively
ease and speed at which this option could be set-up
Option 2: Delivery by LNG vessels (small-scale) Shore-to-Ship – A small
capacity, small volume option where a shore-based bunkering terminal would be
constructed
Option 2: Delivery by LNG vessels (medium-scale) Shore-to-Ship - A medium
capacity, medium volume option where a shore-based bunkering terminal would be
constructed
Option 3a: Delivery by National Gas Network (large) Shore-to-Ship – A large
capacity, large annual volume option where a shored-based terminal would be
constructed; this option includes the addition of a liquefaction plant
Option 4: Delivery by sea - (1 vessel x 3,000m3) Ship-to-Ship – A dedicated
bunkering vessel is constructed with a medium capacity and medium annual volume
Option 4: Delivery by sea (1 vessel x 6,000m3) Ship-to-Ship – A large capacity,
large volume option where a dedicated bunkering vessel is constructed to supply LNG
to those vessels that require larger bunkering volumes
6.4 Input and assumptions
6.4.1 CAPEX and OPEX
The main CAPEX and OPEX items relate to building material requirements and their
associated costs and life cycles. Like the annual volume capacities mentioned above, the
data for materials, building costs and life cycles was obtained from the technological studies
performed in Task 3. It should be noted here that the associated costs include both the
initial capital expenditure to build the facilities as well as the associated maintenance,
operational and renewal costs for all materials required for each of the differing scenario
designs. Renewal costs are those costs associated with the repurchase of a CAPEX item once
it has reached the end of its lifecycle and hence required replacement. An overview of the
CAPEX and OPEX inputs for the materials to build each of the scenarios is presented in the
table below. Table 6.3 shows the total CAPEX estimates for the different scenarios.
R e s t r i c t e d
08 June 2016 LNG BUNKERING FINANCING OPPORTUNITIES M&WPB3039-103-100R001D11
115
Table 6-2 Associated CAPEX & OPEX Inputs
Source: Ocean Shipping Consultants a company of Royal HaskoningDHV
Table 6-3 Costs in EUR millions, present value per January 2015
Case 1 Case 2 Case 3 Case 4 Case 5 Case 6
Truck to Ship:
Small Capacity
Shore to Ship:
Small Capacity
Shore to Ship:
Medium
Capacity
Shore to Ship:
Large Capacity
Ship to Ship:
Medium
Capacity
Ship to Ship:
Large Capacity
CAPEX 7.3 9.0 20.5 97.0 40.0 70
Source: Ocean Shipping Consultants, a company of Royal HaskoningDHV
6.4.2 Storage Capacity, Flow Rates and Annual Volume Capacity
Utilising data for storage capacities and fuel flow rates taken from the technical reports
carried out in Task 3, an estimation of the annual volume capacity for each scenario was
calculated. As mentioned before the model is structured on an annual basis and so it is vital
to have an annual volume capacity as this will be of most importance when being compared
to the estimated market demand for LNG within the European Union. The following is a brief
description of what these three inputs are:
Storage Capacity: the maximum static volume that the facility can hold at any one
time; calculated in cubic metres (m³)
Flow Rate: this is the rate at which each facility can refuel a vessel with LNG; calculated
as cubic metres per hour (m³/hr)
Annual Volume Capacity: this is the estimated amount of LNG a facility can expect to
provide in a single year, given its static storage capacity and flow rate; calculated as cubic
metres per year (m³/year)
R e s t r i c t e d
08 June 2016 LNG BUNKERING FINANCING OPPORTUNITIES M&WPB3039-103-100R001D11
116
The following table provides a breakdown of the storage capacity, flow rates and annual
volume capacity for each of the scenarios investigated in this study:
Source: Ocean Shipping Consultants a company of Royal HaskoningDHV
As is derived from the table the storage capacity of the truck-to-ship is based upon a per
truck basis. The truck-to-ship scenario assumes that approximately 10 trucks each with a
55m³ storage capacity will be operating at the design facility. For the shore-to-ship
scenarios storage capacities is provided LNG bullets tanks. And, for the ship-to-ship
scenarios the bunkering vessel itself provides the storage with the varying storage capacity
sizes between medium and large actually being dictated by an increase in the size of vessel
employed.
As mentioned previously, the annual volume capacities are estimated using the storage
capacity and flow rate data. Estimation of the annual volume capacity was assumed to be
done on the basis of the facilities operating on a 24/7 basis and operating in such a way that
there was no simultaneous refilling of the storage tanks while the facility is refueling a
vessel. Moreover, market demand is often the most important driver for the volume
capacities.
6.4.3 Market Price of LNG
Currently LNG as a bunker fuel has a limited market. As such there is still much variation in
its pricing with no clear indication of a preferred pricing method. Currently the pricing
mechanism for LNG is often pegged to a conventional bunker fuel or the price is estimated
using the natural gas pricing mechanism of million British thermal units (mmbtu). Taking
into account market research into the LNG shipping sector as well as consultation with active
members within the LNG shipping and bunker market, an LNG pricing mechanism of pegging
the price of LNG to that of an existing bunker fuel was chosen. Often the price of LNG as a
bunker fuel is pegged to that of heavy fuel oil (HFO). Consultations with members from the
LNG shipping and bunkering market have indicated that the price of LNG is often discounted
at 15%-20% to the price of HFO. In light of these market consultations the pricing
mechanism for LNG within the model will be pegged against HFO.
LNG Price within the Model and Variables
The pricing mechanism for LNG as a bunker fuel utilised in the model is pegged against
heavy fuel oil (HFO). LNG fuel prices will be pegged against HFO prices in Rotterdam.
R e s t r i c t e d
08 June 2016 LNG BUNKERING FINANCING OPPORTUNITIES M&WPB3039-103-100R001D11
117
The price of HFO is intrinsically linked to that of crude oil prices, which over the past several
months has seen a rapid decline in price. Plunging prices have seen the price of HFO in
Rotterdam fall to below $500/metric ton in mid-March 2015, down from a high of over
$900/metric ton in June of 2014. The current volatility of crude oil prices has led to much
widespread speculation on the future price of bunker fuels. Short term forecasts on the
future price of crude oil appear to change on a daily basis with no clear consensus of
whether that price will be above or below the current level. The only consensus among the
market place is that the price of oil in the long run will increase from its current low prices.
How long before prices rebound to levels previous to the crash in oil prices is open to
speculation, but experts indicate that current price levels can be expected to be maintained
into 2016 before any significant increase can be expected.
In order to accommodate the potential volatility in future price levels for HFO a series of
prices ranging from $300 per metric tonne to $1,000 per metric tonne are provided in a
drop-down list in $100 instalments to provide a robust analysis of how the facilities would
operate within a low price and high price setting. These prices were chosen to represent two
particular aspects of the current price for HFO and are as follows:
$300/metric ton – This low price level assumes the price of oil is to remain at or possible
slightly decrease from its current level, but generally assumes that low oil prices are to be
maintained for longer periods than expected.
$1,000/metric ton – This high end price level assumes that the price of oil will return to
higher levels that were prevalent prior to the collapse in the price oil witnessed in mid-
2104.
As previously mentioned the price of LNG is often pegged to HFO at a discount of 15%-20%.
To accommodate this in the model a drop down list providing a selection of five different
discount levels to be user-selected was incorporated into the cockpit of the model. The five
discount levels to choose from include 10%, 0%, -20%, -30% and -40% (with the negative
numbers representing a discount to the HFO price). Even though market specialist attested
to current price discounts of LNG to HFO of 15%-20%, discounts of 30% and 40% were also
included in the model as means to forecast the potential drop in the relative costs of supply
for LNG compared to HFO in light of advancements in shale gas extraction technology and
the growing supply of shale gas out of America.
LNG Price Mark-Up and LNG price charged by the facility
The above mentioned process results in having a base LNG price expressed in terms of
EUR/m³. This price is assumed to be the expected price that the facility would have to pay to
purchase its supply of LNG. As such this price will be applied when calculating the operating
costs (OPEX) of the facility for obtaining its LNG supply. However, as a means to receive
revenues from operations, it is assumed that the facility will sell the LNG at a competitively
marked-up price. On initial trials of the model it has been found that the optimum mark-up
fluctuates between 2%–10% with those facilities with relatively lower CAPEX and OPEX
costs requiring a lower mark-up to achieve the same sort of return as those facilities with
larger associated CAPEX and OPEX costs.
R e s t r i c t e d
08 June 2016 LNG BUNKERING FINANCING OPPORTUNITIES M&WPB3039-103-100R001D11
118
6.4.4 Inflation Rate
Inflation is the change in price levels and is often measured with an inflation rate that is
usually attached to the movement or changes within a price index, often the consumer price
index (CPI). The rate is the percentage rate of change of the price index over time. Within
the United Kingdom the Retail Price Index is often used as it is considered broader than the
CPI, containing a larger basket of goods and services. Other commonly utilised price indices
are the producer price indices (PPI), commodity price indices and core price indices.
The inflation rate utilised in this model is based upon the European Central Banks (ECB)
inflation forecasts. At the time of writing this report the ECB calculated current inflation rate
as 0.3% with projections for the inflation rate to increase to 1.1%, 1.5% and 1.8% over the
next year, two year and five year periods respectively. For the purposes of this model the
consultants decided upon applying an inflation rate of 1.8%.
6.4.5 Time and phasing
The time / phasing assumptions include the length of construction, length of operations, and
therefore the life of the project. This includes the start and stop time for each of these. The
model has been built to operate on an annual basis and as such all the timing options in the
model will operate on a year to year basis.
Having consulted with the Royal HaskoningDHV engineers, it was determined that for all
building options within this model, construction would be accomplished within one to two
years. Furthermore, it has been assumed that pre-construction studies and delays would be
minimal and has therefore resulted in there being zero time being allowed between the start
of the project and the start of construction. Owing to relatively simplistic parameters for
each building option, it is assumed that there will be zero phasing on construction and that
completion of construction will result in immediate commencement of operations.
Currently the model is being operated under the assumption that the facility will be
operational for 25 years. Length of operation is completely the choice of the user; it should
be kept in mind that the longer the operation the more profitable the facility. Although, it
should also be noted that longer operation will result in increased CAPEX and OPEX,
especially as CAPEX items wear out and inevitably require replacement.
6.4.6 Taxation
In the model, two types of taxation are relevant: VAT and Corporate Tax.
VAT has been assumed to be 0% in the model, as the cost estimates for both CAPEX and
OPEX exclude VAT.
Corporate tax levels differ throughout Europe’s Member States. They vary from 20% to 26%
currently. As the model considers hypothetical projects, the relevant corporate tax rate
cannot be established. Therefore, an average rate of 23% has been assumed.
R e s t r i c t e d
08 June 2016 LNG BUNKERING FINANCING OPPORTUNITIES M&WPB3039-103-100R001D11
119
6.5 Capital structure (without public financial mechanisms)
6.5.1 Gearing
Generally, the capital structure of the project consists of equity and debt. Equity is capital
brought in by investors who take ownership of the project (company), whereas debt consists
of loans taken out by the (project) company. Typically, debt providers require lower returns
than equity providers, so having a high proportion of the project’s need for funding financed
by debt, makes the project more financially feasible. This is also called ‘gearing ’.16 In
project finance, gearing levels of between 65% and 90% are typical. In the base case, a
gearing level of 70%17 has been assumed for this project.
6.5.2 Financing facilities
In the base case, a simple financial structure consisting of two facilities has been assumed:
equity and senior debt. The table below shows the main characteristics for both facilities.
Table 6-5 Characteristics of financial facilities in base case
Financing facility Characteristics Explanation
Equity Tranche 30% of funding requirement
Return on equity (ROE) dependent
on results (target minimum = 15%).
Drawdown period is equal to construction period.
Redemption of equity (including any dividend) takes place as
soon as the project’s cash flows allow this (typically after the debt
has been repaid).
Senior Debt
(Commercial)
70% of funding requirement
Interest rate = 5.5% 18
Grace period = 5 years
It is assumed that the total debt for the project (in the Base Case
totalling approximately 70% of the funding requirement) is
provided by commercial banks.
Drawdown during construction period; redemption during
operations period.
Source: Ocean Shipping Consultants a company of Royal HaskoningDHV
6.5.3 Discount Rate
By definition the discount rate refers to the interest rate that is used in a discounted cash
flow (DCF) analysis to determine the present value of future cash flows. Thus, the discount
rate is the interest rate that is used in calculating the NPV for this model. In a DCF analysis
the discount rate should not only take into account the time value of money, as described in
the definition of NPV earlier, but also any risk or uncertainty of the future cash flows; the
greater the risk or uncertainty of these future cash flows the greater the discount rate. In
DCF evaluations of projects, the weighted average cost of capital (WACC) is the minimum
level at which the discount rate should be established. WACC can be defined as the rate that
a company is expected to pay on average to all its security holders to finance its assets. It is
commonly referred to as the “cost of capital” and it represents the minimum return that a
project must earn on an existing asset base to satisfy its creditors, owners, and/or other
providers of capital, or they might invest elsewhere.
16
Gearing can also be referred to as the debt-to-capital ratio. 17
This gearing level is based on expert judgment by Royal HaskoningDHV and on other similar infrastructure developments. 18
The interest rate of the Senior Debt Commercial is built up as a Swap Base Rate (2.75%), plus a Credit Margin (200 basis points) and a Swap Margin (75 basis points).
R e s t r i c t e d
08 June 2016 LNG BUNKERING FINANCING OPPORTUNITIES M&WPB3039-103-100R001D11
120
For the purpose of this model the discount rate to be utilised will actually be a representation
of the “cost of capital” for this model. This “cost of capital” will be calculated as the Weight
Average Cost of Capital (WACC) which takes into account the cost of equity plus the cost of
debt. For the purposes of this task, the cost of equity is assumed to be set at 15% while the
cost of debt is set at a senior debt interest rate of 5.5%. These costs carry a weighting of
30% and 70% respectively, as explained earlier. With these costs and the associated
weighting of the estimated WACC is 8.35%.
This is approximately close to the weighted average cost of capital for the shipbuilding and
maritime industrial sector as composed by Aswath Damodaran, a Professor of Finance at the
Stern School of Business at New York University (NYU) who specialises in corporate finance
and equity valuation. Professor Damodaran has an extensive reputation within this field with
both his own data results and its sources being highly credible. As of January 2015 the
calculated weighted average cost of capital for the shipbuilding and maritime sector as
composed by Damodaran was 7.87%.
R e s t r i c t e d
08 June 2016 LNG BUNKERING FINANCING OPPORTUNITIES M&WPB3039-103-100R001D11
121
7 Determination of financial viability (Task 7)
7.1 Introduction
The scope of Task 7 is focused on estimating the financial viability of LNG bunkering projects
without any involvement of public financing mechanisms. Therefore, the next paragraphs
follow a structure of introducing different examples for which the financial viability has been
tested using the financial model. The financial viability is tested against four main financial
metrics:
Net Present Value (NPV)
Internal Rate of Return (IRR)
Return on Equity (ROE)
Debt Service Cover Ratio (DSCR)
7.2 Construction option examples
7.2.1 Introduction
In this section a selection of three of the possible six possible main scenarios are presented
to provide an example as to the workings and robustness of the model. Further in this
chapter, the results for all six scenarios, including a sensitivity analysis, will be provided. The
example scenarios are:
Truck-to-Ship – A low capacity, low volume option that would only likely be selected due
to the relatively ease and speed at which this option could be set-up
Shore–to-Ship – A medium capacity, medium volume option where a land-based
terminal would be constructed
Ship-to-Ship – A large capacity, large volume option where a dedicated bunkering vessel
is constructed to supply LNG to those vessels that require it
7.2.2 Case 1: Truck-to-Ship – small capacity
Case 1 looks at the establishment of LNG bunkering facility that will bunker vessels through
the direct hook-up of LNG carrying trucks to vessels requiring LNG bunkering. This case
represents what is considered a low volume / low capacity case as the rate at which trucks
can supply vessels with LNG is limited and thus limits the overall capacity of this type of
facility to a minimal amount. The annual capacity of throughput for this particular terminal is
quite low compared to the other scenarios.
The figure below provides a screenshot of the cockpit page of the model highlighting the
CAPEX, OPEX, Revenues, NPV and IRR for Case 1. The following are several key points
regarding the inputs, assumptions and output for this case:
The model has been set for a project/construction start of 2016 with a concession start
for 2017 (assuming a 1-year construction period).
R e s t r i c t e d
08 June 2016 LNG BUNKERING FINANCING OPPORTUNITIES M&WPB3039-103-100R001D11
122
As mentioned earlier, the discount rate and inflation rate have been set to 8.35% and
1.8%, respectively.
LNG price – Revenues for the terminal are based upon a percentage mark-up of total cost
of LNG.
Currently there is no official pricing mechanism for LNG bunkers, but for the purposes
of this study the price of LNG has been pegged to that of HFO, but with a 20%
discount.
Providing a conservative outlook the price for the example has been set $400 per
metric ton.
Currently the mark-up percentage for this sample has been set at 7%.
Figure 7-1 Case 1: Truck-to-Ship – Cockpit – Small Capacity
Source: Ocean Shipping Consultants a company of Royal HaskoningDHV
Vessel Scenarios – As the foundation for an estimated market demand a high/low outlook
for the number of vessels operating within Europe annually has been developed; to
provide a conservative output for this scenario the low option has been selected.
An additional option for choosing whether the vessels are operating on a short-sea or
deep-sea basis is possible and both have been selected.
Traffic Scenario – Utilising the vessel outlook a market demand is forecast based on the
type of vessel, how many of that type are active in the region, the fuel capacity of that
type of vessel and the expected number of calls that vessel would make at an LNG
bunkering facility.
R e s t r i c t e d
08 June 2016 LNG BUNKERING FINANCING OPPORTUNITIES M&WPB3039-103-100R001D11
123
Traffic scenarios can be selected for low, medium, high and each represents a
prospective market share capture for the design port; the respective market shares are
20%, 40% & 60%.
For the current example the medium (or 40% market share) traffic scenario has been
selected.
Results – Truck-to-Ship - small capacity
Table 7-1 Results scenario 1
NPV IRR ROE Average DSCR
Scenario 1 –
Truck to Ship –
small capacity
EUR 5.7 million 20% 15% 4.77
Source: Ocean Shipping Consultants a company of Royal HaskoningDHV
It can be seen from the output that for this particular case the model returns an NPV of EUR
5.7 million with an IRR of 20%. The relatively strong IRR against the discount rate (at
8.37%) indicates a healthy operating profitability. This is also reflected in the return on
equity (ROE) of 15%. The average DSCR19 of the project is 4.77, indicating that in most
years, the debt service can be met comfortably (if demand builds up according to the
predicted pattern).
7.2.3 Case 3: Shore-to-Ship – medium capacity
Case 3 looks at the establishment of a shore-based facility set up with 6 “bullet” storage
tanks of 1,000m3 allowing for a more continuous refueling of the vessels that call. This case
represents what is considered a medium volume, medium capacity case as the bullet tanks
allow for greater and more continuous capacity over Case 1 (truck-to-ship) though
considerably less than the large volume/large capacity cases.
The following Figure provides an overview of the cockpit highlighting the CAPEX, OPEX,
Revenues, NPV and IRR for Case 3. The following are several key points regarding the
inputs, assumptions and output for this case:
The model has been set for a project/construction start of 2016 with a concession start
for 2017 (assuming a 1-year construction period after consulting our technical advisors
for the project.
As mentioned above, the discount rate and inflation rate have been set to 8.35% and
1.8%, respectively.
LNG price – Revenues for the terminal are based upon a percentage mark-up of total cost
of LNG.
Currently there is no official pricing mechanism for LNG bunkers, but for the purposes
of this study the price of LNG has been pegged to that of HFO, but with a 20%
19
A more detailed discussion on DSCR is included in Task 8.It is especially relevant to focus on the DSCR is early years of operations when assessing the effect of financial mechanisms.
R e s t r i c t e d
08 June 2016 LNG BUNKERING FINANCING OPPORTUNITIES M&WPB3039-103-100R001D11
124
discount as current research has indicated that to be the general pricing mechanism
that many LNG bunker suppliers are unofficially following.
Providing a conservative outlook the price for the example has been set $400 per
metric ton.
Currently the mark-up percentage for the model has been set 5%.
Figure 7-2 Case 1: Shore-to-Ship – Cockpit – Medium Capacity
Source: Ocean Shipping Consultants a company of Royal HaskoningDHV
Vessel Scenarios – As the foundation for an estimated market demand a high/low outlook
for the number of vessels operating within Europe annually has been developed; to
provide a conservative output for this scenario the low option has been selected.
An additional option for choosing whether the vessels are operating on a short-sea or
deep-sea basis is possible with the selection for both (All) having been selected.
Traffic Scenario – Utilising the vessel outlook a market demand is forecast based off the
type of vessel, how many of that type are active in the region, the fuel capacity of that
type of vessel and the expected number of calls that vessel would make at an LNG
bunkering facility.
Traffic scenarios can be selected for low, medium, high and each represents a
prospective market share capture for the design port; the respective market shares are
20%, 40% & 60%.
For the current example the medium (or 40% market share) traffic scenario has been
selected.
Main Assumptions Overview
Start of Project 2016 [year] Mio EU€
Start of Construction 2016 [year] CAPEX 20.2 [EU€ 2015]
Start of Concession 2017 [year] OPEX 1,703.6 [EU€ 2015]
Years of Operation 25 [years ] REVENUES 1,774.1 [EU€ 2015]
RepairOther (Payments)Energy Labour Insur. OtherLNG Supply
R e s t r i c t e d
08 June 2016 LNG BUNKERING FINANCING OPPORTUNITIES M&WPB3039-103-100R001D11
125
Results – Shore-to-ship – medium capacity
Table 7-2 Results scenario 3
NPV IRR ROE Average DSCR
Scenario 3 –
Shore to Ship –
medium capacity
EUR 50.3 29% 17% 8.77
Source: Ocean Shipping Consultants a company of Royal HaskoningDHV
It can be seen from the output that that for this particular case the model returns an NPV
EUR 50.3 million with an IRR of 29%. The relatively strong IRR against the discount rate
indicates a significant operating profitability. This is also reflected in the return on equity
(ROE) of 17%. The average DSCR of the project is 8.77, indicating that in most years, the
debt service can be met comfortably (if demand builds up according to the predicted
pattern).
7.2.4 Case 6: Ship-to-Ship – large capacity
In Case 6 a shore based facility is done away with and replaced with the construction of a
dedicated bunkering vessel. The vessel would operate within the design port area. Case 6 is
being used as an example of a large volume/large capacity option. Also, it is providing a
further robust overview of the model by three distinctly different kinds of options – truck-to-
ship, shore-to-ship and ship-to-ship. The table below provides an insight into the volume
capabilities of this option.
The overview of the cockpit for Case 6 can be found in the figure below which highlights the
CAPEX, OPEX, Revenues, NPV and IRR. The following are several key points regarding the
inputs assumptions and out for this case:
The model has been set for a project/construction start of 2016 with a concession start
for 2017 (assuming a 1-year construction period after consulting our technical advisors
for the project).
As mention above the discount rate and inflation rate have been set to 8.35% and 1.8%,
respectively.
LNG price – Revenues for the terminal are based upon a percentage mark-up of total cost
of LNG;
Currently there is no official pricing mechanism for LNG bunkers, but for the purposes
of this study the price of LNG has been pegged to that of HFO, but with a 20%
discount as current research has indicated that to be the general pricing mechanism
that many LNG bunker suppliers are unofficially following;
Providing a conservative outlook the price for the example has been set $400 per
metric ton;
Currently the mark-up percentage for the model has been set 5%.
R e s t r i c t e d
08 June 2016 LNG BUNKERING FINANCING OPPORTUNITIES M&WPB3039-103-100R001D11
126
Vessel Scenarios – As the foundation for an estimated market demand a high/low outlook
for the number of vessels operating within Europe annually has been developed; for this
particular case a high vessel scenario is used as the capacity capabilities of this option
indicates more beneficial use when significant amounts of demand are existent.
An additional option for choosing whether the vessels are operating on a short-sea or
deep-sea basis is possible with the selection for both (All) having been selected.
Traffic Scenario – Utilising the vessel outlook a market demand is forecast based off the
type of vessel, how many of that type are active in the region, the fuel capacity of that
type of vessel and the expected number of calls that vessel would make at an LNG
bunkering facility.
Traffic scenarios can be selected for low, medium, high and each represents a
prospective market share capture for the design port; the respective market shares are
20%, 40% & 60%.
For the current example the medium (or 40% market share) traffic scenario has been
selected.
Figure 7-3 Case 1: Ship-to-Ship – Cockpit – Large Capacity
Source: Ocean Shipping Consultants a company of Royal HaskoningDHV
Results – Ship-to-Ship – Large capacity
Table 7-3 Results scenario 6
NPV IRR ROE Average DSCR
Scenario 6 – Ship
to Ship – large
capacity
EUR 36.5million 11% 13% 3.89
Source: Ocean Shipping Consultants a company of Royal HaskoningDHV
R e s t r i c t e d
08 June 2016 LNG BUNKERING FINANCING OPPORTUNITIES M&WPB3039-103-100R001D11
127
It can be seen from the output that that for this particular case the model returns an NPV
EUR 36.5 million with an IRR of 11%. The return on equity (ROE) is 13%, which is relatively
low, considering the risks surrounding the business case. Notwithstanding, this case is
economically a sound business case. The average DSCR of the project is 3.89, but in the first
years of operations, the DSCR is too low (0.0 in both years). This indicates that even though
the project if profitable in the long run, the debt service cannot be met in the first years of
operation, due to a lack of sufficient demand. As stated under Task 2, this is an area that
can be covered by introducing a (public) financial mechanism. The effect of this is further
explored in Task 8.
7.2.5 Financial viability for all scenarios (including sensitivity
analysis)
The table below contains an overview of the associated financial metrics for a range of
project scenarios. This table helps provide an insight into the financial viability of each of the
building options at certain price levels. The effects of both the level of the HFO price and
several other factors are explored including LNG mark-up, vessel scenario and the LNG price
discount.
Several general trends can be seen from the table. First is that the results are generally
better when the model is run at a 20% discount (of LNG prices to HFO). Also, as expected
those cases run with a high vessel scenario and thus operating in a strong market
environment also enjoyed better outcomes. Those cases with a relatively high CAPEX and
OPEX show negative results when HFO prices are low, specifically scenarios 4 and 6
indicated negative NPVs in certain scenarios when HFO was assumed to be $400. This
indicated that those larger, more expensive facilities will require both a more substantial
market environment to operate in and also a higher level of oil prices.
All calculations presented here assume that the demand for LNG as a marine fuel is available
according to the forecast made. In other words, the financing gap due to insufficient demand
offtake20 has not been included in these calculations yet. This will be presented as part of
Task 8. Even without the potential lack of demand, in certain scenarios, such as in scenario
6d, whereas the average DSCR may be 7.03, the DSCR in the early years of operations are
actually insufficient, which is an indication of a financing gap. Whereas the project may be
economically viable (the NPV is positive, both IRR and ROE are acceptable), DSCR remains
too low to obtain commercial finance. This can be addressed by introducing public financial
instruments, as suggested in Task 2 and further elaborated upon in Task 8.
Table 7-4 Financial metrics for different scenarios. ‘DSCR’ refers to the average DSCR during the operational
period.
20
Here, two effects should be distinguished: the first one being lack of demand to cover debt service for the first years of operations, the second one being the general uncertainty around the anticipated increase in demand over time.
R e s t r i c t e d
08 June 2016 LNG BUNKERING FINANCING OPPORTUNITIES M&WPB3039-103-100R001D11
128
R e s t r i c t e d
08 June 2016 LNG BUNKERING FINANCING OPPORTUNITIES M&WPB3039-103-100R001D11
1a Truck to Ship Small Medium Low 20% 10% 15.5 40% 17% 8.85 31.8 71% 20% 15.61 48.1 103% 21% 22.37 64.4 135% 22% 29.13
1b Truck to Ship Small Medium High 20% 10% 15.5 40% 17% 8.85 31.8 71% 20% 15.61 48.1 103% 21% 22.37 64.4 135% 22% 29.13
1c Truck to Ship Small Medium Low 40% 10% 7.3 24% 16% 5.46 19.6 48% 18% 10.54 31.8 71% 20% 15.61 44.0 95% 21% 20.68
1d Truck to Ship Small Medium High 40% 10% 7.3 24% 16% 5.46 19.6 48% 18% 10.54 31.8 71% 20% 15.61 44.0 95% 21% 20.68
2a Shore to Ship Small Medium Low 20% 5% 40.5 51% 18% 12.87 68.7 76% 21% 20.40 96.9 102% 22% 27.93 125.0 126% 23% 35.46
2b Shore to Ship Small Medium High 20% 5% 43.4 64% 18% 13.29 73.1 101% 21% 21.03 102.7 138% 22% 28.77 132.4 176% 23% 36.51
2c Shore to Ship Small Medium Low 40% 5% 26.4 38% 17% 9.11 47.5 57% 19% 14.75 68.7 76% 21% 20.40 89.8 95% 22% 26.05
2d Shore to Ship Small Medium High 40% 5% 28.6 46% 17% 9.42 50.8 73% 19% 15.22 73.1 101% 21% 21.03 95.3 129% 22% 26.83
3a Shore to Ship Medium Medium Low 20% 5% 50.3 29% 17% 8.77 92.5 43% 19% 14.20 134.8 55% 21% 19.63 177.0 67% 22% 25.06
3b Shore to Ship Medium Medium High 20% 5% 75.9 44% 18% 10.95 131.0 65% 20% 17.46 186.0 85% 21% 23.98 241.1 105% 22% 30.49
3c Shore to Ship Medium Medium Low 40% 5% 29.2 22% 15% 6.04 60.8 33% 18% 10.13 92.5 43% 19% 14.20 124.2 52% 20% 18.28
3d Shore to Ship Medium Medium High 40% 5% 48.4 33% 16% 7.69 89.7 50% 18% 12.58 131.0 65% 20% 17.46 172.3 80% 21% 22.35
4a Shore to Ship Large Medium Low 20% 10% -68.8 1% 6% 0.93 15.7 10% 11% 2.65 100.2 15% 14% 4.33 184.8 21% 15% 6.00
4b Shore to Ship Large Medium High 20% 10% 188.2 18% 16% 6.86 401.2 27% 18% 11.47 614.2 35% 20% 16.05 827.2 42% 21% 20.63
4c Shore to Ship Large Medium Low 40% 10% -111.0 -7% -1% -0.02 -47.7 4% 8% 1.38 15.7 10% 11% 2.65 79.1 14% 13% 3.91
4d Shore to Ship Large Medium High 40% 10% 81.7 13% 14% 4.54 241.4 21% 17% 8.02 401.2 27% 18% 11.47 560.9 33% 20% 14.91
5a Ship to Ship Medium Medium Low 20% 5% -17.9 4% 7% 1.47 23.8 13% 12% 3.42 65.6 19% 14% 5.35 107.3 24% 16% 7.27
5b Ship to Ship Medium Medium High 20% 5% -0.9 8% 8% 1.98 49.4 18% 13% 4.14 99.7 27% 15% 6.27 150.0 35% 16% 8.41
5c Ship to Ship Medium Medium Low 40% 5% -38.8 -2% 1% 0.42 -7.5 7% 9% 1.96 23.8 13% 12% 3.42 55.2 17% 14% 4.87
5d Ship to Ship Medium Medium High 40% 5% -26.0 1% 1% 0.85 11.7 11% 10% 2.52 49.4 18% 13% 4.14 87.1 25% 14% 5.74
6a Ship to Ship Large Medium Low 20% 10% -7.5 8% 10% 2.17 77.0 16% 14% 4.46 161.6 22% 16% 6.72 246.1 28% 17% 8.97
6b Ship to Ship Large Medium High 20% 10% 249.5 25% 18% 10.16 462.5 35% 20% 16.38 675.5 45% 22% 22.59 888.5 54% 23% 28.79
6c Ship to Ship Large Medium Low 40% 10% -49.7 2% 6% 0.99 13.7 10% 11% 2.74 77.0 16% 14% 4.46 140.4 21% 15% 6.16
6d Ship to Ship Large Medium High 40% 10% 143.0 19% 16% 7.03 302.7 27% 18% 11.71 462.5 35% 20% 16.38 622.2 42% 21% 21.04
$ 1000
€ 414
$ 400
€ 166Scenarios
$ 600
€ 248
$ 800
€ 331
R e s t r i c t e d
08 June 2016 M&WPB3039-103-100R001D11
132
8 Assessment of financial mechanisms and framework
conditions for implementing optimal mechanisms and
financial incentives (Task 8)
8.1 Introduction
In Task 7, the financial viability for projects in the sector for LNG as a marine fuel was
shown, excluding the potential financial mechanisms that have been explored in Task 2. The
effect of such financial mechanisms on several of those business cases is explored in Task 8.
Here, it is important to take several good examples, rather than attempting to provide a
complete overview of all possible scenarios, as there are too many different conceivable
variants. Moreover, as assumptions for average projects are used, it is more useful to obtain
a bandwidth for the results using well-chosen examples (scenarios). Real-life projects will all
have their own individual characteristics, after all, which will determine what solution is
optimal for them.
Below, several scenarios are presented and described. From these, conclusions on the
financial instruments applied will be drawn. Also, a review is provided describing
considerations around framework conditions that should be taken into account when
implementing a financial mechanism.
8.2 Modelling the financial mechanisms
As explained in Task 2, several financial mechanisms are proposed for this project. The main
characteristics of mechanisms (and their underlying instruments and products) have already
been described earlier in this report. Due to their characteristics, not all the financial
mechanisms can be assessed using the project based financial model. For example, the
financial mechanisms that are suitable for a programme of projects rather than a single
project cannot be assessed here. Therefore, a sub-set is made of (certain aspects of)
financial instruments that can be implemented for a single project. The table below shows
this sub set and a description of the scenarios that have been taken into account.
Table 8-1 Scenarios of financial mechanisms
No. Financing mechanism Assumptions for scenario in
financial model
Description
1 Guarantee on offtake a. Full offtake guarantee for first 3
years of operation
b. Offtake guarantee to reach
DSCR of 1.12 in the first years
A form of guarantee will be introduced that
guarantees (a portion of) the offtake of the facility
for the first years of operation. This approach will
be applied to a case that is in principal
economically viable, but has a financing gap.
Multiple variants will be explored.
2 Senior Debt by public
sector party (IFI)
50% of total debt
Interest rate = 4.5% 21
It is assumed that the total debt for the project (in
the Base Case totalling approximately 70% of the
funding requirement) is provided by both
21
The interest rate of the Senior Debt IFI is built up as a Swap Base Rate (2.75%), plus a Credit Margin (100 basis points) and a Swap Margin (75 basis points). It is assumed that the credit margin of international financial institutions is 100 basis points lower than commercial Senior Debt.
R e s t r i c t e d
08 June 2016 M&WPB3039-103-100R001D11
133
Grace period = 5 years
commercial banks and international financial
institutions (IFIs), on a 50% / 50% basis.
It is assumed that the credit margin of international
financial institutions is 100 basis points lower than
commercial debt.
Drawdown during construction period; redemption
during operations period.
3 Grant Grant worth 50% of the CAPEX is
available to the project in 2016.
The grant is tax-exempt, and will not
be escalated.
It is assumed that a grant will be made available to
the project, worth 50% of the case’s CAPEX, in the
construction period, lowering the project’s funding
requirement.
4 Tax exemption Corporate tax is lowered or different
depreciation scheme allowed
Interaction with other measures.
Source: Ocean Shipping Consultants a company of Royal HaskoningDHV
8.3 Results
The scenarios as identified above have been applied to different project business cases in
order to show a relatively broad spectrum of outcomes. Below, the business cases are
described, as well as the way the financial instrument has been applied. The results per case
are also discussed.
8.3.1 Guarantee on offtake
An important characteristic of potential financial mechanisms is that they provide a
guarantee against lack of demand for LNG as marine fuel in the first years of operation of
the supply facility. In Task 2, this has been labelled the ‘time gap’ between investment in the
facility and the development of the demand in the market (i.e. sufficient customers who
have received LNG fuelled vessels). This time gap (before there is a clear offtake of demand)
causes projects to have difficulty obtaining commercial finance: there is a financing gap. This
financing gap can be overcome by different financial mechanisms as set out in Task 2.
Common financial products in such mechanisms are guarantees. In this specific sector,
guarantees should focus on demand.
In this example, the effects of guarantees on two business cases for supply facilities are
explored.
R e s t r i c t e d
08 June 2016 M&WPB3039-103-100R001D11
134
Business case: Small shore-to-ship facility
This case has the following characteristics:
Table 8-2 Characteristics – small shore-to-ship facility
Input Metric Value of metric
Fuel delivery Shore-to-ship (scenario 2d)
Capacity Small
Traffic scenario Medium
Vessel scenario High
LNG price discount 40%
LNG Mark-up 5%
HFO price $ 400 / EUR 166
Source: Ocean Shipping Consultants a company of Royal HaskoningDHV
The outcomes without applying guarantees are as follows:
Table 8-3 Results scenario 2d (base case)
NPV IRR ROE Average DSCR
Scenario 2d – Shore to
Ship – small capacity EUR 28.6 million 46% 17% 9.42
Source: Ocean Shipping Consultants a company of Royal HaskoningDHV
From these outcomes, it follows that this is an economically viable case: the NPV is positive,
the IRR is much higher than the discount rate, and the return on equity is a healthy 17%.
Moreover, the average DSCR is high, also in early years (in the first two years of operation,
the DSCR is 9.15 and 9.79, respectively). Based on these metrics, this business case should
be able to obtain commercial finance easily.
However, if the demand in the first two years does not build up as expected, but lacks
completely (due to the time gap described above), the picture is different. If no offtake is
realised in the first two years, the resulting metrics are:
Table 8-4 Results scenario 2d (no offtake in first two years of operation)
NPV IRR ROE Average DSCR
Scenario 2d – Shore to
Ship – small capacity EUR 22.0 million 26% 17% 8.34
Source: Ocean Shipping Consultants a company of Royal HaskoningDHV
The effect on the business case is substantial: the NPV drops from EUR 28.6 million to EUR
22.0 million and the IRR from 46% to 26%. However, we see that the case is still
economically viable: ROE stays healthy over the lifetime of the project, and the average
DSCR is still quite high. However, the DSCR in the first two years of operation drops to 0, as
there are no revenues in those years. If there is a probability that demand (and therefore,
revenues) are indeed absent in those years, the business case may have great difficulties in
obtaining commercial finance, as commercial banks are generally not able to accept this risk
level.
R e s t r i c t e d
08 June 2016 M&WPB3039-103-100R001D11
135
The effect of the guarantee is clear: if there is no guarantee, the business case cannot be
financed, even though it is economically viable in the longer run/ overall project period. The
potential costs of the guarantee for its provider can also be estimated. If the guarantee has
to be called upon for the full two years, the costs are high: EUR 156 million of revenues
have to be covered in that case. We draw attention to the fact that providing guarantees to
many projects may prove to be a costly strategy. If the market builds up slowly, it is likely
to affect many supply facilities at the same time. If a public sector finance provider (such as
the EIB) has guaranteed a part of the demand in early years for many projects, these
projects may call upon the guarantee at the same time. The costs could then easily rocket
into multiple billions of euros.
To mitigate the risk of spiralling costs, the height of the guarantee can be capped. To
minimise the public sector exposure, only the minimum acceptable DSCR should be covered.
We assume that a minimum acceptable level for a DSCR in this sector is 1.12. With a goal-
seek approach, the financial model can be used to determine the level of revenues needed to
reach a DSCR of 1.12 in the first two years of operation. The revenue needed is EUR 36
million in each of these first two years, totalling EUR 72 million. This is less than half of the
full revenues, which means an effective saving for the public sector financier if the guarantee
is called upon.
Business case: Large ship-to-ship facility
This case has the following characteristics:
Table 8-5 Characteristics – large ship-to-ship facility
Input Metric Value of metric
Fuel delivery Ship-to-ship (scenario 6d)
Capacity Large
Traffic scenario Medium
Vessel scenario High
LNG price discount 40%
LNG Mark-up 10%
HFO price $ 400 / EUR 166
Source: Ocean Shipping Consultants a company of Royal HaskoningDHV
The outcomes without applying guarantees are as follows:
Table 8-6 Results scenario 6d (base case)
NPV IRR ROE Average DSCR
Scenario 6d – Ship to
Ship – large capacity EUR 143 million 19% 16% 7.03
Source: Ocean Shipping Consultants a company of Royal HaskoningDHV
From these outcomes, it follows that this is an economically viable case: the NPV is positive,
the IRR is higher than the discount rate, and the return on equity is 16%. However, even
though the average DSCR is at an acceptable level (above 7), the DSCR in the first two
R e s t r i c t e d
08 June 2016 M&WPB3039-103-100R001D11
136
years of operation is much lower (0.0 and 0.74, respectively). Due to the DSCR being too
low in the first years, it will probably not be possible to obtain finance for this business case
at commercial terms, even though it is economically viable.
To solve this issue, a guarantee could be introduced, which brings the DSCR to an
acceptable level. We assume that a minimum acceptable level for a DSCR in this sector is
1.1222. With the same goal-seek approach, we determine that the level of revenues needed
to obtain a DSCR of 1.12 is EUR 135 million and EUR 138 million for the two years,
respectively, totalling EUR 273 million (in the original situation, the revenue in these years
totalled EUR 204 million, too little to obtain a positive DSCR).
Thus, providing a guarantee improves the business case financially and reduces the
financing gap, as is also shown in the table below.
Table 8-7 Results scenario 6d (with guarantees)
NPV IRR ROE Average DSCR
Scenario 6d – Ship to
Ship – large capacity EUR 149 million 19% 16% 7.12
Source: Ocean Shipping Consultants a company of Royal HaskoningDHV
8.3.2 Senior debt by public sector lender (IFI)
A second potential product of financial instruments we determine the effects of is senior
debt. Of course, senior debt is often provided to projects by commercial lenders. However,
business cases can benefit if a part of the senior debt is provided by a public sector lender,
such as an International Financial Institution (IFI). In this example, we explore the effect if
50% of the senior debt is provided against attractive terms and conditions.
Business case: Medium shore-to-ship facility
This case has the following characteristics:
Table 8-8 Characteristics – medium shore-to-ship facility
Input Metric Value of metric
Fuel delivery Shore-to-ship (scenario 3c)
Capacity Medium
Traffic scenario Medium
Vessel scenario Low
LNG price discount 40%
LNG Mark-up 5%
HFO price $ 400 / EUR 166
Source: Ocean Shipping Consultants a company of Royal HaskoningDHV
22
Expert judgment by Royal HaskoningDHV, based on commonly used values in infrastructure projects in Europe.
R e s t r i c t e d
08 June 2016 M&WPB3039-103-100R001D11
137
The financial structure in the base case (without public senior debt) is as follows:
Table 8-9 Characteristics of financial facilities in base case
Financing facility Characteristics Explanation
Equity Tranche 30% of funding requirement
Return on equity (ROE) dependent
on results (target minimum = 15%).
Drawdown period is equal to construction period.
Redemption of equity (including any dividend) takes place as
soon as the project’s cash flows allow this (typically after the debt
has been repaid).
Senior Debt
(Commercial)
70% of funding requirement
Interest rate = 5.5% 23
Grace period = 5 years
It is assumed that the total debt for the project (in the Base Case
totalling approximately 70% of the funding requirement) is
provided by commercial banks.
Drawdown during construction period; redemption during
operations period.
Source: Ocean Shipping Consultants a company of Royal HaskoningDHV
The outcomes without applying public senior debt are as follows:
Table 8-10 Results scenario 3c (base case)
NPV IRR ROE Average DSCR
Scenario 3c – Shore to
Ship – medium capacity EUR 29.2 million 22% 15% 6.04
Source: Ocean Shipping Consultants a company of Royal HaskoningDHV
From these outcomes, it follows that this is an economically viable case: the NPV is positive,
the IRR is higher than the discount rate, and the return on equity is 15%. However, even
though the average DSCR is at an acceptable level (above 6), the DSCR in the first year of
operation is much lower (0.56). Due to the DSCR being too low in the first year, it will
probably not be possible to obtain finance for this business case at commercial terms, even
though it is economically viable.
We introduce a public sector senior debt facility, which has similar characteristics to the
commercial senior debt, albeit that the interest rate equals 4.5% instead of 5.5%. The effect
if 50% of senior debt is borrowed against these conditions is shown in the table below.
Ship – medium capacity EUR 30.9 million 22% 16% 6.25
Source: Ocean Shipping Consultants a company of Royal HaskoningDHV
The financial metrics of the business case improve slightly, but the DSCR in the first year
only improves to 0.62. We have determined the level of the interest rate at which the DSCR
in the first year would be 1.12. The solution for this specific business case is 0.02%. In other
words, 50% of the senior debt should be provided almost free of charge (interest rate close
to zero) for the financing gap to disappear. We realise that this is not feasible. However, this
example does show that senior debt at attractive terms and conditions can be a useful
23
The interest rate of the Senior Debt Commercial is built up as a Swap Base Rate (2.75%), plus a Credit Margin (200 basis points) and a Swap Margin (75 basis points).
R e s t r i c t e d
08 June 2016 M&WPB3039-103-100R001D11
138
ingredient (product) in the toolbox of a successful financial mechanism for the sector for LNG
as marine fuel.
A combination of cheaper senior debt and a guarantee may also work as a good solution. In
this example, providing 50% senior debt at 4.5% interest as well as a guarantee worth
EUR 4 million also improves the business sufficiently to eliminate the financing gap.
8.3.3 Grant
Even though grants are not part of the innovative financing mechanisms that have been
listed under Task 2, they often form part of a financial solution for projects in this sector. A
grant can be provided at different levels, be it a Member State or EU level. The scenario
below explores the effect of a grant worth 50% of the capital expenditure.
Business case: Large shore-to-ship facility
This case has the following characteristics:
Table 8-12 Characteristics – large shore-to-ship facility
Input Metric Value of metric
Fuel delivery Shore-to-ship (scenario 4b)
Capacity Large
Traffic scenario Medium
Vessel scenario High
LNG price discount 20%
LNG Mark-up 10%
HFO price $ 400 / € 166
Source: Ocean Shipping Consultants a company of Royal HaskoningDHV
The outcomes without applying a grant are as follows:
Table 8-13 Results scenario 4b (base case)
NPV IRR ROE Average DSCR
Scenario 4b – Shore to
Ship – large capacity EUR 188 million 18% 16% 6.86
Source: Ocean Shipping Consultants a company of Royal HaskoningDHV
From these outcomes, it follows that this is an economically viable case: the NPV is positive,
the IRR is higher than the discount rate, and the return on equity is 15%. However, even
though the average DSCR is at an acceptable level (above 6), the DSCR in the first two
years of operation is much lower (0.00 and 0.78, respectively). Due to the DSCR being too
low in the first years, it will probably not be possible to obtain finance for this business case
at commercial terms, even though it is economically viable.
Introducing a grant worth 50% of the CAPEX (50% of EUR 100 million equals EUR 50
million) spread over the first two years of operation closes the financing gap. The DSCR is
acceptable throughout and the financial metrics of the projects improve generally.
R e s t r i c t e d
08 June 2016 M&WPB3039-103-100R001D11
139
Table 8-14 Results scenario 4b (with grant)
NPV IRR ROE Average DSCR
Scenario 4b – Shore to
Ship – large capacity EUR 233 million 24% 16% 7.41
Source: Ocean Shipping Consultants a company of Royal HaskoningDHV
8.3.4 Tax exemption
Tax exemptions are not part of the financing mechanisms listed under Task 2. However,
they must be taken into account as many Member States have programmes to support the
LNG sector, which sometimes contain tax exemption measures. The effect of tax exemption
is useful for the sector for LNG as marine fuel, as it would increase annual revenues for the
project, causing it to have more cash available for debt service. However, this measure is
especially effective on the demand side (vessel operators) and from our market research it
followed that they do not need public participation to get their projects financed. Moreover,
tax exemption is a very costly (and complex) measure.
8.4 Conclusions from the examples
From the examples worked out above, it follows that guarantees, cheaper senior debt as
well as grants (and tax exemption) all assist in targeting the causes of the financing gap
identified in Task 2. As these financial products do this in a different way, this makes them
excellent complimentary products as part of a wider financial mechanism to be developed for
the sector for LNG as marine fuel.
8.5 Framework conditions for implementing financial
mechanisms
This section builds upon the recommendations for the key characteristics for a financial
mechanism for the marine LNG sector, as laid out Task 2, and for which examples have been
shown above. It will further address the conditions for such framework to be implemented in
the European Union.
8.5.1 Supply side support
Our research indicates that financial instruments, striving to accelerate the market for
marine LNG, should be aimed towards the supply side of the market. This means that assets
eligible for application of the instrument should include landside structures, such as
liquefaction, storage and bunkering systems for marine LNG. Any party investing in this type
of assets should in principle be able to successfully apply for the instrument, notwithstanding
existing regulation on state aid, distortion of competition, etc.
Table 8-15 Framework conditions supply side support
Criterion # Description
01 Eligible assets: bunkering facilities (liquefaction, storage and bunkering systems)
02 Eligible parties: all private and public parties
Source: Ocean Shipping Consultants a company of Royal HaskoningDHV
R e s t r i c t e d
08 June 2016 M&WPB3039-103-100R001D11
140
8.5.2 Flexible structure
The available sources of financing are likely to differ from project to project, depending on
the project’s sponsor and partners and their funds as well as their preferred risk profile. The
deployment of public means should be optimised by filling the gap in private financing, in the
most suitable form for the project at hand. This is more helpful in accelerating the market
development than making only one type of financing available to the market. However, this
is not to say that the instrument should cover all risks the parties involved in a certain
transaction are not willing to bear. The key lies in optimally fine-tuning the instrument’s
characteristics such, that it addresses the key risks the companies face causing them to be
unable to obtain private finance, while staying away from all other risks associated with the
business.
In addition, the different types of projects and sponsors will also mean that the instrument
should be able to interact with both corporate and project (limited-recourse) finance. When
a utility company, such as a TSO24 for natural gas, is the sponsor, it is likely that the project
is small in comparison to the company’s balance sheet and the utility will probably be able to
finance at lower costs on its balance sheet rather than opt for project finance.