+ All Categories
Home > Documents > LNG Density

LNG Density

Date post: 29-Dec-2015
Category:
Upload: tmartin125
View: 136 times
Download: 7 times
Share this document with a friend
Description:
LNG Density
Popular Tags:
9
@ 9 Q ‘? $+ Density of Liquefied Natural Gas Robert H. Jensen, U. of Krmsas Fred Kurata, SPE-AIME, U. of Kansas Introduction Liquefied natural gas, LNG, is being handled in in- creasing quantities, and a reliable and convenient method of determining LNG density is desired. If a composition analysis is available, the correlations of Harmens’*2 and of Lyckman, Eckert, and Prausrdtzg may be used to calculate LNG density. Harmens’ correlation was developed for the den- sity of pure light hydrocarbon liquids at saturation and for the density of mixtures of such hydrocarbons, particularly of LNG, In the correlation, Eq. 1 is used to calculate liquid densi~: p=c Or’(Tr). . . . . . . (1) C and F(T,) were tabulated by Harmens. C is an empirical density constant, and F( T~) is Harmens’ generalized density function. T, is reduced tempera- ture, T/ T,, To apply the correlation to mixtures, mixing rules were givenl’2 to compute C and Tc from mixture composition and pure component values. In the correlation of Lyckrnan, Eckert, and Praus- nitz, reduced saturated volume v, is given as a quad- ratic function of acentric factor: v~= v/vc = v,(o) + @vf(l ) + Uzvr(z) . (2) p= M/v, . . . . . . . . (3) where v is molar volume, VCis critical molar volume, and M is mol cular weight. The generalized functions / of reduce temperature V~(0) j V~(*)~ad vr(z)) were tabulated by Lyckman, et al., in the range T, = 0.560 to T, = 0.990. Chueh and Prausnitz4 fitted the tabu- lated values to Eq. 4 and provided the coefficients @ to f(~). + e(~)/T, + j(~)ln(l -T,) . . . (4) Eq. 4 is valid for reduced temperatures from 0,560 to 0.995. Mixing rules were suggested by Chueh and Prausnitz to calculate pseudocritical volume and tem- perature, and mixture acentric factor, for application of the correlation to mixtures of known composition. In using the foregoing correlations, a composition analysis is required, and mixture pseudo constants must be calculated. To provide an easier and quicker procedure for the man in the field, a study was under- taken to correlate LNG density as a function of three measurable properties: tempera~re, pressure, and the gas gravity of gasified LNG. A technician can make these measurements routinely with commer- cially available equipment. Theory To derive the LNG density correlation, equations are required for computing ternary mixture composi- tions, gas gravities, and liquid densities at fixed tem- peratures and pressures. If the vapor phase over an ideal solution behaves An experimentally derived tabular correlation for LNG density as a function of temperature, pressure, and gas gravity has been designed for use in the field. The advantages of this correlation are that a gas gravity analysis is more easily obtained than a composition analysis and that density is determined by direct interpolation of the gas gravity tables. JUNE, 1969 683
Transcript

@

9 Q

‘?$+

Density of Liquefied Natural GasRobert H. Jensen, U. of KrmsasFred Kurata, SPE-AIME, U. of Kansas

IntroductionLiquefied natural gas, LNG, is being handled in in-creasing quantities, and a reliable and convenientmethod of determining LNG density is desired. If acomposition analysis is available, the correlations ofHarmens’*2 and of Lyckman, Eckert, and Prausrdtzgmay be used to calculate LNG density.

Harmens’ correlation was developed for the den-sity of pure light hydrocarbon liquids at saturationand for the density of mixtures of such hydrocarbons,particularly of LNG, In the correlation, Eq. 1 is usedto calculate liquid densi~:

p=c Or’(Tr). . . . . . . ● (1)

C and F(T,) were tabulated by Harmens. C is anempirical density constant, and F( T~) is Harmens’generalized density function. T, is reduced tempera-ture, T/ T,, To apply the correlation to mixtures,mixing rules were givenl’2 to compute C and Tc frommixture composition and pure component values.

In the correlation of Lyckrnan, Eckert, and Praus-nitz, reduced saturated volume v, is given as a quad-ratic function of acentric factor:

v~ = v/vc = v,(o) + @vf(l) + Uzvr(z) . (2)

p= M/v, . . . . . . . . (3)

where v is molar volume, VCis critical molar volume,and M is mol cular weight. The generalized functions

/of reduce temperature V~(0)j V~(*)~ad vr(z)) were

tabulated by Lyckman, et al., in the range T, = 0.560to T, = 0.990. Chueh and Prausnitz4 fitted the tabu-lated values to Eq. 4 and provided the coefficients@ to f(~).

+ e(~)/T, + j(~)ln(l -T,) . . . (4)

Eq. 4 is valid for reduced temperatures from 0,560 to0.995. Mixing rules were suggested by Chueh andPrausnitz to calculate pseudocritical volume and tem-perature, and mixture acentric factor, for applicationof the correlation to mixtures of known composition.

In using the foregoing correlations, a compositionanalysis is required, and mixture pseudo constantsmust be calculated. To provide an easier and quickerprocedure for the man in the field, a study was under-taken to correlate LNG density as a function of threemeasurable properties: tempera~re, pressure, andthe gas gravity of gasified LNG. A technician canmake these measurements routinely with commer-cially available equipment.

TheoryTo derive the LNG density correlation, equations arerequired for computing ternary mixture composi-tions, gas gravities, and liquid densities at fixed tem-peratures and pressures.

If the vapor phase over an ideal solution behaves

An experimentally derived tabular correlation for LNG density as a function oftemperature, pressure, and gas gravity has been designed for use in the field. Theadvantages of this correlation are that a gas gravity analysis is more easily obtainedthan a composition analysis and that density is determined by direct interpolationof the gas gravity tables.

JUNE, 1969 683

as a perfect gas, Raoult’s law is obeyed by eachcomponent: 5

Pi =xiPoi . . . . . . . . . (5)

Total pressure over a solution is the sum of the par-tial pressures, and liquid phase non-idealities are ac-counted for by activity coefficients:

For a binary methane-nitrogen mixture, total pres-sure is written in terms of mole fraction nitrogen, x5:

P = y, PO, + (y,Po, – y,Po, )x5 . . (7)

A plot of P vs x, does not necessarily result in astraight line, as Eq. 7 indicates, because YIand Y6arefunctions of composition. However, a P-x, plot maybe used to find y, and y. by applying Eq. 7 locally toP–x, curves, P and x, values above and below thepressure at which activity coefficients are desired aresubstituted into Eq. 7, and two equations are solvedsimultaneously for Y*and YE.Total pressure over aternary mixture is given by Eq, 8, where the sub-scripts 1 and 5 refer to methane and nitrogen, respec-tively, and the subscript j is equal to either 2, 3, or 4,referring to ethane, propane, or n-butane, respectively:

P = y,x,Po, + y,xJPo, + yjxjPoj ., . j =2, 3,4

. . ..$ . . . . (8)

At the low temperatures involved in this study, thevapor pressures of ethane, propane, and n-butane arenegligible. The third term in Eq. 8 is therefore setequal to zero. Solving for X5and x,:

x, = (P – y,xlPo,)/y,Po, . . . . (9)

Xj =l– X,-X,. . . . . , . (lo)

To compute an equilibrium ternary composition fora mixture containing methane, nitrogen, and eitherethane, propane, or n-butane as the third component,at a fixed temperature and pressure, mole fractionmethane xl is assumed; y, and y~ are assumed equalto the binary mixture methane and nitrogen activitycoefficients at that temperature and pressure; and X6and Xjare calculated from Eqs, 9 and 10, respectively.

If mixture composition is known, gas gravity maybe calculated, Gas gravity is defined as the ratio ofgas density at 60F (520°R) and 1 atm to the densityof air at the same conditions, 0,001224 gm/ccc:

G = %/~air= =/0.001224 . . . (11)

The ideal gas law is assumed for the gas; and 1 atm,52001{, and the ideal gas law constant are substitutedinto the equation:

G = PM/O.001224RT = 0.03449M

= 0.03449xt xiMi . . . . . . (12)

To calculate liquid density from composition, ex-cess specific volumes are utilized. The excess specificvolume, ‘cc/gin, of a binary mixture is equal to actualspecific volume minus ideal solution specific volume:

VE,:J = V,:j – Vls,:j = l/pl:j – %pl–~J/PJ. ..j =2,3,4,5 . . (13)

Ternary mixture excess specific volume is assumedequal to the weighted average of the excess specificvolumes of the two methane-containing bkary mix-tures at the same temperature and weight fractionmethane:

VE1:,:, = (V’,:j 1) + VE,:, ;)/(l–x, ).. ,j= 2,3,4 . . (14)

Ternary density is calculated from pure componentand binary mixture densities:

pl:j:fi= 1/vl,j,5 = I/(;I/p, + 2j/pj + :,/p.

+ VE,:j:J. ..j =2,3,4 . (15)

Ternary mixture compositions, gas gravities, andliquid densities, at fixed temperatures and pressures,may therefore be calculated from Eqs. 9, 10, 12, and15, respectively,

Description of EquipmentTheexperimental apparatus consisted of three majorparts: a glass equilibrium cell, a low-temperature airbath, and a constant-temperature injection box. Thelast two parts were built by Sinor and were discussedin detail elsewhere.7*sThe Pyrex glass equilibriumcell had a volume of approximately 100 cc. Liquidvolume in the cell was determined with a cathetome-ter, and cell pressure was read with a mercury man-ometer in inches of Hg to the nearest 0.1 in. Tem-peratures in the low-temperature bath were measuredand controlled to within Zk0.02°C with a platinumresistance thermometer.

An experimental fluid was injected into the equi-librium cell by a positive displacement piston pumpat a known temperature and pressure. The injectedmass was calculated from the volume displaced bythe pump and from volumetric properties of the fluidat the pump temperature and pressure. For binarymixtures, two mixture mmponents were injected intothe cell separately. For the five-component systems,gaseous mixtures were injected into the cell, The massand volume of the vapor phase inside the ce!~werenegligible in comparison with the liquid phase. How-ever, a correction was made for vapor mass whencalculating experimental liquid densities,

An error analysis showed that the maximum ex-pected experimental error in pure component andbinary mixture liquid density measurements was+0,5 percent; the maximum expected experimental

TABLEI—LIQUID DENSITY OF PURE GRADE METHANEComposition: 99.39 mole percent CH,, 0.08 moie percentC,H,, 0.53 mole percent N,. Gas Gravity = 0.5559

In! Hg

.120!0-175,0-170.0-161.7-160.0

1;:;17.835.539.0

ExperimentalLfqu~,yl ty

. .

0.44920.4430:.:;;:

0:4213

Calculated Liquid Oensl ties, 9 Icc

Thi? Hmens’ Lyckman’sCorrelation Correlation CorrelationP %dev p %dev D %dev

0.4586 -2.05 0.4478 +0.31 0.4412 +1.810.4464 -0.76 0.4406 +0.54 0,4366 +1.470.4392 -0.77 0.4334 +0.55 0.4322 to.830.4276 -0.96 0.4213 +0,50 0.4246 -0.280.4247 -0.$9 0.4128 +0.60 0.4228 -0.35

684 JOURNAL OF PETROLEUM TECHNOLOGY

>

TABLE 2—LIQUID DENSITY OF PURE GRADE E1’HANEComposition: 99.80 mole percent C$HS,0.15 mole percentC,H,,0.05 moie percent Nz. Gas Gravity = 1.0378

Calculated LiquidDensities,9 /ccP Experimental Harmens’ Lyckman’s

‘: in,Hg Llqu:d,~ity Correlation Correlation0 %dev o $dev

-170,0 5,9 0.6411 0.6433 -0,34-160.0 6.8 0.6318

0.6508 -1.490,6319 -0,02

-150.00.6387 -1.08

0,6208 0.6204 +0.06 0.6270 -0.99-140.0 ::!

0.6082 0,6086 -0,07 0.6158 -1.23-130,0 9,9 0.5970 0.5968 +0.03-120.0 11.9 0.5852

0.6049 -1.310.5S48 +0.07 0.5944 -1.55

-110.0 15,3 0.6736 0,5727 +0.16 0.5843 -1,83

TABLE 3-LIQUID DENSITY OF INSTRUMENTGRADE PROPANE

Composition: 99.93 mole percent C,H8, 0.07 mole percentN,, Gas Gravity = 1.5205

CalculatedLiqtsfdOensitfes,9 /ccT Experimental Hannens’Oc 1n! Hg Liqu:d,~f ty

Lyckman’sCorrelatfon COrrelatfonP %dev P %dev

-180.0 <1.0 0,7252 0,7264 -0.17 0.7296 -0.60-770.0 <1’0 0.7149 0,7165 -0.224Mg.g <7..0

0.7168 -0.270.7041 0.7066 -0.35 0.7045 -0.06

<1.0 0.6942 0.6965 -0.33 0.6926 +0.23-140:0 <1.0 0.6S42 0,6864 -0.32 0.6810 +0,47

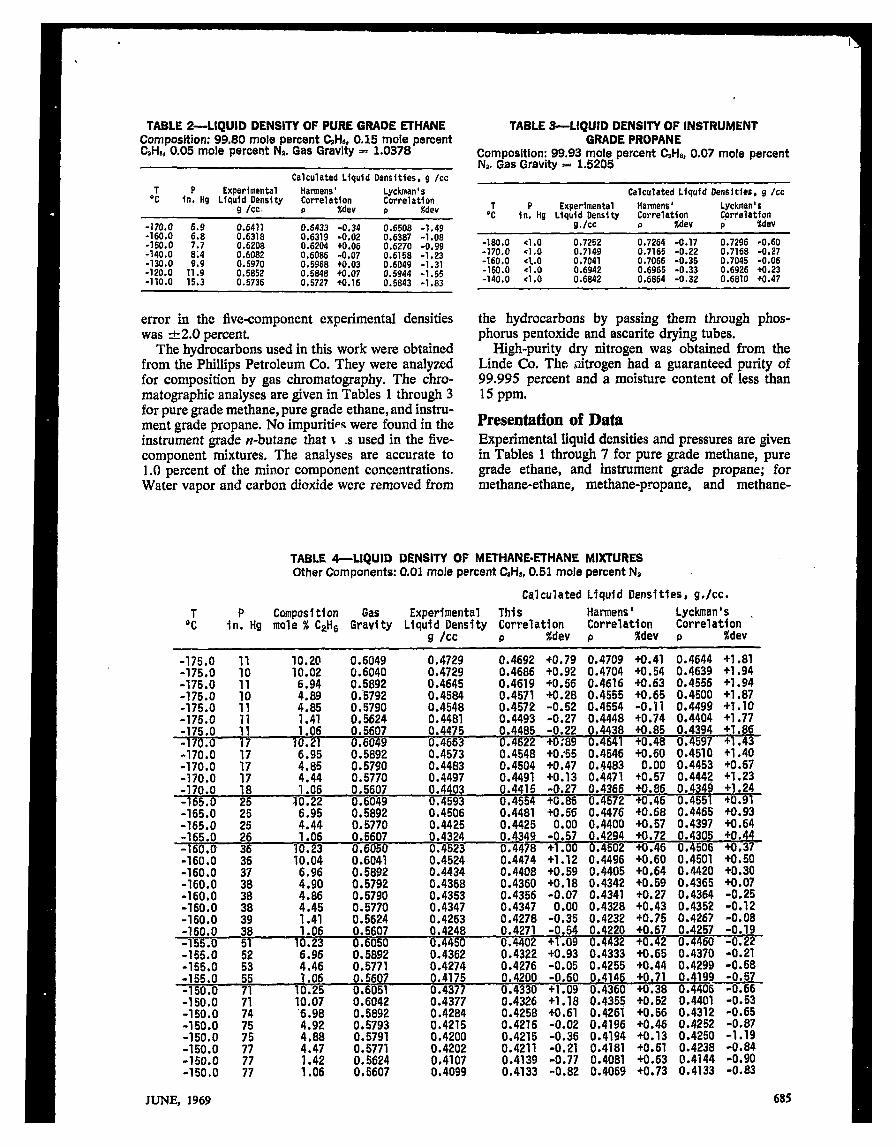
error in the five-component experimental densitieswas *2.0 percent,

The hydrocarbons used in this work were obtainedfrom the Phillips Petroleum Co. They were analyz~dfor composition by gas chromatography. The chro-matographic analyses are given in Tables 1 through 3for pure grade methane, pure grade ethane, and instru-ment grade propane. No impuriti= were found in theinstrument grade n-butane that \ .s used in the five-component mixtures. The analyses are accurate to1.0 percent of the minor component concentrations.Water vapor and carbon dioxide were removed from

the hydrocarbons by passing them through phos-phorus pentoxide and ascarite drying tubes.

High-purity dry nitrogen was obtained from theLinde Co. The nitrogen had a guaranteed purity of99.995 percent and a moisture content of less than15 ppm,

Presentation of DataExperimental liquid densities and pressures are givenin Tables 1 through 7 for pure grade methane, puregrade ethane, and instrument grade propane; formethane-ethane, methane-propane, and methane-

TABLE 4-LIQUID DENSITY OF METHANE.ETHANE MiXTURESother Components: 0,01 mole percent C,H,,0.51 11’IOle13@rC@IItN,

Calculated l.iqu~d Densdties, g.icc.

P Compositlon Gas Exper~rnental This Harmens’‘:

Lyckman’sin, Hg mole % C#6 Gravity Liqu:d,:mi ty Correlation Correlation Correlation

o %dev Q %dev P %dev

-175.0 11 10.20 0.6049 0.4729 0.4692 +0.79 0.4709 +0.41 0.4644 +1 .81-175,0 ;! 10.02 0.6040 0.4729 0.4686 +0.92 0.4704 +0.54 0.4639 +1 .94-175.0 6.94 0.5892 0.46454;;.; j!

0.4619 +0.56 0.4616 +0.63 0.4556 +1.944.89 0.”5792 0.4584 0.4571 +0.28 0.4555 +0.65 0.4500 +1 .87:.:: 0.5790 :.::;;

-175:00.4572 -0.52 0.4554 -0.11 0.4499 +1.10

:. y; 0.4493 -0.27 0.4448 +0.74 0.4404 +1 .77-175.0 !: 1:06 0:4475 0.4485 -0.22 0.4438 +0.85 0.4394 +1086

0:6049 0.4663 0.4622 +0;89 0.4641 +0.48 0.4597 +1 .43:170:0 17 0.5892 0.4573-170.0 17

0.4548 +00’55 0.4546 +0.60 0.4510 +1 .404.85 0.5790 0.4483 0.4504 +0047 0.4483 0.00 0.4453 +0.67

-170.0 17 ;.;; 0.5770 0.4497 0.4491 +0.13 0.4471 +0.57 0.4442 +1 .23-170.0 18 0.5607 0.4403 0.4415 -0.27 0.4366 +0.86 O:4;~9 ;J;4

~ 2;::; 0.6049 .4593 0.4554 +6.86 0.4572 +0.46-165.0 25 0.5892 0.4506-165.0 25 ::;;

0.4481 +0.56 0.4476 +0.68 0.4465 +0:930.5770 0.4425 0.4425 0.00 0.4400 +0.57 0.4397 +0.64

-165.0 26 0.5607 0.4324:;;;.; 36 10:23

0.4349 -0.57 0.4294 +0.72 0.4305 +0.440.6050 0.4523

36 10.040.4478 +1.00 0.4502 +0.46 0.4506 +0.37

0.6041 0.4524-160:0 37 6.96

0.4474 +1.12 0.4496 +0.60 0.4501 +0.500.5892 0.4434

-160.00.4408 40.59 0.4405 +0.64 0.4420 +0.30

4.90 :.:;;; 0.4368 0.4360 +0.18 0.4342 +0.59 0.4365 +0.07-160.0 % 4.86 0.4353 0.4356 -0.07 0.4341 +0,27 0.4364 -0.25-160.0 38 ;.:; 0:5770 0.4347 0.4347 0.00 0.4328 +0.43 0.4352 -0.12-160.0 39 ;.;::; 0.4263 ;W;i -0.35 0.4232 +0.75 0.4267 -0.08-160.0 38 1:06 0.4248 -0.54 0.4220 +0.67 0.4257 -0.19-155.0 51 0.23 0:6050 0.4450 0:4402 +1.09 0.4432 +0.42 0.4460 -0.22-155.0 52 6.96 :* y’ 0.4362 0.4322 +0.93 0.4333 +0.65 0.4370 -0.21-165.0 53 4.46 0.4274 0.4276 -0.05 0.4255 +0.44 0.4299 -0.58-155.0 55 1.06 0:5607 0.41 5 0.4200 -0.60 0.4146 +0.71 0.4199 -0057-1 0.0 71 ]:.;;~ 0.6051-150.0 71 0.6042

0.4330 +1.09 0.4360 +0.38 0.4406 -0.660.4377 0.4326 +1.18 0.4355 +0.52 0.4401 -0.53

-150.0 74 “$;; 0.5892 0.4284-150.0 75

0.4258 +0.61 0.4261 +0.56 0.4312 -0.65:.:;;: 0.4215

-150.0 ;; 4;880.4216 -0.02 0.4196 +0.46 0.4252 -0.87

0.4200 0.4215 -0.36 0.4194 +0.13 0.4250 -1.19-150.0 4.47 0:5771 0.4202-150.0 77 1.42

0.4211 -0.21 0.4181 +0.51 0.4238 -0.840.5624 O*41O7

-150.0 770.4139 -0.77 0.4081 +0.63 0.4144 -0.90

1.06 0.5607 0.4099 0.4133 -0.82 0.4069 +0.73 0.4133 -0.83

JUNE, 1969 685

TABLE 5—LIQUID DENSITV OF METHANE-PROPANE MIXTURESOther Components: 0.07 mole percent C,H,, 0.50 mole percent N,

Calculated Liquid Densities, g /cc

P Composition Gas Experimental This Hannens’“:

Lyckman’sin. Hg mole % C3H8 Gravity Liqu:d,:nsity Correlation Correlation Correlation

P %dev P %dev P %dev

-165.0 25 10.03 0.6528 0.4747 0.4776 -0.61 0.4804 -1.19 0.4738 +0.20-164.0 29 4.13 0.5958 0.4463 0.4496 -0.73 0.4488 -0.56 0.4465 -0.04-162.0 34 10.03 0.6528 0.4698 0.4734 -0.76 0.4764 -1.39 0.4709 -0.24-162.0 34 4.14 0.5958 0.4435 0.4467 -0.72 0.4460 -0.57 0.4447 -0.27-161.7 35 7.35 0.6269 0.4564 0.4607 -0.93 O.462I-160.0 39 10.04 0.6528 o.a671 0.a7na -0.70 lla7?J

‘ii -1.36 0.4589 -0.55

-160.0 39-----.

7.35-...- . -..-

0.6269-..,-6 -1.40 0.4691 -0.41

0.4538 0.4582 -0.96 0.460a -1.42 0.4574 -0.77-160.0-159.0-158.0-158.0-158.0-157.0-156.0-156.0-156.0-154.0-154.0-154.0-152.0-152.0-152.0

4.14 0.59597.35 0.6269

10.04 0.65284645505253

7.35 0.62694.14 0.59597.35 0.6269

10.04 0.65297.35 0.62694.14 0.5959

10.05 0.65297.36 0.62704.14 0.5959

10.05 0.65307.36 0.62704.15 0.5959

-----0.4402 0:4435 -0.72 0.4432 -0.68 0.4430 -0.620.4528 0.4566 -0.83 0.4590 -1.37 0.4565 -0.810.4644 0.4670 -0.56 0.471T -1.42 0.4672 -0.600.4514 0.4551 -0.81 0.4577 -1.38 0.4556 -0.920.4375 0.4406 -0.70 0.4404 -0.67 0.4411 -0.830.4501 0.4536 -0.77 0.4563 -1.36 0.4547 -1.010.4617 0.4640 -0.50 0.4684 -1.44 0.4654 -0.790.4487 0.4521 -0.75 0.4549 -1.38 0.4538 -1.120.4346 0.4378 -0.73 0.4376 -0.69 0.4392 -1.040.4590 0.4610 -0.43 0.4657 -1.44 0.4635 -0.980.4458 0.4492 -0.76 0.4522 -1.40 0.4520 -1.350.4322 0.4346 -0.55 0.4347 -0.58 0.4371 -1.110.4560 0.4582 -0.48 0.4630 -1.51 0.4617 -1.230.4431 0.4464 -0.74 0.4494 -1.40 0.4501 -1.540.4292 0.4322 -0.69 0.4319 -0.62 0.4349 -1.31

TABLE 6-LIQUID DENSITY OF METHANE-NITRoGEN MIXTURESOther Components: 0.07 mole percent C,H,

CalculatedLiquid Densftfes,g /cc

P Composition Gas Experimental This Harmens’“:

Lyckman’sin. Hg mole % N2 Gravity Liquid Density Correlation Correlation Correlation

g /cc P %dev o %dev p %dev

-175.0 40.5 9.54 0.5931 0.4692 0.4703 -0.23 0.4731 -0.83 0.4670 +0.46-175.0 39.9 9.21 0.5917 0.4686 0.4694 -0.17 0.4720 -0.70 0.4659 +0.59-175.0 33.8 6.59 0.5809 0,4601-175.0 21.5

0.4624 -0.50 0.4626 -0.54 0.4571 +0.663.45 0.5679 0.4507 0.4535 -0.62 0.4512 -0.10 0.4464 +0.96

-170.0 59.5 9.50 0.5929 0.4614 0.4619 -0.11 0.4648 -0.73 0.4620 -0.14-170.0 56.8 9.17 0.5916 0.4629 0.4608 +0.46 0.4636 -0.17 0.4609 +0.42-170.0 46.5 6.57 0.5808 0.4523-170.0 31.7

0.4538 -0.33 0.4546 -0.51 0.4522 +0.013.43 0.5679 0.4434 0.4454 -0.45 0.4436 -0.04 0.4418 +0.37

-165,0 78.7 9.44 0.5927 0.4506 0.4538 -0.71 0.4562 -1.24 0.4566 -1.31-165.0 76.3 9.12 0.5914 0.4549 0.4530 +0.42 0.4551 -0.14 0.4555 -0.23-165,0 62,6 6.53 0.5806 0.4445-165.0 44.0

0.4464 -0;43 0.4464 -0.44 0.4472 -0.610.5678 0.4357 0.4390 -0.75 0.4359 -0.04 0.4372 -0.33

-160.0 81.4 0.5804 0.4362 0.4390 -0.64 0.4381 -0.43 0.4412 -1.12-160.0 62,0 0.5677 0.4279 0.4316 -0.86 0.4281 -0.05 0.4317 -0.88-155.0 81.0 3.35 0.5676 0.4199 0.4245 -1.08 0.4201 -0.05 0.4253 -1.26

3.416.483.39

TABLE 7—LIQUID DENSITVOF FIVE.COMPONENT MIXTURES

-.-~,w

0.4960 ‘“-u’” ““=’ ““*DUD----- -..,,-.

0.4833 +2.63 0.4886 +1.51 0.4812 ~;:&0.4782 0.4681 +2,16 0.4727 +1.150.4844 0.4745 +2.09 0.4794 +1.04 0:4;~; l;:2;0.4888 0.4759 +2.71 0.4813 +1.57 0.4762 +2.640.4682 0.4609 +1.58 0.4654 +0.61 0.4634 +1.04

5.62 0.6363 0.4763 0.4668 +2.04 0.4719 +0.93 0.4690 +1,554.77 0.6401 0.4756 0.4679 +1,65 0.4739 +0.36 0.4714 +0,90

Composition*, mole %“: in! Hg

GasGravity

C2H6 C3M3 CI#IO f42

-175.0 24.4 4.68 1.44 1.32 4.26 0.6268-175.0 28.4 2.99 2.01 1.76 5.72 0.6364-175.0 29.3 7.74 1.82 0.81 4.84 0.640270.0 35.4 4.68 1.44 1.32 4.25 0.6268

:170.0 44.3 2.99 2.01 1.77 5.70 0.6364-170.0 42.4 7::; 1.83 0.81 4.83 0.6402-165.0 47.8 1.45 1.33 4.22 0.6267-165.0 60.1 2.99 2.01 1.77 5.67 0.6364-165.0 55.9 7.75 1.83 0,81 4.80 0.6402-160.0 68.6 4.7o 1.45 1.33 4.19 0.6267-160.0 78.3 3.00 2;01 1.77-160.0 72.1 7.76 1.83 0.81

Calcualted Liquid Densities, g /cc

Experimental This. Harmens’ Lyckman’s’Liquid Density Correlation Correlation

9.ICC.Correlation

P %dev p %dev o %dev

0.4925 0.4827 +2.03 0.4872 +1.09 0.4781 +3.010.4990 0.4886 +2.13 0.4941 +0.98 0.4840 +3.090.5029 0.4907 +2.49 0.4958 +1.44 0.4863 +3.420.4851 0.4752 +2.08 0.4800 +1.07n AQ12 4731 +2.54

n .IQ1!2 A1 a7 n ha.=q M.W n.A7mlMm

*CH4 fs 5th component

686 JOURNAL OF PETROLEUM TECHNOLOGY

.

nitrogen binary mixtures; and for three five-compo-nent mixtures, After these data were combined withdata from other sources~’0 equations were derivedfor saturated liquid density (gin/cc), as a functionof temperature (degrees C), for methane, ethane,propane, and n-butane:

Pf =A,j+A,j~+~,j~’,.cj=l,z,3, 4

. . . . . . . . . . (16)

The constants A,J, A,J, and A,j were determined bythe method of least squares. The constants and theirapplicable temperature ranges are given in Table 8.In developing the gas gravity correlation, the densityof pure liquid n-butane was extrapolated below itsfreezing point to – 175C, Equations were also de-rived for the density of binary m“xtures (gin/cc), asa function of temperature (‘C), and mole fractionheavy component, xj, for the composition range Oto 0.10 mole fraction heavy component.

pl:j= 0,0329 -33.548 “ 10-4T – 5,8381

● 10-6T2-t- /4.!jXj + ~@2j

+/lGjxsj. ..j =2,3,5 . . . (17)

Applicable temperature ranges and the least-squaresconstants A+j, A,~, and A Ojare given in Table 9, AtXj = O, Eq. 17 reduces to the equation for puremethane density as a function of composition.

Additional data used in this study were pure liquidnitrogen densities from the International Critical

TABLE S-COEFFICIENTS FOR EQ. 16

TemperatureComponent j ‘?j ‘2j “ ’04 A3j “ ’06 R:;ge

CH,. 1 0.0329 -33.548 -5.8381 -175 to -162c2i6 2 0.4536 -11.080C3H8 3 0.5576 -9.200n-CbH1o 4 0,6135 -9.000

TABLE 9-COEFFICIENTS

Systern j ‘4j ‘5j

-.. -180 to -140--- -180to -140--- -140to -110

FOR EQ. 17

Temperature

‘6jR::ge

CHk-C2H6 2 0.34990 -0.50121 --- -175 to -160CH4-C3H8 3 O.5T31O 0.053997 -2.08083 -165 to -150CH4-N2 5 0.19856 1.14160 -3,06561 -175 to -160

TABLE 1O-DEVELOPMENT OF CORRELATIONExample T = - 175C, P -30 in, Hg, y, = L231,‘Y,== 1.804

CHk

0.94070.93570.93570.93570.9307

Mole Fraction GN2 C*H6 C3H8 n-CJilo lb/c; ft

0,0593 --- --- --” 0.5778 28.595~.~;j; 0.0048 --- ‘-- 0.5802 28.700

--- 0.0048 --- 0.5826 28.7610:0595 --- --- 0.0048 0.5849 28.8320.0596 0.0097 --- ‘-- 0.5827 28.805

. ● ✎ ● ✎ ✎ ✎

✎ ✎ ✎ ✎ ✎ ✎ ✎

✎ ✎ ✎ ✌ ✎ ✎ ✎

0.8707 0.0612 --- --- 0.0681 0.6775 31.702

Tables’z and excess specific volumes of methane-rz-butanemixtures from Shana’a.1°Eq. 18 was derivedfrom data of Shana’a.:

V@l:,= –6.0419x4/M . . . . . . (18)

Derivation of CorrelationAfter equations were established for computing ter-nary compositions, gas gravities, and liquid densities,a computer routine was developed to find LNG den-sity as a function of gas gravity at desired tempera-tures and pressures, To illustrate the routine, an ex-ample will be given for —175C and 30 in. Hg.

The P–x5 plot used for finding binary mixtureactivity coefficients for methane and nitrogen is shownin Fig, 1. At - 175C and pressures of 28 in. Hg and32 in. Hg, corresponding x, values are 0,0651 and0,0536, respectively. These pressure and compositionvalues, together with POl = 7.6 in. Hgll and P“b=198 in. Hg,’2 are substituted into Eq. 7. The resultingtwo equations are solved simultaneously to obtainyl = 1.231 and y. = 1.804.

The binary methane-nitrogen mixture at – 175Cand 30 in. Hg contains 0.9407 mole fraction methaneand 0.0593 mole fraction nitrogen, as shown in thefirst row of Table 10. Gas gravity and liquid densityfor the binary mixture are calculated from Eqs. 12and 17, respectively, and are entered in the last twocolumns of the table. To form the first ternary mix-ture, the methane mole fraction is arbitrarily reduced

OL I 1 1 ! t

o 0.02 0.04 0.06 0.08 0.10

MOLE FRACTION NITROGEN

IN LIQUID PHASE

Fig. 1—P vs X, methanemltrogen system.

JUNE, 1969 687

to 0.9357; and x, and x, are calculated from Eqs. 9and 10, respectively. Gas gravity and liquid densityfor the ternary mixture are calculated from Eqs. 12and 15, respectively, and are entered in the last twocolumns. The third component is changed successive-ly to propane and n-butane, and gas gravity andliquid density are computed for these mixtures, Thisprocedure is continued down and across the table toa methane mole fraction of 0.8707, using yl = 1.231and yo = 1.804 in all cases. By varying ternary com-position in this reamer, pressure is maintained at 30in. Hg, and gas gravities and liquid densities are ob-tained over the widest possible LNG range. Themethod of least squares is then applied to the last twocolumns of Table 10 to find an equation for LNGdensity, lb/cu ft, as a function of gas gravity at– 175C and 30 in. Hg; standard deviation is 0.083lb/cu ft :

pLKO= 10.840 -t 30.939G . . . . (19)*

A linear equation similar to Eq. 19 was derived foreach pressure and temperature covered by the cor-relation, LNG densities were computed from theseequations at gas gravity intervals of 0.005, beginningwith the gas gravity of the methane-nitrogen binary

●The constants in the type of Eq. 19 can be obtained from theauthom upon request,

densities are Iistd- in th= c&relafion of Tables 11through 16, from which LNG density can be foundby linear interpolation.

ConclusionsIn Tables 1 through 7, experimental liquid densitiesare compared with densities predicted by the gasgravity correlation, Tables 11 through 16, and withdensities calculated from the correlations of Harmensand of Lyckman, et al. The six gas gravity tables werelinearly extrapolated for data outside their tempera-ture and pressure ranges. Much of the data were takenat reduced temperatures less than 0.560. To applythe correlation of Lyckman, et al., for T, <0.560,the generalized functions v,(o), v~fl), and v,(z) wereplotted vs T, and extrapolated below T, = 0,560 toT, = 0,250. Extrapolated values of v,(~) were usedfor T, <0,560, and Eq. 4 was used for T, >0.560.

Liquid densities determined by the three correla-tions, p,,],, are compared with experimental densities,P.SXP,by computing percent deviations:

percent dev = [(PW – Peal .)/pcalcl(l00 percent)

. . . . . . . . (20)

Percent deviations for the correlations are given in

TABLE 11—LNG DENSITY,LB/CU IT, As A FUNCTION OF GAS GRAVITY ANDTEMPERATURE AT A PRESSURE OF 20 IN. Hg

GAS TEMPERATURE, DEGREES CENTIGRADEGRAVITY -175.0 -174.0 -173.0 -172.0 -171.0 -170.0 -169.0 -168.0 -167.0

0.550 -- -- -- --0.555 -- 27;;85 27:;01 27~i16 27~i22 %!)0.560 -- 27;;03 27% 5 27;;30 27.634 27.549 27.463 27.368 27.2810.565 28.213 28.055 27.965 27.879 27.783 27.696 27.610 27.514 27.4260.570 28.363 28.206 28.115 28.028 27,931 27.844 27.756 27.660 27.5710.575 28.513 28.357 28.265 28.177 28.080 27.992 27.903 27.806 27.7170.580 28.663 28.508 28.416 28.326 28.229 28.139 28.049 27.953 27.8620.585 28.813 28,660 28.566 28.475 28.377 28.287 28.196 28.099 28.0070.590 28.963 28.811 28.716 28.624 28.526 28.435 28.343 28.245 28.1520.595 29.113 28.962 28.866 28.773 28.675 28.582 28,489 28.391 28.2970.600 29.263 29.113 29.016 28.922 28.823 28.730 28.636 28.537 28.4430.605 29.413 29.265 29.166 29.071 28.972 28.878 28.783 28.684 28,5880.610 29.563 29.416 29.316 29.220 29.121 29.025 28.929 28.830 28,7330.615 29.713 29.567 29.466 29.370 29.269 29.173 29.076 28.976 28.8780.620 29.863 29.718 29.617 29,519 29.418 29.320 29.222 29.122 29.0230.625 30.013 29.870 29.767 29.668 29.567 29.468 29.369 29.268 29.1680.630 .30.163 30.021 29.917 29.817 29.716 29.616 29.516 29.415 29.3140.635 30.313 30.172 30.067 29.966 29.864 29.763 29.662 29.561 29.4590.640 30.463 30.323 30.217 30.115 30.013 29.911 29.809 29.707 29,6040.645 30.613 30.475 30.367 30.264 30.162 30.059 29.956 29.853 29.7490.650 30.763 30.626 30.517 30.413 30.310 30.206 30.102 30.000 29,894().655-30.913 30.777 30.667 30.562 30.459 30.354 30.249 30.146 30.0400.660 31.063 30.928 30.818 30.711 30.608 30.502 30.395 30.292 30,1850.665 31.213 31.080 30.968 30.860 30.756 30.649 30.542 30.438 30.3300.670 31.363 31.231 31.118 31.009 30.905 30.797 30.689 30.584 3004750.675 31.513 31.382 31.268 31.159 31.054 30,945 30.835 30.731 30,6200.680 31.663 31.533 31.418 31.308 31.203 31.092 30.982 30.877 30.7650.685 31.813 31.685 31.568 31.457 31.351 31.240 31.129 31.023 30.911-0.690 31.963 31.836 31.718 31.606 31.500 31.388 31.275 31.169 31.0560.695 32.113 31.987 31.868 31.755 31.649 31.535 31.422 31.315 31.2010.700 32.263 32.138 32.019 31.904 31.797 31.683 31.568 31.462 31.346

688 JOURNAL OF PETROLEUM TECHNOLOGY

b

Tables 1 through 7. The greatest deviations are shownin Table 7 and are for the five-component systems.In this table, the maximum deviation of the gas gravi-ty correlation from the data is +2.71 percent, Thecorrelations of Harmens and of Lyckman et a/. givemaximum deviations of +1.57 percent and +3.42

percent, respectively. On the basis of the expe$-mental results, Harmens’ correlation is the more ac-curate of the two procedures tested for calculatingLNG density from its composition.

The gas gravity-LNG density tables are accurateto approximately 3 perwmt for LNG mixtures con-

TABLE 12—LNG DENSITY, LB/CU F?, AS A FUNCTION OF GAS GRAVITY ANDTEMPERATURE AT A PRESSURE OF 25 IN. Hg

GAS TEMPERATURE, DEGREESCENTIGRADEGRAVITY -175.0 -174.0 -173.0 -172.0 -171.0 -170.0 -169.0 -168.o -167.0 -166.0 -165.0 -164.0

0.550 -- -- -- .- -. . .0.555 -- -- -- .:: --

-. -. .- . . Zci.ul

0.560 --27.238 27.139 27,051 26.988 26.866

-. 27~i63 27;i74 .27.385 27.287 27.198 27,132 27.0110.5 --~3 27.434 27.344 27.2770.570 28.410 28.241 28.144 28.054 27.952 27.862 27.772 27.681 27.581 27.490 27.421 27:3:!0.575 28.563 28.395 28.297 28.205 28.103 28.012 .27.921 27.829 27;~2; ;7.6;; 27.566 ;;.445

~0.585 28.858 28.702 28.602 28.508 28.405 28.312 28.218 28.124 28.024 27:930 27:855 27:7350.590 29.021 28.856 28.754 28.659 28.556 28.462 28.367 28.272 28.171 28.076 27.999 27.880

~0.600 29.327 29.163 29.059 28.962 28.859 28.762 28.665 28.368 28.466 28.369 28.289 28:170

.814 28.716 28.613 28.515 28:43; 28.315------- ------ ------ ------ ------ ------ ------0.605 29.480 29.317 29.212 29.113 29.010 28.912 28i0.610 29.632 29.470 29.365 29.265 29.161 29.062 28. . . .-0.615 29.785 29.624 29.517 29.416 29.312 29.212 29,111 29.011 28.908 28.808 28.722 28.606

670 29.568 29.463 29.362 29.260 29.159 2; .O;EI ;;.954 ;;.867 2~.;50~872 29.71

0.620 29.938 29.778 29.(0.625 30.091 29,931 29.L-- ------ ...... ------ ...___ ------ ______ ... .0.630 30.244 30.085 29.975 29.87o 29.765 29.652 29.558 29,455 29.350 29.247 29.156 29.0390.635 30.397 30.238 30.128 30.022 29.916 29.812 29.707”29,603 29.498 29.394 29.300 29.1840.640 30.549 30.392 30.280 30,173 30.067 29.962 29.856 29.750 29.6450.645 30.702 30.546 30.433 30.325 30.218 30.112 30.005 29.898 29.793 29:686 29:589 29:4740.650 30,855 30.699 30.585 30.476 30.369 30.262 30.153 30.046 29.940 2;.833 29.734 29,6190.655 31.008 30.853 30.738 30.627 30.520 30.412 30.302 30.194 30.087 “0.665 31.314 31.160 31.043 30.930 30.822 30.711 30.600 30.490 30.382 30.272 30.167 30.0540.6~ “10.675 31.619 31.468 31.348 31.233 31.124 31.011 30.898 30,785 30.677 30.565 30:457 30:3!30.680 31.772 31.621 31.501 31.384 31.275 31.161 31.047 30.933 30.824 30.711 30.601 30.4880.685~0.690 32.078 31.928 31.806 31.687 31.577 31.461 31.344 31.229 31.119 31.004 30.890 30:7780.695 32.231 32.082 31.958 31.838 3’.;28 31.6TI 31.493 31.376 31.267 31.150 31.035 30.9230.700 32.383 32.236 32.111 31.99~J 879~

TABLE 13-LNG DENSITY, LB/CU IT, AS A FUNCTION OF GAS GRAVITY ANDTEMPERATURE AT A PRESSURE OF 30 IN. Hg

GAS TEMPERATURE, DEGREESCENTIGRADEGRAVITY -175.0 -174.0 -173.0 -172.0 -171.0 -170.0 -169.0 -168.0 -167.0 -166,0 -165.0 -164.0 -163.0 -162.0

0.550 -- -- -- -- -- -- -- -- -- --0.555 -- -- -- -- -- --0.560 -- -- -- --

26:;87 26;;76 26~;77 i:$$.. 27~~88 27;i97 27:;06 27:~04 27.134 27.022 26.923 26.832

0.565 -- 27;;26 27.733 27.639 27.547 27.455 27.353 27.28D 27.169 27.069 26.9770.570 -- 28;;74 28:i72 28;;75 27.979 27.885 27.791 27.697 27.604 27.502 27.427 27.315 27,216 27.1220.575 28.630 28.431 28.328 28.229 28.132 28.037 27.942 27.847 27.763 27.650 27.574 27:46; ;7.;61 27.2670.580 28.785 28.588 28.484 28.384 28.86 8. 8~0.585 28.939 28.745 28.64D 28.538 28.439 28.341 28.244 28.147 28.051 27.947 27:867 27.754 27:653 27:5570.59~ ;9.094 ;8.;~3 &;5 28.693 28.592 j~.493 28.395 2;.2J7 ;~020~ 28.096 2$0~4 2;.;01 27.79; 27.702

0:600 29:403 29:217 29:107 2g:gO: 2g:899 28:798 28:i97 28:597 28:497 28:3$3 28:308 28:194 28:091 27:;$O:jO; 29.558 29.374 ;9.263 29.157 29.052 28.950 2;.;;; 2~.;;7 28.646 28.641 28.454 28.340 2;.2~7 &36

~0.616 29:868 ;9:688 29:575 ;$:66 2;:3!!!;;:2g4 29:150 29:047 28.944 28.838 28.748 2~:6!3 28:528 28:4260.620 ~0.022 29,845 29.731 29,620 29.512 29.406 29.301 29.197 29.093 28.987 28.895 28:;7; 2~:~74 ;!0571006 30.02 29.885 29.76 9.666 29.65~0.630 30:332 30.159 30.042 29.929 29.819 29.711 29,604 29.497 29.391 29.284 29.188 29.072 28.966 28:861

.128 30.084 29.972 29.863 29.755 29.647 29.540 29.433 29.335 2;.#9 2~JN; 29:0~6263. !49.~

057 29.9A7 29.837 29.730 29.628 29:512 29:404 29.295

----- . ----- ----- . . .0.635 30.486 30.316 30,0.640 -------------- ------ -.0.645 30:;96 30:63; 3bi0 30.393 30.279 30.167 30.L-. -..-.. ------ ------ ------ ------

).097 29.986 29.878 ;9.775 29.658 29:550 29.440).247 30.135 30.027 9.922 29.~

“ )51 29:842 29.730

0:6~0 30.9~0 30.787 30:~66 30.5~8 30.4WJ 3~.3;9 3~.~8 ;0

00660 31:260 31:102 30.977 30:857 30:739 30:624 30:510 30.397 30.284 30.175 30.069 29.9~4 30,215 30.097 29.988 29.875

n~fim ;l~7!% ?1 ~1573 % ~b~; i ~371 31 ~lQ~ i :080 3(1:~63 30:&4~ 38:731 30:621 30:509 30:390 30:279 30:165~.6~ 31:8:9 31:7J0 31:6~1 31”:;7;;1.352 31:2;2 31●1;4 30.997 30.880 3~.77~ 30 30:5~7 3o0425 30:;~o

0:690 32.186 32.044 31.912 31.784 31:659 31.537 3,”;17 31:297 31:178 31:067 30 9 30.830 30:717 30.6000.695 32.343 32.201 32.068 31.939 31.812 31.689 31,568 31.447 31.327 31.215 31.096 30.976 30.863 30.7450.700 32.497 32.358 32.224 32.093 31.966 31.841 31.719 31.597 31.475 31.364 31.243 31.122 31.009 30.889

n mu 1 arm 689

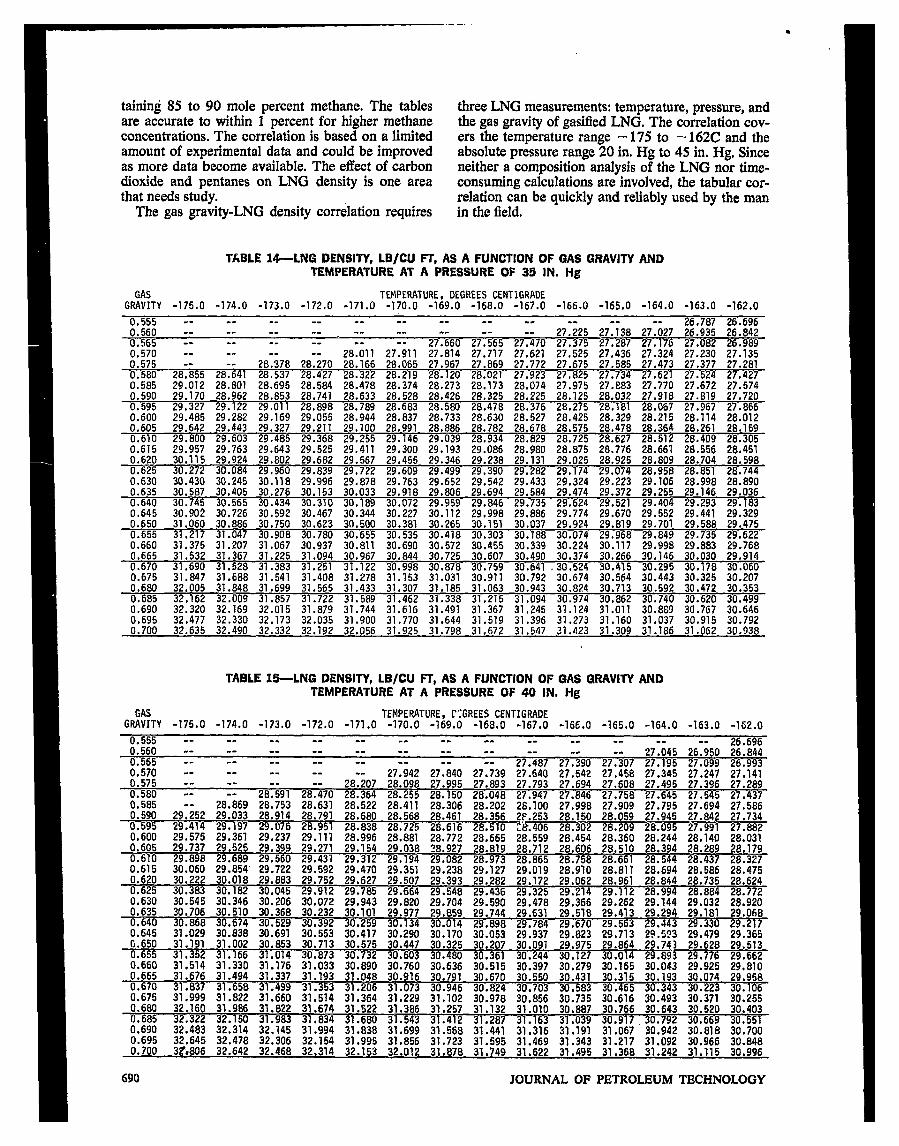
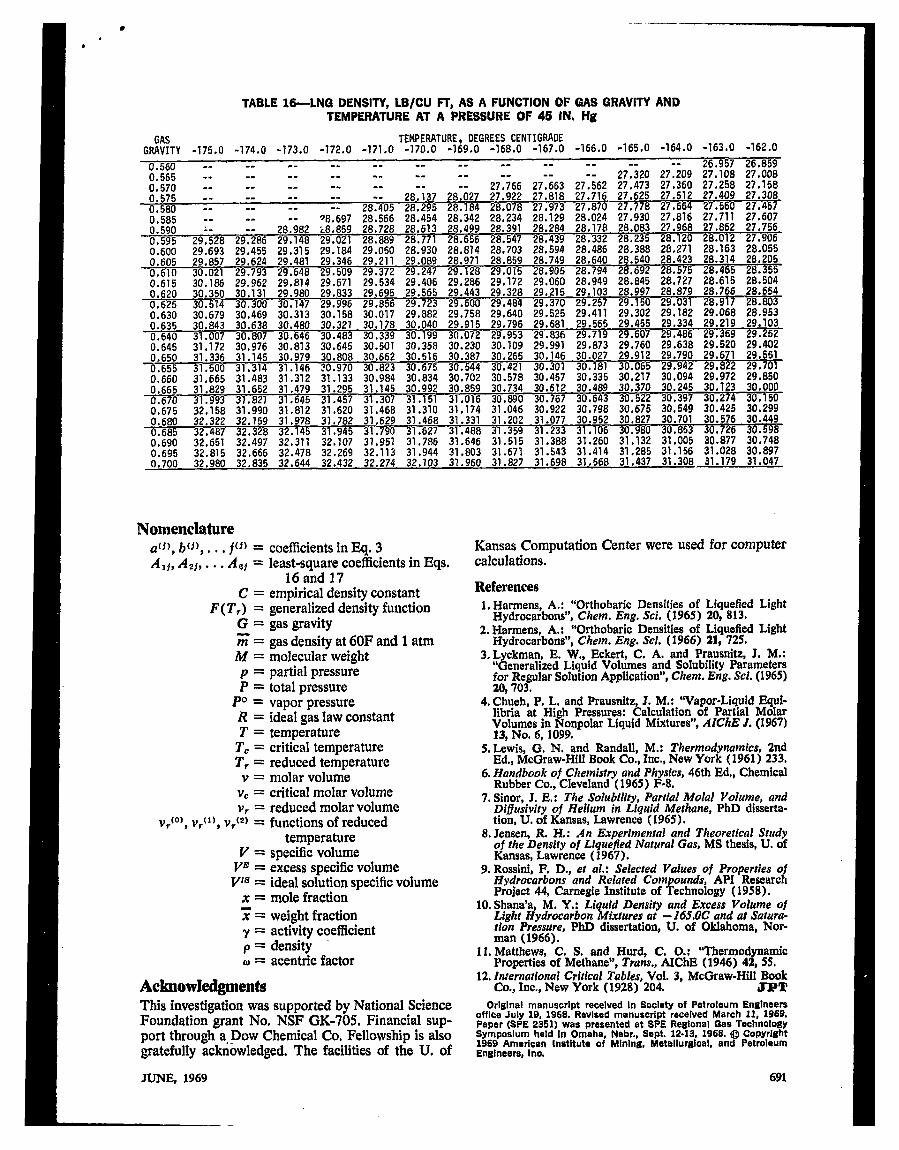
tainkqj 85 to 90 mole percent methane. The tablesare accurate to within 1 percent for higher methaneconcentrations. The correlation is based on a limitedamount of experimental data and could be improvedas more data become available. The effect of carbondioxide and pentanes on LNG density is one areathat needs study.

The gas gravity-LNG density correlation requires

three LNG measurements: temperature, pressure, andthe gas gravity of gasified LNG. The correlation cov-ers the temperature range – 175 to – 162C and theabsolute pressure range 20 in. Hg to 45 in. Hg. Sinceneither a composition analysis of the LNG nor time-consuming calculations are involved, the tabular cor-relation can be quickly and reliably used by the manin the field.

TABLE 14-LNG DENSITV, LB/CU FT, AS A FUNCTION OF GAS GRAVITV ANDTEMPERATURE AT A PRESSURE OF 35 IN. Hg

GAS TEMPERATURE, DEGREES CENTIGRADEGRAVITY -175.0 -174.0 -173.0 -172.0 -171.0 -170.0 -169.0 -168.0 -167.0 -166.0 -165,0 -164.0 -163.0 -162.0

0,555 -- -- -- -- -- -- -- -- -- 26.787 26.6960.560 -- -- -- -- . -- -- ‘- 27:;25 27:;38 27:;27 26,935 26.8420,565 -- -- -- -- -- -- 2?.660 27;~65 27:;70 27.3750.570 -- -- --

27.287 27.176 27.082 26.98928.011 27.911 27.814 27.717 27,621 27.525 27,436 27.324 27.230 27.135

0.575 -- 28.378 28:;70 28.166 28.065 27,967 27.869 27.772 27.675 27.585 27.473 27.377 27,2810.580 28.855 28:;41 28,537 28.427 28.322 28.219 28.120 28.021 27.923 27.825 27.734 27,621 27.5240.585

27,42729.012 28.801 28.695 28.584 28.478 28.374 28.273 28,173 28.074 27,975 27.E83 27.770 27.672 27.574

0.590 29.170 28.962 28.853 28,741 28.633 28.528 28,426 28.325 28.225 28,125 28.032 27.918 27.819 27.720~ 8.067 2 .967 27.8660.600 29.485 29.282 29.169 29.055 28.944 28.837 28.733 28.630 28.527 28,425 28.329 28.215 28.114 28.0120.605 29.642 29.443 29.327 29.211 29.100 28.991 28.886 28.782 28.678 28.575 28.478 28.364 28.261 28.159

~0.615 29.957 29.763 29.643 29.525 29.411 29.300 29.193 29.086 28.980 28.875 28.776 28.661 28.556 28.4510.620 30.115 29.924 29.802 29.682 29.567 29,455 29.346 29.238 29,131 29,025 28.925 28.809 28.704 28.5980.625 30,272 30.084 29.960 29,839 29,722 29.609 29.499 29.390 29.282 29,174 29.074 28.958 28.851 28.7440.630 30.430 30,245 30.118 29.996 29.878 29.763 29.652 29.542 29,433 29.324 29.223 29.106 28.998 28.8900.635 30.587 30,405 30.276 30.153 30.033 29.918 29,806 29.694 29.584 29.474 29.372 29.265 29.146 29.0360.640 30.745 30.565 30.434 30.310 30.189 30.072 29.959 29.846 29.735 29.624 29.521 29.404 29.293 29.1830.645 30.902 30.726 30s592 30.467 30.344 30.227 30.112 29,998 29.886 29.774 29.670 29.552 29.441 29.3290.650 31.060 30.886 30.750 30.623 30.500 30.381 30.265 30,151 30,037 29.924 29.819 29.701 29.588 29.4750.655 31,217 31.047 30.908 30.780 30,655 30.535 30.418 30.303 30.188 30,074 29.968 29.849 29.735 29.6220.660 31.375 31.207 31,067 30.937 30.811 30.690 30.572 30.455 30,339 30,224 30.117 29,998 29.883 29.7680.665 31,532 31.367 31.225 31,094 30.967 30.844 30.725 30.607 30.490 30.374 30.266 30.146 30.030 29.9140.670 31.690 31.528 31.383 31.251 31.122 30.998 30.878 30.759 30.641 .30,524 30.415 30.295 30.178 30.0600.675 31.S47 31.688 31.541 31.408 31,278 31,153 31.031 30.911 30.792 30,674 30.564 30.443 30.325 30.2070.680 32.005 31.848 31.699 31.565 31.433 31.307 31.185 31.063 30.943 30.824 30.713 30.592 30.472 30.3530.685 32,162 32.009 31.857 31.722 31.589 31.462 31.338 31.215 31.094 30.974 30,862 30.740 30.620 30,4990.690 32,320 32.169 32.015 31.879 31.744 31.616 31.491 31.367 31.245 31.124 31.011 30.889 30.767 30.6460,695 32.477 32.330 32.173 32.035 31.900 31.770 31.644 31.519 31.396 31,273 31.160 31.037 30,915 30.7920.700 32.635 32.490 32.332 32,192 32,056 31.925 31.798 31.672 31.547 31,423 31.309 31.186 31.062 30.938

TABLE 15—LNG DENSITV, LB/CU IT, AS A FUNCTION OF GAS GRAVITY ANDTEMPERATURE AT A PRESSURE OF 40 IN. Hg

GAS TEMPERATURE, C:GREES CENTIGRADEGRAVITY -175.0 -174.0 -173.0 -172.0 -171.0 -170.0 -169.0 -168.0 -167.0 -166.0 -165.0 -164.0 -163.0 -1S2.0

0.555 -- -- -- -- -- -- -- -- -- -- --0.560 -- -- -- -- -- -- -- --0.565 -- -- -- -- --

27~;45 26:;50 ;~:g;!

0.570 -- -- -- --27~;87 27:;90 27~;07 270195 27.099 26.993

27;;42 27:~40 27;;39 27.640 27.542 27.458 27.345 27.247 27.1410.575 -- -- 28:;07 28.098 27.995 27.893 27.793 27,694 27.608 27.495 27.396 27.2890.580 -- -- 28t;91 28:;70 28.364 28.255 28.150 28,048 27.947 27.846 27.758 27.645 27.545 27.4370.585 -- 28.869 28.753 28.631 28.522 28.411 28.306 28,202 28,100 27.998 27.909 27.795 27.694 27.5S60.590 29.252 29.033 28.914 28.791 28.680 28.568 28,461 28,356 2P.253 28,150 28,059 27.945 2784 27734

+0.595 29.414 29.197 29.076 28.951 28.838 28,725 28.616 28.510 2&406 28.302 28.209 2S.095 27.990,600 29.575 29.361 29.237 29.111 28.996 28.881 28,772 28,665 28.559 28.454 28.360 28.244 28.140 28.0310,605 29.737 29.525 29.399 29,271 29.154 29.038 28.927 28,819 28,712 28.606 28.510 28.394 28.289 28.179

~0.615 30.060 29.854” 29.722 29.592 29.470 29,351 29,238 29.127 29.019 28.910 28.811 28.694 28.586 28.4750.620 30.222 30.018 29.883 29.752 29.627 29,507 29,393 29,282 29.172 29,062 28,961 28,844 28.735 28.6240,625 30.383 30,182 30.045 29.912 29.785 29.664 29.548 29.436 29.325 29.214 29.112 28.994 28.884 28.7720.630 30.645 30.346 30.206 30.072 29.943 29,820 29.704 29,590 29.478 29.366 29.262 29.144 29.032 28.9200,635 30,706 30.510 30.368 30.232 30.101 29.977 29,859 29.744 29.631 29,518 29.413 29.294 29.181 29.068

~ 29.2170.645 31.029 30.838 30.691 30.553 30.417 30.290 30.170 30.053 29.937 29.823 29,713 29.5?3 29.479 29.365G.650 31.191 31.002 30.853 30.713 30.575 30.447 30.325 30.207 30.091 29.975 29.864 29.743 29.628 29.5130.655 1.352 31.166 31.014 30,873 30.732 30.603 30.480 30.361 30.244 30.127 30.014 29.8~3 29.776 29.6620.660 31,514 31,330 31.176 31.033 30.890 30.760 30.636 30.515 30.397 30.279 30.165 30.043 29.925 29.8100.665 31.676 31.494 31.337 31.193 31.048 30.916 30.791 30.670 30.550 30.431 30.315 30.19; 3~.O;$ ;~.95~0.670 31.837 31.658 31.499 31.353 31.206 31.073 30.946 30.824 30.703 30.583 30.4650.675 31.999 31.822 31.660 31.514 31.364 31.229 31.102 30.978 30.856 30.735 30.616 30:493 30:371 30:2550.680 32.160 31.9S6 31.822 31,674 31.522 31.386 31.257 31.132 31.010 30.887 30.766 30.643 30.520 30.4030.685 .322 32. 5 3 .98 3 .834 .680 3 .543~“ 0,792 30.669 30.550.690 32.483 32.314 32.145 31.994 31.838 31.699 31.568 31.441 31.316 31●191 31.067 30.942 30.818 30.7000.695 32.645 32.478 32.306 32.154 31.995 31.856 31.723 31.595 31.469 31.343 31.217 31.092 30.966 30.8480.700 32’,806 32.642 32.468 32,314 32.153 32.012 31.878 31.749 31.622 31.495 31.368 31.242 31.115 30.996

690 JOURNAL OF PETROLEUM TECHNOLOGY

TABLE 16-LNCi DENSITY, LB/CU IT, AS A FUNCTION OF GAS GRAVITY ANDTEMPERATUREAT A PRESSURE OF 45 IN. Hg

GAS TEMPERATURE, DEGREES CENTIGRADEGRAVITY -175.0 -174.0 -173.0 -172.0 -171.0 -170.0 -169.0 -16S.0 -167.0 -166.0 -165.0 -164.0 -163.0 -162.0

0.560 -- -- -- -- ‘- ‘- ‘- ‘- ‘- ‘- 26,957 26.8590.565 -- -- -- -- ‘- ‘- ‘- 27:;20 27:;09 27.108 27.0080,570 -- -- -- -- -- 27:;66 27;~63 27:;62 27.473 27.360 27.258 27.1680.575 -- -- -- -“ -- 28;i37 28;;27 27.922 27.818 27.716 27,625 27.512 ;7.~~9 ;;.3;;0,580 -- -- -- 28.405 28.295 28.184 28.078 27,973 27.870 27.778 27.664:,::: -- -- -- ~8~;97 28.566 28.454 28,342 28.234 28.129 28.024 27.930 27.816 27:711 27:607

:. .. 28.982 L8.859 28.728 28.613 28.499 28.391 28.284 28.178 28.083 27.968 27.862 27.7560:595 29,528 29,286 29,148 29.021 28.889 28.771 28.656 28.547 28.439 28.332 28,235 28.120 28.012 27.9060.600 29,693 29.455 29.315 29.184 29.050 28.930 28.814 28.703 28,594 28,486 28.388 28,271 28.163 28.0550.605 29.857 29.624 29.481 29.346 29.211 29.089 28.971 28.859 28.749 28.640 28.540 28.423 28.314 28.2050.610 30.021 29.793 29.648 29.509 29.372 29.247 29.128 29.015 28.905 28.794 28,692 28,575 28.465 28.3550.615 30.186 29.962 29.814 29.671 29.534 29.406 29.286 29.172 29.060 28.949 28.845 28,727 28.615 28.5040.620 30.350 30.131 29,980 29.833 29.695 29.565 29.443 29.328 29,215 29.103 28.997 28,879 ;~,;66 28.6540,625 30.514 30.300 30,147 29.996 29.856 29.723 29.600 29.484 29.370 29.257 29.150 29.0310.630 30.679 30,469 30.313 30.158 30,017 29.882 29.758 29.640 29.525 29.411 29.302 29.182 29:068 ;~:~~;0.635 30.843 30.638 30.480 30.321 30.178 30,040 29.915 29.796 29.681 29.565 29.455 29.334 29.219 29.1030.640 31.007 30.807 30,646 30.483 30.339 30.199 30.072 29.953 29.836 29.719 29.607 29.486 29.369 29.2520.645 31,172 30,976 30,813 30.645 30.501 30.358 30.230 30.109 29.991 29.873 29.760 29.638 29.520 29.4020.650 31.336 31,145 30.979 30,808 30,662 30.516 30.387 30,265 30.146 30.027 29.912 29.790 29.671 ;;.;~l0.655 31.500 31.314 31.146 ?0.970 30.823 30.675 30.544 30.421 30.301 30.181 30,065 29.942 29.8220.660 31.665 31.483 31.312 31.133 30,984 30.834 30.702 30.578 30.457 30.335 30.217 30,094 29.972 29:8500,665 31.829 31.652 31.479 31.295 31.145 30.992 30.859 30.734 30.612 30.489 30.370 30.245 30.123 30.0000,670 31.993 31.821 31.645 31.457 31.307 31.151 310016 30.89~ 30.1500.675 32.158 31.990 31.812 31.620 31.468 31.310 31.174 31.046 30.922 30s798 30.675 30.549 30.425 30.2990.680 32.322 32.159 31.978 31.782 31,629 31,468 31.331 31.202 31.077 30.952 30.827 30:7~1 30.57~ 30.4490.685 32.487 32.328 32.145 31.945 31.790 31.627 31.488 31.359 31.233 31.106 30.9800,690 32.651 32,497 32.311 32s107 31.951 31.786 31,646 31.515 31.388 31.260 31.132 31.005 30:877 30:74~0.695 32,815 32.666 32,478 32.269 32.113 31.944 31.803 31.671 31.543 31.414 31.285 31.156 31.028 30.8970.700 32.980 32.835 32.644 32.432 32,274 32,103 31.960 31.827 31.698 31.568 31.437 31.308 31.179 31.047

coefficientsin Eq. 3least-square coefficientsin Eqs.

16and 17empirical density constantgenerali=d density functiongas gravitygas density at 60F and 1 atmmolecular weightpartial pressuretotal pressurevapor pressureideal gas law constanttemperaturecritical temperaturereduced temperaturemolar volumecritical molar volumereduced molar volumefunctions of reduced

temperatures~ecificvolume

VE = eicess specificvolume‘ps = ideal solution speeificvolume

x = mole fractionY= weight fractionY= activity coefficientP = density01= acentric factor

AcknowkdgmentsThis investigation was supported by National ScienceFoundation grant No. NSF GK-705. Financial sup-port through a.-DowChemical Co. Fellowship is alsogratefully acknowledged. The facilities of the U. of

JUNE, 1969

Kansas Computation Center were used for computercalculations.

References1.Harmens, A.: “Orthobaric Densities of Liquefied Light

Hydrocarbons”, Chem. Em?.Sci. (1965) 20, 813*2.H&mens, A.: “Orthobari~ Densities of Liquefied Light

Hydrocarbons”, Chem. Errg. SCL (1966) 21, 725.3. Lyckman, E. W., Eckert, C. A. and Prausnitz, J. M.:

Generalized Liquid Volumes and Solubility Parametersfor Regular Solution Application”, Chem. Eng. Sci. (1965)20,703.

4, Chueh, P. L, and Prausnitz, 1. M.: “Vapor-Liquid Equi-libria at High Pressures: Calculation of Partial MolarVolumes in Nonpolar Liquid Mixtures”, AKhE J. (1%7)13, No. 6, 1099.

5. Lewis, G, N, and Randall, M.: Thermod namics, 2nd1’Ed.. McGraw-HilIBook Co., Inc.. New Yor (1961) 233,

6, li?u~dbo~koj Chemistry anti PhyNcs, 46th Ed,, Ch~micalRubber Co., Cleveland (1965) F-8.

7. Sinor, J. E.: The Sohib~lity, Part!al Molat Volume, andDiffusivity of Helium in Liquid Methane, PhD disserta-tion, U, of Kansas, Lawrence (1965).

8. Jeneen, R. H.: An Experimerftal and Theoretical Studyof the Density of Liquefied Natural Gas, MS thesis, U. ofKansas, Lawrence (1967).

9. Rossini, F. D., et al.: Selected Values of Properties oHydrocarbons and Related Compounds, API Resmrc1Project 44, Carnegie Institute of Technology (1958).

10.Shana’a, M. Y.: Liquid Density and Excess Volume ofLight Hydrocarbon Mixtures at - 16S.OC and at Satura-tion Pressure, PhD dissertation, U. of Oklahoma, Nor-man (1966).

11, Matthews, C. S. and Hurd, C. O.: “Thermod amicrProperties of Methane”, Trans., AIChE (1946) 4, 55.

12, International Critical Tables, VOI.3, McGraw-Hill BookCo., Inc., New York (1928) 204. JPT

Orlglnal manuscript received In Society of Petroleum Englneeraoffice July 19, 196S. Revised manuscript received March U, 1969,Paper (SPE 2351) was presented at SPE Regional Gas TechnologySymposium held irr Omaha, Nebr., Sept. 12.13, 196S. @ Copyright1969 American Institute of Mlnlng, Matallurgloal, and PetroleumEngineers, Inc.

691


Recommended