/0 I:;'f.4 tf .:2;1tCIVIL ENGINEERING STUDIES . 2 .. STRUCTURAL RESEARCH SERIES NO. 224 LOAD - DEFORMATION CHARACTERISTICS OF CONCRETE PRISMS :1- •• WITH RECTILINEAR TRANSVERSE REINFORCEMENT by TADEUSZ SZULCZYNSKI and M. A. SOZEN SEPTEMBER 1961 UNIVERSITY OF ILLINOIS URBANA, ILLINOIS
Transcript
/0 I:;'f.4
tf .:2;1tCIVIL ENGINEERING STUDIES ~ . 2 .. STRUCTURAL RESEARCH SERIES NO. 224
LOAD -DEFORMATION CHARACTERISTICS OF CONCRETE PRISMS
:1- ••
WITH RECTILINEAR TRANSVERSE REINFORCEMENT
by
TADEUSZ SZULCZYNSKI
and
M. A. SOZEN
SEPTEMBER 1961
UNIVERSITY OF ILLINOIS
URBANA, ILLINOIS
LOAD-DEFORMATION CHARACTERISTICS OF CONCRETE PRISMS
WITH RECTILINEAR TRANSVERSE REINFORCEMENT
by
Tadeusz Szulczynski
and
M. A. Sozen
September 1961 University of Illinois
Urbana) Illinois
TABLE OF CONTENTS
1. INTRODUCTION
1.1 Introductory Remarks 1~2 Object and Scope 1.3 Outline of Tests 1&4 Designation of the Test Specimens 1.5 Acknowledgments
2. MATERIAIS AND FABRICATION
2.1 Concrete 2.2 Reinforcement 2.3 Fabrication of the Test Specimens
3 . INSTRUMENTATION AND TEST SETUP
3.1 Instrumentation 3.2 Test Setu:p 3.3 Test Procedure
4 0 BEHAVIOR OF THE TEST SPECIMENS
4.1 Discussion of Deformation Measurements 4~2 Relationship Between Load and Longitudinal Strain 403 Transverse Strains and Lateral Deflection of the Ties
5. EFFECT OF TRANSVERSE REINFORCEMENT ON THE STRENGTH OF THE TEST SPECIMENS
6. SUMMARY
601 Object 6 .. 2 Scope 6.3 Test Results
LIST OF REFERENCES
TABLES
FIGURES
1
1 7 8 8 9
10
10 11 11
14
14 16 17
19
19 24 27
30
36
36 36 36
39
40
LIST OF FIGURES
1. Com~arison of Initial Modulus of Deformation with Cylinder Strength
2. Stress-Strain Curves for the Reinforcement
3. Instrumentation for the Specimens with 5-in. Square Cross Sections
40 Instrumentation for the S~ecimens with 5 by lO-in. Cross Sections.
prisms and cylinders which were reinforced both longitudinally and trans-
versely. These tests offered a direct comparison between the effects of
rectilinear and circular transverse reinforcemento The approximate ranges
of variation were 3000 to 5500 psi for the cube strength of the concrete
~Dd 1 to 4 percent for the volumetric ratio of the transverse reinforcemento
The dimensions of the test specimens were 6 by 6 by 1105, 6-ino round by
12.' and 6 by 3.625 by 52 in ..
Chan related the increase in strength of the concrete to the
volumetric ratio of the transverse reinforcement using the following
expressions.
where K u
For' circular binding,
K -K = ~ u 0 \1°00375
For rectangular binding,
K = 0
Pb =
contribution
strength of
strength.
K - K u 0
of the transverse reinforcement to the unit
the concrete expressed as a ratio of the cube
volumetric ratio of the transverse reinforcemento
6
In the interpretation of the test results the effects of the
longitudinal reinforcement, the strength and spacing of the transverse
reinforcement, and the cross-sectional shape of the prisms were ignored.
Equations l.5 and 1.6 make possible a quantitative comparison between the
effects of rectilinear and circular reinforcement. The comparison of the
denominators on the right-hand sides of Eqs. 1.5 and 1.6 indicates that,
in these tests, the rectangular binding was only about half as effective
as the circular binding for the same transverse reinforcement ratioo This
quantitative relationship is the same as that observed by Considere.
Chan also derived expressions for the ultimate strain observed
in the tests.
For circular binding,
€ - € = U 0
For rectangular binding,
€ - € = U 0
where € - E U 0
increase in ultimate strain made possible by the lateral
reinforcement 0
Equations 1.7 and 108 indicate that the effectiveness of the
rectangular binding compared with that of the circular binding was about
70 percent in reference to strain. Chan reported values ranging from
00015 to 0.025 for circular binding and from 0.012 to 00018 for rectangular
binding.
The tests at Munich were undertaken primarily to investigate the
effect of stirrups in ordinary amounts on the resistance of concrete in
the compression zone of reinforced concrete beams. The test specimens
were eccentrically loaded prisms reinforced transversely (rectilinear
stirrups). The series included specimens with and without longitudinal
reinforcement. In general, the tests indicated that stirrups caused an
increase of concrete strength and ultimate deformation. The addition of
longitudinal reinforcement improved the effects of the transverse rein
forcement.
On the basis of the available information, it appears that
considerable improvements in the ductility of concrete can be effected
7
wi th the use of rectilinear transverse reinforcement • Although the
strength may not be improved as much as in the case of circular 'transverse
reinforcement, the practical reasons for using rectilinear reinforcement
may offset this disadvantage.
1.2 Object and Scope
The object of this report is to describe the results of an
exploratory series of tests to study the load-deformation characteristics
of concrete confined by rectilinear transverse reinforcement.
The test specimens were concrete prisms which measured 25 ino in
length and either 5 by 5 or 5 by 10 in. 'in cross section. All tests were
carried out under axial compression. The spacing of the transverse rein
forcement was held constant at 2 in. The primary variables were: (1)
the amount of transverse reinforcement, (2) the concrete strength, and
(3) the shape of the cross section.
8
1.3 Outline of Tests
A total of 30 specimens were cast and tested in 10 sets of 3.
Each set of 3 specimens comprised a prism with no reinforcement, a prism
with No.2 ties spaced 2 in., and a prism with No.3 ties spaced at 2 in.
As indicated in the previous section, all specimens ~e subjected to
axial loading and had the same length, 25 in.
The distribution of the sets according to the two major variables,
the cross section and the concrete strength, is summarized in the following
table.
Nominal Concrete Strength Cross Section 5 by 5 in. 5 by 10 in.
3000 psi 3 3
5000 psi 2 2
1.4 Designation of the Test Specimens
Each test specimen is deSignated by four numerals such as 11230
The first numeral indicates the nominal concrete strength, the second numeral
the cross-sectional dimenSions, and the third numeral the amount of transverse
reinforcement. The fourth numeral is used to distinguish the specimens for
which the first three variables were the same.
The curve for the first three numerals in the deSignation is as
follows~
The first numeral, 1123
1 ..... Nominal concrete strength = 3000 psi
2 ..... Nominal concrete strength = 5000 psi
The second numeral, 1!23
1 ..... 5 by 5-in. cross section
2 ..•.. 5 by 10-in. cross section
The third numeral, 11g3
0 ..•.. No transverse reinforcement
2 ..•.. No.2 ties at 2 in.
3 ..•.. No.3 ties at 2 in.
1.5 Acknowledgments
9
This work was carried out in the Structural Research Laboratory
of the Civil Engineering Department at the University of Illinois while
Dr. T. Szulczynski was on leave of absence from the University of Gdansk,
Gdansk, Poland, and held a post-doctoral fellowship granted by the University
of Illinois.
10
2. MATERIALS AND FABRICATION
2.1 Concrete
(a) Cement. Marquette brand type III portland cement was used in
manufacturing the specimens.
(b) Aggregates. WabG.sh River sand and gravel were used in all the
specimens. Since the 2-in. spacing of the transverse reinforcement left
rather small openings on the side of the horizontal form, especially in the
specimens reinforced with No.3 bars, it was necessary to use an aggregate
wi th 3/8-in. maximum size. This aggregate has a smooth rounded surface and
results in a ratio of concrete tensile to compressive strength less than that
for concretes made with ordinary angular aggregate. The origin of both the
sand and the gravel is an outwash of the Wisconsin glaciation. Their absorp-
tion was about 1 percent by weight of surface-dry aggregate.
(c) Concrete Mix. Mixes were designed by the trial batch method.
The mix proportions for the various sets of specimens are given in Table 1
which also lists the measured slumps, the compressive strength of the concrete
i~dicated by 6 by 12-in. cylinders, and the tensile strength of the concrete
measured by splitting tests on 6 by 6-in. cylinders 0
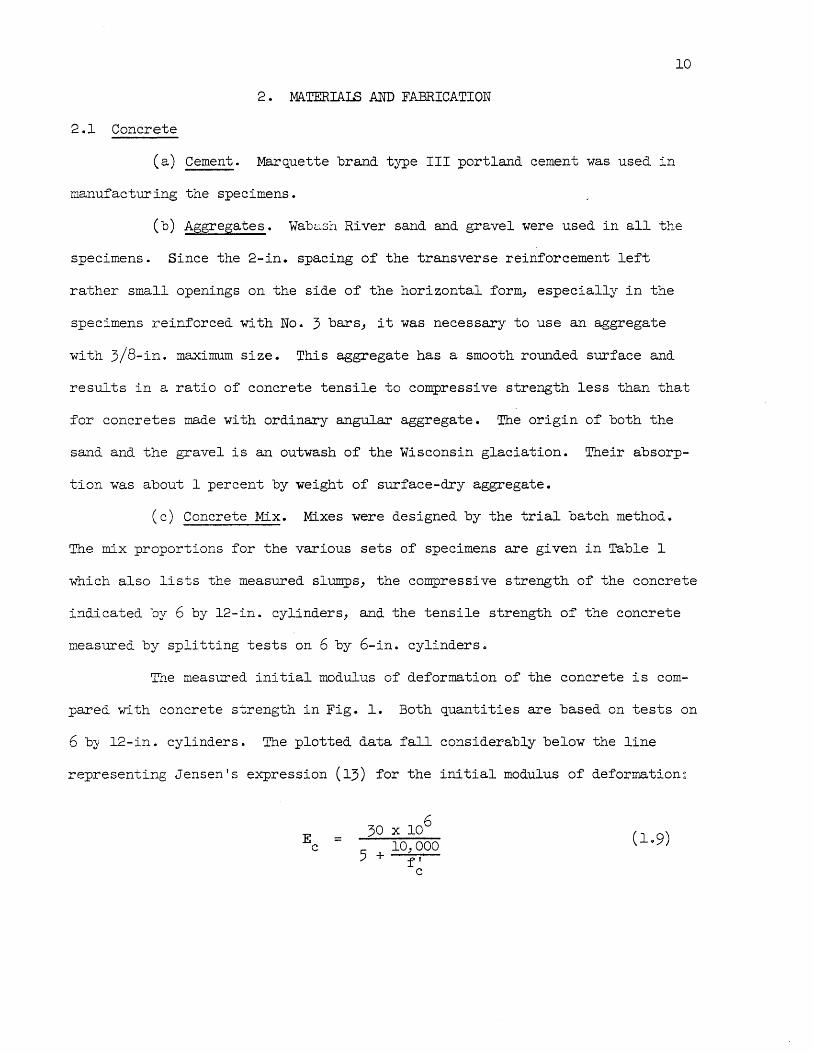
The measured initial modulus of deformation of the concrete is com-
pared with concrete strength in Fig. 1. Both quantities are based on tests on
6 by l2-in. cylinders. The plotted data fall considerably below the line
representing Jensen's expression (13) for the initial modulus of deformation~
E = c
30 x 106
5 10,000
+ ff C
11
where the modulus of deformation} E } and the cylinder strength} f', are c c
in psi. The test data are represented better by the broken line in the
figure described by a modified form of Equation 1.9, with 7 being used
rather than 5 ::_:::-l tb.e denominator. The discrepancy between the plot of
Jensen's expression and the data is a result of the properties'of the
aggregate.
2.2 Reinforcement
Only transverse reinforcement ~s used in the specimens. The
transverse reinforcement consisted of No.2 and No.3 ties at a longitudinal
center-to-center spacing of 2 in. At each end of the specimen, three ties
were placed at a spacing of 1 in. in order to reduce the effect of stress
concentrations at the ends.
The No.2 bars were plain while the No.3 bars were deformed.
The external dimensions of the cold-bent ties were 5 by 5 or 5 by 10 in.
The closed tie was formed by lapping a bar at one face for about 2 in. and
welding along the length of the lap.
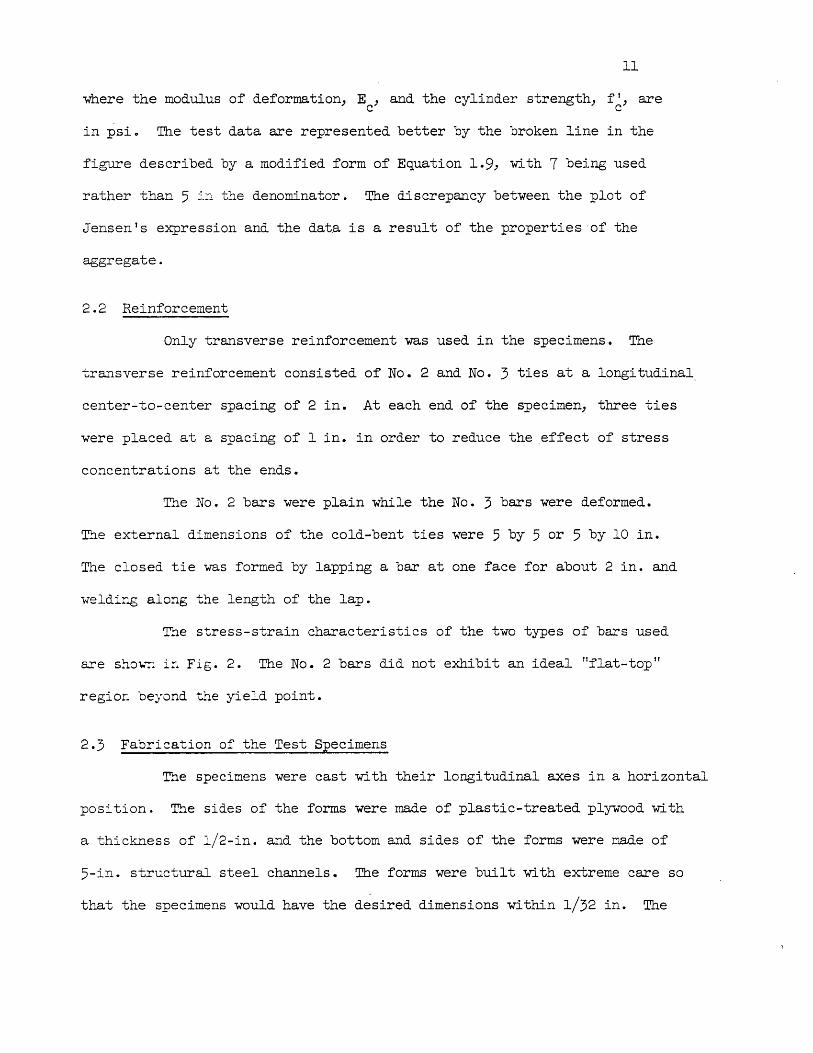
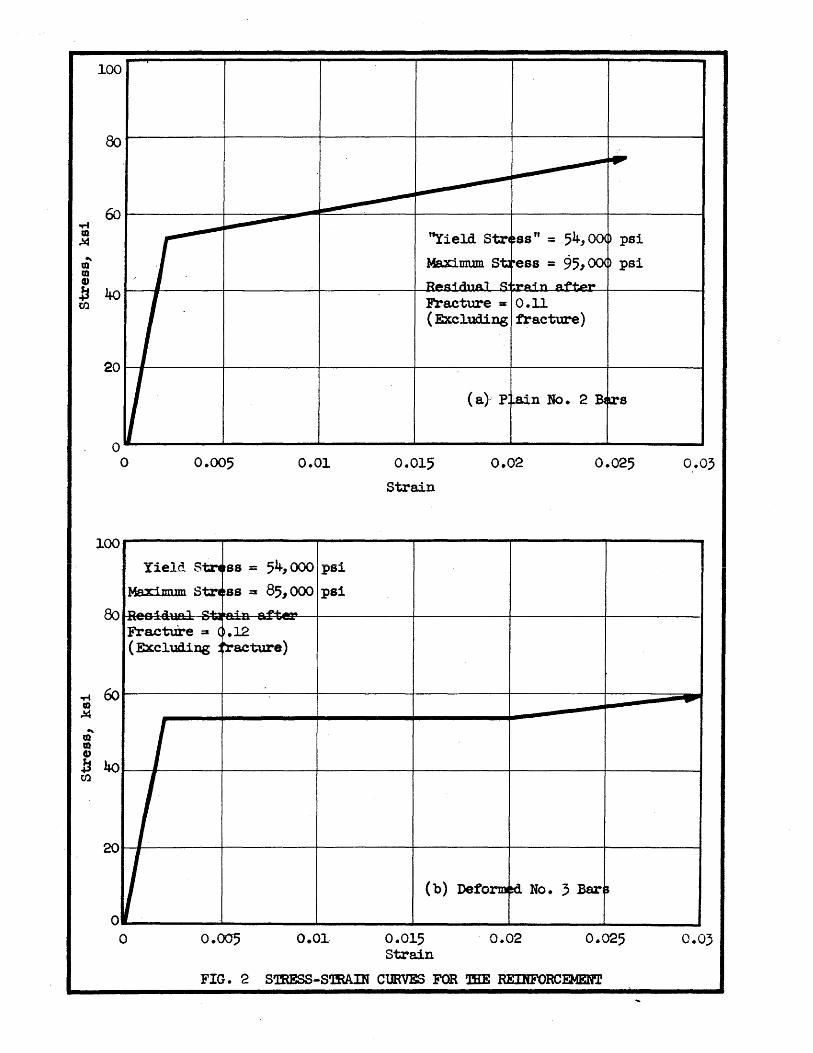
T~e stress-strain characteristics of the two types of bars used
are sho\.,,:: in Fig. 2. The No.2 bars did not exhibit an ideal "flat-top"
region beyond t:~e yield point.
2.3 Fabrication of the Test Specimens
E~e specimens were cast with their longitudinal axes in a horizontal
position. The sides of the forms were made of plastic-treated plywood with
a thickness of 1/2-in. and the bottom and sides of the forms were made of
5-in. structural steel channels. The forms were built with extreme care so
that the specimens would have the desired dimensions wi thin 1/32 in. The
bottoms o~ the forms were removable; each form could accomodate both the
5 in. sq. and the 5 by 10-in. specimens.
12
In order to keep the transverse reinforcement in place during the
operation of casting) the ties were connected by lengths of soft No. 16
gage wire at each corner. The uniform spacing was maintained by first
clamping the stirrups between two pieces of wood and then weaving the
soft wire around each stirrup. Although this system provided no lateral
bracing) once it was placed in the form it was fairly stiff and it was
able to maintain reinforcement in place during vibration.
The ties were arranged so that the laps occurred on two opposite
faces only of the specimen and on alternate ties on each face.
The amount of moisture in the sand was determined immediately
before casting using the "Speedy" apparatus 0 Essentially) this apparatus
involves the measurement of the increase in pressure in a closed chamber
where the wet sand and an amount of sodium carbide are mixed. Previously)
the results obtained using this apparatus were checked against oven-dried
samples and were found to agree within 1/10 of a percent of moisture
content. The gravel was in a bone-dry condition before the mixing operationG
The concrete for all the five sets of specimens having 5-ino sq.
cross sections was mixed in a pan type mixer of 2 cu. ft. capacity in
batches of 350 lbso The concrete of two of the sets of specimens having
5 by 10-in. cross sections) sets 12-1 and 12-2) were also mixed in this
mixer using two batches of 350 lbs for each set of specimens. The concrete
for the rest of the specimens having 5 by 10-in. cross sections were mixed
in a nontilting drum mixer of 6-cue ft capacity 0
13
The concrete was placed in a form with the help of an internal
vibrator 0 The forms were struck 24 hours after casting and the specimens
were stored in a moist room (74°F and 100 percent relative humidity) for
five days. They were then removed and stored in the laboratory while they
were instrumented. The ages of the specimens at the time of test ranged
from 8 to 14 days) most of them being tested at either 9 or 10 days as
indicated in Table 1.
14
3 0 INSTRUMENTATION AND TEST SETUP
3.1 Instrumentation
(a) Measurement of Concrete Deformations. Concrete deformations
were measured on the surface of the specimens in both the vertical and
horizontal directions with the use of mechanical and electrical strain
measuring devices. The basic measuring system consisted of mechanical
measurements of the deformation with the use of a 2-ino Whittemore mechan
ical strain gage.
The locations of the gage plugs are shown in Fig. 3 for the
specimens with 5-in. square sections and in Fig. 4 for the specimens with
5 by lO-in. cross sections. In one set of specimens (11-1), the vertical
gage lines extended over the middle 18 in. of length of the specimen as
indicated in Fig. 3a. In Set 11-2, five gage lines were used in the
longitudinal direction as indicated in Fig. 3b. In the other three sets
of specimens with 5-ino square cross sections, the basic scheme shown in
Figo 3c was used for the location of the gage line plugso The arrangement
of gage ~lugs used in the specimens with 5 by 10-in. cross sections are
shc-wn in Fig. 4a. In Sets 11-1 and 11--2, a 10-in. Whittemore gage was
also used to measure the longitudinal deformation since there was a
sufficient number of gage lines.
The gage plugs for the mechanical gages were mounted on the
concrete using Eastman 910 cement. The gage plugs measured 3/8 in. in
diameter and about 1/4 in. in depth. They were drilled with a No 0 48 d.rill
to a depth of 1/16 in. After drilling) the hole was reamed with a 90°
punch in order to harden the sides of the hole.
15
In Specimens 1223) 1233) and 2221) electrical resistance strain
gages were used as shown in Fig 0 4a 0 The same arrangement of strain gages
was used on the two opposite 10-ina sides of the specimen. The electric
strain gages were SR-4 type A3 gages Which were 1 ino long with a trim
width of l/8 ina These were mounted using Eastman Kodak 910 cement after
the surface of the concrete had been sanded with emery paper and the
small holes on the surface of the concrete were filled with an epoxy resin.
(b) M~asurements of Deformations in the Transverse Reinforcement 0
The tie deformations were measured on the outer surface of the ties using
a 2-ino Whittemore strain gageo With a Noo 48 drill holes to a depth of
1/16 ino were drilled at a spacing of 2 in. on the outer sides of the
stirrups) after the specimen had been cast and curedo The location of
these holes in the specimens are shown in Figso 3 and 40 Holes were drilled
on two opposite faces of the specimen where there were no lap joints except
as indicated in Fig. 4bo
A number of SR-4 type A7 electrical resistance strain gages were
used in Specimens 1223) 1233 and 2221 in order to measure deformations on
the outer surface of the ties. The location of these gages are shown in
Figo 4. In Specimens 1223 and 1233) electrical strain gages were mounted
on both the inside and outside surfaces of the barso The strain gages
inside the bars were mounted prior to casting of the specimens and water
proofed with Epoxoido
All electric strain gages were mounted using Eastman 910 cement
after the surface of the bar had been prepared by sanding with emery paper
and cleaning with acetoneo In the case of the No.3 bars) the deformations
had to be ground down in order to provide a smooth surface for the applica
tion of the strain gage 0 The gages that were mounted on the outside
surface of the bars had no special waterproofing although they were pro
tected by a layer of wax.
16
(c) Longitudinal Deflection. The longitudinal shortening of the
specimens was determined by measuring the distance between the two loading
plates at the top and at the bottom. The movement of these two plates
-with respect to each other was measured at the east and west faces of
the specimen using an extensometer equipped with a OoOOl-ino dial gageo
This measurement was not made for Sets 11-2 and 12-10
(d) Transverse Deflection of the Ties. The transverse deflection
of the middle two or three ties were measured using a C-gage equipped with
a O$OOl-ino dial. The locations at which the deflections of the ties were
meas'rred are indicated in Figs. 3 and 4.
3.2 Test Setup
All specimens were tested in a screw-type testing machine of
300.~ 000-10 capa:: tyo Prior to the series of tests; the stiffness of the
macl-line -was neasU!"ed by extending the legs to a position where they would
be in test}:'l£ "t::'e 25-in. long specimens and loading the head of the machine
'w-itL a hyc.ra'..:.::"~: ~ack seated on the base. At the expected levels of maximum
load.~ ~he s::':::-.ess 0: the machine was fow."ld to be such that for a movement
of 0 001 ir:. :!-'.E ::-"a.:-"be in load was about 56} 000 1bs. Although the machine
was quite s"t::.:-:. ::.."t was not stiff enough not to have the plain concrete
specimens f~::" a: cr soon after the reaching of the maximum load.
~x~e i:fferent arrangements were used for loading the specimens.
The first two specimens, 1101 and 1121, were supported on 2-i.no
end plates flush with the base of the testing machine. At the top the load
17
was applied on another 2-ino end plate ttLrough a 00 5-in~ square bar between
the e!'J.d plate and the head of the machine 0 This represented a line load
applied along one major axis of the cross section. It was used on the
assumption that specimens with eccentrically applied loads would be i.ncluded
in the test program. After two tests) it appeared that this type of loading
affected the stability of the specimen in advanced stages of straining
(about 0005 strain) 0 Hence.~ it was abandoned"
Specimen l13l and Sets 11-2, 12-1, 12-2} 21~lj and 21-2 had the
same arrangement at the bottomo At the tC}).> the load was applied on the
end pla.te th!'ough a movable head which, ostensibly) did not restrain
Totaticno
In testing Sets ll-3y l2~3y 22-1, and 22-2 the movable head was
fixed a.fter a load of .5000 Ib was applied on the specimen 0
The diffe:r'snt methods of loading resulted in no discernible
iiffe:renc~ in the measured C1..lX'ves of load versus longitudinal deformation
Yfle 109.1 en each specimen was increased continually to failure
i:c 1-l./2 't;) L 2./2 bOUX,3> the duration cf test depending on the extent; and
tJ.umbe:::. cf' m.easurements 0 All. measurement,s were obtained at 10 or 20 kip
interval.s depend.ing on the capacity of tl}e speci.men 0 Usually i.t teok
from 10 'to 30 ~Y'.;:~i.:,es to take one set cf readings whi.ch were taken in
the following order ~
. .!.... .A.~:plied load 0
2, Longitudinal d.eflectiono
30 Electric strain gages (if any) 0
4- 0 Lateral. deflection of the -:~ies u
50 Longitudinal deformation of the ties (transverse to the axis of the speci.men) a
6. Longitudinal deformations of the concrete 0
70 -Transverse deformations of the concrete.
80 Repeat measurement of longitudinal deflection.
90 Repeat load measurement.
Since there was serious crushing of the surface concrete at
or sometime after the reaching of the maximum load) it was not possible
18
to get reliable measurements from mechanical gage plugs or electric strain
gages mounted on the concrete beyond that stage of loading.
4. BEHAVIOR OF THE TEST SPECIMENS
4.1 Discussion of Deformation Measurements
19
As described in Section 3.1, deformations of the concrete were
measured through various means and at various locations. To simplify the
discussion of the load-deformation relationShips, it is necessary to refer
to representative curves and consider them as if they were unique. There
fore, it is desirable first to compare the deformation measurements made
at various locations with each other.
The measurement system common to all specimens involved a layout
of mechanical strain gage plugs with two vertical and two longitudinal
2-in. gage lengths as shown in Fig. 3c for the 5 by 5-in. specimens and
in Figo 4a for the 5 by la-in. specimens. The middle line of strain gage
plugs was near the -midheight of the specimen. The plugs were mounted in
this pattern on two opposite sides of the specimen, the longer side being
selected in the 5 by lO-in. specimens. In the 5 by 5-in. specimens, the
gage plugs were mounted on two opposite surfaces where the ties did not
lap.
In Set 11-1, the 2-in. mechanical strain gage layout covered
the whole of the two opposite surfaces of the specimens (Fig. 3a). This
was done in order to obtain a detailed picture of the strain variation
over the surface of the specimen.
Three specimens, 1223, 1233, 2221, were instrumented with SR-4
type A3 electrical resistance strain gages to measure both longitudinal
and transverse strains (Fig. 4a).
In all specimens) except those of the first two sets of speci
men~ the over-all lo~gitudinal deformation of the specimen was measured
20
using deflection dials. Although the readings were not of great import
ance in the early stages of loading, they were quite useful after spalling
of the surface concrete, since the strain gage plugs usually became loose
after this stage.
Figure 5 shows the measured deformations of the middle 4 in. of
two specimens, one with a 5 by 5 and the other with a 5 by 10-in. cross
section. The solid line in the figures show the original position of the
gage lines while the broken ones indicate their displaced shapes at
two different levels of load. In plotting the deformed shapes, the middle
strain gage plug was taken as the datum point and the deformations were
plotted to a much larger scale than the base grid.
As would be expected, the deformations indicate a reduction in
volume; the longitudinal compressive deformation exceeds the lateral
tensile deformation. Furthermore, the relative magnitudes of longitudinal
and transverse deformation measured at various locations indicate that
theSe measurements can be averaged in plotting load-deformation curves.
Although an eccentricity of load is indicated, it is relatively small.
Similar trends indicating eccentricity of load were observed in several
other specimens., but in no case was the difference between the two
extreme strains greater than 10 percent of the average before the load
capacity was reduced considerably.
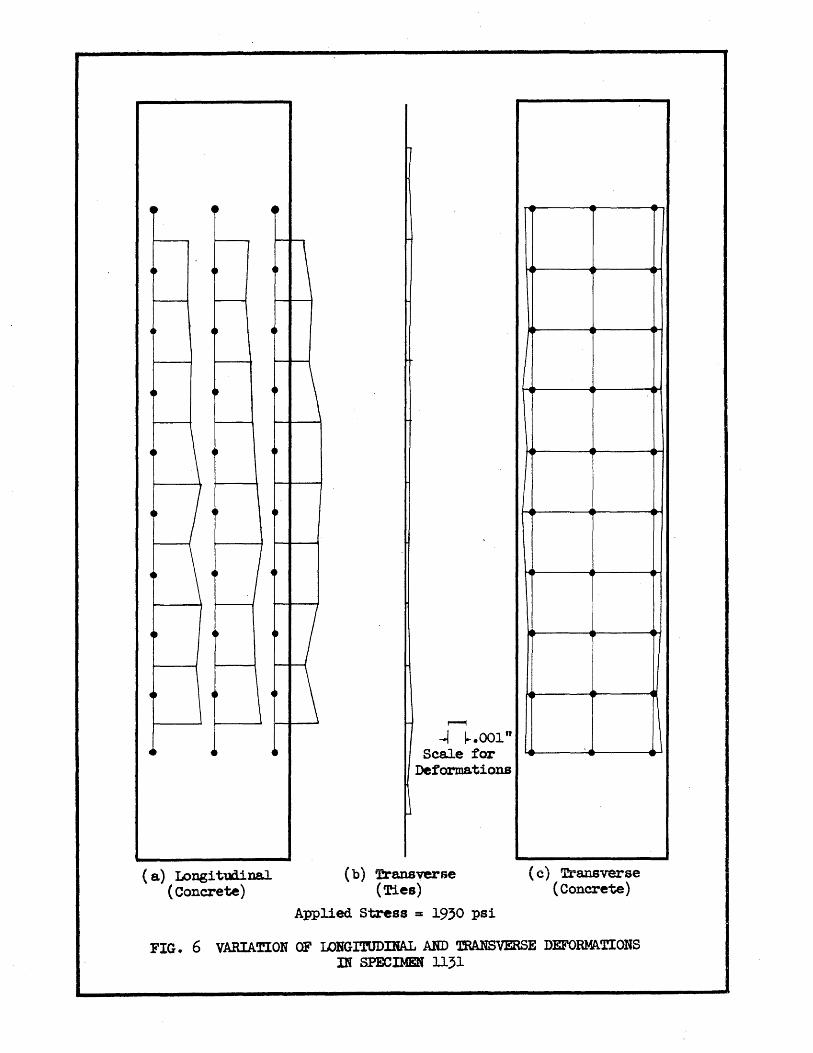
The variation of axial and transverse strains over the surface
of the whole specimen is shown in Fig. 6 for a single load level, 1930
psio No significant !lend effects tr were observed over the middle 18 in.
of the specimen.
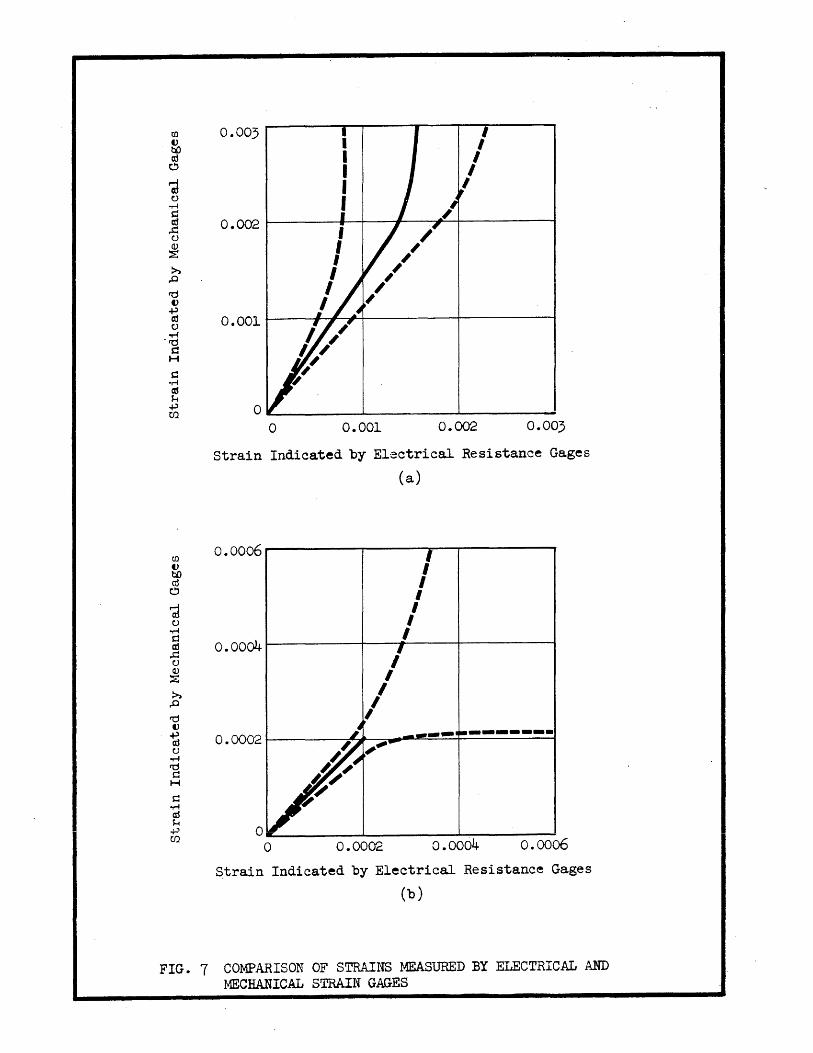
The strain measurements obtained by mechanical and electrical
strain gages are compared in Figso 7a showing the longitudinal strains
and Fig. 7b showing the transverse strains. In these figures, strains
measured mechanically are plotted against those measured electrically
so that a 450 line emanating from the origin would represent complete
agreement between the two types of measurements.
21
The solid curve in Fig. 7a represents the average of the observed
relationships between the strains measured electrically and mechanically
and the broken lines represent the extreme variations observed. The
electrical measurements indicated always smaller strains than the mechani~
cal ones., the absolute difference increasing with increase in load.
Part of the discrepancy between the results of the two types of
measurements may be ascribed to time-dependent effects. The electrical
gaees we~e read usually about ten minutes before the corresponding mechani
cal gages. However, at low loads (longitudinal strain less than O.OOl)J
"the deflection readings taken immediately after stopping and before
re21J.Dlption of loading indicated average strain increases on the order of
the 0.00001. It is extremely unlikely that the corresponding average
deformation measured over the 2-in. gages in the middle portion of the
specimen would be larger than the over-all average deformation. In any
case) even a multiple of the strain 0.00001 does not explain the dis
crepancy indicated in Fig. 7a.
Since the discrepancy between the readings was noticed while
the tests were being carried out, both types of gage systems were checked
carefully. The deformations obtained mechanically over 2-in. gage length
could be summed to match those measured over longer gage lengths independ
ently. The only confirmation for the performance of the electrical gages
was the availability of data from cylinder tests with the same type of
concrete on which gages have been mounted with the same procedurea The
data from these tests gave excellent correlation between electrical and
mechanical measurements. Therefore) it appears extremely unlikely that
one set of gages was malfunctioning consistently.
22
The different gage lengths) 2 in. for the mechanical and 1 in.
for the electrical gages) should result in higher strain measurements
for the electrical gages but for one detail~ the mechanical gages straddled
ties while the electrical gages did noto The plotted average deforma
tions in Fig. 6a show that the readings of the 2-in. mechanical gages
were fairly uniform throughout the middle 18 inches of the specimen.
However J the uniformity of these results does not necessarily imply
uniform s~rains over each gage length. It appears from the comparison
of the readings of the electrical gages mounted on the concrete in
between the ties and the readings of the mechanical gages which measured
the deformation over a 2-ino length including the section with the tie
that the longitudinal concrete deformation in the vicinity of the ties
was appreciably larger than that existing away from the ties.
Another interesting feature of the curve shown in Fig. 7a is
the break occurring at a strain) indicated by the mechanical gages; of
about 00002. In the higher stages of loading corresponding to such
strains; the increase in strain which occurred during the recording
of readings was on the order of 0.0003. This increase in itself does
not explain the breako The most likely cause of this phenomenon is
the initiation of very fine cracks in the concrete which resulted in
less and less stress being transmitted to the surface concrete in
between the ties and more and more of the deformation taking place in
the.immediate vicinity of the ties as in a chain with weaker linkso
The appearance of micro-cracks may have interfered with the functioning
of the electrical gageso However) it is known from experience with
23
other specimens that the electrical gages working in compression function
reasonably well up to strains of Oe004 or even larger.
It was not possible to continue measurements across the 2-in.
gage lines after spalling of the surface concrete since the gage plugs
were loosened. This took place at a measured longitudinal strain of
about 0000350 Beyond this value) the longitudinal deformations of the
concrete had to be based on the measurement of the over-all deflection.
The strains based on the over-all deflection were in quite good agreement
with the local strain measurements up to spalling of the concrete. Beyond
spalling) however) the strain based on the over-all deflection may be
less than the maximum local strain since failure was usually localized
over a depth of not more than four inches.
As indicated in Figo 7b, the agreement between mechanical and
electrical =eas~ements of transverse strains was very good up to a
strain of atJ~:' 0.0002. Both types of measurements were made at the
same leve2. (FiC. 4). After a strain of 000002) the readings of the
mechanical ~d :.ne electrical strain gages deviated from each other quite
drasticallj', ~is was caused by the initiation of hairline cracks in
the concre:'e. E':idently) the appearance of microcracks at or below
strains of 0.0002 interfered drastically with the function of the elec
trical gages while these cracks were sensed only in small uniform increases
in deformation by the 2-in. mechanical gages. According to these results)
the measurements obtained by the mechanical gages may be interpreted as
strains in the concrete up to a strain of about 0000020 Beyond that
strain, they represent average deformations over two inches 0
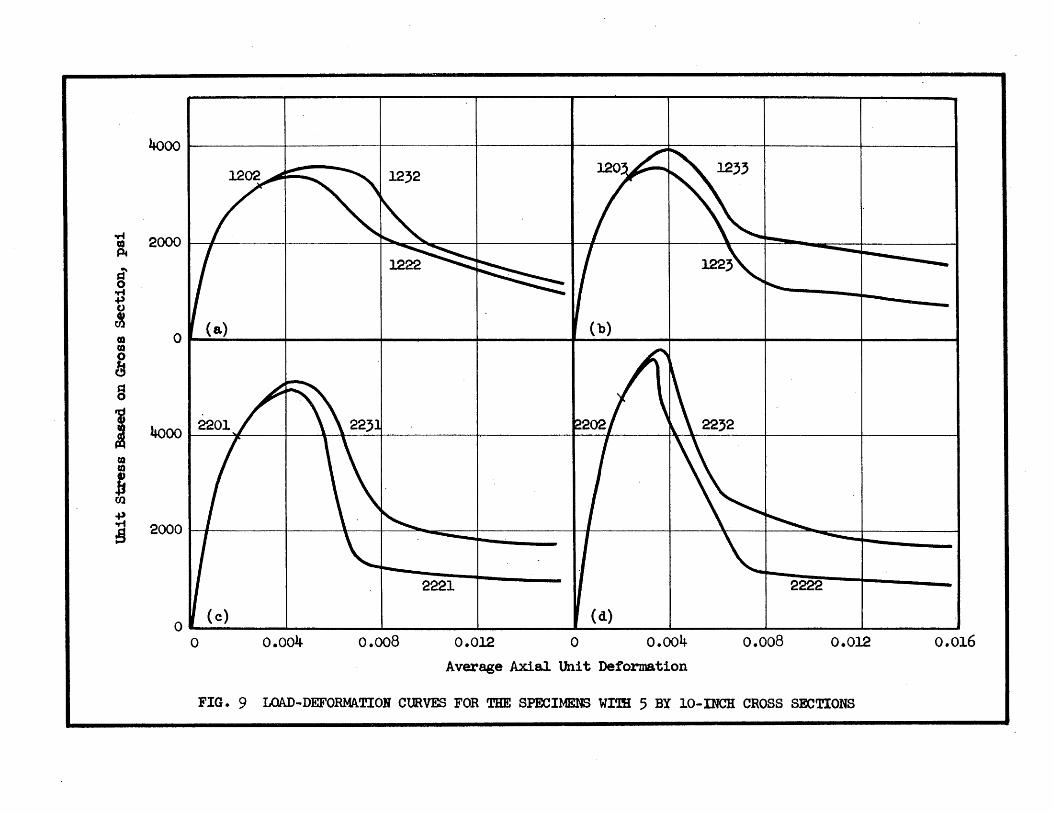
402 Relationship Between Load and Longitudinal Strain
Measured load versus longitudinal strain curves are shown in
Figs 0 8 and 9 for eight of the ten sets of specimens testedo For the
24
first two sets of specimens, 11-1 and 12-1, deflections, and therefore,
average strains beyond spalling were not measured. Otherwise, the behavior
of these specimens was similar to that of the comparable specimens of
Sets 11-2 and 12-2. The load-strain curves and visual observations of
the reinforced specimens indicated three general stages of behavior as
shown ideally in Figo 10Q The first stage corresponded to the behavior
of the plain specimenQ Although a nonlinear load-strain relationship
was observed within this stage, the total strain increase was small, on
the order of 0000150 The initiation of the second stage was marked by
an acceleration in the rate of longitudinal strain. This stage was
terI!1inated by severe spalling of the concrete on the surface, a phenomenon
which occurred at or immediately after the reaching of the maximum loado
Further increase in strain with reduction in over-all resistance of the
specimen were the characteristics of the third stage.
The only variable which appeared to affect the first stage ,.,as the
concrete strenGtho Increase in concrete strength increased the stress,
strain, and stiffness corresponding to the first stage 0 There was no marked
difference between the behavior of plain and reinforced specimens in this
stage 0 Naturally, the plain specimens failed at the end of this range since
25
the testing machine was not stiff enough to prevent the overloading of the
specimen once its resistance started decreasing.
In terms of strain) the second stage of loading was initiated at
0.0015 to 0.002 and ended at 0.003 to 0.004) apparently independent of the
shape and amount of reinforcement. In some cases) the maximum load was
~intained at a strain of 0.005. In general; however) it can be said that
the total increase in strain in the second stage was about as much as it
was in the first stage. On the other hand) the increase in load was not
as much. The increase in load was largest for the 5 by 5-in. specimens
with No.3 bars and smallest for the 5 by 10-in. specimens with No.2 bars)
the relative increase depending on the strength of the concrete.
The parameters to be used in describing the shape of the load
deforEa~ion curve in the third stage demand some discussion. In this range)
the load resisting capacity of the specimen is reduced. However; this does
not cea-~ that ~he unit stress resisted by intact concrete is decreased.
The su::u2e 20ncrete spalls near the end of the second stage. Thus; in
cor.np-...:.:.i:1C the a .... -erage stress in the concrete) the net area (area inside
~:ra.'1s':e!'se !'ein~orceI:lent) rather than the gross may be used. For the 5-in.
square spe2~ens reinforced with No.3 bars this would result in a 40 percent
increase i~ t~e no~~nal stress as compared to the stress based on the gross
sectic~. ~thermore) observations of the state of the specimen in this
stage of loadinG indicated the presence of Tlarches" in the vertical direc
tion spanninc between the ties. The height of these arches) indicated by
the depth of spalling) appeared to increase as longitudinal deformation
was increased; causing a progressive reduction in the cross-sectional area
of the intact concrete. In addition) the horizontal deflection of the
26
transverse reinforcement must have created a partial arch in the horizontal
plane such that the lateral support system could be visualized as a series
of domes spanning between the ties. This effect would tend to reduce the
area further. When this is considered in addition to the fact that the
strains at the section of failure could have been larger than those indicated
by the over-all deflections on which the strains were based in this stage,
it appears that the true stress-strain curve might be ascending or at least
proceeding at the same level of stress rather than descending as the load
deformation curve does.
In terms of the practical output of a given member, it is the
over-all load-deformation curve and not the true stress-strain curve that
is significant. In that sense, the plotted curves showing average unit
load based on gross section versus average strain do possess significance 0
However) they are limited in that they refer to the specific conditions of
transverse reinforcement size and shape used in the tests.
The direction and extent of the load-deformation curve in the
third stage was found to be affected appreciably by the concrete strength,
the type of the specimen, and the size of the reinforcement. The downward
slope of the curve increased as concrete strength and length of the side of
specimen increased and as the size of the reinforcement decreased. For the
5-in. square specimens with No. 3 bars and nominal concrete strength of
3000 psi) the maximum load resisting capacity was maintained at strains on
the order of 0.01. On the other hand, for the 5 by 10-in. specimens with
Noo 2 bars and nominal concrete strength of 5700 psi; the reduction in load
beyond the strain of 000035 was qUite drastic. In fact, it was debatable
whether a third stage existed for these specimens.
27
4.3 Horizontal strains and Lateral Deflection of the Ties
The measured relationships between the applied load and lateral
deformation are summarized in Fig. ll. In this figure the ordinates represent
the ratio of the applied load to the maximum load reached and the abscissas
the average transverse strain. The data plotted pertain only to the speci
Bens with transverse reinforcement. The solid line represents the average
of all the measurements while the two broken lines give the upper and lower
bounds to the measurements.
In the early stages of loading) there was little difference between
horizontal strains measured at comparable stresses for specimens having the
same nominal concrete strength. The measured lateral strain at a stress of
about half the compressive strength of the concrete (6 by 12-in. cylinder)
was only about 0.0001. The horizontal strains started increasing appreciably
at an applied stress equal to about 90 percent of the cylinder strength when
the Beasured horizontal strain was about 0.0002Q This load level also marked
the initiation of consistently measurable strains in the ties. Under careful
examination; longitudinal hairline cracks could be observed in the concrete.
As indicated before in the discussion of the relationship between strains
measured mechanically and electrically) the average strains shown in
Fig. 11 for strains greater than about 0.0002 are not strains but deforma
tions measured over a 2-in. gage length. The abrupt break in the curves
in Fig. 11 indicates the initiation of the second stage of loading as
defined in the preceding section. The transverse strain readings were not
continued beyond the maximum load since spalling of the concrete made the
readings of the gages unreliable.
28
In the initial stages of loading) the ratio of the lateral to
the longitudinal strains was 1/8 to 1/6. This ratio started to increase
slowly at an applied stress of about half the compressive strength of the
concrete. There was a very large increase at about 90 percent of the
cylinder strength.
The diagrams shown in Fig. 12 illustrate the lateral deflections
undergone by the reinforcement. Tne data shown in Fig. 12 pertain to the
long side 01' a 5 by 10-in. tie. Deflections were measured at five points
as indicated in the figure by the centerlines. The curve for PiA = 3200 psi
represents the deflected shape of the stirrup at a load of 94 percent of'
the maxinum reached. At this stage and after maximum load the lateral
deflection of the tie was very small. The curve for PiA = 3400 psi repre
sents the deflections of the tie at maximum load. Compared to the condition
at 3200 psi: the deflections are more than doubled. Nevertheless) in terms
of the absolute length of the tie these deflections are still quite small)
in this case on the order of about 15 percent of the diameter and 1 percent
of t~ne span of the tie. After the m.aximum load had. been reached) the increase
in the lateral deflection of the tie was considerable, in the case shown
the deforTlations reached a m~ximum of about 0.4 in. However, this was
considerably beyond the stage in which the maximum load was reached. The
shape of the stirrup after the removal of the load is also shown in the
figure. Naturally, after such large deformations the residual deflection
was quite large.
In general, the measurements of the deflection of the ties showed
that at the time the specimen developed its maximum load, the lateral
deflections of the ties were negligible. On the basis of the measured
29
deflection) it was unreasonable to expect much nembrane action. Further
more) the few electrical strain gages that were located on the inside face
of the stirrups indicated that at midspan of the tie) the curvature under
gone by the tie was not great. On the basis of these measurements, the
yield stress existed uniformly throughout the depth of the bar.
50 EFFECT OF TRANSVERSE REINFORCEMENT ON THE STRENGTH OF THE TEST SPECIMENS
30
The object of this chapter is to present a simple relationship
between the observed strength of the test specimen and the amount and
configuration of the transverse reinforcement.
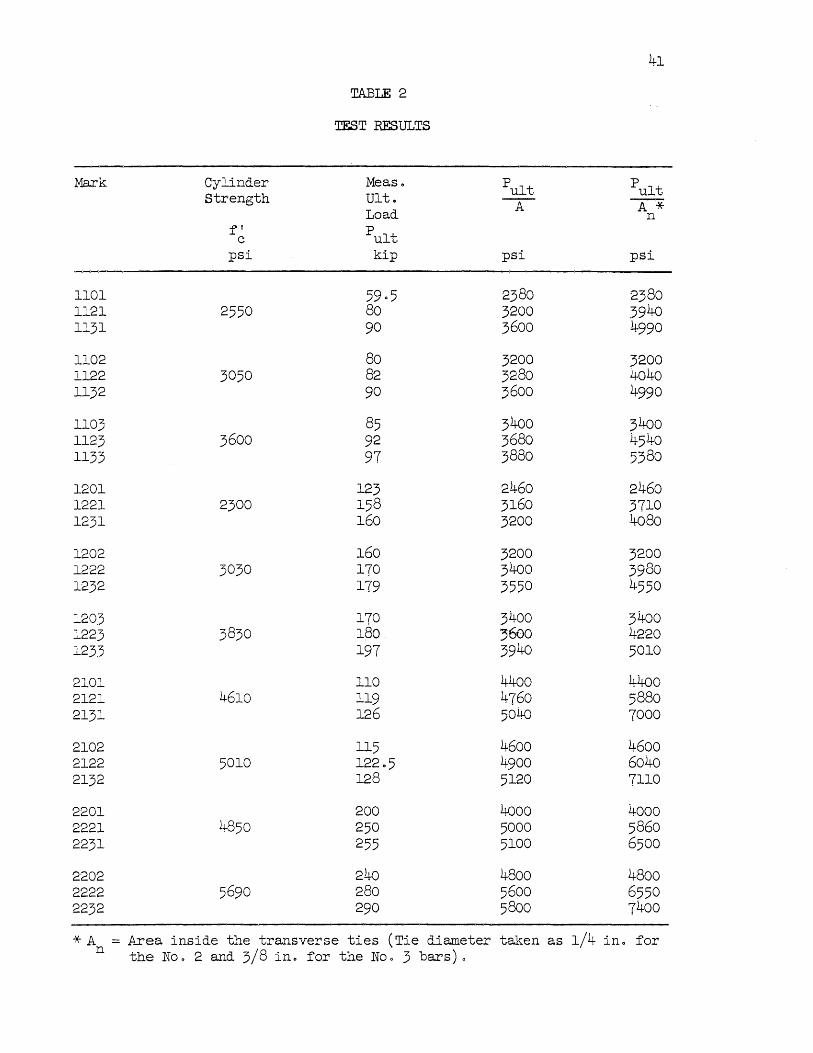
The measured ultimate loads for all the test specimens are listed
in column 3 of Table 2 in sets of three. The first entry for each set
refers to the unreinforced prism. The second and third entries refer to
the prisms with No.2 and No.3 ties, respectively. The ultimate load is
listed also as unit loads based on the gross and net section of the specimen.
To study the influence of transverse reinforcement on a given type
of specimen, one could compare the ultimate loads for the three specimens
of each set. In general, such a comparison indicates the transverse rein-
forcement to be rather inefficiento A system of No.3 ties at 2 in. is
very heavy reinforcement, especially for the 5-in. square specimens. Yet,
except for Set 11-1, the contribution of No.3 ties to the strength of
the 5-ino square specimens was less than 600 psi in every caseo This
rating may be satisfactory if the question is limited to finding out what
happens to a cer~:n specimen upon the addition of transverse reinforcement.
However, it does not reflect the actual effect of the ties on the unit
strength of the concrete, and even a crude projection of the information
obtained frow t~e tests to other cases requires the use of a reasonable
estimate of the t~ue unit strength.
At the time of reaching the maximum load) the surface concrete
was spalledo Examination of the specimens after completion of the tests
showed that the depth of penetration of the spalling was as much as one
inch in some cases. These observations were made after the specimen was
strained several times that at maximum load and do not indicate the net
section at maximum loado
31
However, it cannot be denied that the true average stress at
maximum load was larger than that based on the gross sectiono The net
section must depend on the longitudinal spacing, the size) and the span
of the ties) and the frictional and cohesive properties of the concreteo
The concrete must be supported laterally by two perpendicular systems
of arches or a system of domes on each side; it spans from tie to tie
in the longitudinal direction and most of the reaction must be concentrated
near the corners of the tie in the transverse direction. There was definite
indication of the arching in the longitudinal directiono The sides of the
specimens resembled a washboard after the testo However, there was no
direct evidence of arching in the transverse directiono
On the basis of the data available, it would be presumptuous to
delineate the shape of the net section with any curve implying precise
information. The alternative of using the gross section is equally un
attractive since it is definitely wrong. The only practical choice is
to define a net section geometrically similar to the gross section. In
the quantitative studies made in this chapter, the net section was defined
arbitrarily as the area within the tieo It follows from the preceding
discussion that the net section should be smaller than this area 0 Howevery
no plausible defense could be made for a quantitative expression defining
the reduction in area intelligibly, on the basis of results from 20 rein~
forced specimens involving several variableso
The stresses based on ttds definition of the net section are
listed in column 5 of Table 2 for all the test specimenso
32
In the ACI Column Investigation (6, 7, and 8) it was found possible
to express the increase in strength of the concrete resulting from lateral
pressure in accordance with the following expression~
f == f" + k f 1 c 2
where fl unit strength in compression
f" = unit strength of the concrete in the specimen without lateral c
pressure
f2 == lateral stress
k a constant derived from test data
In the case of helically reinforced columns, f2 was expressed as
2 A" f" S s Ds
where A" cross-sectional area of the transverse reinforcement s
f" = stress in the transverse reinforcement s
D ~ di~eter of enclosed core
s = lo~~itudinal spacing of the transverse reinforcement
Ir: Yiew of the demonstrated success of Eqo 101, it can be assumed
tha~ the ccntrib~tion of the rectilinear transverse reinforcement to the
strength of the ~oncrete is independent of the concrete strength and that
the factor k is a constant 0 The definition of f2 for rectilinear reinforce
ment is no"': as sinple as in the case of circular reinforcemento The steel
stress is not constant along the side of the specimen nor need it be constant
over the cross section of the tieo If these variations are ignored for the
sake of simplicity) a study of the equilibrium of various sections cut in
33
a lateral slice of a rectilinear core indicates different averac;e stresses
acting on different sections. Undoubtedly, shearing stresses exist in the
lateral plane over and above those caused by material non-uniformity.
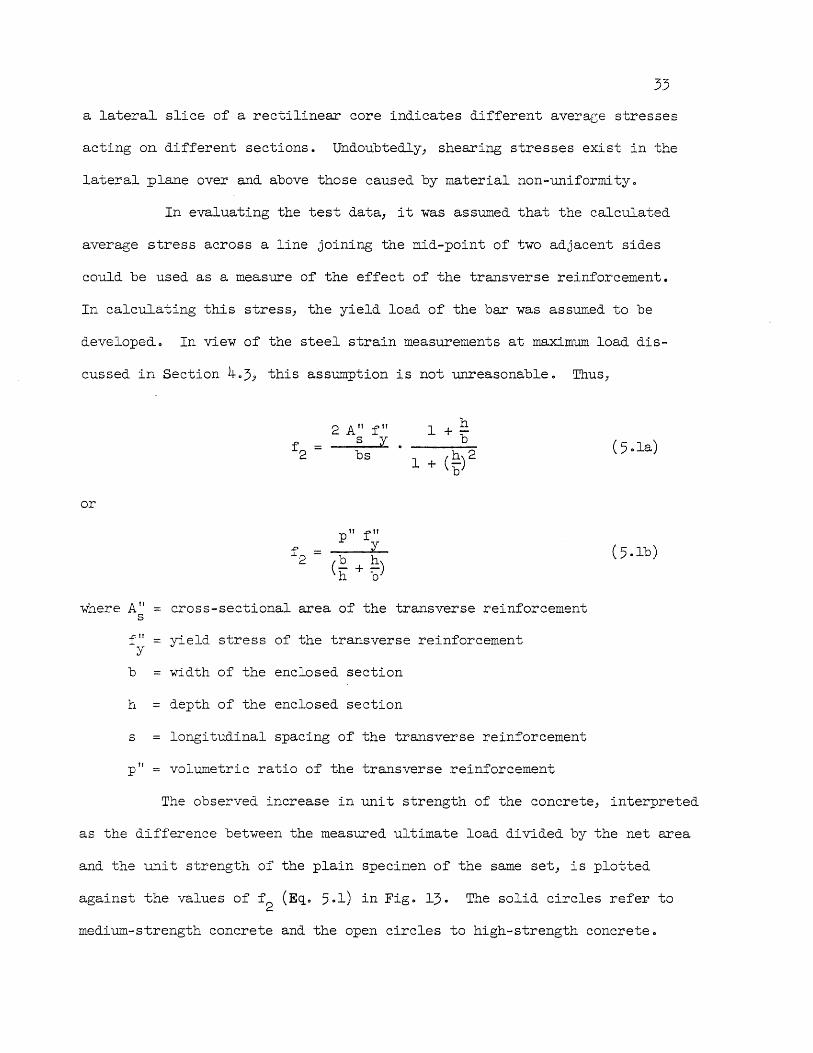
In evaluating the test data, it was assumed that the calculated
average stress across a line joining the mid-point of two adjacent sides
could be used as a measure of the effect of the transverse reinforcement.
In calculating this stress, the yield load of the bar was assumed to be
developed 0 In view of the steel strain measurements at maximum load dis-
cussed in Section 403, this assumption is not unreasonable. Thus,
or
where AI! s
h
s
p"
2 A" f" s y. bs
b h (- + -) h b
h 1+;;-
1 Ih)2 + \-b
cross-sectional area of the transverse reinforcement
yield stress of the transverse reinforcement
width of the enclosed section
depth of the enclosed section
longitudinal spacing of the transverse reinforcement
volumetric ratio of the transverse reinforcement
(5 .lb)
The observed increase in unit strength of the concrete, interpreted
as the difference between the measured ultimate load divided by the net area
and the unit strength of the plain specimen of the same set, is plotted
against the values of f2 (Eqo 5.1) in Fig. 13. The solid circles refer to
medium-strength concrete and the open circles to high-strength concrete.
It is seen that four of the open circles fall considerably above
the rest of the datao These open circles represent the data from Sets 22-1
and 22-2. All four specimens considered have 5 by lO-ino cross sections
and high-strength concreteo
The unit strength of the concrete from the prisms is compared
with that from the cylinders in Figo 14. There is almost a one-to-one
relationship in between the two and all but two points fallon or above
the line representing f" = 009 fto These two points represent the results c c
from Sets 22-1 and 22-20
If the strength of the concrete in Sets 22-1 and 22-2 is assumed
to be 90 percent of the cylinder strength) the corresponding points in
Figo 13 are modified as shown by the open circles crossed by horizontal
lines 0
For purposes of comparison) a broken line representing 6fc = 4.1 f2
is shown in Fig. 13. This line indicates the observed relationship between
the lateral stress and the increase of axial stress for circular transverse
reinforcement (6) 7) and 8)0 This comparison is made on the tacit assump-
tion that the lateral stress is defined correctly 0
It is seen that the efficiency of rectilinear transverse reinforce-
ment is low compared to circular transverse reinforcemento A reasonable
lower bound to the data is represented by
where 6f is the increase in unit strength) while the lower broken line c
in Figo l3 described by
is a lower bound to all the measured values 0
35
The scatter in the data} even without the results of Sets 21-2
and 22-2} is appreciable and raises doubts about the justifiability of
selecting the average stress on a line joining the mid-points of two
adjacent sides rather than using a direct volumetric ratio} such that
f = fll + K p"f" 1 c y
where K is a constant to be determined from the data.
This would have been a more reasonable approach if the inter-
pretation of the data had to be limited to a description of the observed
phenomena. However} it must be admitted that the shape of the transverse
reinforcement affects its efficiency. Hence) although Eq. 1.1 is an over-
simplification in itself} the use of Eq. 5.1 which reflects a shape-effect
in the expected direction is plausibleo
6. SUMMARY
6.1 Object
The object of the exploratory series of tests described in this
report was to investigate the effect of rectangular ties on the load
deformation characteristics of concrete. These tests constitute the first
stage of an experimental investigation of ties, stirrups, and longitudinal
reinforcement on the behavior of concrete in structural memberse The
ultimate object o~ the study is to develop intelligible methods for the
prediction of the rotation capacity of frame connections in reinforced
'concrete.
6.2 Scope
A total of 30 horizontally-cast prisms were tested under axial
compression. Each prism measured 25 in. in length and had a cross section
of either 5 in. square or 5 by 10 in.
The prisms were cast in sets of three) one without reinforcement,
one with NOe 2, and one with No.3 ties at 2 in. The ties were welded and
placed flush with the form. No longitudinal reinforcement was usedo The
concrete strength ranged from 2300 to 5700 psie
The measurements included strains on the surface of the concrete
in both principal directions and deformations of the ties.
6.3 Test Results
Curves of load versus longitudinal deformation are shown in Figs. 8
and 9. The behavior of the reinforced specimens was qualitatively similar
to that of concrete confined by circular transverse reinforcement and can
be idealized into tl1ree stages as ShOWll in Fig. 10.
37
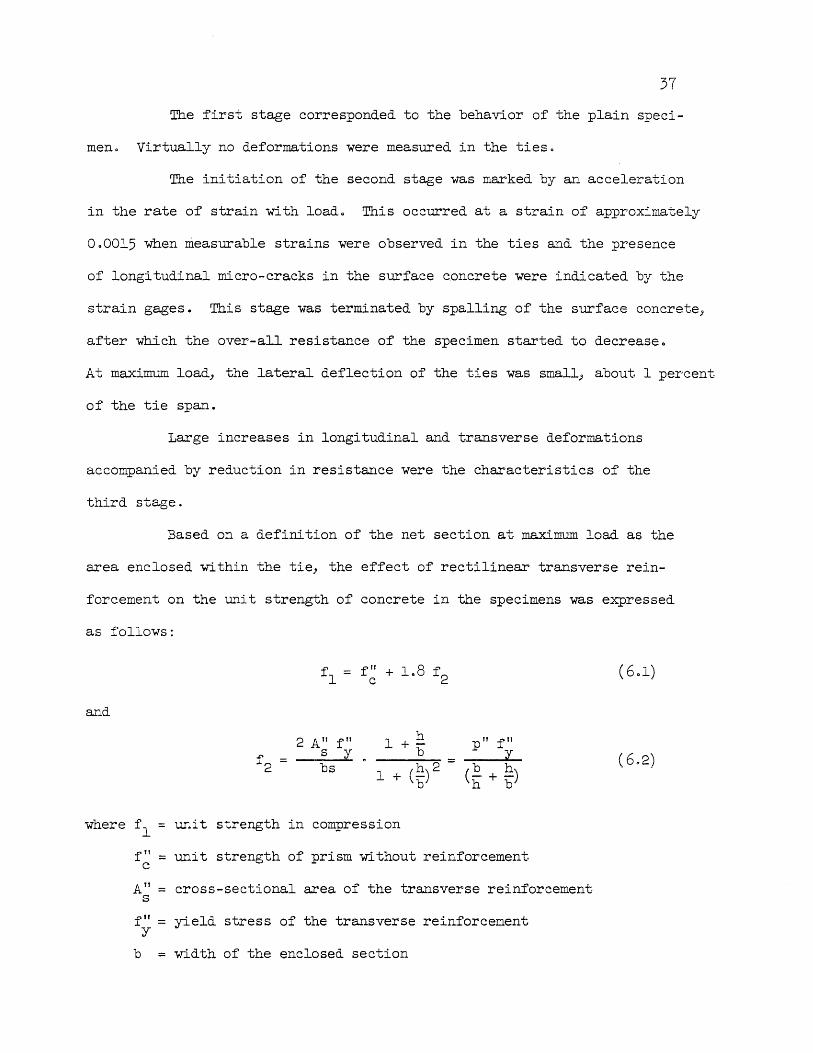
The first stage corresponded to the behavior of the plain speci-
men. Virtually no deformations were measured in the ties.
The initiation of the second stage was marked by an acceleration
in the rate of strain with loado This occurred at a strain of approximately
000015 when measurable strains were observed in the ties and the presence
of longitudinal micro-cracks in the surface concrete were indicated by the
strain gageso This stage was terminated by spalling of the surface concrete,
after which the over-all resistance of the specimen started to decreaseo
At maximum load) the lateral deflection of the ties was small, about 1 percent
of the tie span.
Large increases in longitudinal and transverse deformations
accompanied by reduction in resistance were the characteristics of the
third stage.
Based on a definition of the net section at maximum load as the
area enclosed within the tie) the effect of rectilinear transverse rein-
forcement on the unit strength of concrete in the specimens was expressed
as follows:
and
where fl =
f" = c
At! = s
f" = y
b =
ur .. it s:.rength
unit strength
2 Ail f" s y. bs
h 1+1)"
-----=- = 1 + (:e:) 2
b
in compression
pIT fIT Y
b h (- + -) h b
of prism without reinforcement
cross-sectional area of the transverse reinforcement
yield stress of the transverse reinforcement
width of the enclosed section
h = depth of the enclosed section
s = longitudinal spacing of the transverse reinforcement
pH = volumetric ratio of the transverse reinforcement
The relation of the test data to Eq. 6.1 is shown in Figo 13.
The ductility of the specimens, especially the rectangular ones
with high-strength concrete, was poor. However, the observed behavior of
concrete in the compression zone of beams with compression steel indicates
that the combined action of longitudinal reinforcement with the ties may
improve the ductility considerably.
39
LIST OF REFERENCES
1. Eddy, Ho To and Co Ao p" Turner, rtConcrete-Steel Construction; Part I, Buildings, fI Second Edition" Minneapolis, 1919" Appendix, p. 1.
20 Ransome" E. L. and Alexis Saurbrey, flReinforced Concrete Buildings, ff
McGraw Hill Book COO" New York, 1912, po 260
30 Considere, Armand, "Le Beton Frette et Ses Applications, II Publications du Journal Le Genie Civil, Paris, 19070
4.. Considere) Armand, "Experimental Researches on Reini'orced Concrete., If
English Translation by L. F 0 MoisseiffJ McGraw Publishing CO OJ New York, 19030
50 'Reinforced Concrete Column Investigation, Tentative Final Report of Committee 105, " Fo Eo Richart" Chairman" ACI Journal" June 1933) Proceedings Volume 29) po 443.
6. Richart, Fa Eo" A. Brandtzaeg) and R. L. Brown, f~ Study of the Failure of Concrete under Combined Compressive Stresses) II University of Illinois Engineering Experiment Station Bulletin No. 185) 1928.
7. Richart, Fo E", A Brandtzaeg, and Ro Lo Brown, liThe Failure of' Plain and Spirally Reinforced Columns in Compression) Ii University of' Illinois Engineering Experiment Station Bulletin Noo 190) 19290
8. Richart, F. E., and Ro Lo Brown, "An Investigation of Reinforced Concrete Columns, " University of' Illinois Engineering Experiment Station Bulletin No. 267, 19340
9. Ri chart} F. E., J 0 00 Draffin" T .. A 0 Olson, and R .. H. Reitman" "The Effect of Eccentric Loading) Protective Shells" Slenderness Ratios, and Other Variables in Reinforced Concrete Columns" n University of Illino~s ~ineering Experiment Station Bulletin Noo 368, 19480
100 Lyse, luge) '~ifth Report on Column Tests at Lehigh University" " ACI Journal, JU.I1e 1933; ACI Proceedings Volume 29) p. 4330
110 Talbot, A. N., "Tests of Concrete and Reinforced Concrete Columns; Series of 1907, " University of Illinois Engineering Experiment Station Bulletin No. 20) 19070
12. Chan, W. W. L., "The Ultimate Strength and Deformation of Plastic Hinges in Reinforced Concrete Frameworks, " Magazine of Concrete Research, Volume 7, No. 21, November 1955 (London) 0
13. Jensen, VO Po, "Ultimate Strength of' Reinforced Concrete Beams as Related to the Plasticity Ratio of' Concrete, II University of Illinois Engineering Experiment Station Bulletin Noo 345, 19430
40
TABLE 1
PROPERTIES OF THE TEST SPECIMENS AND CONCREI'E MIXES
Mark Width Depth Reinf. Water/ Mix Slump Age Concrete Tensile Bar Cement Proportions at Strength Strength
* Based on 6 by 12-ino cylinders .. Numeral in parentheses indicates number of cylinders testedo
** Based on splitting test of 6 by 6-ino cylinder 0 a Plain bar, Diameter~ 1/4 ino, A = 0005 sqo ino b Deformed bar) Nominal Diameter~ s3/B ino) Nominal A = 0011 sqo in ..
s
41
TABLE 2
TEST RESULTS
Mark Cylinder Measo Pu1t Pu1t Strength Ulto --p:- A * Load n


![Concrete Friction Buffers - Reducing impact from ship ......ship to absorb the entire impact energy through plastic deformation [1; 2]. As a consequence, this accidental load case](https://static.documents.pub/doc/80x56/60d529dea03483544a2a9218/concrete-friction-buffers-reducing-impact-from-ship-ship-to-absorb-the.jpg)


