Load Rating of Arch Bridges by MICHAEL CHAJES Department of Civil and Environmental Engineering College of Engineering University of Delaware October 2002 Delaware Center for Transportation University of Delaware 355 DuPont Hall Newark, Delaware 19716 (302) 831-1446 DCT 144
Transcript
Load Rating of Arch Bridges
by
MICHAEL CHAJES Department of Civil and Environmental Engineering
College of Engineering University of Delaware
October 2002
Delaware Center for Transportation University of Delaware
355 DuPont Hall Newark, Delaware 19716
(302) 831-1446
DCT 144
The Delaware Center for Transportation is a university-wide multi-disciplinary research unit reporting to the Chair of the Department of Civil and Environmental Engineering, and is co-sponsored by the University of Delaware and the Delaware Department of Transportation.
DCT Staff
Ardeshir Faghri Jerome Lewis Director Associate Director
Wanda L. Taylor Lawrence H. Klepner Sandi Wolfe Assistant to the Director T2 Program Coordinator Secretary
DCT Policy Council
Robert Taylor, Co-Chair Chief Engineer, Delaware Department of Transportation
Eric Kaler, Co-Chair
Dean, College of Engineering
The Honorable Tony DeLuca Chair, Delaware Senate Transportation Committee
The Honorable Richard Cathcart
Chair, Delaware House of Representatives Transportation Committee
Timothy K. Barnekov Dean, College of Human Resources, Education and Public Policy
Michael J. Chajes
Chair, Civil and Environmental Engineering
Ralph A. Reeb Director of Planning, Delaware Department of Transportation
Stephen Kingsberry
Director, Delaware Transit Corporation
Shannon Marchman Representative of the Director of the Delaware Development Office
Roger Roy
Representative, Transportation Management Association
Jim Johnson Executive Director, Delaware River & Bay Authority
Delaware Center for Transportation University of Delaware
Newark, DE 19716 (302) 831-1446
Load Rating of Arch Bridges
by
MICHAEL J. CHAJES Department of Civil and Environmental Engineering
University of Delaware Newark, Delaware 19716
DELAWARE CENTER FOR TRANSPORTATION University of Delaware
Newark, Delaware 19716
This work was sponsored by the Delaware Center for Transportation and was prepared in cooperation with the Delaware Department of Transportation. The contents of this report reflect the views of the authors who are responsible for the facts and accuracy of the data presented herein. The contents do not necessarily reflect the official views of the Delaware Center for Transportation or the Delaware Department of Transportation at the time of publication. This report does not constitute a standard, specification, or regulation.
1
Executive Summary Motivation for the Research
As the literature contains little information on evaluating the load-carrying capacity of arch bridges, the burden falls to bridge owners to develop their own methods for rating these bridges. Some research has been done on determining how to load rate masonry arches, virtually none has addressed the process for concrete arches. In Delaware, 27 of the 33 arch bridges in the bridge inventory are made of reinforced concrete, while only six are masonry. A majority of the arch bridges in Delaware are at least 75 years old and do not have existing plans or documentation. As a result, additional research was needed to establish a suitable rating methodology for concrete arch bridges.
Background on Load Rating Methods
Several methods have been explored for load rating of arch bridges, with most of the research being conducted outside the United States. DelDOT is currently using the STAAD-III computer software program to aid in load rating the arch bridges in their bridge inventory. This software package is not specific to arch bridges; rather, it is used to analyze and design a variety of structure types, including those made of truss, frame, and plate/shell elements. When an arch bridge is modeled using this software, it is represented as an assemblage of frame elements.
Once the arch is modeled, truck loads representing the various rating vehicles are applied. Then the bridge is analyzed using STAAD-III. Next, three influence lines are determined for the three critical arch sections. These critical arch sections are the midpoint of the arch, the quarter point, and at the springing. Basic principles are used to calculate the properties for the critical sections. The stresses are calculated at the critical sections. Once the influence lines are determined, the load ratings are determined. Then the arch is rated for the controlling sections. This method is the basis of the method developed in this report. The primary difference between STAAD-III and the proposed method is that effective width and live load distribution are altered based on load test results.
Bridge 1-136 As a Case Study
Bridge 1-136 is located in New Castle County, Delaware, north of Wooddale. It carries Barley Mill Road and crosses over a tributary of the Red Clay Creek. It is a concrete arch bridge with an 18-foot span length and a 9-foot rise. This bridge was built in 1932 and has never been reconstructed. The arch is circular in shape. Bridge 1-136 was chosen for this study because it was typical of the types of concrete arch bridges in Delaware’s bridge inventory. Its 18-ft. span length is close to the average of 25 ft. It is made of concrete, as are the majority of the arch bridges in the inventory. Bridge 1-136 is also posted, which makes it a good candidate for load testing. If the load rating method developed shows that the load posting can be removed, it will indicate that the previous method of rating was conservative.
2
Experimental/Load Test Method
To determine whether the analytical method developed in this report is accurate to use when load rating arch bridges, a load test was conducted on Bridge 1-136 using two DelDOT dump trucks crossing the bridge in a variety of combinations, and the results were compared to those from the proposed method. The field tests showed that the governing load location is at the outside edge of the arch at the arch crown. This location sees the highest strains because there is limited ability for transverse load distribution at the edge of the arch. The calculated effective width beff (transverse load distribution) value was found to be 8.76 ft. This beff value was also used in the longitudinal direction in the analytical model. The peak strain ε was 20.70 µε, and it occurred at the outside edge of the arch crown (the governing load location). It was also found that higher strains are produced when two trucks are on the bridge at one time. There is a 12% increase in the strain value at the governing load location from when one truck is on the bridge to when two trucks are present.
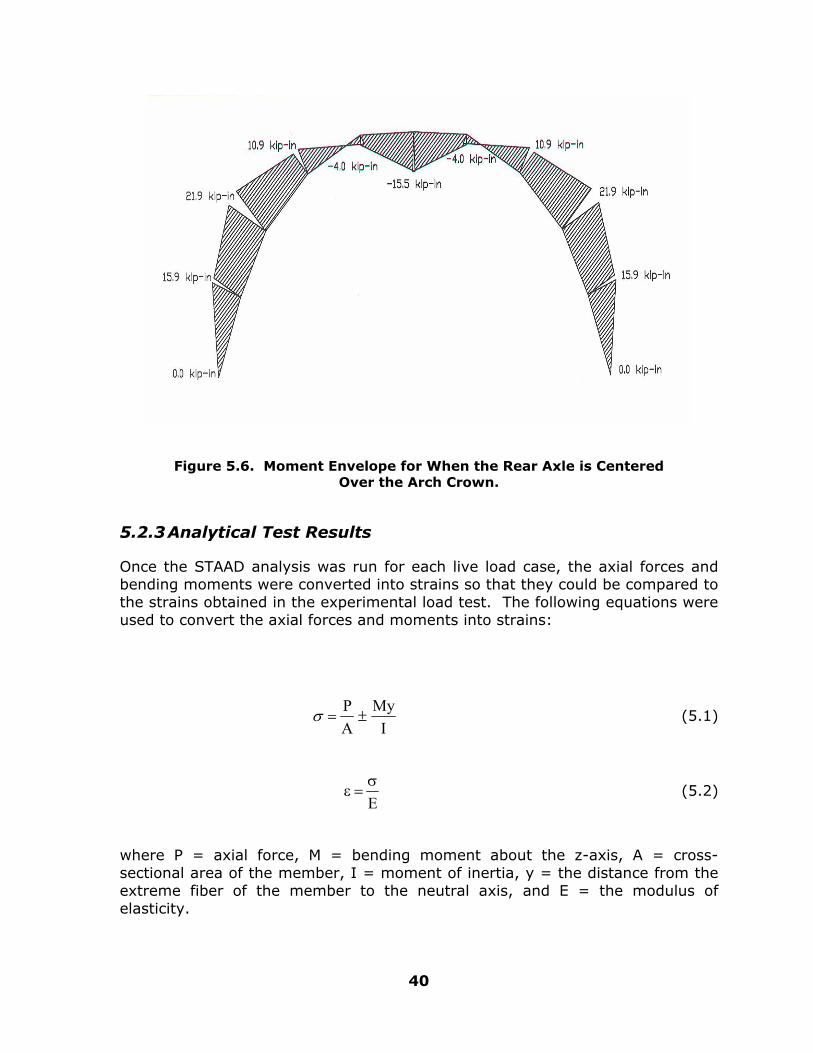
Analytical Method
Bridge 1-136 was modeled using ten tapered straight-line beam elements having a unit width. All of the load cases were representative of a single wheel load acting on a unit width of arch. In order to get to the final recommended bridge model, a series of load cases was explored. The refinement of the load cases was based on the comparison of the calculated strains and the measured strains on the bridge. Once the STAAD analysis was run for each live load case, the axial forces and bending moments were converted into strains so that they could be compared to the strains obtained in the experimental load test.
To determine the load rating for Bridge 1-136, the moment and axial force capacities at each node of the bridge model were calculated. Once this was done, the load rating factors were determined. Since DelDOT uses the load factor rating (LFR) method, that was the rating method used to rate Bridge 1-136. The load rating factors were calculated based on the axial loads and the bending moments for all load distributions and for concrete strengths of both 3,000 psi and 7,000 psi. It was determined that the rating factors due to bending moment and concrete strength of 3,000 psi governed. Inventory and operating ratings were determined. It was also necessary to determine the posting rating factor. Based on the recommended load distribution of 2V:4H, the posting load rating factor is 1.71 for a S335 truck type (similar to the test truck). According to this rating factor it would be possible to remove the load posting sign for Bridge 1-136.
Recommendations and Conclusions
The recommended load rating method for the arch bridges in the DelDOT inventory is basically the same as the one currently being used. The only difference is that the recommended method uses a different load distribution for the longitudinal and transverse directions. DelDOT is currently using the AASHTO load distribution of 2 units vertical to 1 unit horizontal, as opposed to the recommended distribution of 2
3
units vertical to 4 units horizontal. (This recommended distribution applies only to Bridge 1-136.) Similarly, the AASHTO load distribution was used as a starting point for the analysis described in this report. The posting level obtained using the AASHTO distribution was roughly half the value currently being used by DelDOT. DelDOT’s current posting rating factor for Bridge 1-136 is 0.66. This research yielded a rating of 0.31. It appears that the difference is due to the fact that the edge section, which has half the effective width, governs. When the recommended distribution of 2V:4H was used, a posting factor of 1.71 was determined. Since the recommended load rating method was based on only a single experimental load test, further verification is needed. Additional load tests can be performed on other arch bridges to determine whether this method is satisfactory.
Table of Contents Abstract..................................................................................................2 Executive Summary................................................................................3
Motivation for the Research .................................................................... 3 Background on Load Rating Methods........................................................ 3 Bridge 1-136 As a Case Study................................................................. 3 Experimental/Load Test Method .............................................................. 4 Analytical Method.................................................................................. 4 Recommendations and Conclusions.......................................................... 5
Chapter 1: Introduction.........................................................................6 1.1 Research Motivation ..................................................................... 6 1.2 Research Objective....................................................................... 7 1.3 Research Plan .............................................................................. 7
Chapter 2: Background Information ......................................................8 2.1 Prior Research ............................................................................. 8
2.2 Arch Load Rating Procedures in Use Today..................................... 13 2.2.1 MEXE Method....................................................................... 13 2.2.2 STAAD-III Method ................................................................ 16
2.3 DelDOT’s Current Load Rating Method........................................... 17 Chapter 3: DelDOT Arch Bridge Inventory ...........................................18 Chapter 4: Experimental Method/Load Test ........................................21
4.1 Method Description..................................................................... 21 4.2 Experimental Load Test Example .................................................. 21
4.2.1 Bridge Description .................................................................... 21 4.2.2 Setup of the Experimental Load Test ....................................... 22 4.2.3 Running the Experimental Load Test ....................................... 25 4.2.4 Experimental Load Test Results .............................................. 25
4.3 Summary of Results ................................................................... 31 Chapter 5: Analytical Method...............................................................35
5.1 Method Description..................................................................... 35 5.2 Analytical Method Example .......................................................... 35
5.2.1 Bridge Model ....................................................................... 35 5.2.2 Load Cases.......................................................................... 36 5.2.3 Analytical Test Results .......................................................... 40 5.2.4 Load Rating ......................................................................... 45
5.3 Summary of Results ................................................................... 49 Chapter 6: Recommendations and Conclusion .....................................51
6.1 Recommendations for Load Rating an Arch Bridge........................... 51 6.2 Conclusion ................................................................................ 52
References ...........................................................................................54 Appendix: Photographs of Bridge1-136...............................................55
2
Abstract
In the Delaware Department of Transportation (DelDOT) Bridge Inventory, there are 33 arch bridges, most of which were built over 75 years ago. Due to the age of these bridges, it is necessary to make sure that they are strong enough to carry the ever-increasing loads and volumes of traffic on today’s roadways. In order to do this, accurate methods for evaluating and rating arch bridges are needed.
Since there is currently no designated method of load rating arch bridges at DelDOT, a standard method needs to be established. The research conducted in this project aids in the development of an analytical method to load-rate arch bridges. In order to establish this new method, analytical modeling and experimental load testing were performed on DelDOT’s Bridge1-136. From the results, recommendations are made regarding future methods for evaluating and rating DelDOT’s arch bridges.
3
Executive Summary
Motivation for the Research
As the literature contains little information on evaluating the load-carrying capacity of arch bridges, the burden falls to bridge owners to develop their own methods for rating these bridges. Some research has been done on determining how to load rate masonry arches, virtually none has addressed the process for concrete arches. In Delaware, 27 of the 33 arch bridges in the bridge inventory are made of reinforced concrete, while only six are masonry. A majority of the arch bridges in Delaware are at least 75 years old and do not have existing plans or documentation. As a result, additional research was needed to establish a suitable rating methodology for concrete arch bridges.
Background on Load Rating Methods
Several methods have been explored for load rating of arch bridges, with most of the research being conducted outside the United States. DelDOT is currently using the STAAD-III computer software program to aid in load rating the arch bridges in their bridge inventory. This software package is not specific to arch bridges; rather, it is used to analyze and design a variety of structure types, including those made of truss, frame, and plate/shell elements. When an arch bridge is modeled using this software, it is represented as an assemblage of frame elements.
Once the arch is modeled, truck loads representing the various rating vehicles are applied. Then the bridge is analyzed using STAAD-III. Next, three influence lines are determined for the three critical arch sections. These critical arch sections are the midpoint of the arch, the quarter point, and at the springing. Basic principles are used to calculate the properties for the critical sections. The stresses are calculated at the critical sections. Once the influence lines are determined, the load ratings are determined. Then the arch is rated for the controlling sections. This method is the basis of the method developed in this report. The primary difference between STAAD-III and the proposed method is that effective width and live load distribution are altered based on load test results.
Bridge 1-136 As a Case Study
Bridge 1-136 is located in New Castle County, Delaware, north of Wooddale. It carries Barley Mill Road and crosses over a tributary of the Red Clay Creek. It is a concrete arch bridge with an 18-foot span length and a 9-foot rise. This bridge was built in 1932 and has never been reconstructed. The arch is circular in shape. Bridge 1-136 was chosen for this study because it was typical of the types of concrete arch bridges in Delaware’s bridge inventory. Its 18-ft. span length is close to the average of 25 ft. It is made of concrete, as are the
4
majority of the arch bridges in the inventory. Bridge 1-136 is also posted, which makes it a good candidate for load testing. If the load rating method developed shows that the load posting can be removed, it will indicate that the previous method of rating was conservative.
Experimental/Load Test Method
To determine whether the analytical method developed in this report is accurate to use when load rating arch bridges, a load test was conducted on Bridge 1-136 using two DelDOT dump trucks crossing the bridge in a variety of combinations, and the results were compared to those from the proposed method. The field tests showed that the governing load location is at the outside edge of the arch at the arch crown. This location sees the highest strains because there is limited ability for transverse load distribution at the edge of the arch. The calculated effective width beff (transverse load distribution) value was found to be 8.76 ft. This beff value was also used in the longitudinal direction in the analytical model. The peak strain ε was 20.70 µε, and it occurred at the outside edge of the arch crown (the governing load location). It was also found that higher strains are produced when two trucks are on the bridge at one time. There is a 12% increase in the strain value at the governing load location from when one truck is on the bridge to when two trucks are present.
Analytical Method
Bridge 1-136 was modeled using ten tapered straight-line beam elements having a unit width. All of the load cases were representative of a single wheel load acting on a unit width of arch. In order to get to the final recommended bridge model, a series of load cases was explored. The refinement of the load cases was based on the comparison of the calculated strains and the measured strains on the bridge. Once the STAAD analysis was run for each live load case, the axial forces and bending moments were converted into strains so that they could be compared to the strains obtained in the experimental load test.
To determine the load rating for Bridge 1-136, the moment and axial force capacities at each node of the bridge model were calculated. Once this was done, the load rating factors were determined. Since DelDOT uses the load factor rating (LFR) method, that was the rating method used to rate Bridge 1-136. The load rating factors were calculated based on the axial loads and the bending moments for all load distributions and for concrete strengths of both 3,000 psi and 7,000 psi. It was determined that the rating factors due to bending moment and concrete strength of 3,000 psi governed. Inventory and operating ratings were determined. It was also necessary to determine the posting rating factor. Based on the recommended load distribution of 2V:4H, the posting load rating factor is 1.71 for a S335 truck type (similar to the test truck). According to this rating factor it would be possible to remove the load posting sign for Bridge 1-136.
5
Recommendations and Conclusions
The recommended load rating method for the arch bridges in the DelDOT inventory is basically the same as the one currently being used. The only difference is that the recommended method uses a different load distribution for the longitudinal and transverse directions. DelDOT is currently using the AASHTO load distribution of 2 units vertical to 1 unit horizontal, as opposed to the recommended distribution of 2 units vertical to 4 units horizontal. (This recommended distribution applies only to Bridge 1-136.) Similarly, the AASHTO load distribution was used as a starting point for the analysis described in this report. The posting level obtained using the AASHTO distribution was roughly half the value currently being used by DelDOT. DelDOT’s current posting rating factor for Bridge 1-136 is 0.66. This research yielded a rating of 0.31. It appears that the difference is due to the fact that the edge section, which has half the effective width, governs. When the recommended distribution of 2V:4H was used, a posting factor of 1.71 was determined. Since the recommended load rating method was based on only a single experimental load test, further verification is needed. Additional load tests can be performed on other arch bridges to determine whether this method is satisfactory.
6
Chapter 1: Introduction
1.1 Research Motivation
While it is not simple to accurately load rate any existing bridge, it is especially difficult to evaluate the load-carrying capacity of arch bridges. There is plenty of information available on how to load rate steel or pre-stressed concrete girder bridges but no specific information in bridge evaluation manuals on how to load rate arch bridges. As a result, bridge owners need to develop their own method for rating arch bridges.
Some research has been done on determining how to load rate masonry arches, but for a concrete arch, little to no research has been conducted. In Delaware, 27 of the 33 arch bridges in the bridge inventory are made of reinforced concrete. Only six arch bridges are masonry. As a result, additional research was needed to establish a suitable rating methodology for concrete arch bridges.
Since arch bridges are more complicated to model and analyze than girder bridges, the methods used by engineers usually have high factors of safety. This can cause the bridges to have overly conservative load ratings. In some cases, overly conservative ratings can cause a bridge that does not need a load posting to be posted.
There is no obvious or simple method for analyzing arch bridges. The soil-structure interaction and the non-homogeneous quality of the structure can raise a lot of questions and concerns. Due to a lack of bridge plans in some cases, one must make assumptions about the material properties of the bridge, fill, etc.
The number, weight, and size of vehicles on a road change over time. Due to the necessity for effective roadways, engineers must make sure that all bridges are safe and able to handle the capacities of the vehicles traveling over them. Engineers need to establish the load-carrying capacity of arch bridges in order to determine if the bridges need to be replaced, rehabilitated, load posted, or have load postings removed. For example, if one determines that a bridge suspected of being too weak is actually strong enough to handle present and future loads, it can save the community money by eliminating the need to repair or reconstruct the bridge.
The strength of some arch bridges has been assessed on the premise that they are safe if they do not show signs of deterioration or distress. This assumption can be made only if one assumes that the present loading of the bridge will be the same as the projected future loading. One cannot use this assumption if the bridge is to carry heavier vehicles than it has in the past (Halden, 1995).
7
1.2 Research Objective
The objective of the research detailed in this report is to identify an accurate method for load rating arch bridges. At the present time, the Delaware Department of Transportation (DelDOT) is looking for an improved method to load rate the 33 arch bridges in their inventory. These bridges are made of reinforced concrete, stone masonry, and corrugated metal. A majority of the bridges are at least 75 years old and do not have existing plans or documentation.
To load rate a structure, the as-built plans are needed. If plans are not available, as is the case for many of the arch bridges in the DelDOT inventory, then a detailed site inspection must be conducted. Even if plans are available, field measurements should be taken so that the present condition of the bridge can be taken into account. Due to the age of the majority of Delaware’s arch bridges, many were designed for lighter truck loads. As a result, the engineers at DelDOT must assess the current bridge capacity in terms of today’s greater truck weights.
1.3 Research Plan
The purpose of this research is to determine a better way to accurately load rate concrete arch bridges in the Delaware bridge inventory. Both analytical and experimental techniques are explored. In Chapter 2, background information is given on the types of load rating methods currently being used in the United States and abroad. Also discussed are related research activities conducted on load rating of arch bridges. Chapter 3 presents a summary of the arch bridges in DelDOT’s bridge inventory. Chapter 4 describes an analytical method that was developed based on a literature review and input from DelDOT engineers. An example using this analytical method is then presented using Bridge 1-136 from the DelDOT bridge inventory. Chapter 5 describes an experimental/load test method and provides an example using the same bridge that was used in the analytical example in Chapter 4. This enables us to establish the reliability of the analytical method. In Chapter 6, recommendations are made regarding a method for rating arch bridges in Delaware. With an improved method for rating arch bridges, DelDOT will be able to evaluate these bridges in a more efficient manner, yet still ensure the safety of the traveling public.
8
Chapter 2: Background Information
2.1 Prior Research
There is not a lot of information on the subject of load rating methods for concrete arch bridges. Of the research that was found, virtually all dealt with masonry arches. Research on load rating of masonry arch bridges receives limited attention in the United States; however, the topic is researched often in the United Kingdom, Italy, and Australia. This means that the research and load rating methods conducted overseas need to be adapted and incorporated into the load rating practices here in the United States. An additional challenge exists, since the majority of arches in the DelDOT bridge inventory are made of concrete. This raises the question as to whether or not the load rating methods for masonry arch bridges can be adapted to concrete arch bridges.
Masonry arch bridges make up less than 1% of the total population of bridges in the United States. The number of these bridges that are in use is around 1000, and six of them are located in Delaware (Boothby and Roise, 1996). The other 27 arch bridges in the Delaware bridge inventory are made of concrete. Before the early 1900s, arch bridges were typically built of masonry units (Boothby and Anderson, 1995). At the present time, concrete is a more popular material to use. This is a trend that is seen in Delaware because most of the concrete arch bridges in the state’s bridge inventory were built after 1900.
A masonry arch is capable of ductile behavior. It can deform a significant amount while keeping its load-carrying capacity before it reaches its maximum load. Many arch bridges today that have distorted arch rings, but are still carrying load, demonstrate this phenomenon (Boothby and Anderson, 1995).
2.1.1 Boothby’s Method
Boothby et al., (2000) and Boothby (2001) have found that there is a definite distinction between the load effects along the length of the bridge span and the transverse effects. Arch bridge failures usually occur because of transverse failures like overturning or sliding of the spandrel walls and the beginning of cracks in the arch barrel. More research has been done, however, with the effects along the length of the span. To determine the effects along the length of the span, one can use a two-dimensional analysis. To determine the transverse effects, one needs a more complex three-dimensional analysis. In general, an arch bridge should be viewed as a complex three-dimensional structure.
The interaction between the fill and the masonry arch barrel should be taken into account in generating a finite element model of an arch bridge. The masonry should be simplified to a homogeneous isotropic material, and the failure criterion for concrete should be used. Boothby et al. concluded that in
9
order to model an arch, one should divide a unit width of arch ring into ten or more segments and give each of them appropriate geometric dimensions. There should be rigid supports in the vertical direction and elastic spring supports in the horizontal direction. The truck axle loads should be distributed through the fill at a slope of 2 vertical to 1 horizontal. One also needs to know the modulus of elasticity and the strength of the masonry, as well as the support horizontal spring constant. An HS-20 rating should be performed using the inventory and operating rating load factors in the AASHTO Manual for the Evaluation of Bridges (1994).
A masonry arch bridge responds to truck loading in the span direction in the following manner. First, compressive thrusts develop within the arch barrel. These forces are then transferred to the abutments. The arch bridge also responds to truck loading in the transverse direction. As a response to the lateral loading, lateral soil pressure is applied to the inside of the spandrel walls and wing walls. These forces can be harmful to the structure, causing pushing out or overturning of the spandrel wall. Longitudinal cracks can also develop in the arch barrel. This can cause the arch barrel to separate from the spandrel walls, or it can cause the spandrel walls to collapse. Longitudinal cracks can reduce the carrying capacity of the structure. If a structure does not have longitudinal cracks, it is usually an indication that the rating analysis of the bridge need be considered only in the span direction. Normally, bridges with thick arch barrels are not susceptible to adverse transverse effects. Bridges with thin arch barrels and deep fills tend to be vulnerable to adverse transverse effects.
Boothby (2001) presents a method for analyzing masonry arch bridges using elastic constraints based on evidence from a visual inspection. His method is validated by comparing the analytical results to the results of field tests conducted on several masonry arch bridges.
In this method, Boothby models the arch as an elastic frame structure with the arch ring divided into segments. The nodes at each end of the segments are given nodal coordinates, and straight segments are used to join these nodes. Spring supports allow horizontal translation, but vertical displacement or rotation is not allowed. As stated previously, ten segments are recommended for the model. The cross-sectional area and moment of inertia of each segment is based on a unit width of the arch ring. The effect of the spandrel wall is ignored. It is conservative to neglect the stiffening effects of the spandrel walls. Elastic spring stiffness is included for the horizontal supports at the abutments and interior piers. Abutment spring stiffnesses are usually greater than pier spring stiffness because of the passive earth pressure of the fill.
The self-weight can usually be calculated by the analysis program used (e.g., STAAD-III); in order to do this, one needs to know the cross-sectional area and density of the arch ring material. Superimposed dead load is based on the weight of the fill and pavement lying directly above the segment in question. This load is uniformly distributed over the element. The unit density of the fill
10
and pavement needs to be determined. The live load is represented as a linearly varying vertical pressure applied to the top of the arch ring. The live load is a truck axle load. The load is distributed through the fill at a slope of 2 vertical to 1 horizontal.
Boothby et al. (1997, 1998) load tested four bridges. These bridges were modeled using the aforementioned analytical method. The analysis for each bridge was conducted in accordance with the Manual for the Condition Evaluation of Bridges (AASHTO 1994). The envelope of axial force and moment can be drawn for each arch. The failure envelope is defined by the following equation:
0PP
PP
MM
41 2
ooo≤
+
− (2.1)
where Po = bhσo = maximum concentric axial force, Mo = 0.125bhσo = maximum moment, and σo = peak stress in the masonry. The load rating is determined by comparing the critical dead and live load axial thrust and moment at each node of the bridge to the axial thrust moment envelope given in the above equation. According to Boothby, this analysis method is reasonably accurate.
2.1.2 Walrath’s Method
Walrath (1991) presented a method of load rating masonry arch bridges using an iterative calculation that is simplified by using computer analysis software like STAAD-III. This method assumes a vehicle size of AASHTO H-20 or HS-20 and a lateral earth pressure constant of Ko = 0.25.
In this method, one must first model the shape of the arch to match the field measurements, so that it can be entered into the computer program being used. By applying unit loads to the arch segments, one can derive a table of influence coefficients for moments resulting at given joints from unit loads on each of the segments. The next step is to determine the arch segments that must be loaded in order to produce a maximum moment at each respective joint.
The first iteration of analysis gives the live load position that is most critical. Iteration two gives the revised gross vehicle size. The rated vehicle size is based upon the adjusted tire contact area. This iteration gives the most conservative load rating. Iteration three includes the passive lateral earth pressure coefficient caused by the deflection of the arch ring into the fill. This gives a less conservative load rating. The fourth iteration is a check of the third iteration. In the fifth and final iteration, all of the parameters are the same except that the minimum moment of inertia, Imin, is assumed throughout the arch ring.
11
2.1.3 Modes of Failure of Masonry Arch Bridges
Identifying collapse mechanisms assists in the visual inspection of arch bridges by helping to identify a pattern of expected damage. Sliding modes of failure are possible. Sliding modes may involve three sliding surfaces or a combination of sliding surfaces and hinges (totaling four). Sliding modes involving three surfaces occur more often in bridges with low rise/span ratios and thick arch rings. Combined hinging and sliding collapse modes occur more often in bridges with low rise/span ratios. Hinging collapse modes occur most often in bridges with high rise/span ratios and thin arch rings (Boothby, 1995).
Based on the allowable stress method of analysis, ten causes of masonry arch bridge failure have been determined (Walrath, 1991). They are as follows:
1. Crushing of masonry
2. Sliding of one voussoir upon another
3. One voussoir overturning about an adjacent voussoir
4. Shear
5. Buckling
6. Removing the falsework before the mortar has set
7. Loading the arch asymmetrically during construction
8. Settlement of the foundations
9. Sliding upon the foundations
10. Overturning about any point in the pier or abutment
2.1.4 Spandrel Wall Assessment
It is difficult to determine the resistance to failure of a spandrel wall (Thompson, 1995) because of the geometry of the wall, the nature of the masonry, and the manner in which the spandrel is connected to the wing wall and arch barrel. There are two failure modes for spandrel walls—tilting and sliding. Bulging may occur prior to tilting. Failures generally begin at the third or quarter points and continue in both directions. There is a linear relationship between the depth of fill and the spandrel wall pressure, which is in the at-rest state.
Furtado and Newton (1975) used a finite element model to analyze spandrel walls. They assumed that the arch was segmental with a granular fill that reached the parapet level. They also assumed that the spandrel was not
12
connected to the arch barrel. They stated that the spandrel’s support came from springing and continuity at its ends.
The British Rail Research’s NEWPAC FE package and the Georgia Institute of Technology’s STRUDL-1 program were used to analyze the spandrel. Loads were applied to the spandrel. One model represented the fill, and the other represented a 25-ton truck that crosses the bridge. A Boussinesq load distribution was used for the point loads. The spandrel was checked for overturning and for tensile and shear cracking.
Furtado concluded that dead load soil pressure is four times more important than live loads and that just before failure a vertical crack occurs at the crown and a 45° crack develops at the springing.
In order to assess the stability of spandrel walls, one must first resolve the weight of the wall and the forces acting on it. Next, one should check for sliding and bulging failure, or overturning. A Rankine analysis, using an active earth pressure coefficient, is then used to determine the lateral soil pressures. The fill is assumed to be granular material. Dividing the spandrel into strips and analyzing it with bending theory and statics is another simple method of analysis. This is a relatively good method to use when not much is known about the spandrel geometry.
When assessing spandrel walls, one needs to obtain information about distributing forces, resistance capacity, exposure conditions, and types of loading. High dead loads and superimposed dead loads have a greater chance of causing failure than live loads on most masonry arch bridges. A plastic Rankine analysis can be used to determine the pressure on the spandrel walls. To do this, one needs to have information about the soil. One should also be aware that the mortar and its condition affect the strength of the masonry material. Water, weathering, and high-frequency dynamic loads can degrade the mortar. This should be considered when evaluating the material strength.
2.1.5 Experimental Load Tests
Experimental load rating is another way to rate bridges. Load tests have been used by transportation departments throughout the country as an alternative to purely analytical methods. Experimental load rating, which results from field-testing, entails measuring the bridge’s response to live loads. The results obtained are then used in place of results obtained through a purely analytical method.
DelDOT inspects bridges every two years. When bridges are not able to carry the current state load limits, it may be because they were constructed using lower than current design loads or because the bridge has deteriorated from its original condition (Edberg, 1994). This is one reason that older bridges need to be inspected and rated. Some of the bridges may need to be posted, forcing trucks that are over the allowable gross vehicle weight to take an alternate
13
route. This places additional costs on the users of the commercial truck transport because the trucks must travel longer distances. DOT’s also place posted bridges at the top of their list for repair or replacement. A posted bridge that is capable of carrying legal loads but has been conservatively rated can lead a DOT to spend money replacing it when it might not be necessary (Edberg, 1994). This type of posted bridge is a perfect candidate for evaluation through experimental load rating. Experimental load ratings reflect the actual bridge condition. If the bridge is shown to be capable of carrying greater loads than previously thought, the bridge postings can be removed or lowered. Experimental load rating can lead to the determination that some bridges are stronger than initially thought.
DOT’s use several methods to rate bridges. They can use AASHTO guidelines, general computer programs for structural analysis, computer programs specifically for bridge rating, or a combination of these methods. Since there has been a decrease in the cost of electronic equipment used for field testing, and an increase in the need to best utilize all of the bridges in the infrastructure, whether they be old or new, experimental load rating has become a more common approach for critical bridges (Edberg, 1994).
AASHTO’s Manual for Condition Evaluation of Bridges (1994) mentions several types of nondestructive load tests that can be used to evaluate the variation of live loads and the effects of temperature changes and wind. Diagnostic load tests determine the effect of a known service live load on the bridge. Proof-load tests determine the maximum live load that a bridge can support through the use of factored truck loading. Ratings are based on the allowable stress method (ASD), load factor rating method (LFR), or the load and resistance factor rating method (LRFD). The ASD and the LFR are the most common methods, and using these methods one can readily determine the operating and inventory ratings for the bridge.
Piers and abutments should have at least the capacity of the superstructure member with the lowest rating (AASHTO, 1994). This can be determined only if one has the as-built plans, construction plans, inspection results, design calculations, and other important information. For bridges with unknown structural components, like reinforcement in concrete bridges, load tests can be conducted to aid in determining the load capacity. It is very important to know a bridge’s load rating because all bridges must be capable of carrying a minimum gross live load of 3 tons at the posting level (AASHTO, 1994). If not, the bridge should be closed, demolished, rehabilitated, or reconstructed.
2.2 Arch Load Rating Procedures in Use Today
2.2.1 MEXE Method
In the United Kingdom in the 1940s, there was an increasing amount of military vehicles on the roads. These military vehicles were much heavier than the
14
average vehicle that would normally cross the country’s large inventory of masonry arch bridges, causing the Military Engineering Experimental Establishment (MEXE) to develop an analytical technique, inspired by work done by Pippard, to assess arch bridges. The method that MEXE developed has been adapted for use by civilians. Based on this method, computer programs have been created to facilitate a more refined analysis (Halden, 1995).
The MEXE method is the most popular analysis technique used in the United Kingdom to evaluate masonry arch bridges. This method is used to determine the load carrying capacity of single span masonry arches with spans of up to 18 m, and it is considered to give conservative values when the arch span is over 12 m. It is recommended that this method not be used when the arch is deformed or flat. This method should be used only when the fill is compacted well, and it should not be used for open spandrel arch bridges. This is a fast and easy method to use. It is recommended that the MEXE method be tried before using a more sophisticated method (Department of Transport, UK, 1993).
There are uncertainties in current assessment techniques, worldwide. These uncertainties stem from limitations on the inspection of a particular bridge, inaccuracy of the assessment technique, and lack of knowledge or variability of the material properties. The last reason is due to a lack of bridge plans, because most arch bridges are relatively old and plans may have been lost or destroyed. Due to these uncertainties in the strength of the materials used to create the arch ring, BD 21/93, a load rating guideline provided by the United Kingdom’s Department of Transportation, provides a method in which the strength of the masonry can be determined from the strength of the individual blocks and the mortar type (Halden, 1995).
For the MEXE method, one needs to inspect the arch thoroughly and note the following dimensions:
1. Span length, L (m).
2. Rise of arch barrel at the crown, rc (m).
3. Rise of arch barrel at the quarter points, rq (m).
4. Thickness of arch barrel adjacent to the keystone, d (m).
5. Average depth of fill (between crown and quarter points), h (m).
There are other bridge parameters that one can determine during a bridge inspection, like the external edge of arch ring thickness, the condition of arch ring material, and the visible deterioration. However, even with thorough inspections, uncertainties such as the arch ring thickness at the center of the arch, the infill composition, and the deterioration in the interior of the bridge still may exist. The inability to assess the fill allows for even more uncertainties in the calculation of the resistance. Only approximate descriptions of the fill can be given, since one cannot easily take samples of the fill. Traffic loading and load
15
distribution can also introduce uncertainty when calculating load effects on the bridge (Department of Transport, UK, 1993).
When using the MEXE method, there is a specific manner in which one should model the arch ring. One should straight-line elements to represent the arch, with ten being the recommended number. There should be pinned supports at the springings, and the bridge should be modeled as a unit width in the transverse direction. A node should be placed at the 1/3 span section because it is the most critical section when it comes to figuring out the axle load capacity. The dead load should be applied as joint loads, and the live load can be applied as joint loads or uniformly distributed member loads. Load is distributed through the fill at a slope of 2 vertical to 1 horizontal. The effective width of the arch (w) in meters is determined by
w = h+1.5 (2.1)
where h is the fill depth in meters (Department of Transport, UK, 1993).
In the analysis there is also a need to check the adequacy of the spandrel walls and dry-stone walls. A visual inspection should be conducted in which the inspector notes the defects and their significance. Outward movement of the spandrel walls is due to dead and live load lateral forces caused by the fill and vehicular impact. The wall may rotate outward from the arch barrel, slide on the arch barrel, displace outwards while taking part of the arch ring with it, or bulge (Department of Transport, UK, 1993).
When using the MEXE method, one must assume that the arch is parabolic, has a span/rise ratio of 4, is without cracks, is made of good quality masonry, has well-defined joints, and has good abutments. A nomograph is used to assess the idealized arch. Given the arch span length and crown thickness, one can determine the provisional axle loading in tons. Since the actual arch bridge may be different from the idealized arch, the idealized assessment is multiplied by a modification factor in order to determine the actual assessment (Department of Transport, UK, 1993).
In order to determine the modification factor, the following information is needed:
1. The type of material used for the arch barrel.
2. The type of construction of the arch barrel.
3. The condition of the materials in the barrel.
4. The deformation of the arch barrel from its original shape.
5. The positions of dropped voussoirs and the amount of drop.
6. The width, length, number, and position of cracks.
7. The type of fill above the arch and its condition.
16
8. The position and size of services.
9. The width of mortar joints.
10. The condition of joint mortar.
Once the modification factor is calculated, one can determine the modified axle load. This is determined by multiplying the provisional axle loading (PAL) by the condition and modification factor. The modified axle load represents the allowable loading on the arch from a double axle bogie (truck) configuration with no “lift-off” from any axle. The modified axle load is now multiplied by the axle factors given in Figure 3/5 of The Assessment of Highway Bridges and Structures (BA 16/93) (Department of Transport, UK, 1993). This gives the allowable axle loads for single or multiple axle trucks. The arch bridge’s capacity is determined using Table 3/6 of the previously mentioned manual.
The allowable axle load represents the strength of only the arch barrel. If the spandrel walls, wing walls, etc. affect the bridge strength, one should determine whether the barrel or the spandrel wall, etc. has a lower strength. The lowest value should represent the bridge strength.
The ultimate live load capacity is determined to be the load at which the maximum compressive fiber stress is equal to the compressive strength of the masonry. To get the allowable live load, one multiplies the ultimate capacity by the joint and condition factors, Fj and Fc, respectively. One must also multiply by the partial safety factor for load γfl (Department of Transport, UK, 1993).
According to The Assessment of Highway Bridges and Structures, there is an alternative to the Modified MEXE method. It is a two-dimensional elastic method that represents a computerized version of the Pippard/MEXE method. This method is more flexible than the normal MEXE method. One can use the computer program MINIPOINT, or any comparable program, to carry out the analysis. Only joint and condition factors are required. This method is more accurate than the normal MEXE assessment.
2.2.2 STAAD-III Method
STAAD-III is a computer software program that is used to analyze and design many different types of structures. It can analyze structures made of truss, frame, and plate/shell elements. Loads on the structure can be joint loads, member loads, temperature loads, moving loads, or time varying loads. When an arch bridge is modeled, it is represented as an assemblage of frame elements. The dead load for the arch includes self-weight and superimposed dead loads. These are represented as joint and/or member loads. The live load on the arch bridge can be represented as a moving load or as member loads at different positions along the arch length. To evaluate a bridge, we are most interested in what happens when standard rating vehicles cross the bridge. These rating vehicles have defined specifications for axle loads and axle
17
spacings. The engineer defines the intervals at which the vehicles are moved across the bridge. The live loads can be applied to either a three-dimensional space frame model or a two-dimensional plane frame model. Typically, a two-dimensional plane frame model is adequate.
There are many types of output data that can be obtained from computer programs such as STAAD-III. Axial, flexural, and shear stresses in the components of the structure can be determined. These values are available for each load case.
2.3 DelDOT’s Current Load Rating Method
DelDOT is currently using the STAAD-III computer software program to aid in load rating the arch bridges in their bridge inventory. Any comparable plane frame computer analysis program can be used to rate the arch. The bridge in question is modeled by at least ten straight elements. Since the thickness of the arch is usually not constant, the cross-sectional area of each element is the average of the thickness at the end of each segment of the bridge. Each element can also be modeled as a tapered element with a changing cross-sectional area along the length of the element. Each element is given the appropriate material properties. A plane frame analysis is used. Where more than 8 feet of fill are present, the live load acting on the arch is neglected. Where the fill is less than 2 feet, the live load is treated as a point load. Everywhere else, the live load is distributed through the fill with a slope of 2 vertical to 1 horizontal in the transverse and longitudinal directions.
Once the arch is modeled, different truck loads representing the various rating vehicles are applied. Then the bridge is analyzed using STAAD-III. Next, three influence lines are determined for the three critical arch sections. These critical arch sections are the midpoint of the arch, the quarter point, and at the springing. Basic principles are used to calculate the properties for the critical sections. The stresses are calculated at the critical sections. Once the influence lines are determined, the load ratings are determined. Then the arch is rated for the controlling sections. This method will be the basis of the method developed herein. The primary differences with the proposed method are that effective width and live load distribution are altered based on load test results.
18
Chapter 3: DelDOT Arch Bridge Inventory
There are a total of 33 arch bridges in the DelDOT Bridge Inventory. Six of them are made of masonry, and the remaining 27 are made of reinforced concrete. Table 3.1 shows some important information about each bridge. It is important to note that 82% of DelDOT’s arch bridges are made of concrete; however, the majority of research found on the subject of load rating arch bridges involves masonry arch bridges.
A majority of the bridges (67%) have plans readily available to aid in the load rating process. Since some of the bridges do not have plans available (those designated as “year built 1900”—a default value), it makes it more difficult to load rate these structures. For these arch bridges, a field inspection of the bridge must be conducted so that the exact bridge dimensions can be determined. Bridge inspections are performed on each bridge regardless of whether or not plans are available; however, these inspections usually do not include measuring the bridge dimensions.
A significant percentage of the arch bridges in DelDOT’s inventory (42%) are designated as being built during or before 1900 (this designation is also applied to bridges for which no plans are available and the actual construction date is unknown). In either case, these bridges are all likely to be quite old, and approaching or exceeding their original design life. Of the remaining arch bridges, eight were built between 1901 and 1920, four between 1921 and 1930, and five between 1931 and 1940. The two remaining bridges on the list were built in 1956 and 1991. Fourteen of these bridges have had some type of reconstruction. Due to the old age of these bridges, it is important to ensure that they are still able to withstand the current live loads as well as potential increased future live loads.
Two of the arch bridges are currently posted with weight restrictions. One of them, Bridge 1-136, will be analyzed later in this report, and it will be discovered that the load posting for this particular bridge can potentially be removed.
The arch bridges in DelDOT’s inventory are all relatively short spans, with an average of 25 ft. Eight of the bridges are 10 ft or under; ten are between 11 and 20 ft; four are between 21 and 30 ft; three are between 31 and 40 ft; four of the bridges are between 41 and 50 ft; two are between 51 and 60 ft; and one is over 60 ft.
The bridge shapes range from circular to elliptical. Most of the bridges’ superstructures, substructures, and decks are in good condition; however, some do have very low condition ratings in these areas. The bridges with low condition ratings are prime candidates for more thorough load rating.
19
Table 3-1: DelDOT Bridge Inventory
Bridge Number Material Year
Built Year
Reconstr. Span
Length (ft) ADT ADTT Posting Level
Superstruct.Cond. Rating
1-001A Masonry 1900 1995 25 9148 640 Yes 4
1-091 Concrete 1900 N/A 10 1036 73 No 5
1-120 Concrete 1922 N/A N/A 1867 131 No 4
1-136 Concrete 1931 N/A 18 1231 62 Yes 5
1-160 Concrete 1931 N/A 50 20091 603 No 6
1-177 Masonry 1900 1965 20 3639 255 No 7
1-229A Concrete 1900 1958 50 31973 1918 No 6
1-233 Concrete 1900 N/A 16 3922 196 No 5
1-276 Concrete 1991 N/A 42 9230 738 No 8
1-311 Concrete 1900 1930 8 5805 1161 No 5
1-336 Concrete 1922 N/A 64 10800 756 No 6
1-337 Concrete 1900 1932 9 1902 133 No 7
1-348 Concrete 1900 1932 8 1902 133 No 7
1-383 Concrete 1900 N/A 12 283 42 No 8
1-488S Concrete 1920 N/A 42 16845 2695 No 6
1-515N Concrete 1929 N/A 20 18523 3149 No 7
1-515S Concrete 1920 1941 20 18523 3149 No 7
1-550 Masonry 1900 1919 15 12842 642 No 3
1-554 Masonry 1900 1956 16 16941 847 No 7
1-576 Concrete 1922 1966 8.2 4329 216 No 6
1-617 Masonry 1900 N/A 9 4270 299 No 7
1-698B Concrete 1900 N/A 36 6292 315 No 5
2-003C Concrete 1937 N/A 28 18405 920 No 4
2-023A Concrete 1934 N/A 52 9065 544 No 7
2-027A Concrete 1919 1957 32 9638 578 No 7
2-027B Concrete 1919 1957 32 12904 774 No 8
2-039C Masonry 1900 N/A 10 4060 406 No 6
2-040C Concrete 1931 N/A 11 100 0 No 6
2-067A Concrete 1956 N/A 60 6968 557 No 7
2-104B Concrete 1920 1934 20 8355 668 No 6
3-202 Concrete 1919 N/A 24 4440 444 No 8
3-659 Concrete 1920 N/A 28 5616 393 No 8
3-823 Concrete 1913 1948 8 1871 262 No 5
20
DelDOT inspects all of their bridges every two years, which a historical profile to be developed for each bridge. Each inspector notes all of the physical changes on the bridge since the last inspection. For example, many of the arch bridges exhibit spalling of concrete along the outside edges of the arch, as well as small superficial cracks along the arch barrel. Making a note of these problems every two years makes it possible to see how the bridge ages. One is able to notice whether a particular crack is growing or whether the crack width has stayed the same over the past two years. During each inspection, there is a checklist of things that the inspector looks at:
• Debris/sediment in channel
• Channel capacity/roadway overflow risk
• Stream/river bank conditions
• Foundation condition
• Presence of local scour
• Spalling of concrete
• Presence of cracks
Bridge 1-136 was chosen for this study because it was typical of the types of concrete arch bridges in Delaware’s bridge inventory. This bridge has a span length of 18 ft., where the average span length is approximately 25 ft. It is made of concrete, as are the majority of the arch bridges in the inventory. Bridge 1-136 is also posted, which makes it a good candidate for load testing. If the load rating method developed shows that the load posting can be removed, it will indicate that the previous method of rating was conservative.
21
Chapter 4: Experimental Method/Load Test
4.1 Method Description
There are several reasons that one might conduct a load test on a particular bridge. There may be no plans available for a bridge. Someone may be developing an analytical method to load rate bridges, and they need to conduct a load test in order to have data to compare to their analytical method. Sometimes a researcher would like to know how a bridge responds to cyclical loads or loads over a certain period of time. In this instance, it is necessary to instrument the bridge and leave the gages in place for a certain period of time. Whatever the specific reason for the experimental load test, such tests can be extremely beneficial in evaluating bridges.
In an experimental load test, the bridge in question can be instrumented with strain gauges or strain transducers at critical locations on the bridge. These gages are connected to a computer that records strains in bridge elements due to either ambient traffic or a known truck load. Using a truck of known weight, a diagnostic load test can be conducted. For this type of test, the truck crosses the bridge at a crawl speed and a data-acquisition system records the strains. After the test is completed, strain vs. location and strain vs. time plots can be generated. In addition, the maximum and minimum strains at each gage location can be determined. The data is then evaluated in order to characterize the bridge response and to identify key response parameters (such as transverse load distribution). These parameters are used to help accurately rate the bridge.
4.2 Experimental Load Test Example
To determine whether the analytical method developed in this report is accurate to use when load rating arch bridges, a load test was conducted on Bridge 1-136, and the results were compared to those from the proposed method. As mentioned earlier, this bridge is representative of concrete arch bridges in DelDOT’s inventory, and was the one agreed upon in consultation with DelDOT engineers.
4.2.1 Bridge Description
Bridge 1-136 is located in New Castle County Delaware, north of Wooddale. It carries Barley Mill Road and crosses over a tributary of the Red Clay Creek. It is a concrete arch bridge with an 18-foot span length and a 9-foot rise. This bridge was built in 1932 and has never been reconstructed. The arch is circular in shape. At the present time this bridge is posted. Selection of this bridge was made with the idea that the resulting evaluation might result in justification for removal of the current posting. Photograph 1 in the Appendix shows the bridge
22
posting sign at the bridge site. The bridge is in fairly good condition; however, there is some spalling of concrete and superficial cracks. Around the outer edges of the arch ring, the areas where spalling has occurred, patching has been attempted. In most cases the patches are now soft and delaminated. In some places at the arch edges the steel rebar is exposed. Photograph 2 in the Appendix and Figure 4.1 below shows the bridge in question.
Figure 4.1. Plans of Bridge 1-136.
4.2.2 Setup of the Experimental Load Test
Based on the geometry of the arch model used in the computer analysis portion of the work described in Chapter 5, the strain transducer locations for the test were determined. The finite element model uses ten line elements to represent the arch. In relation to this model, and as shown in Figure 4.2, the gages for the test were placed in the center of members 1-4 and 7-10 (see Figure 5.1 for element numbers). A gage was also placed in between members 5 and 6 (at the arch crown). Strain transducers were also placed transversely along the arch crown at 3-foot spacing (see Figure 4.3).
23
Figure 4.2. Gage Locations Around the Arch.
Figure 4.3. Gage Locations Along the Arch Centerline.
All strain transducers were applied to the underside of the arch. After the exact gage locations were marked, the concrete surface was prepared. The dirt and debris at the gage location were removed with a wire bristle brush. Then a quick-setting 2-part epoxy was applied to the gage, and it was secured in the proper position. There were also several transducers (339, 532, 304, 315, and 296) that were anchored to the arch using nails. This was done so that a comparison could be made between the results from the anchored transducers and the ones that were attached using only epoxy (to ensure the bonded gages
24
were not slipping). Gage numbers and their locations were recorded. After the gages were in position, they were connected to the data acquisition system so that the strains could be recorded as load was applied to the arch.
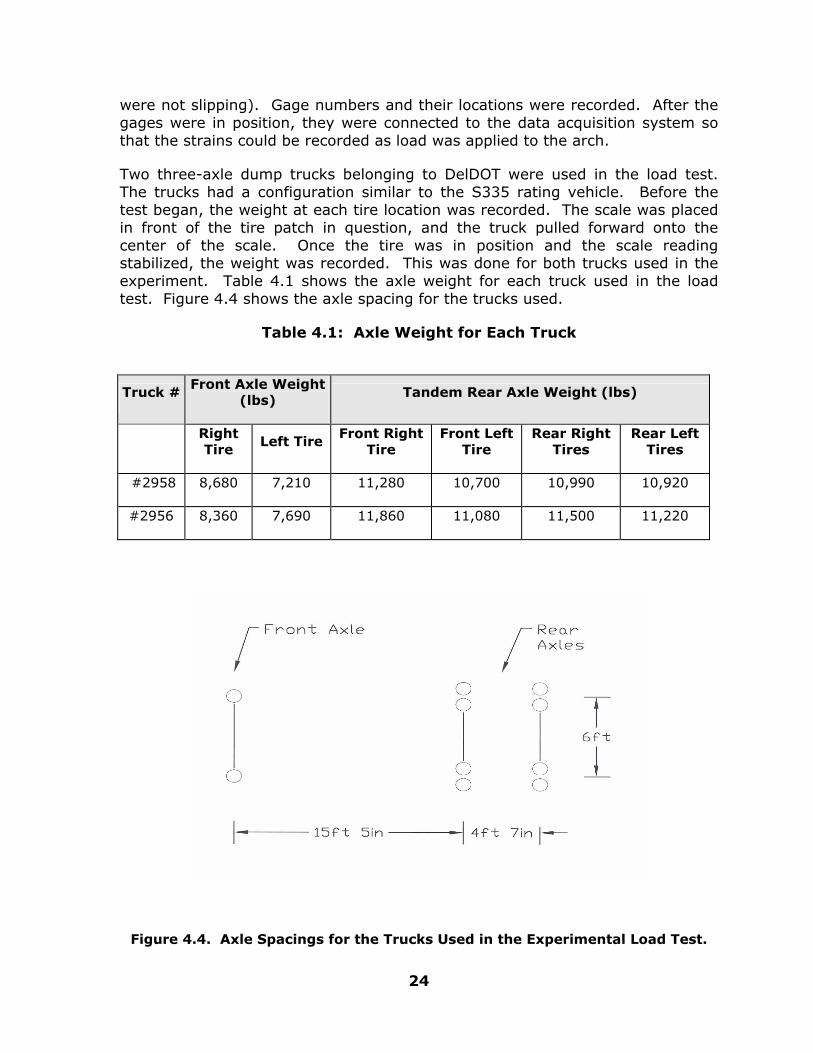
Two three-axle dump trucks belonging to DelDOT were used in the load test. The trucks had a configuration similar to the S335 rating vehicle. Before the test began, the weight at each tire location was recorded. The scale was placed in front of the tire patch in question, and the truck pulled forward onto the center of the scale. Once the tire was in position and the scale reading stabilized, the weight was recorded. This was done for both trucks used in the experiment. Table 4.1 shows the axle weight for each truck used in the load test. Figure 4.4 shows the axle spacing for the trucks used.
Table 4.1: Axle Weight for Each Truck
Truck # Front Axle Weight
(lbs) Tandem Rear Axle Weight (lbs)
Right Tire
Left Tire Front Right
Tire Front Left
Tire Rear Right
Tires Rear Left
Tires
#2958 8,680 7,210 11,280 10,700 10,990 10,920
#2956 8,360 7,690 11,860 11,080 11,500 11,220
Figure 4.4. Axle Spacings for the Trucks Used in the Experimental Load Test.
25
4.2.3 Running the Experimental Load Test
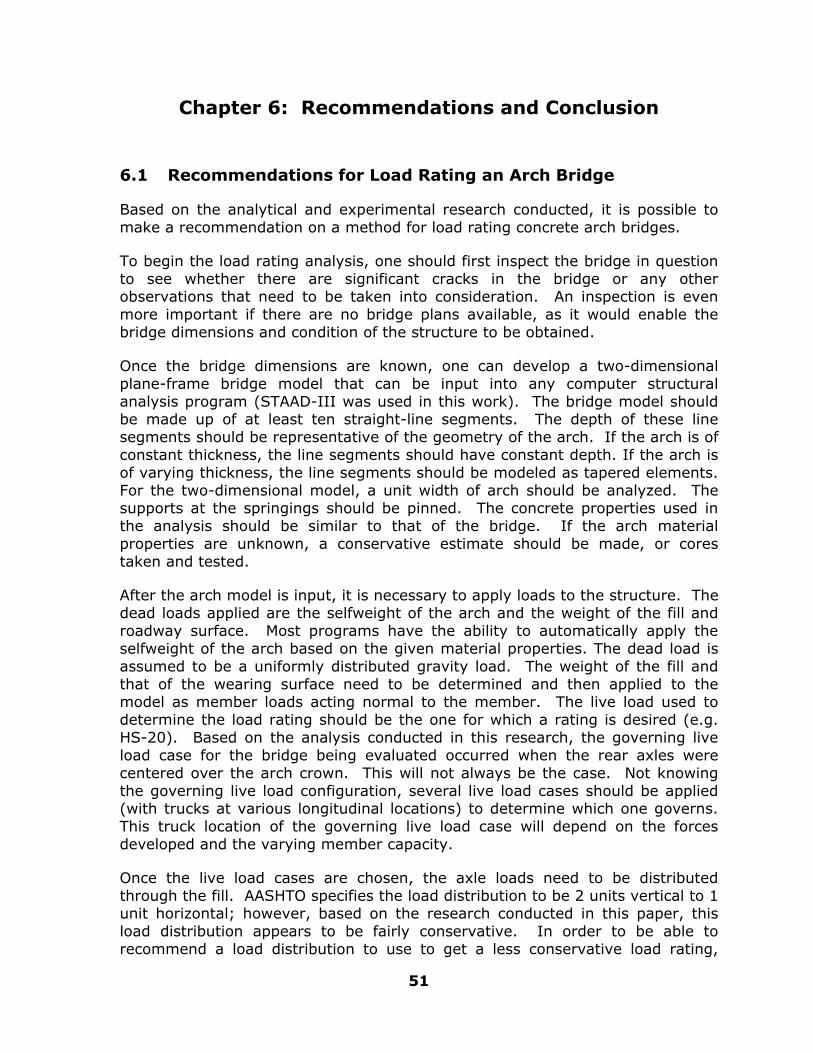
Once the transducers were attached and the trucks were weighed, the load test was conducted. When the computer system was ready, the trucks were signaled to begin moving slowly across the bridge. In some cases, one truck crossed the bridge followed by the other. In these cases, truck #2958 always crossed the bridge first. In other cases, the trucks passed over the bridge side-by-side. For the side-by-side tests, Truck #2958 was on the right and truck #2956 was on the left. All truck passes traveled across the bridge from north to south. In total, four truck passes were conducted. They were as follows:
1. One truck behind the other in the right lane.
2. One truck behind the other in the left lane.
3. Both trucks side by side.
4. Both trucks side by side with the truck in the right lane approximately 6 feet in front of the other truck (to match the skew of the bridge).
Pass #1 represents vehicles traveling in the right lane. Pass #2 represents vehicles traveling in the left lane. Passes #3 and #4 represent when two vehicles are crossing the bridge at the same time side-by-side. The second truck for passes #1 and #2 allows repeatability of the results to be verified.
Safety was an extremely important issue when the load test was conducted. Because, traffic was allowed to travel across the bridge, between tests, flaggers stopped traffic for each pass.
After the passes were conducted, the strain transducers were removed. Finally, dimension measurements of the arch were taken so that accurate values would be used in the analytical model.
4.2.4 Experimental Load Test Results
After the load test was completed, the data collected was converted into understandable graphs and tables so that it could be analyzed and compared to the analytical method. Since each transducer was given a number and their locations were known, the strain values for each transducer were organized in the order in which they were located along the arch.
Knowing data was taken at 5 Hz during the tests, strains vs. time graphs were created for each pair of gages (symmetric gages on the arch). Maximum strain vs. gage location graphs were developed. Strain vs. gage location graphs were also developed for the time when the front axle was over the arch crown and the time when the rear axle was centered over the arch crown (this was believed to be the critical load case). A graph was also made for the comparison of symmetric gages around the arch ring when the front axle of truck #2958 was over the arch crown. Finally, a table was created that shows the maximum positive and negative strain at each gage location for each pass (see Tables 4.2
26
and 4.3). Tables 4.2 and 4.3 aid in comparing the effect of one vs. two trucks on the bridge response. All of the above described graphs and tables will be shown and explained at the end of this chapter.
Table 4.2. Maximum tension strain at each gage location.
Based on the strain data, it was determined that there were two important locations on the particular arch tested that need to be considered when one is calculating the load rating. These two locations are both at the arch crown, with one at the centerline, and the other at the outside edge of the arch. In the load test, these two locations were monitored by gages #308 and #314 respectively. In the majority of cases, the outside edge gage recorded the largest strains. This location experiences the largest strains due to limited ability for transverse load distribution at the edge of the arch (similar to an edge girder in a slab-on-girder bridge). Three of the four passes demonstrated this trend. However, since only the west edge of the arch was gaged, pass #2, which had both trucks traveling in the left lane (not the half of the bridge that was gaged), had maximum strains at the bridge centerline. If there were gages on the east side of the arch, the outside edge gage on the left of the bridge would have experienced the highest strain value.
Pass #2 was most useful in evaluating transverse load distribution away from the trucks. Using the data from pass #2, the value for the effective width beff was determined. This value was critical for developing the analytical model in
27
Chapter 5. The value of beff describes the length that the tire load is distributed over in the transverse direction. To determine this value, the magnitude of strain vs. transverse location along the arch crown was plotted for the time when the front axle was directly over the crown (see Figure 4.5). The area under the curve was calculated from the y-axis to the edge gage location. This area was then divided by the peak crown strain value (3.549 µε) to determine the effective width. The calculated beff value is 8.76 feet. Using the beff value, one can utilize simple beam analysis in which uniform strains at the peak value occur across a member width of beff. As Figure 4.5 shows, the actual strain distribution is much wider than the beff, but not uniform.
Strain vs. Location along the arch crown when the front axle is over the crown
0.0
0.5
1.0
1.5
2.0
2.5
3.0
3.5
4.0
4.5
-4.0 -2.0 0.0 2.0 4.0 6.0 8.0 10.0 12.0
Gage Location (ft)
Mic
rost
rain
Figure 4.5. Graph used to obtain beff. Data is from Pass #2.
A lot of data was recorded during the load test, and only representative plots will be shown in this thesis. The data obtained was used to create easily readable graphs, and results for data involving Pass #1 (see Figures 4.6 through 4.15) will be shown.
Figures 4.6 through 4.11 show strain time histories recorded during Pass #1. These graphs were helpful in determining when each axle of the truck was over the arch crown. The smaller peaks on the figures represent when the front axle of each truck is over the arch crown. The larger peaks show when the two rear axles are centered over the bridge crown. Figure 4.11 shows the response of all gages mounted on the arch crown. These have the largest response and are easiest to interpret.
28
Strain vs. Time
-2.0
-1.5
-1.0
-0.5
0.0
0.5
1.0
1.5
0 5 10 15 20 25 30 35 40 45
Time (sec)
Mic
rost
rain
Gage#339
Gage#345
Gage#344
Figure 4.6. Strain vs. Time for gages 339, 345, and 344 (Pass #1).
Strain vs. Time
-8.0
-7.0
-6.0
-5.0
-4.0
-3.0
-2.0
-1.0
0.0
1.0
2.0
0 5 10 15 20 25 30 35 40 45
Time (sec)
Mic
rost
rain
Gage#532
Gage#306
Figure 4.7. Strain vs. Time for gages 532 and 306 (Pass #1).
29
Strain vs. Time
-10.0
-8.0
-6.0
-4.0
-2.0
0.0
2.0
4.0
0 5 10 15 20 25 30 35 40 45
Time (sec)
Mic
rost
rain Gage
#304
Gage#533
Figure 4.8. Strain vs. Time for gages 304 and 533 (Pass #1).
Strain vs. Time
-12.0
-10.0
-8.0
-6.0
-4.0
-2.0
0.0
2.0
4.0
6.0
0 5 10 15 20 25 30 35 40 45
Time (sec)
Mic
rost
rain
Gage#315
Gage#346
Figure 4.9. Strain vs. Time for gages 315 and 346 (Pass #1).
30
Strain vs. Time
-6.0
-4.0
-2.0
0.0
2.0
4.0
6.0
8.0
10.0
12.0
0 5 10 15 20 25 30 35 40 45
Time (sec)
Mic
rost
rain Gage
#308
Gage#296
Figure 4.10. Strain vs. time for gages 308 and 296 (Pass #1).
Figure 4.11. Strain vs. Time for gages 314, 303, 342, 298, 296, 308, and 294 (Pass #1).
31
Many key results were determined from the load test data. The maximum positive microstrain (tensile strain) was 20.7 µε, and it occurred during Pass #3 at the edge gage (#314). During Pass #3, the trucks traveled side-by-side across the bridge. The increase in the live load on the bridge—combined with the fact that at the edge of the arch, stresses can be distributed in only one direction—resulted in this maximum strain. The maximum negative microstrain (compression strain) was –10.15 µε, and it also occurred during Pass #3. It occurred at gage #304 (see Figure 4.2 for the exact location).
From Tables 4.2 and 4.3 it is possible to differentiate between the effects of one or two trucks. The strains are noticeably higher for Passes #3 and #4 because these two passes involve two trucks crossing the arch.
Figures 4.12 and 4.14 show the strains obtained from the gages longitudinally along the arch at the centerline. Each gage location is measured from the arch crown outward. Figures 4.13 and 4.15 show the strains obtained from the gages transversely along the arch at the crown. Each gage location is measured from the centerline of the roadway. Figures 4.12 and 4.13 give the strains for when the front axle of the truck is over the crown, and Figures 4.14 and 4.15 give the strains for when the rear axles of the truck are centered over the arch crown.
Figures 4.13 and 4.15 aid in comparing the live load effects of the edge vs. center gages. Whether there are two trucks or one truck on the arch, the strain at the edge gage (#314) was always larger than the center gage (#308). This occurs due to a similar phenomenon that takes place on the edge girder of a slab-on-girder bridge. The edge of the bridge ends up taking more strain because the live load forces can distribute transversely in only one direction.
It is possible to compare the strains at the crown and the base of the arch by looking at Figures 4.12 and 4.14. One can see that when the front or rear axles are over the bridge crown, the strains at the crown are larger than the strains near the base. It is expected that the strain at the crown would be the largest value because the axle load is acting directly over this point.
4.3 Summary of Results
The following is a summary of the key findings from the field tests:
• The governing load location is at the outside edge of the arch at the arch crown. Gage #314 recorded the strains for this location. This location sees the highest strains because there is limited ability for transverse load distribution at the edge of the arch.
• Pass #2 aided in helping to find the effective width beff (transverse load distribution). The calculated beff value is 8.76 ft. This beff value was also used in the longitudinal direction in the analytical model.
32
• The peak strain ε was 20.70 µε, and it occurred at the outside edge of the arch crown (the governing load location) during Pass #3.
• As observed in Tables 4.2 and 4.3, higher strains are produced when two trucks are on the bridge at one time. There is a 12% increase in the strain value at the governing load location from when one truck is on the bridge to when two trucks are present.
Strain vs. Location along the arch at the centerline when front axle is over crown
Figure 4.14. Strains longitudinally along the arch centerline, rear axles over crown (Pass #1).
34
Strain vs. Location along the arch crown when rear axles are over crown
0.0
2.0
4.0
6.0
8.0
10.0
12.0
14.0
16.0
18.0
20.0
-4.0 -2.0 0.0 2.0 4.0 6.0 8.0 10.0 12.0
Gage Location (ft)
Mic
rost
rain
Figure 4.15. Strains transversely along the arch crown, rear axles over crown (Pass #1).
35
Chapter 5: Analytical Method
5.1 Method Description
To conduct an analytical analysis, one first needs to develop a model for the bridge. The bridge dimensions are taken from the plans or measured at the bridge site. When modeling an arch bridge, it is acceptable to model the arch using straight-line elements and a plane frame model. Based on the literature reviews, researchers have found that ten elements will yield acceptable results. Depending on whether or not the arch ring is of a consistent or varying depth, the beam elements can be tapered or of constant depth. The nodes of the arch model are defined according to an x-y coordinate system. This also enables the model to be duplicated easily in other computer programs such as AutoCAD. The arch bridge material also has to be defined in the model. This is done based on either the as-built specifications or field tests. The support type at each end of the arch also needs to be defined.
Once the parameters for the model are established, they should be entered into a computer analysis program like STAAD-III. Next, one needs to define the applicable live and dead loads. The loads can be applied as point loads or uniform loads depending on what one has to model. The selfweight of the arch, as well as the weight of fill, is also included in the model.
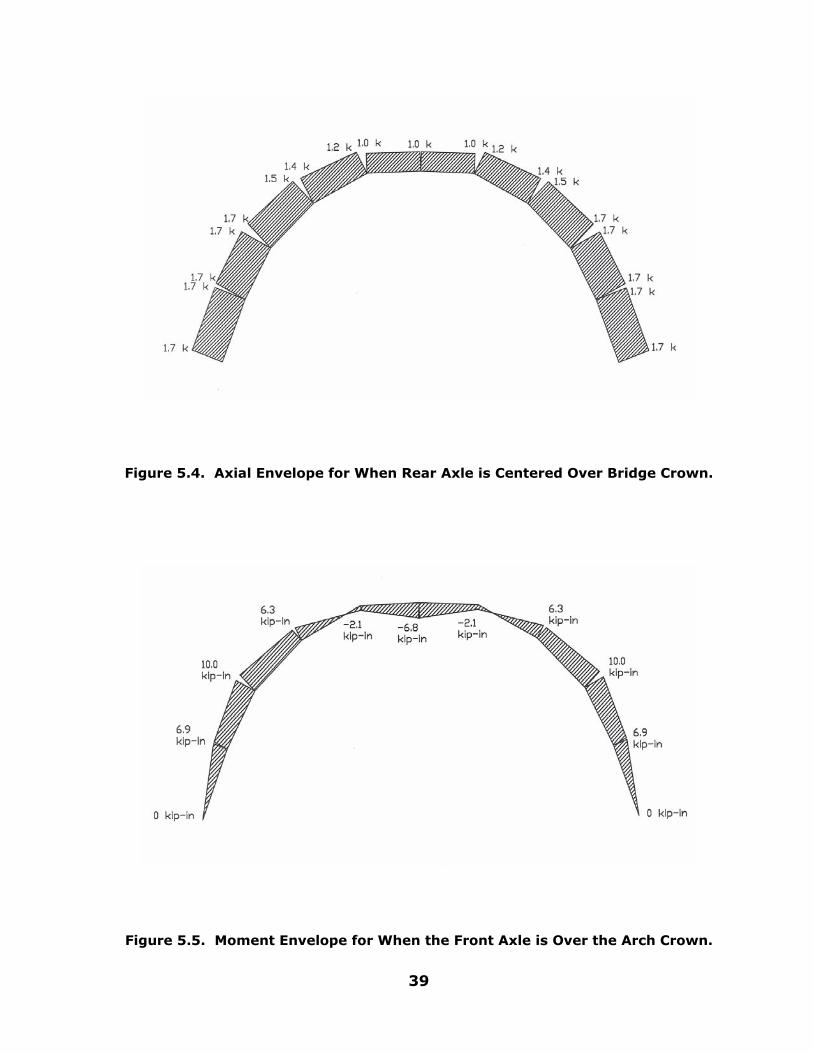
After the loads are applied, an analysis is run to determine the forces and moments in the bridge elements, and the deflections they produce. If a comparison is being made between the analytical model and strain results from an experimental load test, it is necessary to convert the axial forces and moments in each member to the corresponding strains. By comparing the experimental and analytical results, it is possible to refine the bridge model and/or the loading used to get better agreement. This is done by using the test results to compute more accurate parameters such as load distribution. Getting exact agreement between an analytical and experimental model is not expected, since arches with fill are complex structures.
Once the strains, axial forces, and moments are determined at the critical sections, one can load rate the arch in question.
5.2 Analytical Method Example
5.2.1 Bridge Model
Ten tapered straight-line beam elements having a unit width were used to model Bridge 1-136 (see Figure 5.1). A description of Bridge 1-136 was given in Section 4.2.1. The depth at the end of each element was determined from the depth of the arch ring at the corresponding location along the arch. The arch
36
ring depth ranged from 2.805 ft to 0.75 ft. The modulus of elasticity for the concrete was taken to be 3,150 ksi, with a Poisson’s ratio of 0.17 and a density of the concrete of 8.68x10⁻⁵ kips/in3.
Figure 5.1. Bridge Model
5.2.2 Load Cases
All of the load cases were representative of a single wheel load, acting on a unit width of arch. In order to get to the final recommended bridge model, a series of load cases was explored. The refinement of the load cases was based on the comparison of the calculated strains and the measured strains on the bridge. Many load cases were used in the STAAD analysis in order to get to the final recommended load case:
1. Self-weight of arch.
2. Weight of fill and bridge deck.
2. Weight of front axle over bridge crown (no load distribution).
3. Weight of rear axle centered over bridge crown (no load distribution).
4. Front axle over bridge crown using the recommended AASHTO load distribution in both the transverse and longitudinal directions.
5. Rear axle centered over bridge crown using the recommended AASHTO load distribution in both the transverse and longitudinal directions.
37
6. Front axle over crown using the experimentally determined transverse load distribution and a similar distribution in the arch span direction (beff = 8.76 ft).
7. Rear axle centered over crown using the experimentally determined transverse load distribution and a similar distribution in the arch span direction (beff = 8.76 ft).
For load case 1, STAAD automatically determined the selfweight of the arch based on the density of the concrete. These are applied to the elements as distributed gravity loads. For load case 2, the weight of the fill and the deck was determined using the geometry of the arch and a soil density of 120 lb/ft3. This density value was used for both the soil and the asphalt material because these two densities were assumed to be similar. The depth of “fill”, soil, and asphalt above the arch crown is 1.75 ft. These loads were applied as distributed normal loads to the beam elements. Load case 3 involved applying a joint load at node 6 (arch crown). Load case 4 involved applying two point loads, one each, to members 5 and 6. Load cases 5 and 6 were identical to load cases 3 and 4 except that the point loads from the tires were distributed using the AASHTO load distribution stating that the projected square area on the arch where the uniform tire load is applied is equal to the depth of fill directly under the tire load squared. This load distribution can also be represented as 2 V: 1 H (two units vertical to one unit horizontal). (See Figure 5.2 for a graphical explanation of how the load is distributed through the fill.) Load cases 7 and 8 used the beff value calculated from the load test and discussed in Section 4.2.4 to determine the appropriate load applied on the unit width model. The effective width in this case is the width of arch that carries a single wheel line. The load distribution that relates to the beff value is approximately equal to a load distribution of 2 V: 5 H. In load cases 7 and 8, the tire loads were distributed longitudinally through the fill (in the arch span direction) based on this 2 V: 5 H distribution. The last two load cases were the most refined live load cases and are eventually used to make comparisons with the experimental load test results and the AASHTO recommended distribution. Figures 5.3 through 5.6 show the axial force and moment envelopes based on the analytical results of load cases 7 and 8.
If a bridge must be load rated with only the analytical method, beff will not be known. This means that one can only distribute the load using the AASHTO load distribution described above. Note that the current DelDOT rating method was checked and found to be consistent with cases 5 and 6 (AASHTO load distribution). This will result in a more conservative load rating than if the beff determined from the field test is used. In order to maintain some level of conservatism, a recommendation was made to use a load distribution through the fill of 2 V: 4 H instead of AASHTO’s distribution of 2 V: 1 H. The manner in which this distribution was developed will be discussed in Section 5.2.3.
38
Figure 5.3. Axial Envelope for When the Front Axle is Over the Bridge Crown.
39
Figure 5.4. Axial Envelope for When Rear Axle is Centered Over Bridge Crown.
Figure 5.5. Moment Envelope for When the Front Axle is Over the Arch Crown.
40
Figure 5.6. Moment Envelope for When the Rear Axle is Centered Over the Arch Crown.
5.2.3 Analytical Test Results
Once the STAAD analysis was run for each live load case, the axial forces and bending moments were converted into strains so that they could be compared to the strains obtained in the experimental load test. The following equations were used to convert the axial forces and moments into strains:
IMy
AP
± = σ (5.1)
Eσ
= ε (5.2)
where P = axial force, M = bending moment about the z-axis, A = cross-sectional area of the member, I = moment of inertia, y = the distance from the extreme fiber of the member to the neutral axis, and E = the modulus of elasticity.
41
It is important to note that in calculating the strains due to axial load and bending, the y value used in Equation 5.1 is for an uncracked concrete section. This was done because the low strain values observed in the experimental load test indicated that the concrete has not likely cracked due to service loads.
After the models for load cases 3 and 4 were finished, an analysis was run using the unit width model and full wheel weights. The forces and moments at each gage location were calculated using interpolation. The strain was calculated using a modulus of elasticity of 3,150 ksi, which is the same value used in the STAAD analysis. As expected, since this model did not incorporate any load distribution, the results were significantly higher than the measured strains. However, this load case could be easily scaled for the correct effective width.
The fifth and sixth load cases were developed and analyzed next. Distributing the load through the fill using the AASHTO load distribution guidelines helped in lowering the calculated strains; however, they still were higher than the strains measured during the load test. A modulus of elasticity of 3,150 ksi was also used in these two load cases.
As discussed in Section 4.2.4, an effective width (beff) of 8.76 feet was calculated from the test results. This meant that the tire load was distributed to the arch over an 8.76 ft x 8.76 ft area (2 V: 5 H). As a result, the amount of load that should be applied to a unit width of arch was determined by dividing the total load by beff. Once this value was calculated, the models for load cases 7 and 8 were refined. After the analysis was run, the strains were calculated at each location using the same method described above for load cases 3 and 4; however, a modulus of elasticity of 4,800 ksi instead of 3,150 ksi was used. The modulus of elasticity was increased because the quality of concrete used around the time when this bridge was built in 1932 was very good, and concrete strength increases over time. With both of these factors considered, we assumed that the strength of the concrete was 7,000 psi, which would in turn make the modulus of elasticity around 4,800 ksi (cores on concrete samples taken from bridges in Delaware on Route 13 constructed at a similar date indicated much higher current strengths). The equation used to calculate the modulus of elasticity is shown below:
cf'57,000 E = (5.3)
where the concrete strength f’c is in psi. The strains calculated using the experimentally determined load distribution and the higher modulus of elasticity were much more comparable to the actual strain values obtained from the load test. Tables 5.1 and 5.2 show the calculated and experimental strain values at each gage location along the arch for a single truck. The calculated values in these two tables are based on the strains obtained from load cases 7 and 8. The calculated strains in Tables 5.1 and 5.2 are of comparable magnitude, and they are small values. Because of these small magnitudes, some of the percent errors are large. Figures 5.7 and 5.8 show the results of Table 5.1 and 5.2 in
42
graphical form. Table 5.3 compares the calculated strains based on load cases 4, 6, and 8 (no load distribution, AASHTO load distribution, experimentally determined load distribution). All three of these load cases are for when the rear axles are centered over the arch crown.
It should be noted that the load distribution through the fill of 2 vertical to 5 horizontal cannot be used for all of the arch bridges in DelDOT’s bridge inventory because this particular distribution is specific to Bridge 1-136. It is likely that arch bridges of similar size, shape and fill depth will have a similar distribution, but one cannot load rate a bridge based on this assumption. The AASHTO distribution of 2 vertical to 1 horizontal appears to be a relatively conservative load distribution. This is based on the comparison between the measured strain values and the calculated strains based on the AASHTO distribution. The AASHTO load distribution is currently in use by DelDOT. For Bridge 1-136 the load distribution of 2 vertical to 5 horizontal can be used to obtain the rating factor; however, if one wants slightly more conservative rating, a distribution of 2 vertical to 4 horizontal can be used. Based on the research conducted, it is not possible to recommend a specific load distribution to use on the other arch bridges in DelDOT’s inventory. Therefore, a recommendation has been made to conduct additional experimental load tests on other arch bridges in DelDOT’s inventory in order to determine the appropriate load distribution.
Table 5.1 Calculated and Measured Strain Values for Pass #1*
Gage #
Member Location
Axial Force (kips)
Moment (kip-in)
Stress (ksi)
Strain (E10^-6)
Measured Strain
339 1 -0.62 -4.44 -0.005 -1.00 0.00
532 2 -0.64 -8.45 -0.022 -4.62 -0.56
304 3 -0.64 -8.16 -0.032 -6.70 -1.69
315 4 -0.48 -2.10 -0.013 -2.75 -1.11
308 5-6 -0.38 6.77 0.038 7.97 4.73
346 7 -0.48 -2.10 -0.013 -2.75 -2.49
533 8 -0.64 -8.16 -0.032 -6.70 -1.76
306 9 -0.64 -8.45 -0.022 -4.62 0.00
344 10 -0.62 -4.44 -0.005 -1.00 0.00
314 5-6 -0.38 6.77 0.038 7.97 5.04
* Front axle over arch crown (Load Case 7)
43
Table 5.2. Calculated and Measured Strain Values for Pass #1*
Gage # Member Location
Axial Force(kips)
Moment (kip-in)
Stress (ksi)
Strain (E10^-6)
MeasuredStrain
532 2 -1.72 -18.90 -0.051 -10.68 -1.12
304 3 -1.62 -16.39 -0.067 -13.93 -3.38
315 4 -1.31 -3.47 -0.026 -5.39 -2.22
308 5-6 -0.97 15.48 0.087 18.04 8.87
346 7 -1.31 -3.47 -0.026 -5.39 -3.73
533 8 -1.62 -16.39 -0.067 -13.93 -5.87
306 9 -1.72 -18.90 -0.051 -10.68 -3.97
344 10 -1.69 -10.19 -0.012 -2.46 0.59
314 5-6 -0.97 15.48 0.087 18.04 18.47
*Rear axle over arch crown (Load Case 8)
Table 5.3. Calculated and Measured Strains for Pass #1*
Gage # Microstrain
(Load Case 4)Microstrain
(Load Case 6) Microstrain
(Load Case 8)Measured
Strain
339 -23.73 -13.93 -2.46 0.00
532 -110.18 -64.34 -10.68 -1.12
304 -163.67 -94.79 -13.93 -3.38
315 -133.86 -77.41 -5.39 -2.22
308 88.82 95.88 18.04 8.87
346 -133.86 -77.41 -5.39 -3.73
533 -163.67 -94.79 -13.93 -5.87
306 -110.18 -64.34 -10.68 -3.97
344 -23.73 -13.93 -2.46 0.59
345 -23.73 -13.93 -2.46 0.00
314 88.82 95.88 18.04 18.47
*Load Cases 4, 6, and 8
44
Figure 5.7. Strain envelope, front axle over crown, Pass #1.
Figure 5.8. Strain envelope, rear axles over crown, Pass #1.
45
5.2.4 Load Rating
To calculate the load rating for Bridge 1-136, the moment and axial force capacities at each node of the bridge model were calculated. The following equations were used to obtain the capacities:
a/2)-(d f A M y sn = (5.4)
bf'0.85
fA ac
y s= (5.5)
Pn = 0.85 f’c (Ag – As) + As fy (5.6)
The moment and axial capacities were calculated at each node for concrete strengths of 3,000 psi and 7,000 psi. Due to the uncertainty of the concrete strength, the two previously mentioned values were used. The different concrete strengths had little impact on the moment capacities; however, the axial force capacities were affected greatly. As will be discussed later, since the rating factors due to axial load do not govern, this difference in the axial capacities is not a factor.
Next it was necessary to determine which load case and arch bridge node location governed. From the testing, it was observed that the live load case when the rear axle of each truck was centered over the bridge crown governed. It was also observed that the load case of two trucks on the bridge is the governing case. In our rating, we used the case of one truck on the bridge. This was done for two reasons. First, as seen from the experimental load test data, the maximum strains do not change much when two trucks are on the bridge instead of one (due to the outer edge of the arch governing). In using a unit width, one generally considers only the appropriate distribution factor and a single wheel line. The current DelDOT ratings use this approach. The maximum moment occurred at node 9, which is approximately the quarter point, for each load distribution analyzed in STAAD.
It is important to note that the load factors are based on the case when the tires are at the edge of the bridge. During the development of the bridge model, it was assumed that the unit width of arch analyzed was from the middle of the bridge, although this is not the part of the arch that governs. The edge of the arch governs because the strains at the edge of the arch are approximately twice the value of the strains at the arch center. If the unit width of arch analyzed in order to determine the load factor is from the edge of the bridge, the beff value used to distribute the load through the fill needs to be halved. The effective width is reduced because at the edge of the arch, the load can distribute in only one direction.
46
Once this was done, the load rating factors were determined. DelDOT uses the load factor rating (LFR) method; therefore, that was the rating method used to rate Bridge 1-136. The following equation was used to calculate the load rating:
I)L(1A
DA - C RF2
1
+= (5.7)
where C=capacity, D=contribution due to dead load, L=contribution due to live load, I=0.3, A1=1.3, and A2=2.17 for inventory level and A2=1.3 for operating level.
The load rating factors were calculated based on the axial loads and the bending moments for all load distributions and for both f’c=3000 and 7000 psi. It was determined that the rating factors due to bending moment and f’c=3000 psi governed. Inventory and operating ratings were determined. It was also necessary to determine the posting rating factor. The posting rating factor is one-third the operating rating plus two-thirds the inventory rating. Tables 5.4 and 5.5 show the inventory, operating, and posting load rating factors and posting loads for a variety of load distributions and truck types. The truck types used are based on the DelDOT design trucks. Table 5.6 shows the posting rating factors and posting loads for a S335 truck type, which is similar to the test truck we used to conduct the experimental load test. Figure 5.9 shows the posting versus load distribution for the S335 truck type. The posting factors for the 2V:1H and 2V:5H load distributions were calculated based on the moment and forces obtained from the STAAD analysis; however, the other three data points on the figure were obtained by interpolation.
Based on the recommended load distribution of 2V:4H, the posting load rating factor is 1.71 for a S335 truck type (similar to the test truck). According to this rating factor it would be possible to remove the load posting sign at Bridge 1-136 because at the present time the posting load is based on a factor determined by engineers at DelDOT of 0.66. This value is approximately twice the value we obtained using the recommended AASHTO distribution. The posting rating factor we calculated for an AASHTO distribution was 0.29. Since we used almost the same method as DelDOT to rate the bridge, it appears that DelDOT used an interior arch section to rate the bridge as opposed to the edge section (one-half the distribution). It is safe to assume that they did not use the edge, since the current rating factor of 0.66 is roughly twice the value of 0.29 determined in this report for a 2v:1H load distribution.
47
Table 5.4. Rating Factors for Each Truck Type for a 2V:1H Load Distribution.
Truck Type Inventory
Rating Factor
Operating Rating Factor
Posting Rating Factor
Total Truck Load (tons)
Posting Load (tons)
HS-20 0.33 0.55 0.40 36 14.4
S220 0.53 0.88 0.65 20 13.0
S335 0.29 0.48 0.35 35 12.3
S437 0.28 0.47 0.35 36.5 12.8
T330 0.53 0.88 0.65 30 19.5
T435 0.29 0.47 0.35 35 12.3
T540 0.29 0.47 0.35 40 14.0
48
Table 5.5. Rating Factors for Each Truck Type for a 2V:5H Load Distribution.
Truck Type Inventory
Rating Factor
Operating Rating Factor
Posting Rating Factor
Total Truck Load (tons)
Posting Load (tons)
S220 3.02 5.03 3.69 20 73.8
S335 1.77 2.95 2.16 35 75.6
S437 1.67 2.78 2.04 36.5 74.5
T330 3.02 5.03 3.69 30 110.7
T435 1.74 2.90 2.12 35 74.2
T540 1.74 2.90 2.12 40 84.8
Table 5.6. Posting Rating Factors and Posting Loads for Each Load Distribution for a S335 Truck.
Posting Rating Factor
H V 2(H/V) Posting Load
(tons)
0.35 1 2 1 12.3
0.80 2 2 2 28.0
1.26 3 2 3 44.1
1.71 4 2 4 59.9
2.16 5 2 5 75.6
49
Rating Factor vs. Distribution Ratio
0
0.5
1
1.5
2
2.5
0 1 2 3 4 5 6
2 ( H / V )
Rat
ing
Fato
r (Po
stin
g)
V=2
H=?
Distribution Through Fill
Figure 5.9. Posting Rating Factor vs. Load Distribution.
5.3 Summary of Results
The following section is a summary of the findings of the result from the analytical method:
• Conducting an analysis using a distribution value based on beff will not be possible if a field test has not taken place to determine the effective width.
• If a field test cannot be conducted, it is recommended that one use the AASHTO distribution of 2 vertical to 1 horizontal. This, however, results in a conservative load rating.
• Based on the findings from this analysis, it is not possible at this time to determine a recommended load distribution that is less conservative than the AASHTO distribution because more load tests need to be conducted on other arch bridges in order for this to happen. This means that the load distribution of 2 vertical to 5 horizontal can be used only on Bridge 1-136. The recommended load distribution to use on Bridge 1-136 is 2 vertical to 4 horizontal. This way, a more conservative load rating factor can be obtained.
• It was observed that the live load case when the rear axle of each truck was centered over the bridge crown governed.
50
• The edge of the arch governs in determining the load factor because the strains at the edge of the arch are approximately twice the value of the strains at the center of the bridge. This means that the beff value used to distribute the load through the fill needs to be halved. This is because the load can be distributed in only one direction at the edge of the arch.
• Load rating factors due to bending moment and f’c = 3,000 psi governed.
• Based on the recommended load distribution of 2 vertical to 4 horizontal and the posting load factor of 1.71 for a S335 truck, it would be possible to remove the load posting sign at Bridge 1-136.
51
Chapter 6: Recommendations and Conclusion
6.1 Recommendations for Load Rating an Arch Bridge
Based on the analytical and experimental research conducted, it is possible to make a recommendation on a method for load rating concrete arch bridges.
To begin the load rating analysis, one should first inspect the bridge in question to see whether there are significant cracks in the bridge or any other observations that need to be taken into consideration. An inspection is even more important if there are no bridge plans available, as it would enable the bridge dimensions and condition of the structure to be obtained.
Once the bridge dimensions are known, one can develop a two-dimensional plane-frame bridge model that can be input into any computer structural analysis program (STAAD-III was used in this work). The bridge model should be made up of at least ten straight-line segments. The depth of these line segments should be representative of the geometry of the arch. If the arch is of constant thickness, the line segments should have constant depth. If the arch is of varying thickness, the line segments should be modeled as tapered elements. For the two-dimensional model, a unit width of arch should be analyzed. The supports at the springings should be pinned. The concrete properties used in the analysis should be similar to that of the bridge. If the arch material properties are unknown, a conservative estimate should be made, or cores taken and tested.
After the arch model is input, it is necessary to apply loads to the structure. The dead loads applied are the selfweight of the arch and the weight of the fill and roadway surface. Most programs have the ability to automatically apply the selfweight of the arch based on the given material properties. The dead load is assumed to be a uniformly distributed gravity load. The weight of the fill and that of the wearing surface need to be determined and then applied to the model as member loads acting normal to the member. The live load used to determine the load rating should be the one for which a rating is desired (e.g. HS-20). Based on the analysis conducted in this research, the governing live load case for the bridge being evaluated occurred when the rear axles were centered over the arch crown. This will not always be the case. Not knowing the governing live load configuration, several live load cases should be applied (with trucks at various longitudinal locations) to determine which one governs. This truck location of the governing live load case will depend on the forces developed and the varying member capacity.
Once the live load cases are chosen, the axle loads need to be distributed through the fill. AASHTO specifies the load distribution to be 2 units vertical to 1 unit horizontal; however, based on the research conducted in this paper, this load distribution appears to be fairly conservative. In order to be able to recommend a load distribution to use to get a less conservative load rating,
52
more load tests should be conducted on other arch bridges in Delaware. Once the load distribution is chosen, the axle loads should be applied to the model as distributed member gravity loads. Note that the edge of the arch will govern, and the distribution factor should reflect the load expected on an edge section.
After analyzing the bridge for a variety of truck loadings, the governing loading and associated critical location in the arch can be identified. This is done by finding out, for each live load case, which node has the maximum bending moment and axial load. Once these node locations are determined, one can begin to calculate the load rating factors. In order to determine the load rating, the axial and bending moment capacities need to be calculated at each node.
The rating method suggested is LFR (load factor rating). The equation for this method is as follows:
I)L(1A
DA - C RF2
1
+= (6.1)
where C=capacity, D=contribution due to dead load, L=contribution due to live load, I=impact, A1=1.3, and A2=2.17 for inventory level and A2=1.3 for operating level. The impact value I varies depending on the span length of the bridge.
I = 50 /(L + 125) (6.2)
where L is the span length. After the rating factors are determined for each load case (truck location) and at each node, the smallest load factor calculated is the one that governs. From the inventory, operating, and posting loads, one can determine whether or not the bridge needs to be posted, unposted, reconstructed, or rehabilitated.
6.2 Conclusion
The recommended load rating method for the arch bridges in the DelDOT inventory is basically the same as the one they are currently using. The only difference is that the recommended method uses a different load distribution for the longitudinal and transverse directions. DelDOT is currently using the AASHTO load distribution of 2 units vertical to 1 unit horizontal, as opposed to the recommended distribution of 2 units vertical to 4 units horizontal. (This recommended distribution applies only to Bridge 1-136.) While conducting the analytical research in Chapter 5 of this paper, we also used the AASHTO load distribution as a starting point for our analysis. We discovered that the posting level obtained using the AASHTO distribution was roughly half the value currently being used by DelDOT. DelDOT’s current posting rating factor for Bridge 1-136 is 0.66. We obtained a rating of 0.31. It appears the difference is
53
due to the fact that the edge section, which has half the effective width, governs. When we used the recommended distribution of 2 V to 4 H, a posting factor of 1.71 was determined.
Since the recommended load rating method was based on only a single experimental load test, further verification is needed. Additional load tests can be performed on other arch bridges to see if this method is satisfactory. Perhaps, the next several times DelDOT needs to rate a problematic arch bridge, they should perform a load test in order to validate the recommended rating method and to determine the appropriate load distribution through the fill. Even if the bridge is in good condition, a load test could still be used for validation purposes. DelDOT especially needs to conduct a load test if the bridge is in poor condition, because the bridge that we used to develop the rating method was in fairly good condition.
The objective of this project was to develop a method to load rate the arch bridges in the DelDOT bridge inventory based on research found in the literature and the results obtained from analyzing an example bridge (Bridge 1-136). The method recommended above is comparable to methods developed by Boothby and several other engineers. Hopefully, DelDOT will benefit from the recommendations given in this paper.
54
References
1. AASHTO, (1994). Manual for the Condition Evaluation of Bridges.” American Association of State Highway and Transportation Officials. Washington, D. C.
2. Boothby, T. E. (1995). “Collapse Modes of Masonry Arch Bridges.” Journal of the British Masonry Arch Society. 9(2), 62-69.
3. Boothby, T. E. and Anderson, A. K. (1995). “The Masonry Arch Reconsidered.” Journal of Architectural Engineering. ASCE. 1(1), 25-36.
4. Boothby, T. E. and Roise, C. K. (1996). “Masonry Arch Bridges.” Seventh North American Masonry Conference. 1077-1085.
5. Boothby, T. E., Fanning, P. J. and Roberts, B.J. (2000). “Modeling, Assessment, and Load-Rating of Masonry Arch Bridges.” Transportation Research Board 79th Annual Meeting. Paper No. 000394.
6. Boothby, T. E. (2001). “Load Rating of Masonry Arch Bridges.” Journal of Bridge Engineering. ASCE. 6(2), 79-86.
7. Das, P. C. (1995). “Assessment of Masonry Arch Bridges.” Arch Bridges. Thomas Telford, London. 21-27.
8. Department of Transport, UK. (1993). “The Assessment of Highway Bridges and Structures.” BA 16/93. Her Majesty’s Stationary Office. London.
9. Edberg, W. M. (1994). “State-of-the-Art Survey in Experimental Load Rating of Bridges.” Thesis Submitted to University of Delaware.
10. Halden, D. (1995). “Performance Criteria in Arch Bridge Assessment.” Arch Bridges: Proceedings of the First International Conference on Arch Bridges held at Bolton, UK Thomas Telford, London. 439-448.
11. Reichelt, G. H. (1997). “Bridge Rating Based on Field Test Results.” Thesis Submitted to the University of Delaware.
12. Thompson, D. R. (1995). “Assessment of Spandrel Walls.” Arch Bridge: Proceedings of the First International Conference on Arch Bridges held at Bolton, UK. Thomas Telford, London. 469-477.
13. Tonias, D. E. (1995). “Bridge Engineering.” McGraw-Hill Inc.
14. Walrath, J. (1991). “Load Rating Analysis of Masonry Arches.” Presented to: New York Assoc. of Transp. Engineers 1991 Conference.
55
Appendix: Photographs of Bridge1-136
Photograph 1. Weight Limit Sign for Bridge1-136.
Photograph 2. Bridge 1-136.
56
Photograph 3. Spalling of Concrete Along the Edge of the Bridge.
Photograph 4. DelDOT Truck Used in the Experimental Load Test.
57
Photograph 4. Pass #3 Across Bridge 1-136.
Delaware Center for Transportation
University of Delaware Newark, Delaware 19716
AN EQUAL OPPORTUNITY/AFFIRMATIVE ACTION EMPLOYERThe University of Delaware is committed to assuring equal opportunity to all persons and does not discriminate on the basis of race, color, gender, religion, ancestry, national origin, sexual orientation, veteran statutes, age, or disability in its educational programs, activities, admissions, or employment practices as required by the Title IX of the Education Amendments of 1972, Title VI of the Civil Rights Act of 1964, the Rehabilitation Act of 1973, the Americans with Disabilities Act, other applicable statutes and University policy. Inquiries concerning these statutes and information regarding campus accessibility should be referred to the Affirmative Action Officer, 305 Hullihen Hall, (302) 831-2835 (voice), (302) 831-4563 (TTD)