Load Sharing in Tungsten Continuous Fiber Reinforced Kanthal MMC’s B. Clausen † , M.A.M. Bourke ‡ and E. Üstündag † † Materials Science, California Institute of Technology ‡ MST-8, Los Alamos National Laboratory Annual Meeting New Orleans, Louisiana February 11-15, 2001
Transcript
Load Sharing in Tungsten Continuous Fiber Reinforced Kanthal MMC’s
B. Clausen†, M.A.M. Bourke‡ and E. Üstündag†
†Materials Science, California Institute of Technology ‡MST-8, Los Alamos National Laboratory
Annual Meeting
New Orleans, Louisiana
February 11-15, 2001
Outline
Tungsten Continuous Fiber Reinforced Kanthal Metal Matrix CompositesNeutron DiffractionFinite Element ModelingSelf-consistent ModelingConclusions
Kanthal has good high temperature propertiesInherent corrosion/oxidization protection by forming an alumina case73.2% Fe, 21.0% Cr, 5.8% Al and 0.04%C
Tungsten fibers increase creep resistance
SamplesMonolithic Kanthal.
• Reference sample. No TRS.10, 20 and 30 volume percent Tungsten fibers
• Various levels of TRS due to the differences in CTE• Different yield points in tension due to the TRS
Manufacture techniqueArc-sprayed, NASA Lewis, Tufts UniversityMixed cubic and hexagonal stacking observed
10%
20%
30%
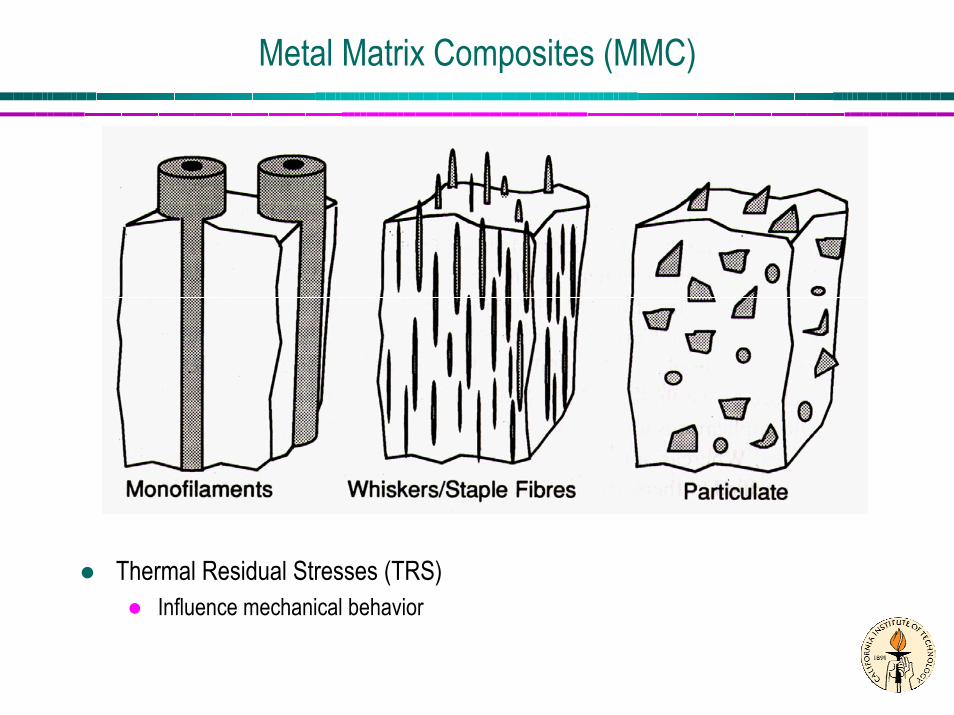
Neutron Diffraction (ND)
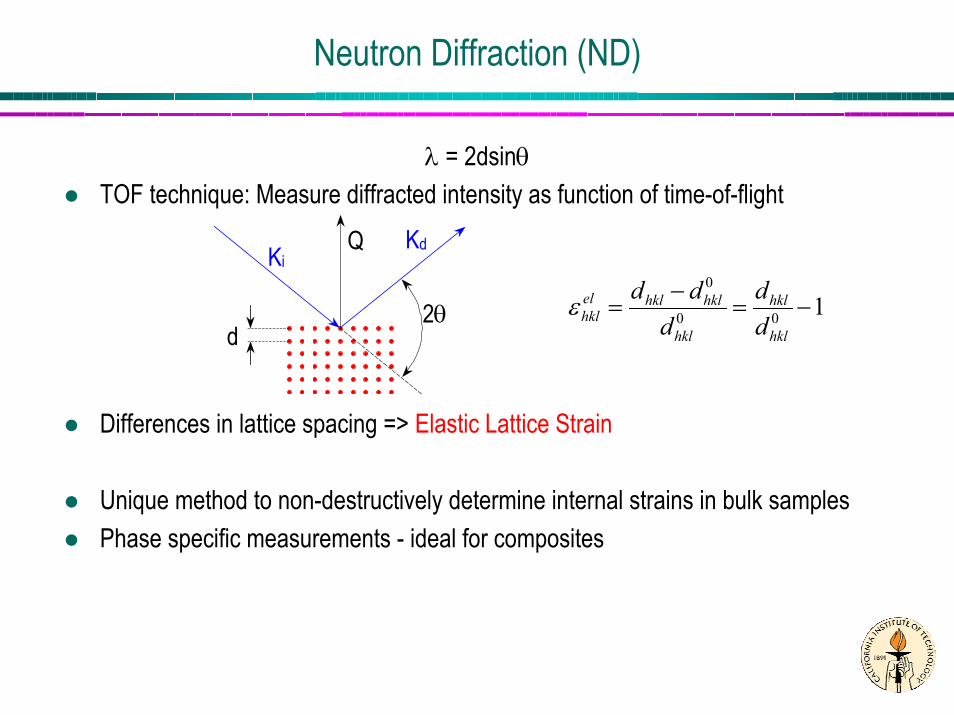
λ = 2dsinθTOF technique: Measure diffracted intensity as function of time-of-flight
Differences in lattice spacing => Elastic Lattice Strain
Unique method to non-destructively determine internal strains in bulk samplesPhase specific measurements - ideal for composites
KiKdQ
2θd
100
0
−=−
=hkl
hkl
hkl
hklhklelhkl d
ddddε
Neutron Diffraction
+ 90°Detector Bank
Incident Neutron Beam
- 90°Detector Bank Tensile Axis
Q⊥
Q||
Neutron Powder Diffractometer (NPD) at LANSCESchematic set-up for in-situ loading measurementsMeasurement time is about 2-4 hours per load levelMeasure elastic strains in two directions simultaneously
Neutron Diffraction
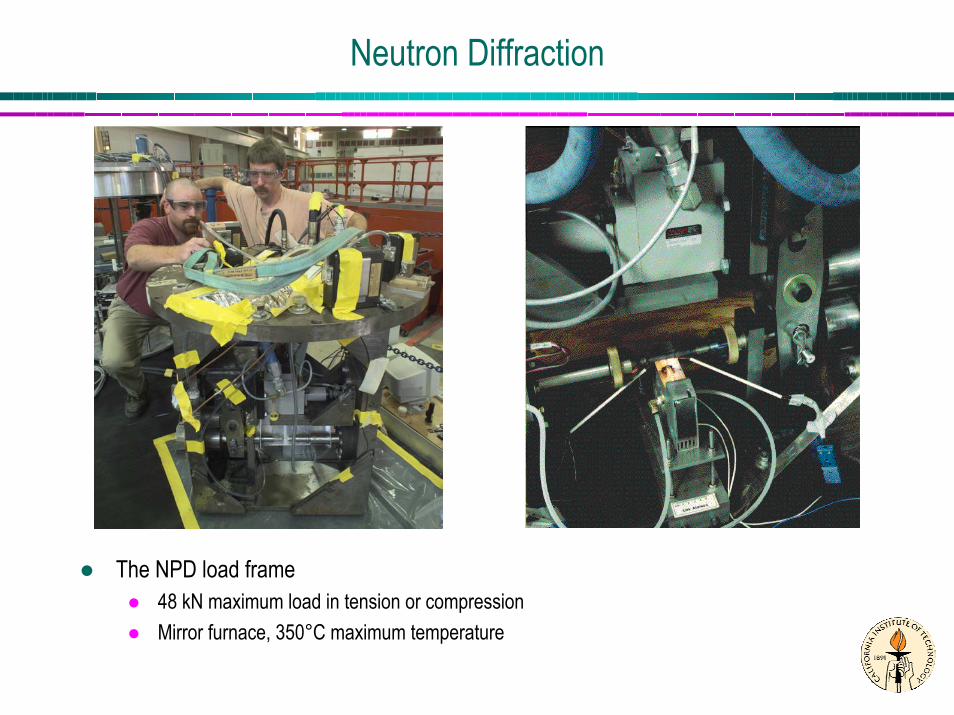
The NPD load frame48 kN maximum load in tension or compressionMirror furnace, 350°C maximum temperature
Neutron Diffraction
SMARTS: Spectrometer for Materials Research at Temperature and Stress
SMARTS; First neutrons by May 2001Order of magnitude lower count times than NPD (10-20 min)1 cubic millimeter gauge volumeCombined ±250kN, 1500°C and translation/rotation
Neutron Diffraction
PerpendicularParallel
Monolithic KanthalRandom (texture index is 1.04)
30% Tungsten fibersKanthal matrix is still random (1.05)The fibers are highly textured (5.87)
Rietveld refinement provides an empirical lattice elastic mean phase (LEMP) strain
Neutron Diffraction
Measured macroscopic stress/strain curves10 and 20% N/A due to extensometer problems
Difference in curves?Young’s modulus?Yield point?
0
100
200
300
400
500
600
0.0 0.5 1.0 1.5 2.0
Macro, NeatMacro, 30%
Appli
ed st
ress
[MP
a]
Total strain [%]
Macro Measurements
Neutron Diffraction
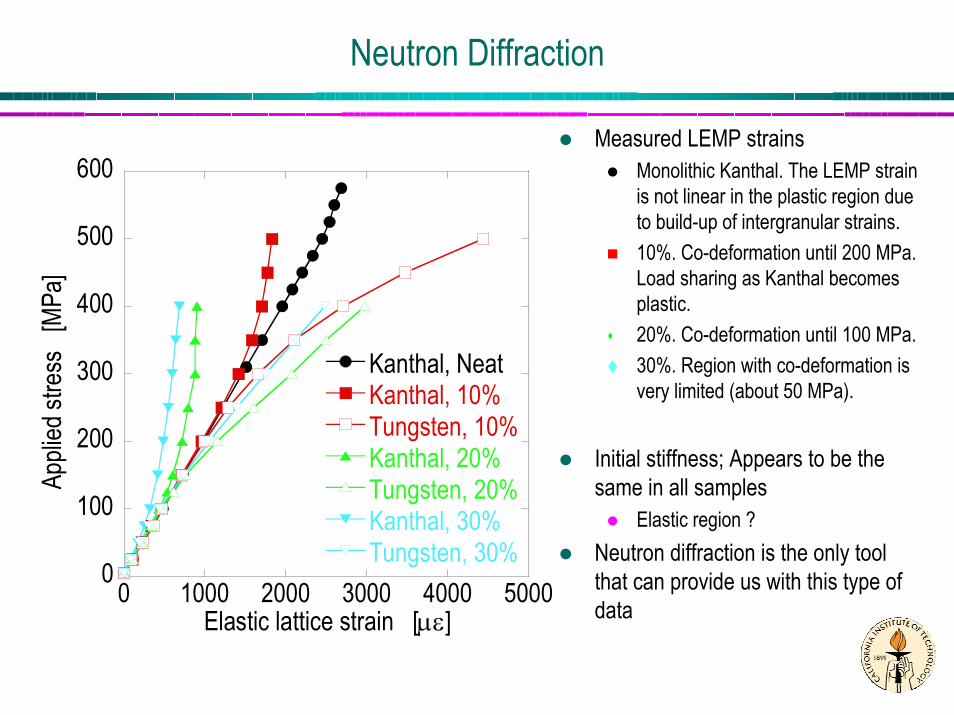
Measured LEMP strainsMonolithic Kanthal. The LEMP strain is not linear in the plastic region due to build-up of intergranular strains. 10%. Co-deformation until 200 MPa. Load sharing as Kanthal becomes plastic.20%. Co-deformation until 100 MPa. 30%. Region with co-deformation is very limited (about 50 MPa).
Initial stiffness; Appears to be the same in all samples
Elastic region ?Neutron diffraction is the only tool that can provide us with this type of data0 1000 2000 3000 4000 5000
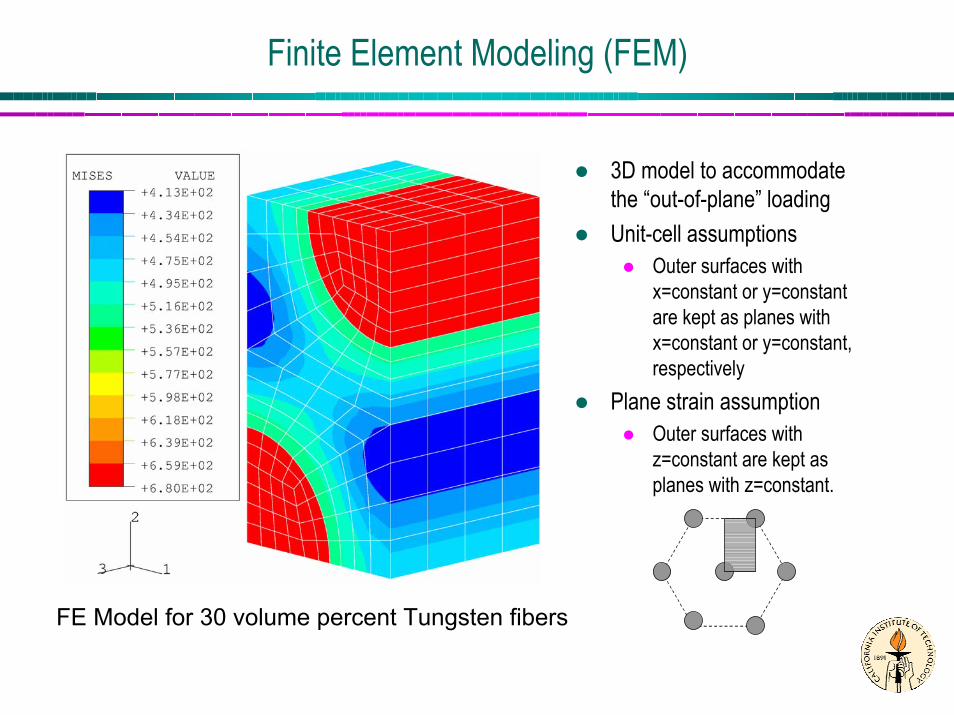
3D model to accommodate the “out-of-plane” loadingUnit-cell assumptions
Outer surfaces with x=constant or y=constant are kept as planes with x=constant or y=constant, respectively
Plane strain assumptionOuter surfaces with z=constant are kept as planes with z=constant.
FE Model for 30 volume percent Tungsten fibers
FEM Compared to ND
0 1500 3000 4500Elastic lattice strain [µε]
Kanthal 30% W
0 1500 3000 4500
K, NDW, NDK, ∆T=630W, ∆T=630
Elastic lattice strain [µε]
Kanthal 20% W
0 1500 3000 45000
100
200
300
400
500
Elastic lattice strain [µε]
Appli
ed st
ress
[MP
a]
Kanthal 10% W
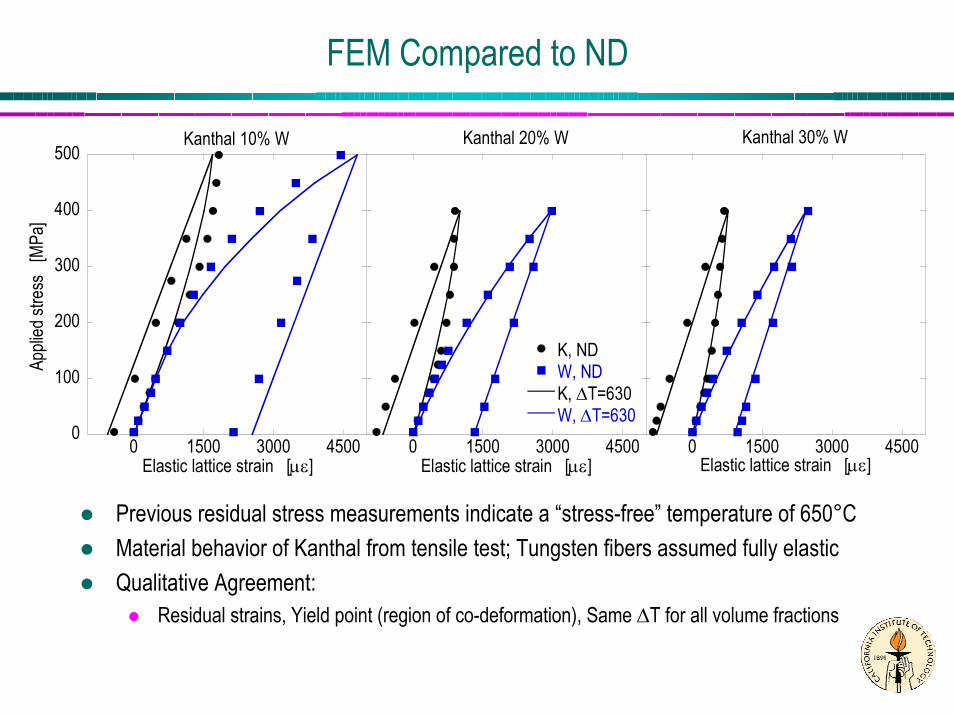
Previous residual stress measurements indicate a “stress-free” temperature of 650°CMaterial behavior of Kanthal from tensile test; Tungsten fibers assumed fully elasticQualitative Agreement:
Residual strains, Yield point (region of co-deformation), Same ∆T for all volume fractions
FEM Compared to Macro Measurements
0
100
200
300
400
500
0.0 0.1 0.2 0.3 0.4 0.5 0.6
Macro, NeatMacro, 30%Ap
plied
stre
ss [
MPa]
Total strain [%]
Macro Measurements
0
100
200
300
400
500
0.0 0.1 0.2 0.3 0.4 0.5 0.6
Neat, ∆T=63010%, ∆T=63020%, ∆T=63030%, ∆T=630
Appli
ed st
ress
[MP
a]Total strain [%]
Finite Element Modeling
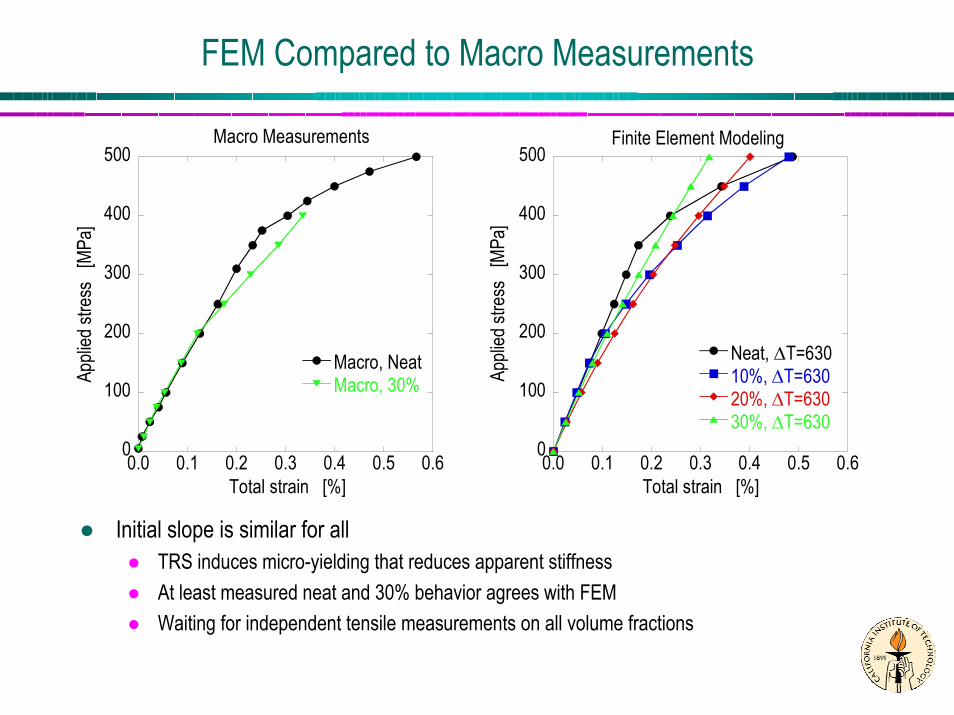
Initial slope is similar for allTRS induces micro-yielding that reduces apparent stiffnessAt least measured neat and 30% behavior agrees with FEMWaiting for independent tensile measurements on all volume fractions
Self-consistent model (SCM)
Material parametersSingle crystal stiffnesses and coefficients of thermal expansionDescription of texture with discrete set of grain orientationsCrystal structure, slip (and twinning) systemsCRSS and hardening law
Model AssumptionsEshelby inclusion theoryHEM properties equal to weighted average of the grains
OutputDirect comparison with neutron diffraction measurementsAverages over grains sets representing reflections
σσσc σc
HEM
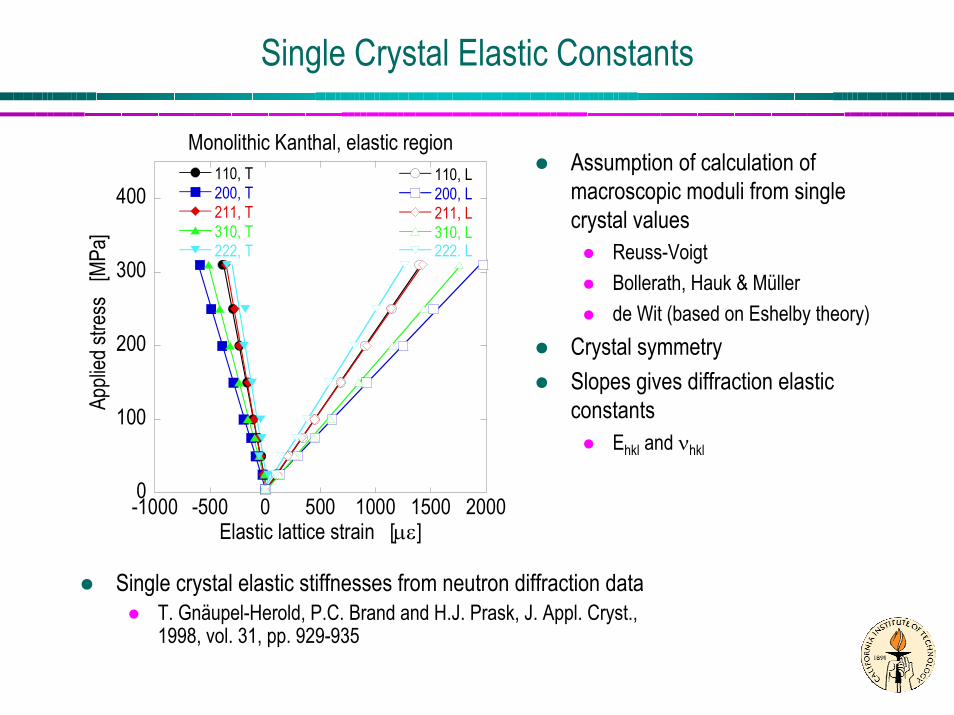
Single Crystal Elastic Constants
Assumption of calculation of macroscopic moduli from single crystal values
Reuss-VoigtBollerath, Hauk & Müllerde Wit (based on Eshelby theory)
Single crystal elastic stiffnesses from neutron diffraction dataT. Gnäupel-Herold, P.C. Brand and H.J. Prask, J. Appl. Cryst., 1998, vol. 31, pp. 929-935
Polycrystal versus Continuum Constitutive Description
Experimental Data
Single Crystal Properties and Deformation Mechanisms
Polycrystal Texture
Polycrystal Model
Constitutive Response
Simulation of Component Loading or Forming Operations using
Finite Element Codes
Continuum mechanics
SCM Compared to ND
0
100
200
300
400
500
600
0.0 0.5 1.0 1.5
Measured{110}<111> slip only{211}<111> slip only{321}<111> slip only
Appli
ed st
ress
[MP
a]
Total strain [%]
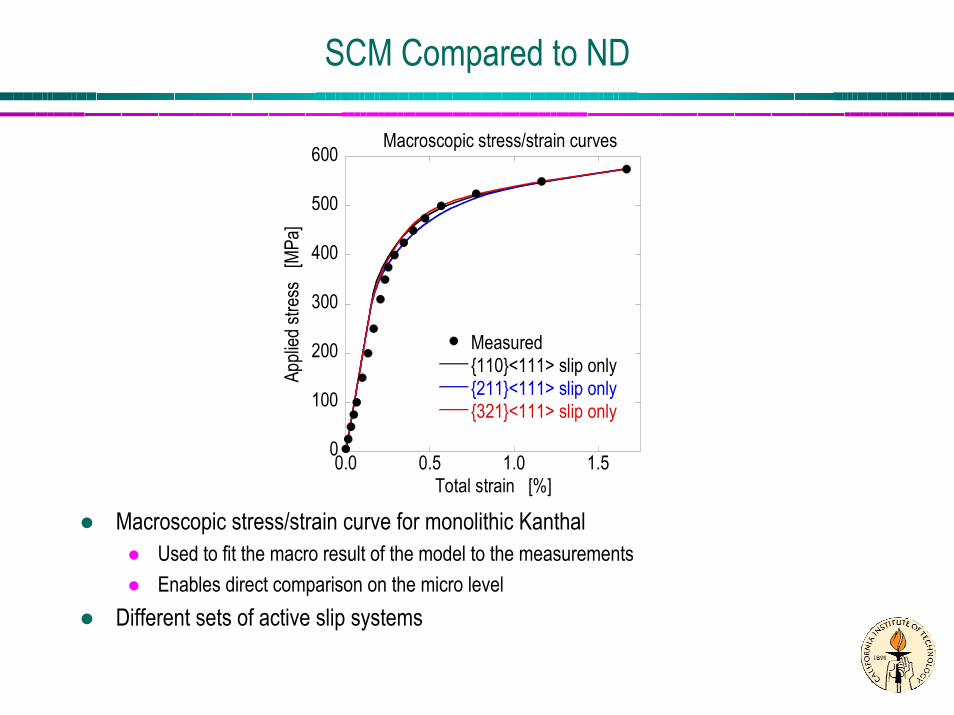
Macroscopic stress/strain curves
Macroscopic stress/strain curve for monolithic KanthalUsed to fit the macro result of the model to the measurementsEnables direct comparison on the micro level
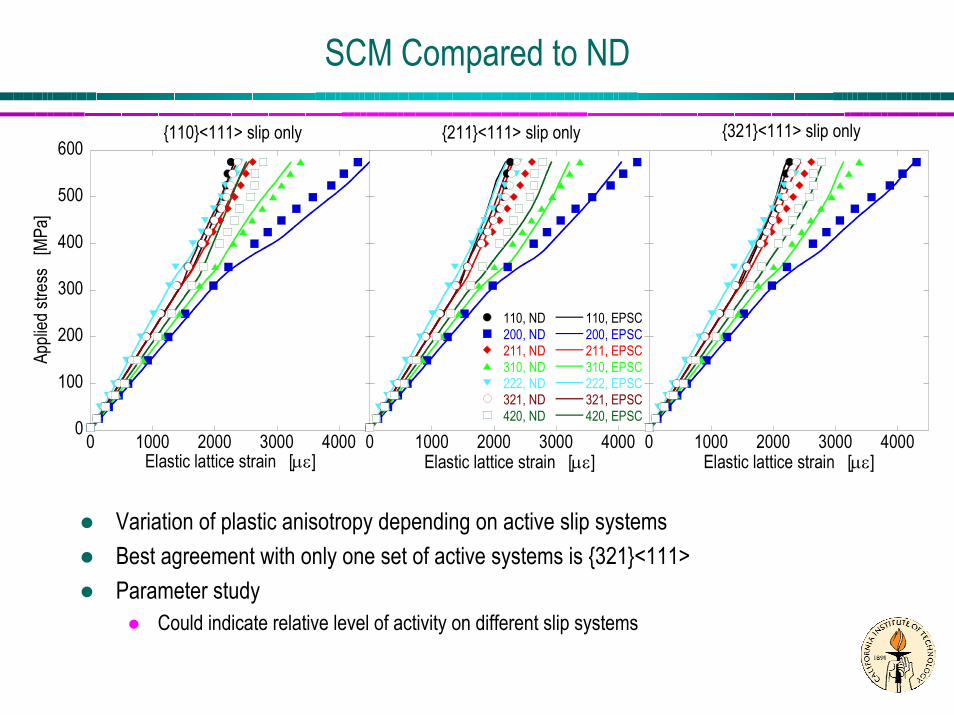
Variation of plastic anisotropy depending on active slip systemsBest agreement with only one set of active systems is {321}<111>Parameter study
Could indicate relative level of activity on different slip systems
Conclusions
Neutron diffraction measurementsUnique ability to measure in-situ phase strains in MMC’s during loadingDirectly applicable for model validation on a microstructural level
FEM predictions show qualitative agreement with the measurementsMicro yielding in composites; residual strainsModel development
• Unit cell assumptions; hexagonal, cubic, coaxial, multi fiber, …
SCM predictions show qualitative agreement with the measurementsMonolithic Kanthal only
• Quantitative agreement in the elastic region• Plastic anisotropy depends on set(s) of active slip systems