LOAN METHODOLOGY, GENDER, ENVIRONMENT AND THE FORMATION OF CAPITAL BY MEXICAN MICROFINANCE INSTITUTIONS by Denis John Griffin Presented to the Faculty of the EGADE Business School of the Instituto Tecnológico y de Estudios Superiores de Monterrey in Partial Fulfillment of the Requirements for the Degree of Doctor of Philosophy in Administration Instituto Tecnológico y de Estudios Superiores de Monterrey April, 2012
Transcript
LOAN METHODOLOGY, GENDER, ENVIRONMENT AND THE
FORMATION OF CAPITAL BY MEXICAN MICROFINANCE
INSTITUTIONS
by
Denis John Griffin
Presented to the Faculty of the EGADE Business School of
the Instituto Tecnológico y de Estudios Superiores de Monterrey
in Partial Fulfillment of the Requirements
for the Degree of
Doctor of Philosophy
in
Administration
Instituto Tecnológico y de Estudios Superiores de Monterrey
April, 2012
L O A N METHODOLOGY, GENDER, ENVIRONMENT AND THE
FORMATION OF CAPITAL BY MEXICAN MICROFINANCE
INSTITUTIONS
Approved by Dissertation Committee:
Bryan W. Husted, Ph.D., Main Advisor Chair of the Committee
Professor of Management
Edgardo Ayala, Ph.D. Associate Professor of Economics
Jorge,M. Rocha, Ph.D. Assistant Professor of (organisational and
Consumer Behaviour
Anabella Davila, Ph.D. Professor of Organisation Theory
Research and Ph.D. Program Director
DEDICATION
This dissertation is dedicated to:
my spiritual guide, Swami Chidvilasanda
my mother, Helga Griffin
my father, James Griffin (1929-2010)
my wife, Catalina Lira Meza
my son, Uriel Griffin Lira
v
ACKNOWLEDGEMENTS
My doctoral studies involved a lengthy journey through different locations
in North America. So many people have helped me during this time that it is not
possible to acknowledge all of them individually.
Firstly, I would like to especially thank Bryan Husted, my dissertation
supervisor, who I met in my first doctoral class in the EGADE Business School
and who encouraged me from the beginning to pursue my interest in microfinance
at a time when there was no published research in business administration on this
topic. He is a great example to those of us in administration who live and carry
out research in Mexico, in Latin American and in other developing countries.
I was originally drawn towards microfinance in the early 1990s thanks to
Joe Remenyi’s (1991) book “Where Credit is Due” and Deakin University’s
development studies program, which was available internationally through
distance education.
I am indebted to my wife, Catalina, who took me and collected me from
the bus station so many times at all hours, supported me and expressed interest in
my progress. She was a substantial support as I confronted diverse obstacles in
order to complete this dissertation. I also wish I had had more time for my son
Uriel, who was always extremely understanding and patient in resolving many of
my digital problems. He is a wonderful person much loved by all his family in
Australia and Mexico. My parents, Helga Griffin and Emeritus Professor Jim
Griffin, both authors and lecturers in Australia, stimulated my academic interests
vi
from an early age. My association with my brothers and sisters (Justin, Gerald,
Anthea, Cathie and Gabrielle) has also enriched my life.
My time spent working voluntarily in India and Australia with the Siddha
Yoga Foundation between 1985 and 1991 provided me with a strong work ethic;
taught me about discipline, perseverance and multi-cultural collaboration;
revealed the predicament of extreme poverty in Bombay’s slums and amongst the
rural poor in Maharashtra; introduced me to a rural development program that was
to become the official Prasad Project; and enabled me to interchange experiences
and knowledge in challenging environments, such as the maximum security
section of what was Pentridge Prison in Melbourne. The Siddha Yoga Foundation
has inspired me for life. Its important cultural and development contributions have
since been justly recognised by the United Nations.
For two and a half years I travelled seven hours by bus across northern
Mexican deserts to Monterrey in order to attend weekly classes while I worked as
a lecturer in the Tecnológico de Monterrey, Campus Zacatecas. This entailed
either renting a room in Monterrey or sleeping on the bus. Persistent travel by bus
involved many incidents, such as breaking down in the desert; not waking up at
my destination; the bus not stopping at my destination; walking back towards the
bus station along the highway in the dark; and/or ending up in another city. Thank
you Alejandro Ibarra Yúnez, the head of the doctoral program when I started, and
David Noel Ramírez Padilla, the then Rector of the northern zone of the
Tecnológico de Monterrey. Thanks to them I was able to obtain backing from my
campus to continue in the doctoral program of the EGADE Business School and it
vii
was possible to spend a year as a visiting student in Montreal, Canada. The next
Director of the doctoral program, Anabella Dávila, also proved to be a constant
reinforcement and a valued friend. I am also appreciative to two lecturers and
friends from Campus Zacatecas, Eduardo Lopez de Lara and Raúl Quiroga, who
assisted me when I had numerous queries concerning mathematics. Thanks to the
staff of Campus Zacatecas and the staff and fellow doctoral students of the
EGADE Business School.
Spending a year in Montreal, in addition to the 8,650 kilometre drive up
there and the 6,900 kilometre drive back, was a remarkable experience. Thanks to
the doctoral program of the Desautels Faculty of Management, McGill University,
for accepting me as a visiting student and special thanks to my mentor there,
Paola Perez-Aleman, who selflessly dedicated her time so that I could spend a
fruitful year there. She also introduced me to the topic of strategic management
for developing countries. Ashesh Mukherjee of Desautels was perhaps the first
academic to see some promise in my embryonic dissertation proposal and I am
grateful for his encouragement. One of the outstanding components of the
Montreal environment was the option of taking related courses in the other three
Montreal universities. Through the Montreal Joint PhD Program I was able to take
two courses with Ann Langley of HEC Montreal. In her first course she
recommended a literature review that guided me to the debate over group and
individual loans. The exploratory qualitative study in her second course led me
the topic of environment. Although an extremely busy academic, Ann Langley
also kindly agreed to form part of the committee for my comprehensive exam.
viii
The interaction between the doctoral students in Montreal from the different
universities contributes to a truly motivating community and I especially esteem
the friendships I formed with Abhijit Ghosh and Andrew Gates of McGill. Thanks
Abhijit for the conversations about India, your interest in cooperatives, and the
constant advice on strategy-related topics.
Returning to Zacatecas and Monterrey I was able to form my dissertation
committee and meet Edgardo Ayala Gaytán of Monterrey Campus, who instructed
me on structural equation modeling, and Jorge M. Rocha of the EGADE Business
School, who proposed delving deeper into social networks and reviewing the
various anthropological perspectives of culture.
Then in 2010 I moved to the Centre of Interdisciplinary Research and
Integrated Regional Development (CIIDIR) of the National Polytechnic Institute
(IPN), 1,000 kilometres to the south in the state of Oaxaca. I would like to thank
all the staff of the CIIDIR who aided and supported me, especially Amado
Poblano Vásquez, Mara Rosas Baños, Elvira Duran Medina, Pedro Benito
Bautista, Nelly Arellanes, and Griselle Velasco Rodríguez. Amado invited me
into his home without even knowing me and became a steadfast confidant. I am
appreciative to the many friends I have made in the state of Oaxaca and in the
northern sierra of the state of Puebla, including the Siddha Yoga community in
Oaxaca and the historic hamlet of Lachatao in the Pueblos Mancomunados
(Commonwealth of Villages).
Various institutions provided me with beneficial feedback, moral support
and/or financial contributions including the Center for the Study of Western
ix
Hemispheric Trade of the Texas A&M International University; the Latin
American Council of Business Schools (CLADEA); the Academy of
Management; oikos; and the United Nations Development Program (UNDP). I am
beholden to the UNDP for the Growing Inclusive Markets (GIM) Travel Grant to
attend the oikos UNDP Young Scholars Development Academy in Costa Rica.
I would also like to recognise the contribution of those people who
collaborated during the four stages of my data collection. Firstly, thanks to
Duanne Andrade (Evolution Business Development; Evolution Green Solutions),
Carlos Trujillo (FONAES), Jaime Flemate, Ricardo Cantú Calderón (EGAP), and
Jairo Abraham Ruiz Nava (Tecnológico de Monterrey). It was Duanne who
pointed out that rural dwellers appeared to be more collectivistic in their
interactions and that this is one reason why large groups may be a preferred
microfinance methodology in rural environments. She has a wealth of knowledge
and first-hand experience related to the microfinance industry.
For the backing I received in carrying out my first pilot survey I would
like to express my gratitude to ADMIC and the following staff in particular:
Orlando, Alberto González Díaz, and Nohemí González. Alberto and Nohemí
offered important assistance in locating clients in Villa de García.
Thank you to the following people in CAME: Federico Manzano López,
Denice Degollado, José Luis Torales Caballero, Miguel Cortes Félix, Camelia
Reyes Emba, Martin Sánchez Varela, and Joaquín Rocha Silva. Miguel kindly
introduced me to the centres in Valle de Chalco, coordinated the survey collection
x
in Nezahualcóyotl and generously answered many questions. Joaquín, the security
guard in Ozumba, made my life considerably easier, assisted with the survey
collection there and became a considerate friend. Thanks to all the CAME staff in
the centres of Ozumba, Tezozomoc (Valle de Chalco) and Neza.
The support of María Teresa García Moisés of Apros proved to be
essential to the success of my dissertation. Also I would like to thank the
following staff of Apros that I met personally: Carlos Delgado, Claudia
Arizmendi Jiménez, Juan Carlos Vázquez, Beatriz Cristóbal Delgado, Claudia
Torres, and Alejandra Medina Romero. However, I am indebted to all the staff in
all the centres of Apros because all of them cooperated with the survey collection
and this vital sample would not have been possible without them.
Finally, thank you especially to Ariadna Velázquez for gathering the
CAME survey in wet and difficult conditions in the Nezahualcóyotl area of
Mexico City. Answering the first hypothesis would not have been possible
without her. Also, I am highly appreciative to all the micro-entrepreneurs
associating with ADMIC, CAME and Apros who collaborated with the survey.
xi
ABSTRACT OF DISSERTATION
EGADE BUSINESS SCHOOL, MONTERREY
INSTITUTO TECNOLOGICO Y DE ESTUDIOS DE ESTUDIOS SUPERIORES DE MONTERREY
Degree: Doctor of Philosophy Program: Doctoral Program in Administration Name of Candidate: Denis John Griffin Main Advisor: Bryan Husted
LOAN METHODOLOGY, GENDER, ENVIRONMENT AND THE
FORMATION OF CAPITAL BY MEXICAN MICROFINANCE
INSTITUTIONS
Although evidence from literature in social psychology, sociology, the
economics of gender, and business administration generally states that men are
more successful than women as business owners and employees, the development
literature suggests that women may be more successful than men in microfinance
programs. This may be due to higher levels of peer-group pressure, community
pressure, group participation and solidarity in microfinance groups with a greater
proportion of females. Group loans may also have more success in rural areas
where society is more closely knit. In order to test these assumptions a survey was
xii
conducted in two microfinance institutions operating in central Mexico consisting
of 109 individual loans, 182 small groups and 110 large groups. The survey was
analysed with t-tests, ANOVAs and structural equation modeling. Surprisingly,
no significant difference was found between the financial capital creation of males
and females with individual loans, nor between groups with a greater proportion
of females and groups with a greater proportion of males. This suggests that the
gender gap in this context does not appear to be as wide as the literature would
indicate. Males appear to enjoy few advantages in this context. Groups with a
greater proportion of females appear to impose more sanctions from within the
group, although there are not significantly more community sanctions imposed on
these groups nor do these groups place more emphasis on group and community
relations. Rural groups, however, did create significantly more financial capital
than urban groups. An important by-product of this study was the finding that
sanctions do not improve repayment rates but in fact have a negative affect on
repayments rates, whereas, social relations within the group and the community
have a significant positive affect on repayment rates. Furthermore, the sample of
small groups found that high repayment rates significantly raise the creation of
financial capital by microfinance clients.
xiii
La literatura de psicología social, sociología, economía de género, y
administración de empresas generalmente afirma que los hombres tienen más
éxito como dueños y empleados que las mujeres. No obstante, aportes empíricos
sobre el desarrollo sugiere que las mujeres podrían tener más éxito en los
programas de microfinanzas debido a la presión que en ellas se ejerce por el grupo
y por la comunidad. Prácticamente se espera de ellas mayor participación en el
grupo y un incremento en el nivel de solidaridad cuando hay una mayor
proporción de mujeres en el grupo. También se supone que los préstamos a
grupos podrían tener más éxito en zonas rurales donde la sociedad es más
solidaria. Para probar estas proposiciones se aplicó una encuesta en dos
microfinancieras ubicadas en cuatro estados del centro de la República Mexicana.
La encuesta se aplicó a los usuarios de 109 prestamos individuales, 182 grupos
pequeños y 110 grupos grandes; y fue analizada con pruebas de t, ANOVAs y
modelos de ecuaciones estructurales. Para nuestra sorpresa, no existieron
diferencias significativas en la creación de capital financiero entre hombres y
mujeres con préstamos individuales, ni entre grupos con una proporción mayor de
mujeres y de hombres. Estos resultados sugieren que el vacío entre los géneros en
este contexto no es tan amplio como la literatura indica y los hombres disfrutan
pocas ventajas en este contexto. Los grupos con una mayor proporción de mujeres
imponen más sanciones al grupo, pero no hay significativamente más sanciones
de la comunidad a estos grupos. Además en los grupos con una proporción mayor
de mujeres tampoco existe un énfasis en las relaciones en el grupo y con la
comunidad. Sin embargo, los grupos rurales crearon más capital financiera que los
xiv
grupos urbanos. De este estudio se deriva un resultado importante, que las
sanciones no mejoran las tasas de pago y su efecto es contraproducente porque las
bajan, mientras que las relaciones solidarias en el grupo y con la comunidad sí
suben significativamente las tasas de pago. En el caso de la muestra de grupos
pequeños se encontró que las altas tasas de pago suben significativamente la
creación de capital financiera por parte de los microempresarios.
xv
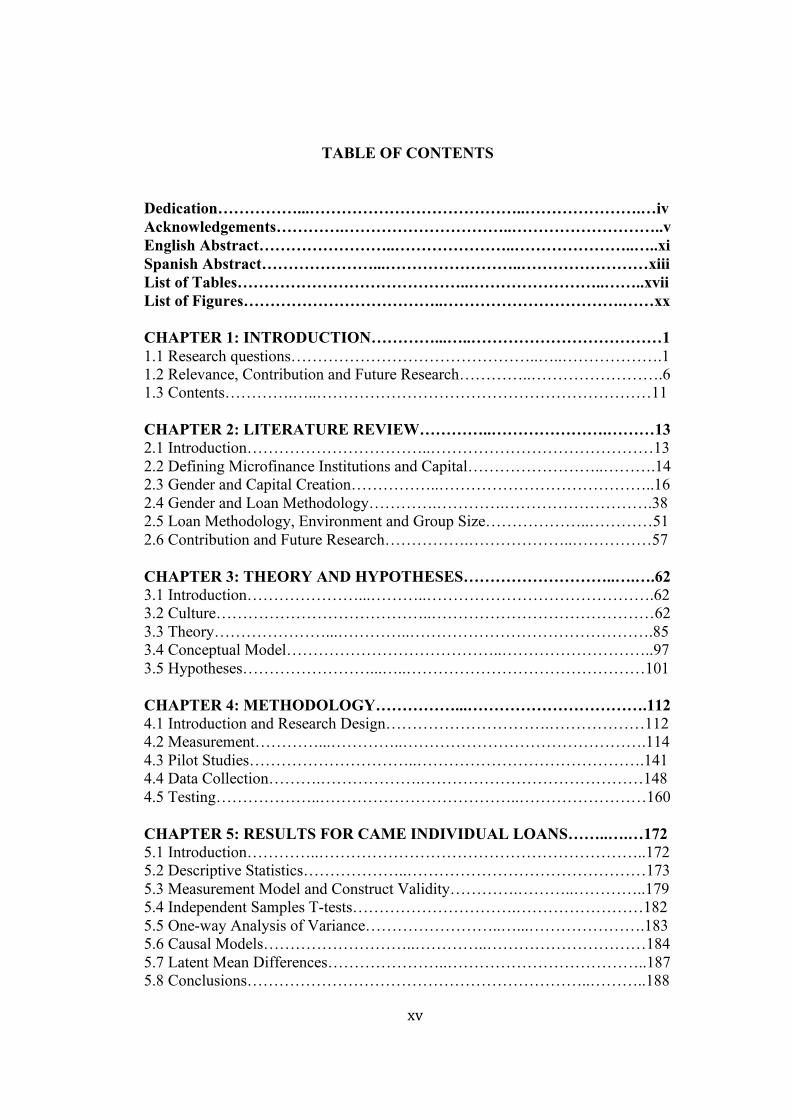
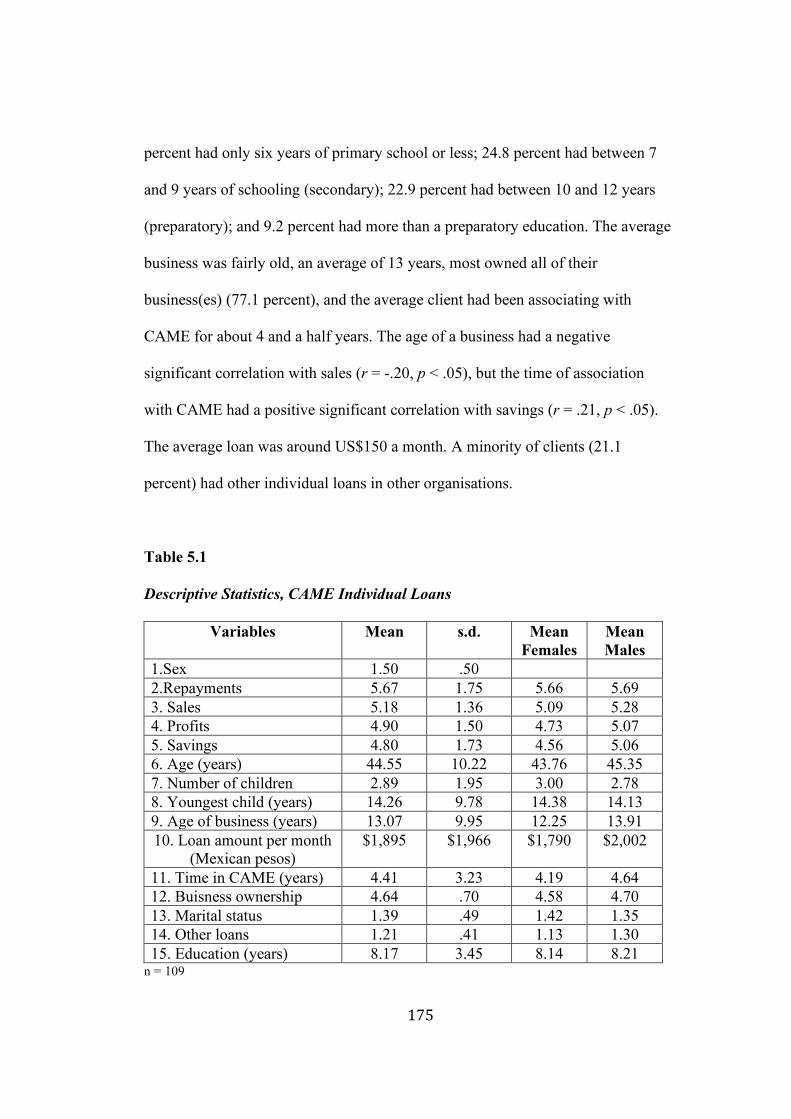
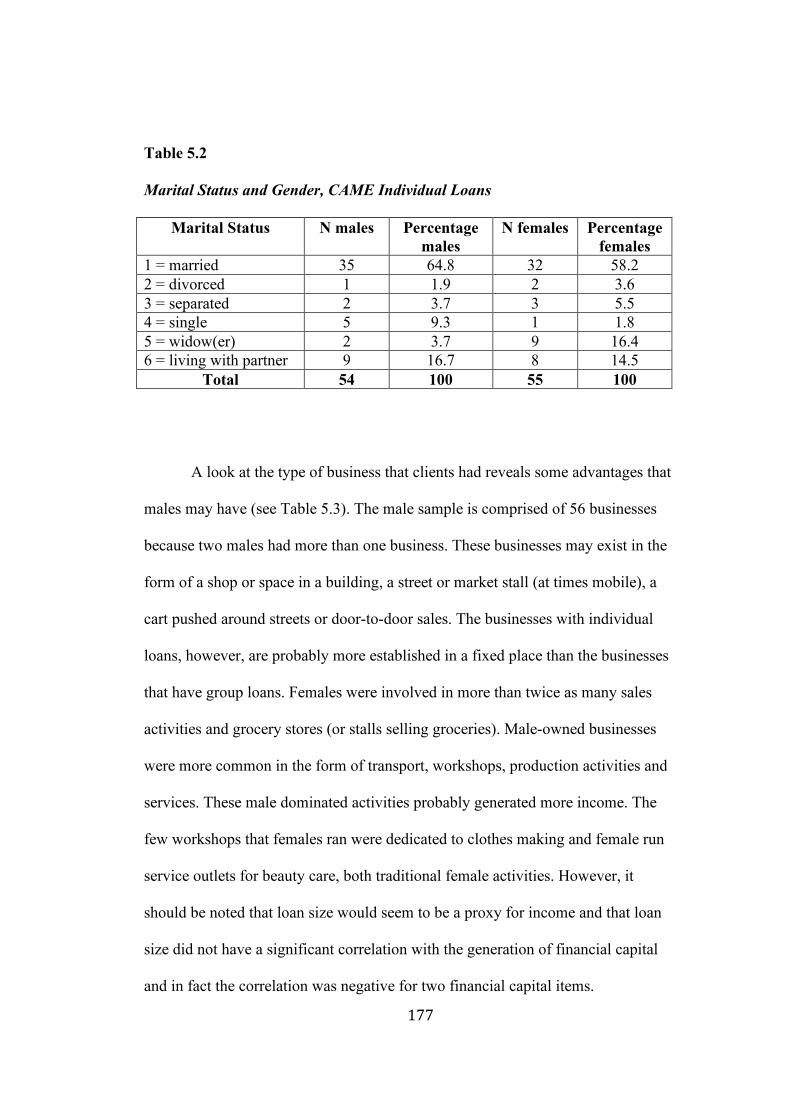
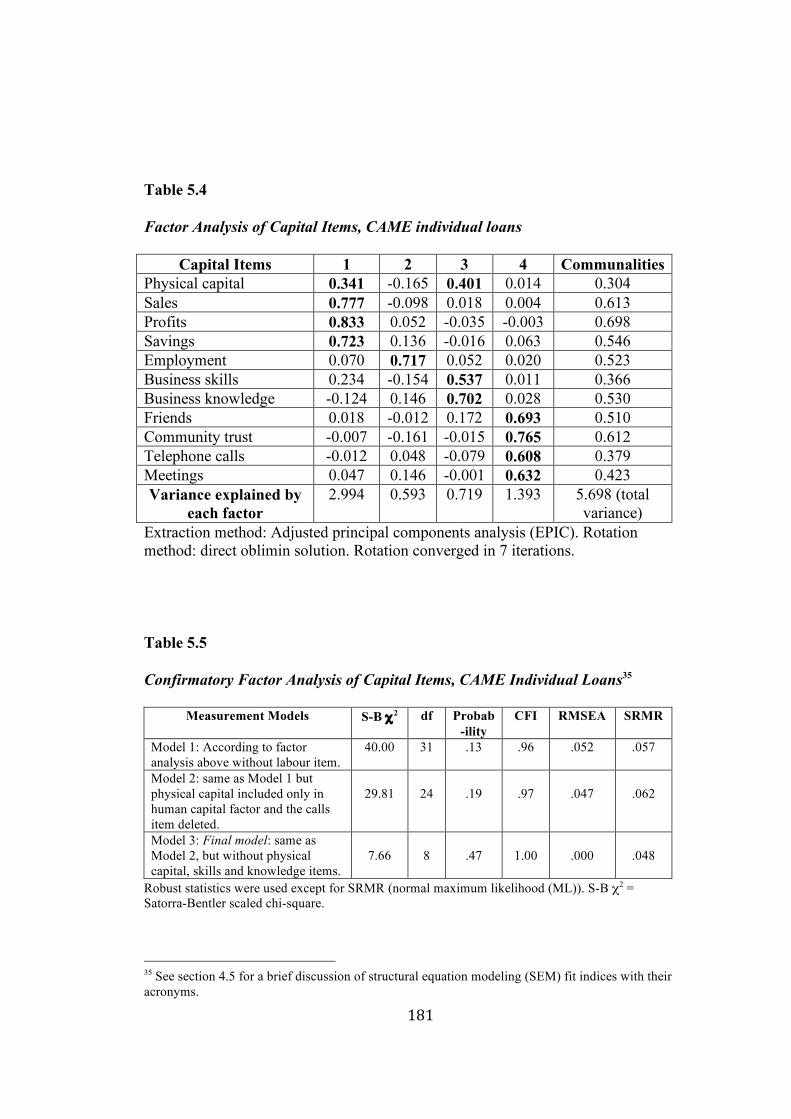
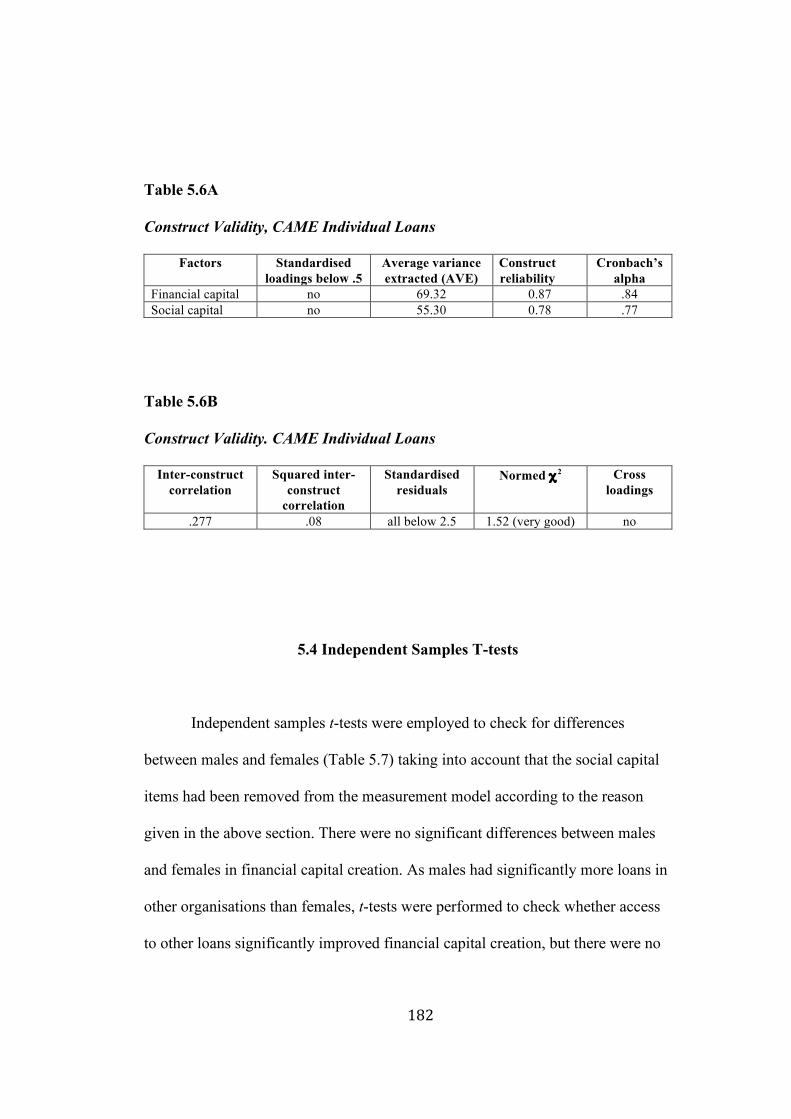
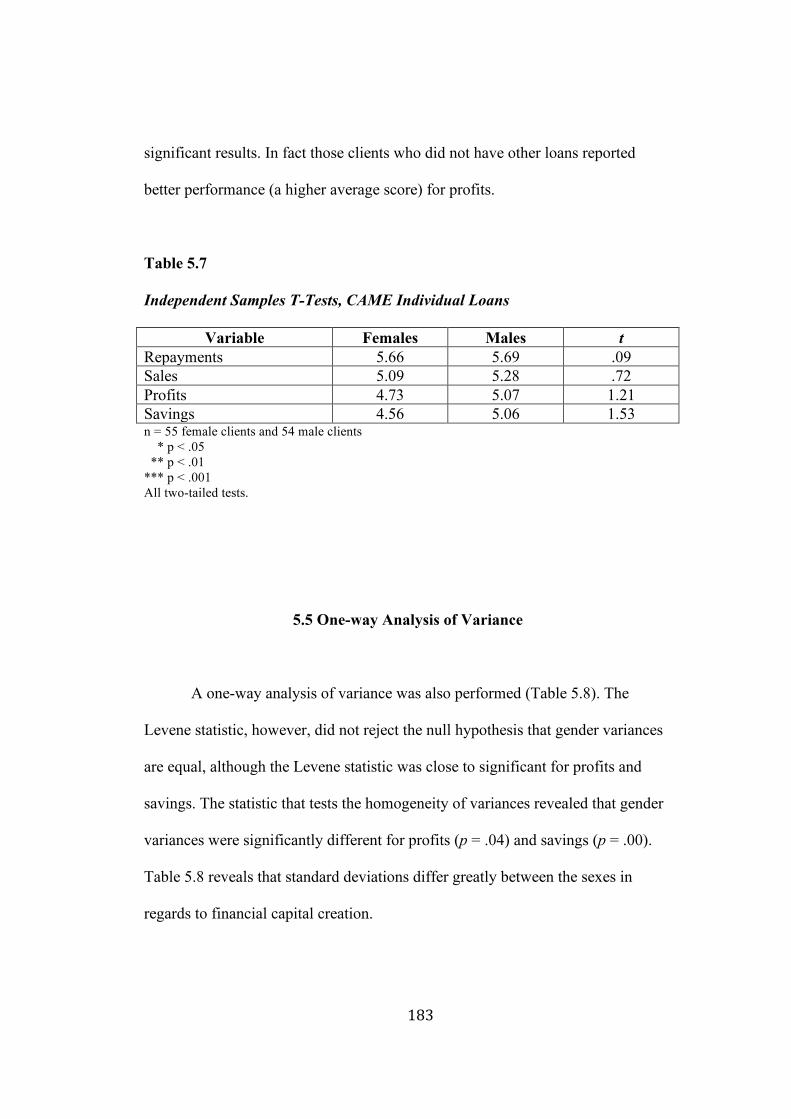
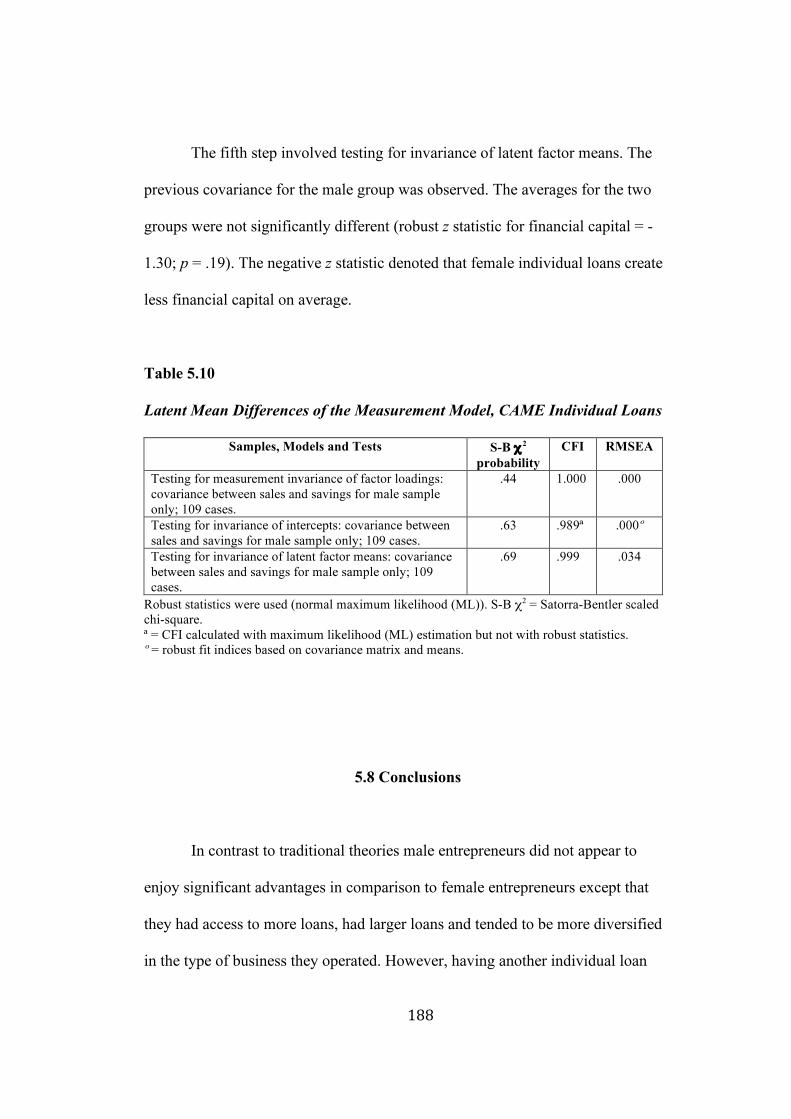
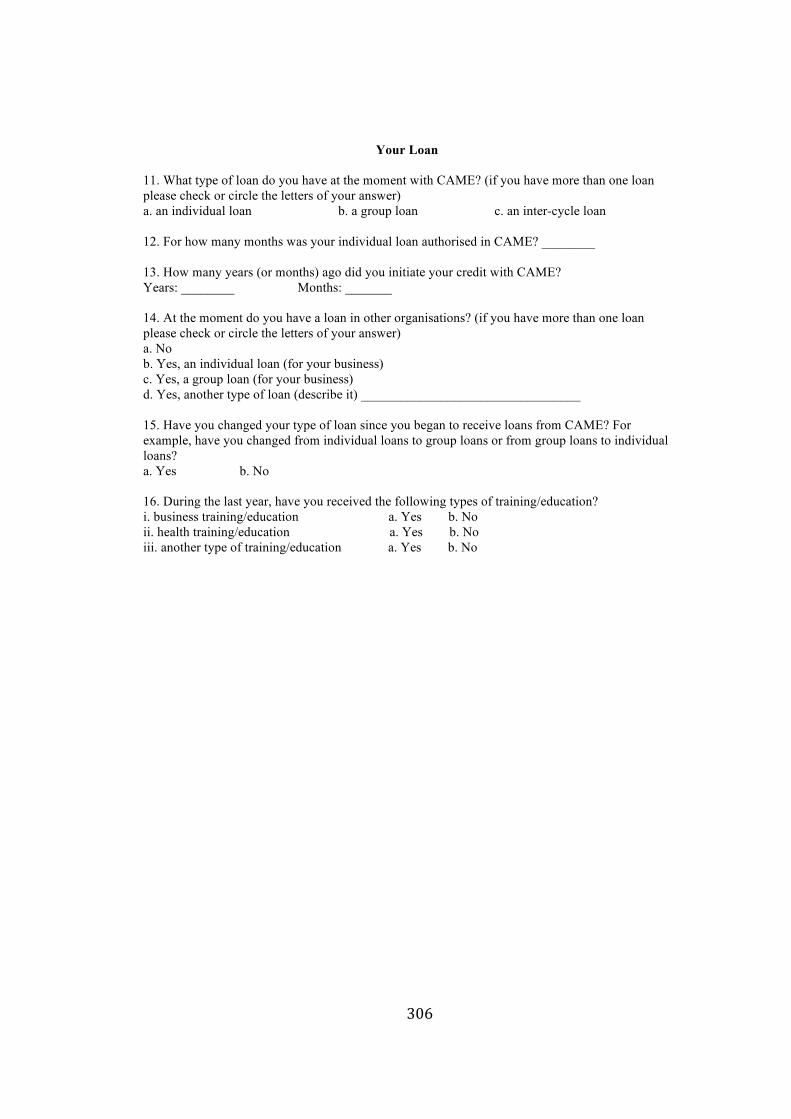
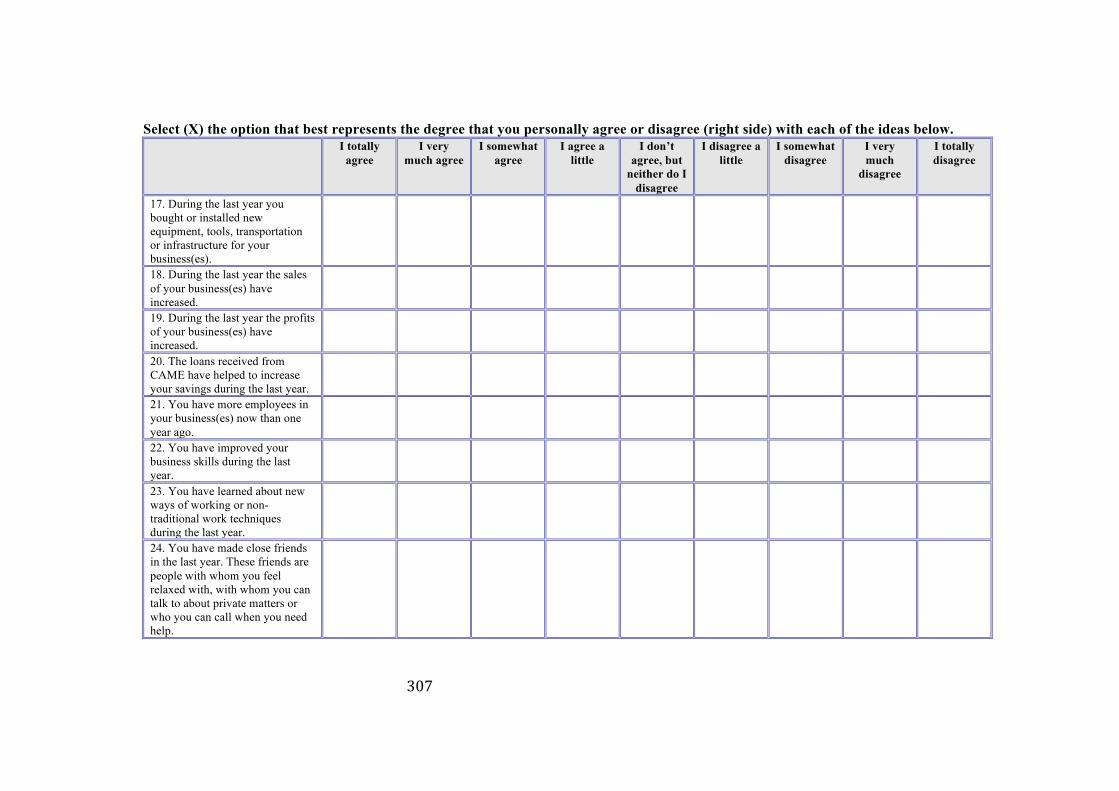
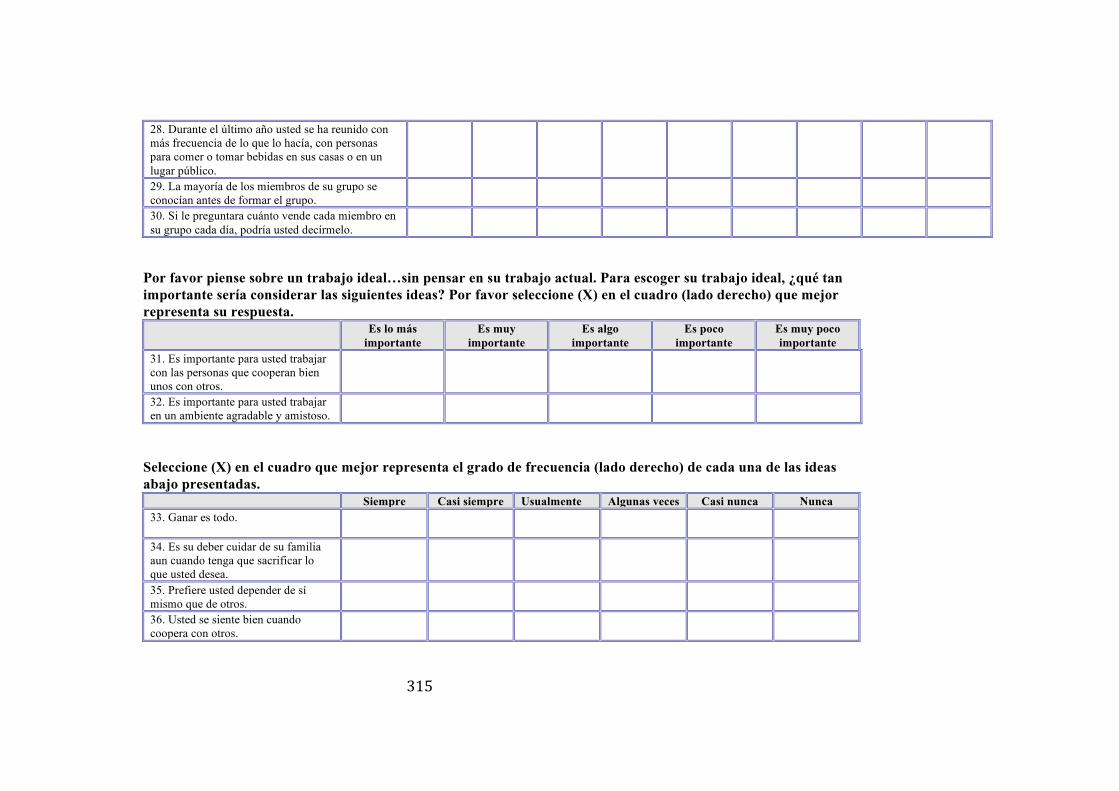
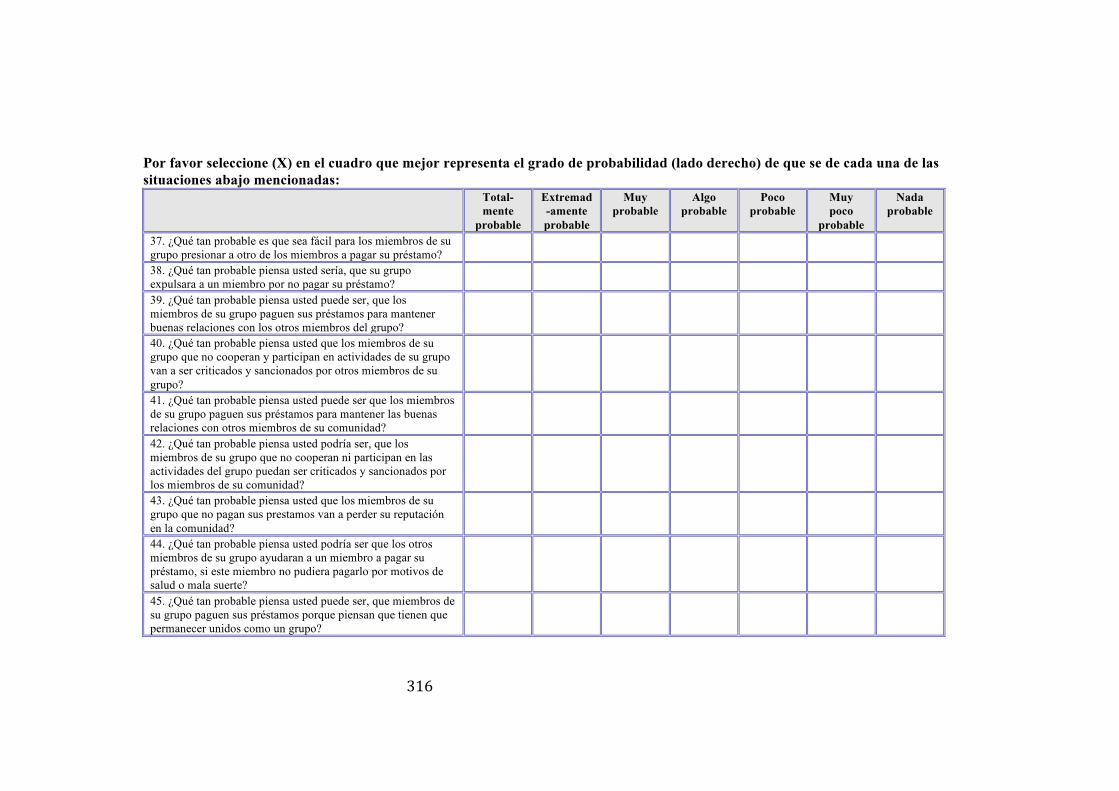
TABLE OF CONTENTS Dedication……………...…………………………………..………………….…iv Acknowledgements………….…………………………..………………………..v English Abstract……………………..…………………..…………………..…..xi Spanish Abstract…………………...……………………..……………………xiii List of Tables……………………………………..……………………..……..xvii List of Figures………………………………..…………………………….……xx CHAPTER 1: INTRODUCTION…………...…..………………………………1 1.1 Research questions………………………………………..…..……………….1 1.2 Relevance, Contribution and Future Research…………..…………………….6 1.3 Contents………….…..………………………………………………………11 CHAPTER 2: LITERATURE REVIEW…………..………………….………13 2.1 Introduction……………………………..……………………………………13 2.2 Defining Microfinance Institutions and Capital……………………..……….14 2.3 Gender and Capital Creation……………..…………………………………..16 2.4 Gender and Loan Methodology………….………….……………………….38 2.5 Loan Methodology, Environment and Group Size………………..…………51 2.6 Contribution and Future Research…………….………………..……………57 CHAPTER 3: THEORY AND HYPOTHESES………………………..….….62 3.1 Introduction…………………...………..…………………………………….62 3.2 Culture…………………………………..……………………………………62 3.3 Theory…………………...…………..……………………………………….85 3.4 Conceptual Model…………………………………..………………………..97 3.5 Hypotheses……………………...…..………………………………………101 CHAPTER 4: METHODOLOGY……………...…………………………….112 4.1 Introduction and Research Design………………………….………………112 4.2 Measurement…………...…………..……………………………………….114 4.3 Pilot Studies…………………………..…………………………………….141 4.4 Data Collection……….……………….……………………………………148 4.5 Testing………………..………………………………..……………………160 CHAPTER 5: RESULTS FOR CAME INDIVIDUAL LOANS……..….…172 5.1 Introduction…………..……………………………………………………..172 5.2 Descriptive Statistics………………..………………………………………173 5.3 Measurement Model and Construct Validity………….………..…………..179 5.4 Independent Samples T-tests………………………….……………………182 5.5 One-way Analysis of Variance……………………..…...………………….183 5.6 Causal Models………………………..…………..…………………………184 5.7 Latent Mean Differences…………………..………………………………..187 5.8 Conclusions………………………………………………………..………..188
xvi
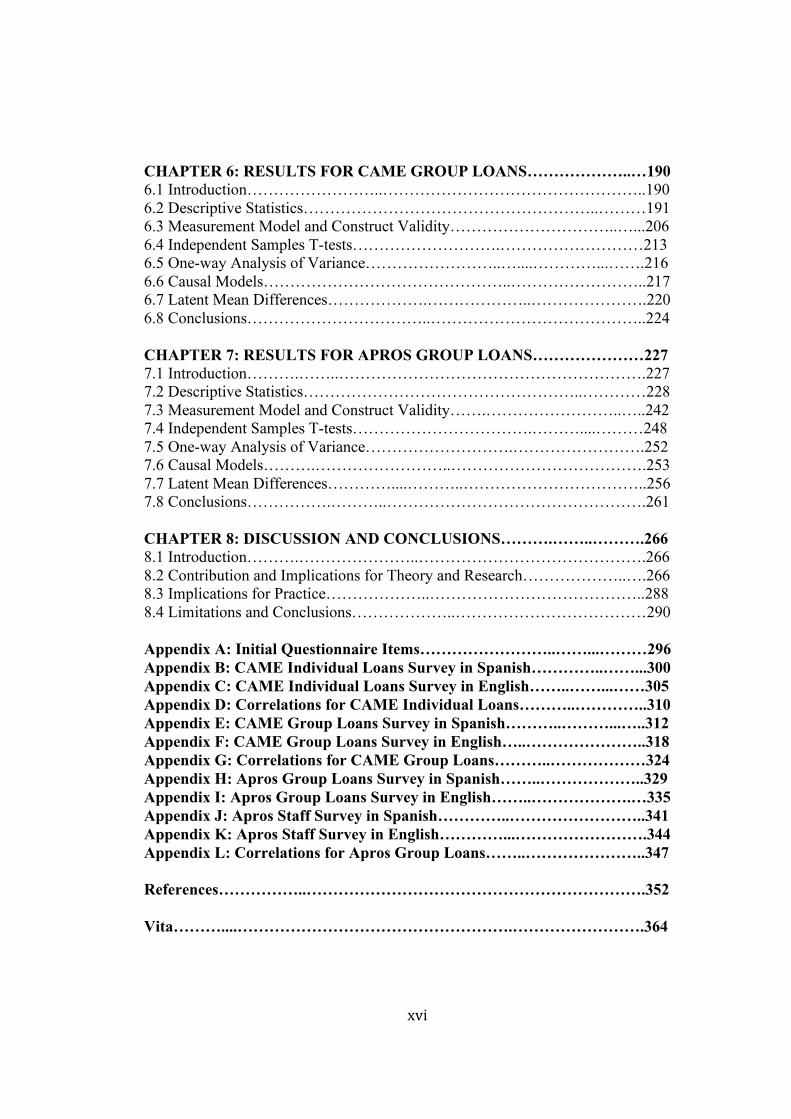
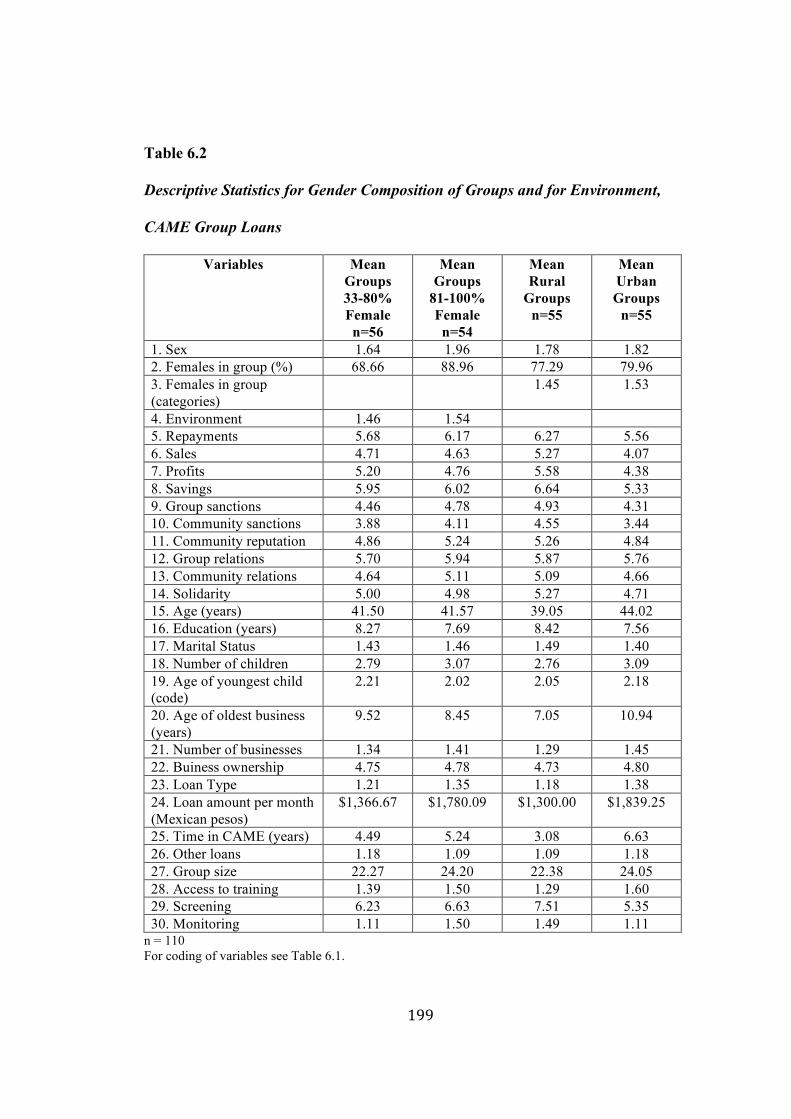
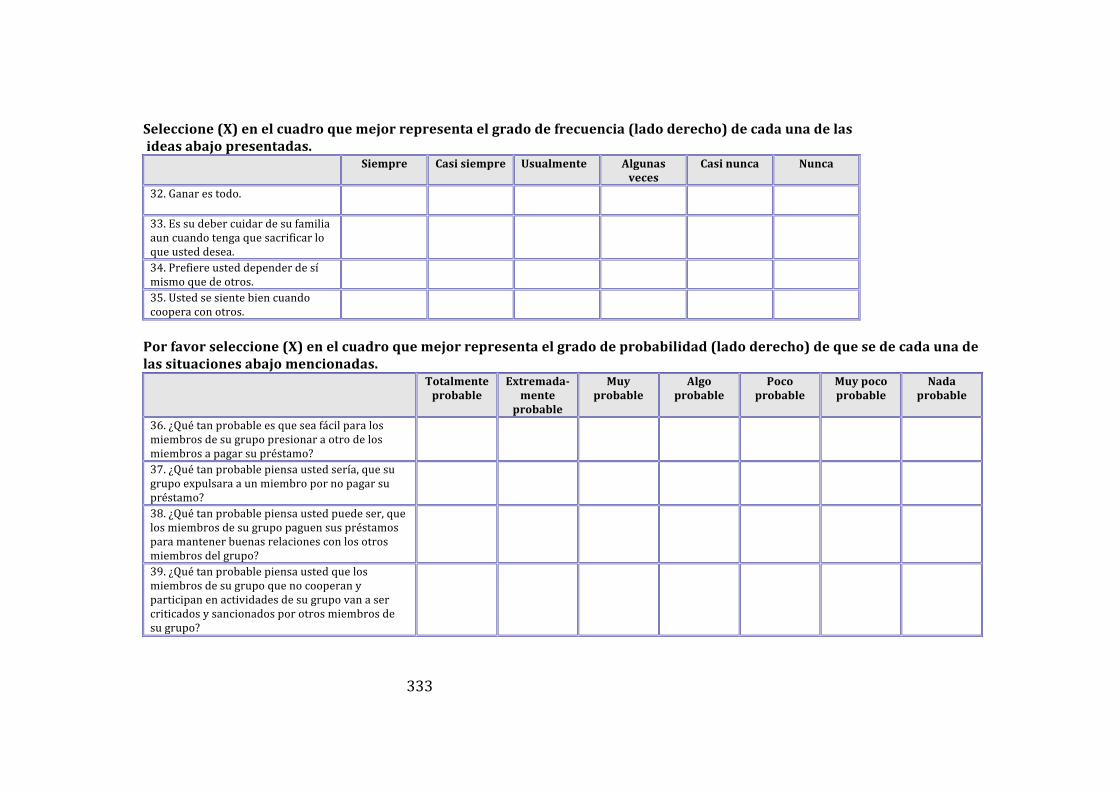
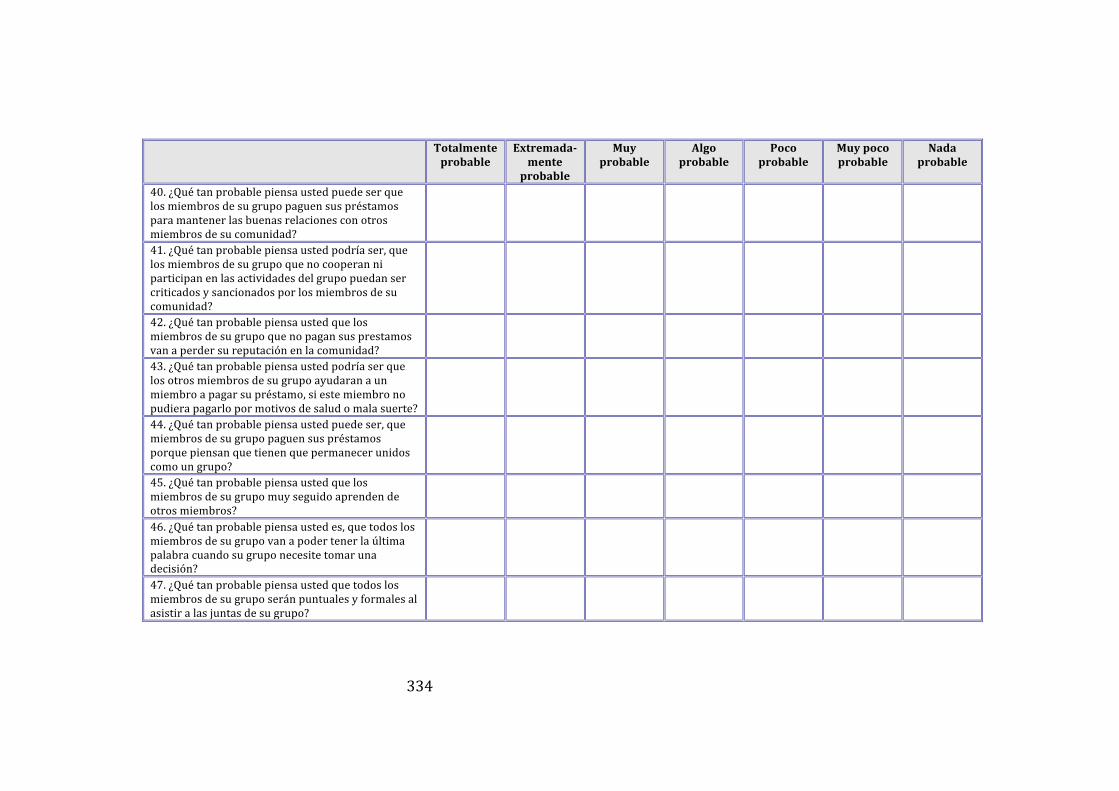
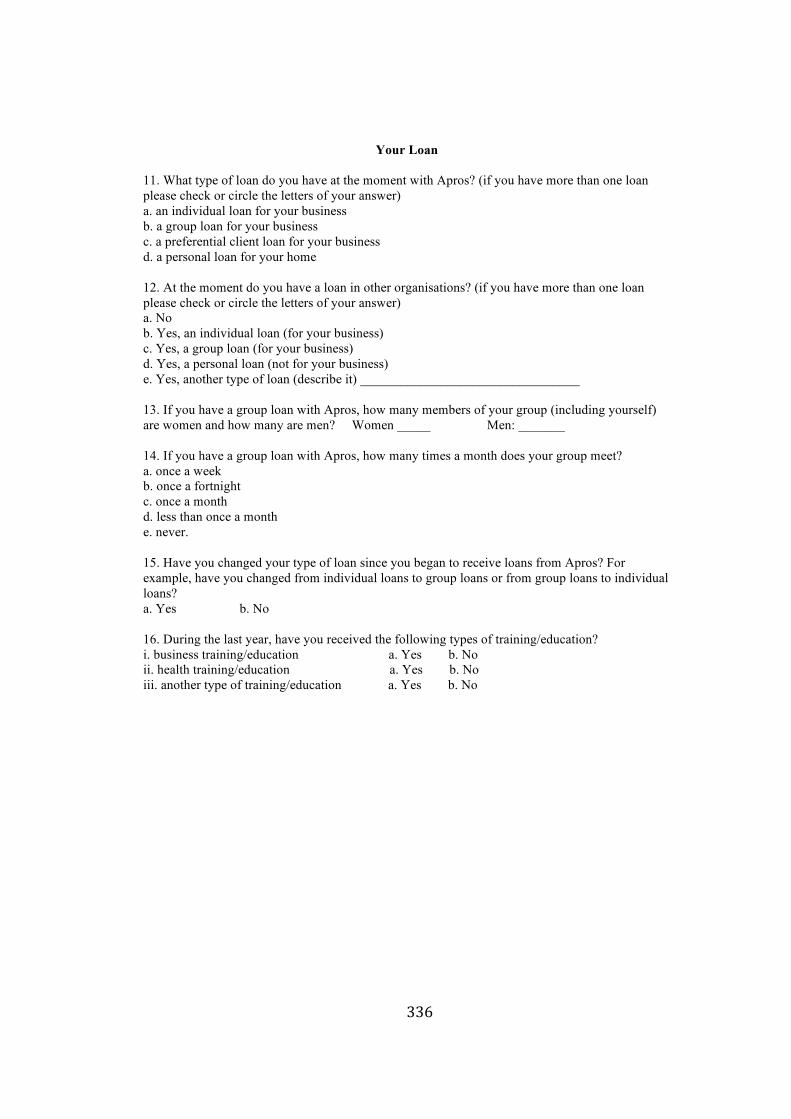
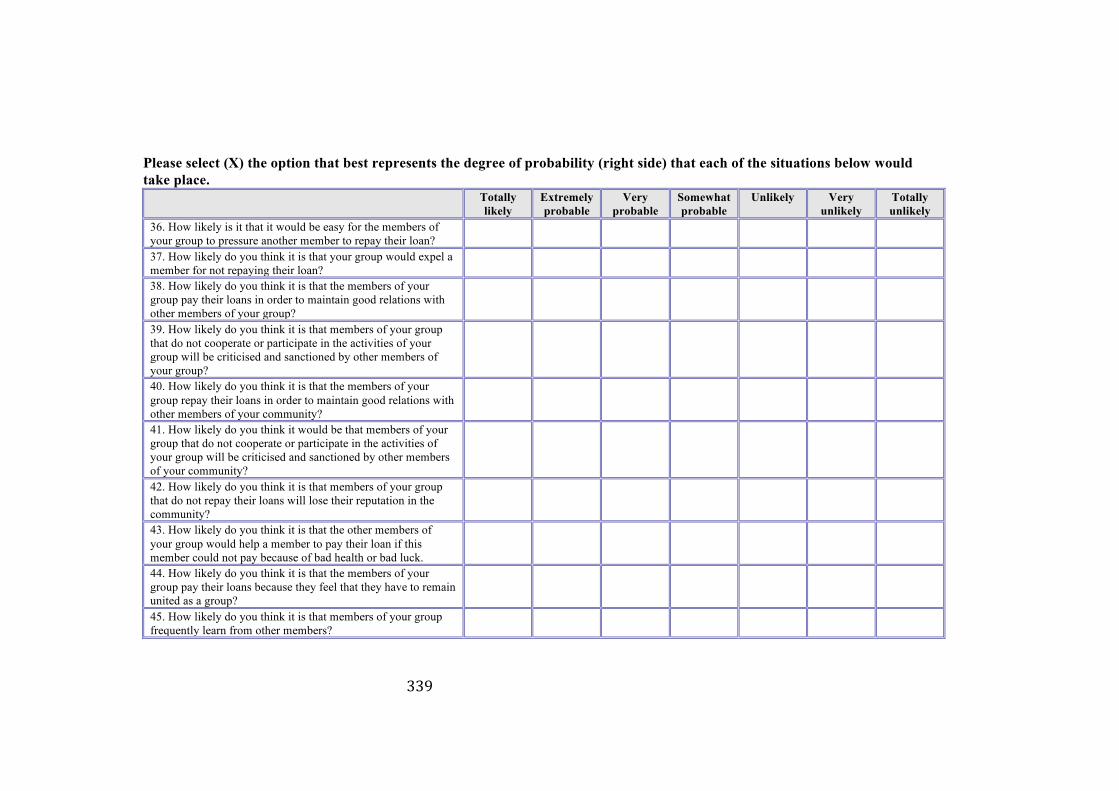
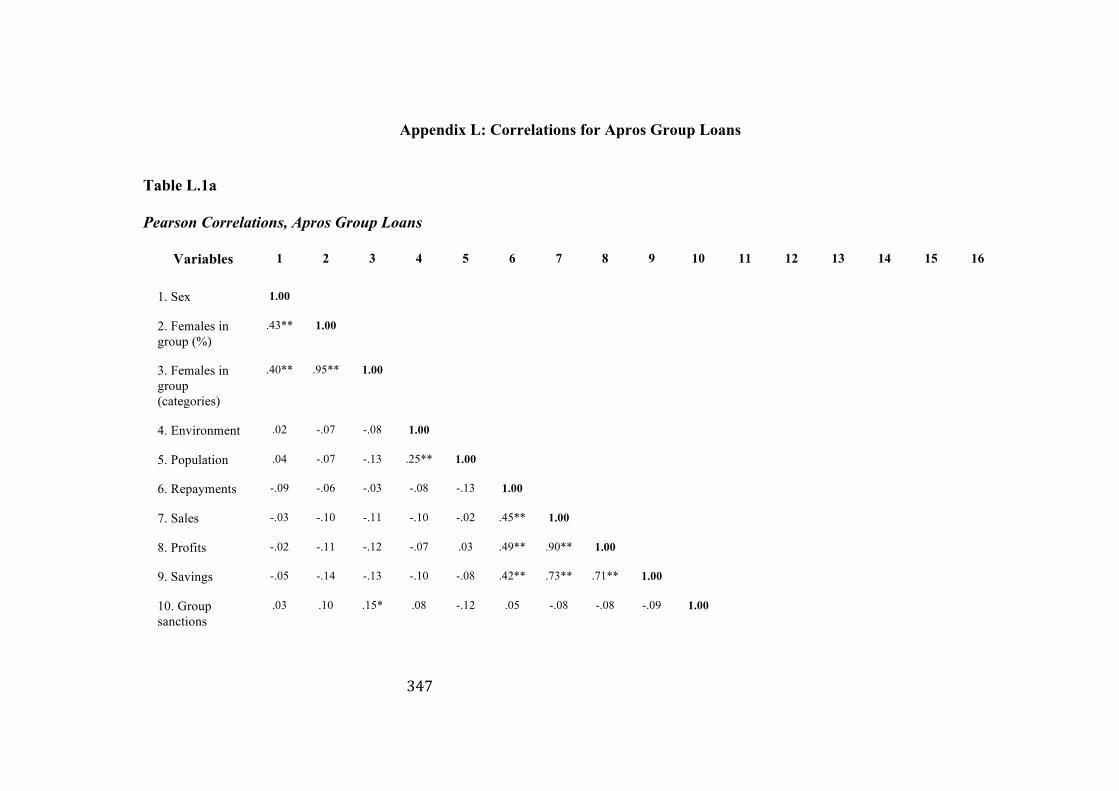
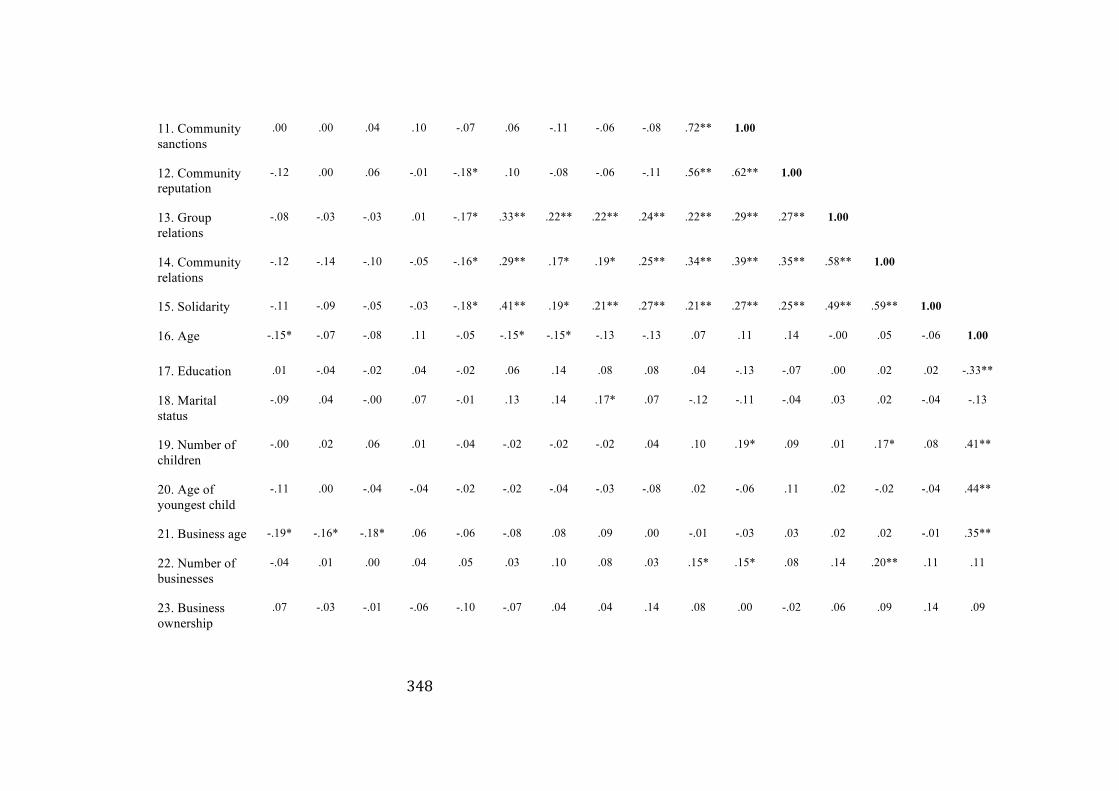
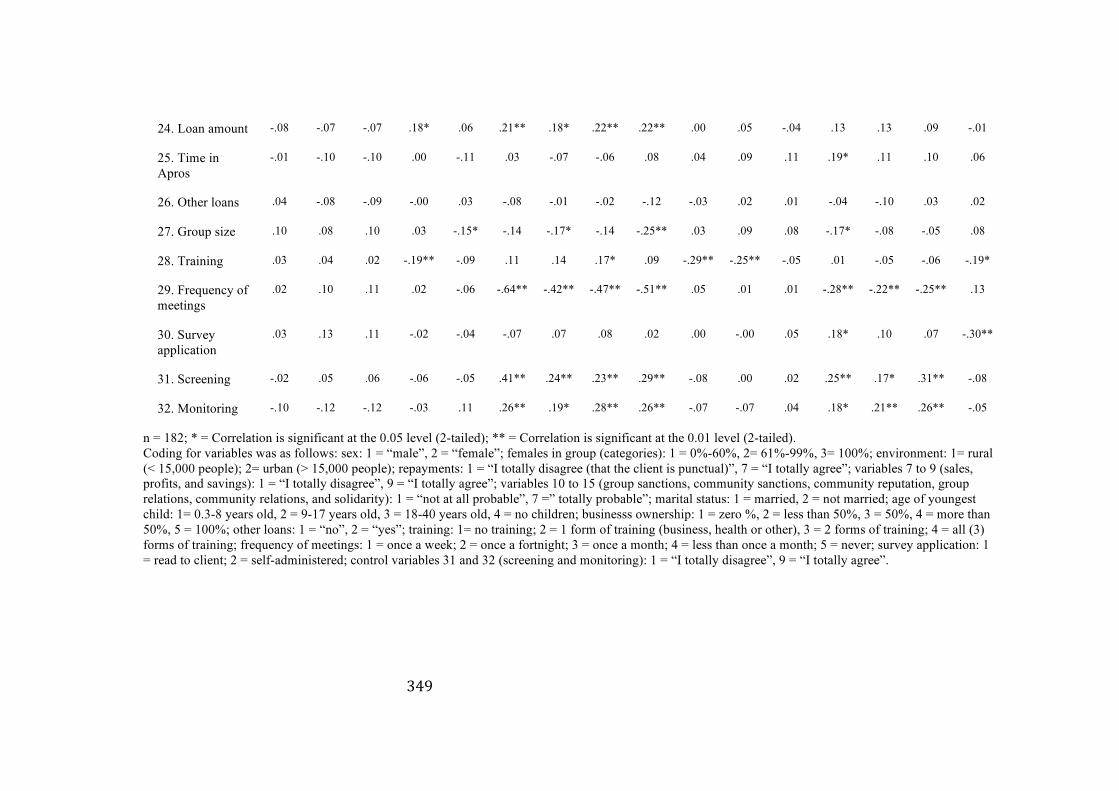
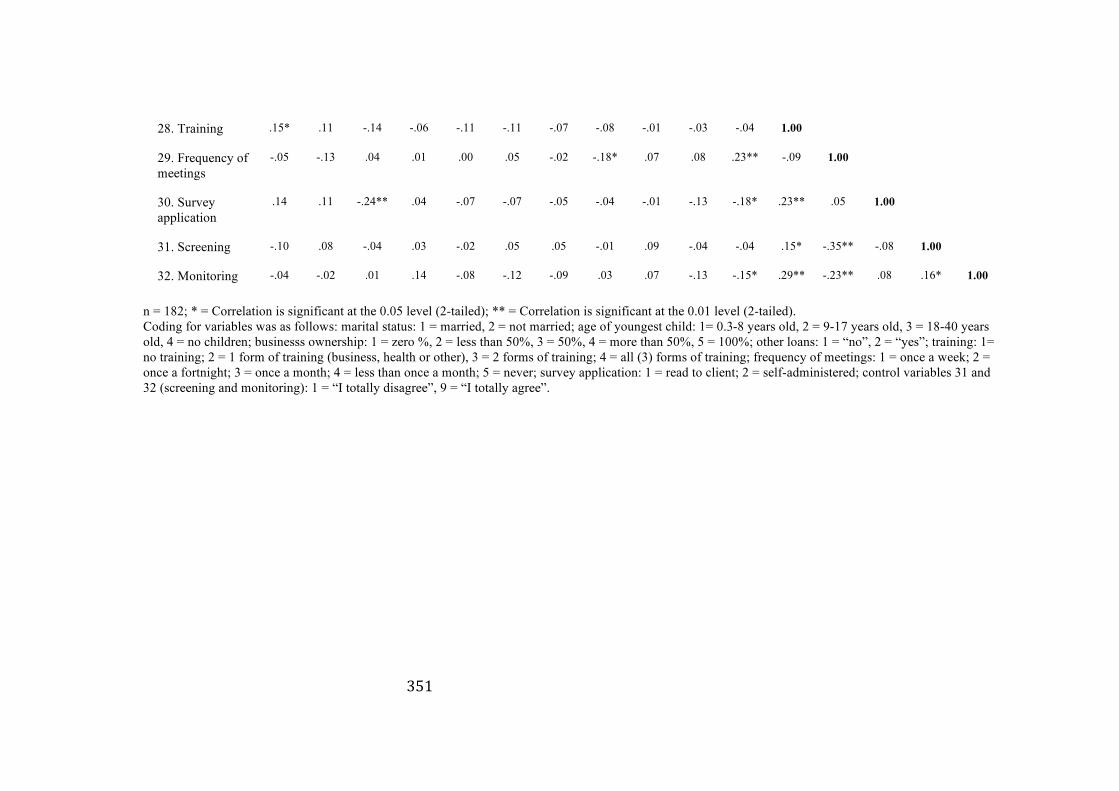
CHAPTER 6: RESULTS FOR CAME GROUP LOANS………………..…190 6.1 Introduction……………………..…………………………………………..190 6.2 Descriptive Statistics………………………………………………..………191 6.3 Measurement Model and Construct Validity…………………………..…...206 6.4 Independent Samples T-tests……………………….………………………213 6.5 One-way Analysis of Variance……………………..…....…………...…….216 6.6 Causal Models………………………………………..……………………..217 6.7 Latent Mean Differences……………….………………..………………….220 6.8 Conclusions……………………………..…………………………………..224 CHAPTER 7: RESULTS FOR APROS GROUP LOANS…………………227 7.1 Introduction……….……..………………………………………………….227 7.2 Descriptive Statistics……………………………………………..…………228 7.3 Measurement Model and Construct Validity…….……………………..…..242 7.4 Independent Samples T-tests…………………………….………....………248 7.5 One-way Analysis of Variance……………………….…………………….252 7.6 Causal Models……….……………………..……………………………….253 7.7 Latent Mean Differences…………....………..……………………………..256 7.8 Conclusions…………….………..………………………………………….261 CHAPTER 8: DISCUSSION AND CONCLUSIONS……….……..……….266 8.1 Introduction……….…………………..…………………………………….266 8.2 Contribution and Implications for Theory and Research………………..….266 8.3 Implications for Practice………………..…………………………………..288 8.4 Limitations and Conclusions………………..………………………………290 Appendix A: Initial Questionnaire Items……………………..……...………296 Appendix B: CAME Individual Loans Survey in Spanish…………..……...300 Appendix C: CAME Individual Loans Survey in English……..……...……305 Appendix D: Correlations for CAME Individual Loans………..…………..310 Appendix E: CAME Group Loans Survey in Spanish………..………...…..312 Appendix F: CAME Group Loans Survey in English…..…………………..318 Appendix G: Correlations for CAME Group Loans………..………………324 Appendix H: Apros Group Loans Survey in Spanish……..………………..329 Appendix I: Apros Group Loans Survey in English……..……………….…335 Appendix J: Apros Staff Survey in Spanish…………..……………………..341 Appendix K: Apros Staff Survey in English…………...…………………….344 Appendix L: Correlations for Apros Group Loans……..…………………..347 References……………..……………………………………………………….352 Vita………....…………………………………………….…………………….364
xvii
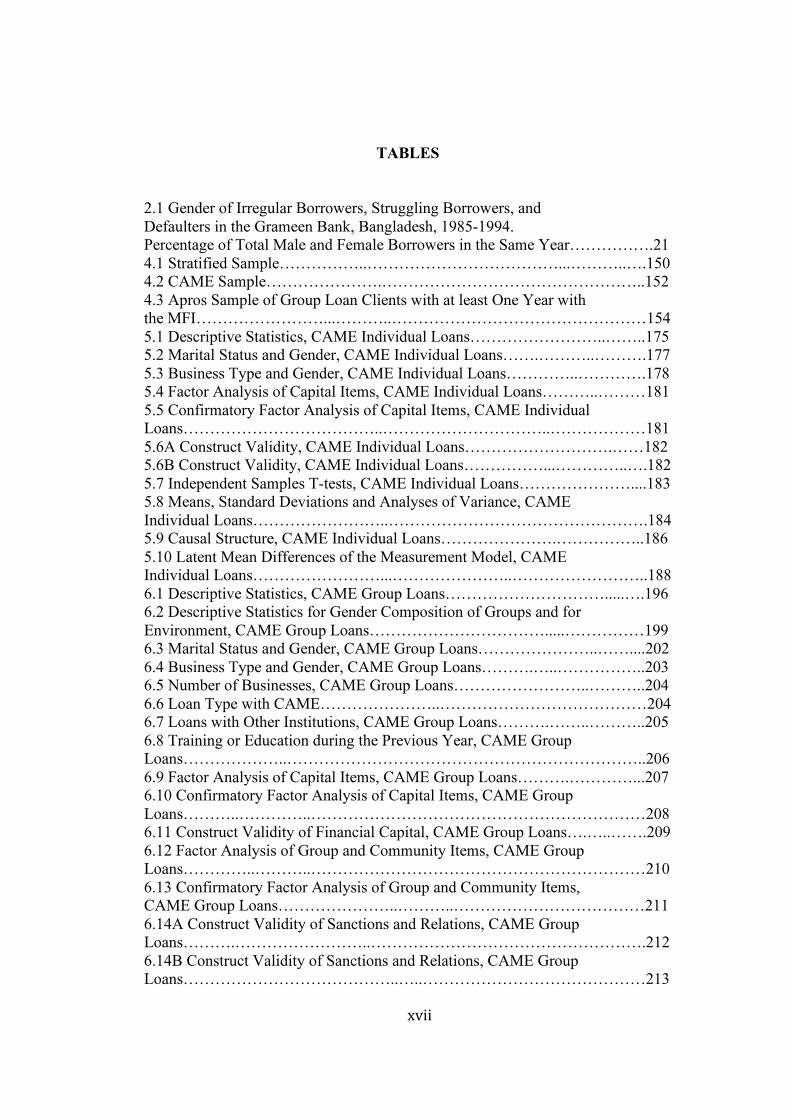
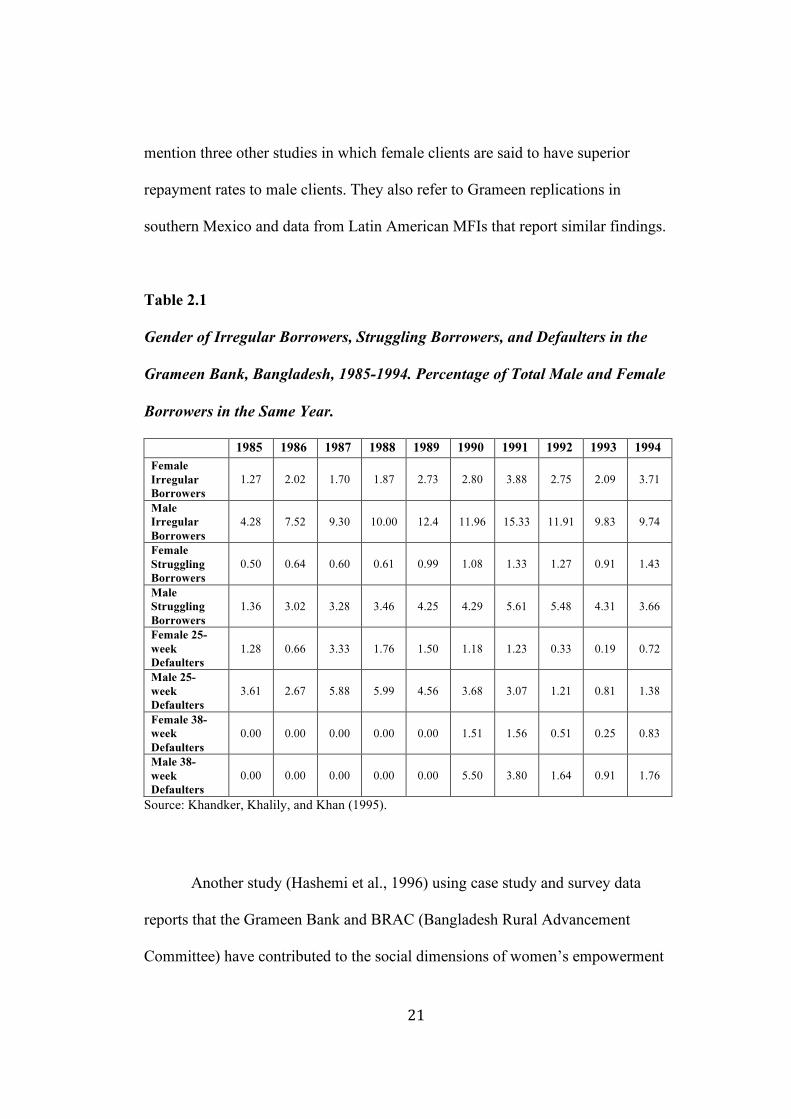
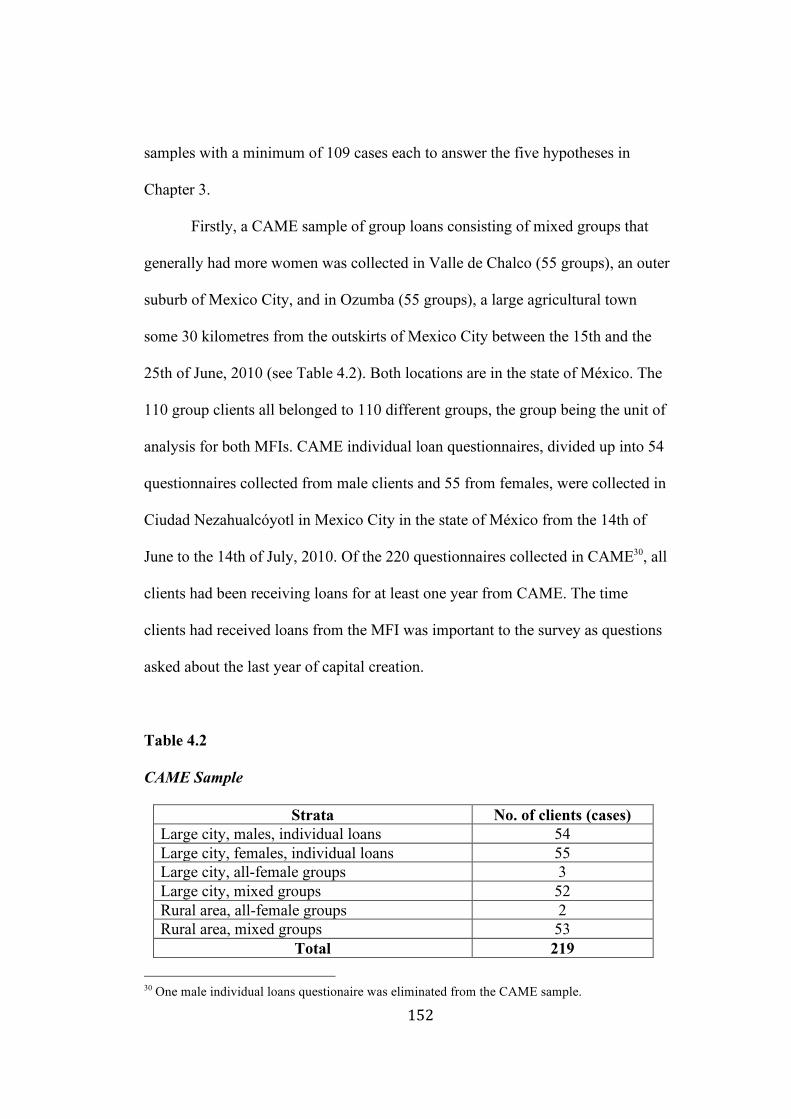
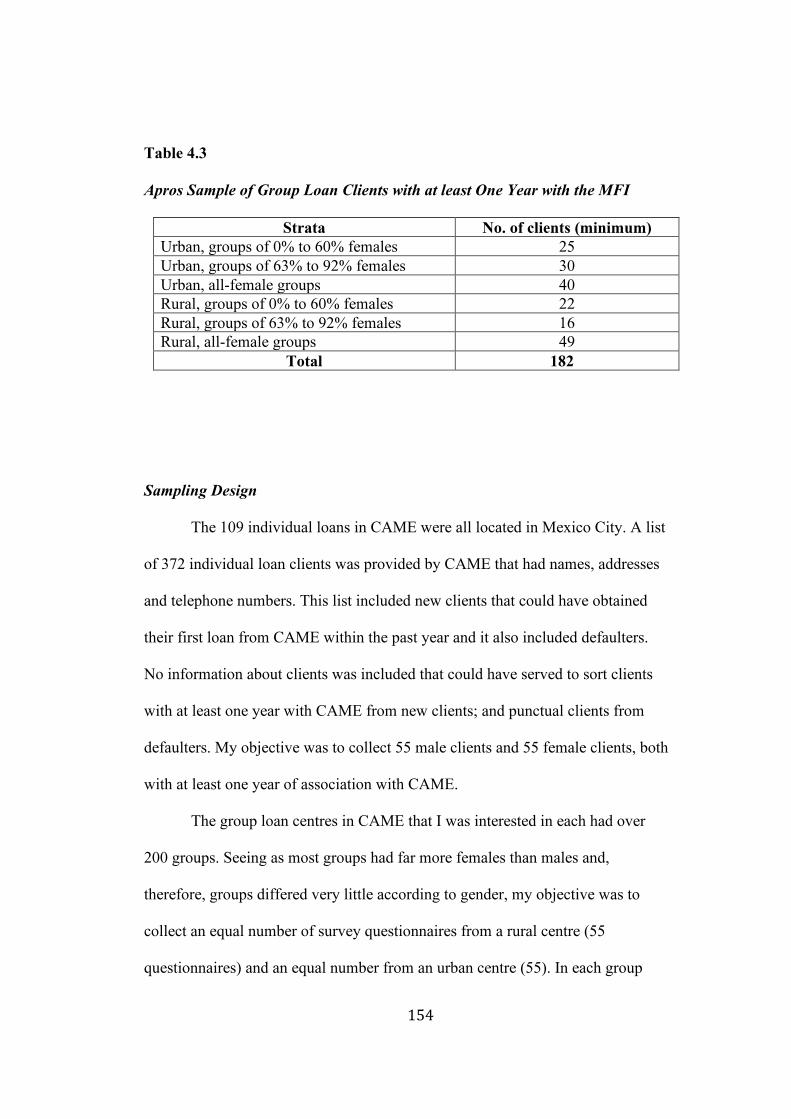
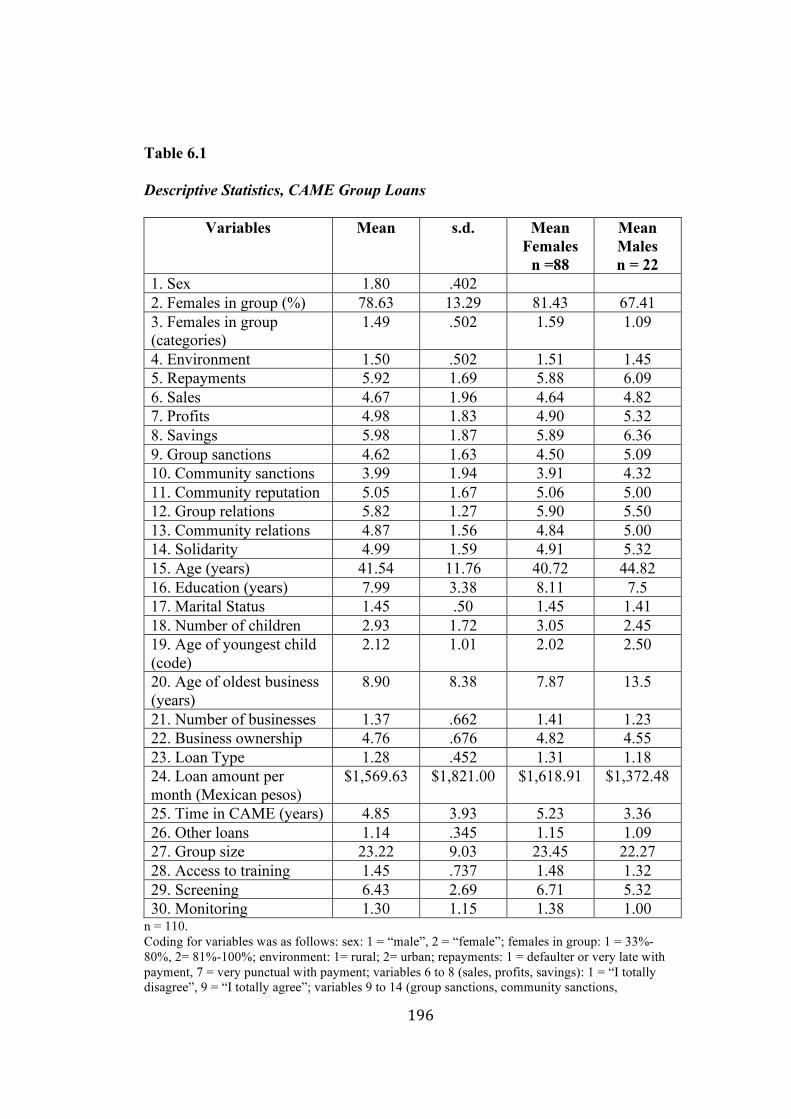
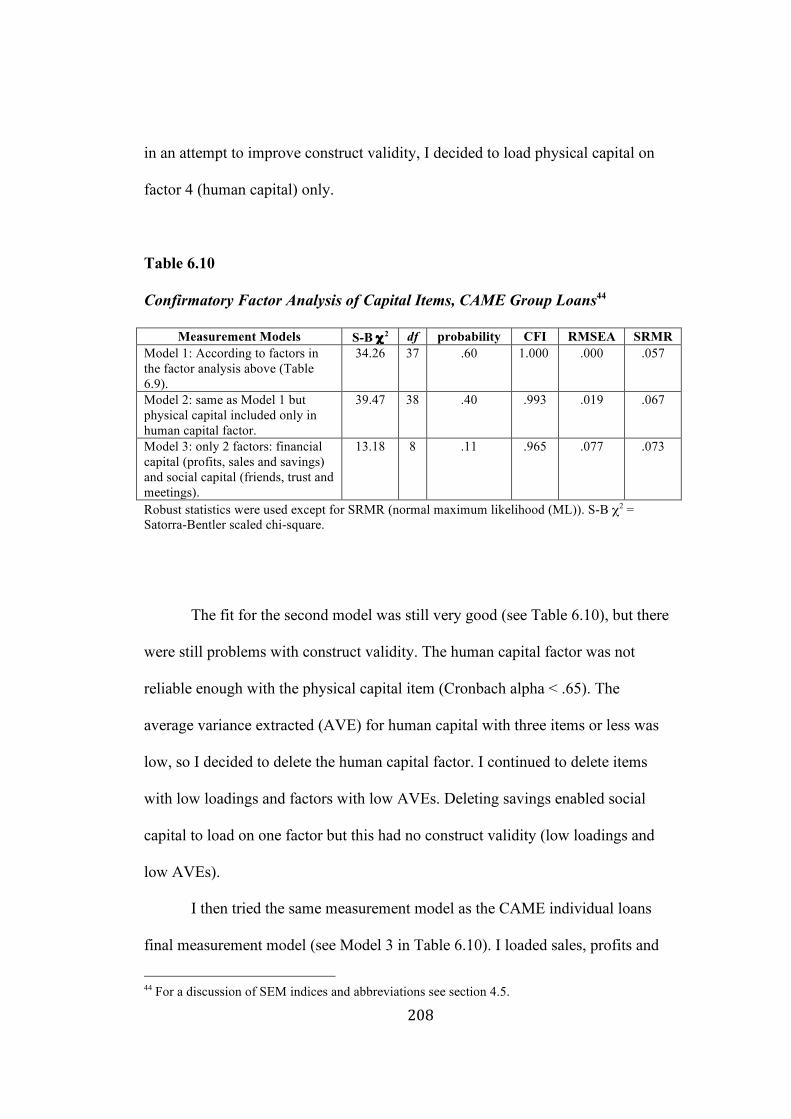
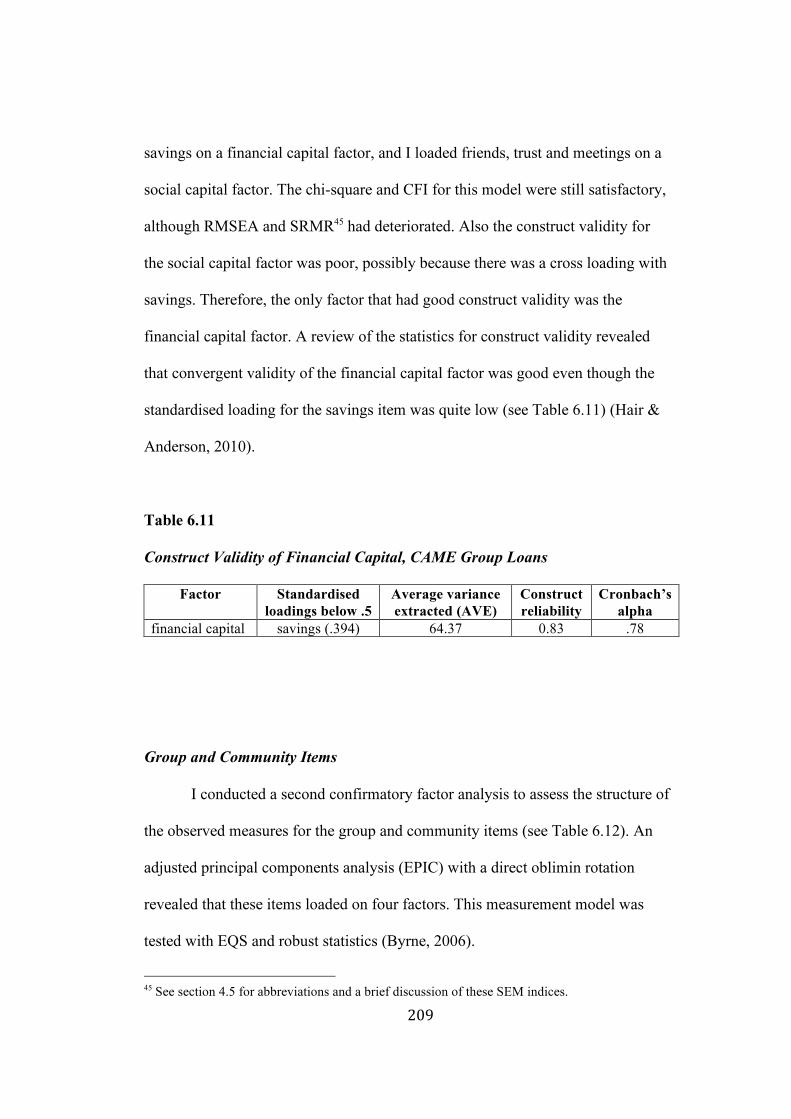
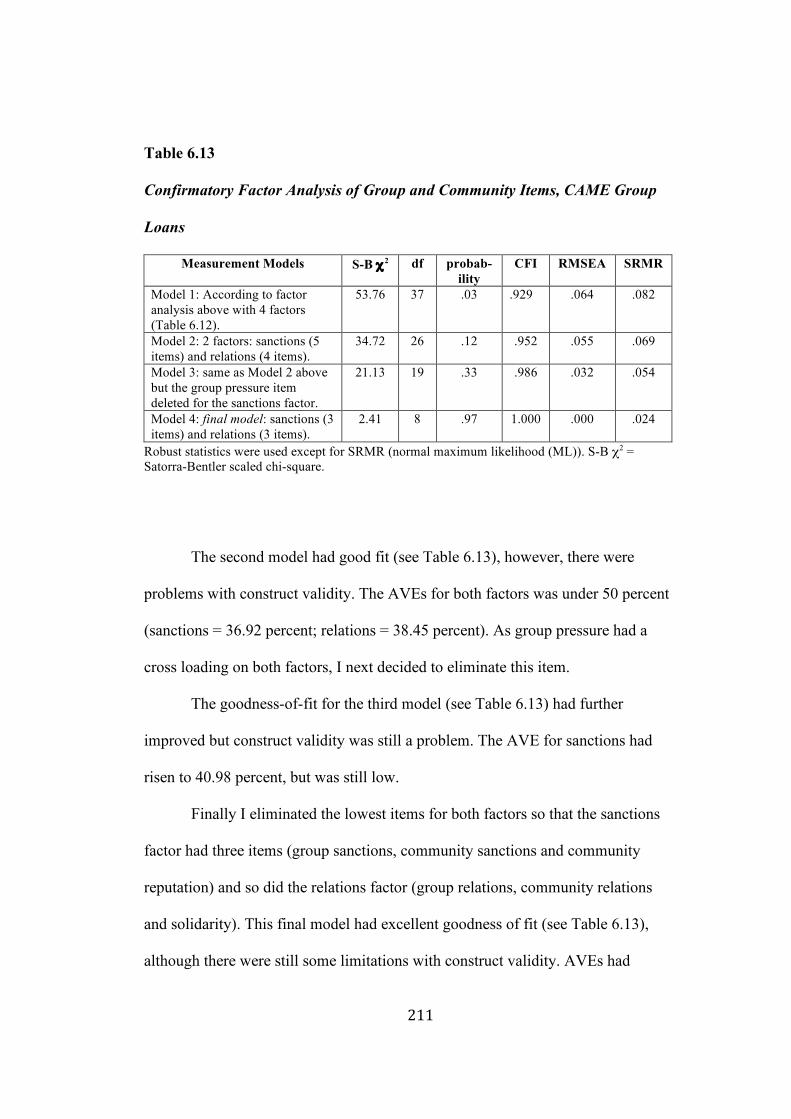
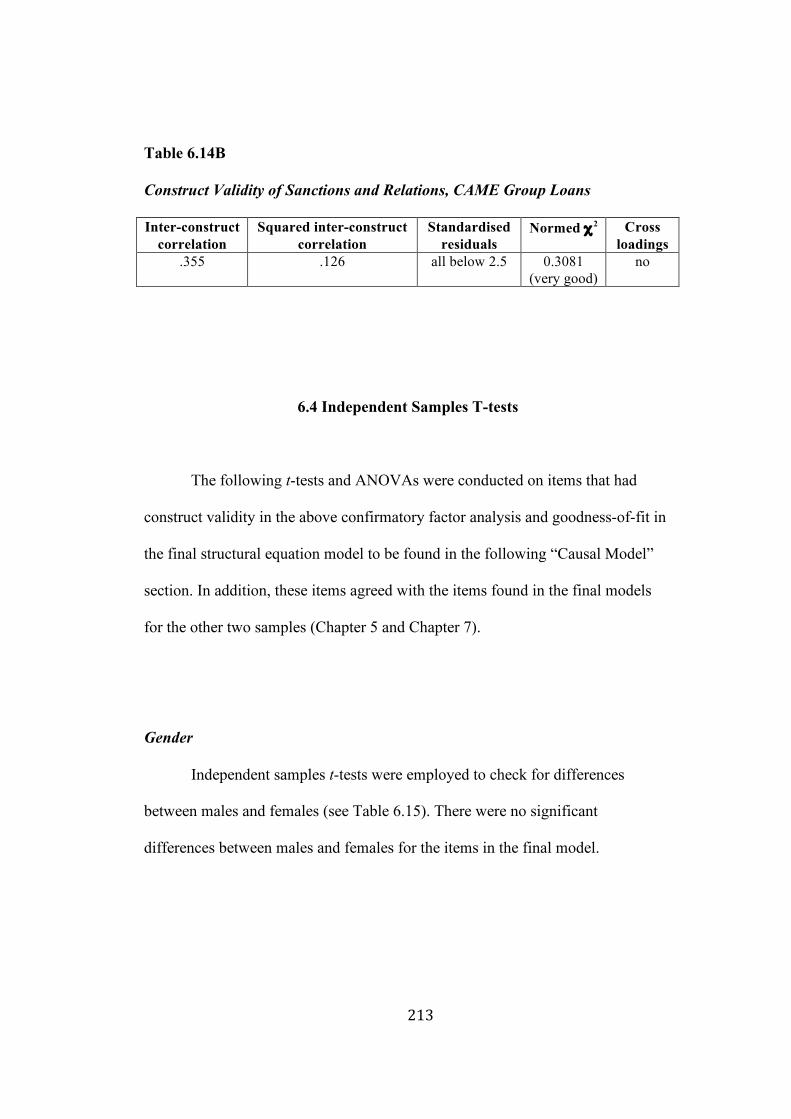
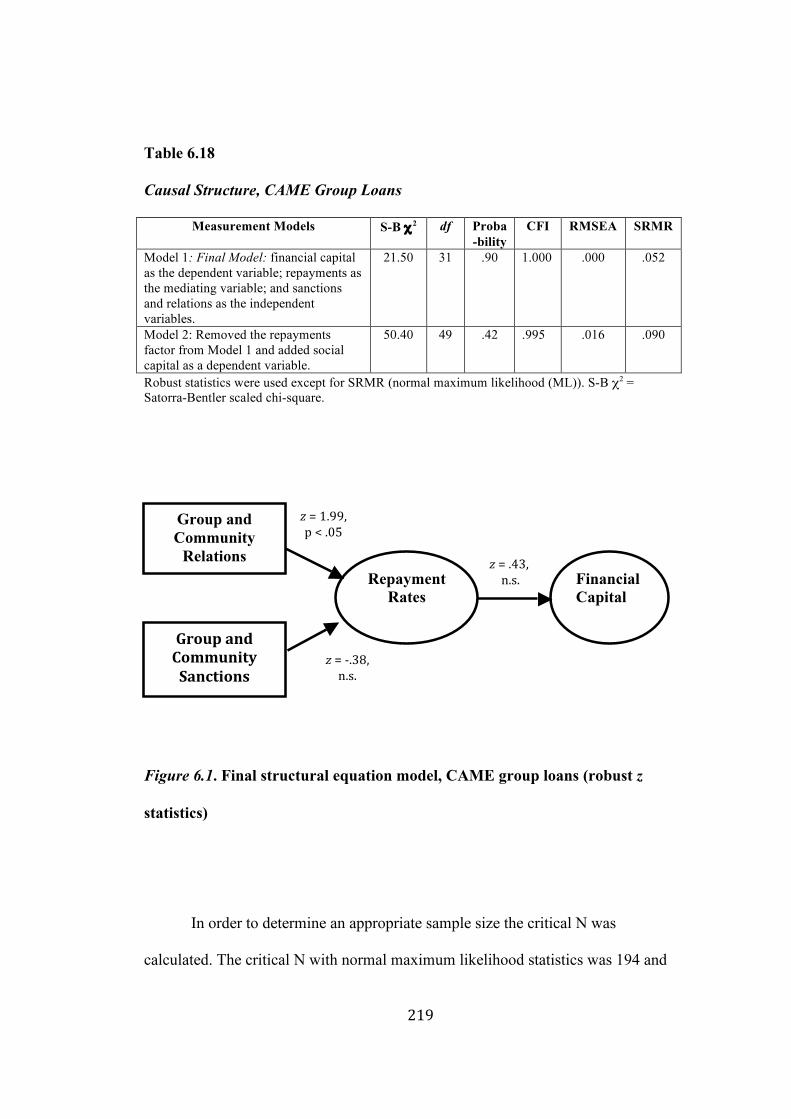
TABLES 2.1 Gender of Irregular Borrowers, Struggling Borrowers, and Defaulters in the Grameen Bank, Bangladesh, 1985-1994. Percentage of Total Male and Female Borrowers in the Same Year…………….21 4.1 Stratified Sample……………..………………………………...………..….150 4.2 CAME Sample………………….…………………………………………..152 4.3 Apros Sample of Group Loan Clients with at least One Year with the MFI……………………...………..…………………………………………154 5.1 Descriptive Statistics, CAME Individual Loans……………………..……..175 5.2 Marital Status and Gender, CAME Individual Loans…….………..……….177 5.3 Business Type and Gender, CAME Individual Loans…………..………….178 5.4 Factor Analysis of Capital Items, CAME Individual Loans………..………181 5.5 Confirmatory Factor Analysis of Capital Items, CAME Individual Loans………………………………..…………………………..………………181 5.6A Construct Validity, CAME Individual Loans……………………….……182 5.6B Construct Validity, CAME Individual Loans……………...…………..….182 5.7 Independent Samples T-tests, CAME Individual Loans…………………....183 5.8 Means, Standard Deviations and Analyses of Variance, CAME Individual Loans……………………..………………………………………….184 5.9 Causal Structure, CAME Individual Loans………………….……………..186 5.10 Latent Mean Differences of the Measurement Model, CAME Individual Loans……………………...…………………..……………………..188 6.1 Descriptive Statistics, CAME Group Loans………………………….....….196 6.2 Descriptive Statistics for Gender Composition of Groups and for Environment, CAME Group Loans…………………………….....……………199 6.3 Marital Status and Gender, CAME Group Loans…………………..……....202 6.4 Business Type and Gender, CAME Group Loans……….…..……………..203 6.5 Number of Businesses, CAME Group Loans……………………..………..204 6.6 Loan Type with CAME…………………..…………………………………204 6.7 Loans with Other Institutions, CAME Group Loans……….……..………..205 6.8 Training or Education during the Previous Year, CAME Group Loans………………..…………………………………………………………..206 6.9 Factor Analysis of Capital Items, CAME Group Loans……….…………...207 6.10 Confirmatory Factor Analysis of Capital Items, CAME Group Loans………..…………..………………………………………………………208 6.11 Construct Validity of Financial Capital, CAME Group Loans….…..…….209 6.12 Factor Analysis of Group and Community Items, CAME Group Loans…………..………..………………………………………………………210 6.13 Confirmatory Factor Analysis of Group and Community Items, CAME Group Loans…………………..………..………………………………211 6.14A Construct Validity of Sanctions and Relations, CAME Group Loans……….……………………..…………………………………………….212 6.14B Construct Validity of Sanctions and Relations, CAME Group Loans…………………………………..…..……………………………………213
xviii
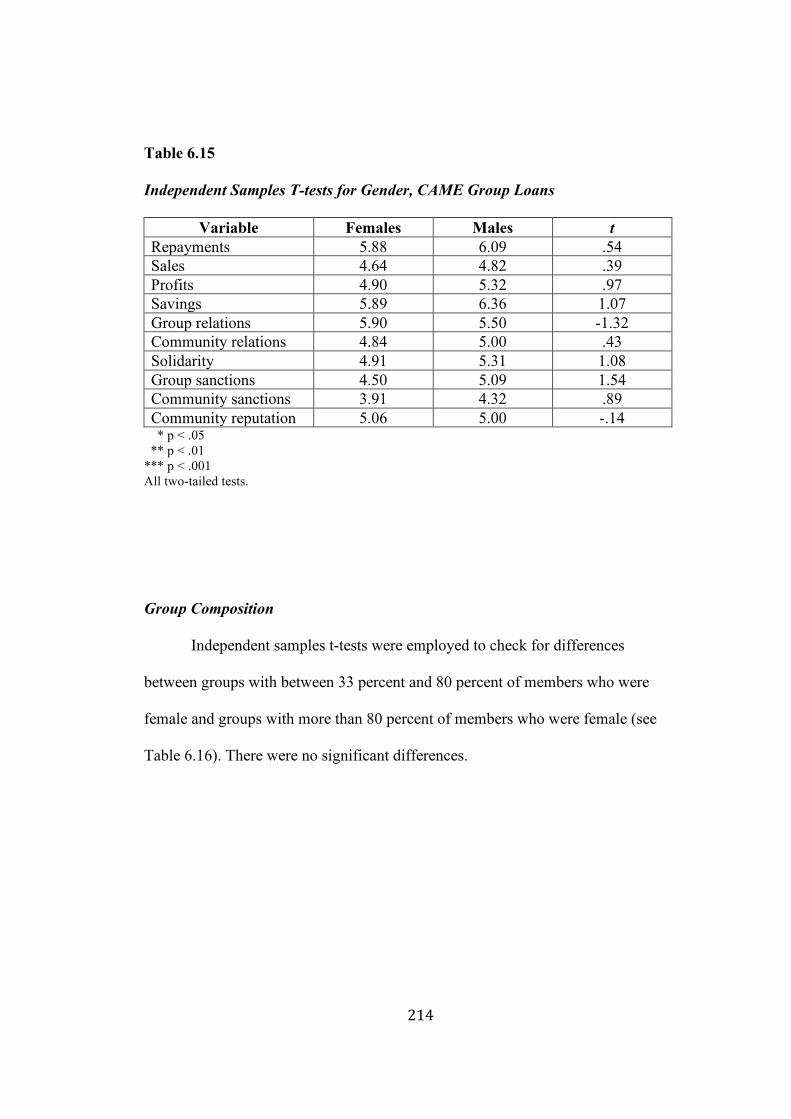
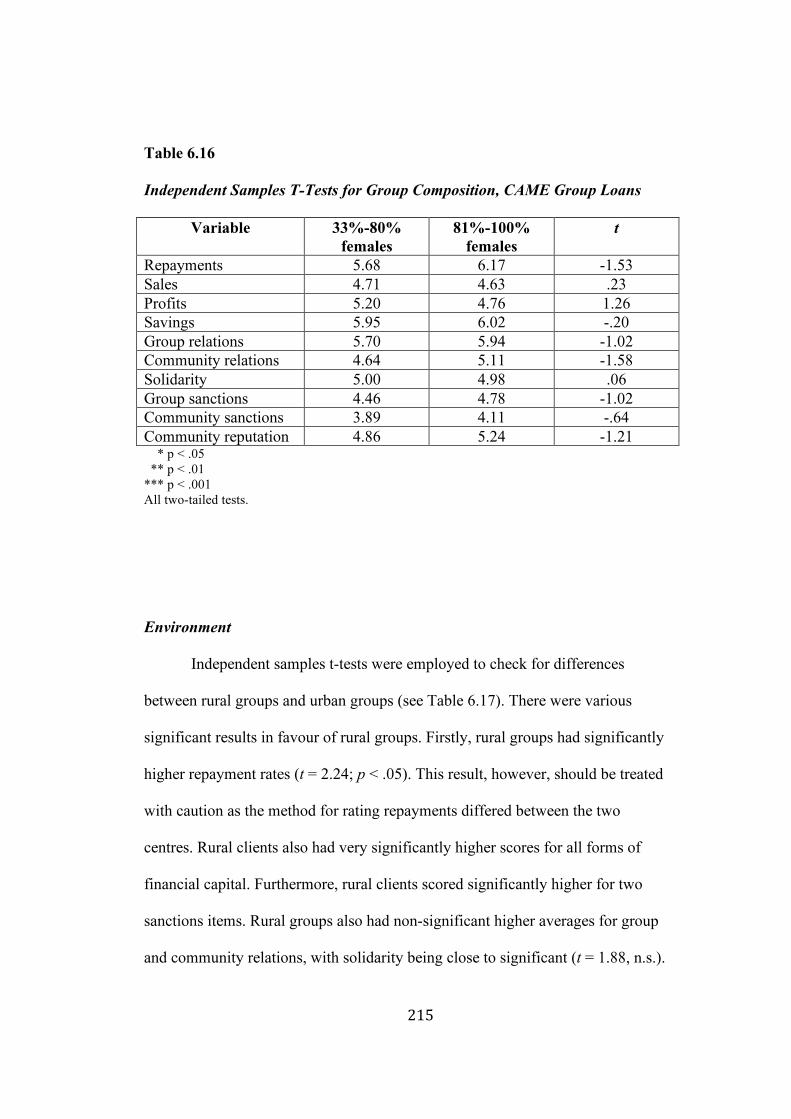
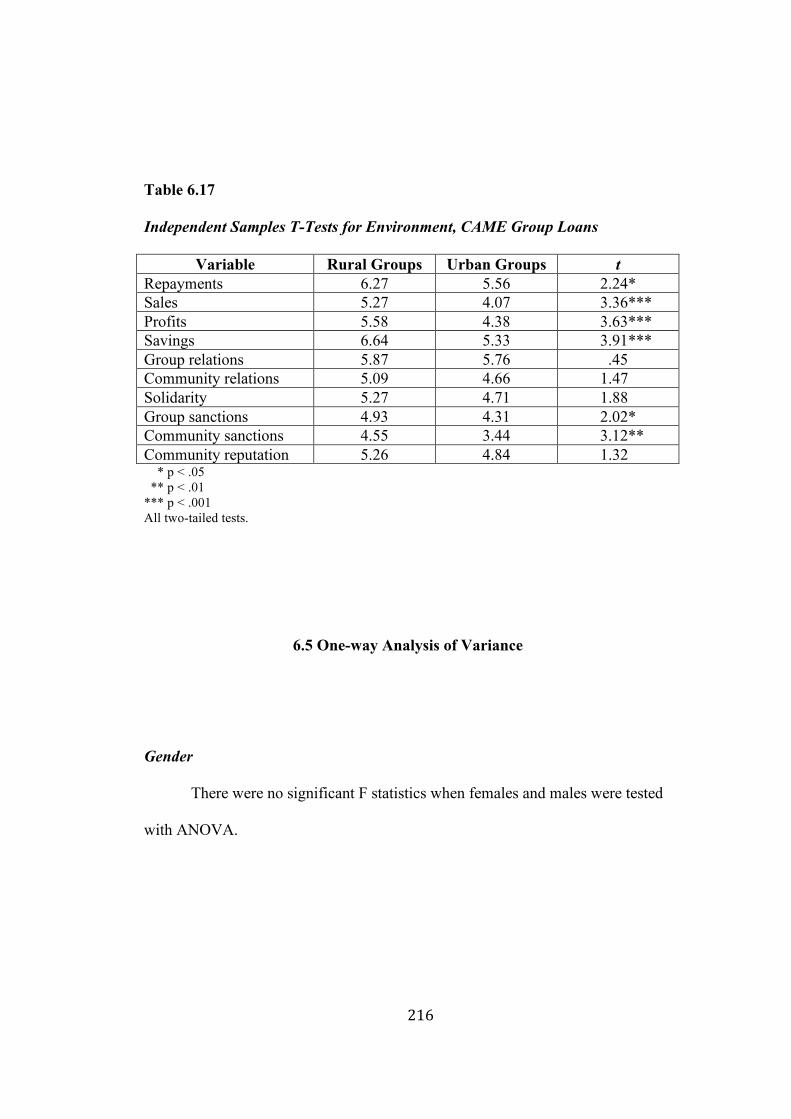
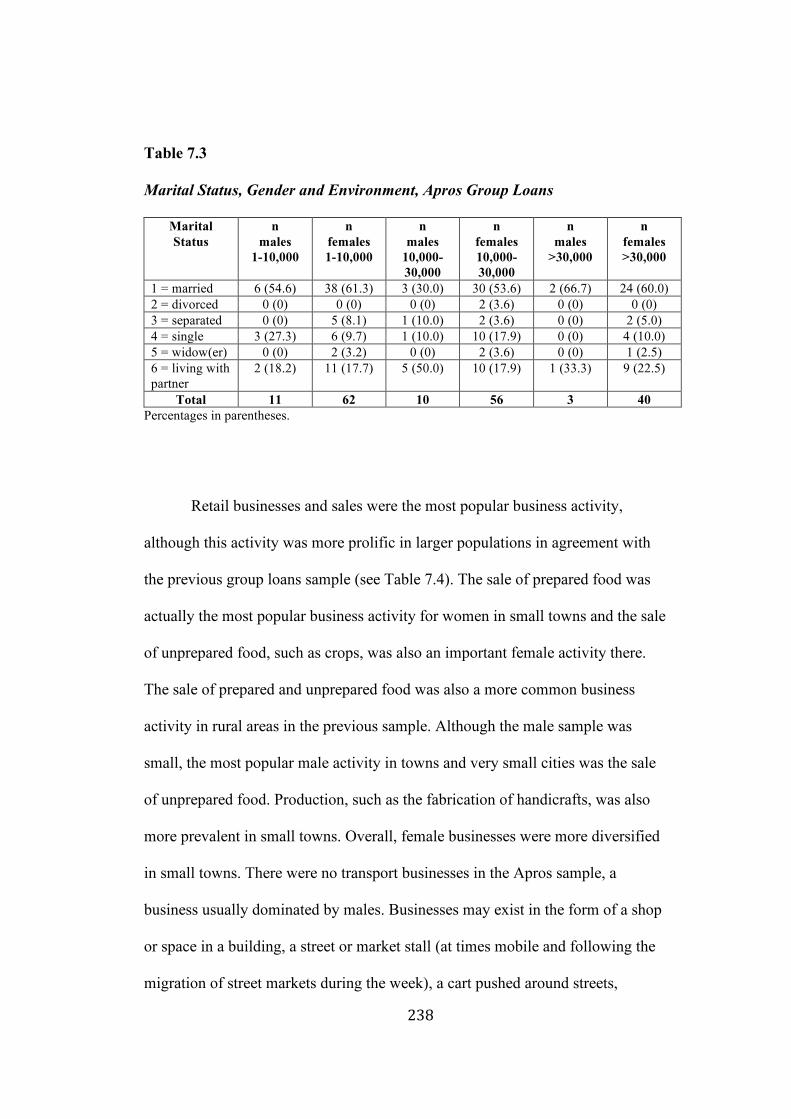
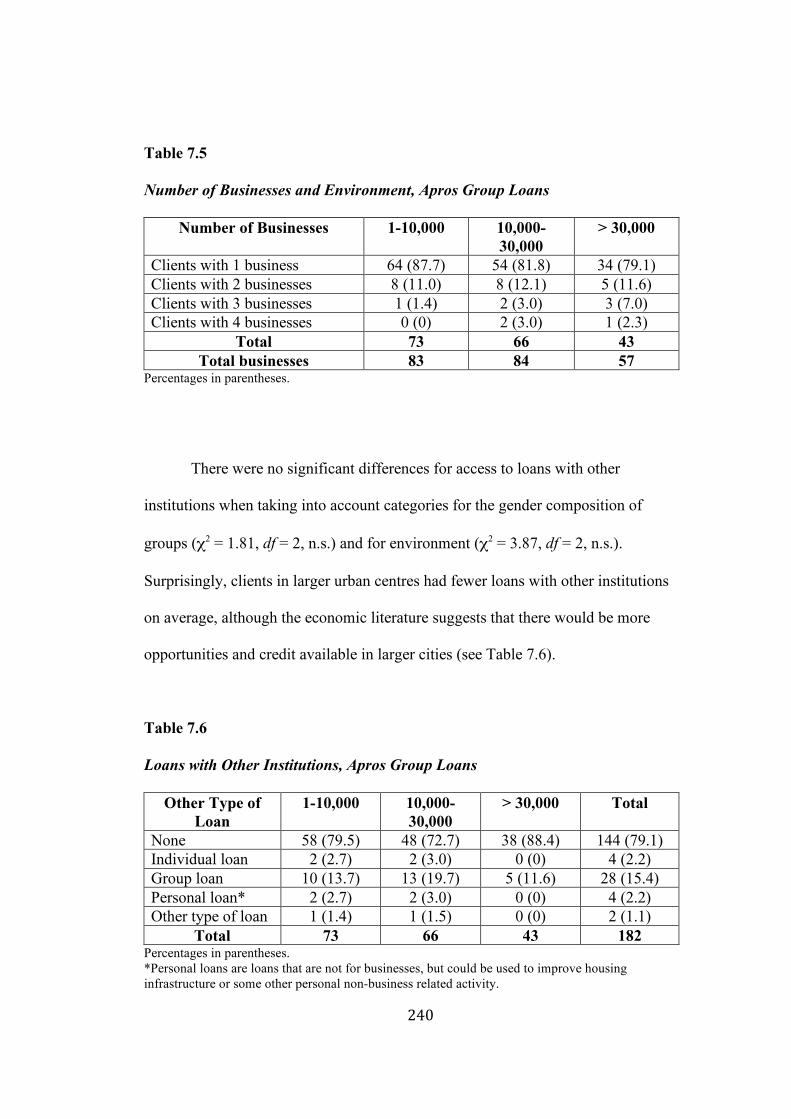
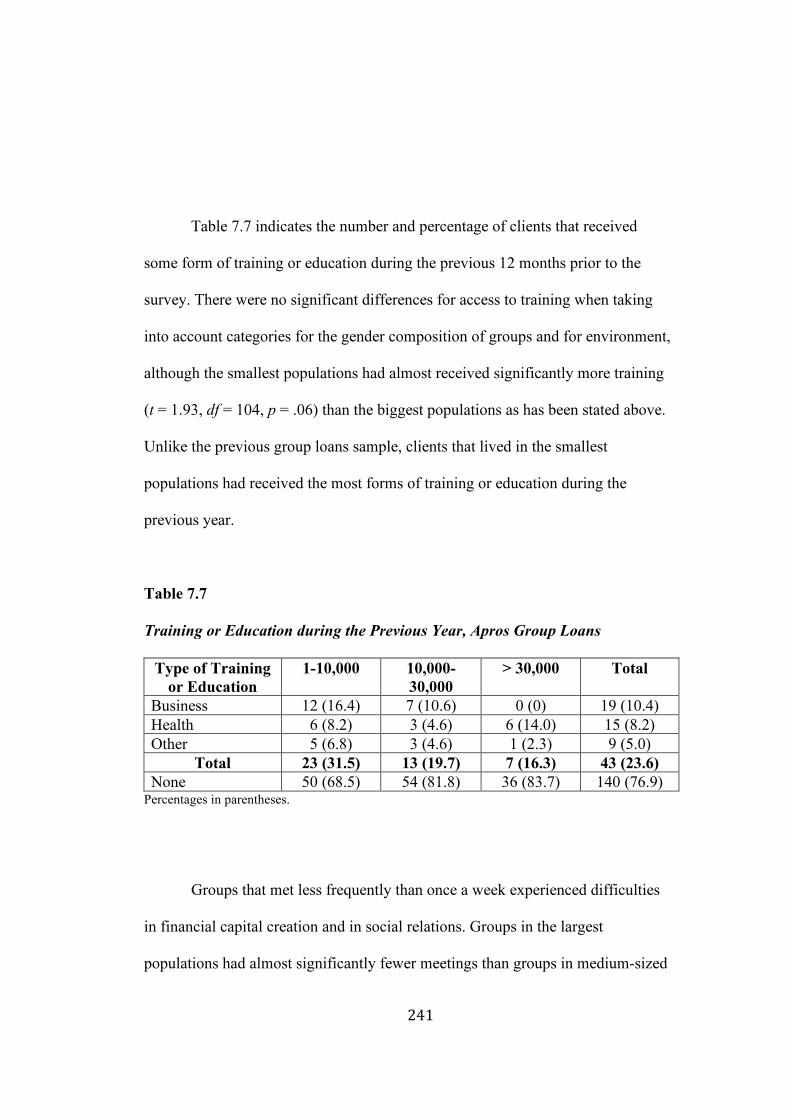
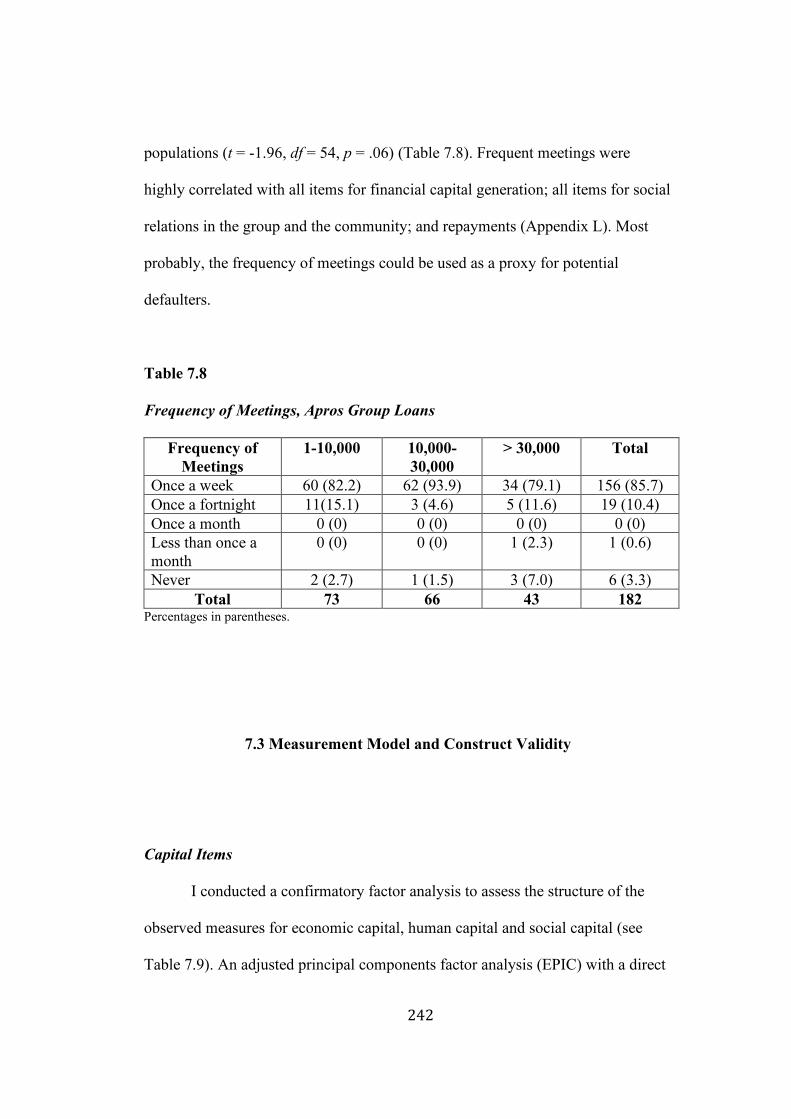
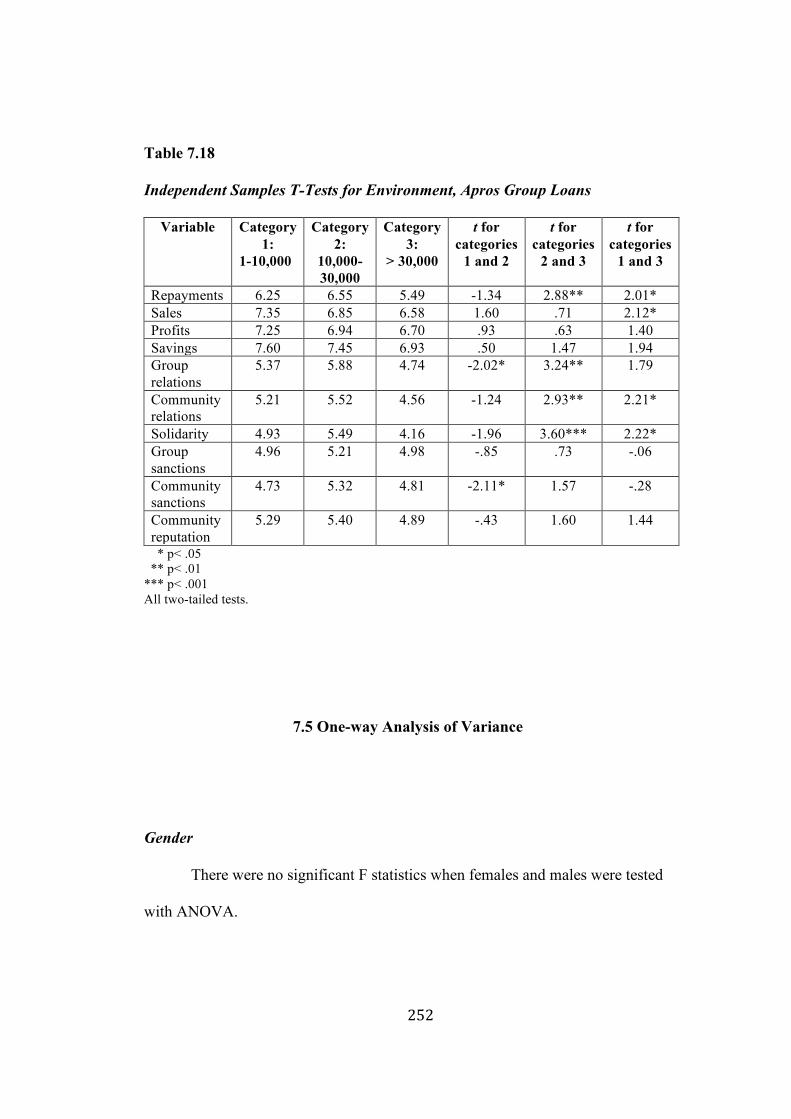
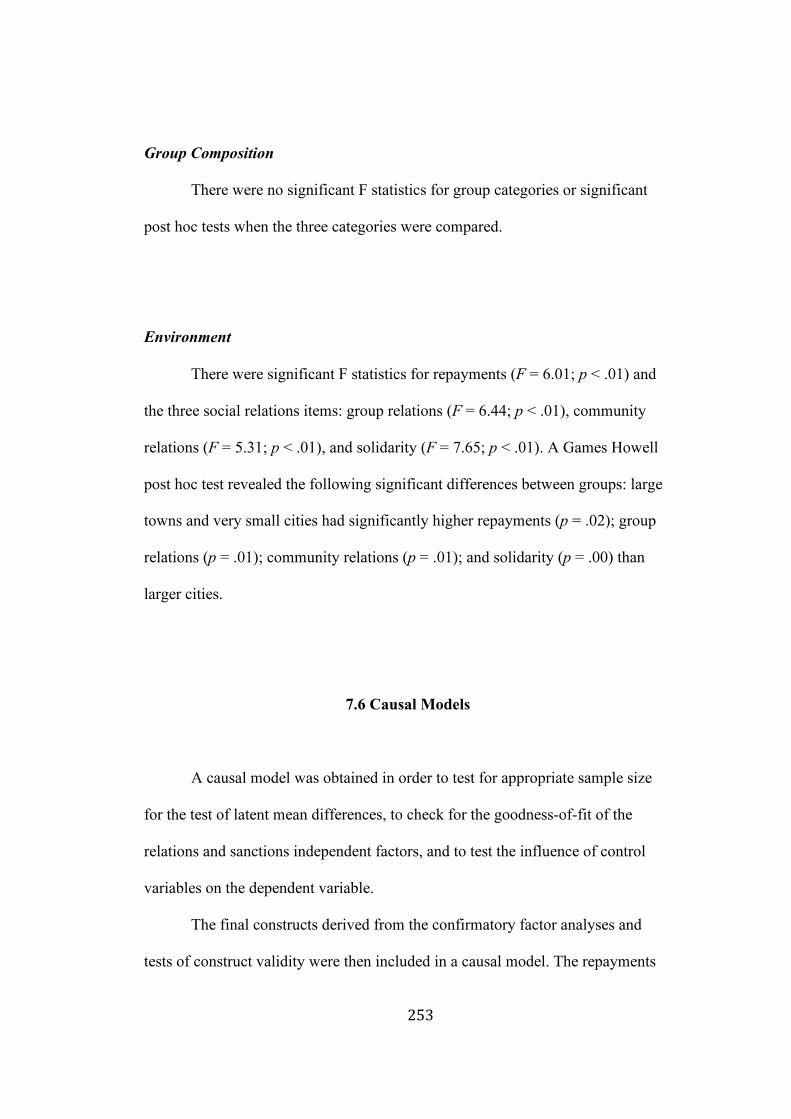
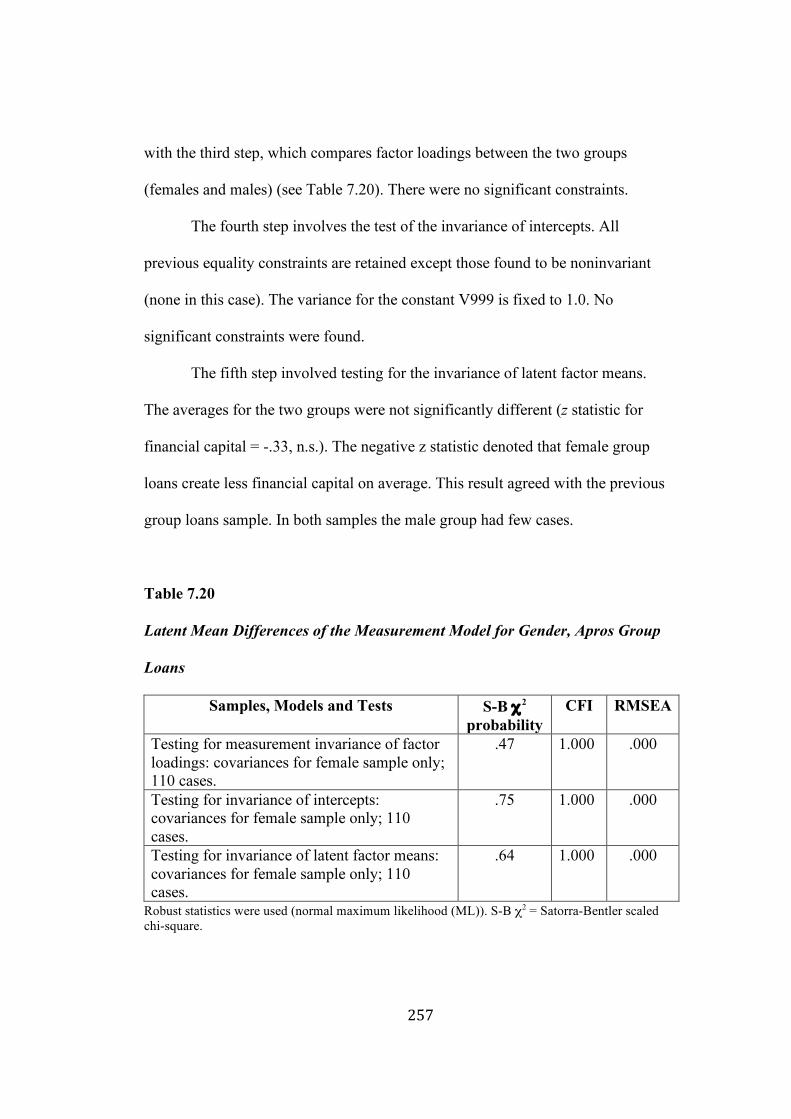
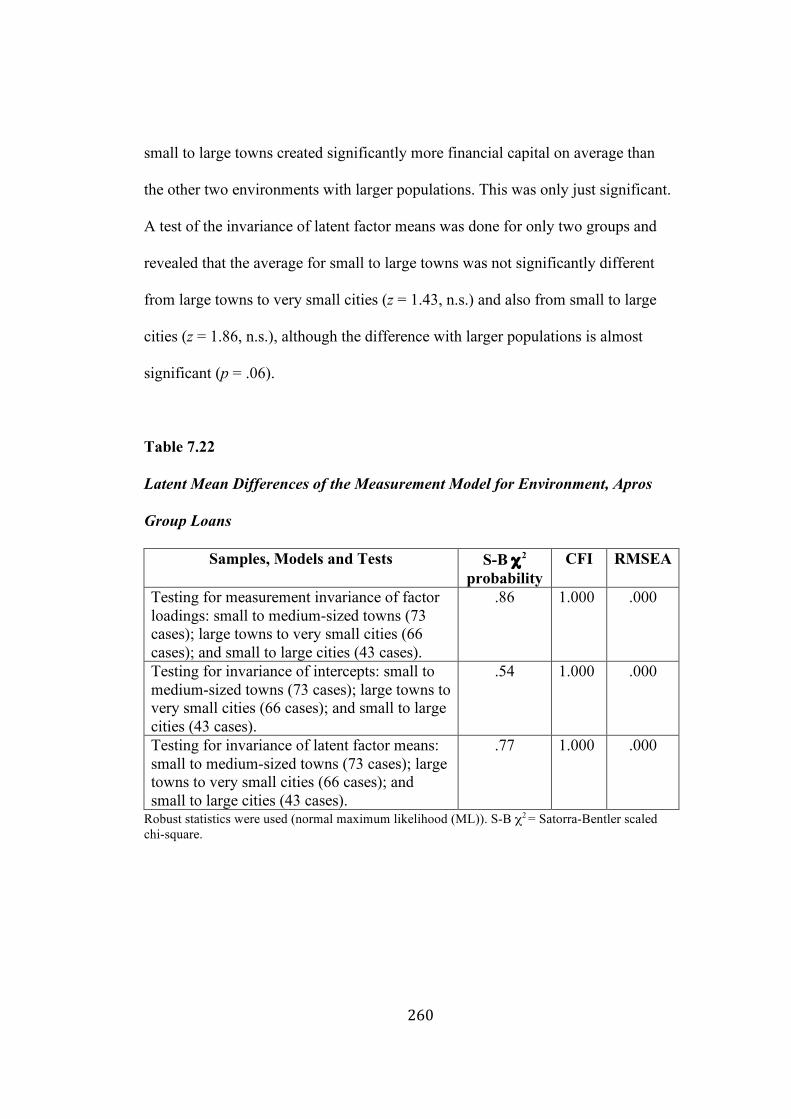
6.15 Independent Samples T-tests for Gender, CAME Group Loans………..…214 6.16 Independent Samples T-tests for Group Composition, CAME Group Loans…………………………..………………..……………………….215 6.17 Independent Samples T-tests for Environment, CAME Group Loans……………………………………..……………………………………..216 6.18 Causal Structure, CAME Group Loans………………………………..…..219 6.19 Latent Mean Differences of the Measurement Model for Gender, CAME Group Loans…………………………….….…………………221 6.20 Latent Mean Differences of the Measurement Model for Group Composition, CAME Group Loans………………………………..……………222 6.21 Latent Mean Differences of the Measurement Model for Environment, CAME Group Loans……………………………………….……223 7.1 Descriptive Statistics, Apros Group Loans……………….………………...233 7.2 Descriptive Statistics for Gender Composition of Groups and Environment, Apros Group Loans………………………….....………………..236 7.3 Marital Status, Gender and Environment, Apros Group Loans…….....……238 7.4 Business Type, Gender and Environment, Apros Group Loans…..………..239 7.5 Number of Businesses and Environment, Apros Group Loans……..……...240 7.6 Loans with Other Institutions, Apros Group Loans…….……..……………240 7.7 Training or Education during the Previous Year, Apros Group Loans………………………..…………………………………………..………241 7.8 Frequency of Meetings, Apros Group Loans……………………….....……242 7.9 Factor Analysis of Capital Items, Apros Group Loans………………..……243 7.10 Confirmatory Factor Analysis of Capital Items, Apros Group Loans………………………..…………………………………………………..244 7.11 Construct Validity of Capital Items, Apros Group Loans…….…………...244 7.12 Factor Analysis of Group and Community Items, Apros Group Loans……………………..……………………………………………………..245 7.13 Confirmatory Factor Analysis of Group and Community Items, Apros Group Loans………………………………..……………………………246 7.14A Construct Validity of Group and Community Items, Apros Group Loans……….…………………………..………………………………..246 7.14B Construct Validity of Group and Community Items, Apros Group Loans…………….………………………………..……………………..246 7.15A Construct Validity of Group and Community Items, Apros Group Loans………...………………………………………..…………………247 7.15B Construct Validity of Group and Community Items, Apros Group Loans………...……………………………………………..……………247 7.16 Independent Samples T-tests for Gender, Apros Group Loans…………...248 7.17 Independent Samples T-tests for Gender Composition of Group, Apros Group Loans……………………………..………………………………250 7.18 Independent Samples T-tests for Environment, Apros Group Loans……………….……………………..…………………………………….252 7.19 Causal Structure, Apros Group Loans………....…………………….……255 7.20 Latent Mean Differences of the Measurement Model for Gender, Apros Group Loans………………………..…………………..………257
xix
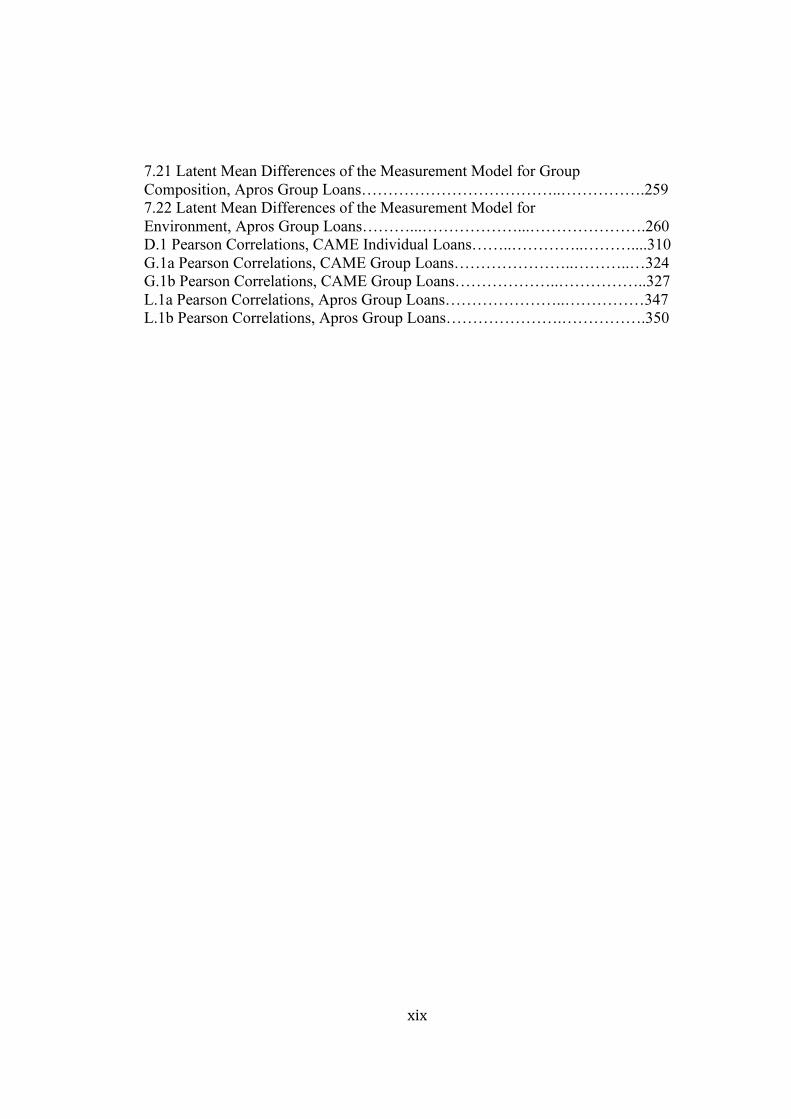
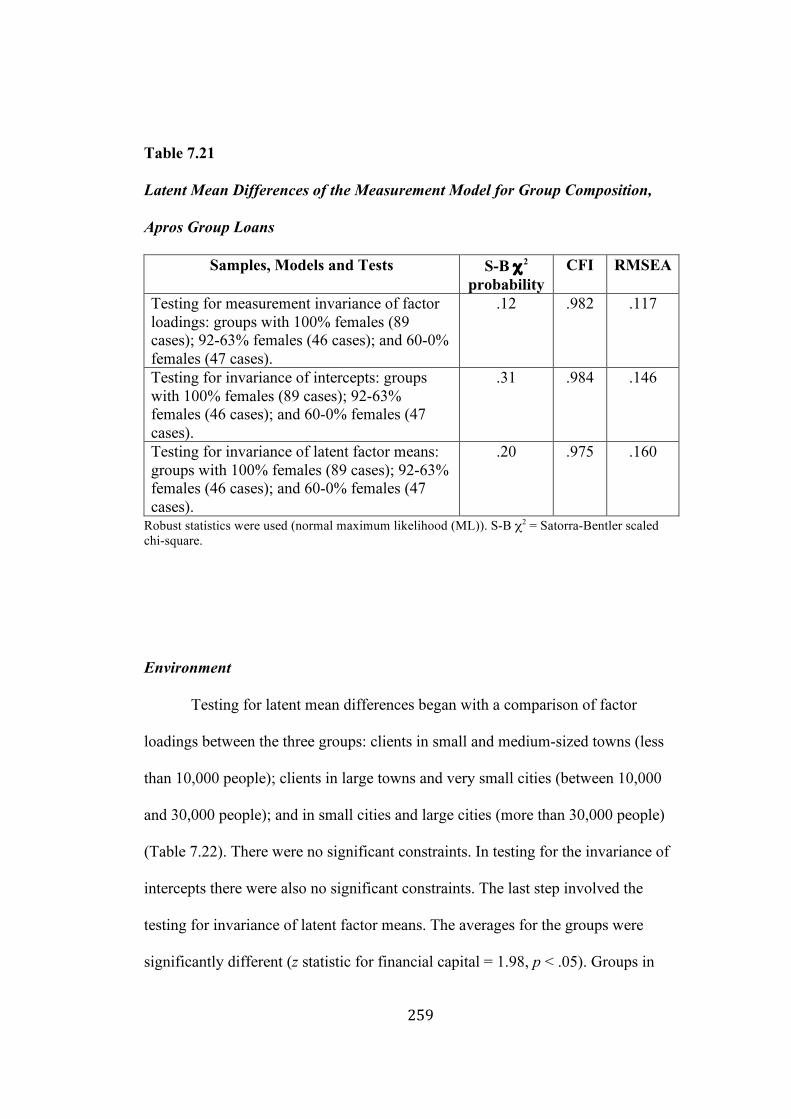
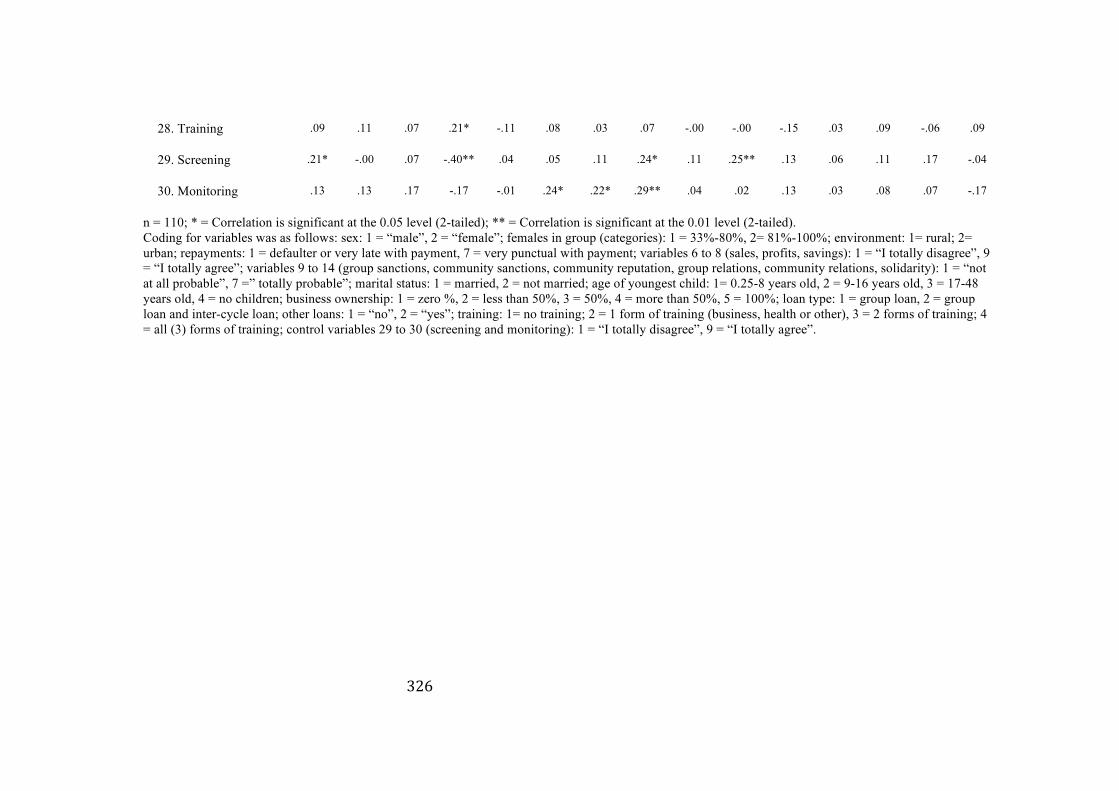
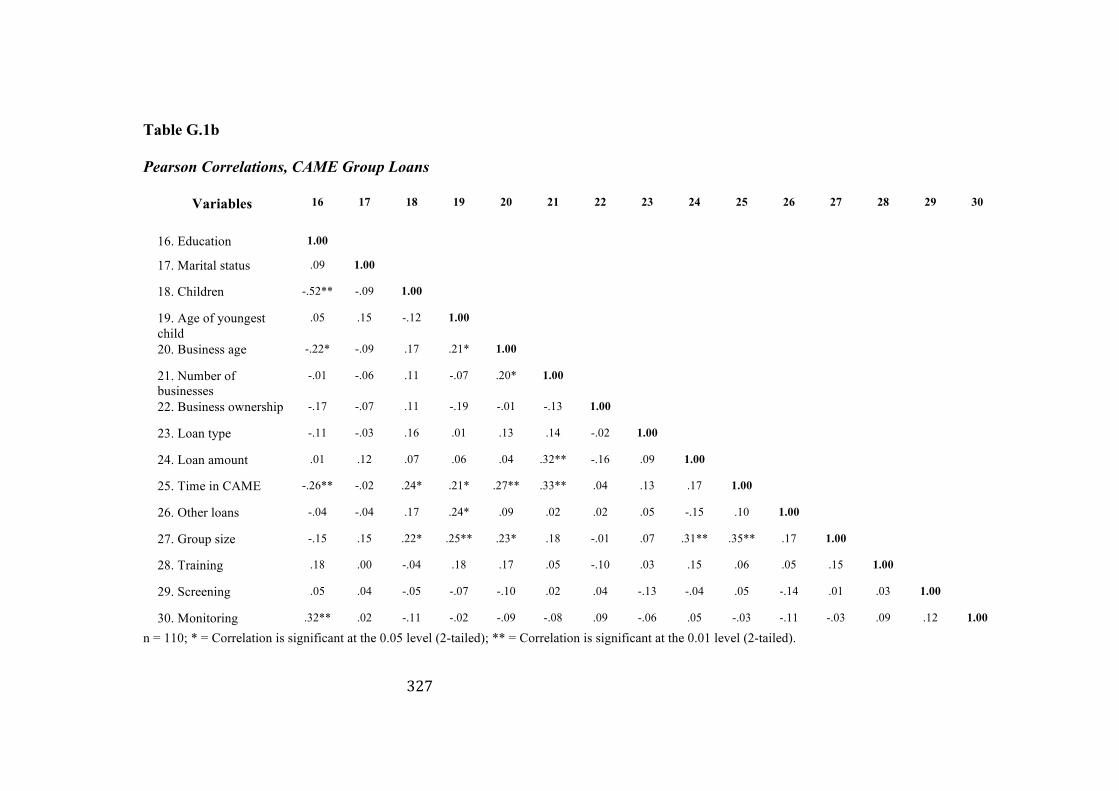
7.21 Latent Mean Differences of the Measurement Model for Group Composition, Apros Group Loans………………………………..…………….259 7.22 Latent Mean Differences of the Measurement Model for Environment, Apros Group Loans………...………………...………………….260 D.1 Pearson Correlations, CAME Individual Loans……..…………..………....310 G.1a Pearson Correlations, CAME Group Loans…………………..………..…324 G.1b Pearson Correlations, CAME Group Loans………………..……………..327 L.1a Pearson Correlations, Apros Group Loans…………………..……………347 L.1b Pearson Correlations, Apros Group Loans………………….…………….350
xx
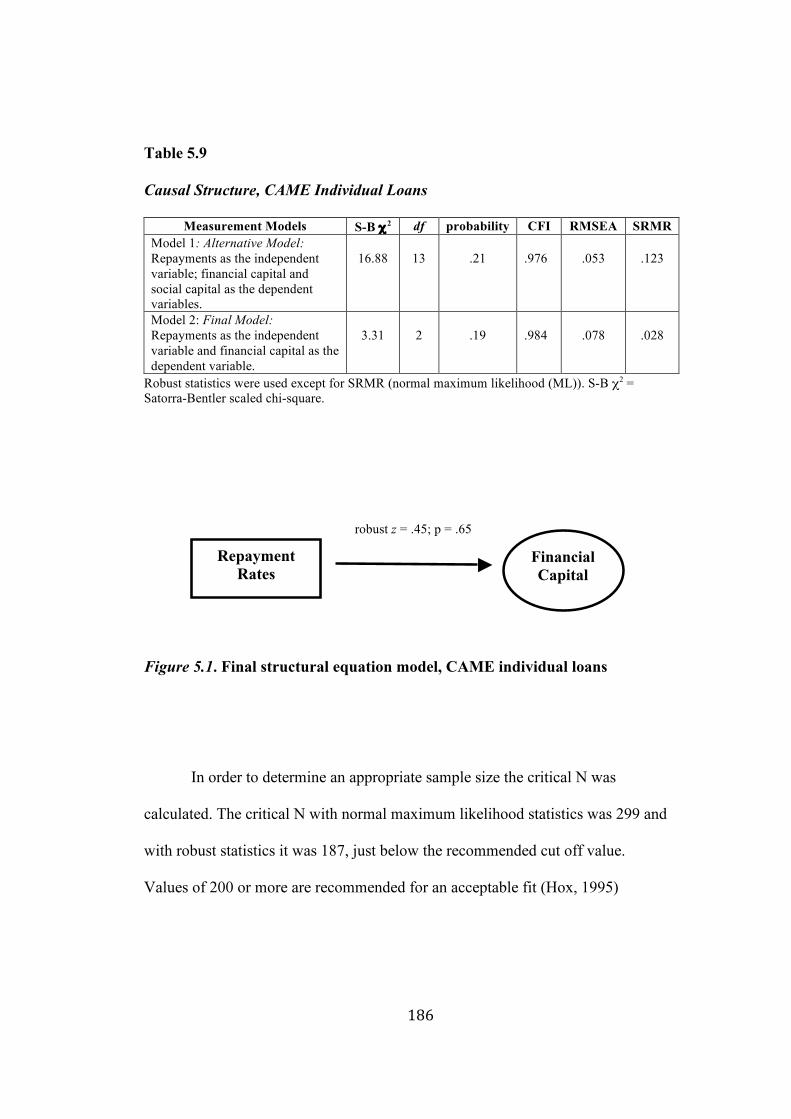
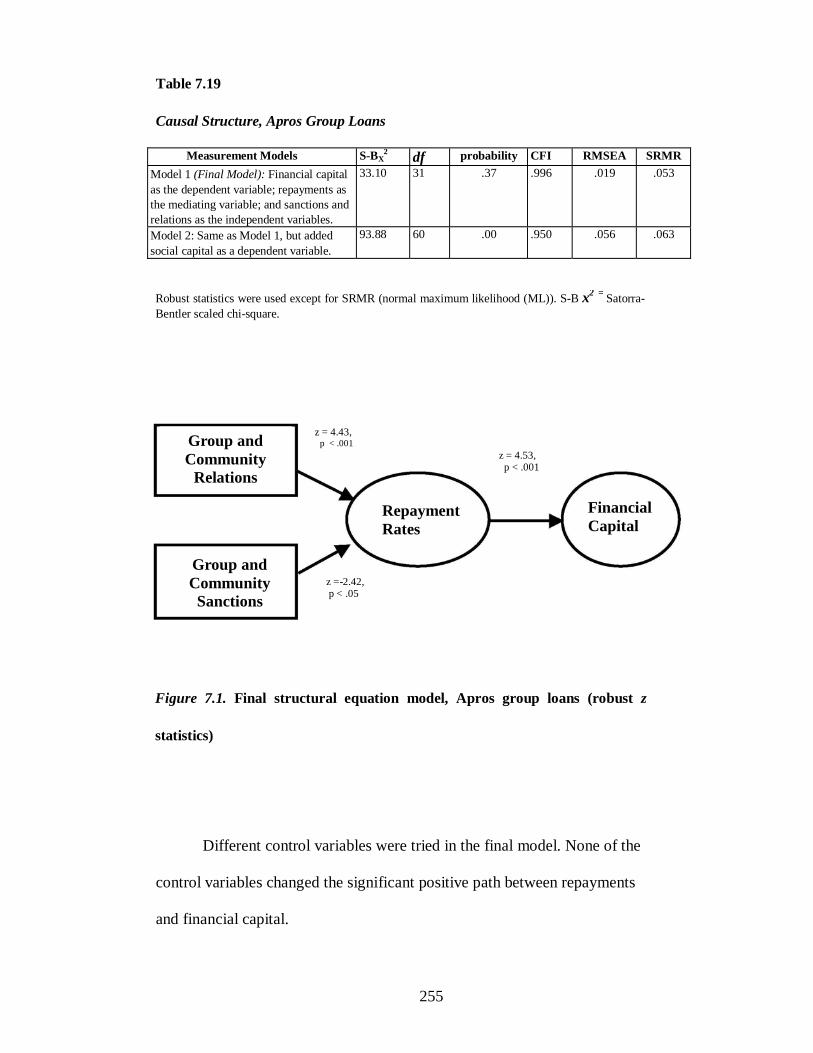
FIGURES 3.1 Conceptual model………………………………………….…………………98 5.1 Final structural equation model, CAME individual loans……………….…186 6.1 Final structural equation model, CAME group loans……………..……..…219 7.1 Final Structural Equation Model, Apros Group Loans…………..…………255
1
CHAPTER 1: INTRODUCTION
1.1 Research Questions
The informal sector is crucial to the survival of the poor in urban and rural
areas of the developing world (Safilios-Rothschild, 1984). Research in Latin
America has revealed that while men tend to move into the formal sector, the
majority of women tend to be concentrated in the informal sector and thus remain
marginalised with low incomes and intermittent work (Charlton, 1984; Haig-
Muir, 1996; Young, 1997). Despite its impact on developing economies, the
informal sector has been regarded as insignificant and has not only been largely
ignored by government policymakers, but also by researchers in the field of
business administration (Khavul, Bruton, & Wood, 2009; Webb, Tihanyi, Ireland,
& Sirmon, 2009; Young, 1997). However, arguably, it is in the informal sector
that development projects have had their greatest successes, particularly small-
scale credit and micro-enterprise projects that provide loans or technical services
to the poor (Buvinic & Yudelman, 1989; Carloni 1987; Lewis, 1988; Walker,
1986). The success of credit programs in reaching a large number of women and
improving their incomes has been emphasised by numerous organisations,
including the United Nations, the World Bank, and the Nobel Committee (Buvinic
1997) suggests that poor women1 may create more capital than poor men in
microfinance programs. Related to the phenomenon of gender and success in
microfinance, a debate is currently taking place in microfinance literature between
proponents of group loans (Khandker, 1998; McKernan, 2002; Navajas,
1 Remenyi (1991) provides a definition of poverty: “At its most general, to be economically poor in the Third World means that one belongs to a household which has access to income that is well below the national average, whether one is landless or not. In this study the income standard below which one is regarded as poor is defined as, ‘persons coming from households with a total household annual cash income less than one half the national average” (Remenyi, 1991, p. 3).
4
Schreiner, Meyer, Gonzalez-Vega & Rodriguez-Meza, 2000; Remenyi, 1991) and
proponents of individual loans (Armendáriz de Aghion & Morduch, 2000, 2004,
2005; Morduch 1999). The Grameen Bank, a pioneer microfinance institution
(MFI) and leader in innovations, is reported to be moving away from the
provision of group loans (Armendáriz de Aghion & Morduch, 2005; Dowla &
Barua, 2006). One argument in favour of group loans states that women benefit
more from these loans than individual loans (Velasco & Marconi, 2004). Female
success in microfinance programs may be related to group forces, such as peer
group pressure, and group participation (Bhatt & Tang, 2001; Dowla & Barua,
2006; Khandker, 1998; McKernan, 2002; Prahalad, 2005b; Remenyi, 1991). The
qualitative pilot study (Griffin, 2008) I conducted on microfinance programs in
Mexico suggests that the benefits that women derive from microfinance programs
may be influenced by peer-group pressure, community pressure, mutual insurance
(help), solidarity, intra-group learning, and participation in joint-decision making.
Furthermore, environmental and cultural forces may influence the success of
female clients in capital creation. An explanation of gender, group loans,
environment, and capital creation in this context may be pertinent to other
businesses not served by MFIs that operate at the bottom of the pyramid in
This study is organised around the following research questions:
5
1. Do women who receive group loans from MFIs create more capital2 than
men who receive group loans from MFIs?
2. Do men who receive individual loans from MFIs create more capital than
women who receive individual loans from MFIs?
3. Do group loans from MFIs in rural settings create more capital than group
loans from MFIs in urban settings?
The dependent variable of this study (capital) is divided into economic,
social and human capital. The independent variable is loan methodology (group
loans or individual loans), which is moderated by environment (rural or urban),
and the gender of clients (male or female). Capital creation and the other variables
in this dissertation were measured by a survey collected from the female and male
clients of two Mexican MFIs that operate with both group loans and individual
loans. The survey was carried out in the states of México, Hidalgo, Veracruz, and
in the Federal District. Samples collected in the state of México and the Federal
District included microfinance clients in densely populated Mexico City. Within
the two samples there were clients residing in cities and towns of varying sizes.
As structural equation modeling was used as the statistical tool for testing data, a
minimum of 200 questionnaires were required in each of the two MFIs.
2 The measurement of capital is discussed in sections 2.2 and 4.2. Economic capital, social capital and human capital are measured by questionnaires. Microfinance clients were asked questions related to economic capital (sales, profit, savings, business infrastructure, and employment) formation over the previous year. Social capital (6 dimensions) and human capital (knowledge, business skills, and new business awareness) items were also included in the survey.
6
1.2 Relevance, Contribution and Future Research
Although the questions surrounding loan methodology, gender,
environment, and capital creation in the microfinance sector have not been
adequately answered by research carried out in business administration and other
disciplines, these topics continue to challenge accepted wisdom on gender and
business success.
Loan Methodology
Among recent studies conducted to investigate the benefits of group loans,
McKernan (2002) measures the total and non-credit effects on self-employment
profits of microfinance clients in Bangladesh. She provides evidence for the
success of group loans, but does not compare these with individual loans, nor does
she measure the composition of non-credit effects, such as group cohesion,
information sharing and peer-group pressure. Gomez and Santor (2003) find
empirical evidence that borrower default rates are lower with group lending than
with individual lending. Furthermore, they point out that group loans benefit from
both selection into the program and from incentives within the group, although
these two channels are “inferred rather than measured” (2003, p. 18). According
to the experiment of Abbink, Irlenbusch and Renner (2006), group lending
outperforms individual lending with social ties making no significant difference.
Giné and Karlan (2006) find that the new individual liability “centers” do not
7
have lower repayment rates than group liability “centers” and that individual
liability “centers” have higher growth in size due to new clients.
A review of the above studies (Abbink et al., 2006; Giné and Karlan, 2006;
Gomez and Santor, 2003; McKernan, 2002), which attempt a comparison of group
loans with individual loans, indicates that there is a gap in the literature. There has
recently been considerable criticism of group loans (Armendáriz de Aghion &
Morduch, 2000, 2004, 2005; Morduch 1999) that may be unjustified and lacking
in empirical evidence. Giné and Karlan, for example, claim (2006, p. 3) that
“despite being a question of first-order importance, empirical literature on group
versus individual liability lending has not provided policymakers and institutions
the clean evidence needed to determine the relative merits of the two
methodologies.”
There are limitations associated with the above four studies that need to be
overcome. Firstly, these studies make no comparison of loan methodologies
taking into account gender. Secondly, the above studies do not provide
comprehensive explanations of the group and social forces that aid in capital
creation nor do they attempt to measure these forces3. Explanations and empirical
measurement should take into account mutual insurance (help), solidarity, intra-
group learning, joint-decision making, peer-group pressure (joint liability), and
community pressure. Thirdly, there are limitations associated with the settings of
three of these studies. For example, two of these studies were carried out in
3 Ahlin and Townsend (2007) have attempted to measure joint liability, social ties, group cooperation, and social sanctions in Thailand, but there appear to be some limitations with their study. See section 2.6 for a brief explanation of these limitations and section 4.2 for some examples of their items.
8
industrialised economies. Abbink, Irlenbusch and Renner (2006) conducted their
experiment on German students, whereas Gomez and Santor’s (2003) secondary
and survey data was collected in two regions of Canada. The German study has no
statistics dealing with individual loans as such (like McKernan’s 2002 study);
investigates self-selected groups formed before the experiment; lacks authentic
monitoring between clients, references to “microfinance”, experimental
businesses, and actual loans; and stops in the tenth round, a future event that
clients already know when they begin the experiment (Armendáriz de Aghion and
Morduch, 2005). A rigorous study comparing both loan methodologies needs to
be conducted with microfinance clients in a developing country, but without the
methodological problems of Giné and Karlan’s (2006) study in the Philippines in
which individual lenders had previously been group lenders, thereby arguably
already developing their human and social capital, and still benefitted from group
lending logistics, such as a common site and schedule for meetings and
repayments. These are vital components of the group lending methodology.
This study does not attempt a direct comparison of loan methodologies,
but includes samples of both loan methodologies and examines group and
community forces that raise repayment rates and capital formation; examines the
influence of gender on both loan methodologies and of environment on group
loans; and is based in a developing country. It also controls for whether
microfinance clients previously had access to different loan methodologies.
9
Gender
Other studies investigate gender in the context of microfinance although
they tend to focus on group loans. Pitt and Khandker (1998) find that female
clients in Bangladesh have a larger positive impact on household consumption
expenditure, family welfare, and the labour supply of both sexes than male clients.
A later study (Pitt, Khandker, & Cartwright, 2006) finds that women’s
participation in microfinance programs in Bangladesh has a positive effect on
their empowerment, whereas male participation has a negative effect on female
empowerment in their households. Kevane and Wydick’s (2001) results taken
from a Guatemalan MFI find that young women during child bearing and child
raising years generate less employment than males, but that older women generate
more employment.
Business related economic capital, especially profit and physical capital,
needs to be measured for both genders, as does social capital and human capital.
For example, Pitt and Khandker (1998) do not measure social and human capital
(except children’s schooling) and provide a limited measurement of economic
capital (labour and women’s nonland assets). Male nonland assets are not
measured in order to compare this outcome variable with female nonland assets.
Pitt, Khandker & Cartwright (2006) do include items to measure some forms of
social capital (mobility and networks) and human capital (an awareness of law
and politics), although they do not compare the relative growth of thematic groups
for both males and females. Kevane and Wydick (2001) examine labour
generation and sales, but not profit, physical capital, social capital or human
10
capital. Gomez and Santor (2003) compare repayment rates, but do not compare
profits, other measures of economic capital, nor gender.
This study offers to make a contribution by building up a more complete
theoretical model to explain why traditional concepts about gender may need to be
revised in the context of microfinance and the base of the pyramid. Although
business administration literature generally emphasises the advantages of males in
the creation of capital as business owners or employees, there is a lack of
literature and theory concerning the specific advantages of women either in
microfinance programs or at the base of the socio-economic pyramid in general. A
recent search that I conducted for A-level journals in administration revealed no
publications dedicated specifically to the MFI phenomenon before about 2009,
although a few authors have briefly mentioned MFIs as an example of social
capital, collaboration within an indigenous community, or local knowledge (e.g.
London & Hart, 2004; Peredo & Chrisman, 2006; see also Bruton, 2010). A
greater recognition of the potential of poor women to create capital may lead to
more support for and research on women at the base of the pyramid. For the
benefit of practitioners, this study sets out to test the conditions under which
female and male clients create more capital and aims to address the gap in the
microfinance literature that so far has not examined thoroughly the influence of
gender on peer-group pressure, community pressure, and group participation.
11
Environment
There also seems to be a lack of research about the influence of
environment on loan methodology. Although environmental forces are related to
the debate on joint liability, there appears to be no literature to explain why large
groups of 10 or more clients may be preferred in rural environments in Mexico
and why individual loans are preferred by many MFIs in large cities (Griffin,
2008). A debate is now underway amongst MFI directors and employees in
Mexico concerning the appropriate loan methodology for urban environments
(Griffin, 2008). The link between the cultural dimension of collectivism and
preferred loan methodology has not been sufficiently emphasised in the literature
(Griffin, 2009). Environment may actually play a large role in the capital creation
of clients and MFIs depending on the loan methodology adopted. Explanations of
the most suitable methodology for a given environment need to be grounded in
theory.
1.3 Contents
The following chapter provides definitions for economic, human and
social capital; reviews the literature concerned with loan methodology, gender,
and environment; and discusses my contribution in greater detail. A discussion of
theory in Chapter 3 leads to an explanation of my conceptual model and of my
hypotheses. Chapter 4 provides a description and an explanation of the research
12
methodology I have adopted for this dissertation. Here I discuss the choice of a
survey; the operationalisation of the variables in my conceptual model; my plan
for data collection and analysis; the potential limitations of my research method;
how I intend to overcome these limitations; and details regarding my two pilot
studies. In Chapter 5 I describe my individual loans sample, the statistical tests of
this sample, and the results related to the first hypothesis. In Chapter 6 I present
the same process for the first group loans sample and answer the next four
hypotheses. The same statistical tests are performed in Chapter 7 and their results
presented for the second group loans sample. Finally I conclude this study in
Chapter 8 by providing a discussion of my contribution and the implications for
theory and research; the implications for practice; the limitations of this study; and
a final conclusion.
13
CHAPTER 2: LITERATURE REVIEW
2.1 Introduction
Chapter 1 reviews the microfinance literature related to gender, loan
methodology and environment in order to clarify the contribution that this study
sets out to make. In this chapter I firstly provide definitions for microfinance
institutions (MFIs) and for capital, which is divided up into economic capital,
human capital and social capital. This is necessary because one of the main
purposes in this study is to measure capital creation by different microfinance loan
methodologies, genders and environments.
The second section is dedicated to a discussion of gender, repayment rates
and capital creation by MFIs. I summarise the traditional theories on gender and
business success, contrast these theories with empirical findings in development
studies and economic development literature, and present both sides of the debate
on whether loans to females may actually boost or hinder economic development.
I expand this discussion on gender by including loan methodology in the
third section. In this section I firstly discuss and differentiate individual loans and
group loans. Then I refer to possible success factors of group loans that may
The fourth section then looks at the relationship that rural or urban
environments may have on the loan methodology chosen by the MFI. The size of
a group may also have an influence on capital creation depending on the
environment. Finally, based on this literature review, I outline my contribution to
the topics of gender, loan methodology and environment in the existing
microfinance literature.
2.2 Defining Microfinance Institutions and Capital
A microfinance4 institution (MFIs) can be defined as “a bank, a
cooperative, a credit union, an NGO or some other form of non-bank financial
intermediary5, (which) seek(s) to provide clients from poor households with a
range of money management and banking services6” (Remenyi, 1999b, p. 8).
4 “Also called microcredit or microbanking. A means of extending credit, usually in the form of small loans with no collateral, to non-‐traditional borrowers such as the poor in rural or undeveloped areas” (microcredit, 2008).
“Microfinance is no different (from banking services, especially credit and savings) except that its market consists of poor households and very small enterprises (microenterprises), in the rural and informal sectors of developing countries. The formal banking system that serves this intermediation role for larger enterprises and wealthier clients in the modern sector of poor economies has thus far found it almost impossible to service this market, essentially because poor people lack collateral against which to borrow, and the financial ‘products’ poor people need involve very high transactions costs and risks that are difficult to manage using the ‘technology’ of modern banking” (Remenyi, 1999b, p. 8).
5 “The world of MFIs is diverse – they exist in various legal forms, including nongovernmental organizations (NGOs), credit unions, nonbank financial intermediaries, and commercial banks” (Prahalad, 2005b, p. 293).
6 “These services can be grouped into five basic ‘product’ types: credit…; deposit services…; insurance products…; financial advisory services…; and advocacy services…” (Remenyi, 1999b, pp. 8-‐9).
15
MFIs often provide small loans of around US$50 to US$1,000 to poor clients,
especially women, usually in rural and informal sectors of developing countries,
so that they can start or expand small businesses. The study of microfinance
includes “elements of the principles of free-enterprise banking and finance, a
neoclassical presentation of the economics of poverty and contemporary thinking
on grass-roots based community development” (Remenyi, 1999a, p. 2).
Capital is “a stock of resources that may be employed in the production of
goods and services” (capital, 2007). Most economic text books refer to capital as
physical capital or capital goods, but here I will use a broader definition: “Capital
may be so broadly defined as to include all possible material, nonmaterial and
human inputs into a productive system” (capital, 2007). Capital consists of
economic capital, human capital and social capital. Economic capital includes
physical capital (capital goods or real capital), such as land, buildings, machinery,
equipment, and inventories of raw materials and goods; non-physical capital
(money or financial capital); and the price of labour (capital, 2007).
Human capital will be defined as “the stock of technical knowledge and
skill embodied in a nation’s work force” (Samuelson & Nordhaus, 2001, p. 766;
see Lin, 2001). Although human capital is thought to result from “investments in
formal education and on-the-job training” (Samuelson & Nordhaus, 2001, p. 766),
in this dissertation I will argue that the formation of client groups promotes the
formation of human capital because clients learn from each other when they
“The primary focus of MFIs had been access to credit, a very capital-‐intensive process. The other plank of banking, namely savings, has been primarily ignored by MFIs (Prahalad, 2005b, p. 292).
16
communicate, give advice and participate in joint-decision making (Griffin,
2008).
Social capital is “the goodwill available to individuals or groups. Its source
lies in the structure and content of the actor’s social relations. Its effects flow from
the information, influence, and solidarity it makes available to the actor” (Adler,
& Kwon, 2002, p. 23). Social capital refers to connections within and between
social networks that promote productive activities. “The term (social capital)
captures the idea that social bonds and social norms are an important basis for
sustainable livelihoods” (Pretty & Ward, 2001, p. 210; see Pretty, 2003). The
Integrated Questionnaire for the Measurement of Social Capital (SC-IQ) designed
by the World Bank divides social capital into six dimensions: groups and
networks; trust and solidarity; collective action and cooperation; information and
communication; social cohesion and inclusion; and empowerment and political
action (Grootaert, Narayan, Nyhan Jones, & Woolcock, 2004, p. vii).
2.3 Gender and Capital Creation
Traditional Theories of Gender
The social psychology, sociology, economics of gender, and business
administration literatures generally agree that men are more successful than
women as business owners or business employees (Brehm et al., 1999; Brush et
7 Abbink et al.’s 2002 working paper is now the 2006 paper that I have summarised.
59
Gender
I propose to fill in another gap in the literature on microfinance caused by
the absence of a comparison of loan methodologies that takes into account gender.
There is also a need to build up a more complete theoretical model to explain why
traditional concepts about gender may need to be revised in the context of
microfinance and the bottom of the pyramid. My dissertation aims to address the
absence of empirical evidence and theory targeting the influence of gender on
peer-group pressure, community pressure, and group participation. The theory of
gender stratification (Blumberg, 1991)8 is usually not emphasised in the
microfinance literature. For example, Armendáriz de Aghion and Morduch’s
(2005) comprehensive literature review briefly mention Blumberg’s findings from
a 1989 study as evidence of the advantage of serving women clients, but not as an
explanation for high female repayment rates or female capital creation. For the
benefit of practitioners, this study sets out to test the conditions under which
female and male clients create more capital.
My dissertation offers to provide a more complete measurement of capital
creation as the studies (e.g. Gomez and Santor, 2003; Kevane and Wydick, 2001;
Pitt and Khandker, 1998; Pitt et al., 2006; Wydick, 2002)9 consulted for the above
literature review have many measurement gaps. Business related economic
capital, especially profit and physical capital, needs to be measured, as does social
capital and human capital. Social and human capital should lead to the long-term 8 See section 3.3 for a summary of the theory of gender stratification. 9 See section 1.2 for a brief summary of measurement gaps in these studies related to capital creation.
60
creation of economic capital (Grootaert et al., 2004). This research also sets out to
address the Mexican context in relation to the performance of MFI clients and to
carry out an economic and social impact study of business owners.
Environment
I also aim to attend to the lack of research regarding the influence of
environment on loan methodology. Although environmental forces are related to
the debate on joint liability, there appears to be very little literature to explain why
large groups of 10 or more clients may be preferred in rural environments and
why individual loans are preferred by many MFIs in large cities. Environment
may actually play a large role in capital creation depending on the loan
methodology adopted. The possible link between collectivism and preferred loan
methodology has not been emphasized and examined sufficiently in the literature.
Armendáriz de Aghion and Morduch (2005, pp. 93-94) suggest that further
research should be carried out on environmental factors:
The village banks of Ayachucho represent a different context, one more
typical of urban areas such as Mexico City and Bogotá, where populations
are highly mobile and often have little information about each other. Can
group lending still help to overcome adverse selection? Can group lending
carry benefits even if the “getting to know each other” process is slow or
imperfect?
61
Adverse selection is probably more easily overcome in rural environments where
people are better informed about their neighbours and the families that live in the
nearby vicinity. In urban areas less is probably known about the people that live in
one’s neighbourhood due to population density, population mobility and the more
individualistic tendencies of urban dwellers.
Armendáriz de Aghion and Morduch (2005, p. 109) ask two further
questions emphasizing the relationship between social sanctions and environment:
“Will the threat of social sanctions be credible in small village communities
among very close friends and relatives? Or, at the other extreme, can social
sanctions have teeth in urban environments where borrowers come and go and
remain fairly anonymous to one another?” Some studies10 find that having close
friends or stronger social ties in a group actually worsens repayment rates,
although other studies challenge this. There is definitely an area of opportunity for
research that examines and explains the relationship between social sanctions and
the environment.
10 See Armendáriz de Aghion & Morduch (2005, pp. 103-104).
62
CHAPTER 3: THEORY AND HYPOTHESES
3.1 Introduction
In this chapter I will present theory that aids in the explanation of my
conceptual model and hypotheses. In the first section I will discuss the concept of
culture and the controversy surrounding psychology-based theory that explains
national and cultural differences. I will also examine three critiques of Hofstede’s
(1980; 2001) cultural dimensions. In the second section I discuss the cultural
dimensions of collectivism/individualism and masculinity/femininity. The third
section presents and explains my conceptual model, while the fourth section
expounds each hypothesis.
3.2 Culture
Culture and Anthropology
What is culture? Kuper states that “in its most general sense, culture is
simply a way of talking about collective identities. Status is also in play,
however” (2001, p. 3). He emphasises that culture only provides a “partial
explanation” for human behavior and that “political and economic forces, social
63
institutions, and biological processes” need to be included in a more complete
explanation (Kuper, 1999, p. xi). Without under-estimating the power of culture,
definitely other influences must be taken into account. However, it could be
argued that political forces, economic forces and social institutions are also
influenced by culture, which is in turn affected by the physical environment.
A multitude of definitions for culture exist. Geertz disapprovingly lists 11
distinct definitions for culture provided by Clyde Kluckhohn, one of which is
“learned behaviour” (Geertz, 1973, pp. 4-5). This is what I consider to be the best
definition of culture, although not the only one. A definition that shares this
perspective is the following: (culture) “is the integrated sum total of learned
conduct traits that are manifested and shared by the members of a society”11
(Hoebel, 1975, p. 231). I basically agree with social psychologists that state that
culture is largely acquired when we are children and that the older people get the
less likely it is that they will change their deeply embedded belief systems. The
ability to adjust or change one’s values indeed depends on the culture one has
acquired. A culture that emphasizes greater tolerance of diversity should be a
culture in which older members are more able to adjust their values. Hofstede
states that values
are acquired in one’s early youth, mainly in the family and in the
neighbourhood, and later at school. By the time a child is 10 years old,
most of its basic values have been programmed into its mind…For
11 Translated from Spanish.
64
occupational values the place of socialization is the school or university,
and the time is in between childhood and adulthood (Hofstede in
McSweeney, 2002a, p. 98).
Hofstede’s view about the acquisition of culture would appear to agree with
Shweder’s cultural psychology perspective.
It is our view that children’s emerging moral understandings are the
product of continuous participation in social practices (the mundane rituals
of everyday life), and those socially produced and reproduced
understandings are the grounding for later attempts, reflectively or self-
consciously, to reconstruct their own moral code (Shweder in Markus &
Kitayama, 1992, p. 361).
Beliefs that societies come to share through socialisation are said to be social
representations or cultural frames.
Social representations…are culturally conditioned ways of making sense
of the everyday world and establishing the nature of social reality. They
provide a shared framework allowing people to function in their social
world and establishing a social code so that members of a given group can
communicate with one another. Behavior and social representations are
65
dynamically interdependent and subject to change over time (Markus &
Kitayama, 1992, p. 362).
Various interpretivist, positivist and postmodern schools of thought in
anthropological circles have espoused differing scholarly concepts of culture since
at least the 1800s (Kuper, 2001). At the beginning of the twentieth century,
American anthropology developed from a debate between the school of Franz
Boas, which saw culture as something that humans learned from a particular
social environment, and the evolutionist school of thought (Kuper, 2001). During
the 1930s positivists adopted both qualitative and quantitative methods in an
attempt to untangle the causal relationships that explain cultural differences. At
this time the debate over the correct method for conducting research on the topic
of culture began to heat up. Paul Radin, for example, criticised renowned
contemporary scholars for “abandoning the humanistic, historical study of culture
and for trying to make ethnology a comparative, untimely quantitative science”
(Bernard, 1995, p. 15). Positivists had begun to explore psychological
mechanisms in order to explain collective behavior.
After the Second World War the social sciences began to enjoy a period of
prosperity in the United States with cultural anthropology dominating the study of
culture (Kuper, 2001). Talcott Parsons had introduced the concept of culture as a
collective consciousness into traditional empiricist American sociology and was a
large influence on leading anthropologists of the 1960s and 1970s, including
Clifford Geertz, David Schneider and Marshal Sahlins (Kuper, 2001). According
66
to Parsons, collective symbols influenced the individual consciousness but did not
dominate it. However, a new breed of anthropologist became increasingly
convinced that society not only fashioned a world of symbols, but that it also
dwelt within this native world of ideas. Even though psychological perspectives
contributed to scientific understanding about collective perceptions and social
identity, by the 1970s the interpretivist school (Geertz, 1973) was gaining
ascendancy, soon to be followed by a wave of deconstruction led by post
modernists (Kuper, 2001). The emphasis on psychological mechanisms and
sociological analysis was deemed to be unsuccessful by the now dominant schools
of anthropology, which transferred their intellectual preferences away from the
social sciences towards the humanities (Kuper, 2001).
Geertz, for example, espoused a semiotic concept of culture that was based
on symbols and signs to be interpreted through semantics, syntactics and
pragmatics. “Believing, with Max Weber, that man is an animal suspended in
webs of significance he himself has spun, I take culture to be those webs, and the
analysis of it to be therefore not an experimental science in search of law but an
interpretive one in search of meaning” (Geertz, 1973, p. 5). Geertz was very
critical of positivism and attempts at operationalisation. “Operationalism as a
methodological dogma never made much sense so far as the social sciences are
concerned, and except for a few rather too well-swept corners – Skinnerian
behaviourism, intelligence testing, and so on – it is largely dead now” (Geertz,
1973, p. 5). Such a comment today in the administrative sciences, however, would
have little credibility with the vast majority of scholars. Although Geertz’s
67
argument in favor of an interpretive methodology is both eloquent and valid, his
statement above reveals his intolerance of scientific perspectives that differ from
his own.
He hastily discards two philosophical extremes, one of which claims culture
is a “self-contained “super-organic” reality with forces and purposes of its own”
(idealist) and the other that describes culture as a “brute pattern of behavioural
events we observe” (behaviourist) (Geertz, 1973, p. 11). Overall, Geertz is most
disdainful of Ward Goodenough’s (2003) cognitive anthropology, which sees
culture as consisting of psychological structures which guide the behavior of
individuals. Goodenough’s faction of cognitive science arose from developments
in linguistics and focused on discourse theory and pragmatics (Harris, 1979;
Kuper, 2001). Geertz reasons that analyzing culture through formal methods that
resemble mathematics and logic is as “destructive” as the “behaviourist and
idealist fallacies” that Goodenough had attempted to improve on (Geertz, 1973, p.
12). “Cultural analysis is (or should be) guessing at meanings, assessing the
guesses, and drawing explanatory conclusions from the better guesses, not
discovering the Continent of Meaning and mapping out its bodiless landscape”
(Geertz, 1973, p. 20). Geertz alludes to an Indian story to argue that there is no
end to potential explanations. “Cultural analysis is intrinsically incomplete. And,
worse than that, the more deeply it goes the less complete it is” (Geertz, 1973, p.
29). He concludes his argument for an interpretive theory of culture by stating that
“the essential vocation of interpretive anthropology is not to answer our deepest
questions, but to make available to us answers that others, guarding sheep in other
68
valleys, have given, and thus to include them in the consultable record of what
man has said” (Geertz, 1973, p. 30). To be able to consult records that include
differing interpretations of events is indeed a valuable contribution to humanities
and the social sciences, but should social scientists desist in their attempt to
answer some of the deeper questions?
In the discipline of anthropology, due to the criticism of seminal authors
such as Geertz, positivism has lost much of its earlier credibility. However,
Geertz’s students in turn questioned his interpretive stance. They began to doubt
whether it was really possible for an outsider to build up an understanding of a
culture (Kuper, 2001). Postmodernists began to advocate that an anthropologist’s
view of a culture is actually based on a contrived text that does not present a clear
message and does not actually resemble reality.
It is amusing to contrast anthropology with the conservative discipline of
administration in which symbolists and post modernists struggle for recognition.
Overall, intolerance is prevalent throughout scientific philosophy in both
disciplines. Adherence to a different methodological perspective at times is akin
to biased football barracking. Some academics in administration, for example,
insist that only a positivist study is “rigorous” and there are journals that will
mainly publish only quantitative research. Mintzberg’s (1998) story of the
elephant in his introduction to “Strategy Safari” is a parable, which I heard
frequently in India, concerning different religious schools of thought12. A blind
man touches an elephant’s trunk and pronounces “this is what an elephant is: long
12 See Muktananda (1977, pp. 227-228) for an earlier version of the elephant story.
69
and hollow.” Another blind man insists that the elephant’s stomach really
represents the elephant and so on.
Unlike the administrative sciences in the 1990s, in anthropology there was
a general agreement in the 1970s that psychological mechanisms could not be
depended upon to provide an explanation of national or cultural differences. Even
so, there were some influential anthropologists that still saw psychological
anthropology (as opposed to Goodenough’s cognitive anthropology) as a valid
area for research. Marvin Harris (1979, p. 259), for example, stated that
One popular set of psychologistic theories of sociocultural causality sets
out from the assumption that each society has a national character, a modal
personality, or some other definite range of personality types. Provided
that proper empirical procedures are employed to measure and define a
group’s personality complex, I find nothing objectionable in such an
assumption.
Harris agrees that personalities vary across cultures and that there must be some
match between emic and mental culture and the kind of personality a group
possesses. Where Harris disagrees with psychological anthropology is when this
branch of anthropology fails to recognise that national personality types are the
result of infrastructural conditions, which is espoused by Harris’ school of cultural
materialism, or when psychological anthropology goes further to make the claim
that etic infrastructure results from personality types. Harris (1979) also criticises
70
this branch for abandoning causal theories concerning the formation of culture
because of the difficulty of tracing psychological configurations back in history
and, therefore, in accepting that national or group personality types are impossible
to predict.
In addition to debates amongst different philosophical perspectives, the
topic of culture is also immersed in a discussion concerning the relative merits of
anthropology, economics and sociology in providing adequate explanations of
human behavior. Granovetter (1985, 1992), for example, criticises both the
culturalist position for its over-socialisation of human behaviour and the
functionalist position, represented by the new institutional economics, for its
static, atomized perspective which innocently assumes that natural selection is
constantly weeding out weak actors and organisations. Granovetter (1992) points
out that institutions would not evolve over time if the culture they were located in
remained stable. Furthermore, the casual relationship between culture and human
behaviour is generally inferred, but is not actually demonstrated to exist. He
argues that actions are often embedded in a complex network of human relations.
An emphasis on culture, however, does not necessarily have to be over-socialised
and can also take into account social networks.
Criticisms of Hofstede’s Cultural Dimensions
Paradoxically, it is against this background that Hofstede’s (1980, 2001)
quantifiable cultural dimensions began to be debated in organisational behaviour
71
in the 1980s and became part of mainstream theory in this field of inquiry by the
1990s. His dimensions are based on psychological processes that are the result of
“socialisation” or “enculturation”. Criticism of Hofstede’s cultural dimensions
comes from scholars who reject the validity of psychometric-based survey
questions and indexes that supposedly define and distinguish the “personalities”
of different nationalities. Many would argue that the “personalities” of
nationalities or ethnic groups are impossible to quantify and compare as such and
that such comparisons would need to be done qualitatively. Others would say that
the culture or essence or spirit of an ethnic group cannot be captured, categorised
and compared with numbers (or even words), and that such a comparison is bound
to be interpreted by ethnocentric discourse. In many ways, this controversy is
related to much earlier debates between humanists and positivists, who were
themselves challenged by post modernists in the later part of the twentieth
century.
Potential criticisms by Bernard. Criticisms of Hofstede’s preoccupation with
structured interviews, indexes, factors and cross cultural survey replications could
conceivably come from other positivist researchers who argue that not all
quantifiable data has causal relationships. Bernard, a cultural anthropologist and
self-claimed positivist, for example, asserts that “searching the Bible for statistical
evidence to support the subjugation of women doesn’t turn the enterprise into
science...And for those whose work is in the positivist tradition, it is important to
72
remember that numbers do not automatically make any inquiry scientific” (1995,
p. 16). In regard to indexes, Bernard maintains that
We pretend that (1) (a student’s) knowledge (of a discipline) (Bernard’s
example) is a unidimensional variable; (2) a fair set of questions is chosen
to represent knowledge of some subject; and therefore, (3) a cumulative
index is a fair test of knowledge of that subject. We know that the system
is imperfect, but we pretend in order to get on with life (2000, p. 289).
Bernard (1995, p. 305) also claims that “most anthropologists won’t develop
major scales for others to use. What they will do (and should do), is test the
unidimensionality of the measures in their own field data...” However, “if scales
do exist, the instruments are not transportable to another culture” (1995, p. 497)
and “are not perfectly transportable across time” either (2000, p. 312). This
contrasts with surveys that Hofstede includes at the end of his books that are
“recommended for future cross-cultural survey studies” (1980, p. 419) and for
“replicating the IBM-style cross-national survey” (2001, pp. 491).
Bernard might also question Hofstede’s use of factor analysis to identify
his “supervariables” (factors) or dimensions. For Bernard (2000, p. 636), an
acceptable cut off point for variables that load onto a factor is 0.60, with some
researchers using 0.50. However, Hofstede (2001, pp. 214, 255-257, 281) has
accepted the following work goals as important variables for his cultural
dimension factors: freedom (a loading of 0.49), challenge (0.46), and
73
advancement (-.56). Some variables have high loadings on one factor analysis
performed by Hofstede and have much lower loadings on another. There appears
to be no loading data for other important variables.
Criticisms by McSweeney. A recent and well-known criticism of Hofstede comes
from McSweeney (2002a, 2002b). McSweeney (2002a, p. 95) finds fault with
Hofstede’s “Assumption 1” that organisational culture, occupational culture and
national culture are “three non-interacting and durable cultures.” There are
problems with Hofstede’s concepts of ‘practice’ and ‘perceptions of practice’, and
he does not link his ideas with recent research in the social sciences. Hofstede is
also said to ignore research that questions the analysis of cultural levels. The idea
that national and occupational cultures are permanent and fixed consequences of
childhood and adolescent socialisation is also debatable. Socialisation within the
workplace has also been neglected by this emphasis on pre-work socialisation.
The content of schooling can differ extensively within a nation as it can within an
occupation. National cultures can also influence occupational and organisational
cultures. Hofstede (2002, p. 1356) agrees that national units are problematic but
“they are usually the only kinds of units available for comparison and better than
nothing.”
Hofstede’s second assumption that national culture is found in the micro-
local is attacked by McSweeney (2002a). There were large differences between
the responses of the surveys applied in each country. However, although data may
be representative of a limited segment of a national population, certain cultures do
74
appear to group together in the results, such as Anglo English-speaking nations or
Latin American Spanish-speaking countries. There would seem to be a certain
amount of face validity in these cultural groupings. Hofstede (2002, p. 1356)
argues that “the country scores obtained correlated highly with all kinds of other
data, including results obtained from representative samples of entire national
populations.” His dimensions have been supported by many validations and
replications.
As with all surveys, there are some problems related to Hofstede’s
“Assumption 3” that “national culture creates questionnaire response differences”,
such as some of the questionnaires being completed within groups, and
respondents being aware of potential changes that could take place in IBM
because of the survey (McSweeney, 2002a, p. 102). Hofstede (2002, p. 1356)
recognises that surveys “should not be the only way…of measuring cultural
differences”.
Other researchers have found other dimensions and dynamic connections
between values (“Assumption 4”). People may exercise contradictory values
depending on different contexts. Triandis and Gelfand (1998), for example, argue
that collectivism and individualism are not opposites but can co-exist. When
Hofstede added a fifth dimension, based on a Chinese Values Survey, he did not
drop the dimension of Uncertainty Avoidance, even though it was not found in
this survey (McSweeney, 2002a). Furthermore, meaning differs throughout
cultures so the wording or translation of some questions may have elicited
different responses. However, the IMEDE sample, which followed the HERMES
75
sample by several years, revealed similar results that according to Hofstede (2002,
p. 1357) “ruled out the hypothesis that the differences found among countries
could be due to the translation of the questionnaire.”
The assumption (“Assumption 5”) that a cultural dimension is the same in
any situation within a country is also criticised by McSweeney (2002a). High
power distance within a firm does not necessarily indicate that there will be high
power distance within the family. Once again McSweeney quotes Triandis to
support his argument. However, although Triandis differs in his conception of the
relationship between individualism and collectivism, nevertheless, he agrees that
they are valid cultural dimensions that can be measured. Also, Triandis was
initially enthusiastic of Hofstede’s 1980 seminal work (Hofstede, 2002), and has
praised it various times since (Ailon, 2008). McSweeney also quotes another
noted cross-cultural researcher, Schwartz, who has been critical of Hofstede, but
who, like “market researchers, sociologists and political scientists throughout the
world”…“draw(s) conclusions from central tendencies calculated from individual
survey answers” (Hofstede, 2002, p. 1360).
One of Hofstede’s weaknesses, which McSweeney is eager to accentuate,
is his tendency to jump to “scientific” conclusions with his validatory stories
(McSweeney, 2002a; 2002b, pp. 1366-1370). His stories, although stimulating for
contemplation, lead him to many implausible generalisations. McSweeney
(2002a, p. 110), however, also cites at least one study that appears to arrive at
dubious conclusions in order to support his critique.
76
McSweeney (2002a, p. 109) carries on the debate about the influence of
culture when he asks “Why should the idea of national-cultural causation be
privileged over administrative, coercive, or other means of social action?”
Hofstede (2002a, p. 1359) replies that “in many practical cases it (culture) is
redundant, and economic, political or institutional factors provide better
explanations. But sometimes they don’t, and then we need the construct of
culture.” Hofstede also argues that the relationship between national culture and
national institutions can be circular. Validations can also indicate causes, effects,
or links to hidden elements. Other forces can also influence culture. For example,
past Soviet governments have influenced present-day Russian society to be more
egalitarian in their attitudes towards gender. 75 years of Soviet rule may have
been sufficient time for a significant shift in gender values. These values were
revealed in the GLOBE study (House, Hanges, Javidan, Dorfman, & Gupta,
2004).
McSweeney may be over-stating Hofstede’s conception of the rigidity of
cultures. However, Hofstede (2002, p. 1360) confirms that “values (as we
measured them) are hardly changeable (they change but not according to
anybody’s intentions), whereas practices can be modified – given sufficient
management attention.” Utilising the disintegration of Yugoslavia as an example,
McSweeney ridicules Hofstede’s conception of national cultures, but to be fair
Hofstede also accepts the existence of sub-cultures. Yet even so, the cultures of
Serbia, Croatia, Kosovo and Bosnia definitely would have more in common with
77
each other than they would with the cultures of China, Vietnam and North Korea,
even though all these areas had communist governments in the 1980s.
Criticisms by Ailon. Another recent critique of Hofstede’s (1980) seminal work
comes from Galit Ailon (2008), who employs an analytical strategy to mirror the
book against the value dimensions it offered to the administrative sciences. She
questions the role of these dimensions in presenting a “universal typology that
captures cross-cultural differences” and describes them “as a very distinct
construction that reifies a scheme of global hierarchy” (Ailon, 2008, p. 887).
Hofstede’s dimensions are said to reinforce ethnocentric bias by supporting a
framework in which cultures of Western origin dominate.
Western production of scientific knowledge about “others” does not
involve neutral comparisons but is always, to some extent, an act of power
involving a contest over worth…The paper’s argument is that if we truly
want to promote these values (tolerance, dialogue and diversity), we must
become reflexive of how the things we say about “others” are often bound
up with what we want to see in ourselves (Ailon, 2009, pp. 572-573).
Cultural bias can be detected by the way in which Hofstede’s own Dutch culture
is supposedly manipulated by his survey questions into possessing superior values
in the first four cultural dimensions that were revealed in Hofstede’s (1980)
original work. Hofstede (2009) replies that Ailon is committing ecological fallacy
78
by attempting to apply national differences at the levels of personality psychology
and the individual (the author).
Beginning with the cultural dimension of power distance, it is assumed
that Hofstede favors Western countries that have low levels of power distance
(PD). Ailon adds that France and Belgium are exceptions to this trend of “all
Western countries”, including Holland, that have “relatively small PD culture”
(2008, p. 890), but fails to note that Dutch culture is closer to the centre of the
power distance index and surpassed by many other Western cultures (Hofstede,
1992, p. 107). Other Western European countries relatively high in power distance
that she ignores are Italy, Spain and Portugal.
Ailon (2008, p. 890) argues that the emphasis on the “boss/subordinate
relationship” steers clear of the “more unattractive forms of Western inequality”,
such as “racial and colonial inequalities”. Hofstede (2009) insists that his
definition of PD does not include racial separation. Ailon also assumes that racial
and colonial inequalities are cultural tendencies that distinguish Western cultures.
However, many members of ethnic groups throughout the globe, such as the
Armenians, Kurds, Tutsis, Hutus, Tibetans, Koreans, Mayans13, and many
subordinated Hindu castes may not agree with Ailon’s conclusions regarding
racism and imperialism. For example, the diverse regions of the Indian
subcontinent had experienced successive invasions for thousands of years before
the arrival of the Portuguese, French and English. Newly independent India and
13 Modern-day Mexican culture is a mixture of European and indigenous cultures, although Mexicans are highly critical of Spanish colonialism in their government education system and generally praise pre-hispanic civilisations. However, indigenous groups in southern Mexico have unsuccessfully rebelled against the central government.
79
Indonesia were both accused of imperialism for their sudden annexation of
neighboring territories. Frequent human rights abuses accompanied and followed
the invasion of East Timor, whereas Indonesia also annexed Dutch New Guinea
(Irian Jaya), a huge territory populated by tribal groups vastly different from the
ruling Javanese. Those who have lived extensively in foreign countries may also
affirm that racial and ethnic biases seem to be prevalent in almost all cultures.
Take the case of Ailon’s Israel, where violence arising from ethnic tensions has
continued unabated for decades.
Ailon (2008, p. 890) attacks the power distance dimension by indicating
that apartheid South Africa had a “moderately small PD score”. However, South
Africa, although not scoring highly on the power distance index, was actually
located on the right side of the line that separates small (left) from large (right)
power distance (Hofstede, 1992, p. 107). South Africa’s relatively moderate
power distance may have been influenced by whether South Africans of English
or Afrikaner origin predominantly answered the questionnaire, the former being
generally opposed to apartheid. Yes, Hofstede could have explored the sub-
dimensions of racial prejudice or colonialism in the work place, but then again he
could have also explored many other work-related dilemmas. Other cross-cultural
researchers could also have made contributions here, but Ailon provides no
empirical findings from other studies concerning racial inequality or
“colonialism” in the workplace to justify that Western cultures would score
relatively highly in these sub-dimensions in comparison to other cultures.
80
Ailon’s critique of Hofstede’s second dimension, uncertainty avoidance
(UA) follows a similar argument: “His (Hofstede’s) country, the Netherlands,
again like many Western countries – especially Anglo and Nordic – and a few
non-Western (Asian) ones, is ranked as having a low UA culture” (2008, p. 893).
Ailon uses this dimension to attack Hofstede’s positivist scientific method, which
she deduces, by means of her mirroring strategy, actually represents an example
of high uncertainty avoidance. Hostede (2009) counters that there is no evidence
to support the assumption that societies with a high level of uncertainty avoidance
utilise the scientific method more frequently. A closer review of a Hofstede
uncertainty avoidance scale, however, reveals that the Netherlands is just above
the line that separates low (above) uncertainty avoidance from high (below)
uncertainty avoidance (Hofstede, 1992, p. 107). Five Asian countries are lower in
uncertainty avoidance than the Netherlands and almost all the other countries (10)
in the Nordic and Anglo groups that Ailon refers to. In fact, Singapore has by far
the lowest uncertainty avoidance of all the 40 countries included in the ranking.
However another nine western European countries (Finland, Switzerland,
Germany, Austria, Italy, Spain, Portugal, Belgium and France) are all ranked as
being below the uncertainty avoidance dividing line and, therefore, are relatively
high in uncertainty avoidance and similar to other Asian and Latin American
countries in this cultural dimension.
The individualism (IDV) index corresponds more closely with Ailon’s
thesis. Only one Western European nation, Portugal, is high in collectivism and
there appears to be a fairly obvious division between collectivistic Asian and
81
Latin American countries and individualistic European ones (Hofstede, 1992, p.
895). According to her, this “illustrates the way that IDV, like the other
dimensions, implicitly endorses managerial and Western agendas, both clearly
embedded in capitalist values and ideals, and legitimizes the power of these
hegemonic social groups within the cross-cultural organizational universe” (2008,
p. 895). Reflecting on Hofstede’s (2009, p. 570) “metaphor of culture as collective
programming of the mind” Ailon concludes that Hofstede is in fact a collectivist.
However, although high levels of PD, UA and masculinity could be interpreted to
contain undesirable social values, it is more debatable as to whether individualism
or collectivism is more desirable with both extremes embodying appealing values.
Other cross-cultural researchers actually divide them into two separate dimensions
asserting that all cultures have varying levels of both (Triandis & Gelfand, 1998).
Ailon notes that the fourth dimension, masculinity (MAS), is the only one
that “distinguishes Anglo (masculine) from Nordic (feminine) cultures” (2008, p.
895). In fact, a large number of Western nations (12) are classified as being
relatively high in masculinity, whereas some Asian (5) and Latin American (2)
nations are relatively low. Among the nine nations scoring lowest in masculinity
are Chile, Thailand and what was then Yugoslavia (Hofstede, 1992, p. 109). This
is a sensitive topic about which Hofstede makes many “essentialist statements”
that Ailon claims “legitimate sexual inequality” (2008, p. 896). Hofstede is also
accused of being very assertive and that this contrasts glaringly with his
supposedly feminine Dutch culture. Hofstede (2009) retorts that Ailon is once
again confusing culture with personality and questions whether his works are
82
more assertive than that of other social scientists. Although some of Hofstede’s
statements may be interpreted as being sexist, it is difficult to accept that he is
legitimating sexual inequality and relegating women to domestic household roles
when feminine cultures, which include the Dutch in his index, are societies in
which “both men and women are supposed to be modest, tender, and concerned
with quality of life” (Hofstede, 1997, pp. 82-83). Feminism, as he argues, does not
necessarily have to endorse the masculine values in his cultural dimensions so that
the ideal woman should be as aggressive and competitive as the men in masculine
cultures. He sees this as an American or Anglo interpretation of what feminism
should be. In fact, his explanation of the socialisation process within cultures is
similar to, and perhaps is taken from, the socialisation theory found in feminist
views of workplace differences.
Ailon also comments on a fifth dimension that Hofstede added later. Long
term orientation (LTO) distinguishes cultures concerned with future oriented
virtue from those in which virtue is oriented in the past or present. This Confucian
concern for virtue contrasts with the Western search for the truth that is covered
by the UA dimension. Here Hofstede clearly distances himself from Western
values by praising the long term orientation and arising prosperity of East Asian
cultures. However, Ailon compares this dimension unfavorably with UA to which
LTO is apparently subordinated. How LTO “does not challenge but in fact
reaffirms Western cultural hegemony and position in the global hierarchy” (Ailon,
2008, p. 897), however, is not lucid. LTO is somehow subordinated to UA
because Eastern cultures “acknowledged the intrinsic and universal value (for
83
“human progress”) of the Western search for “truth”” (2008, p. 898). When
Ailon’s mirror is applied, non-Western countries are always patronised by
Hofstede. He in turn asks “I don’t know which global hierarchy Ailon means –
one where China (high LTO) or where the United States (low LTO) comes on
top?” (2009, p. 571).
To conclude, if Hofstede did actually intend to enact a global hierarchy in
which Western cultures led by Nordic and Anglo cultures represent a shining
example to the rest of the world, his attempt has clearly failed. The only cultural
dimension that obviously divides Western cultures from the rest is IDV, Portugal
being the one exception here (Hofstede, 1992, p. 108). There are many Western
countries that are closer to large PD, strong UA (Finland and Israel14), or high
MAS (Great Britain, Ireland, USA, Canada, New Zealand and Australia) or that
have two (Germany, Switzerland, Austria, Spain, Portugal, France and South
Africa) or three (Italy and Belgium) combinations of these values (Hofstede,
1992, pp. 107-109). On the other hand many Asian, Latin American or Eastern
European15 countries are closer to weak UA (Hong Kong, India, and the
Philippines) or low MAS (Iran, Thailand, Taiwan, Turkey, Brazil, Peru, Chile and
Yugoslavia) or both (Singapore) (Hofstede, 1992, p. 109). Western countries also
do not fare so well on the LTO dimension. If there are indeed value judgments
associated with Hofstede’s cultural dimensions, Nordic culture probably does
perform better than Anglo culture and all others. On the other hand, the
Netherlands is almost borderline in UA and PD (Hofstede, 1992, p. 107) and, 14 Depending on whether Israel is viewed as being a “Western” country or not. 15Yugoslavia and Greece are the only East European countries found in Hofstede’s (1992) country scales.
84
therefore, according to Ailon’s scheme of global hierarchy, the Dutch have
considerable room for improvement in three out of five cultural dimensions.
Mirroring could in turn be used to examine closely Ailon’s eloquent
critique of Hostede. Although she “reconsider(s) concepts and convictions that
predominate cross-cultural research” and encourages the adoption of “norms of
reflexivity”, in the final analysis, her mirror distorts Hofstede’s findings and
interprets them in a way that serves her own “normative viewpoint and political
subtext” (Ailon, 2008, p. 885) within the postmodern tradition. Ailon (2009, p.
572) points out that “this interpretation (Hofstede’s) was culturally bound and
issued from a specific standpoint and place in the world”, but the same could be
said for all works by social scientists, including those of Ailon’s postmodern
tradition. Postmodernism itself is deeply rooted in Western culture and may not
have much credence in other societies, such as the conservative organisational
cultures of many developing nations and especially within the culture of privately
owned organisations in these societies. Ailon (2009, pp. 572-573) insists that her
“paper explicitly seeks to promote”…“tolerance, dialogue and diversity”, yet she
accuses Hofstede of endorsing racial bigotry, inequality, chauvinism and a general
scheme of global hierarchy.
85
3.3 Theory
Collectivism/Individualism
Collectivistic cultures embrace a sociocentric vision of the individual’s
relationship to society that lends itself to an organic metaphor (Shweder &
Bourne, 1982). In India, for example, a person in society is not an autonomous
individual but is regulated by firm rules of interdependence that are particularistic
and based on specific contexts. Many sociocentric cultures, such as the Oriyas of
India, however, have a conception of the autonomous individual, although others,
like the Zapotecs of Oaxaca, Mexico, do not. In contrast, in the West the
individual is perceived to be a specific incarnation of abstract humanity. The
concrete social thought of Bali, New Guinea, and India has been contrasted with
the Western mode in which the individual’s social role is abstracted and inviolable
(Shweder & Bourne, 1982). The moral responsibilities of this abstracted
individual are differentiated from his/her duties and social responsibilities. These
two conceptions of an individual’s relationship to society were to gain greater
acceptance in the social scientific community under the terminology of
“collectivism” (“sociocentric organic”) and “individualism” (“egocentric
Hofstede (1980) was very influential in exploring national influences on
organisational culture by presenting four cultural dimensions, one of which was
collectivism and individualism. According to his dimensions, Mexican
86
organisational culture was very similar to that of other collectivistic Latin
American cultures, whereas American and Canadian cultures were similar to that
of other individualistic English speaking cultures (Hofstede, 1997, 2001; Kim,
Triandis, Kagitcibasi, Choi, & Yoon, 1994). Hofstede defined collectivism as
pertaining to “societies in which people from birth onwards are integrated into
strong, cohesive in-groups, which throughout people’s lifetime continue to protect
them in exchange for unquestioning loyalty” (Hofstede in Gelfand, Bhawuk,
Nishii, & Bechtold, 2004, pp. 440-441; see Hofstede, 2009, p. 570). He described
individualism as pertaining to “societies in which the ties between individuals are
loose; everyone is expected to look after himself or herself and his or her
immediate family” (Hofstede in Gelfand et al., 2004, p. 440; see Hofstede, 2009,
p. 570). Hofstede indicated that collectivistic cultures viewed individualism as
undesirable and alienating (Hatch & Cunliffe, 2006; Hofstede, 2001). He also
suggested that relationships prevail over tasks in organisations that are operating
in collectivistic cultures, whereas the opposite takes place in individualistic
organisations.
Hofstede (1980) and the Globe study (House et al., 2004) have measured
the cultural dimension of collectivism/individualism in many different countries.
Hofstede’s Country Individualism Index Values (IDV) were based on the factor
scores of the first factor found in a 14-work goals, 40-country matrix (1980, p.
222). Work scores were computed for a stratified sample of 7 occupations at 2
points in time. He measured actual values and values predicted on the basis of a
multiple regression on wealth, latitude and organisation size. Hofstede’s findings
87
suggest that Mexican culture is similar to Chinese culture because both are high in
collectivism, whereas Canadians are similar to Americans because both are high
in individualism. However, it may be that Hofstede’s cultural dimension for
collectivism and individualism was too broad, and he wasn’t taking into account
the differences in the way that the people of a culture may act with their in-group
as opposed to the way that they may act when working inside an organisation.
Mexican society, for example, is very family-oriented, but may not be very
collectivistic when it comes to working within organisations, whereas the Chinese
seem to be collectivistic in both situations.
The more recent GLOBE study of cultural dimensions in 62 societies
analysed four different characteristics of individualism and collectivism (House et
al., 2004). Firstly a distinction was made between institutional collectivism and
in-group collectivism. Secondly, the GLOBE study analysed not only practices,
that is the way people believe that people from their culture really act, but also
values, the way people believe that people from their culture should act.
Therefore, depending on the context, a culture may be more or less collectivistic.
Scores for Mexican nationals portray them as being highly collectivistic in
relation to in-groups and out-groups, but no more collectivistic than many
Western societies when it comes to working inside organisations.
Of particular importance to my study is the presence of sub-cultures within
the borders of a nation. Although the cultural dimension of collectivism is not
mentioned, some microfinance authors (Abbink et al., 2006, p. 616; Armendáriz
de Aghion & Morduch, 2005, pp. 93-94, 109) indicate that rural clients live in
88
more closely-knit communities where people tend to have more information about
their neighbours in contrast to urban dwellers. Cross-cultural management authors
(Erez & Somech, 1996; Hofstede, 1997, pp. 65, 74) also suggest that rural areas
tend to be more collectivistic than urban areas. The cultural dimension of
collectivism appears to explain why large groups may function better in rural
environments where communities are still more closely knit. Hofstede states that
“identity (in a collectivistic society) is based in the social network to which one
belongs” and the “economy (is) based on collective interests” (1997, pp. 67, 73).
It would seem logical that group loans would be better adapted to communities
that are more collectivistic.
Masculinity/Femininity
Masculinity is a second cultural dimension that is highly relevant to my
study. Hofstede (1980) did not intend this dimension to measure the level of
gender equality in a society, such as the Globe study’s (House et al. 2004) later
dimension of gender egalitarianism, but this dimension encompasses attitudes to
what gender roles are supposed to be in a society as opposed to how occupations
are actually divided up amongst males and females.
Based on all the information about the distinctions between societies related
to this dimension, it can be defined as follows: masculinity pertains to
societies in which social gender roles are clearly distinct (i.e., men are
89
supposed to be assertive, tough, and focused on material success whereas
women are supposed to be more modest, tender, and concerned with the
quality of life); femininity pertains to societies in which social gender roles
overlap (i.e., both men and women are supposed to be modest, tender, and
concerned with the quality of life) (Hofstede, 1997, pp. 82-83; see also
Hofstede, 2009, p. 570).
House and colleagues criticised this dimension and divided it up into four cultural
dimensions: “Ultimately, we argue that masculinity/femininity…confounds
assertiveness, gender egalitarianism, humane orientation, and achievement
orientation, thereby yielding findings that are difficult to interpret” (House et al.,
2004, p. 344). However, by dividing the dimension of masculinity up, it could be
argued that the social scientist loses sight of the overall attitudes that distinguish
high masculine cultures from low masculine cultures and therefore, masculinity is
no longer a topic of importance.
Hofstede’s original IBM survey found that men and women consistently
answered differently when the questionnaire was concerned with work goals. Of
particular interest were the questions about “hav(ing) a good working relationship
with your direct superior” and “work(ing) with people who cooperate well with
one another” which represent the feminine pole (Hofstede, 1997, p. 82). Women
attached the most significance to these two questions indicating that relationships
and cooperation are highly important to them. Hofstede (1997, p. 82) concludes
from these results that “the importance of relations with the manager and with
90
colleagues corresponds to the feminine, caring, and social-environment oriented
role.”
Arguably, gender attitudes have a large role to play in the success of group
loans in Mexico, a country that ranks high on Hofstede’s (1997) masculinity
index. Mexico has the sixth highest ranking in the masculinity index (MAS)
values for 50 countries and 3 regions (Hofstede, 1997, p. 84). This ranking
indicates that in Mexico there is a significant gap in the way females and males
are expected to behave. Hofstede (1997, p. 85) expounds:
Individual women can learn to function in a masculine way and individual
men in a feminine way. Where men are together a masculine culture is
likely to dominate; where women are together, a feminine culture. Calling
these differences ‘cultures’ stresses their profound and emotional
nature…The males in virtually every society dominate in politics, in the
community, and at the workplace; so the subcultures of politics, community
affairs, and work are relatively masculine…The differences among
countries…have mainly resulted from different gender roles and
socialisation processes in the family and at school…
According to Hofstede’s theory, differences in the behaviour of all-female groups
and all-males groups are the result of socialisation processes, which in turn are
determined by culture. When masculinity is compared to the cultural dimension of
power distance, Mexico is placed in a quadrant that “stands for a norm of a
91
dominant tough, father and a submissive mother who, although fairly tough, is at
the same time the refuge for consolation and tender feelings (Hofstede, 1997, pp.
87-88). All-female groups will probably behave with feminine values that stress
cooperation, consensus and relationships, whereas all-male groups should be more
competitive, assertive, ambitious, and focused on equity (individual performance)
(Hofstede, 1997, pp. 93-97). Feminine cultures socialise children towards mutual
solidarity, caring for others, modesty, equality, compromise, negotiation,
environmental protection, and obtaining quality in one’s work life (Hofstede,
1997, pp. 91, 93, 96-97, 103).
It should be stressed that feminine cultures will be low in masculinity with
no significant differences in workplace values between males or females, whereas
masculine cultures will be high in masculinity with a significant difference
between males and females. Here I will give a few examples to underline this
point. A recent paper on full time American managers and professionals by
Powell and Greenhaus (2010, p. 515), for example, agrees that there is a
significant difference in the beliefs of males and females about the degree to
which they possess feminine characteristics, such as those that are
“interpersonally oriented” or “communal”. Hofstede (1992, p. 105) affirms that
“the more a society moves to the masculine side, the wider the gap between its
“men’s” and “women’s” values.” In Cultures Consequence’s (1980, pp. 261-262)
Hofstede originally insisted that “countries with higher MAS values also show
greater differences in values between men and women in the same jobs.” This is
visually produced in Exhibit 6.5 (p. 288) of Culture’s Consequences, which
92
displays a graph with the masculinity index by gender on the vertical axis and the
country masculinity index on the horizontal axis. The lines represented
masculinity and femininity are joined at the bottom left hand side of the graph.
The lines then separate as they rise towards the right hand side. At the far right
hand side the lines are at their most separated point with males being distinctly
higher in masculinity, illustrating that males in the most masculine societies are
significantly more masculine in their values than females in these societies.
Feminine cultures in northwestern Europe began to evolve from trading and
seafaring societies that depended on good interpersonal relationships between
communities. When the Vikings left their native shores on their many voyages
between AD 800 and 1,000, their women had to organize the economic life of
their communities (Hofstede, 1997). Women also formed business teams during
the time of the Hanseatic League (1200-1500), an autonomous association of
trading settlements of northwestern Europe. Because the Hansa women had a
relative degree of freedom, this led to an increase in their independence and
business skills (Hofstede, 1997).
Hofstede uses various examples of feminine cultures and masculine cultures
to stress differences in behavioural norms. He suggests that “in feminine cultures
a humanised job should give more opportunities for mutual help and social
contacts” (Hofstede, 1997, p. 94). Swedish workers (in a feminine culture) in Saab
and Volvo in the 1970s were found to prefer autonomous work groups that relied
on interdependence, whereas Detroit automobile workers (from a masculine
culture) who visited the plant to inspect these experiments later said they preferred
93
their US work system which stressed independence (Hofstede, 1997). Hofstede
(1997, p. 95) also emphasises the difference in meetings between the Dutch (a
feminine culture) and Americans: “In the Dutch situation, meetings were places
were problems were discussed and common solutions were sought; they served
for making decisions. In the US situation…meetings were opportunities for
participants to assert themselves: to show how good they were. Decisions were
made by individuals elsewhere.”
Armendáriz de Aghion and Morduch (2005) provide an informative
discussion of the advantages that women may have as borrowers in microfinance.
Women are said to be more susceptible to the verbal hostility and pressure of
group members and MFI staff. It is also easier for group and staff members to
monitor and pressure women because women are generally less mobile than men.
Due to this lack of mobility, their fear of social sanctions, and, perhaps, higher
risk aversion, women will tend to be more cautious in their investment
strategies.16 Women are probably more sensitive to criticism and social pressure
because they place more importance on harmonious relationships. Female workers
have often been preferred to men in the “offshore plants” of multinational
corporations and in the electronics industry because they are not only cheaper to
hire, but are said to be more obedient and disciplined, and have greater manual
dexterity and patience than men (Charlton, 1984). Also, their goals of maintaining
a secure environment for their family may make women less likely to take risks
that may upset the family economy. These goals that emphasise family welfare 16 Risk taking behaviour may also be related to testosterone levels, with young men more susceptible to risk taking. See Saad (2006) for an evolutionary psychology explanation of gender and consumption behaviour.
94
more can be described as long-term goals that value business stability, compared
to the short-term risky profit seeking behavior of males. Related to long-term
goals, Hofstede describes feminine cultures as being more concerned with
environmental and community welfare. Abbink, Irlenbusch and Renner, for
example, mention an experiment carried out in Zimbabwe using a public good
game that found that women “tend to contribute more to the public good than
men” (2006, p. 617).
When masculinity is compared to femininity, it is constantly emphasised
that feminine cultures focus on nurturing and caring behaviours as opposed to
achievement (Hofstede, 1997). Development literature often states that because
women are more likely than men to put the interests of their family first, they are
more likely to re-invest credit into their business if they think that the business
will benefit their children and family in the long run (Haig-Muir, 1996). Women
seem to invest more in household consumption and in human capital
development, such as health care and the education of children (Khan, 1999; Pitt
et al., 2006; Rosintan et al., 1999). Men, on the other hand, are more likely to
spend credit on entertainment or luxury items, such as cigarettes and radios, that
do not appear to aid the economic welfare of their families (Jacobsen, 1998). In
poorer levels of society men appear to be generally less responsible than women
in spending money and tend to be more self-centered than women in their
purchases. Muhammad Yunus, founder of the Grameen Bank, has observed that
“when women borrow, the beneficiaries are the children and the household. In the
case of a man, too often the beneficiaries are himself and his friends” (Nebel &
95
Wright, 2000, pp. 177-178). On the other hand, the degree and results of such
supposedly unnecessary expenditures should be investigated thoroughly as it is
possible that a poor male may be attempting to build up his community status and
social capital in this manner and that such a strategy might possibly benefit the
welfare of his family in the long run.
Blumberg (1989a, 1991, 2005) points out that a change in the balance of
economic power can affect family well being and points to a number of studies
that state that women hold back less income for personal use and spend more on
family welfare and children’s nutrition (Bolender, n.d.). In one study carried out
in 20 villages in South India, although women earned 55 percent of male income,
the proportion of male contributions (70% and 74% in two states) to female (90%
and 98%) was always much lower (Blumberg, 1991, pp. 102-104). In one village
in which men and women had roughly equal incomes, women still dedicated a
higher proportion to family needs. In the cases in which women devoted less than
100 percent to the family, income was spent on work-related transport and lunch
costs, whereas men held back a portion for leisure and “status production”
activities. This study also found that when women earn less, men actually
contributed a lower proportion of their earnings to family needs. A Mexico City
based study of 140 women, who were doing garment/textile piecework in their
homes, found that men also held back more income (Blumberg 1991, p. 103).
However, when, according to the culture, women have no structural obligations to
contribute to family needs, their spending patterns may not be more altruistic,
except in times of crisis. Women also spend a greater proportion of their income
96
on investments in extended kin exchange/sharing networks that provide an
insurance/risk spreading function of reciprocity in times of need.
Numerous studies support the argument that women who retain control of
income and expenditure invest proportionally more income on family education,
nutrition, health care and children’s clothing, whereas men spend more on
unnecessary consumer goods, luxury items and entertainment (Armendáriz de
male groups. More effective group participation amongst clients will be
characterised by greater mutual insurance, solidarity, learning, and joint-decision
making amongst clients. Learning refers to knowledge or skills acquired from
interactions with other clients. Groups with higher levels of mutual aid and
solidarity should increase the overall social capital of clients. Group loans
combine instrumental and interpersonal relationships, which should lead to
increased social capital, particularly amongst women due to their more effective
group participation. Studies have shown that increased social capital leads to
increased borrowing, human capital and economic capital and that the returns of
social capital are highest for the poorest levels of society (Grootaert et al., 2004,
pp. 15-16; Salinas Occelli, 2005, p. 124). Learning in groups and joint-decision
making in groups also contributes to more human capital. Higher levels of human
capital also lead to more economic capital.
In addition, improved group participation and cooperation overall will lead
to higher repayment rates and hence to more capital accumulation. In a group in
which relations are considered more important, group members should be more
punctual about repaying their loans in order not to upset the solidarity that has
been generated in the group. If one of the members is tardy or defaults, her
relationship with other group members will be negatively affected. Healthy
repayment rates represent future access to credit. Credit enables clients to invest in
their businesses in the form of physical capital, merchandise, services and/or
employees. If clients are thoughtful and responsible with their investments this
should raise the economic capital that is generated.
100
Women dedicate a higher percentage of their income towards fulfilling
their families’ basic needs (Blumberg, 1991) and are expected to be more
motivated to spend their income on investments that provide a stable source of
income and that favor satisfying these needs over the long-term. Female clients
realise that loans from a MFI might be one of their few sources of credit or their
only source; that credit enables them to invest more into their micro-business; and
that the family income will in turn expand, which enables greater spending on
family necessities. This increased spending may continue as long as the client has
access to credit or until their business becomes more sustainable. The higher
desire to fulfill the basic needs of the family over the long-term will serve as an
added motivation to female clients to ensure access to credit. Therefore, women
will be more motivated to continue in MFI programs and will register higher
repayment rates than men. For example, a client list I obtained from a centre of a
MFI in Monterrey revealed that female clients with individual loans had higher
repayment rates than males with individual loans17. Repayment rates will also be
higher for clients in all-female groups due to the higher levels of peer-group and
community pressure they experience, which pressures them to repay more
punctually.
Environment is expected to moderate the relationship between loan
methodology and peer-group pressure experienced by clients, and between loan
methodology and community pressure experienced by clients, because the peer-
17 49.1% of 110 female clients that had received individual loans in the last one and a half years were up-to-date with their payments compared to 45.3% of 53 male clients with individual loans. However, the list doesn’t differentiate between new clients and continuing clients so there is a chance that more female clients are new clients. On the other hand, repayment rates in many studies are shown to be higher for female clients (see Chapter 2).
101
group pressure and community pressure experienced by clients are expected to be
higher in rural areas. Higher peer-group pressure should also increase community
pressure because when group members are more anxious about potential
defaulters and pressure them more, others members of the wider community, such
as relatives and business associates, will also be more concerned, which should in
turn lead to more pressure on group members from the outside community, thus
also increasing peer-group pressure amongst MFI clients. Increased peer-group
pressure and community pressure on clients should increase client repayment
rates, which in turn leads to increased survival in the MFI program, increased
access to loans, and increased capital creation, in this case economic capital.
3.5 Hypotheses
Individual Loans and Capital Creation
MFIs that employ individual loans serve less women (46 percent), than
MFIs that lend to solidarity groups of 3 to 9 borrowers (73 percent), and village
banks with groups of more than 10 clients (89 percent) (Armendáriz de Aghion &
Morduch, 2005). Examples of the superior repayment rates of female clients come
from programs that practice group loans.
The traditional theories of gender, such as human capital and social
network theories, explain why male small-business owners will generally create
102
more capital than female business owners (Bird et al., 2001). The theory of human
capital argues that women business owners are more inclined to invest their time
into managing both family relationships and businesses, whereas men invest more
time into their businesses (Jacobsen, 1998; Kalleberg & Leicht, 1991; Loscocco at
al., 1991). Therefore, women have less human capital that is conducive to small
business success.
The business-related social capital of males who have individual loans
may increase more than that of females with individual loans in accordance with
social network theory. Social network theory claims that the social networks of
women emphasise interpersonal relationships over instrumental relationships and,
therefore, women are exposed to fewer business-relevant sources (Brush, 1992;
Moore, 1990; Worchel et al., 2002). Other traditional theories, organisational
ecology and feminist views18, also explain why male small-business owners will
generally create more capital than female business owners.
Although poor women may be more motivated to fulfill the basic needs of
their families, according to the empirical evidence provided by Blumberg (1991),
and, therefore, may persevere in microfinance programs longer and re-invest their
income into their small businesses, the traditional theories mentioned above will
probably explain better gender and capital creation with individual loans.
Furthermore, a masculine culture focusing on achievement, assertiveness, and a
preference for independence, as opposed to an emphasis on relationships and
18 See section 2.3 for a brief summary of these theories of gender.
103
interdependence, would appear to be better suited to individual loans (Hofstede,
1997).
The four traditional theories of gender explain why males will generate
more economic capital, including financial capital, physical capital, and
employment. For example, the organisational ecology view expounds how male
small-business owners will occupy larger and more prosperous businesses in less
crowded industries. These small businesses will generate more income for the
owners, contribute to more infrastructure, and create more employment. In
addition, the theory of human capital explains why men will produce more human
capital that is conducive to small business success, and the theory of social
networks explains why males forge more business-related social capital.
Hypothesis 1: Male clients will create more capital (economic, human and
social)19 with individual loans20 than female clients with individual loans.
Group Participation
The cultural dimension of masculinity provides a good explanation of why
all-female groups in Mexico, a country with a high ranking in the masculinity
index (MAS), will behave differently than all-male groups or mixed groups
19 For a definition of capital and the three forms of capital (economic, human, and social) that I refer to, see section 2.2. 20Individual loans: loans provided by MFIs to clients that do not involve any joint liability with other clients of the same MFI if the client is behind in the repayment schedule or defaults on the loan repayment. This loan methodology does not involve weekly or monthly meetings with members of the same group.
104
(Hofstede, 1997). Whereas females in Mexico will possess more masculine
values, due to the high level of masculinity in Mexico, there will also exist a
wider gap between the values of males and females regarding this cultural
dimension. A review of Hofstede (1997) reveals that the feminine pole
(pp. 96, 103). Mutual insurance (help), solidarity, and joint-decision making
would clearly appear to be values that feminine cultures espouse. In addition, if
all-female groups cooperate more, are more concerned with their group
relationships, and help each other out more, it seems logical that clients in all-
female groups will learn more from each other than clients in all-male groups or
mixed groups. Also, a greater concern for fellow members should contribute to
higher attendance and punctuality in all-female groups.
Group forces may motivate female clients more than male clients and
influence women to behave with more social responsibility and, as a consequence,
misuse funds less. According to my exploratory study (Griffin, 2008), women in
Mexico appear to collaborate more effectively in microfinance groups than men
and may provide more support and feedback to their co-members. Therefore,
groups of poor women may be more efficient at transferring knowledge amongst
themselves than groups of poor men. For example, a government program in a
105
predominantly rural state of Mexico claimed that women “assimilate better the
technical knowledge that is offered by the institution” (Griffin, 2008, p. 14).
Those studies that report encouraging results for female clients were
carried out in MFIs that operate with group loans (e.g. Hashemi et al., 1996;
Kevane & Wydick, 2001; Pitt & Khandker, 1998; Pitt et al., 2006). Women
working as employees in BRAC, a large MFI operating in Bangladesh,
demonstrate high levels of group support (Khan, 1999). Groups also provide
women with opportunities for social learning, gender solidarity and ‘group
reproduction’ (Griffin, 2008; Velasco, & Marconi, 2004). Group lending to
women in Bolivia stimulates collective public action and these externalities are
achieved when intra-group equality is high and the group has a collective
experience of adversity. During the mid 1980s economic crisis in Bolivia, while
the bulk of the microfinance loan volume declined during the recession, the
volume of the all-female integrated MFIs continued to rise (Velasco & Marconi,
2004).
Hypothesis 2: The greater the proportion of female members in a group 21, the
higher the levels of mutual insurance, solidarity, learning, and joint decision-
making experienced by group members.
21 Group loans: loans to more than one client that involve joint liability for loan repayment between members and some level of expected group participation between members, such as a minimum of one group meeting a month and assigned tasks (president (leader), treasurer, secretary etc.) within the group.
106
Peer-Group and Community Pressure
The discussion of group participation above suggests that all-female
groups or groups with more females will demonstrate greater concern for their
fellow group members (Hofstede, 1997). A greater concern for relationships in
these groups will contribute to higher levels of peer-group and community
pressure. Social network theory, which argues that females tend to favor inter-
personal relationships over instrumental, has similarities with Hofstede’s cultural
dimension of masculinity/femininity, in that it argues that women are more
concerned with non-aggrandising relationships. This theory indicates why group
loans have had a large impact on the female clients of microfinance institutions,
because women in microfinance groups are able to engage in both inter-personal
and instrumental relationships.
Peer-group pressure would seem to be a crucial factor contributing to the
success of female groups that is largely overlooked in the microfinance literature.
A few authors (Armendáriz de Aghion & Morduch, 2000, 2005; Rahman, 1999)
and my exploratory study (Griffin, 2008) suggest that women may be more
influenced by peer-group pressure than men. Armendáriz de Aghion and Morduch
(2005) report that women in microfinance programs are said to be more
susceptible to the verbal hostility and pressure of group members and MFI staff,
whereas men have a greater tendency to resist and reject criticism. Women also
have a greater tendency to stay in or around the home and are, therefore, easier to
locate, monitor and pressure, and they may find it easier to maintain membership
in groups and programs over the long term. Therefore, according to Armendáriz
107
de Aghion and Morduch, “because women are less mobile and more fearful about
social sanctions, they tend to be more risk averse than men and more conservative
in their investment projects” (2005, p. 189).
Because women are more susceptible or sensitive to disparaging remarks
and less mobile than men, community pressure is also expected to be significant
in group-based loans because other members of the group may exert pressure on
the defaulter by appealing to family, friends and other members of the community
(Besley & Coate, 1995; Griffin, 2008). Social control through the potential threat
of reprisals from within the community is an effective tool for ensuring
cooperation, especially when an individual’s status and reputation are at stake.
Hypothesis 3: The greater the proportion of female members in a group, the
higher the levels of peer-group and community pressure experienced by group
members.
Group Loans and Capital Creation
Some studies (Haase, 2006; Matienzo, 1993) claim that men are able to
increase their incomes more than women in microfinance. Other researchers
(Carloni, 1987; Clark, 1991; Kevane & Wydick, 2001; Wydick, 2002) state that
female clients do as well or better than male clients in performance, sales and
employment generation.
108
Taking into account the discussion to support Hypothesis 2, I argue that
all-female groups or groups with a greater proportion of female members will be
able to increase social and human capital to a greater extent than mixed groups
with fewer female members due to higher levels of mutual insurance, solidarity,
learning, and joint decision-making. Group participation will be more effective in
all-female groups due to the feminine culture that will be more prevalent in these
groups (Hofstede, 1997). According to my exploratory study (Griffin, 2008), poor
female microfinance clients collaborate more effectively in groups, support each
other more, form stronger social ties, and are more affected by peer-group
pressure. It is expected that women will be able to increase their social capital
more than men during the initial period of access to microcredit. As women are
more concerned with relationships, female clients should be able to develop more
social capital from microfinance group relationships than male clients.
The discussion in Hypothesis 2 also indicates that intra-group learning will
be greater in all-female groups or groups with a greater proportion of females due
to the prevalence of feminine values that emphasise cooperation, mutual
assistance and concern for others. Intra-group learning should aid female clients to
learn more about their business and increase their overall business-related human
capital. Furthermore, higher levels of social capital will also lead to a greater
accumulation of human capital (Grootaert et al., 2004).
Higher levels of peer-group and community pressure in all-female groups
(see Hypothesis 3) will also influence female clients to repay their loans more
frequently. Higher levels of human capital, social capital, peer-group pressure,
109
and community pressure will in turn lead to the growth of economic capital
(Grootaert et al., 2004). Group loans and the more responsible investment habits
of poor females will help to offset the advantages that males are said to enjoy
according to the traditional theories of gender and business success mentioned in
Hypothesis 1.
Hypothesis 4: The proportion of females in a group will have no significant effect
on the generation of capital.
Group Loans and Environment
There does not appear to be sufficient literature that explains why MFIs
may prefer to operate with large groups in rural environments and individual loans
in cities. This could be explained by cross-cultural management theories. In
particular, the cultural dimension of collectivism may explain why large groups
may function better in rural environments where communities are still more
closely knit (Hofstede, 1997). Some microfinance papers indicate that rural clients
live in more closely-knit communities where people tend to have more
information about their neighbours in contrast to urban dwellers, although the
cultural dimension of collectivism is not mentioned in these papers (Abbink et al.,
2006, p. 616; Armendáriz de Aghion & Morduch, 2005, pp. 93-94, 109). Other
authors state that rural areas tend to be more collectivistic than urban areas (Erez
110
& Somech, 1996; Hofstede, 1997, pp. 65, 74). Besley and Coate (1995, pp. 13-14)
had pointed out that
social collateral in the form of sanctions available to community members
to discipline poor behavior is a resource that can usefully be harnessed by
group lending…..(and that) this may explain why group lending is often
advocated for rural lending in developing countries, where social
connectedness among communities is typically high.
My exploratory study (Griffin, 2008) indicates that peer-group and community
pressure is stronger in rural areas, where traditions and social ties are more
binding, than in urban areas. Therefore, it will be more stressful for clients to
default on their loans or exit from the program in rural areas. Because
communities in rural areas are more closely knit, group members will probably
communicate more together and be able to interchange ideas and knowledge to a
greater extent contributing to the creation of human capital.
In Mexico there is a tendency for MFIs to operate with groups of between
10 and 50 clients in rural areas, and with groups of between 3 and 9 clients or
individual loans in urban areas (Griffin, 2008). According to Armendáriz de
Aghion and Morduch (2005, p. 120), urban MFIs in Latin America and the
transition economies of Eastern Europe have “eschewed group loans from the
start.” Gomez and Santor (2003) found that borrowers in certain neighbourhoods
in Canada outperformed others and they discovered a negative coefficient in urban
111
areas in contrast to suburban areas. This may be due to less group or community
pressure in urban areas. Abbink and colleagues (2006, p. 616) suggest that it may
be more difficult to create self-selected groups in urban areas of transition
economies than in “closer-knit rural communities.”
Hofstede states that “identity (in a collectivistic society) is based in the
social network to which one belongs” and the “economy (is) based on collective
interests” (1997, pp. 67, 73). It would seem logical that group loans would be
better adapted to communities that are more collectivistic. I propose that higher
social cohesiveness in rural areas will generate higher levels of social capital,
social pressure, and effective participation within groups. This will lead to the
creation of more human capital and, consequently, economic capital.
Hypothesis 5: The smaller the population of a city/town in which clients reside,
the greater the capital creation of clients with group loans.
112
CHAPTER 4: METHODOLOGY
4.1 Introduction and Research Design
This chapter will provide a description and explanation of the research
methodology I have adopted for my dissertation. In the first section I will briefly
explain why I chose a survey, specifically a self-administered survey, instead of
other research methods. In the next section I will begin by describing how other
studies have operationalised the variables in my conceptual model, how they have
influenced the final choice of items for my survey, and why I chose the items in
Appendix A. I will first discuss the dependent variable, then the independent
variable, moderating variables, mediating variables, and control variables. The
items in Appendix A appear in the same order as they are discussed in the
measurement section. Then in Section 3 I include my two pilot studies to test
these items and reduce them. Section 4 will be dedicated to a discussion of data
collection, which will include the population, sampling design, possible sampling
problems, the application of the survey, and data entry. The last section will deal
with the analysis of data utilising structural equation modeling, and will include a
discussion of both the potential limitations of my research method and how I
intend to overcome these limitations.
After investigating the different possible contributions that I could make
with a study on microfinance, I decided that it would be best to focus on the
113
questions surrounding gender and loan methodology, and environment and loan
methodology. The best methodology for answering my research questions is a
self-administered survey (Babbie, 1998; Fowler, 2002). A survey was selected
after originally considering a multi-method design consisting of a case study to
generate new theory, and an interview-based questionnaire (Glesne, 1992; Lincoln
p. iv) suggests that both quantitative and qualitative research can provide
revealing data about microenterprises: “Whereas a quantitative survey can
measure broad patterns and correlates of change, case studies can illuminate the
impact process; test counter-factual or rival explanations; and investigate complex
or unexplained phenomena.” An exploratory study employing a case study could
reveal new theory, but I already had some research questions that could make a
significant contribution to the literature and that could be answered with a
quantitative study (Yin, 2003).
A quantitative survey is more appropriate for my more immediate research
objectives. Studies on gender and loan methodology have not conducted a
thorough measurement of different forms of capital (economic, human and social)
nor of the influence of different forms of social pressure and group forces on the
three forms of capital. There is also a lack of literature concerning environmental
forces, although Wydick (1996, 2002) does include rural and urban clients in his
survey. The conceptual model that I developed during my literature review and
pilot study can be tested using structural equation modeling because this statistical
tool is appropriate for testing all of the variables in a model, not just the
114
relationships between the independent and dependent variables. The kind of
research questions that I am asking need to be carried out in a microfinance
setting in a developing country and, therefore, an experiment (Babbie, 1998;
Campbell & Stanley, 1963) would not be a valid substitute for an authentic
environment. Abbink, Irlenbusch and Renner (2006) conducted an experiment on
social ties and group size, but there are many limitations with their experiment on
German students, including students knowing when the experiment would end.
4.2 Measurement
In this section I will explain how I operationalise the constructs in my
conceptual model. First of all I will discuss the operationalisation of the
dependent variable, capital. Then I will discuss the independent variable (loan
methodology), moderating variables (gender and environment), mediating
variables (peer-group pressure, community pressure, group participation, and loan
repayment), and the various control variables. The initial survey questions are
found in Appendix A, although the survey was later modified by pilot studies that
tested the reliability and validity of items. Some questions mentioned in this
section were omitted from the survey as the quesionaire had a limited length and
the omitted questions were later deemed less necessary for the success of the
survey.
115
Dependent Variable
Capital consists of economic capital, human capital and social capital22.
Economic capital. Economic capital includes physical capital (capital goods or
real capital), such as land and equipment, non-physical capital (money or financial
capital), and labour (capital, n.d.). It is doubtful that subjects will remember or be
aware of exact monetary quantities related to the different forms of economic
capital and if they do they may be reluctant to divulge such information. In any
case, exact quantities of income are not necessary as my objective is to measure
the relative growth of clients’ economic capital and, therefore, statements using a
Likert scale will be employed. I have one Likert scale item measuring physical
capital, three items measuring different forms of financial capital (profit, sales,
and savings), and one for labour. I have limited my measurement of economic
capital to the business(es) of the microfinance borrowers as the measurement of
the economic capital of the household takes into account contributions of different
family members and not just the microfinance client. My objective is to measure
the growth of the client’s capital that can contribute to future business growth and
not to measure the capital of the client’s entire family.
Of the studies that have attempted a measure of physical capital, Pitt and
Khandker (1998) included women’s non-land assets; McKernan (2002) transport
assets, agricultural assets, tools, processing equipment, and inventory for non-
22 For definitions of capital see section 2.2.
116
farm enterprises; Wydick (1996, 2002) new equipment for enterprises; Gomez
and Santor (2003) household assets; and Pitt, Khandker and Cartwright (2006)
household land assets. Just what items Pitt and Khandker (1998) used to measure
non-land assets in their survey is not clear. All of these studies involve ratio
measures, except for Wydick’s that appears to utilise a nominal measure (yes/no).
Purchase of equipment in Wydick’s (2002, p. 504) 1999 Guatemalan survey was
significantly higher for men, although this could be explained because females
tended to be involved in retail enterprises as opposed to manufacturing. I will
employ an item that incorporates a broader measure of physical capital than new
equipment and which uses an ordinal scale.
I have included three items for financial capital. Business sales have been
measured by Sadoulet (1999); Kevane & Wydick (2001); Wydick (2002); and
Gomez and Santor (2003). Wydick (2002) uses a nominal measure for business
growth, whereas the other three studies employ ratio measures. I will utilise an
ordinal measure of business growth as a nominal measure with structural equation
modeling would require a much bigger sample.
Profit is a crucial indicator of economic capital and overall business
success and requires more calculation than sales. Therefore, sales serves as a
check for profit as the two indicators are normally highly correlated. McKernan
(2002) measured self-employment profits; and Gomez and Santor (2003) business
profit. McKernan’s (2002, p. 103) definition of profit is “total household gross
revenue from self-employment, plus the value of household consumption from
production less monthly operating expenses (primarily raw materials and hired
117
labour). Both studies utilised ratio measures. I will employ an ordinal scale here
as I am interested in comparing the growth of business profit over time not in
actual quantities.
A third item for financial capital is savings. Studies that take into account
savings are Wydick’s (1996, 2002) and Haase’s (2006). One of the problems with
measuring savings is that, depending on the family, it may be difficult to separate
the savings of a micro-entrepreneur and those of other members of the family. In
the case of married women, the husband may control the savings account of the
family and make a dominant contribution. The question I use to measure savings
was adapted from a question in Wydick’s (1996, pp. 17-18) survey: “19b. How
have the loans from FUNDAP benefited your family? (circle those that apply).”
One of the options is “increased savings”. I use an ordinal measure of savings.
Labour has been measured by Wydick (1996); Pitt and Khandker (1998);
Kevane and Wydick (2001); Wydick (2002); and Haase (2006). Wydick’s (1996,
p. 16) survey includes two questions: “2a. Before receiving loans from FUNDAP
how many employees did you have? 2b. How many employees do you have
currently?” These are the same two questions that are found in Kevane and
Wydick (2001), whereas Wydick (2002) has included a nominal measure (yes/no)
from a more recent survey. Wydick (1996, p. 17) also asked in his dissertation
survey whether the micro-entrepreneur’s business had benefitted from its
relationship with the MFI because it “added new employees”. Pitt and Khandker
(1998) measured market labour supply by gender including self-employment
according to the number of hours worked per month of employees/owners
118
between the ages of 16 and 59. Haase’s (2006) questions on labour were similar to
Wydick’s (1996). I will use an ordinal measure for labour generation.
Human capital. I intended to measure human capital with three items. The
standard item for measuring human capital refers to the formal education of the
client, that is, the highest grade completed by the client and/or by the client’s
family (e.g. McKernan, 2002, p. 111). This does not, however, include the growth
of knowledge, skills or awareness that the client may have gained by participating
in a business or by socialising with other micro-entrepreneurs. Some studies have
included items for knowledge, skills or awareness development. Pitt, Khandker &
Cartwright (2006) include the thematic group of activism, which is a dimension of
social capital (the dimension of empowerment and political action), but includes
an awareness of law and politics. Sadoulet (1999, p. 126) includes items for the
number of years of business experience and the age of the business at the
beginning of the group. Gomez and Santor (2003) provide information on the
percentage of clients with skills training in business activity and self-employment
training.
My items for human capital were adopted from the “Guide for Assessing
the Impact of Microenterprise Services at the Individual Level” (Chen, 1997).
Chen of the Harvard Institute of International Development includes cognitive
change as a major part of her consolidated framework that she developed for the
Assessing Impact of Microenterprises (AIMS) Project undertaken for the U.S.
Agency for International Development’s (USAID’s) Microenterprise Initiative.
119
The AIMS Project had developed a comprehensive research plan and engaged in
longitudinal impact assessments of three MFIs operating in Peru, Zimbabwe, and
India. Chen’s paper also builds on previous impact studies of MFIs that targeted
female clients in Bangladesh and India and developed conceptual frameworks.
Before Chen’s working paper, AIMs had “carried out eight technical and literature
review desk studies and three field studies. These studies have helped to clarify
analytical and measurement issues related to the study of the impacts of
microenterprise services at the client, enterprise and household levels” (Chen,
1997, p. 2). The cognitive pathway comes from the second of “four broad
pathways through which individuals experience change” (Chen, 1997, p. iv). This
pathway measures cognitive change and whether “participation in microenterprise
services leads to”...” increased knowledge”, “improved skills”, and “increased
awareness of (the) wider environment” (Chen, 1997, p. 7). I have included three
Likert scale questions for measuring human capital in the survey, one for each
dimension of cognitive change.
My first question concerning human capital measures knowledge in the
form of literacy and numeracy (Chen, 1997, p. 17). Chen recommends “ask(ing)
respondents whether they a) can read a newspaper and b) maintain accounts for
their business” (1997, p. 22). My second question measures an increase in skills
(Chen, 1997, p. 17). Chen recommends “ask(ing) respondents whether they have
received any skills, management, or entrepreneurship training” (1997, p. 23). This
research is not interested in whether clients have received training, but whether
clients have improved their business skills due to the positive effects of group
120
loans and increased social capital. My third question measures an increase in the
awareness of the wider environment (Chen, 1997, p. 17). Chen recommends
“ask(ing) respondents whether they have engaged in new or non-traditional types
of work since joining the program” (1997, p. 22). Chen recommends a case study
approach for these questions, but, as with the questions for economic capital, I
will utilise an ordinal measure and a survey.
Social capital. I intended to measure social capital with six items. Of those studies
I have consulted on microfinance, Kevane and Wydick (2001, p. 1230) measure
social capital or group homogeneity by asking respondents the number of “years
members were acquainted before group foundation” and whether the “group share
social activities”. They use a ratio measure for the first question and a nominal
measure for the second. Gomez and Santor (2003, p. 5) use a telephone survey
that measures “normally hard-to-observe characteristics, such as the nature and
abundance of social ties.” They ask three questions about social capital within the
group, and a related question about group solidarity. These three questions ask
about the proportion of the group that knew each other before the formation of the
group in the Canadian MFI; the amount of trust that exists within the group; and
whether the client is a member of a team, club, association, or organisation
(Gomez & Santor, 2003, pp. 7-8, 28). They use ratio, ordinal and nominal
measures respectively for these questions. Pitt, Khandker and Cartwright (2006)
attempted some measurement of social capital when they included the two
thematic groups of mobility and networks; and activism in their survey. They ask
121
questions with a nominal measure (yes/no) about borrowing emergency funds
from other unrelated people (not moneylenders); having voted in the last election;
voting independently; protesting against domestic abuse and corruption; and
sharing feelings with people outside the family (Pitt et al., 2006, pp. 821-822).
There is one question about the degree of mobility that employs an ordinal
measure (Pitt et al., 2006, p. 823). Unlike the first two studies above, my objective
is not to measure social capital within the group, but to measure the overall
growth of a client’s social capital within the local community and beyond.
The Integrated Questionnaire for the Measurement of Social Capital (SC-
IQ) is designed by the World Bank to “generate quantitative data on various
dimensions of social capital as part of a larger household survey” (Grootaert et al.,
2004: vii). The six dimensions are: groups and networks; trust and solidarity;
collective action and cooperation; information and communication; social
cohesion and inclusion; and empowerment and political action. The survey tool,
which focuses on measurement at the micro-level, the level of individuals and
households, was piloted in Albania and Nigeria and benefitted from “extensive
input and critique” from a team of external experts. “Each question included in
this document is drawn from prior survey work on social capital (where it has
demonstrated its reliability, validity, and usefulness)” (Grootaert et al., 2004, p.
1). The SC-IQ incorporates lessons learned in five studies undertaken in various
countries of Africa, Asia and Latin America. I have included one question in my
survey for each of the six dimensions of social capital.
122
The first question was modified from a question designed for the groups
and networks dimension of social capital.
This is the category most associated with social capital. The questions here
consider the nature and extent of a household member’s participation in
various types of social organizations and informal networks, and the range
of contributions that one gives and receives from them. This dimension
also considers the diversity of a given group’s membership, how its
leadership is selected, and how one’s involvement has changed over time
(Grootaert et al., 2004, p. 5).
I have chosen the following questions from the SC-IQ based on what I believe to
be the potentially most relevant ones for measuring the social capital of
microfinance clients in Mexico. The question I modified from this category came
from the Appendix of core questions: “About how many close friends do you
have these days. These are people you feel at ease with, can talk to about private
matters, or call on for help” (Grootaert et al., 2004, p. 46). Pitt, Khandker and
Cartwright (2006, p. 821) included similar questions in their survey.
The second dimension is trust and solidarity. “This category seeks to
procure data on trust towards neighbours, key service providers, and strangers,
and how these perceptions have changed over time” (Grootaert et al., 2004, p. 5).
The question I chose to modify for this dimension was: “Do you think that over
the last five years*, the level of trust in this village/neighbourhood has gotten
123
better, worse, or stayed about the same? [*enumerator23: time period can be
clarified by situating it before, after major event] 1. Gotten better; 2. Gotten
worse; 3. Stayed about the same” (Grootaert et al., 2004, p. 33).
The third dimension is collective action and cooperation. “This category
explores whether and how household members have worked with others in their
community on joint projects and/or in response to a crisis. It also considers the
consequences of violating community expectations regarding participation”
(Grootaert et al., 2004, p. 5). I modified a core question for this dimension: “In the
past 12 months, did you or any one in your household participate in any
communal activities, in which people came together to do some work for the
benefit of the community? Yes; No” (Grootaert et al., 2004, p. 47).
The fourth dimension is information and communication. “This category
of questions explores the ways and means by which poor households receive
information regarding market conditions and public services, and the extent of
their access to communications infrastructure” (Grootaert et al., 2004, p. 5). I
modified a core question for this dimension: “15. In the past month, how many
times have you made or received a phone call?” (Grootaert et al., 2004, p. 47).
The fifth dimension is social cohesion and inclusion: “Questions in this
category seek to identify the extent and nature of these differences (that can lead
to conflict), the mechanisms by which they are managed, and which groups are
excluded from key public services. Questions pertaining to everyday forms of
social interaction are also considered” (Grootaert et al., 2004, p. 5). I chose to
23 The enumerator appears to be the person responsible for adapting, organising and recording the survey. Enumerate = to tally, list, itemise etc.
124
modify a core question concerned with everyday social interaction: “How many
times in the past month have you got together with people to have food or drinks,
either in their home or in a public place?” (Grootaert et al., 2004, p. 48).
The sixth and final dimension is empowerment and political action. “The
questions in this section explore household members’ sense of happiness, personal
efficacy, and capacity to influence both local events and broader political
outcomes” (Grootaert et al., 2004, p. 5). I chose to modify a core question for this
dimension: “In the past 12 months, how often have people in your
village/neighbourhood got together to jointly petition government officials or
political leaders for something benefiting the community? 1. Never; 2. Once; 3. A
few times (< 5); 4. Many times (> 5)” (Grootaert et al., 2004, p. 49).
All of the questions in this section of the survey to measure economic,
human, and social capital utilise a seven-point Likert scale: 7. I strongly agree; 6.
I moderately agree; 5. I mildly agree; 4. I neither agree nor disagree; 3. I mildly
disagree; 2. I moderately disagree; 1. I strongly disagree.24
24 In regard to this kind of Likert scale question, De Vellis (2003, p. 79) comments: “Common choices for a midpoint include “neither agree nor disagree” and “agree and disagree equally.” There is legitimate room for discussion concerning the equivalence of these two midpoints. The first implies apathetic disinterest, while the latter suggests strong but equal attraction to both agreement and disagreement. It may very well be that most respondents do not focus very much attention on subtleties of language but merely regard any reasonable response option in the center of the range as a midpoint irrespective of its precise wording.”
125
Independent Variable
According to my conceptual model, loan methodology is the independent
variable and is a dichotomous variable divided up into group loans and individual
loans. Clients will be targeted according to their loan methodologies. There are
four questions about loan methodology, beginning with the type of loan
(individual or group). The other questions ask whether the client’s loan type has
changed, when it changed, and what type of loan the client had previously. Thus,
these questions check to see if the duration of a certain loan contract exerts an
influence on the dependent variable and whether the client has previously been
influenced by a different loan contract. This information is similar to Wydick’s
(1996, p. 16); Kevane and Wydick’s (2001, p. 1230); and Ahlin and Townsend’s
(2007, p. F31) question about the number of years the group has existed.
Moderating Variables
Moderating variables in this study are gender and environment. There are
three questions concerned with gender, which is a dichotomous variable. There is
a question about gender, the client’s name also provides me with information
about the client’s gender, and there is a question about the gender of members of
group loans. This third question also asks about the number of members in a
group, so it is also a question about group size. Wydick (1996, p. 16); Kevane and
Wydick (2001, p. 1230); and Ahlin and Townsend (2007, p. F31) also ask a
126
question about group size. Wydick (1996, p. 16) asks whether the group includes
only men, only women, or is mixed.
There are three questions related to environment. One question asks if the
client lives in the country, a town, a small city, or a large city. The client’s address
provides further information about the location of the client’s home. This was
checked with information provided by INEGI (National Institute of Statistics and
Geography) concerning the population of towns and cities in Mexico. In case the
client’s business is located in a different environment, I also ask about the location
of a client’s business. Wydick (1996, p. 16) asks about the location of the client’s
enterprise and whether it is rural or urban.
Mediating Variables
Variables that will mediate the influence of the independent variable on
the dependent variable are peer-group pressure, community pressure, group
participation, and repayment rates.
Peer-group pressure. I have five items for measuring peer-group pressure.
Wydick (1996) included three questions in his dissertation’s survey that were
concerned with the degree of peer-group pressure and he also performed a factor
analysis that revealed three distinct factors: social homogeneity (factor 1); group
solidarity and friendship (factor 2); and business monitoring (factor 3).
127
Borrowing groups who ranked highly in terms of factor 1 were rural
groups (rotated factor pattern = -0.818; urban dummy variable equal to 1 if
urban group), of the same sex (0.540) and ethnicity (principally indigenous
Quiché peoples) (0.765), had similar businesses (0.498), similar-sized
businesses (0.270), had known each other a long time (0.342), yet stated
that they were hesitant to pressure each other to repay loans (-0.330) as
they found pressuring their peers difficult (0.345)…..Groups who ranked
highest with factor 2 were groups who stated that they had been friends
prior to forming the group (0.548), shared many social activities together
(0.458), found it easy to admonish their fellow group members to repay
loans (0.486), stated that important motives to repay loans were to “stay on
good terms with my fellow group members” (0.644) and that “as a group
we must stay united (0.498).”…..Highly correlated with this factor (factor
3) were members having similar types of businesses (0.382) located in
close proximity (-0.399). Groups ranking highly with respect to factor 3
also stated they had keen awareness of other members’ weekly sales
(0.558), and found no difficulty in admonishing others to repay (-0.371)
(Wydick, 1996, p. 149).
Other items correlated with factor 3 not mentioned by Wydick, but found in Table
2 (1996, p. 148), are group members belonging to the same sex (0.302) and
having a business of roughly the same size (0.654). In factors 1 (0.242) and 3
128
(0.251), there was some correlation with friendship and some correlation to group
members knowing each other before the group in factor 2 (0.243).
My first four items for peer-group pressure were modified from the
following questions from Wydick’s (1996, p. 17) survey. Two of the questions are
ordinal measures and two are nominal.
• “15a. If a member of your group were to use a loan dishonestly and refuse
to repay, how much pressure would other members of the group exert on
this member to encourage him to repay? 4. much; 3. moderate; 2 little; 1
none.”
• “15b. Would pressuring a member to repay a loan be easy or difficult for
the members of your group? 3 difficult; 2 moderately difficult; 1 easy.”
• “16. Has your group ever expelled a member for failing to repay a loan?
yes; no.”
• “17. What do you think is the main incentive for borrowers in lending
groups like yours with FUNDAP to repay their loans? (check all the
reasons that are mentioned).” One of the possible reasons is “b) stay on
good terms w/ other members.”
The last question is not focused on group pressure related to repayment, but on
group pressure related to cooperating and participating in the group. It comes
from a similar ordinal question found in the World Bank’s social capital
integrated questionnaire (SC-IQ) (Grootaert et al., 2004, p. 34): “3.4 How likely is
it that people who do not participate in community activities will be criticized or
129
sanctioned? 1 very likely; 2 somewhat likely; 3 neither likely nor unlikely; 4
somewhat unlikely; 5 very unlikely”.
All of the questions about peer-group pressure utilise a seven-point Likert
Solidarity. A united group should participate more effectively. Solidarity is
positively correlated with open communication and peer-group pressure in
Wydick’s (1996) factor analysis. The item I chose to measure group solidarity is
modified from a nominal measure in Wydick (1996, p. 17) survey: “17. What do
you think is the main incentive for borrowers in lending groups like yours with
FUNDAP to repay their loans? (check all the reasons that are mentioned).” One of
the possible reasons is “d) as a group, we must stick together.” This question is
similar to an ordinal question about motivations for repayment in the survey of
Gomez and Santor (2003, p. 28), in which 81.5 percent of group clients claimed
132
that not wanting to let the group down was “extremely important”, 13.7 percent
“important”, 3.6 “somewhat important”, and 1.2 “not important”.
Learning. If capital creation is greater in group loans than individual loans this
may be caused by the learning that takes place in groups. Being influenced by a
higher level of communication and advice in group loans may influence greater
learning that should also contribute to more effective group participation. To
measure learning, seeing as this construct was not found in other microfinance
surveys, I developed the following item: “How likely do you think it is that
members of your group often learn from other group members?” The new items I
have developed for group participation will be tested for reliability and validity.
Joint decision-making. Ahlin and Townsend (2007) regard joint decision-making
as a dimension of microfinance group cooperation: Their questions for joint
decision-making counts “the number of the following three decisions on which
some or all group members, as opposed to the individual farmer, have the final
say: which crops to grow, pesticide and fertilizer usage, and production
techniques” (Ahlin & Townsend, 2007, p. F48). Microfinance literature indicates
that joint decision-making may contribute to effective groups (Remenyi, 1991).
To measure joint decision-making, I developed the following item: “How likely is
it that all of the members of your group will have the final say when your group
needs to make a decision?”
133
Attendance and punctuality. For a group to operate effectively, discipline in
regularly attending group meetings and punctuality should contribute to group
effectiveness. This should be true in the context of Mexican culture where
punctuality can be regarded as a special ability. To measure attendance and
punctuality, seeing as this construct was not found in other microfinance surveys,
I developed the following item: “How likely is it that all your group members will
be punctual in attending your group meetings?”
All of the questions about group participation utilise the same seven-point
Likert scale as the questions about peer-group pressure. Questions about group
participation, peer-group pressure and community pressure were not present in the
surveys answered by clients with individual contracts.
Repayment rates. I have included a question about repayment rates that is
directed at microfinance staff. Repayment rates may reflect peer-group and
community pressure and lead to the formation of more economic capital.
Repayment rates may also be correlated with higher levels of group participation.
This question is based on one of two questions included in Wydick’s (1996, p.18)
survey: “A. Since its beginning, how consistent has this group been with repaying
its loans according to credit records?” Gomez and Santor (2003) and Giné and
Karlan (2006) are other authors that have measured repayment rates.
The one question about repayment rates utilises the same seven-point
Likert scale that is utilised for the items measuring the dependent variable.
134
Control Variables
The different control variables are age; education; marital status; children;
business type; business ownership; duration in the program; loan size and
duration; screening; and monitoring.
Age. There is one question using a ratio measure about age. Age is a common
control variable. For example, older people may have more business experience
and there may be more middle-aged males than females in the sample. Kevane
and Wydick (2001) found that young male microfinance clients (between the ages
of 20 and 30) generated more employment than young females, but that women
from 34 years of age to 64 generated more employment than mature males.
Education. There are three questions about education. Clients with more
education should be able to create more economic capital as they already have a
head start in human capital. The first question is a ratio measure of years of formal
education and the other two are nominal measures that ask whether clients can
read and write. I include these two questions because those who are literate might
have no formal education but they have an advantage over other clients who not
only have no formal education but are also illiterate.
Marital status. There is one question using an ordinal measure of marital status. It
was based on a similar question found in the survey titled “Evaluación del
135
Impacto Social y Económico del PRONAFIM” (p. 3) found in the study by the
Centro de Investigación y Docencia Económicas (CIDE) (2006). Women with
husbands or partners living with them may receive more financial support for their
business.
Children. There are two questions about children using ratio measures. Kevane
and Wydick (2001, p. 1225) suggested that younger women generated less
employment because they had to take care of younger children: “Increases in
value of home time during childbearing years for women may substantially
account for gender differences in response to credit access.” The first question
asks about the number of children a client may have because women with more
children should have less time for their micro-business. The second question asks
about the age of children as younger children will also require more attention
from female clients. Having a larger number of children may also divert more
income away from micro-business investment.
Business type. Regional differences in business types could affect capital creation.
For example, a typical business in one area may be more profitable than a typical
one in another and they may differ considerably in kinds of services or products.
Business types may also differ according to gender, giving one gender an
advantage. Wydick’s (1996, p. 16) survey asks about the type of business a client
has. Sadoulet’s (1999, p. 126) survey asks various questions about business
characteristics and also whether the micro-entrepreneur has more than one
136
business. I adopt a question utilizing a nominal measure from the PRONAFIM
survey (CIDE, 2006, p. 9). I ask about “business(es)” in case the microfinance
client manages more than one business.
Business ownership. A client may manage a business but not own it. Ownership
may influence the performance of the micro-business as more than one owner
may invest in a business. On the other hand the client may be less motivated if she
owns a small percentage of the business. This question also checks if the client
actually owns the micro-business(es) referred to in the previous question. The
question uses an ordinal measure that includes part ownership.
Time in the program. I have one question using a ratio measure for the length of
time a client has been in the program. Some studies indicate that micro-businesses
grow quicker in the first years and that growth levels off later (e.g. Wydick, 2002,
referring to employment creation).
Loan size and duration. Wydick (1996, p. 16) and Sadoulet (1999, p. 126) ask a
question about loan size. Wydick (1996, p. 16) also asks about the duration of the
client’s loan. If loan sizes are different for different methodologies, this may
affect micro-business performance as clients with access to larger loans may have
more business options and opportunities. Also, loan size may be a proxy for the
socio-economic level of the client or the income of the client. The duration of a
loan is also important because a client may take out a loan, for example, of $500
137
and another of $1,000, but if the first loan covers a period of 6 months for
repayment, and the second a year, then they are really about the same quantity
each month when it comes to repayment depending on the interest rate. I have
included a question about loan size and another about loan duration, both of which
represent ratio measures.
Screening. The following two questions about screening and monitoring are
designed to take into account two alternative explanations for the success of group
loans. The screening explanation states that group loans are more successful
because the initial group members are able to reject those members who represent
a high risk. This proposition takes into account that initial members know
something about each other and about potential members before they decide to
form a group.
Sadoulet’s (1999, p. 100) study incorporates how well clients knew other
group members, although his actual survey is not included in his dissertation. In
Ahlin and Townsend’s (2007, p. F49) study, screening is proxied by two dummy
variables: “KNOW_TYPE equals one if the group leader answered that members
know the quality of each other’s work. SCREEN equals one if the group leader
answered that there are borrowers who would like to join their group but cannot”
(because they are screened out of the group). The questions for KNOW_TYPE
and for SCREEN are: “Do group members know the quality of each other’s
work?”; and “Do some want to join this group but cannot?” (Ahlin & Townsend,
2007, p. F31). Some of Ahlin and Townsend’s (2007) proxies and variables are
138
curious and appear to refer to other variables. For example, the first question
above that these authors use seems to be a question for the variable “monitoring”.
As the most crucial period for screening is the time surrounding the initial
formation of the group, I have based my ratio measure question on the following
one by Wydick (1996, p. 17): “9a. How long did most of the members of your
group know each other before establishing your group? ______ months/years
(circle).”
The one question about screening utilises the same seven-point Likert
scale used for the items for the dependent variable.
Monitoring. Monitoring between clients is shown to stimulate mutual insurance
(in urban groups of vendors) (Wydick, 1996, p. 9), which is an item I have
included for the variable of group participation. Sadoulet’s (1999, p. 100)
dissertation incorporates monitoring by asking whether clients can observe other
members activities. Ahlin and Townsend (2007, p. F48) measure the cost of
monitoring with two items: “IN_VILLAGE gives the percentage of the group
living in the same village. RELATEDNESS gives the percentage of group
members who have a close relative in the group.” However, both items could also
be proxies for social capital. Furthermore, the first question could be a proxy for
screening.
The question I used was based on one from Wydick’s (1996, p. 17) survey:
“11. If I asked you how much each member in your group sells each day, would
you be able to tell me? yes; no; uncertain.”
139
The one question about monitoring utilises the same seven-point Likert
scale used for the items for the dependent variable.
Cultural dimensions. As the theory I incorporate states that women in Mexico
have more feminine values and rural dwellers are more collectivistic, I have
included three questions for the cultural dimension of masculinity/femininity,
three questions for collectivism, and three for individualism. High femininity
represents low masculinity and vice versa. Although Hofstede (1980, 2001)
includes individualism and collectivism in one dimension, other authors (Li &
Aksoy, 2007; Triandis and Gelfand, 1998) point out, based on exploratory and
confirmatory factor analyses, that there are two distinct cultural dimensions.
The questions I adopted for the dimension of masculinity/femininity were
obtained from Hofstede (1980, 2001). The question on cooperation had the equal
highest loading (.69) on factor 2 (social/ego) of a factor analysis of a 14-goal, 40-
country matrix, while the question on earnings had the lowest loading (-.70)
(Hofstede, 2001, pp. 255). These questions measure femininity and masculinity
respectively (Hofstede, 2001, p. 281). A factor analysis of a 22-goal, 19-country
matrix, revealed that the earnings question (.68) had the second highest loading on
factor 1 (ego/social), whereas friendly atmosphere (-.79) had the lowest loading
and cooperation (-.66) had the fourth lowest loading (Hofstede, 2001, p. 257). A
third factor analysis involved a matrix of 22-goals and 15 mainly European
countries (Hofstede, 1980, p. 242). The questions on cooperation (.86) and
friendly atmosphere (.84) had the second and third highest loadings respectively
140
on factor 2 (social/ego), while earnings (-.50, second loading) had the fifth lowest
loading. Two of the three items I incorporate for masculinity/femininity were
found in the “Values Survey Module” (Hofstede, 1980, p. 419) that are
“recommended for future cross-cultural survey studies”, while all the three items
are found in the “Hermes” Attitude Survey Questionnaire” (Hofstede, 1980, pp.
404, 409).
The questions I adopted for the dimensions of collectivism and
individualism were adopted from Triandis and Gelfand (1998). I have
incorporated three items for collectivism and three items for individualism. Based
on their confirmatory factor analyses, Li and Aksoy (2007) find that collectivism
and individualism are different constructs with multiple dimensions. The
collectivism items I adopt concerning family integrity (about parents and children
sticking together; and taking care of the family), had factor loadings of 0.61 and
0.60 with Triandis and Gelfand’s exploratory factor analysis, loadings of 0.77 and
0.87 in Li and Aksoy’s first confirmatory factor analysis, and 0.78 and 0.69 in a
second confirmatory factor analysis with a new sample (Li & Aksoy, 2007, pp.
317, 320, 322). The collectivism item I adopted for interdependence with
sociability (about cooperation) had factor loadings of 0.49, 0.63 and 0.54
respectively. The two individualism items for competition (about winning; and
competition as the law of nature) had factor loadings of 0.56 and 0.53; 0.64 and
0.58; 0.72 and 0.57 respectively. Finally the individualism item for self-reliance
(about depending on oneself) had loadings of 0.68, 0.76 and 0.76 respectively.
141
I chose all of the items I adopted for cultural dimensions based on the
above factor analyses and their appropriateness for the microfinance client context
in central Mexico. The three items from Hofstede (1980) were modified slightly.
In my survey, the nine questions utilise the same seven-point Likert scale used for
the items for the dependent variable.
4.3 Pilot Studies
The purpose of this section is to present the two pilot studies that were
used to test the survey items, especially the items used for the dependent
variables, the mediating variables and to test the femininity/masculinity and
collectivism/individualism cultural dimensions used in the theory. These pilot
tests helped in eliminating items that were found to be lacking in validity or
reliability. A qualitative pilot study consisting of four in-depth interviews had
been carried out in August and September, 2007, but will not be described here
(see Griffin, 2008). This qualitative study (Miles & Huberman, 1994) and a
literature review helped to determine the constructs and the overall model to be
tested. Then, between the 5th and the 10th of October, 2009, 21 surveys were
gathered from ADMIC clients in Villa de Garcia, Nuevo Leon, just outside the
city of Monterrey in a semi-arid zone of northern Mexico. 17 completed
questionnaires were obtained from clients with individual loans and the remaining
4 had group loans. Due to a lack of answers for the group items, which measured
142
group pressure, community pressure and group participation, a second pilot study
was carried out with Apros clients in Milpa Alta, a semi-rural area of México D.F.
(the Federal District), in central Mexico, on the 11th of February, 2010. Here 15
questionnaires were collected from clients that had group loans. The following
two sections describe the validity and reliability analysis that corresponded to the
two pilot studies of the survey. The factor analysis extraction method used was
principal components analysis including a varimax rotation method with Kaiser
normalisation. Cronbach’s coefficient alpha was used to test reliability (DeVellis,
2003).
First Pilot Study: ADMIC, Villa de Garcia
Capital. Items for economic capital loaded on two factors: sales and profits on one
factor with high loadings (.96 and .93 respectively) and high reliability (alpha =
.92); and physical capital, savings and labour with good loadings (.83, .75, and
.65), but with a Cronbach’s alpha of .62. DeVellis (2003, pp. 95-96) believes that
an alpha of “between .60 and .65 (is) “undesirable” and between .65 and .70,
minimally acceptable”. I decided to keep all economic capital items as they reveal
interesting data for a general impact study and for comparing and contrasting the
results from previous studies.
The three items for human capital loaded on one factor with loadings
above .70 and an acceptable alpha of .68. Removing the “reading, writing and
143
math” item raised the alpha slightly. Removing one of the other two items
lowered the alpha. In order to shorten the questionnaire I removed the “reading,
writing and math” item.
The social capital items loaded on two factors, both with very good
reliability (above .80) and all with loadings above .72. When the “work for the
community” and “demands on the government” items were removed, the other
items loaded on one factor in the rotated component matrix with a Cronbach’s
alpha of .83. In order to shorten the questionnaire I removed these two items as it
appears that they are less relevant to micro-businesses than the other forms of
social capital.
Culture. The items for cultural dimensions had validity and reliability problems.
For the femininity/masculinity items this could be because I did not exactly
duplicate Hofstede’s (1980) scale for these items. For the femininity/masculinity
construct there were three items, one of which measured masculinity (wages or
high earnings) and was reverse scored. They loaded on two factors that indicated a
division between femininity and masculinity. The two femininity items had
loadings above .53, but a low alpha (.50). I eliminated the “wages” item.
The six items for collectivism and individualism were adopted from
Triandis and Gelfand (1998). I had not been able to locate their exact survey, but
one paper (Singelis, Triandis, Bhawuk & Gelfand, 1995) provided a summary of
this scale. They used a 9-point scale beginning with “always” or “definitely yes”
(9) and ending with “never” or “definitely no” (1) (Singelis et al., 1995, p. 250).
144
The “family lives together” item had a very low loading (.20) and contributed to a
low alpha (.24) for the collectivism items. The other two items had high loadings
above .81. Removing the “family lives together” item raised the alpha to .48. I
decided to remove this item.
The Cronbach’s alpha for the three items for individualism was very low
(.10). The winning and independence items loaded above .72. The “competition”
item had a negative loading and removing this item raised the alpha to .47, so I
decided to remove it.
Second Pilot Study: Apros, Milpa Alta
Capital. The scale for economic capital items was changed from “I totally agree”
(“estoy totalmente de acuerdo”) – “I totally disagree” (“estoy totalmente en
desacuerdo”) to “yes, a lot more” (“sí, mucho más”) – “no, it has decreased a lot”
(“no, ha(n) disminuido mucho”), however, the reliability for these items dropped.
Sales and profits loaded on one factor with good loadings (.85 and .92
respectively) and a good alpha (.87). Physical capital and savings also had good
loadings (.86 and .81), but an unacceptable alpha (-.58). Labour had a negative
loading (-.56) with the sales and profits factor and a low loading (.10) on the other
factor. Because reliability had dropped with this scale, I decided to use the
original scale for the main survey.
145
The two remaining human capital items loaded on one component with
loadings of .75, however, with a low alpha of only .20. Culture items had been put
in front of the human capital items for this pilot study and this may have confused
respondents. Therefore, I decided to return the capital items to their original scale
and put them in their original order (economic capital, human capital, social
capital) in order to increase reliability.
The scale for social capital items was changed in the same way as
described above for economic capital items in this pilot study, however, the
reliability for these items had also dropped to .47 and one item (“new close
friends”) loaded on another factor. Therefore, I decided to use the original scale
for the main survey.
Culture. I used Hofstede’s (1980) exact scale and written introduction for the
femininity items. Both items had a high loading (.89 each) and a respectable
Cronbach’s alpha (.70).
In an attempt to increase the reliability of the two items for collectivism, a
statement just before these questions reminded respondents to be honest in
answering the questionnaire and this statement reminded respondents that the
questionnaire was confidential. I also mixed the collectivism and the
individualism items. The two collectivism items had a high loading (.83 each), but
a low Cronbach’s alpha (.28).
146
I attempted to increase the reliability of the two items for individualism in
the same way that I did for the two remaining collectivism items. Both items had a
good loading (.77 each), but a low Cronbach alpha (.21).
Peer-group pressure. Two items (“group expulsion” and “group sanctions”) had
high loadings (.96 and .89 respectively) on a first factor (sanctions). Two other
items (“peer-group pressure” and “group relations”) had good loadings (.74 and
.81) on a second factor (relationships). The first factor had a good Cronbach’s
alpha (.86), whereas the alpha for the second factor was a bit low (.57). The first
item (“dishonest use of loan”) had a negative loading on both factors (-.30 and -
.60 respectively). I decided to remove this first item.
Community Pressure. All the five items for community pressure loaded on one
factor with reasonably high loadings above .74 and a high Cronbach’s alpha (.89).
In order to shorten the questionnaire, I removed the first item (“dishonest use of
loan”)25 and the fourth item (“future access to community loans”). Removing
these two items reduced the Cronbach’s alpha the least to .87.
Group participation. The group participation items loaded on two factors.
“Solidarity” (.95), “decision-making” (.58) and “punctuality” (.80) loaded on the
first factor. “Learning” (.96) and “decision-making” (.68) loaded on the second.
Thus, the “decision-making” item loaded on both factors. The “help” item was the
25 This item here is related to community pressure not peer-group pressure like the other “dishonest use of loan” item above. Both these items, however, were eliminated from the final questionnaire.
147
only item that didn’t have an adequate loading on at least one factor, although it
came close to an acceptable loading on both factors (.48 and .43 respectively).
Both factors had reasonable reliability (.80 and .73 respectively). Because these
items could potentially reveal interesting data about group processes, I decided to
retain all of these items.
Conclusions
Various items were removed during the two pilot studies because they
lacked reliability or validity or in order to shorten the questionnaire. To make the
questionnaire shorter I removed one item for human capital and two for social
capital. I also experimented with the scale for the economic capital items and
social capital items, but decided to return these items to their original scale and
original order. I then extended the original scale to nine options by including “I
very much agree” (“estoy muy de acuerdo”) and “I very much disagree” (“estoy
muy en desacuerdo”) as there appeared to be a wide gap between “I totally agree”
and “I somewhat agree” and their negative equivalents.
In regard to items for cultural dimensions, I removed those items that did
not load with the others. Adopting Hofstede’s (1980) exact scale and his written
introduction to the femininity items worked well. As the Cronbach’s alpha was
low for the collectivism and individualism items adopted from Triandis and
Gelfand (1998), I decided to change the scale to resemble their original scale as
closely as possible (e.g. always; frequently etc.).
148
In general the items for peer-group pressure, community pressure and
group participation functioned well in the pilot study. The peer-group pressure
items formed two factors (group sanctions and relationships). One item that did
not load positively was removed from the peer-group pressure items. All the
community pressure items loaded together with high loadings, however, I decided
to remove two items to shorten the questionnaire. Finally, I decided to retain all
the group participation items, even though one did not load adequately on any
factor, as I believed these items would provide interesting insights into group
processes.
4.4 Data Collection
Population
The population is composed of men and women who are engaged in
micro-enterprises and have access to credit in micro-credit programs. Because
MFIs operate in different environments and have differences in their loan
methodologies, two MFIs were needed to answer the five hypotheses of Chapter
3. Firstly, CAME (Crédito y Ahorro a tu Medida) has large groups of between 10
and 48 clients consisting of mainly mixed groups in which females generally
outnumbered males; insists on obligatory savings (the village bank method);
operates in rural environments and also in the largest cities; and provides
149
individual loans in Mexico City only. CAME is the second largest MFI group
lender in Mexico with more than 250,000 group clients (CAME, n.d.)26. Secondly,
APROS (Ambito Productivo)27 has small groups of between 5 and 12 clients
(solidarity groups) consisting of all-female groups and mixed groups of different
gender proportions; operates mainly in environments that range from small towns
to small cities; but provides very few individual loans (Apros, n.d.; Conde Bonfil,
2009).
As mentioned in the previous section (“4.3 Pilot Studies”), three pilot
studies were conducted. Firstly, I performed a qualitative pilot study in August
and September 2007 consisting of interviews with the Chief Operations Officer
and the ex-manager of two private MFIs, the sub-Director of a government
program, and a student researcher (Griffin, 2008; Miles & Huberman, 1994)28.
The interviews were conducted in Zacatecas, Mexico City and Monterrey.
Secondly, I tested my survey from the 5th to the 10th of October, 2009, with 21
ADMIC (Asesoría a Microempresas) clients, most of whom had individual loans
in Villa de Garcia, Nuevo Leon, in northern Mexico (ADMIC, n.d.). Thirdly, a
second testing of my survey took place on the 11th of February, 2010, with 15
Apros group clients in the vicinity of the semi-rural town of Milpa Alta, which is
also the capital of one of the municipalities of México D.F. (Federal District).
Mexico City is located in México D.F. and the state of México.
26 On June 30, 2011, CAME had 259,334 clients (“socios”) divided into 16,969 groups in 138 branches (CAME, n.d.). At the time of the survey in 2010, CAME had roughly 1,000 individual loans. 27 For a description of Apros in Spanish see Conde Bonfil (2009, pp. 73-79). 28This pilot study has been included in conference proceedings and will not be presented here.
150
A sample of around 200 is often recommended for publishing with
structural equation modeling, so more than 200 questionnaires were collected in
both Apros and CAME (Iacobucci, 2010; Nachtigall, Kroehne, Funke, & Steyer,
2003). An attempt was made to divide clients evenly up by gender composition of
groups (for group loans) or gender (for individual loans), environment and loan
methodology. Table 4.1 represents my original survey sample intentions.
However, all-male groups seem to be very rare in Mexico and it was not possible
to find a Mexican MFI with sufficient all-male groups that was willing to
participate in the survey.
Table 4.1
Stratified Sample
Strata No. of clients (minimum) Large city, males, individual loans 20 Large city, females, individual loans 20 Large city, all-male groups 20 Large city, all-female groups 20 Large city, mixed groups 20 Rural area, males, individual loans 20 Rural area, females, individual loans 20 Rural area, all-male groups 20 Rural area, all-female groups 20 Rural area, mixed groups 20
Total (minimum) 200
The samples for groups were also intended to be divided into around 50
percent cities (urban areas) and 50 percent towns (rural areas). Some microfinance
papers indicate that rural clients live in more closely-knit communities where
151
people tend to have more information about their neighbours in contrast to urban
dwellers, although the cultural dimension of collectivism is not mentioned in these
papers (Abbink et al., 2006, p. 616; Armendáriz de Aghion & Morduch, 2005, pp.
93-94, 109). Other authors state that rural areas tend to be more collectivistic than
urban areas (Erez & Somech, 1996; Hofstede, 1997, pp. 65, 74). The above
literature suggests that clients living in densely populated urban centres, such as
Mexico City, will tend to be more individualistic and/or have less knowledge
about the activities of people in the local community than clients living in rural
areas.
This study includes two MFIs both of which operate with two loan
methodologies. An attempt was made to collect the above sample in Table 4.1 in
only one MFI, but this was not possible. Even with two MFIs there were still
some gaps in the above sample requirements in Table 4.1. There were only a few
all-male groups in Apros29 and none in CAME. CAME had few groups in which
there were more males than females, so groups in Apros with 40 percent or more
males were especially targeted in order to collect about 50 of these groups. CAME
also had very few all-female groups. Furthermore, Apros did not have enough
individual loans and CAME only had urban ones, so only a few males and
females with rural individual loans were collected from Apros. Therefore, it was
not possible to answer a potential sixth hypothesis about differences between
urban individual loans and rural individual loans, although there were three
29 Only one questionnaire was collected from a client in an all-male group who had been with Apros for at least one year.
152
samples with a minimum of 109 cases each to answer the five hypotheses in
Chapter 3.
Firstly, a CAME sample of group loans consisting of mixed groups that
generally had more women was collected in Valle de Chalco (55 groups), an outer
suburb of Mexico City, and in Ozumba (55 groups), a large agricultural town
some 30 kilometres from the outskirts of Mexico City between the 15th and the
25th of June, 2010 (see Table 4.2). Both locations are in the state of México. The
110 group clients all belonged to 110 different groups, the group being the unit of
analysis for both MFIs. CAME individual loan questionnaires, divided up into 54
questionnaires collected from male clients and 55 from females, were collected in
Ciudad Nezahualcóyotl in Mexico City in the state of México from the 14th of
June to the 14th of July, 2010. Of the 220 questionnaires collected in CAME30, all
clients had been receiving loans for at least one year from CAME. The time
clients had received loans from the MFI was important to the survey as questions
asked about the last year of capital creation.
Table 4.2
CAME Sample
Strata No. of clients (cases) Large city, males, individual loans 54 Large city, females, individual loans 55 Large city, all-female groups 3 Large city, mixed groups 52 Rural area, all-female groups 2 Rural area, mixed groups 53
Total 219
30 One male individual loans questionaire was eliminated from the CAME sample.
153
The Apros sample was collected in two phases between the 24th of May
and the 11th of June, 2010; and the 15th of July and the 26th of August, 2010, in
all of the eight Apros centres in the states of Hidalgo, Veracruz and the Federal
District. As there were too few individual loans, more than 200 questionnaires
were collected from group clients. A sample of all-female groups, mixed groups
with more than 60 percent women and mixed groups of 60 percent or fewer
women was collected. There were originally 186 group questionnaires pertaining
to clients who had been with Apros for at least a year but 4 of these were
eliminated as they were missing too much data (see Table 4.3). In addition
another 57 questionnaires were collected by Apros staff from group clients who
had been with Apros for less than one year and there were 37 individual loan
questionnaires filled out, but many of these clients were new. The sample I used
in Apros to answer hypotheses 2 to 5 was that of group loans in which the clients
had been associating with Apros for at least one year (Table 4.3). Very few groups
were located in large cities in the Apros sample as most clients in the Federal
District were located in the vicinity of Milpa Alta, a large agricultural town only
about 10 kilometres from the outskirts of Mexico City.
154
Table 4.3
Apros Sample of Group Loan Clients with at least One Year with the MFI
Strata No. of clients (minimum) Urban, groups of 0% to 60% females 25 Urban, groups of 63% to 92% females 30 Urban, all-female groups 40 Rural, groups of 0% to 60% females 22 Rural, groups of 63% to 92% females 16 Rural, all-female groups 49
Total 182
Sampling Design
The 109 individual loans in CAME were all located in Mexico City. A list
of 372 individual loan clients was provided by CAME that had names, addresses
and telephone numbers. This list included new clients that could have obtained
their first loan from CAME within the past year and it also included defaulters.
No information about clients was included that could have served to sort clients
with at least one year with CAME from new clients; and punctual clients from
defaulters. My objective was to collect 55 male clients and 55 female clients, both
with at least one year of association with CAME.
The group loan centres in CAME that I was interested in each had over
200 groups. Seeing as most groups had far more females than males and,
therefore, groups differed very little according to gender, my objective was to
collect an equal number of survey questionnaires from a rural centre (55
questionnaires) and an equal number from an urban centre (55). In each group
155
sample, centre managers were asked to provide information about the percentage
of groups that were not punctual with payments or had defaulted over the last
year, and the same percentage of irregular groups or actual defaulters was
included among the questionnaires collected.
As I obtained a list from Apros of all their groups that had at least one year
of association with Apros, it was possible to utilise a stratified sample design and
select participants from each strata (as in Table 4.1 with some exceptions)
(Babbie, 2004; Fowler, 2002). This list included various details about all the
group members’ gender, their address, their Apros centre and the group’s name.
As there was a lack of groups with more males than females, the group category
with less than 61 percent females had to be carefully chosen. An effort was made
to divide the sample up between the three group categories mentioned above
while also dividing the sample up between urban areas and rural areas. Large
cities were specially selected as there was a lack of group loans in large cities. To
verify the population of a town or city, the 2005 INEGI (National Institute of
Statistics and Geography) census statistics were referred to (INEGI, 2005)31. A list
of defaulting groups was also obtained from Apros and a proportion of defaulting
groups was included in the sample.
31 The 2010 census was being carried out by INEGI when my survey had been collected and data was still not available for 2010, so 2005 data was used to verify the environment in which the clients lived e.g. small town, large town, small city etc.
156
Possible Sampling Problems
This sample doesn’t claim to be representative of Mexican culture. The
Apros sample is only representative of Apros clients, whereas the CAME sample
is representative of CAME individual loan clients in the Ciudad Nezahualcóyotl
centre and CAME group loan clients in the centres of Ozumba and Tezozomoc
(Valle de Chalco). Ciudad Nezahualcóyotl and Valle de Chalco are recognised as
being poor suburbs of Mexico City, although Ciudad Nezahualcóyotl, being closer
to the inner city, has evolved economically over the last two decades from one of
the more infamous areas of Mexico City. Valle de Chalco is a more recently
populated urban area on the outskirts of Mexico City. Many clients in the rural
town of Ozumba grow and sell agricultural products. Ozumba’s close proximity to
Mexico City, by far the largest city in Mexico and one of the largest in the world,
must have influenced to some extent the local economy and culture. Many
residents in Ozumba and the surrounding area had lived and worked in Mexico
City, the capital of modern, colonial and Aztec-dominated Mexico.
The Apros centre of Milpa Alta is similar to the CAME centre of Ozumba,
both being agricultural towns close to Mexico City in the fertile densely populated
volcanic belt. Milpa Alta specialises in the harvesting of edible cactus (nopal). A
few questionnaires were collected from an Apros centre in Mexico City, but most
were collected in the states of Hidalgo and Vera Cruz to the north-east and east of
Mexico City. One Apros centre in Hidalgo was located in the mountainous
Huasteca region in the Sierra Madre Oriental; another four centres were located
157
between the lower slopes of the Sierra Madre Oriental and the coast; and one
centre had clients in coastal towns and cities of the Gulf of Mexico.
The CAME and Apros samples were composed of micro- and small
business entrepreneurs that lived below or above the poverty line. CAME clients
belonged to the congested, polluted environment of Mexico’s traditional capital or
lived in a densely populated rural area close by. The Apros sample was mainly
composed of rural or small city dwellers to the east or north-east of Mexico City.
The people of Mexico City tend to vote for left of centre political parties in
comparison to northern Mexicans who tend to support the free-enterprise
Catholic-oriented PAN (National Action Party). The culture of northern Mexico
differs in that it is generally more prosperous economically and has more of an
American and European influence. The elites of northern cities generally relate
their family heritage to the Spanish whereas central Mexican dwellers are
generally more egalitarian and nationalistic. The indigenous influence has been
strong in central Mexico, but this has merged into a modern mestizo culture that is
highlighted by a busy economic and social lifestyle in Mexico City. In southern
states the indigenous culture, which emphasises a more relaxed lifestyle based on
community, cordial relationships, and alliances, is still an important contemporary
influence. However, each state in Mexico has a tendency to differ somewhat in
gastronomy, traditional dance, traditional attire, other cultural traits, and economic
characteristics.
Therefore, the main differences between the clients in my sample and
those in other parts of Mexico would be cultural. Per capita income also tends to
158
decrease from the north to the south of Mexico. Furthermore, there may also be
regional differences in business types. For instance, in the Huasteca region some
Apros clients sold exclusively enormous two-meter long tamales32, known as
zacahuil, particular only to that area.
Other factors were controlled for between the different strata that were
sampled, such as the age and the education level of clients. Other sampling
problems that have already been mentioned were a lack of all-male groups; and a
lack of rural individual loans for both sexes. A comparison of rural individual
loans with a large enough sample of urban individual loans was also not possible.
Method, Administering the Survey, Data Entry and Codification
Administering the survey differed according to the characteristics of the
MFI. For the CAME survey, two people collected the entire sample in three
centres. A paid assistant with previous experience collected all the individual
loans in Ciudad Nezahualcóyotl, while I collected all group loans in Tezozomoc
and Ozumba. In the Ciudad Nezahualcóyotl centre, clients with individual loan
rarely go to the centre except when they are applying for a new loan. Therefore,
the only way to collect this part of the sample was to ring the clients, find out how
long they had been clients, ask permission to apply the questionnaire, and visit
their businesses or homes. Clients with individual loans in the CAME sample
generally preferred to fill out the questionnaire themselves.
32 Tamales are pre-hispanic dishes or snacks, a kind of traditional Mexican fast food, composed of a base of starchy corn dough with a variety of fillings steamed in a leaf wrapper of corn or banana.
159
In the Tezozomoc centre in Valle de Chalco, groups had weekly meetings
in the centre. Therefore, the survey collector would enter the meeting and ask a
group member to answer the survey. Clients generally preferred to have the
survey read in this situation.
Finally, the groups in the Ozumba centre did not have meetings in the
centre, but in their homes. The most efficient way to collect the survey here was
to wait next to the cashier at the centre and ask clients to cooperate with the
survey when they were waiting in line to make their weekly payments. Usually a
security guard, who the clients knew, asked the clients to cooperate with the
survey. Clients in this situation also preferred to have the survey read to them. It
should also be taken into account that there were illiterate clients who needed to
have the survey read or older clients who expected to be helped with the survey.
Regarding the Apros survey, it was not practical to collect the survey
questionnaires in the centres because the Apros representatives were repaid part of
the loans during the group meetings in the clients’ homes. Due to the smaller
population of groups in the eight Apros centres; the large distances between the
centres; and the difficulty involved in locating clients, it was decided that Apros
staff would collect the questionnaires. Each centre had particular staff members
who were responsible for certain groups. In general, about two thirds of the
questionnaires were read to the clients and another third were self-administered.33
My questionnaire was short enough and sufficiently user friendly so that
literate clients had no problem filling it out themselves with a minimum amount 33 Testing the dependent variables of the Apros survey with t-‐tests and regression revealed no significant differences in the way that the survey was administered.
160
of error. The time taken to fill out a questionnaire and the level of difficulty that
clients experienced had been tested during the pilot studies.
After the interviews I entered data directly into data files so that it was
ready for immediate analysis. There are two codes for gender and loan
methodology and up to six for environment. There is also a ratio question asking
about the gender of group members that divides group loans up according to the
gender of members. Mediating and dependent variables were coded with Likert
scales that varied between scales with five categories to scales with nine
categories.
4.5 Testing
Data Analysis
My first hypothesis will be corroborated if my results register a
significantly greater average increase in the capital of males with individual loans
compared to the capital of females with individual loans. The fourth and fifth
hypotheses measure capital creation with group loans comparing different group
categories. The second hypothesis measures differences in group participation and
the third measures differences in peer-group and community pressure. All of these
differences in averages and variances were tested with t-tests and ANOVAs.
Factors for capital were also tested for latent mean differences by means of
161
structural equation modeling (Schumacker & Lomax, 2004). It was necessary to
check to see whether control variables, such as education or age, affected the
dependent variable or other factors. Pearson’s product-moment correlation (r) is
one way to measure association between variables (Babbie, 2004). The influence
of control variables was also tested with structural equation modeling. Reliability
was assessed with Cronbach’s alpha; and validity with factor analysis and
variance) Extraction method: Adjusted principal components analysis (EPIC). Rotation method: direct oblimin solution. Rotation converged in 7 iterations.
Table 5.5
Confirmatory Factor Analysis of Capital Items, CAME Individual Loans35
Measurement Models S-B χ 2 df Probab-ility
CFI RMSEA SRMR
Model 1: According to factor analysis above without labour item.
40.00 31 .13 .96 .052 .057
Model 2: same as Model 1 but physical capital included only in human capital factor and the calls item deleted.
29.81
24
.19
.97
.047
.062
Model 3: Final model: same as Model 2, but without physical capital, skills and knowledge items.
7.66
8
.47
1.00
.000
.048
Robust statistics were used except for SRMR (normal maximum likelihood (ML)). S-B χ2 = Satorra-Bentler scaled chi-square.
35 See section 4.5 for a brief discussion of structural equation modeling (SEM) fit indices with their acronyms.
182
Table 5.6A
Construct Validity, CAME Individual Loans
Factors Standardised loadings below .5
Average variance extracted (AVE)
Construct reliability
Cronbach’s alpha
Financial capital no 69.32 0.87 .84 Social capital no 55.30 0.78 .77
Table 5.6B
Construct Validity. CAME Individual Loans
Inter-construct correlation
Squared inter-construct
correlation
Standardised residuals
Normed χ 2 Cross loadings
.277 .08 all below 2.5 1.52 (very good) no
5.4 Independent Samples T-tests
Independent samples t-tests were employed to check for differences
between males and females (Table 5.7) taking into account that the social capital
items had been removed from the measurement model according to the reason
given in the above section. There were no significant differences between males
and females in financial capital creation. As males had significantly more loans in
other organisations than females, t-tests were performed to check whether access
to other loans significantly improved financial capital creation, but there were no
183
significant results. In fact those clients who did not have other loans reported
better performance (a higher average score) for profits.
Table 5.7
Independent Samples T-Tests, CAME Individual Loans
Variable Females Males t Repayments 5.66 5.69 .09 Sales 5.09 5.28 .72 Profits 4.73 5.07 1.21 Savings 4.56 5.06 1.53 n = 55 female clients and 54 male clients * p < .05 ** p < .01 *** p < .001 All two-tailed tests.
5.5 One-way Analysis of Variance
A one-way analysis of variance was also performed (Table 5.8). The
Levene statistic, however, did not reject the null hypothesis that gender variances
are equal, although the Levene statistic was close to significant for profits and
savings. The statistic that tests the homogeneity of variances revealed that gender
variances were significantly different for profits (p = .04) and savings (p = .00).
Table 5.8 reveals that standard deviations differ greatly between the sexes in
regards to financial capital creation.
184
Table 5.8
Means, Standard Deviations and Analyses of Variance, CAME Individual
Loans
Variable Females Mean
Females s.d.
Males Mean
Males s.d.
F
Repayments 5.66 1.82 5.69 1.70 0.01
Sales 5.09 1.60 5.28 1.07 0.51
Profits 4.73 1.74 5.07 1.21 1.46
Savings 4.56 2.08 5.06 1.25 2.31
n = 55 female clients and 54 male clients * p < .05 ** p < .01 *** p < .001
5.6 Causal Models
In this section a causal model for individual loans with goodness-of-fit was
found. The following two chapters include causal models for group loans to
demonstrate that the independent factors have construct validity and goodness-of-
fit. Although the independent variable for this sample (repayments) is not directly
related to Hypothesis 1, I considered that it would be useful to include an
individual loans model in order to be able to compare this model with the group
loans models and to demonstrate that individual loans do have a structural
equation model. Also, in order to determine an appropriate sample size with the
critical N (Hoelter index), a formula that incorporates statistics for the whole
185
model is utilised (Hox, 1995; Schumacker & Lomax, 2004). The critical N cannot
be calculated for one factor taking into account that there is only one dependent
factor.
Therefore, the measurement model that had construct validity was then
tested as a causal structure adding repayment rates as the independent variable
(Model 1 in Table 5.9). Two models were compared. Firstly, there was an initial
model with repayment rates as the independent factor and financial capital and
social capital as the dependent factors. The dependent factors were financial
capital (sales, profits and savings) and social capital (friends, trust and meetings).
None of the two paths between the independent variable and the two dependent
variables had a significant z statistic. When the different control variables were
placed in the model, none had a significant relationship with the dependent
variables nor did they affect the path from the original dependent variable
(repayments) to the two dependent variables. The robust statistics for this model
were good, although the normal SRMR was high.
Secondly, in order to have agreement with the measurement model of the
two other other samples that follow in the next two chapters, the above model was
transformed by eliminating the social capital factor (Model 2 in Table 5.9 and
Figure 5.1). A final comparison with the alternative model yielded ∆S-B χ2 =
13.96 (∆df = 11; p > 0.2) (Byrne, 2006)36. Therefore, the two models were not
significantly different in fit.
36 See Byrne (2006, pp. 218-219) for the formula for comparing model fit.
186
Table 5.9
Causal Structure, CAME Individual Loans
Measurement Models S-B χ 2 df probability CFI RMSEA SRMR Model 1: Alternative Model: Repayments as the independent variable; financial capital and social capital as the dependent variables.
16.88
13
.21
.976
.053
.123
Model 2: Final Model: Repayments as the independent variable and financial capital as the dependent variable.
3.31
2
.19
.984
.078
.028
Robust statistics were used except for SRMR (normal maximum likelihood (ML)). S-B χ2 = Satorra-Bentler scaled chi-square.
Figure 5.1. Final structural equation model, CAME individual loans
In order to determine an appropriate sample size the critical N was
calculated. The critical N with normal maximum likelihood statistics was 299 and
with robust statistics it was 187, just below the recommended cut off value.
Values of 200 or more are recommended for an acceptable fit (Hox, 1995)
Repayment Rates
Financial Capital
robust z = .45; p = .65
187
5.7 Latent Mean Differences
In this section I look at latent mean differences to test whether males and
females have significant differences in regards to financial capital creation. The
test of latent mean differences differs from t-tests and ANOVAs because it
compares a complete construct composed of different items, whereas the latter
tests compare individual items.
Testing for latent mean differences of a measurement model involves five
steps (Byrne, 2006). The first three steps are the same as the first three steps in the
test of factorial invariance. However, with the CAME individual loans sample it
was not possible to perform the first two steps as there was only one dependent
factor (financial capital) and to test a measurement instrument with confirmatory
factor analysis it is necessary to have at least two factors. Therefore, testing for
latent differences began with the third step, which compares factor loadings
between the two groups (females and males) (see Table 5.10). There was a
covariance between sales and savings for the male category. The univariate
increment for the profit constraint was not tested due to numerical problems so it
was assumed to be significant for the next step. The savings constraint was not
significant.
The fourth step involved the testing for invariance of intercepts. All
previous equality constraints were retained except those found to be noninvariant
(profits). The variance for the constant V999 was fixed to 1.0. No significant
constraints were found.
188
The fifth step involved testing for invariance of latent factor means. The
previous covariance for the male group was observed. The averages for the two
groups were not significantly different (robust z statistic for financial capital = -
1.30; p = .19). The negative z statistic denoted that female individual loans create
less financial capital on average.
Table 5.10
Latent Mean Differences of the Measurement Model, CAME Individual Loans
Samples, Models and Tests S-B χ 2 probability
CFI RMSEA
Testing for measurement invariance of factor loadings: covariance between sales and savings for male sample only; 109 cases.
.44 1.000 .000
Testing for invariance of intercepts: covariance between sales and savings for male sample only; 109 cases.
.63 .989ª .000º
Testing for invariance of latent factor means: covariance between sales and savings for male sample only; 109 cases.
.69 .999 .034
Robust statistics were used (normal maximum likelihood (ML)). S-B χ2 = Satorra-Bentler scaled chi-square. ª = CFI calculated with maximum likelihood (ML) estimation but not with robust statistics. º = robust fit indices based on covariance matrix and means.
5.8 Conclusions
In contrast to traditional theories male entrepreneurs did not appear to
enjoy significant advantages in comparison to female entrepreneurs except that
they had access to more loans, had larger loans and tended to be more diversified
in the type of business they operated. However, having another individual loan
189
had low correlations with sales (r = .03, n.s.), profits (r = -.01, n.s.) and savings (r
= .08, n.s.) (see Appendix D) and no significant difference was found in the
creation of sales (t = .31, df = 107, n.s.), profits (t = -.11, df = 107, n.s.) and
savings (t = .72, df = 30, n.s.) by clients who had more than one loan when t-tests
were performed. The amount of the loan per month also had a negative correlation
with sales (r = -.11, n.s.) and profits (r = -.04, n.s.) and a non-significant
correlation for savings (r = .08, n.s.). T-tests furthermore revealed no significant
difference in the generation of sales (t = -.63, df = 79, n.s.), profits (t = .39, df =
79, n.s.) and savings (t = 1.88, df = 79, n.s.) between clients that had the largest
loans per month (between $1,667 and $15,000 Mexican pesos) and those that had
the smallest ($250 - $833). Loan amount would appear to be a proxy for income.
T-tests and ANOVAs found no significant differences between the
financial capital generation of male clients and female clients. A test of latent
mean differences indicated that females created less capital on average although
this was also not significant. Based on the present sample for individual loans it
cannot be said that male entrepreneurs create significantly more financial capital
than female entrepreneurs.
190
CHAPTER 6: RESULTS FOR CAME GROUP LOANS
6.1 Introduction
The object of this chapter is to test Hypotheses 2, 3, 4 and 5 with the
CAME sample for group loans. Hypothesis 2 examines whether groups with a
greater proportion of females have higher levels of group participation.
Hypothesis 3 deals with peer-group and community pressure, and suggests groups
with a greater proportion of females will experience more pressure. Hypothesis 4
states that groups with a greater proportion of females will be able to generate as
much capital as groups that have a smaller proportion of females. Finally,
Hypothesis 5 indicates that groups in towns/cities with smaller populations will
generate more capital.
The first section looks at descriptive statistics and includes additional
tables. The second section analyses the measurement model for this sample with
confirmatory factor analysis and determines construct validity. The third and
fourth sections provide the results of t-tests and ANOVAs. The fifth section
searches for a causal model with satisfactory goodness-of-fit, while the sixth
section looks at latent mean differences. The causal model is necessary in order to
demonstrate that the items and constructs tested for Hypotheses 2 and 3 have
goodness-of-fit in a model and in order to estimate the critical N to determine
appropriate sample size. A causal model is also useful to test the control variables.
191
The test of latent mean differences compares the same dependent factor between
different categories. Finally, taking into account the results of the statistical tests
in this chapter, I come to a conclusion concerning the above four hypotheses.
6.2 Descriptive Statistics
Sampling Procedure37
This part of the CAME sample was collected in two areas, both of which
are in the state of México. The CAME group loans questionnaire in Spanish can
be found in Appendix E and its translation into English in Appendix F. A sample
of 55 rural clients in different groups was collected in Ozumba, an agricultural
town with a population of 15,717 people about 30 kilometres from Mexico City
(INEGI, 2005)38. A second sample of 55 clients in different groups was collected
in Valle de Chalco (Valley of Chalco), a poor suburb that forms part of Mexico
City. Villa de Chalco (the Village of Chalco) separates Valle de Chalco from the
countryside. The total municipality of Chalco has a population of 257,403 people
whereas the rural municipality of Ozumba has 24,055.
The survey was collected in Ozumba by waiting for clients to arrive to
receive their first loans or pay off part of their group’s loan with the CAME
cashier. A security guard asked clients if they would be willing to answer the 37 A discussion of sampling procedure is also found in section 4.4. 38 INEGI population figures are from the 2005 census as the 2010 census was being undertaken when data was being recorded.
192
questionnaire. Almost all the questionnaires were read to the clients. The manager
of the Ozumba centre was asked about the proportion of defaulting clients and he
later gave me a list with all the defaulting clients or clients who were late in their
payments over the last year. Overall, there were very few defaulting clients but
initially five groups with irregular payments were visited, mostly during their
meetings in a member’s home, and a questionnaire was collected from one of the
members of each group. Also during the course of the collection of the survey, I
also managed to obtain questionnaires from other groups that were on the
irregular/defaulting client list.
Group meetings for the Tezozomoc centre in the Valle de Chalco were
held in the centre so the survey was collected during the group meetings on the
CAME premises. Almost all questionnaires were read to the clients. The manager
of this centre was also asked about the proportion of defaulting and irregular
clients and I was told that they represented a very small minority of groups. Three
irregular groups were targeted, but during the process of collecting the survey I
also came across other groups that were potential defaulters or were in the process
of defaulting. Later the manager sent me a list of the clients included in the survey
with a completed scale from 1 to 7 concerning the punctuality of payments for
each client and a nominal answer (yes/no) concerning whether or not each group
was behind in their payments.
In both CAME centres only clients with at least one year of association
with CAME were included in the survey. Clients were asked this question when
being asked for permission to be included in the survey.
193
Generally the clients were read the questionnaire, but four people decided
to fill out the questionnaire on their own. Of the clients who self-administered the
questionnaire, three were females and one was male (χ2 = .07, df = 1, n.s.); three
belonged to groups of more than 80 percent female composition, whereas one
belonged to a group of between 33 percent and 80 percent female composition (χ2
= 1.12, df = 1, n.s.); and three clients came from the rural sample (Ozumba) and
one came from the urban sample (Valle de Chalco) (χ2 = 1.04, df = 1, n.s.).
Missing Data
None of the questionnaires were eliminated so there were 55 cases for each
centre and each environment (urban and rural). The cases represented different
compositions of mixed groups with a minority of all-female groups. There were
only two all-female groups in Ozumba and three in Tezozomoc. Very little data
was missing. Most items had no missing data and only a few items had missing
data for one case. The items for “business skills” and “loan amount” had data
missing for two cases (1.82 percent of all cases). Missing data for loan amount
was replaced according to the average of the gender in each branch. The missing
data for the three capital items and one group forces item was replaced according
to the average for the client’s gender, group category and centre. For example, an
item with one case of missing data could be replaced according to the average for
urban (Tezozomoc) women in groups composed of between 81 to 100 percent
females.
194
Descriptive Statistics
Below are tables with means, standard deviations (Tables 6.1 and 6.2) and
correlations (Appendix G) for CAME group loans. Items that did not have
construct validity (tested later on in this chapter) are not included in these tables.
The repayments scale (see coding for Table 6.1) was designed from data provided
by CAME managers. The Ozumba centre provided a list of groups that were late
in their payments including the number of days behind. The Tezozomoc centre
provided a list of clients with a punctuality scale and a nominal answer (yes/no)
according to whether clients were behind in payments.
Table 6.1 gives us some information about the averages of the sample that
can be compared with the CAME individual loans sample in the previous chapter.
One would expect clients with group loans to have less income. Clients in this
group loans sample were a bit younger (about 41 and a half years old), the
majority were also married (55.5 percent) and they also had about three children
each. The average client with group loans had slightly less formal education
(almost 8 years). The average business was about 9 years old39, about 4 years
younger than the businesses of individual loans. Most clients with group loans
reported owning all of their business (88.2 percent), and they had been associating
with CAME slightly longer (nearly 5 years). The average loan per month (about
US$125) was only less than the average individual loan by about US$25. That is,
39 The age of the business was recorded as the age of the client’s oldest business if the client answered that he/she had more than one business.
195
the average individual loan was only about 20 percent more. Fewer group loan
clients (13.6 percent of the sample) reported that they had loans with other
institutions.
The descriptive statistics suggest that males in this sample did not enjoy
obvious advantages compared to females (Table 6.1). There were 22 males in the
sample and 88 females. Males had less education (t = -.75, df = 108, n.s.); fewer
loans with other organisations (χ2 = .48, df = 1, n.s.); less inter-cycle loans (an
additional short-term loan) in CAME (χ2 = 1.36, df = 1, n.s.); less businesses (t = -
1.16, df = 108, n.s.); reported owning less of their business (t = -1.33, df = 26,
n.s.); and had smaller loans per month (by about US$20) (t = -.57, df = 108, n.s.).
Males had also received less training or education over the last year related to
business, health or other forms (t = -.91, df = 108, n.s.). They did, however, have
significantly more business experience judging by the age of their oldest business
(t = 2.30, df = 108, p < .05).
196
Table 6.1
Descriptive Statistics, CAME Group Loans
Variables Mean s.d. Mean Females
n =88
Mean Males n = 22
1. Sex 1.80 .402 2. Females in group (%) 78.63 13.29 81.43 67.41 3. Females in group (categories)
1.49 .502 1.59 1.09
4. Environment 1.50 .502 1.51 1.45 5. Repayments 5.92 1.69 5.88 6.09 6. Sales 4.67 1.96 4.64 4.82 7. Profits 4.98 1.83 4.90 5.32 8. Savings 5.98 1.87 5.89 6.36 9. Group sanctions 4.62 1.63 4.50 5.09 10. Community sanctions 3.99 1.94 3.91 4.32 11. Community reputation 5.05 1.67 5.06 5.00 12. Group relations 5.82 1.27 5.90 5.50 13. Community relations 4.87 1.56 4.84 5.00 14. Solidarity 4.99 1.59 4.91 5.32 15. Age (years) 41.54 11.76 40.72 44.82 16. Education (years) 7.99 3.38 8.11 7.5 17. Marital Status 1.45 .50 1.45 1.41 18. Number of children 2.93 1.72 3.05 2.45 19. Age of youngest child (code)
2.12 1.01 2.02 2.50
20. Age of oldest business (years)
8.90 8.38 7.87 13.5
21. Number of businesses 1.37 .662 1.41 1.23 22. Business ownership 4.76 .676 4.82 4.55 23. Loan Type 1.28 .452 1.31 1.18 24. Loan amount per month (Mexican pesos)
$1,569.63 $1,821.00 $1,618.91 $1,372.48
25. Time in CAME (years) 4.85 3.93 5.23 3.36 26. Other loans 1.14 .345 1.15 1.09 27. Group size 23.22 9.03 23.45 22.27 28. Access to training 1.45 .737 1.48 1.32 29. Screening 6.43 2.69 6.71 5.32 30. Monitoring 1.30 1.15 1.38 1.00
n = 110. Coding for variables was as follows: sex: 1 = “male”, 2 = “female”; females in group: 1 = 33%-80%, 2= 81%-100%; environment: 1= rural; 2= urban; repayments: 1 = defaulter or very late with payment, 7 = very punctual with payment; variables 6 to 8 (sales, profits, savings): 1 = “I totally disagree”, 9 = “I totally agree”; variables 9 to 14 (group sanctions, community sanctions,
197
community reputation, group relations, community relations, solidarity): 1 = “not at all probable”, 7 =” totally probable”; marital status: 1 = married, 2 = not married; age of youngest child: 1= 0.25-8 years old, 2 = 9-16 years old, 3 = 17-48 years old, 4 = no children; business ownership: 1 = zero %, 2 = less than 50%, 3 = 50%, 4 = more than 50%, 5 = 100%; loan type: 1 = group loan, 2 = group loan and inter-cycle loan; other loans: 1 = “no”, 2 = “yes”; access to training: 1= no training; 2 = 1 form of training (business, health or other), 3 = 2 forms of training; 4 = all (3) forms of training; control variables 29 to 30 (screening and monitoring): 1 = “I totally disagree”, 9 = “I totally agree”.
Pearson correlations were all significant for gender (see Appendix G).
Females had younger children40 (r = -.19, p < .05); younger businesses (r = -.27, p
< .01); more time in CAME (r = .19, p < .05); and they also practiced more
screening (r = .21, p < .05). The age of children did not appear to exert any
influence on capital, whereas business age and time with CAME had a negative
correlation with financial capital items. There was a significant correlation
between the time of association with CAME and sales (r = -.22, p < .05); and
savings (r = -.27, p < .01). Screening had a positive correlation with savings (r =
.24, p < .05). Therefore, younger businesses and greater screening may have aided
female entrepreneurs, whereas less time in CAME may have aided males.
Table 6.2 presents the descriptive statistics for group composition and
environment. Groups with a higher proportion of females had larger loans (t = -
1.19, df = 97, n.s.); more businesses (t = -.54, df = 108, n.s.); more inter-cycle
loans (χ2 = 2.57, df = 1, n.s.); had associated with CAME for longer (t = -1.00, df
= 108, n.s.); had received more training over the last year (t = -.76, df = 108, n.s.);
knew their members better when the group was formed (t = -.77, df = 108, n.s.);
and also monitored their members more (t = -1.80, df = 84, n.s.). Groups with a 40 The average age of the youngest child for females who had children was 12.62 years, whereas the youngest child for males that had children was 17.04 years, a difference of 4.43 years.
198
lower proportion of females, however, had more education (t = .89, df = 108, n.s.);
fewer children (t = -.88, df = 108, n.s.); more business experience (t = .67, df =
108, n.s.); and more loans outside of CAME (χ2 = 1.73, df = 1, n.s.).
Pearson correlations also revealed that groups with a higher proportion of
females (more than 80 percent) had more inter-cycle loans (r = .19, p < .05) and
had more members (r = .24, p < .05) (see Appendix G). However, inter-cycle
loans and group size had negative non-significant relationships with financial
capital items. As we can see, none of the above differences for group composition
were significant except for the Pearson correlations and only monitoring was
close to significant. Monitoring did have significant positive correlations with
financial capital items and this may have aided groups with a higher proportion of
females.
199
Table 6.2
Descriptive Statistics for Gender Composition of Groups and for Environment,
CAME Group Loans
Variables Mean Groups 33-80% Female
n=56
Mean Groups
81-100% Female
n=54
Mean Rural
Groups n=55
Mean Urban Groups
n=55
1. Sex 1.64 1.96 1.78 1.82 2. Females in group (%) 68.66 88.96 77.29 79.96 3. Females in group (categories)
1.45 1.53
4. Environment 1.46 1.54 5. Repayments 5.68 6.17 6.27 5.56 6. Sales 4.71 4.63 5.27 4.07 7. Profits 5.20 4.76 5.58 4.38 8. Savings 5.95 6.02 6.64 5.33 9. Group sanctions 4.46 4.78 4.93 4.31 10. Community sanctions 3.88 4.11 4.55 3.44 11. Community reputation 4.86 5.24 5.26 4.84 12. Group relations 5.70 5.94 5.87 5.76 13. Community relations 4.64 5.11 5.09 4.66 14. Solidarity 5.00 4.98 5.27 4.71 15. Age (years) 41.50 41.57 39.05 44.02 16. Education (years) 8.27 7.69 8.42 7.56 17. Marital Status 1.43 1.46 1.49 1.40 18. Number of children 2.79 3.07 2.76 3.09 19. Age of youngest child (code)
2.21 2.02 2.05 2.18
20. Age of oldest business (years)
9.52 8.45 7.05 10.94
21. Number of businesses 1.34 1.41 1.29 1.45 22. Buiness ownership 4.75 4.78 4.73 4.80 23. Loan Type 1.21 1.35 1.18 1.38 24. Loan amount per month (Mexican pesos)
$1,366.67 $1,780.09 $1,300.00 $1,839.25
25. Time in CAME (years) 4.49 5.24 3.08 6.63 26. Other loans 1.18 1.09 1.09 1.18 27. Group size 22.27 24.20 22.38 24.05 28. Access to training 1.39 1.50 1.29 1.60 29. Screening 6.23 6.63 7.51 5.35 30. Monitoring 1.11 1.50 1.49 1.11
n = 110 For coding of variables see Table 6.1.
200
In regards to environment, rural clients were younger (t = -2.25, df = 108,
p < .05); had more education (t = 1.35, df = 108, n.s.); had fewer children (t = -
1.00, df = 108, n.s.); and reported more screening (t = 4.60, df = 101, p < .001)
and monitoring (t = 1.76, df = 71, n.s.) (see Table 6.2). Urban clients, however,
had various potential advantages. They had more business experience (t = -2.49,
df = 96, p < .05); more businesses (t = -1.30, df = 101, n.s.); considerably bigger
loans (t = -1.56, df = 76, n.s.); more inter-cycle loans (χ2 = 5.44, df = 1, p < .05);
more loans outside of CAME (χ2 = 1.93, df = 1, n.s.); had associated with CAME
twice as long (t = -5.31, df = 69, p < .001); and had received more training over
the previous year (t = -2.2, df = 89, p < .05). Thus, there were more significant
differences between rural and urban clients in relation to control variables than
there were for gender or group composition. Age had a significant negative
correlation with savings (r = -.19, p < .05); screening had a significant positive
correlation with savings (r = .24, p < .05); and monitoring had significant positive
correlations with all the three financial capital items (see Appendix G). These
variables may have aided rural clients. On the other hand, business experience and
inter-cycle loans had a non-significant negative correlation with financial capital
items; access to training had non-significant positive correlations; whereas time in
CAME had significant negative correlations with sales (r = -.22, p < .05) and
savings (r = -.27, p < .01). Therefore, there were no noticeable advantages that
urban clients may have enjoyed whereas rural clients may have benefited from
201
being younger and newer in CAME, and from employing more screening and
monitoring.
Looking at Pearson correlations with the items for the independent
variables in the structural equation model, screening had a positive relationship
with community sanctions (r = .25, p < .01) and business ownership had a
negative relationship (r = -.19, p < .05) (see Appendix G). Education actually had
a negative relationship with solidarity (r = -.19, p < .05).
Only one control variable was not included in the correlations table
(Appendix G). For the question concerning whether clients had changed from
individual loans to group loans, only one male in Ozumba answered in the
affirmative and two females in Tezozomoc. The individual loans sample also had
a small affirmative response for this item.
Marital status did not have any significant correlations (Appendix G).
Statistics were similar to the CAME individual loans sample in regard to marriage
except that fewer females reported being married in Ozumba, the rural centre (see
Table 6.3). There was no significant difference between rural and urban
environments for the marital status of clients of both genders (χ2 = .92, df = 1,
n.s.) and for the marital status of females only (χ2 = 1.11, df = 1, n.s.).
Total 16 100 55 100 11 100 69 100 Oz. = Ozumba centre (rural) Tez. = Tezozomoc centre (urban)
Table 6.5 displays the number of businesses that clients had in each centre.
There tend to be more clients in Tezozomoc that had two businesses (t = -1.30, df
= 101, n.s.), although the number of businesses did not have a significant
correlation with financial capital items. The number of businesses was highly
significant in relation to loan amount (a proxy for income) (r = .32, p < .01) and
time with CAME (r = .33, p < .01), and significant with business age (r = .20, p <
.05) (see Appendix G). This suggests that association with CAME and business
experience may help clients to diversify their business activities and form more
capital over the long-term.
204
Table 6.5
Number of Businesses, CAME Group Loans
Number of Businesses Ozumba (rural)
% Ozumba
Tezozomoc (urban)
% Tezozomoc
Clients with 1 business 42 76.4 35 63.6 Clients with 2 businesses 10 18.2 17 30.9 Clients with 3 businesses 3 5.5 2 3.6 Clients with 4 businesses 0 0 0 0 Clients with 5 businesses 0 0 1 1.8
Total 55 100 55 100 Total businesses 71 80
Table 6.6 presents descriptive statistics indicating the number of clients
that had an additional inter-cycle loan with CAME. The inter-cycle loan is a short-
term loan to take advantage of an opportunity or to cover an emergency. The sum
varies between $200 to $2,000 Mexican pesos or between US$16 to US$160.
Inter-cycle loans had negative correlations with economic capital items, but these
correlations were not significant.
Table 6.6
Loan Type with CAME
Loan Type n males Oz.
% males Oz.
n females
Oz.
% females
Oz.
n males Tez.
% males Tez.
n females
Tez.
% females
Tez. Group loan 11 91.7 34 79.1 7 70.0 26 57.8 Group loan and inter-cycle loan
1
8.3
9
20.9
3
30.0
19
42.2
Total 12 100 43 100 10 100 45 100 Oz. = Ozumba centre (rural) Tez. = Tezozomoc centre (urban)
205
Urban clients had greater access to loans in other institutions (χ2 = 1.93, df
= 1, n.s.), although this difference was not significant (see Table 6.7). 9 percent of
Ozumba clients had loans with other institutions compared to 18 percent of
Tezozomoc clients. Loans in other institutions did not have significant
correlations with economic capital creation (Appendix G).
Table 6.7
Loans with Other Institutions, CAME Group Loans
Other Type of Loan Ozumba male
Ozumba female
Tezozomoc male
Tezozomoc female
Other individual loan 0 3 1 5 Other group loan 0 1 0 2 Another type of loan 0 0 0 0 Individual loan and group loan
0 0 1 1
Individual loan, group loan and other type of loan
0 1 0 0
Total 0 5 2 8
Finally, Table 6.8 indicates the percentage of males and females that
received some form of training or education during the previous 12 months prior
to the survey. Males had less access to educational services than females (t = -.91,
df = 108, n.s.) with urban females reporting the most interaction with educational
services, especially in health-related training. Overall, urban females reported
twice as much contact with educational services than urban males, although less
than 50 percent of urban females had contact with an educational service. Overall,
urban clients had received more training over the previous year than rural clients
206
(t = -2.2, df = 89, p < .05), but training had no significant correlations with
financial capital items.
Table 6.8
Training or Education during the Previous Year, CAME Group Loans
Training or Education
Type
n males Oz.
% males Oz.
n females
Oz.
% females
Oz.
n males Tez.
% males Tez.
n females
Tez.
% females
Tez. Business 1 8.3 6 14.0 1 10.0 9 20.0 Health 1 8.3 7 16.3 2 20.0 13 28.9 Other 0 0 1 2.3 2 20.0 6 13.3
Total 2 14 5 28 None 11 91.7 30 69.8 8 80.0 26 57.8 Oz. = Ozumba centre (rural) Tez. = Tezozomoc centre (urban) Note: each client could have received more than one type of training or education during the last year.
6.3 Measurement Model and Construct Validity
Capital Items
I conducted a confirmatory factor analysis to assess the structure of the
observed measures for economic capital, human capital and social capital (see
Table 6.9). An adjusted principal components analysis (EPIC) with an oblimin
rotation42 revealed that capital items loaded on four factors. This measurement
model was tested with EQS and robust statistics (Byrne, 2006).
42 For a brief discussion of my choice of a factor analysis solution and a rotation method see section 5.3.
207
Table 6.9
Factor Analysis of Capital Items, CAME Group Loans
Construct Validity of Sanctions and Relations, CAME Group Loans
Inter-construct correlation
Squared inter-construct correlation
Standardised residuals
Normed χ 2 Cross loadings
.355 .126 all below 2.5 0.3081 (very good)
no
6.4 Independent Samples T-tests
The following t-tests and ANOVAs were conducted on items that had
construct validity in the above confirmatory factor analysis and goodness-of-fit in
the final structural equation model to be found in the following “Causal Model”
section. In addition, these items agreed with the items found in the final models
for the other two samples (Chapter 5 and Chapter 7).
Gender
Independent samples t-tests were employed to check for differences
between males and females (see Table 6.15). There were no significant
differences between males and females for the items in the final model.
214
Table 6.15
Independent Samples T-tests for Gender, CAME Group Loans
Variable Females Males t Repayments 5.88 6.09 .54 Sales 4.64 4.82 .39 Profits 4.90 5.32 .97 Savings 5.89 6.36 1.07 Group relations 5.90 5.50 -1.32 Community relations 4.84 5.00 .43 Solidarity 4.91 5.31 1.08 Group sanctions 4.50 5.09 1.54 Community sanctions 3.91 4.32 .89 Community reputation 5.06 5.00 -.14
* p < .05 ** p < .01 *** p < .001 All two-tailed tests.
Group Composition
Independent samples t-tests were employed to check for differences
between groups with between 33 percent and 80 percent of members who were
female and groups with more than 80 percent of members who were female (see
Table 6.16). There were no significant differences.
215
Table 6.16
Independent Samples T-Tests for Group Composition, CAME Group Loans
Variable 33%-80% females
81%-100% females
t
Repayments 5.68 6.17 -1.53 Sales 4.71 4.63 .23 Profits 5.20 4.76 1.26 Savings 5.95 6.02 -.20 Group relations 5.70 5.94 -1.02 Community relations 4.64 5.11 -1.58 Solidarity 5.00 4.98 .06 Group sanctions 4.46 4.78 -1.02 Community sanctions 3.89 4.11 -.64 Community reputation 4.86 5.24 -1.21 * p < .05 ** p < .01 *** p < .001 All two-tailed tests.
Environment
Independent samples t-tests were employed to check for differences
between rural groups and urban groups (see Table 6.17). There were various
significant results in favour of rural groups. Firstly, rural groups had significantly
higher repayment rates (t = 2.24; p < .05). This result, however, should be treated
with caution as the method for rating repayments differed between the two
centres. Rural clients also had very significantly higher scores for all forms of
financial capital. Furthermore, rural clients scored significantly higher for two
sanctions items. Rural groups also had non-significant higher averages for group
and community relations, with solidarity being close to significant (t = 1.88, n.s.).
216
Table 6.17
Independent Samples T-Tests for Environment, CAME Group Loans
Variable Rural Groups Urban Groups t Repayments 6.27 5.56 2.24* Sales 5.27 4.07 3.36*** Profits 5.58 4.38 3.63*** Savings 6.64 5.33 3.91*** Group relations 5.87 5.76 .45 Community relations 5.09 4.66 1.47 Solidarity 5.27 4.71 1.88 Group sanctions 4.93 4.31 2.02* Community sanctions 4.55 3.44 3.12** Community reputation 5.26 4.84 1.32 * p < .05 ** p < .01 *** p < .001 All two-tailed tests.
6.5 One-way Analysis of Variance
Gender
There were no significant F statistics when females and males were tested
with ANOVA.
217
Group Composition
There were no significant F statistics when groups with fewer females (33-
80 percent) were compared with groups with more females (81-100 percent).
Environment
As in the case of the independent samples t-tests, the three items for
financial capital had p values equal to or less than .001 and were highly
significant. The repayment item was significant (F = 5.04; p < .05) and two items
for sanctions were significant. The community sanctions item was highly
significant (F = 9.74; p < .01) and group sanctions item was significant (F = 4.09;
p < .05). Of all these significant items, none had a significant Levene statistic, the
test of the homogeneity of variances.
6.6 Causal Models
A causal model was necessary in order to check whether independent
constructs had goodness-of-fit in a model; to check for appropriate sample size
with the critical N as this cannot be done with a single dependent factor; and to
test control variables with the model to see whether they have a significant
relationship with the dependent variable.
218
The final model was composed of the final constructs derived from the
confirmatory factor analysis and construct validity tests. The repayments factor
was also added as a mediating variable. Sanctions (group sanctions, community
sanctions and community reputation) and relations (group relations, community
relations and solidarity) were the independent variables and financial capital
(sales, profits and savings) was the dependent variable. The fit for this model
(Model 1) was very good (see Table 6.18).
The group and community relations factor had a significant path with
repayments (robust z = 1.99; p < .05) (see Figure 6.1). The other two paths,
however, were not significant. Note how the sanctions construct lowers repayment
rates (robust z = -.38; n.s.). Repayments had a non-significant relationship with
financial capital (robust z = .43, n.s.).
I then compared this model with another that included social capital as a
dependent variable. However, this model had problems of linear dependency.
Another model that included both social capital and human capital as dependent
variables also had problems of linear dependency. Then I removed the repayments
factor and included social capital with paths from both independent variables to
both dependent variables. This model (Model 2) had very good fit, although
Model 1 had better overall indicators of fit (see Table 6.18).
When the different control variables were placed in the final model, none
had a significant relationship with the dependent variable (financial capital) nor
did they affect the other paths in the model.
219
Table 6.18
Causal Structure, CAME Group Loans
Measurement Models S-B χ 2 df Proba-bility
CFI RMSEA SRMR
Model 1: Final Model: financial capital as the dependent variable; repayments as the mediating variable; and sanctions and relations as the independent variables.
21.50 31 .90 1.000 .000 .052
Model 2: Removed the repayments factor from Model 1 and added social capital as a dependent variable.
50.40 49 .42 .995 .016 .090
Robust statistics were used except for SRMR (normal maximum likelihood (ML)). S-B χ2 = Satorra-Bentler scaled chi-square.
Figure 6.1. Final structural equation model, CAME group loans (robust z
statistics)
In order to determine an appropriate sample size the critical N was
calculated. The critical N with normal maximum likelihood statistics was 194 and
Financial Capital
z = .43, n.s. Repayment
Rates
Group and Community
Relations
Group and Community Sanctions
z = 1.99, p < .05
z = -‐.38, n.s.
220
with robust statistics it was 228. Values of 200 or more are recommended for an
acceptable fit (Hox, 1995)
6.7 Latent Mean Differences
The test of latent mean differences was now undertaken to examine
whether the dependent variable had significant differences between categories for
gender, the gender composition of groups, and environment.
Gender
Testing for latent mean differences of a measurement model involves five
steps. The first three steps are the same as the first three steps in the test of
factorial invariance. However, with the CAME group sample it was not possible
to perform the first two steps as there was only one dependent factor (financial
capital) and to test a measurement instrument with confirmatory factor analysis it
is necessary to have at least two factors. However, a measurement model and a
causal model with construct validity and acceptable goodness-of-fit had already
been obtained. Therefore, testing for latent differences began with the third step,
which compares factor loadings between the two groups (females and males) (see
Table 6.19). There were no significant constraints.
221
The fourth step involves the test of the invariance of intercepts. All
previous equality constraints are retained except those found to be non-invariant
(none in this case). The variance for the constant V999 is fixed to 1.0. No
significant constraints were found.
The fifth step involved testing for invariance of latent factor means. The
averages for the two groups were not significantly different (z statistic for
financial capital = -.834, n.s.). The negative non-significant z statistic denoted that
female group loans create less money capital on average.
Table 6.19
Latent Mean Differences of the Measurement Model for Gender, CAME Group
Loans
Samples, Models and Tests S-B χ 2 probability
CFI RMSEA
Testing for measurement invariance of factor loadings: covariances for female sample only; 110 cases.
.74 1.000 .000
Testing for invariance of intercepts: covariances for female sample only; 110 cases.
.67 1.000 .000
Testing for invariance of latent factor means: covariances for female sample only; 110 cases.
.67 1.000 .000
Robust statistics were used (normal maximum likelihood (ML)). S-B χ2= Satorra-Bentler scaled chi-square.
Group Composition
As with the comparison of gender above, testing for latent differences
began with a comparison of factor loadings between the two groups: groups with
222
between 33 percent to 80 percent female members; and groups with more than 80
percent female members (see Table 6.20). There were no significant constraints.
In the testing for invariance of intercepts, the constraint of the intercept for profits
and the constant V999 had a significant univariate increment (p = .02). The last
step involved testing for invariance of latent factor means. The averages for the
two groups were not significantly different (z statistic for financial capital = -1.25,
n.s.). The negative non-significant z statistic denoted that groups with more
females (more than 80 percent) create less money capital on average.
Table 6.20
Latent Mean Differences of the Measurement Model for Group Composition,
CAME Group Loans
Samples, Models and Tests S-B χ 2 probability
CFI RMSEA
Testing for measurement invariance of factor loadings: covariances for groups with more females only; 110 cases.
.24 .993 .089
Testing for invariance of intercepts: covariances for groups with more females only; 110 cases.
.11 .988 .121
Testing for invariance of latent factor means: covariances for groups with more females only; 110 cases.
.09 .987 .128
Robust statistics were used (normal maximum likelihood (ML)). S-B χ2 = Satorra-Bentler scaled chi-square.
Environment
As with the comparisons for gender and group composition above, testing
for latent differences began with a comparison of factor loadings between the two
223
groups: urban groups and rural groups (see Table 6.21). The univariate increment
for the profit constraint was significant (p = .02). In the testing for the invariance
of intercepts, the constraint of the intercept for sales and the constant V999 (p =
.002) and for savings and the constant V999 (p = .02) both had significant
univariate increments. The last step involved testing for invariance of latent factor
means. The averages for the two groups were very significantly different (z
statistic for financial capital = -3.59; p < .001). The negative z statistic denoted
that urban groups created significantly less money capital on average than rural
groups.
Table 6.21
Latent Mean Differences of the Measurement Model for Environment, CAME
Group Loans
Samples, Models and Tests S-B χ 2 probability
CFI RMSEA
Testing for measurement invariance of factor loadings: covariances for groups with more females only; 110 cases.
.09 .970 .161
Testing for invariance of intercepts: covariances for groups with more females only; 110 cases.
.00074 .982 .228
Testing for invariance of latent factor means: covariances for groups with more females only; 110 cases.
.05 .974 .193
Robust statistics were used (normal maximum likelihood (ML)). S-B χ2 = Satorra-Bentler scaled chi-square.
224
6.8 Conclusions
This chapter covers the results for the CAME group loans sample, one of
the two group loans samples that test Hypotheses 2 to 5. A limitation of this
CAME sample was that there was very little difference in the gender composition
of groups. Few groups had more than 40 percent male members and there were
very few all-female groups. Never the less, there are some interesting results.
Hypothesis 2 states that groups with a greater proportion of female
members will experience higher levels of group participation. Group participation
is highly related to social relations. Solidarity, originally an item intended for
group participation, loads with group and community relations. There is also a
tendency in this sample and the next for group participation items to load with
group and community relations items. Groups with a greater proportion of females
in fact generally placed more importance on group and community relations, but
neither the t-tests nor the ANOVAs were significant. Also the t score for solidarity
was almost exactly the same for both groups. A test of invariance for the casual
model indicated that the model for male clients was significantly different than the
model for female clients. However, a test of invariance of the causal model for
groups with more males (20 percent or more male members) was not significantly
different than the model for groups with fewer males (less than 20 percent). There
is no evidence that group participation or social relations differ according to the
gender composition of the group and, therefore, there is no support for Hypothesis
2.
225
Hypothesis 3 states that groups with a greater proportion of females will
experience more peer-group and community pressure. The factor analysis in both
group samples indicated that group and community sanctions were distinct from
group and community relations and that items for group participation were related
to items for group and community relations. Items for sanctions represent the best
measures of group and community pressure. Groups with a greater proportion of
females did have a greater likelihood of imposing sanctions, but the t-tests and
ANOVAs were not significant. Therefore, there is no support for Hypothesis 3
that states that groups with a greater proportion of females will experience more
sanctions.
Hypotheses 4 states that capital creation will not differ between groups
with a greater proportion of females and groups with a smaller proportion of
females, even though traditional wisdom and theory indicates that males will
create more capital. There was virtually no difference between the two groups in
the creation of sales and savings, although groups with a higher proportion of
males performed better for profits. However, none of the t-tests and ANOVAs for
financial capital creation were significant. Also, although the test of latent mean
differences revealed that males with group loans will create more capital than
females with group loans, and that groups with more males (at least 20 percent
male members) will create more capital than groups with less males (less than 20
percent male members), the z statistics for both comparisons of latent means were
not significant. There was no significant evidence that capital creation is
226
determined by the gender composition of a group. This result supports Hypothesis
4.
Finally, Hypothesis 5 states that clients with group loans in smaller
populations will create more capital than clients with group loans in larger
populations. Clients in a large agricultural town (or very small city) were
compared with clients in a poor area of Mexico City, one of the world’s biggest
cities. In agreement with this hypothesis all items for financial capital creation
were highly significant in favour of rural clients with both t-tests and ANOVAs.
The test of latent mean differences indicated that there was a significant difference
in the averages for financial capital creation between the two environments. Rural
groups do create significantly more financial capital than urban groups. This
finding supports Hypothesis 5.
In summary, no significant differences were found for group composition,
indicating that the proportion of males and females in a group in this sample did
not affect relations, sanctions or financial capital creation. However, rural groups
did outperform urban groups in regard to the formation of financial capital.
227
CHAPTER 7: RESULTS FOR APROS GROUP LOANS
7.1 Introduction
The object of this chapter is to test Hypotheses 2, 3, 4 and 5 with the Apros
sample for group loans. Hypothesis 2 examines whether groups with a greater
proportion of females have higher levels of group participation, such as solidarity.
Hypothesis 3 deals with peer-group and community pressure, and suggests groups
with a greater proportion of females will experience more pressure. Hypothesis 4
states that groups with a greater proportion of females will be able to generate as
much capital as groups that have a smaller proportion of females. Finally,
Hypothesis 5 indicates that groups that live in smaller towns or cities will generate
more capital than those that live in urban areas with larger populations.
The first section looks at descriptive statistics and additional tables that
describe control variables. The second section analyses the measurement model
for this sample with confirmatory factor analysis and determines construct
validity. The third and fourth sections examine the items that have construct
validity with t-tests and ANOVAs. The fifth section searches for a causal model
with goodness-of-fit. A causal model is included in order to examine appropriate
sample size for the test of latent mean differences; to check that independent
factors and their items have goodness-of-fit in a rigorous model; and to be able to
test the influence of control variables on the dependent variable. The next section
228
deals with a test of latent mean differences in order to compare the dependent
construct utilising categories that represent gender, the gender composition of
groups, and population size. Finally, taking into account the results of the
statistical tests in this chapter, I come to a conclusion concerning the above four
hypotheses.
7.2 Descriptive Statistics
Sampling Procedure46
The Apros group loans sample was collected from all the eight Apros
centres located in two states and the Federal District extending from Mexico City
towards the northeast and the east to the sea, the Gulf of Mexico. Each centre
serves a considerable area. There are two in the Federal District, two in the state
of Hidalgo, and four in the state of Veracruz. Only the Cuajimalpa centre was
located in a large city, but only three groups that had at least one year of
association with Apros were operating from this centre at this time. Other clients
located in Mexico City were contacted by means of the Milpa Alta centre, a rural
centre very close to Mexico City. However, seven centres were located in cities of
less than 100,000 people. Six of these had populations smaller than 40,000. Also,
many of the clients included in the survey and their groups lived outside of cities.
46A discussion of sampling procedure is also found in section 4.4.
229
The original goal of this sample was to collect about 220 questionnaires
from clients in groups that had been associating with Apros for at least one year.
As there was a minority of groups with 50 percent or more male members, groups
composed of at least 40 percent male members were selected from a list. The
sample was selected according to a third of groups composed of at least 40
percent male members; a third of mixed groups with less than 40 percent male
members; and a third composed of all-female groups. Also, the sample was
divided up into half of clients located in urban populations of more than 15,000
people and a half of clients from rural populations of less than 15,000 people. If
possible, I chose clients in the largest cities and the smallest towns, but generally
there were very few clients from cities of more than 40,000 people.
Clients in Apros met in the home of a member and made a weekly
payment to the Apros promoter (staff member responsible for coordinating
groups) during the meeting. Due to distances between centres and the sparse
distribution of clients, it was decided that Apros staff would collect the
questionnaires from the clients selected considering that staff members normally
visited each group once a week. Each centre usually had various staff members
who visited group meetings. A total of 243 questionnaires were collected from
243 different groups47. The Apros group loans questionnaire for clients can be
found in Appendix H and its English translation in Appendix I. Of these, 57
questionnaires were answered by clients who had been associating with CAME
for less than one year. Another four were removed because the client had not
47 If more than one questionnaire came from the same group, the questionnaire of only one group member was retained for the survey sample.
230
answered the questions concerned with group processes, such as group
participation. This left me with 182 questionnaires.
A list of defaulting groups was also obtained from Apros and these groups
were included amongst the 182 questionnaires above. If it was not possible to
obtain a questionnaire from the groups in the defaulting list, another defaulting
group or group with payment problems was selected by Apros staff and a
questionnaire obtained. Surveys were also collected from other clients that were
not selected as defaulters but who were not punctual with repayments according to
staff answers. The staff answered separate questions about the client including one
concerning the punctuality of the clients’ payments, which was used for the
mediating variable (repayments). The Apros staff questionnaire can be found in
Appendix J and its English translation in Appendix K.
Generally the survey was read, but 43 clients (23.6 percent) self-
administered the questionnaire. The method of collecting the survey had
significant correlations with age (r = -.30; p < .01); number of children (r = -.24; p
< .01); group size (r = -.18; p < .05); and training (r = .23; p < .01). These
correlations indicate that the minority who opted for a self-administered
questionnaire were significantly younger, had fewer children, belonged to smaller
groups and had received more training or education over the last year. These
clients had over a year of formal education more than those who were read the
questionnaire, although the t-test (t = -1.86, df = 180, p = .06) and the Pearson’s
correlation (r = .138, p = .06) were not quite significant. Chi-square tests were
performed looking at the application of the survey and categories for gender (χ2 =
231
.12, df = 1, n.s.), group composition (χ2 = 3.05, df = 2, n.s.), and environment (χ2
= 3.05, df = 2, n.s.). No significant differences were found when comparing the
way the survey was applied with the different categories.
Missing Data
Generally very little data was missing. For example, no more than three
cases (1.7 percent) were missing data for dependent variable items, no more than
one case for relations items, and no more than two cases for sanctions items.
Missing data was replaced according to the average for the client’s centre, gender,
the client’s group composition (3 categories) and the environment of the client
(rural or urban). For example, missing data for a case could be replaced according
to the average of that item for clients in all-female groups in the Tantoyuca centre
that lived in populations of less than 15,000 people (a rural environment). Missing
data for control variables were replaced according to the average for the client’s
centre, gender and environment.
Descriptive Statistics
Below are tables with means, standard deviations (Tables 7.1 and 7.2) and
correlations (Appendix L) for Apros group loans. Items that did not have
construct validity (tested later on in this chapter) are not included in the table. The
repayments question was answered by Apros staff.
232
Table 7.1 provides information about the averages of the sample.
Compared to the previous group loans sample, Apros group clients had a similar
age (42.4 years), marital status (56.6. percent married), number of children (2.7),
business age (9.3 years)48, and business ownership status (87.9 percent own 100%
of their business), but Apros clients had a bit more than half a year extra of formal
education (8.6 years) and more Apros clients had loans in other institutions (20.9
percent). Apros group clients had been associating with the institution two years
less (2.6 years). Loans to Apros group clients covered a 6-month period and were
a bit less per month (about US$110 a month in total or about 13.6 percent less).
Males were about 5 years older than females (t = 2.07, df = 180, p < .05)
and their businesses were more than 4 years older (t = 1.85, df = 26, n.s.) (Table
7.1). Age (r = -.15, p < .05) and business age (r = -.19, p < .05) had significant
negative correlations with gender (Appendix L). Age had a negative correlation
with financial capital correlation, being significant in the case of sales (r = -.15, p
< .05) and almost significant in the case of profits and savings (both r = -.13, n.s.).
Therefore, males in this sample did not appear to possess any significant
advantages and their average age was a possible disadvantage.
48 The age of the business was recorded as the age of the client’s oldest business if the client answered that he/she had more than one business.
233
Table 7.1
Descriptive Statistics, Apros Group Loans
Variables Mean n=182
s.d.
Mean Females n=158
Mean Males n=24
1. Sex 1.87 .34 2. Females in group (%) 81.27 21.84 84.89 57.50 3. Females in group (categories) 2.23 .835 2.36 1.38 4. Environment 1.53 .501 1.53 1.50 5. Population 1,333,652 4,973,057 1,407,573 847,006 6. Repayments (staff answer) 6.18 1.62 6.12 6.54 7. Sales 6.99 1.89 6.96 7.13 8. Profits 7.01 1.99 6.99 7.08 9. Savings 7.39 1.80 7.35 7.63 10. Group sanctions 5.05 1.66 5.07 4.92 11. Community sanctions 4.96 1.66 4.96 4.96 12. Community reputation 5.24 1.54 5.16 5.71 13. Group relations 5.41 1.67 5.35 5.75 14. Community relations 5.17 1.54 5.10 5.63 15. Solidarity 4.95 1.79 4.87 5.46 16. Age (years) 42.36 10.49 41.56 46.33 17. Education (years) 8.60 3.49 8.62 8.50 18. Marital Status 1.43 .497 1.42 1.54 19. Number of children 2.70 1.73 2.70 2.71 20. Age of youngest child (code) 2.14 .97 2.09 2.42 21. Age of oldest business (years) 9.26 7.88 8.69 13.00 22. Number of businesses 1.23 .59 1.22 1.29 23. Business ownership 4.76 .70 4.78 4.63 24. Loan amount (total in Mexican pesos)
Coding for variables was as follows: sex: 1 = “male”, 2 = “female”; females in group (categories): 1 = 0%-60%, 2= 61%-99%, 3= 100%; environment: 1= rural< 15,000 people; 2= urban> 15,000 people; repayments: 1 = “I totally disagree (that the client is punctual)”, 7 = “I totally agree”; variables 7 to 9 (sales, profits, and savings): 1 = “I totally disagree”, 9 = “I totally agree”; variables 10 to 15 (group sanctions, community sanctions, community reputation, group relations, community relations, and solidarity): 1 = “not at all probable”, 7 =” totally probable”; marital status: 1 = married, 2 = not married; age of youngest child: 1= 0.3-8 years old, 2 = 9-17 years old, 3 = 18-40 years old, 4 = no children; business ownership: 1 = zero %, 2 = less than 50%, 3 = 50%, 4 = more than 50%, 5 = 100%; other loans: 1 = “no”, 2 = “yes”; training/education: 1= no training; 2 = 1 form of training (business, health or other), 3 = 2 forms of training; 4 = all (3) forms of
234
training; meetings: 1 = once a week; 2 = once a fortnight; 3 = once a month; 4 = less than once a month; 5 = never; survey application: 1 = read to client; 2 = self-administered; control variables 31 and 32 (screening and monitoring): 1 = “I totally disagree”, 9 = “I totally agree”.
Table 7.2 presents the descriptive statistics for the gender composition of
groups and environment49. The clients in mixed groups with more than 60 percent
female members had larger loans than all-female groups (t = 3.06, df = 133, p <
.01) and groups with 60 percent or less females (t = -2.10, df = 91, p < .05).
Clients in groups with 60 percent or less females owned older businesses (t =
2.04, df = 63, p < .05) than all-female groups. Business age was negatively
correlated with the percentage of women in a group (r = -.16, p < .05) and the
categories of group composition (r = -.18, p < .05) meaning the older the business,
the greater the percentage of males in the group (Appendix L). Business age did
not have any significant correlations with financial capital items, but the size of
the loan did. Sales (r = .18, p < .05), profits (r = .22, p < .01) and savings (r = .22,
p < .01) were all significantly correlated with loan size indicating that mixed
groups with more than 60 percent female members had an advantage over the
other two gender composition categories for groups.
Groups in the largest populations had received less training over the last
year (t = 1.93, df = 104, n.s.) and had screened their members less (t = 1.92, df =
114, n.s.) than groups in small and medium-sized towns (Table 7.2). Groups in the
49 The average for the population of the location of the client does not represent the median as 12 clients (6.6 percent) were located in Mexico City, which has a population of around 20 million or more, whereas the next biggest city had a population of just under 40,000 people. 31 clients were located in small cities of between 35,000 and 40,000, the next biggest urban zones after Mexico City in this sample.
235
largest populations were also less frequent with their meetings (t = -1.96, df = 54,
n.s.) than groups in large towns and very small cities. All these differences were
almost significant. Groups in the smallest populations had significantly smaller
loans than groups in medium-sized populations (t = -2.30, df = 131, p < .05.) and
almost significantly smaller loans than groups in the largest populations (t = -1.89,
df = 114, n.s.). Screening and training are highly related to financial capital
creation, whereas training is significantly related to profits (r = .17, p < .05) and
almost significantly related to sales (r = .14, n.s.) (Appendix L). A Pearson
correlation also indicated that clients who had received some form of training or
education in the last year were more common in rural areas (r = -.19, p < .01). A
lack of training may have hindered the performance of groups in the largest
populations, whereas small loans appear to have been a disadvantage for groups in
the smallest populations as loan size is significantly correlated with all financial
capital items. Loan amounts were significantly bigger in urban areas (r = .18, p <
.05). Group size was also larger in the smallest populations (r = -.15, p < .05) and
was negatively correlated with sales (r = -.17, p < .05), profits (r = -.14, n.s.) and
savings (r = -.25, p < .01) indicating another disadvantage for the smallest
populations.
236
Table 7.2
Descriptive Statistics for Gender Composition of Groups and for Environment,
Apros Group Loans
Variables Mean 0-60%
Females n=47
Mean 61-99% Females
n=46
Mean 100%
Females n=89
Mean 1-
10,000 People n=73
Mean 10,000-30,000 People n=66
Mean over
30,000 people n=43
1. Sex 1.68 1.80 2.00 1.85 1.85 1.93 2. Females in group (%) 50.28 76.72 100.00 83.67 77.47 83.05 3. Females in group (categories)
Total 73 66 43 182 Percentages in parentheses. *Personal loans are loans that are not for businesses, but could be used to improve housing infrastructure or some other personal non-business related activity.
241
Table 7.7 indicates the number and percentage of clients that received
some form of training or education during the previous 12 months prior to the
survey. There were no significant differences for access to training when taking
into account categories for the gender composition of groups and for environment,
although the smallest populations had almost received significantly more training
(t = 1.93, df = 104, p = .06) than the biggest populations as has been stated above.
Unlike the previous group loans sample, clients that lived in the smallest
populations had received the most forms of training or education during the
previous year.
Table 7.7
Training or Education during the Previous Year, Apros Group Loans
Type of Training or Education
1-10,000 10,000-30,000
> 30,000 Total
Business 12 (16.4) 7 (10.6) 0 (0) 19 (10.4) Health 6 (8.2) 3 (4.6) 6 (14.0) 15 (8.2) Other 5 (6.8) 3 (4.6) 1 (2.3) 9 (5.0)
Groups that met less frequently than once a week experienced difficulties
in financial capital creation and in social relations. Groups in the largest
populations had almost significantly fewer meetings than groups in medium-sized
242
populations (t = -1.96, df = 54, p = .06) (Table 7.8). Frequent meetings were
highly correlated with all items for financial capital generation; all items for social
relations in the group and the community; and repayments (Appendix L). Most
probably, the frequency of meetings could be used as a proxy for potential
defaulters.
Table 7.8
Frequency of Meetings, Apros Group Loans
Frequency of Meetings
1-10,000 10,000-30,000
> 30,000 Total
Once a week 60 (82.2) 62 (93.9) 34 (79.1) 156 (85.7) Once a fortnight 11(15.1) 3 (4.6) 5 (11.6) 19 (10.4) Once a month 0 (0) 0 (0) 0 (0) 0 (0) Less than once a month
0 (0) 0 (0) 1 (2.3) 1 (0.6)
Never 2 (2.7) 1 (1.5) 3 (7.0) 6 (3.3) Total 73 66 43 182
Percentages in parentheses.
7.3 Measurement Model and Construct Validity
Capital Items
I conducted a confirmatory factor analysis to assess the structure of the
observed measures for economic capital, human capital and social capital (see
Table 7.9). An adjusted principal components factor analysis (EPIC) with a direct
243
oblimin rotation method50 revealed that capital items loaded on three factors. This
measurement model was tested with EQS and robust statistics (Byrne, 2006).
Table 7.9
Factor Analysis of Capital Items, Apros Group Loans
Extraction method: Adjusted principal components analisis (EPIC). Rotation method: direct oblimin. Rotation converged in 32 iterations.
The first model was based on the loadings in bold in the factor analysis
above (Table 7.9) but it had poor fit (Table 7.10) so the one item factor consisting
of physical capital was eliminated. The second model still had poor fit. The
employment item had the lowest standardised loading so it was decided to
eliminate the second factor also, which left just one factor with eight items.
50 See the same section in Chapter 5 for a brief discussion of why I chose this factor analysis solution and rotation method.
244
Table 7.10
Confirmatory Factor Analysis of Capital Items, Apros Group Loans51
Measurement Models S-B χ 2 df probability CFI RMSEA SRMR
Model 1: According to factor analysis above (Table 7.9).
149.99 55 .00 .815 .121 .065
Model 2: Only first two factors from Table 7.9. Physical capital eliminated.
143.27 34 .00 .801 .133 .070
Robust statistics were used except for SRMR (normal maximum likelihood (ML)). S-B χ2 = Satorra-Bentler scaled chi-square.
As I now had loadings on only one factor I decided to retain the items for
financial capital (sales, profits and savings). These items agreed with the items for
the dependent variable in the previous group loans sample and had a very good
AVE (79 percent). A review of the statistics for construct validity revealed that
convergent validity was good for this factor (see Table 7.11) (Hair & Anderson,
2010).
Table 7.11: Construct Validity of Capital Items, Apros Group Loans
Factor Standardised loadings below .5
Average variance
extracted (AVE)
Construct reliability
Cronbach’s alpha
financial capital no 79 percent 0.92 .91
51 See section 4.5 for a discussion of SEM and fit indices, including abbreviations for fit indices.
245
Group and Community Items
I conducted a second confirmatory factor analysis to assess the structure of
the observed measures for the group and community factors (see Table 7.12). An
adjusted principal components factor analysis (EPIC) with a direct oblimin
rotation method revealed that these items loaded on two factors: social relations
and sanctions. This measurement model was tested with EQS and robust statistics
(Byrne, 2006).
Table 7.12
Factor Analysis of Group and Community Items, Apros Group Loans
Group Forces Items 1 2 Communalities Group relations 0.645 0.081 0.422 Community relations 0.629 0.219 0.443 Help 0.639 0.177 0.439 Solidarity 0.766 0.008 0.587 Learning 0.754 -0.021 0.569 Decision-making 0.796 -0.119 0.648 Punctuality 0.692 -0.125 0.494 Group pressure 0.366 0.401 0.295 Group expulsion 0.015 0.747 0.558 Group sanctions -0.074 0.808 0.658 Community sanctions -0.003 0.808 0.653 Community reputation 0.045 0.712 0.509 Variance explained by each factor
4.785 1.681 6.466 (total variance)
Extraction method: Adjusted principal components analysis (EPIC). Rotation method: oblimin direct. Rotation converged in 5 iterations.
For the first model I respected the factor analysis above in Table 7.12
except that peer-group pressure was removed because it had a cross loading and a
covariance was added between learning and decision-making in agreement with
246
the Lagrange Multiplier test. The fit for this first model was good (see Table 7.13)
and so was construct validity (see Table 7.14A and Table 7.14B).
Table 7.13
Confirmatory Factor Analysis of Group and Community Items, Apros Group
Loans
Measurement Models S-B χ 2 df probability CFI RMSEA SRMR Model 1: According to factor analysis above (Table 7.12). Peer-group pressure item eliminated. Covariance for learning and decision-making.
54.72 42 .09 .979 .041 .056
Model 2: Sanctions (group sanctions, community sanctions and community reputation) and social relations (group relations, community relations and solidarity).
3.69 8 .88 1.000 .000 .025
Robust statistics were used except for SRMR (normal maximum likelihood (ML)). S-B χ2 = Satorra-Bentler scaled chi-square.
Table 7.14A
Construct Validity of Group and Community Items, Apros Group Loans
Factors Standardised loadings below .5
Average variance extracted (AVE)
Construct reliability
Cronbach’s alpha
Sanctions no 61.23 percent 0.86 .86 Relations no 50.11 percent 0.88 .88
Table 7.14B
Construct Validity of Group and Community Items, Apros Group Loans
Inter-construct correlation
Squared inter-construct correlation
Standardised residuals
Normed χ 2 Cross loadings
.438 .192 all below 2.5 1.55 (very good) no
247
Although the above model (Model 1 in Table 7.13) had good fit and good
construct validity, it was necessary to have agreement between the
operationalisation of the two group loans samples. Therefore, for my second
model I tried the same items and factors for group and community items as in the
previous chapter: social relations (group relations, community relations and
solidarity) and sanctions (group sanctions, community sanctions and community
reputation). The second model had excellent goodness-of-fit (see Table 7.13) and
had improved considerably from Model 1. Construct validity was also good (see
Table 7.15A and Table 7.15B) so I decided to continue with the items and factors
in Model 2.
Table 7.15A
Construct Validity of Group and Community Items, Apros Group Loans
Factors Standardised loadings below .5
Average variance extracted (AVE)
Construct reliability
Cronbach’s alpha
Sanctions no 64.30 percent 0.84 .84 Relations no 55.83 percent 0.79 .78
Table 7.15B
Construct Validity of Group and Community Items, Apros Group Loans
Inter-construct correlation
Squared inter-construct correlation
Standardised residuals
Normed χ 2 Cross loadings
.487 .237 all below 2.5 0.46 (very good) no
248
7.4 Independent Samples T-Tests
Gender
Independent samples t-tests were employed to check for differences
between males and females (see Table 7.16). As in the previous group loans
sample, there were no significant differences for the items in the final model.
Males had higher averages for all items except for group sanctions and
community sanctions.
Table 7.16
Independent Samples T-Tests for Gender, Apros Group Loans
Variable Females Males t Repayments 6.12 6.54 1.19 Sales 6.96 7.13 .39 Profits 6.99 7.08 .21 Savings 7.35 7.63 .69 Group relations 5.35 5.75 1.09 Community relations 5.10 5.63 1.58 Solidarity 4.87 5.46 1.50 Group sanctions 5.07 4.92 -.43 Community sanctions 4.96 4.96 -.01 Community reputation 5.16 5.71 1.62
There were no significant F statistics when females and males were tested
with ANOVA.
253
Group Composition
There were no significant F statistics for group categories or significant
post hoc tests when the three categories were compared.
Environment
There were significant F statistics for repayments (F = 6.01; p < .01) and
the three social relations items: group relations (F = 6.44; p < .01), community
relations (F = 5.31; p < .01), and solidarity (F = 7.65; p < .01). A Games Howell
post hoc test revealed the following significant differences between groups: large
towns and very small cities had significantly higher repayments (p = .02); group
relations (p = .01); community relations (p = .01); and solidarity (p = .00) than
larger cities.
7.6 Causal Models
A causal model was obtained in order to test for appropriate sample size
for the test of latent mean differences, to check for the goodness-of-fit of the
relations and sanctions independent factors, and to test the influence of control
variables on the dependent variable.
The final constructs derived from the confirmatory factor analyses and
tests of construct validity were then included in a causal model. The repayments
254
factor was also added as a mediating variable. Sanctions (group sanctions,
community sanctions and community reputation) and relations (group relations,
community relations and solidarity) were the independent variables and financial
capital (sales, profits and savings) was the dependent variable. The fit for this
model (Model 1) was very good (see Table 7.19). The Wald test did not
recommend the dropping of any parameters; the freeing of parameters
recommended by the Lagrange Multiplier test represented only a small
improvement in chi-square; and all standardised loadings were high, which points
to good construct validity.
All the paths were significant with robust z statistics (see Figure 7.1).
Social relations in the group and the community had a highly significant positive
relationship with repayments (z = 4.43, p < .001). Group and community sanctions
had a significant negative relationship with repayments (z = -2.42, p < .05).
Repayments had a highly significant positive relationship with financial capital
formation (z = 4.53, p < .001).
I then compared this model with another that included social capital as a
dependent variable. That is, there was a path from repayments to social capital
(friends, trust and meetings). However, the chi-square of this model was below
.05 implying that this model was not significantly related to the theoretical model.
All the paths in this model were similar to those in the final model and in addition
there was a highly significant positive path between repayments and social capital
(robust z = 5.34, p < .001).
255
Different control variables were tried in the final model. None of the
control variables changed the significant positive path between repayments
and financial capital.
Measurement Models S-BX2 df probability CFI RMSEA SRMR
Model 1 (Final Model): Financial capital as the dependent variable; repayments as the mediating variable; and sanctions and relations as the independent variables.
33.10 31 .37 .996 .019 .053
Model 2: Same as Model 1, but added social capital as a dependent variable.
93.88 60 .00 .950 .056 .063
Table 7.19
Robust statistics were used except for SRMR (normal maximum likelihood (ML)). S-B x2 = Satorra-Bentler scaled chi-square.
Causal Structure, Apros Group Loans
Figure 7.1. Final structural equation model, Apros group loans (robust z
statistics)
Group and Community
Relations
Group and Community Sanctions
Financial Capital
Repayment Rates
z = 4.43, p < .001
z =-2.42, p < .05
z = 4.53, p < .001
Melissa Rangel
Sticky Note
MigrationConfirmed set by Melissa Rangel
256
In order to determine an appropriate sample size the critical N was
calculated. The critical N with normal maximum likelihood statistics was 215 and
with robust statistics it was 245. Values of 200 or more are recommended for an
acceptable fit (Hox, 1995)
7.7 Latent Mean Differences
The test of latent mean differences was now employed with the dependent
variable (financial capital) to ascertain whether there were significant differences
in the averages of the latent variable between categories for gender, the gender
composition of groups, and population size.
Gender
Testing for latent mean differences of a measurement model involves five
steps. The first three steps are the same as the first three steps in the test of
factorial invariance. However, with the Apros group sample it was not possible to
perform the first two steps as there was only one dependent factor (financial
capital) and to test a measurement instrument with confirmatory factor analysis it
is necessary to have at least two factors even though a test of invariance of the
causal model revealed good fit. Therefore, testing for latent differences began
257
with the third step, which compares factor loadings between the two groups
(females and males) (see Table 7.20). There were no significant constraints.
The fourth step involves the test of the invariance of intercepts. All
previous equality constraints are retained except those found to be noninvariant
(none in this case). The variance for the constant V999 is fixed to 1.0. No
significant constraints were found.
The fifth step involved testing for the invariance of latent factor means.
The averages for the two groups were not significantly different (z statistic for
financial capital = -.33, n.s.). The negative z statistic denoted that female group
loans create less financial capital on average. This result agreed with the previous
group loans sample. In both samples the male group had few cases.
Table 7.20
Latent Mean Differences of the Measurement Model for Gender, Apros Group
Loans
Samples, Models and Tests S-B χ2 probability
CFI RMSEA
Testing for measurement invariance of factor loadings: covariances for female sample only; 110 cases.
.47 1.000 .000
Testing for invariance of intercepts: covariances for female sample only; 110 cases.
.75 1.000 .000
Testing for invariance of latent factor means: covariances for female sample only; 110 cases.
.64 1.000 .000
Robust statistics were used (normal maximum likelihood (ML)). S-B χ2 = Satorra-Bentler scaled chi-square.
258
Group Composition
As with the comparison for gender above, testing for latent mean
differences began with a comparison of factor loadings between the three groups:
all-female groups; mixed groups with more than 60 percent female members; and
groups with less than 61 percent female members (see Table 7.21). There was one
significant constraint for the profit item (p = .03) in the case of all-female groups
and groups with a greater proportion of males. In testing for the invariance of
intercepts there were no significant constraints. All previous constraints had been
retained except the above significant constraint. The last step involved testing for
invariance of latent factor means. The averages for the groups were not
significantly different (z statistic for financial capital = -1.47, n.s.). The negative z
statistic denoted that groups with more females create less financial capital on
average. A test of the invariance of latent factor means was done for only two
groups and revealed that the average of all-female groups was not significantly
different from groups with a greater proportion of males (z = -1.84; n.s.) and from
mixed groups with more females (z = -.55; n.s.), although the first means
comparison is almost significant (p = .07).
259
Table 7.21
Latent Mean Differences of the Measurement Model for Group Composition,
Apros Group Loans
Samples, Models and Tests S-B χ2 probability
CFI RMSEA
Testing for measurement invariance of factor loadings: groups with 100% females (89 cases); 92-63% females (46 cases); and 60-0% females (47 cases).
.12 .982 .117
Testing for invariance of intercepts: groups with 100% females (89 cases); 92-63% females (46 cases); and 60-0% females (47 cases).
.31 .984 .146
Testing for invariance of latent factor means: groups with 100% females (89 cases); 92-63% females (46 cases); and 60-0% females (47 cases).
.20 .975 .160
Robust statistics were used (normal maximum likelihood (ML)). S-B χ2 = Satorra-Bentler scaled chi-square.
Environment
Testing for latent mean differences began with a comparison of factor
loadings between the three groups: clients in small and medium-sized towns (less
than 10,000 people); clients in large towns and very small cities (between 10,000
and 30,000 people); and in small cities and large cities (more than 30,000 people)
(Table 7.22). There were no significant constraints. In testing for the invariance of
intercepts there were also no significant constraints. The last step involved the
testing for invariance of latent factor means. The averages for the groups were
significantly different (z statistic for financial capital = 1.98, p < .05). Groups in
260
small to large towns created significantly more financial capital on average than
the other two environments with larger populations. This was only just significant.
A test of the invariance of latent factor means was done for only two groups and
revealed that the average for small to large towns was not significantly different
from large towns to very small cities (z = 1.43, n.s.) and also from small to large
cities (z = 1.86, n.s.), although the difference with larger populations is almost
significant (p = .06).
Table 7.22
Latent Mean Differences of the Measurement Model for Environment, Apros
Group Loans
Samples, Models and Tests S-B χ2 probability
CFI RMSEA
Testing for measurement invariance of factor loadings: small to medium-sized towns (73 cases); large towns to very small cities (66 cases); and small to large cities (43 cases).
.86 1.000 .000
Testing for invariance of intercepts: small to medium-sized towns (73 cases); large towns to very small cities (66 cases); and small to large cities (43 cases).
.54 1.000 .000
Testing for invariance of latent factor means: small to medium-sized towns (73 cases); large towns to very small cities (66 cases); and small to large cities (43 cases).
.77 1.000 .000
Robust statistics were used (normal maximum likelihood (ML)). S-B χ2 = Satorra-Bentler scaled chi-square.
261
7.8 Conclusions
This chapter covers the results for the Apros group loans sample, the
second of the group loans samples that test Hypotheses 2 to 5. Hypothesis 2 states
that all-female groups or groups with a greater proportion of females will
experience higher levels of group participation. Group participation is highly
related to social relations. Solidarity, originally an item intended for group
participation, loads with group relations and community relations. All items for
group participation in the larger Apros sample loaded with items for group
relations and community relations suggesting that all these items belong to the
same construct and will possibly load together in larger samples. Therefore, social
relations would appear to encompass group participation.
The independent samples t-tests did not support Hypothesis 2 as groups
with the the greater proportion of male members (more than 39 percent) had the
highest means for social relations items and were significantly higher in solidarity
(t = 2.11, p < .05) than mixed groups that had the greater proportion of females
(more than 60 percent). ANOVAs for group composition and social relations were
not significant. Although groups with a greater proportion of females had higher
means for group relations and community relations in the previous group loans
sample, none of the t-tests or ANOVAS in that sample was significant. The t score
for solidarity was almost exactly the same for both groups. There is no evidence
that groups with a greater proportion of female members place more emphasis on
262
group or community relations or on group participation and, therefore, there is no
support for Hypothesis 2 in both group loans samples.
Hypothesis 3 states that groups with a greater proportion of females will
experience more peer-group and community pressure. The factor analysis
indicated that group and community sanctions were distinct from group and
community relations and that items for group participation were related to items
for group and community relations. Items for sanctions represent the best
measures of group and community pressure. All-female groups did have a greater
tendency to impose sanctions than the other two group categories, although
community sanctions and community reputation did not have a significant
difference between categories. However, all-female groups did have a significant
tendency to impose more group sanctions (t = -2.08, p < .05) than mixed groups
with more males. There was some agreement with the previous group loans
sample in that groups with a greater proportion of females in that sample did have
a greater likelihood of imposing sanctions than groups with fewer females even if
the t-tests and ANOVAs were not significant. Therefore, without including
sanctions originating in the community and taking into account that the previous
group loans sample was smaller and composed of almost no mixed groups that
had more than 50 percent male members, there is tentative support that groups
with a greater proportion of females impose more group sanctions (but not
community sanctions).
Hypotheses 4 states that capital creation will not differ between groups
with a greater proportion of females and groups with a smaller proportion of
263
females, even though traditional wisdom and theory indicates that males will
create more capital. In the previous sample there was virtually no difference
between the two categories for the gender composition of groups in the creation of
sales and savings, although groups with more males performed better with profits
on average (t = 1.26, n.s.). However, none of the t-tests and ANOVAS for
financial capital creation was significant. In the Apros sample groups with a
greater proportion of males created more sales, profits and savings on average and
all-female groups were the lowest for all these three financial capital items.
However, the t-tests to compare these two categories were not significant, but they
came very close. ANOVAs were also not significant in the Apros sample.
In the previous group loans sample the test of latent mean differences
revealed that males with group loans will create more capital than females with
group loans, and that groups with more males (at least 20 percent male members)
will create more capital than groups with less males (less than 20 percent male
members). However, the z statistics for both comparisons involving latent mean
differences were not significant. The test of latent mean differences in the Apros
sample agreed with the above results in the previous sample. Males created more
capital than females on average and groups with a greater proportion of males
created more capital than groups with a greater proportion of females, although
the results were not significant. This test of latent mean differences was almost
significant between groups with a greater proportion of males and all-female
groups. Possibly a larger sample that included a greater proportion of groups with
at least 50 percent male members would have found significant differences in
264
financial capital creation. However, because none of the results were significant
over the two samples, for the time being I conclude that there is no significant
evidence that capital creation is determined by the gender composition of a group.
This result supports Hypothesis 4.
Finally, Hypothesis 5 states that clients with group loans in smaller
populations will create more capital than clients with group loans in larger
populations. In the previous group loans sample all items for capital creation were
highly significant in favour of rural clients for both t-tests and ANOVASs. In the
Apros sample clients in small and medium-sized towns created significantly more
sales (t = 2.22, p < .05) than clients in small to large cities and savings were also
higher (t = 1.94, p = .06), but not quite significant. ANOVAs with the Apros
sample were not significant in relation to financial capital creation.
In the previous sample, the test of latent mean differences of the capital
items for both models indicated that there was a significant difference in the
averages for financial capital creation between the two environments. Rural
groups created significantly more financial capital than urban groups. Also, the
test of latent mean differences with the Apros sample revealed that groups in the
smallest rural populations created significantly more capital than the other two
groups in larger populations. Therefore, these findings support Hypothesis 5.
In conclusion, social relations and financial capital creation were not
significantly different when the gender composition of a group was examined,
although groups with a greater proportion of males on average tended to
emphasise social relations more and created more financial capital. In contrast,
265
all-female groups were significantly more likely to impose group sanctions than
groups with at least 40 percent male members. There were no significant
differences for gender composition in relation to community sanctions. Finally,
groups from rural areas also created significantly more capital than those from
urban populations of more than 30,000 people.
266
CHAPTER 8: DISCUSSION AND CONCLUSIONS
8.1 Introduction
The first section of this final chapter discusses the contribution this study
makes to the theoretical literature and proposes topics for further research. This
discussion follows the themes that deal with the different hypotheses I have
tested, includes a proposal for investigating individual loans in different
environments, and ends by commenting on the causal models for both group loan
samples. In the second section I consider the implications of my findings for
practice. Finally, I will deliberate over the limitations of this study and make my
closing conclusions.
8.2 Contribution and Implications for Theory and Research
Gender, Individual Loans and Capital Creation
Traditional theories concerned with gender explain why male business
owners generally create more capital than female business owners (Bird et al.,
2001). To test this assumption, questionnaires were collected from microfinance
clients with individual loans in Mexico City. Neither the test of latent mean
267
differences with EQS nor t-tests revealed any significant difference in the creation
of financial capital between males and females. In contrast to traditional theories,
male-owned businesses in this sample actually possessed almost no significant
advantages. They did have significantly more loans in other organisations, but
access to other loans had very little correlation with the financial capital items.
A proxy for business experience or human capital would be the age of a
business, but there were no significant differences between male- and female-
owned businesses for business age. Sales actually had a significant negative
correlation with business age, while profits had a non-significant negative
correlation. Such results question the value of human capital theory (Jacobsen,
1998; Kalleberg & Leicht, 1991; Loscocco et al., 1991) in a micro-enterprise
context in developing countries. It is possible that even though no significant
differences were found for business age that males over the years had invested
significantly more time in attending to their businesses, while females had been
diverted more by family obligations, however, if this was so the accumulation of
human capital on behalf of males was not evident in the results. Also, there would
still be a positive correlation between business age and financial capital creation if
business experience was a dominant control variable.
Social network theory states that males invest more time into instrumental
relationships that contribute to capital creation, whereas females invest more time
in inter-personal relationships that are not business relevant (Brush, 1992; Moore,
1990; Worchel et al., 2002). This assumption was not tested directly although four
social capital items were included in the questionnaire. These social capital items
268
did not distinguish between instrumental relationships and inter-personal. The
social capital construct, composed of three items, did have goodness-of-fit in an
alternative model for individual loans, but this construct was eliminated in order
to have agreement with the measurement models between the three samples
collected. Males scored significantly higher for the meetings item (t = 2.02, p <
.05), which represented social gatherings in restaurants, other people’s houses or
public places. The forming of new close friends, probably comprised of inter-
personal relationships, but also possibly instrumental, was almost significant in
favour of males (t = 1.77, p = .08). An initial test of latent mean differences,
which included both financial capital and social capital constructs, revealed that
there was no significant difference between males and females in social capital
creation (z = -1.731, p = .08), although this test was close to being significant.
However, if males did enjoy advantages in instrumental relationships, this
advantage was not translated into a significant difference in financial capital
creation. In order to explore further the influence of social networks on male and
female-owned businesses, future research could differentiate between
instrumental and inter-personal relationships in the context of microfinance and
micro-entrepreneurs in developing countries to confirm whether males in this
context do in fact enjoy more instrumental relationships and whether such
relationships have a significant influence on economic and human capital
creation.
Finally, the theory of organisational ecology states that female-owned
businesses will be confined to smaller, less established businesses in more
“solidarity”, “aid”, “caring for others”, “sympathy for the weak”, “equality”,
“consensus”, “common solutions”, “compromise”, and “negotiation”. A figure
reveals that Mexico is about the fifth most masculine country in Hofstede’s (1992,
p. 109) list of 40 countries. This point about a difference between the values of
males and females in masculine countries is important and must be stressed again.
272
Hofstede (1992, p. 105) states, for example, that “the more an entire society
scores to the masculine (MAS) side, the wider the gap between its “men’s” and
“women’s” values.” Hofstede (1980, pp. 261-262) also adds that “countries with
higher MAS values also show greater differences in values between men and
women in the same jobs.”52 If females do possess more feminine values in
Mexico, females should exhibit a higher level of cooperation and solidarity in
groups that should aid them in capital creation.
First of all I checked whether there was a significant difference for the two
femininity items I had included. In the CAME group loans sample the two items
for femininity had acceptable loadings with a factor analysis (above .63)53 and an
acceptable Cronbach’s alpha (.72). However, there was no significant difference
between the averages for males and females. The Cronbach’s alpha for these two
items in the Apros sample was too low (.55). Because there were few males in
these samples, I also examined the CAME individual loans sample. Factor
analysis loadings were above .62 and Cronbach’s alpha was just acceptable (.66).
T-tests revealed no significant differences between males and females.
Hofstede (1980, p. 291) also points out that the division in values between
the sexes is greatest when adults are youngest, around 20 years old, with males
being more masculine. Masculinity then tends to decline for both sexes until about
the age of 45 when masculine values between the sexes are no longer different.
Masculinity continues to drop slightly into old age but there is no longer any
52 For a visual example of the masculinity index for gender and countries see Hofstede (1980, p. 288). 53 The factor analysis solution utilised was an adjusted principal components analysis (EPIC) with a direct oblimin rotation method.
273
difference between the sexes. Therefore, as age might be a factor in the non-
significant results I had for the femininity values above, I decided to examine
whether younger females had higher levels of femininity. There seemed to be no
indications that younger females were higher in femininity. Across all three
samples, correlations between age and the femininity items were almost zero; the
youngest males (20-37 years old) had higher average scores for femininity than
the same age group for females; and the youngest clients (20-37 years old) were
not significantly different in femininity than the oldest clients (48-75 years old).
There was no evidence that the Mexican males in the sample were more
masculine or assertive or that females stressed interpersonal relationships and
interdependence more in their values (Hofstede, 1997; Powell & Greenhaus,
2010).
These results indicated that in this segment of the population in central
Mexico both males and females were high in feminine values. Hofstede (1997, p.
104) suggests that Central American countries are feminine in their values,
however, he concludes that “most of Mexico would have inherited the tough
Aztec culture” (p. 105). In fact the Aztecs only dominated a region in central
Mexico for a relatively brief period. The South of Mexico was influenced to some
extent by the militaristic Aztecs and Toltecs from central Mexico, but was and is
culturally distinct. Indigenous inhabitants are more numerous in southern Mexico
and they would appear to have more feminine values. Poorer areas of Mexico City
have been populated by recent immigrants from rural areas, many from the South,
whose families may have only recently been integrated into the national mestizo
274
culture over the space of a few generations. Many of the poor in Mexico may have
preserved more values in common with their pre-hispanic roots and such
segments of the population may differ in their values from the upper classes, the
upper middle classes and the Mexican executives of Hofstede’s IBM study.
Further research on the dominant cultural values at the base of the pyramid in
Mexico are needed in order to be able to compare this segment of the population
with other social classes and other Mexican ethnic groups. As both males and
females across the three samples were high in feminine values, interpersonal
relationships and cooperation would have been emphasised in groups and,
consequently, group and community relations would be seen as important in all
groups regardless of gender composition.
Gender Composition of Groups and Sanctions
Very little research has been conducted on gender differences in relation to
peer-group pressure. Some microfinance literature suggests that females are more
sensitive to criticism and that females in groups will pressure each other more
than males and for this reason females have higher repayment rates (Armendáriz
de Aghion & Morduch, 2000, 2005; Rahman, 1999). As I have discussed in the
above section, the results for the two femininity items suggest that there are no
significant differences in values between males and females in this study, so any
differences in the threat of sanctions between groups with a greater proportion of
females cannot be related to this cultural dimension.
275
Over both samples clients in groups with a greater proportion of females
were generally more likely to experience sanctions, although this was only
significant in one instance. The group sanctions item was significantly higher for
all-female groups (t = -2.08; p < .05) in the Apros sample when compared to
groups with a greater proportion of males. Almost all the groups in the CAME
sample had more than 50 percent female members so categories for gender
composition were going to have more similarities. The gender composition of
groups appeared to have no significant relationship with community sanctions.
However, the gender composition of groups may influence sanctions that come
from within the group.
Further research is needed to test whether this is so. If possible, larger
samples could compare groups consisting of more than 50 percent male members
with all-female groups. A questionnaire on this theme could contain items related
to the level of the respondent’s sensitivity towards criticism and to the probability
of the respondent pressuring other group members. My questionnaire asked only
about the probability of other members pressuring group members. More items
could also be tested and included related to sanctions from within the group.
Gender Composition of Groups and Financial Capital Creation
According to traditional literature, male business owners have significant
advantages over female business owners in capital creation. However, there is
some debate in the microfinance literature as to whether males have a distinct
276
advantage when females have access to group loans (Clark, 1991; Haase, 2006;
Kevane & Wydick, 2001; Matienzo, 1993; Wydick, 2002). I predict in my
discussion for the fourth hypothesis that higher levels of participation in groups
with a greater proportion of females and greater female sensitivity to group and
community pressure evens the playing field in regards to capital creation. Such
tendencies could be explained by higher feminine values in the case of Mexican
females, which manifests in a greater concern for inter-personal relationships
(Hofstede, 1997; Powell & Greenhaus, 2010). However, feminine values were not
found to differ between the Mexican males and females in this sample, nor do the
results for the social relations construct suggest that groups with a greater
proportion of females place more emphasis on harmonious group and community
relations.
Results for financial capital creation indicate that there are no significant
differences according to the gender composition of a group. However, as I have
already mentioned, there was very little difference between the gender
composition of groups in the CAME sample. Secondly, a comparison between
groups with a greater proportion of males and all-female groups in the Apros
sample revealed that there was almost a significant difference for all three
financial capital items and that all-female groups generated less capital. The test
of latent mean differences between these two extreme categories was also almost
significant (z = -1.84, p = .07). As males in this sample were found to be similar to
females in regard to feminine values, which are conducive to harmonious group
processes, then they may have still enjoyed some of the advantages that are
277
explained by the traditional theories on gender and business success. A larger
sample would most likely indicate significant differences that demonstrate the
value of having males in microfinance groups. However, as is the case with
individual loans, the gender gap is not as wide as would be expected, although
group loans may actually accelerate the capital creation of individuals (Kevane
and Wydick, 2001).
Group Loans, Environment and Financial Capital Creation
If society in rural environments is more collectivistic as some literature
indicates, it would seem logical that group loans are better suited to rural
environments. In collectivist cultures relationships prevail over tasks and such
values would appear to be compatible with group loans (Hatch & Cunliffe, 2006;
Hofstede, 2001). Some authors state that rural areas tend to be more collectivistic
than urban areas (Erez & Somech, 1996; Hofstede, 1997, pp. 65, 74). My
exploratory study (Griffin, 2008) indicates that peer-group and community
pressure is higher in rural areas, where traditions and social ties are more binding,
than in urban areas. However, my results reveal that sanctions are not beneficial
for punctual repayment rates and financial capital creation. Because communities
in rural areas are more socially cohesive, group members will probably
communicate more together and be able to interchange ideas and knowledge to a
greater extent contributing to the creation of human capital. My results reveal that
intra-group learning is highly related to a concern for healthy group and
278
community relations, and that relations increase repayment rates and in turn
financial capital.
There were, however, problems with the validity and reliability of items
for collectivism and individualism. Across all three samples, the items for
collectivism and individualism had generally low loadings and low reliability and,
therefore, it is not possible to provide any evidence related to these cultural
dimensions. Future surveys conducted in a similar context, which include various
items for each of these cultural dimensions would be valuable. Such research
should take into account environmental, socio-economic and ethnic differences.
Also, looking at feminine values and environment, both samples revealed no
significant differences when comparing urban and rural environments.
Results reveal that there is a tendency for groups in rural areas and very
small cities to experience higher levels of sanctions and relations than in larger
urban areas with more than 30,000 people, although the results are not always
significant. Results for the CAME sample revealed that all items for sanctions and
relations (including the learning item) were higher for rural groups, although
learning was the only social relations item significantly higher (t = 2.49; p <
.05).54 Group sanctions (t = 2.02; p < .05) and community sanctions (t = 3.12; p <
.01) were very significantly higher for rural groups. The Apros sample indicated
that large towns and very small cities had the highest averages for sanctions and
relations (including the learning item). Relations in large towns and very small
cities were very significantly more important than relations in cities bigger than
54 The learning ítem was removed from group models in the CAME and Apros samples as the CAME construct for group and community relations had problems with construct validity.
279
30,000 people. Relations in small and medium-sized towns were also significantly
higher in importance than relations in the largest cities for two items and almost
significant for the third. However, because sanctions were also higher in large
towns and very small cities, this may have given small and medium-sized towns
an advantage in financial capital creation.
It would appear that in the smallest communities there is a tendency to
avoid sanctions, whereas social relations are still important. In very small cities,
social relations are important, but community members are more inclined to
impose sanctions. In the larger cities, it may be more difficult to impose sanctions,
whereas social relations are less important. Although, sanctions lower repayments
and financial capital, harmonious social relations and intra-group learning would
appear to override the adverse implications of sanctions. In both group loan
models the path between relations and repayments is more significant than the
path between sanctions and repayments. Overall, the test of latent mean
differences demonstrated that groups in the smallest populations generated
significantly more financial capital in both samples.
Individual Loans and the Environment
If rural dwellers are more collectivistic and urban dwellers more
individualistic as some literature suggests (Erez & Somech, 1996; Hofstede, 1997,
pp. 65, 74), then individual loans should be better suited to large cities. In an
individualistic culture, “identity is based in the individual” and the “economy (is)
280
based on individual interests” (Hofstede, 1997, pp. 67, 73). However, the items
for cultural dimensions lacked validity and reliability to test whether there really
are cultural differences based on population density. Also, a sample that I
collected to compare rural and urban individual loans proved to be too small.
Therefore, a comparison of individual loans across environments is a pertinent
topic for future research.
Causal Models
The paths in my causal models were not included in my hypotheses.
Causal models were obtained for each sample in order to justify the relationship
of the independent variables with the mediating and dependent variables; to
provide a rigorous process of operationalisation for my construct items that
included agreement between the different samples; to verify appropriate fit and
sample size with the critical N; and to test for the influence of control variables.
However, it is fitting to comment on my models as they enhance the contribution
of this study.
Microfinance literature tends to point to peer-group pressure (or joint
liability), screening and monitoring as the key components of microfinance
According to Hermes and Lensink (2007, p. F3) “several theoretical models (e.g.
Stiglitz, 1990; Varian, 1990) confirm that joint liability group lending leads to
more and more effective screening, monitoring and enforcement among group
281
members.” They also comment on “some other models (that) specifically discuss
the role of social ties within group lending in improving repayment performance
of groups. The work of Besley and Coate (1995) and Wydick (2001) fall into this
category of models.”
Besley and Coate (1995, pp. 13-14) present their model in the form of
econometric theory, which leads them to the common assumption that “if social
penalties are severe enough, group lending will result in a higher repayment rate
than individual lending.” They conclude that “this may explain why group lending
is often advocated for rural lending in developing countries, where social
connectedness among communities is typically high.” However, they are unsure
about the connection between repayment rates and welfare. Although they focus
on social connectedness, this has an impact in the form of social penalties or the
“wrath of other group members” (Besley and Coate, 1995, p.16).
Wydick (2001) develops a game-theoretic model developed from field
research gathered in Guatemala. He emphasizes screening, monitoring, the threat
of group expulsion, mutual aid and the threat of social sanctions. Although
Wydick (2001, p. 13) includes “aid (by the group) of their own who appear
victims of unavoidable shocks” (mutual aid) as a contributing factor towards high
repayment rates, he highlights that “it is important to understand that the credible
threat by the lending institution to deny credit to expelled group members and
defaulting groups provides the backbone for a borrowing group’s internal
discipline.” Therefore, these theoretical models that underline the workings of
282
social ties in groups basically argue that these ties mainly impact repayment rates
in the form of sanctions.
Other authors gathered empirical data and comment on social ties in
microfinance. Zeller (1998) collected data from 146 groups in Madagascar to
conclude that higher repayment rates were prominent in groups with stronger ties.
Wydick (1999) finds that social ties within 137 groups in Guatemala lower the
peer pressure that coerces group members to repay. Karlan (2007) takes advantage
of a quasi-random group formation process in Peru and finds that members with
supposedly strong ties, those who live in a close proximity to each other or belong
to the same culture, generate higher repayment rates and savings. Cassar, Crowley
and Wydick’s (2007) trust and microfinance games involve 498 group members
in 36 groups in South Africa and Armenia. They find that trust between group
members and group homogeneity affects group repayment rates more so than
societal trust and familiarity with other members. Past experiences of mutual aid
also contribute to stable repayments. On the other hand, Ahlin and Townsend’s
(2007, p. F43) study of 262 groups in Thailand concludes on the
sometimes negative relationship (of repayment rates) with more benign
social ties such as relatedness and sharing. This is one of the most striking
aspects of the results for policy implications: strong social ties – measured
by sharing among non-relatives, cooperation, and clustering of relatives,
and village-run savings and loan institutions (PCGs) – having seemingly
adverse effects on repayment performance…..Social structures that enable
283
penalties can be helpful for repayment, while those which discourage them
can lower repayment.
These authors accept that weaknesses of their study is that the groups they study
have a fixed size of two, a pair of microfinance clients but not really a group, and
that their models are static. Some of their proxies are also questionable.
Hermes and Lensink (2007, p. F3) point out that
In spite of the abundance of theoretical literature, there has been
surprisingly little empirical evidence of whether and how microfinance
actually helps to reduce existing information asymmetries. This is at least
partly due to the difficulty of obtaining reliable data on the working of these
programmes and the behaviour of their participants. Most of the available
empirical studies address the general question of whether joint liability
lending improves repayment performance of groups, using different types of
proxies for screening, monitoring and enforcement behaviour taking place
within groups.
Theory has generally ignored the positive aspects of group participation;
and social relations and sanctions outside the group, a trend partly countered by
the theory of Besley and Coate (1995) above. Believing that the positive aspects
of group cooperation and also community pressure may be important, I started out
with a conceptual model that separated peer-group pressure, community pressure
284
and group participation. However, clients do not appear to distinguish between
group and community relations and between group and community sanctions. The
final structural equation model in both group loans samples that connects group
and community forces with financial capital creation indicates that these social
relations are integral.
Some commentators (Barboza & Barreto, 2006; McKernan, 2002) have
mentioned intra-group learning (learning by association or peer mentoring) as a
possible factor in improving repayments and capital creation, but overall the
creation of human capital in groups has generally been a theme and a key success
factor neglected in the literature. Barboza and Barreto (2006, p. 330), however,
also suggest that “endogenous learning” takes place “as participants with initial
high probability of success share their knowledge and generate an endogenous
learning process that improves the probability of repayment of the remaining
group and centre members.” They estimated performance by means of repayment
rates in Chiapas, Mexico, while McKernan (2002) estimated a non-credit effect on
profits in Bangladesh without identifying categories for non-credit effects and
their proportional input. I included peer mentoring (learning by association) as an
item and measured the relationship of its construct with repayments and financial
capital. The learning item was later omitted as there were problems related to
construct validity in the smaller CAME group loans sample. A smaller sample can
only support a more limited number of parameters between items and constructs.
However, I was able to demonstrate that the learning item did have construct
285
validity in the larger Apros group loans sample and loaded on the factor for group
and community relations.
Hermes and Lensink (2007, p. F4) also argue that
(empirical studies on joint liability lending) suffer from a number of
potential weaknesses. First, in most papers the link between theory and
empirics is rather implicit. Many of the variables used to measure group
member behaviour in terms of screening, monitoring and enforcement are
only indirectly related to the contents of these concepts from a theoretical
perspective. Moreover, in several cases crude, or at least one-dimensional,
measures are used to proxy for complex constructs such as social ties.
I developed the learning item as I could not find a similar item in other
microfinance surveys. The same was the case for the item concerning attendance
and punctuality in group meetings. Ahlin and Townsend (2007) had included
decision-making items to measure three decision-making situations that Thai
farmers might find themselves in, so I adapted this to a non-agricultural context
for group loan decision-making. In the larger sample all of these items loaded well
with group and community relations items indicating there is no conceptual
division and suggesting that these items could be useful for future research on
group behaviour in microfinance. From the perspective of the micro-entrepreneur,
intra-group learning in microfinance and items for group participation (mutual
286
aid, solidarity, decision-making and punctuality) do not appear to be distinguished
from general group and community relations.
Although peer-group pressure is emphasised in the literature, the
assumption that peer-group pressure contributes to superior repayment rates and
capital creation must be questioned by the results in this study. The two group
samples agreed with a final model rigorously defined by confirmatory factor
analysis, construct validity measurements and goodness-of-fit indicators. Both
samples indicate that group and community sanctions lower repayment rates,
although this is not significant in the smaller CAME group loans sample.
Sanctions would in turn lower the creation of financial capital if it were not for the
beneficial influence of group and community relations. This is because good
repayment rates have a positive relationship with financial capital suggesting that
having groups with good payment records, apparently the vast majority of group
loans in both MFIs, may be effective in promoting economic development at the
level of the entrepreneur. Bruton, Khavul and Chavez (2011, p. 37) comment that
a number of recent studies have tried to untangle the effect of group
relationship on repayment rates (Ahlin & Townsend, 2007; Cassar et al.,
2007; Karlan, 2007), and future research should also look beyond
repayment rates in trying to understand whether the nature of the group
also affects the growth and survival potential of the businesses that
borrowers start.
287
In order to test whether high repayment rates caused financial capital creation or
were the result of higher levels of financial capital formation, I tested a model that
included all the same constructs from the final model but arranged financial
capital as the mediating variable and repayments as the dependent variable. This
model had inferior goodness-of-fit.
Further research should also develop structural equation models that
incorporate constructs representing screening and monitoring. Monitoring had a
significant correlation with all items for financial capital creation in both group
loan samples, whereas screening was significant with all items in the Apros
sample and one item in the CAME sample. However, from my own experience of
collecting first hand all the group loans questionnaires for the CAME sample,
clients in village bank-size groups of between 10 and 50 members reacted as if it
was almost impossible to have knowledge about the business of another client in
such large groups. Therefore, although significant relationships were found
between monitoring and financial capital in this sample, scores for monitoring
were skewed around the lowest possible score and, therefore, must be regarded
with extreme caution. Monitoring might be significant, but it seems to almost
rarely take place to any relevant extent. The frequency of group meetings also had
a high correlation with all items and with repayments. Overall, theory suggests
monitoring and screening are important factors, so their relationship with the
constructs present in my model should be clarified in future research.
288
8.3 Implications for Practice
The results of this study indicate that the gap between males and females
in this Mexican context is not as wide as some of the literature suggests and,
therefore, both genders represent worthy borrowers for both individual loans and
group loans. Loans to females may be a more efficient means of improving the
nutrition, health and education of children, but both sexes represent attractive
clients for MFIs. The view that females are universally more responsible with
loans and have superior repayment rates, except curiously in the case of
Indonesia, is questioned by this study (Khan, 1999; Remenyi, 2000; Rosintan et
al., 1999). In both group loans samples, although results were not significant, MFI
staff indicated that male clients had higher repayment rates. However, staff
opinions may subconsciously favour males, so a more precise measurement of
repayment rates is also required. In regards to group loans, males add to the
productivity of a group and their presence would appear to benefit females. This
may be more so in the case of solidarity groups of between 5 to 10 members and
less so in the case of village bank groups of over 15 clients, although further
research with larger samples could confirm this.
Males were a minority in both MFIs in this study representing roughly
between 13 to 20 percent of all group members. Considering their relative
success, one must ask why there are so few males with group loans. Are males
less interested in micro-loans because they have more opportunities or are a
greater proportion of males weeded out because they are initially found to be
289
riskier prospects by MFI staff? Such questions are worthy of further investigation.
If males are actually just as reliable as females, they represent a huge potential
market in countries such as Mexico.
This study suggests that MFIs should benefit by concentrating on
harmonious relations within groups and with the community in general. Those
aspects that relate to social pressure on individuals on behalf of the group should
be discouraged if possible. Group members should also be discouraged from
applying pressure on other members through their family, friends and other
community members. Possibly when each new cycle begins, in the initial meeting
staff could encourage harmonious relations through the promotion of incentives
involving group cooperation and by sponsoring community projects that involve
group members. Unconstructive criticism within the group, threats of expulsion
and other potential sanctions could be discouraged through training sessions that
promote solidarity.
Finally, rural groups were significantly higher in financial capital creation
than urban groups suggesting that economic conditions in rural areas in Mexico
may be more dynamic than popular paradigms about rural areas would have us
believe. Urban environments are generally credited with offering more economic
opportunities for microfinance clients (Armendáriz de Aghion & Morduch, 2005;
Khandker et al., 1995; Morduch, 1999). My results contrast dramatically with
those based on repayment rates in Chiapas that describe a lack of opportunities
and services in rural areas, including limited access to markets (Barboza &
Barreto, 2006; Barboza & Trejos, 2009). Chiapas, on the southern border, shares
290
Guatemala’s indigenous heritage and is renowned for being Mexico’s poorest
state. This study in central Mexico found that rural microfinance clients not only
had access to loans from various competing MFIs, but also had access to
educational programs. Moreover, repayment rates were significantly higher in
rural areas than in the largest populations pointing out that rural environments in
this region may be more attractive from the point of view of the MFI. This may be
especially true during times of economic recession. Microfinance loans may be an
effective means of countering rural unemployment and a traditional lack of
opportunities in rural areas that has contributed to severe population density in
Mexico City and an overall exodus to larger Mexican cities and to the United
States. Although the money that relatives send from the United States can be an
important source of capital for state economies, academics argue that overall
migration has adverse consequences for Mexico (Delgado Wise, Márquez
Covarrubias & Rodríguez Ramírez, 2009).
8.4 Limitations and Conclusions
This study had various limitations. First, caution should be exercised in
generalising my findings to other Mexican microfinance institutions, especially
those operating in the south and north of Mexico. This study includes only one
MFI with village bank-style loans, one with solidarity groups, and one with
individual loans.
291
Second, there was such a slight difference between the proportion of males
in the CAME group loans sample that such a comparison did not represent a
dramatic enough difference for a comparison of the gender composition of groups.
Only two groups (1.8 percent of all groups) had more than 50 percent male
members. The Apros group loans sample enabled a more distinct comparison.
However, even in this sample only 15 groups (8.2 percent of all groups) had a
composition of more than 50 percent male members.
Third, the Apros group loans sample mainly consisted of clients living in
towns and cities that had less than 40,000 people. Only 12 clients resided in cities
of more than 40,000 and all were located in Mexico City, one of the world’s
biggest cities. Therefore, the Apros sample did not include any clients living in
medium-sized cities of between say 100,000 and one million people nor did it
have enough clients residing in large cities.
Fourth, the questionnaire could be criticised because the respondents were
only asked about relative changes in capital and they were not asked for
information about specific income quantities in Mexican pesos. This may have
been possible in the case of economic capital, but would have involved numerous
questions concerning their present income and their income of one year ago.
Trying to obtain exact measures of income would have expanded and complicated
the questionnaire considerably. Also income, particularly in rural areas, tends to
vary according to the seasons. There are also concerns about whether clients
would have been able to recall exact income quantities of a year ago. Even if
clients could remember it is unlikely that they would have given a sincere answer
292
to such a sensitive question given the current situation regarding crime and
extortion in Mexico. To overcome such obstacles it was decided that one question
concerning the relative growth of physical capital, sales, profits, savings, and
employees over the last year would be asked. Such a decision may have been
justified because the financial capital factor had the highest construct validity of
the capital items. The social capital items were adopted from a World Bank study
that had been tested in many locations in the developing world. These items had
high validity and reliability in the pilot studies, however, only the financial capital
items passed all the rigorous tests of reliability, validity and goodness-of-fit.
Fifth, an item for human capital that was valid and reliable was eliminated
from the questionnaire to shorten it after the pilot study leaving the human capital
factor with only two items. It would have been wiser to keep this item as I later
learned that construct validity appears to be higher in structural equation modeling
when there are at least three items for a factor. Therefore, although my original
goal was to measure the formation of social and human capital, this was not
possible due to construct validity. However, the third item for human capital may
not have made a difference to construct validity tests as in the case of the four
social capital items. The item for employment generally loaded independently and
physical capital had cross loadings. A broader measurement of capital creation
could be included after a careful selection of items based on similar studies, the
incorporation of at least three items per factor, and the collection of a larger
sample.
293
Sixth, the items that were most problematic were those that represented the
cultural values of collectivism and individualism. If such cultural dimensions are
to be measured in a future study related to the bottom of the pyramid, I
recommend the selection of a greater variety of items after the careful
consideration of recent literature and surveys on collectivism and individualism.
Firstly, a pilot study should be conducted to test the reliability and validity of
these items.
In conclusion, this study revealed that there were no significant differences
between the sexes in the creation of financial capital with individual loans or
group loans. It is possible that a larger sample might reveal that males with
individual loans might create significantly more financial capital than females
with individual loans; and that groups with more than 50 percent male members
may generate significantly more financial capital than all-female groups.
However, as no significant differences were found in the economic performance
of male-owned and female-owned businesses in these samples, the gender gap
does not appear to be as wide as the literature indicates. Possibly, the advantages
that males have enjoyed in the past are diminishing and the playing field is
becoming more level or perhaps this segment of the Mexican population
represents an anomaly. Eking out a living in an often harsh and unpredictable
economic environment, poorer Mexican women have been known to be resilient,
tenacious and independent (Barry, 1992; Riding, 1985). Male-owned businesses
in this study tended to be more diversified according to business type, but apart
294
from this advantage, which would agree with the organizational ecology
perspective, males appeared to enjoy few advantages.
Group loans do not appear to reduce the gender gap. There is no evidence
that groups with a greater proportion of female members in central Mexico place
more importance on interpersonal relationships and cooperation either within their
groups or within the community. Also, groups with a greater proportion of female
members do not encourage more community sanctions, although they appear to
impose more sanctions from within the group. Finally, rural groups in central
Mexico created significantly more financial capital than urban groups in both
microfinance institutions. The results of this study question whether male-owned
microenterprises and urban environments in this region indeed have access to
significantly greater opportunities that accelerate economic capital creation.
Further studies are needed to explore and confirm these findings.
This study makes a further contribution by developing a causal model that
demonstrates that clients do not make a distinction between their group and their
community in regards to social relations and sanctions. The vast majority of
microfinance literature assumes, without empirical evidence, that repayment rates
are heightened by enforcement, screening and monitoring. Some literature argues
that social capital is a key factor in improving repayment rates, but often infers
that this inevitably takes place through pressure in the form of sanctions. This
study makes a key contribution to the empirical literature by finding that group
and community sanctions in fact tend to lower repayment rates. Furthermore, this
study reveals that it is harmonious social relations in the group and the community
295
that actually raises repayment rates. Screening may be related to group relations,
but it is doubtful that monitoring takes place in large groups with 15 or more
members. Screening and monitoring both appear to take place more frequently
and have more of an impact on capital creation with smaller solidarity groups. The
positive connection between repayment rates and financial capital creation, which
is assumed in the literature but not demonstrated empirically, is also confirmed in
the larger group sample in which staff members responsible for each group
directly answered the repayment rate question. Therefore, harmonious social
forces, such as solidarity and intra-group learning, improve the performance of
microfinance clients and microfinance institutions. However, contrary to the
inferences of the dominant literature in microfinance, the threat of sanctions
expressed through peer-group pressure retards economic development.
296
Appendix A: Initial Questionnaire Items
1. Dependent Variable: Capital Clients read the following statements and answer one of the following: 7. I strongly agree; 6. I moderately agree; 5. I mildly agree; 4. I neither agree nor disagree; 3. I mildly disagree; 2. I moderately disagree; 1. I strongly disagree. a.) Economic capital
1. You bought new equipment, tools, transport or infrastructure for your business in the last year.
2. Your business sales have increased over the last year. 3. Your business profits have increased over the last year. 4. Your loans from _________ (microfinance institution) have helped to
increase your savings. 5. You have more employees in your business now than one year ago.
b.) Human capital
1. You have improved your reading, writing or mathematical skills over the last year.
2. You have improved your business skills over the last year. 3. You have become aware of new or non-traditional types of work over the
last year. c.) Social capital.
1. You have made close friends over the last year. These are people you feel at ease with, can talk to about private matters, or call on for help.
2. The level of trust in your town/neighbourhood has gotten better over the last year.
3. Over the last year, you or any one in your household have participated more in any communal activities, in which people came together to do some work for the benefit of the community.
4. You make or receive more phone calls now than you did one year ago. 5. In the past year you have gotten together more frequently with people to
have food or drinks, either in their home or in a public place. 6. In the past year you have gotten together more frequently with people in
your town/neighbourhood to jointly petition government officials or political leaders for something benefiting the community.
2. Independent Variable: Loan Methodology
1. Do you presently receive group loans or individual loans? 2. Has your loan contract changed since you have been in the program? 3. If you answered yes to Question 2, when did your loan contract change?
297
(month and year) 4. If you answered yes to Question 2, what was your last loan contract?
(large groups (12 members or more), small groups (less than 12 members) or individual loans)
3. Moderating Variables: Gender and Environment A. Gender
1. What is your name? 2. Are you male or female? 3. If you have a group loan, how many group members are men and how
many are women? B. Environment
1. What is your address, general location and phone number? 2. Do you live in: the country; a town; a small city; a large city? 3. Is your business in: the country; a town; a small city; a large city?
4. Mediating Variables Clients read the following statements and answer one of the following: 7. Extremely likely; 6. Quite likely; 5. Slightly likely; 4. Neither likely nor unlikely; 3. Slightly unlikely; 2. Quite unlikely; 1. Extremely unlikely. A. Peer-Group Pressure
1. How likely do you think it is that other members of your group would exert pressure on a group member to encourage that member to repay if that member were to use a loan dishonestly and refuse to pay?
2. How likely do you think it is that pressuring a group member to repay a loan would be easy for the members of your group?
3. How likely do you think it is that your group would expel a member for failing to repay a loan?
4. How likely do you think it is that members of your group repay their loans to stay on good terms with other group members?
5. How likely do you think it is that members of your group who do not cooperate and participate with group activities will be criticised and sanctioned by other group members?
B. Community Pressure
1. How likely do you think it is that members of the community would exert pressure on a member of your group to encourage that member to repay if a member were to use a loan dishonestly and refuse to pay?
2. How likely do you think it is that members of your group repay their loans to stay on good terms with other members of the community?
298
3. How likely do you think it is that members of your group who do not cooperate and participate in your group activities will be criticised and sanctioned by members of the community?
4. How likely do you think it is that members of your group who do not repay their loans will not be able to obtain credit from other members of the community?
5. How likely do you think it is that members of your group who do not repay their loans will lose their reputation in the community?
C. Group Participation:
1. How likely do you think it is that if a group member could not repay a loan because of bad luck, illness etc., other members of your group would help to repay his/her loan?
2. How likely do you think it is that members of your group repay their loans because they feel they must stick together as a group?
3. How likely do you think it is that members of your group often learn from other group members?
4. How likely is it that all of the members of your group will have the final say when your group needs to make a decision?
5. How likely is it that all your group members will be punctual in attending your group meetings?
D. Repayment Rates (Question for MFI staff) MFI staff to answer this last question with the following scale: 7. I strongly agree; 6. I moderately agree; 5. I mildly agree; 4. I neither agree nor disagree; 3. I mildly disagree; 2. I moderately disagree; 1. I strongly disagree.
1. Over the last year this client/client’s group has been consistent in repaying his/her/their loans according to credit records.
5. Control Variables A. General
1. How old are you? 2. How many years of formal education have you completed beginning with
grade one elementary? 3. Can you read a newspaper? 4. Can you write a letter? 5. Are you married, divorced, separated, single, living with someone (union
libre), or widowed? 6. How many children do you have? 7. How old are your children?
299
B. Microfinance 1. What kind of business(es) do you manage personally? That is, what
products do you make or sell or what type of service do you provide? 2. How much of this/these business(es) do you own personally? 1.
everything (100%); 2. more than half (more than 50%); 3. half (50%); 4. less than half (less than 50%); 5. none (0%).
3. When did you join this microfinance program (month and year)? 4. How much was your present loan when you first received it? 5. How much time do you have to pay your present loan? 6. Most of the members of your group knew each other before
establishing your group (this question uses the same Likert scale as the Dependent Variable section).
7. If I asked you how much each member in your group sells each day, you would be able to tell me (this question uses the same Likert scale as the Dependent Variable section).
C. Cultural Dimensions Clients read the following statements and answer one of the following: 7. I strongly agree; 6. I moderately agree; 5. I mildly agree; 4. I neither agree nor disagree; 3. I mildly disagree; 2. I moderately disagree; 1. I strongly disagree.
1. It is important for me to work with people who cooperate well with one another.
2. It is important for me to work in a congenial and friendly atmosphere. 3. It is important for me to have an opportunity for high earnings. 4. Parents and children must stay together as much as possible. 5. It is my duty to take care of my family even when I have to sacrifice what
I want. 6. I feel good when I cooperate with others. 7. Winning is everything. 8. Competition is the law of nature. 9. I’d rather depend on myself than others.
300
Appendix B: CAME Individual Loans Survey in Spanish
CUESTIONARIO PARA CLIENTES CON UN PRÉSTAMO INDIVIDUAL La siguiente encuesta será usada para una investigación en la Escuela de Graduados en Administración y Dirección de Empresas (EGADE) del Tecnológico de Monterrey. El contenido de cada encuesta individual permanecerá estrictamente confidencial. Por favor conteste las siguientes preguntas, las cuales le tomarán 10 minutos de su tiempo.
Información General 1. ¿Cuál es su nombre? ____________________________________________ 2. ¿Cuál es su género? (marque o circule la letra de su respuesta) a. hombre b. mujer 3 ¿Cuántos años tiene?_______ 4. ¿Cuántos años de educación formal ha terminado, empezando con primero de primaria?________ 5. ¿Es usted: a. casada (o)? b. divorciada(o)? c. separada(o)? d. soltera(o)? e. viuda(o)? f. viviendo con su pareja en unión libre? 6. ¿Cuántos hijos tiene? _______ 7. Si tiene hijos, ¿Cuántos años tiene su hijo menor? _______
Información de Su Negocio 8. ¿A qué tipo de negocio(s) se dedica? Por ejemplo, ¿Qué tipo de producto(s) hace usted o vende o qué tipo de servicio(s) facilita? primer negocio:_________________________________________________ segundo negocio:________________________________________________ tercer negocio:__________________________________________________ 9. ¿Cuánto tiempo tiene(n) su(s) negocio(s)? primer negocio: ______ años ______meses segundo negocio: _______años ______meses tercer negocio: ______ años ______meses 10. ¿En qué cantidad de todos su(s) negocio(s) es usted la (el) dueña(o)? a. todo (100%) b. más de la mitad (más que 50%) c. la mitad (50%) d.menos de la mitad (menos que 50%) e. nada (0%)
301
Su Préstamo 11. Actualmente, ¿Qué tipo de préstamo usted tiene en CAME? (si tiene más que un préstamo por favor marque o circule las letras de su respuesta) a. un préstamo individual b. un préstamo de grupo c. un préstamo interciclo 12. ¿Por cuantos meses le autorizaron su préstamo individual en CAME? _____ 13. ¿Hace cuantos años (o meses) se inició el crédito con CAME? Años: _____ Meses: ______ 14. Actualmente ¿Usted tiene un préstamo en otras organizaciones? (si tiene más que un préstamo por favor marque o circule las letras de su respuesta) a. No b. Sí, un préstamo individual (para su negocio) c. Sí, un préstamo de grupo (para su negocio) d. Sí, otro tipo de préstamo (describa) ________________________ 15. ¿Ha cambiado su tipo de préstamo desde que usted empezó a recibir préstamos de CAME? Por ejemplo, ¿Ha cambiado de préstamos individuales a préstamos de grupo o de préstamos de grupo a préstamos individuales? a. Sí b. No 16. ¿Durante el último año, usted ha recibido los siguientes tipos de capacitación? i. capacitación empresarial a. Sí b. No ii. capacitación sobre la salud a. Sí b. No iii. otro tipo de capacitación a. Sí b. No
302
Seleccione (X) en el cuadro que mejor representa el grado en que usted personalmente está de acuerdo o en desacuerdo (lado derecho) con cada una de las ideas abajo presentadas.
Estoy totalmente de acuerdo
Estoy muy de acuerdo
Estoy algo de acuerdo
Estoy poco de acuerdo
Ni estoy de acuerdo, ni
estoy en desacuerdo
Estoy poco en
desacuerdo
Estoy algo en
desacuerdo
Estoy muy en
desacuerdo
Estoy total-mente en
desacuerdo
17. Durante el último año usted compró o instaló nuevo equipo, herramientas, transportación o infraestructura para su(s) negocio(s).
18. Durante el último año las ventas de su(s) negocio(s) se han incrementado.
19. Durante el último año las ganancias de su(s) negocio(s) se han incrementado.
20. Los prestamos recibidos de CAME han ayudado a incrementar sus ahorros durante el último año.
21. Tiene más empleados en su(s) negocio(s) ahora que hace un año.
22. Usted ha mejorado sus habilidades para hacer negocios durante el último año.
23. Usted se ha enterado sobre nuevas formas de trabajar o formas de trabajo no tradicionales durante el último año.
303
24. Usted se ha hecho de amigos cercanos en el último año. Estos amigos son personas con quien usted se siente a gusto, con quien usted puede platicar sobre asuntos privados, o con quien usted puede llamar cuando necesita ayuda.
25. El nivel de cercanía y confianza en su comunidad ha mejorado durante el último año.
26. Ahora usted hace o recibe más llamadas telefónicas que hace un año.
27. Durante el último año usted se ha reunido con más frecuencia de lo que lo hacía, con personas para comer o tomar bebidas en sus casas o en un lugar público.
Seleccione (X) en el cuadro que mejor representa el grado de frecuencia (lado derecho) de cada una de las ideas abajo presentadas.
Siempre Casi siempre Usualmente Algunas veces Casi nunca Nunca 28. Ganar es todo.
29. Es su deber cuidar de su familia aun cuando tenga que sacrificar lo que usted desea.
30. Prefiere usted depender de sí mismo que de otros.
31. Usted se siente bien cuando coopera con otros.
304
Por favor piense sobre un trabajo ideal…sin pensar en su trabajo actual. Para escoger su trabajo ideal, ¿qué tan importante sería considerar las siguientes ideas? Por favor seleccione (X) en el cuadro (lado derecho) que mejor representa su respuesta.
Es lo más importante
Es muy importante
Es algo importante
Es poco importante
Es muy poco importante
32. Es importante para usted trabajar con las personas que cooperan bien unos con otros.
33. Es importante para usted trabajar en un ambiente agradable y amistoso.
34. ¿De cuánto es el préstamo individual que tiene ahora con CAME? $________________ Para ser llenado por la encuestadora después de la entrevista: 35. ¿El cliente llenó el cuestionario solo? a. Sí b. No, la encuestadora leyó el cuestionario al cliente
305
Appendix C: CAME Individual Loans Survey in English
QUESTIONNAIRE FOR CLIENTS WITH AN INDIVIDUAL LOAN The following survey will be used for research purposes in the Graduate School of Administration and Business Management (EGADE) of the Tecnológico de Monterrey. The content of each individual questionnaire will remain strictly confidential. Please answer the following questions, which will take you about 10 minutes of your time.
General Information 1. What is your name? ____________________________________________ 2. What is your gender? (check or circle the letter of your answer) a. male b. female 3. How old are you? ___________ 4. How many years of formal education have you finished beginning with grade one in primary school? ___________ 5. Are you: a. married? b. divorced? c. separated? d. single? e. widowed? f. living with your partner without being married? 6. How many children do you have? ________ 7. If you have children, how old is your youngest child? ________
Information about your Business 8. What type of business do you have? For example, what type of products do you make or sell or what type of service do you provide? first business: ____________________________________________________ second business: __________________________________________________ third business: ____________________________________________________ 9. How old is (are) your business(es)? first business: ______ years _______ months second business: ______ years _______ months third business: ______ years _______ months 10. How much of all your business(es) do you own? a. everything (100%) b. more than half (more than 50%) c. half (50%) d. less than half (less than 50%) e. nothing (0%)
306
Your Loan 11. What type of loan do you have at the moment with CAME? (if you have more than one loan please check or circle the letters of your answer) a. an individual loan b. a group loan c. an inter-cycle loan 12. For how many months was your individual loan authorised in CAME? ________ 13. How many years (or months) ago did you initiate your credit with CAME? Years: ________ Months: _______ 14. At the moment do you have a loan in other organisations? (if you have more than one loan please check or circle the letters of your answer) a. No b. Yes, an individual loan (for your business) c. Yes, a group loan (for your business) d. Yes, another type of loan (describe it) _________________________________ 15. Have you changed your type of loan since you began to receive loans from CAME? For example, have you changed from individual loans to group loans or from group loans to individual loans? a. Yes b. No 16. During the last year, have you received the following types of training/education? i. business training/education a. Yes b. No ii. health training/education a. Yes b. No iii. another type of training/education a. Yes b. No
307
Select (X) the option that best represents the degree that you personally agree or disagree (right side) with each of the ideas below. I totally
agree I very
much agree I somewhat
agree I agree a
little I don’t
agree, but neither do I
disagree
I disagree a little
I somewhat disagree
I very much
disagree
I totally disagree
17. During the last year you bought or installed new equipment, tools, transportation or infrastructure for your business(es).
18. During the last year the sales of your business(es) have increased.
19. During the last year the profits of your business(es) have increased.
20. The loans received from CAME have helped to increase your savings during the last year.
21. You have more employees in your business(es) now than one year ago.
22. You have improved your business skills during the last year.
23. You have learned about new ways of working or non-traditional work techniques during the last year.
24. You have made close friends in the last year. These friends are people with whom you feel relaxed with, with whom you can talk to about private matters or who you can call when you need help.
308
25. The level of togetherness and trust in your community has improved during the last year.
26. Now you make and receive more telephone calls than one year ago.
27. During the last year you have got together with more frequency than what you used to with people to eat or drink in their homes or in a public place.
Select (X) the option that best represents the degree of frequency (right side) of each one of the ideas below.
Always Almost always
Usually Sometimes Almost never Never
28. Winning is everything
29. It is your duty to look after your family even when you have to sacrifice what you want.
30. You prefer to depend on yourself than others.
31. You feel fine when you cooperate with others.
309
Please think about your ideal job/work…without thinking about your present job/work. In order to choose your ideal job/work, how important are the following ideas to you? Please select (X) the option (right side) that best represents your choice.
It is extremely important
It is very important
It is somewhat important
It is slightly important
It is very slightly important
32. It is important for you to work with other people who cooperate well with each other.
33. It is important for you to work in a nice and friendly environment.
34. How much is the individual loan that you have with CAME now? $________________ To be filled out by the survey collector after the interview: 35. Did the client fill out the questionnaire by himself/herself? a. Yes b. No, the survey collector read the questionnaire to the client.
310
Appendix D: Correlations for CAME Individual Loans Table D.1 Pearson Correlations, CAME Individual Loans
Variables 1 2 3 4 5 6 7 8 9 10 11 12 13 14 15
1. Sex 1.00
2. Repayments -.01 1.00
3. Sales -.07 .12 1.00
4. Profits -.12 .04 .73** 1.00
5. Savings -.15 .05 .53** .70** 1.00
6. Age -.08 -.04 -.09 -.01 -.03 1.00
7. Number of children .06 .00 -.13 -.17 -.07 .48** 1.00
8. Age of youngest child
.01 -.15 -.06 -.06 -.00 .73** .15 1.00
9. Business age -.08 .01 -.20* -.04 .04 .55** .41** .38** 1.00
n = 109; * = Correlation is significant at the 0.05 level (2-tailed); ** = Correlation is significant at the 0.01 level (2-tailed). Coding for variables was as follows: sex: 1 = “male”, 2 = “female”; repayments: 1= 1,156-1,500 days late, 2 = 811-1,155 days late, 3 = 466-810 days late, 4 = 121-465 days late, 5 = 61-120 days late, 6 = 1-60 days late, 7 = 0 days late; variables 3 to 5 (sales, profits, savings): 1 = “I totally disagree”, 9 = “I totally agree”; business ownership: 1 = zero %, 2 = less than 50%, 3 = 50%, 4 = more than 50%, 5 = 100%; marital status: 1 = married, 2 = not married; other loans: 1 = “no”, 2 = “yes, an individual loan”.
312
Appendix E: CAME Group Loans Survey in Spanish
CUESTIONARIO PARA CLIENTES CON UN PRÉSTAMO DE GRUPO La siguiente encuesta será usada para una investigación en la Escuela de Graduados en Administración y Dirección de Empresas (EGADE) del Tecnológico de Monterrey. El contenido de cada encuesta individual permanecerá estrictamente confidencial. Por favor conteste las siguientes preguntas, las cuales le tomarán 15 minutos de su tiempo. 1. ¿Cuál es su nombre? ____________________________________________ 2. ¿Cuál es su género? (marque o circule la letra de su respuesta) a. hombre b. mujer 3. ¿Cuántos años tiene?_______ 4. ¿Cuántos años de educación formal ha terminado, empezando con primero de primaria?________ 5. ¿Es usted: a. casada (o)? b. divorciada(o)? c. separada(o)? d. soltera(o)? e. viuda(o)? f. viviendo con su pareja en unión libre? 6. ¿Cuántos hijos tiene? _______ 7. Si tiene hijos, ¿Cuántos años tiene su hijo menor? _______ 8. ¿A qué tipo de negocio(s) se dedica? Por ejemplo, ¿Qué tipo de producto(s) hace usted o vende o qué tipo de servicio(s) facilita? primer negocio:________________________________________________ segundo negocio:________________________________________________ tercer negocio:__________________________________________________ 9. ¿Cuánto tiempo tiene(n) su(s) negocio(s)? primer negocio: ______ años ______meses segundo negocio: _______años ______meses tercer negocio: ______ años ______meses 10. ¿En qué cantidad de todos su(s) negocio(s) es usted la (el) dueña(o)? a. todo (100%) b. más de la mitad (más que 50%) c. la mitad (50%) d. menos de la mitad (menos que 50%) e. nada (0%)
313
11. Actualmente, ¿Qué tipo de préstamo tiene en CAME? (si tiene más de un préstamo por favor marque o encierre en circulo las letras de su respuesta) a. un préstamo individual b. un préstamo de grupo c. un préstamo interciclo 12. ¿De cuánto es el préstamo de grupo que tiene actualmente? $________________ 13. ¿Hace cuantos años (o meses) inició su crédito con CAME? Años: _____ Meses: ______ 14. Actualmente ¿Usted tiene algún préstamo en otras organizaciones? (si tiene más de un préstamo por favor marque o encierre en circulo las letras de su respuesta) a. No b. Sí, un préstamo individual (para su negocio) c. Sí, un préstamo de grupo (para su negocio) d. Sí, otro tipo de préstamo (describa) ________________________ 15. Si usted tiene un préstamo de grupo en CAME, ¿cuántos miembros de su grupo (incluyéndolo a usted) son mujeres y cuantos son hombres? Mujeres: ______ Hombres: ______ 16. ¿Ha cambiado su tipo de préstamo desde que usted empezó a recibir préstamos de CAME? Por ejemplo, ¿Ha cambiado de préstamos individuales a préstamos de grupo o de préstamos de grupo a préstamos individuales? a. Sí b. No 17. ¿Durante el último año, usted ha recibido los siguientes tipos de capacitación? i. capacitación empresarial a. Sí b. No ii. capacitación sobre la salud a. Sí b. No iii. otro tipo de capacitación a. Sí b. No
314
Seleccione (X) en el cuadro que mejor representa el grado en que usted personalmente está de acuerdo o en desacuerdo (lado derecho) con cada una de las ideas abajo presentadas.
Estoy total-
mente de acuerdo
Estoy muy de acuerdo
Estoy algo de acuerdo
Estoy poco de acuerdo
Ni estoy de
acuerdo, ni estoy en des-acuerdo
Estoy poco en
des-acuerdo
Estoy algo en
des-acuerdo
Estoy muy en
des-acuerdo
Estoy total-
mente en des-
acuerdo
18. Durante el último año usted compró o instaló nuevo equipo, herramientas, transportación o infraestructura para su(s) negocio(s).
19. Durante el último año las ventas de su(s) negocio(s) se han incrementado.
20. Durante el último año las ganancias de su(s) negocio(s) se han incrementado.
21. Los prestamos recibidos de CAME han ayudado a incrementar sus ahorros durante el último año.
22. Tiene más empleados en su(s) negocio(s) ahora que hace un año.
23. Usted ha mejorado sus habilidades para hacer negocios durante el último año.
24. Usted se ha enterado sobre nuevas formas de trabajar o formas de trabajo no tradicionales durante el último año.
25. Usted se ha hecho de amigos cercanos en el último año. Estos amigos son personas con quien usted se siente a gusto, con quien usted puede platicar sobre asuntos privados, o con quien usted puede llamar cuando necesita ayuda.
26. El nivel de cercanía y confianza en su comunidad ha mejorado durante el último año.
27. Ahora usted hace o recibe más llamadas telefónicas que hace un año.
315
28. Durante el último año usted se ha reunido con más frecuencia de lo que lo hacía, con personas para comer o tomar bebidas en sus casas o en un lugar público.
29. La mayoría de los miembros de su grupo se conocían antes de formar el grupo.
30. Si le preguntara cuánto vende cada miembro en su grupo cada día, podría usted decírmelo.
Por favor piense sobre un trabajo ideal…sin pensar en su trabajo actual. Para escoger su trabajo ideal, ¿qué tan importante sería considerar las siguientes ideas? Por favor seleccione (X) en el cuadro (lado derecho) que mejor representa su respuesta.
Es lo más importante
Es muy importante
Es algo importante
Es poco importante
Es muy poco importante
31. Es importante para usted trabajar con las personas que cooperan bien unos con otros.
32. Es importante para usted trabajar en un ambiente agradable y amistoso.
Seleccione (X) en el cuadro que mejor representa el grado de frecuencia (lado derecho) de cada una de las ideas abajo presentadas.
Siempre Casi siempre Usualmente Algunas veces Casi nunca Nunca 33. Ganar es todo.
34. Es su deber cuidar de su familia aun cuando tenga que sacrificar lo que usted desea.
35. Prefiere usted depender de sí mismo que de otros.
36. Usted se siente bien cuando coopera con otros.
316
Por favor seleccione (X) en el cuadro que mejor representa el grado de probabilidad (lado derecho) de que se de cada una de las situaciones abajo mencionadas:
Total-mente
probable
Extremad-amente probable
Muy probable
Algo probable
Poco probable
Muy poco
probable
Nada probable
37. ¿Qué tan probable es que sea fácil para los miembros de su grupo presionar a otro de los miembros a pagar su préstamo?
38. ¿Qué tan probable piensa usted sería, que su grupo expulsara a un miembro por no pagar su préstamo?
39. ¿Qué tan probable piensa usted puede ser, que los miembros de su grupo paguen sus préstamos para mantener buenas relaciones con los otros miembros del grupo?
40. ¿Qué tan probable piensa usted que los miembros de su grupo que no cooperan y participan en actividades de su grupo van a ser criticados y sancionados por otros miembros de su grupo?
41. ¿Qué tan probable piensa usted puede ser que los miembros de su grupo paguen sus préstamos para mantener las buenas relaciones con otros miembros de su comunidad?
42. ¿Qué tan probable piensa usted podría ser, que los miembros de su grupo que no cooperan ni participan en las actividades del grupo puedan ser criticados y sancionados por los miembros de su comunidad?
43. ¿Qué tan probable piensa usted que los miembros de su grupo que no pagan sus prestamos van a perder su reputación en la comunidad?
44. ¿Qué tan probable piensa usted podría ser que los otros miembros de su grupo ayudaran a un miembro a pagar su préstamo, si este miembro no pudiera pagarlo por motivos de salud o mala suerte?
45. ¿Qué tan probable piensa usted puede ser, que miembros de su grupo paguen sus préstamos porque piensan que tienen que permanecer unidos como un grupo?
317
46. ¿Qué tan probable piensa usted que los miembros de su grupo muy seguido aprenden de otros miembros?
47. ¿Qué tan probable piensa usted es, que todos los miembros de su grupo van a poder tener la última palabra cuando su grupo necesite tomar una decisión?
48. ¿Qué tan probable piensa usted que todos los miembros de su grupo serán puntuales y formales al asistir a las juntas de su grupo?
318
Appendix F: CAME Group Loans Survey in English
QUESTIONNAIRE FOR CLIENTS WITH A GROUP LOAN The following survey will be used for research purposes in the Graduate School of Administration and Business Management (EGADE) of the Tecnológico de Monterrey. The content of each individual questionnaire will remain strictly confidential. Please answer the following questions, which will take you about 15 minutes of your time. 1. What is your name? ____________________________________________ 2. What is your gender? (check or circle the letter of your answer) a. male b. female 3. How old are you? ___________ 4. How many years of formal education have you finished beginning with grade one in primary school? ___________ 5. Are you: a. married? b. divorced? c. separated? d. single? e. widowed? f. living with your partner without being married? 6. How many children do you have? ________ 7. If you have children, how old is your youngest child? ________ 8. What type of business do you have? For example, what type of products do you make or sell or what type of service do you provide? first business: ____________________________________________________ second business: __________________________________________________ third business: ____________________________________________________ 9. How old is (are) your business(es)? first business: ______ years _______ months second business: ______ years _______ months third business: ______ years ___ ___ months 10. How much of all your business(es) do you own? a. everything (100%) b. more than half (more than 50%) c. half (50%) d. less than half (less than 50%) e. nothing (0%)
319
11. What type of loan do you have at the moment with CAME? (if you have more than one loan please check or circle the letters of your answer) a. an individual loan b. a group loan c. an inter-cycle loan 12. How much is the group loan worth that you have at the moment? $ _________________ 13. How many years (or months) ago did you initiate your credit with CAME? Years: ________ Months: _______ 14. At the moment do you have a loan in other organisations? (if you have more than one loan please check or circle the letters of your answer) a. No b. Yes, an individual loan (for your business) c. Yes, a group loan (for your business) d. Yes, another type of loan (describe it) _________________________________ 15. If you have a group loan with CAME, how many members of your group (including yourself) are women and how many are men? Women _____ Men: _______ 16. Have you changed your type of loan since you began to receive loans from CAME? For example, have you changed from individual loans to group loans or from group loans to individual loans? a. Yes b. No 17. During the last year, have you received the following types of training/education? i. business training/education a. Yes b. No ii. health training/education a. Yes b. No iii. another type of training/education a. Yes b. No
320
Select (X) the option that best represents the degree that you personally agree or disagree (right side) with each of the ideas below.
I totally agree
I very much agree
I somewhat agree
I agree a little
I don’t agree, but
neither do I
disagree
I disagree a little
I somewhat disagree
I very much
disagree
I totally disagree
18. During the last year you bought or installed new equipment, tools, transportation or infrastructure for your business(es).
19. During the last year the sales of your business(es) have increased.
20. During the last year the profits of your business(es) have increased.
21. The loans received from CAME have helped to increase your savings during the last year.
22. You have more employees in your business(es) now than one year ago.
23. You have improved your business skills during the last year.
24. You have learned about new ways of working or non-traditional work techniques during the last year.
25. You have made close friends in the last year. These friends are people with whom you feel relaxed with, with whom you can talk to about private matters or who you can call when you need help.
26. The level of togetherness and trust in your community has improved during the last year.
27. Now you make and receive more telephone calls than one year ago.
28. During the last year you have got together with more frequency than what you used to with people to eat or drink in their homes or in a public place.
321
29. The majority of the members of your group knew each other before the group was formed.
30. If I asked you how much each member of your group sells each day you would be able to tell me.
Please think about your ideal job/work…without thinking about your present job/work. In order to choose your ideal job/work, how important are the following ideas to you? Please select (X) the option (right side) that best represents your choice.
It is extremely important
It is very important
It is somewhat important
It is slightly important
It is very slightly important
31. It is important for you to work with other people who cooperate well with each other.
32. It is important for you to work in a nice and friendly environment.
Select (X) the option that best represents the degree of frequency (right side) of each one of the ideas below.
Always Almost always
Usually Sometimes Almost never Never
33. Winning is everything
34. It is your duty to look after your family even when you have to sacrifice what you want.
35. You prefer to depend on yourself than others.
36. You feel fine when you cooperate with others.
322
Please select (X) the option that best represents the degree of probability (right side) that each of the situations below would take place.
Totally likely
Extremely probable
Very probable
Somewhat probable
Unlikely Very unlikely
Totally unlikely
37. How likely is it that it would be easy for the members of your group to pressure another member to repay their loan?
38. How likely do you think it is that your group would expel a member for not repaying their loan?
39. How likely do you think it is that the members of your group pay their loans in order to maintain good relations with other members of your group?
40. How likely do you think it is that members of your group that do not cooperate or participate in the activities of your group will be criticised and sanctioned by other members of your group?
41. How likely do you think it is that the members of your group repay their loans in order to maintain good relations with other members of your community?
42. How likely do you think it would be that members of your group that do not cooperate or participate in the activities of your group will be criticised and sanctioned by other members of your community?
43. How likely do you think it is that members of your group that do not repay their loans will lose their reputation in the community?
44. How likely do you think it is that the other members of your group would help a member to pay their loan if this member could not pay because of bad health or bad luck.
45. How likely do you think it is that the members of your group pay their loans because they feel that they have to remain united as a group?
46. How likely do you think it is that members of your group frequently learn from other members?
323
47. How likely do you think it is that all the members of your group will have a say when your group needs to make a decisión?
48. How likely do you think it is that all the members of your group will be punctual and constant in attending the meetings of your group?
324
Appendix G: Correlations for CAME Group Loans Table G.1a Pearson Correlations, CAME Group Loans
n = 110; * = Correlation is significant at the 0.05 level (2-tailed); ** = Correlation is significant at the 0.01 level (2-tailed). Coding for variables was as follows: sex: 1 = “male”, 2 = “female”; females in group (categories): 1 = 33%-80%, 2= 81%-100%; environment: 1= rural; 2= urban; repayments: 1 = defaulter or very late with payment, 7 = very punctual with payment; variables 6 to 8 (sales, profits, savings): 1 = “I totally disagree”, 9 = “I totally agree”; variables 9 to 14 (group sanctions, community sanctions, community reputation, group relations, community relations, solidarity): 1 = “not at all probable”, 7 =” totally probable”; marital status: 1 = married, 2 = not married; age of youngest child: 1= 0.25-8 years old, 2 = 9-16 years old, 3 = 17-48 years old, 4 = no children; business ownership: 1 = zero %, 2 = less than 50%, 3 = 50%, 4 = more than 50%, 5 = 100%; loan type: 1 = group loan, 2 = group loan and inter-cycle loan; other loans: 1 = “no”, 2 = “yes”; training: 1= no training; 2 = 1 form of training (business, health or other), 3 = 2 forms of training; 4 = all (3) forms of training; control variables 29 to 30 (screening and monitoring): 1 = “I totally disagree”, 9 = “I totally agree”.
n = 110; * = Correlation is significant at the 0.05 level (2-tailed); ** = Correlation is significant at the 0.01 level (2-tailed).
328
Coding for variables was as follows: marital status: 1 = married, 2 = not married; age of youngest child: 1= 0.25-8 years old, 2 = 9-16 years old, 3 = 17-48 years old, 4 = no children; business ownership: 1 = zero %, 2 = less than 50%, 3 = 50%, 4 = more than 50%, 5 = 100%; loan type: 1 = group loan, 2 = group loan and inter-cycle loan; other loans: 1 = “no”, 2 = “yes”; training: 1= no training; 2 = 1 form of training (business, health or other), 3 = 2 forms of training; 4 = all (3) forms of training; control variables 29 to 30 (screening and monitoring): 1 = “I totally disagree”, 9 = “I totally agree”.
329
Appendix H: Apros Group Loans Survey in Spanish
CUESTIONARIO PARA CLIENTES CON UN PRÉSTAMO DE GRUPO La siguiente encuesta será usada para una investigación en la Escuela de Graduados en Administración y Dirección de Empresas (EGADE) del Tecnológico de Monterrey. El contenido de cada encuesta individual permanecerá estrictamente confidencial. Por favor conteste las siguientes preguntas, las cuales le tomarán 15 minutos de su tiempo.
Información General 1. ¿Cuál es su nombre? ____________________________________________ 2. ¿Cuál es su género? (marque o circule la letra de su respuesta) a. hombre b. mujer 3. ¿Cuántos años tiene?_______ 4. ¿Cuántos años de educación formal ha terminado, empezando con primero de primaria?________ 5. ¿Es usted: a. casada (o)? b. divorciada(o)? c. separada(o)? d. soltera(o)? e. viuda(o)? f. viviendo con su pareja en unión libre? 6. ¿Cuántos hijos tiene? _______ 7. Si tiene hijos, ¿Cuántos años tienen sus hijos? a. primer hijo: ______ b. segundo hijo: ______ c. tercer hijo: ______ d. cuarto hijo: _______ e. otros: _____ ______ ______ ______ ______ ______
Información de Su Negocio 8. ¿A qué tipo de negocio(s) se dedica? Por ejemplo, ¿Qué tipo de productos hace usted o vende o qué tipo de servicio(s) facilita? primer negocio:_________________________________________________ segundo negocio:________________________________________________ tercer negocio:__________________________________________________ otro(s) negocio(s): ________________________________________________________________ 9. ¿Cuánto tiempo tiene(n) su(s) negocio(s)? primer negocio: ______ años ______meses segundo negocio: _______años ______meses tercer negocio: ______ años ______meses 10. ¿En qué cantidad de todos su(s) negocio(s) es usted la (el) dueña(o)? a. todo (100%) b. más de la mitad (más que 50%) c. la mitad (50%) d. menos de la mitad (menos que 50%) e. nada (0%)
330
Su Préstamo 11. Actualmente, ¿Qué tipo de préstamo usted tiene en APROS? (si tiene más que un préstamo por favor marque o circule las letras de su respuesta) a. un préstamo individual para su negocio b. un préstamo de grupo para su negocio c. un préstamo preferente para su negocio d. un préstamo personal para apoyo de vivienda 12. Actualmente ¿Usted tiene un préstamo en otras organizaciones? (si tiene más que un préstamo por favor marque o circule las letras de su respuesta) a. No b. Sí, un préstamo individual (para su negocio) c. Sí, un préstamo de grupo (para su negocio) d. Sí, un préstamo personal (no para su negocio) e. Sí, otro tipo de préstamo (describa)_______________________________________________________________________ 13. Si usted tiene un préstamo de grupo en APROS, ¿cuántos miembros de su grupo (incluyéndolo a usted) son mujeres y cuantos son hombres? Mujeres: ______ Hombres: ______ 14. Si usted tiene un préstamo de grupo en APROS, ¿cuántas veces al mes se reúne su grupo? a. una vez a la semana b. una vez cada quince días c. una vez al mes d. menos de una vez al mes e. nunca 15. ¿Ha cambiado su tipo de préstamo desde que usted empezó a recibir préstamos de APROS? Por ejemplo, ¿Ha cambiado de préstamos individuales a préstamos de grupo o de préstamos de grupo a préstamos individuales? a. Sí b. No 16. ¿Durante el último año, usted ha recibido los siguientes tipos de capacitación? i. capacitación empresarial a. Sí b. No ii. capacitación sobre la salud a. Sí b. No iii. otro tipo de capacitación a. Sí b. No
331
Seleccione (X) en el cuadro que mejor representa el grado en que usted personalmente está de acuerdo o en desacuerdo (lado derecho) con cada una de las ideas abajo presentadas. Estoy
total-‐mente de acuerdo
Estoy muy de acuerdo
Estoy algo de acuerdo
Estoy poco de acuerdo
Ni estoy de
acuerdo, ni estoy en des-‐acuerdo
Estoy poco en des-‐
acuerdo
Estoy algo en des-‐
acuerdo
Estoy muy en des-‐
acuerdo
Estoy total-‐
mente en des-‐
acuerdo
17. ¿Durante el último año usted compró o instaló nuevo equipo, herramientas, transportación o infraestructura para su(s) negocio(s)?
18. ¿Durante el último año las ventas de su(s) negocio(s) se han incrementado?
19. ¿Durante el último año las ganancias de su(s) negocio(s) se han incrementado?
20. ¿Los prestamos recibidos de APROS han ayudado a incrementar sus ahorros durante el último año?
21. ¿Tiene más empleados en su(s) negocio(s) ahora que hace un año?
22. Usted ha mejorado sus habilidades para hacer negocios durante el último año.
23. Usted se ha enterado sobre nuevas formas de trabajar o formas de trabajo no tradicionales durante el último año.
24. Usted se ha hecho de amigos cercanos en el último año. Estos amigos son personas con quien usted se siente a gusto, con quien usted puede platicar sobre asuntos privados, o con quien usted puede llamar cuando necesita ayuda.
25. ¿El nivel de cercanía y confianza en su comunidad ha mejorado durante el último año?
26. ¿Ahora usted hace o recibe más llamadas telefónicas que hace un año?
332
Estoy
total -‐mente de
acuerdo
Estoy muy de acuerdo
Estoy algo de acuerdo
Estoy poco de acuerdo
Ni estoy de
acuerdo, ni estoy en des-‐acuerdo
Estoy poco en des-‐
acuerdo
Estoy algo en des-‐
acuerdo
Estoy muy en des-‐
acuerdo
Estoy total-‐
mente en des-‐
acuerdo
27. ¿Durante el último año usted se ha reunido con más frecuencia de lo que lo hacía, con personas para comer o tomar bebidas en sus casas o en un lugar público?
28. La mayoría de los miembros de su grupo se conocían antes de formar el grupo.
29. Si le preguntara cuánto vende cada miembro en su grupo cada día, podría usted decírmelo.
Por favor piense sobre un trabajo ideal…sin pensar en su trabajo actual. Para escoger su trabajo ideal, ¿qué tan importante sería considerar las siguientes ideas? Por favor seleccione (X) en el cuadro (lado derecho) que mejor representa su respuesta. Es lo más
importante Es muy
importante Es algo
importante Es poco
importante Es muy poco importante
30. ¿Es importante para usted trabajar con las personas que cooperan bien unos con otros?
31. ¿Es importante para usted trabajar en un ambiente agradable y amistoso?
333
Seleccione (X) en el cuadro que mejor representa el grado de frecuencia (lado derecho) de cada una de las ideas abajo presentadas. Siempre Casi siempre Usualmente Algunas
veces Casi nunca Nunca
32. Ganar es todo.
33. Es su deber cuidar de su familia aun cuando tenga que sacrificar lo que usted desea.
34. Prefiere usted depender de sí mismo que de otros.
35. Usted se siente bien cuando coopera con otros.
Por favor seleccione (X) en el cuadro que mejor representa el grado de probabilidad (lado derecho) de que se de cada una de las situaciones abajo mencionadas. Totalmente
probable Extremada-‐mente probable
Muy probable
Algo probable
Poco probable
Muy poco probable
Nada probable
36. ¿Qué tan probable es que sea fácil para los miembros de su grupo presionar a otro de los miembros a pagar su préstamo?
37. ¿Qué tan probable piensa usted sería, que su grupo expulsara a un miembro por no pagar su préstamo?
38. ¿Qué tan probable piensa usted puede ser, que los miembros de su grupo paguen sus préstamos para mantener buenas relaciones con los otros miembros del grupo?
39. ¿Qué tan probable piensa usted que los miembros de su grupo que no cooperan y participan en actividades de su grupo van a ser criticados y sancionados por otros miembros de su grupo?
334
Totalmente
probable Extremada-‐mente probable
Muy probable
Algo probable
Poco probable
Muy poco probable
Nada probable
40. ¿Qué tan probable piensa usted puede ser que los miembros de su grupo paguen sus préstamos para mantener las buenas relaciones con otros miembros de su comunidad?
41. ¿Qué tan probable piensa usted podría ser, que los miembros de su grupo que no cooperan ni participan en las actividades del grupo puedan ser criticados y sancionados por los miembros de su comunidad?
42. ¿Qué tan probable piensa usted que los miembros de su grupo que no pagan sus prestamos van a perder su reputación en la comunidad?
43. ¿Qué tan probable piensa usted podría ser que los otros miembros de su grupo ayudaran a un miembro a pagar su préstamo, si este miembro no pudiera pagarlo por motivos de salud o mala suerte?
44. ¿Qué tan probable piensa usted puede ser, que miembros de su grupo paguen sus préstamos porque piensan que tienen que permanecer unidos como un grupo?
45. ¿Qué tan probable piensa usted que los miembros de su grupo muy seguido aprenden de otros miembros?
46. ¿Qué tan probable piensa usted es, que todos los miembros de su grupo van a poder tener la última palabra cuando su grupo necesite tomar una decisión?
47. ¿Qué tan probable piensa usted que todos los miembros de su grupo serán puntuales y formales al asistir a las juntas de su grupo?
335
Appendix I: Apros Group Loans Survey in English
QUESTIONNAIRE FOR CLIENTS WITH A GROUP LOAN The following survey will be used for research purposes in the Graduate School of Administration and Business Management (EGADE) of the Tecnológico de Monterrey. The content of each individual questionnaire will remain strictly confidential. Please answer the following questions, which will take you about 15 minutes of your time.
General Information 1. What is your name? ____________________________________________ 2. What is your gender? (check or circle the letter of your answer) a. male b. female 3. How old are you? ___________ 4. How many years of formal education have you finished beginning with grade one in primary school? ___________ 5. Are you: a. married? b. divorced? c. separated? d. single? e. widowed? f. living with your partner without being married? 6. How many children do you have? ________ 7. If you have children, how old are your children? a. first child: _______ b. second child: _______ c. third child: _______ d. fourth child: ________ e. others: _______ _______ _______ _______ _______ ________
Information about your Business 8. What type of business do you have? For example, what type of products do you make or sell or what type of service do you provide? first business: ____________________________________________________ second business: __________________________________________________ third business: ____________________________________________________ other business(es): _________________________________________________ 9. How old is (are) your business(es)? first business: ______ years _______ months second business: ______ years _______ months third business: ______ years ___ ___ months 10. How much of all your business(es) do you own? a. everything (100%) b. more than half (more than 50%) c. half (50%) d. less than half (less than 50%) e. nothing (0%)
336
Your Loan 11. What type of loan do you have at the moment with Apros? (if you have more than one loan please check or circle the letters of your answer) a. an individual loan for your business b. a group loan for your business c. a preferential client loan for your business d. a personal loan for your home 12. At the moment do you have a loan in other organisations? (if you have more than one loan please check or circle the letters of your answer) a. No b. Yes, an individual loan (for your business) c. Yes, a group loan (for your business) d. Yes, a personal loan (not for your business) e. Yes, another type of loan (describe it) _________________________________ 13. If you have a group loan with Apros, how many members of your group (including yourself) are women and how many are men? Women _____ Men: _______ 14. If you have a group loan with Apros, how many times a month does your group meet? a. once a week b. once a fortnight c. once a month d. less than once a month e. never. 15. Have you changed your type of loan since you began to receive loans from Apros? For example, have you changed from individual loans to group loans or from group loans to individual loans? a. Yes b. No 16. During the last year, have you received the following types of training/education? i. business training/education a. Yes b. No ii. health training/education a. Yes b. No iii. another type of training/education a. Yes b. No
337
Select (X) the option that best represents the degree that you personally agree or disagree (right side) with each of the ideas below.
I totally agree
I very much agree
I somewhat agree
I agree a little
I don’t agree, but
neither do I
disagree
I disagree a little
I somewhat disagree
I very much
disagree
I totally disagree
17. During the last year you bought or installed new equipment, tools, transportation or infrastructure for your business(es).
18. During the last year the sales of your business(es) have increased.
19. During the last year the profits of your business(es) have increased.
20. The loans received from Apros have helped to increase your savings during the last year.
21. You have more employees in your business(es) now than one year ago.
22. You have improved your business skills during the last year.
23. You have learned about new ways of working or non-traditional work techniques during the last year.
24. You have made close friends in the last year. These friends are people with whom you feel relaxed with, with whom you can talk to about private matters or who you can call when you need help.
25. The level of togetherness and trust in your community has improved during the last year.
26. Now you make and receive more telephone calls than one year ago.
27. During the last year you have got together with more frequency than what you used to with people to eat or drink in their homes or in a public place.
338
28. The majority of the members of your group knew each other before the group was formed.
29. If I asked you how much each member of your group sells each day you would be able to tell me.
Please think about your ideal job/work…without thinking about your present job/work. In order to choose your ideal job/work, how important are the following ideas to you? Please select (X) the option (right side) that best represents your choice.
It is extremely important
It is very important
It is somewhat important
It is slightly important
It is very slightly important
30. It is important for you to work with other people who cooperate well with each other.
31. It is important for you to work in a nice and friendly environment.
Select (X) the option that best represents the degree of frequency (right side) of each one of the ideas below.
Always Almost always
Usually Sometimes Almost never Never
32. Winning is everything
33. It is your duty to look after your family even when you have to sacrifice what you want.
34. You prefer to depend on yourself than others.
35. You feel fine when you cooperate with others.
339
Please select (X) the option that best represents the degree of probability (right side) that each of the situations below would take place.
Totally likely
Extremely probable
Very probable
Somewhat probable
Unlikely Very unlikely
Totally unlikely
36. How likely is it that it would be easy for the members of your group to pressure another member to repay their loan?
37. How likely do you think it is that your group would expel a member for not repaying their loan?
38. How likely do you think it is that the members of your group pay their loans in order to maintain good relations with other members of your group?
39. How likely do you think it is that members of your group that do not cooperate or participate in the activities of your group will be criticised and sanctioned by other members of your group?
40. How likely do you think it is that the members of your group repay their loans in order to maintain good relations with other members of your community?
41. How likely do you think it would be that members of your group that do not cooperate or participate in the activities of your group will be criticised and sanctioned by other members of your community?
42. How likely do you think it is that members of your group that do not repay their loans will lose their reputation in the community?
43. How likely do you think it is that the other members of your group would help a member to pay their loan if this member could not pay because of bad health or bad luck.
44. How likely do you think it is that the members of your group pay their loans because they feel that they have to remain united as a group?
45. How likely do you think it is that members of your group frequently learn from other members?
340
46. How likely do you think it is that all the members of your group will have a say when your group needs to make a decisión?
47. How likely do you think it is that all the members of your group will be punctual and constant in attending the meetings of your group?
341
Appendix J: Apros Staff Survey in Spanish
CUESTIONARIO PARA PERSONAL DE APROS Por favor conteste las siguientes preguntas sobre el cliente abajo mencionado.
1. Nombre de cliente: ________________________________________ 2. Nombre de su cuidad o pueblo:_______________________________ 3. ¿El cliente llenó el cuestionario solo? a. Sí b. No, el asesor leyó el cuestionario al cliente 4. ¿Vive en: a. el campo? b. un pueblo chico (con menos de 5,000 habitantes)? c. un pueblo grande (entre 5,000 y 20,000 habitantes)? d. una cuidad muy pequeña (entre 20,000 y 40,000 habitantes)? e. una cuidad pequeña (entre 40,000 y 100,000)? f. una cuidad de tamaño mediana o grande (de más de 100,000 habitantes)? 5. ¿Su negocio(s) se encuentra(n) en: (si tiene más que un negocio por favor marque o circule las letras de su respuesta) a. el campo? b. un pueblo chico (con menos de 5,000 habitantes)? c. un pueblo grande (entre 5,000 y 20,000 habitantes)? d. una cuidad muy pequeña (entre 20,000 y 40,000 habitantes)? e. una cuidad pequeña (entre 40,000 y 100,000)? f. una cuidad de tamaño mediana o grande (de más de 100,000 habitantes)? 6. ¿Cuándo se inició el crédito el cliente con APROS? Año: __________ Mes: ____________________ 7. ¿Qué tipo de préstamo tiene éste cliente en APROS? (si tiene más que un préstamo por favor marque o circule las letras de su respuesta) a. un préstamo individual para su negocio b. un préstamo de grupo para su negocio c. un préstamo preferente para su negocio d. un préstamo personal para apoyo de vivienda 8. ¿De cuánto es el préstamo que tiene ahora? $________________ 9. Si tiene un préstamo de grupo, ¿cuántos miembros de su grupo (incluyendo el cliente) son mujeres y cuantos son hombres? Mujeres: ______ Hombres: ______
342
10. ¿Ha cambiado su tipo de préstamo desde que el cliente empezó a recibir préstamos de APROS? Por ejemplo, ¿Ha cambiado de préstamos individuales a préstamos de grupo o de préstamos de grupo a préstamos individuales? a. Sí b. No 11. Si contestó “Sí” a la última pregunta, ¿cuándo cambió su tipo de préstamo?
Año: ________ Mes: _______________ 12. Si contestó “Sí” a la penúltima pregunta, ¿Qué tipo(s) de préstamo(s) tenía antes? a. préstamos individuales b. préstamos de grupo c. otro tipo de préstamo (describa): _________________________
343
Por favor seleccione (X) el cuadro que mejor representa el grado en que usted personalmente está de acuerdo o en desacuerdo con la siguiente oración.
Estoy totalmente de
acuerdo
Estoy algo de acuerdo
Estoy poco de acuerdo
Ni estoy de acuerdo, ni
estoy en desacuerdo
Estoy poco en desacuerdo
Estoy algo en desacuerdo
Estoy totalmente en desacuerdo
13. Durante el último año éste cliente (préstamo individual) o su grupo (préstamo de grupo) ha sido puntual al pagar sus préstamos según los documentos de su historial crediticio.
344
Appendix K: Apros Staff Survey in English
QUESTIONNAIRE FOR APROS STAFF Please answer the following questions about the client mentioned below.
1. Name of the client: ________________________________________ 2. Name of the client’s city or town: ____________________________________ 3. Did the client fill out the questionnaire by himself/herself? a. Yes b. No, the asesor (Apros staff member responsable for the group) read the questionaire to the client. 4. Do you live in: a. the countryside (not in a town)? b. a small town (of less than 5,000 people)? c. a large town (of between 5,000 and 20,000 people)? d. a very small city (of between 20,000 and 40,000 people)? e. a small city (of between 40,000 and 100,000 people)? f. a medium-sized or large city (of more than 100,000 people)? 5. Is (are) your business(es) located in: (if you have more than one business please check or circle the letters of your answer) a. the countryside (not in a town)? b. a small town (of less than 5,000 people)? c. a large town (of between 5,000 and 20,000 people)? d. a very small city (of between 20,000 and 40,000 people)? e. a small city (of between 40,000 and 100,000 people)? f. a medium-sized or large city (of more than 100,000 people)? 6. When did the client begin to receive credit from Apros? Year: _______ Month: ___________ 7. What type of loan does this client have with Apros? (if you have more than one loan please check or circle the letters of your answer) a. an individual loan for your business b. a group loan for your business c. a preferential loan for your business d. a personal loan for your home 8. How much is the loan that the client has now? $________________
345
9. If the client has a group loan, how many members of her/his group (including the client) are women and how many are men? Women: ________ Men: __________ 10. Has the client changed her/his type of loan since she/he began to receive loans from Apros? For example, has she/he changed from individual loans to group loans or from group loans to individual loans? a. Yes b. No 11. If you answered “Yes” in the last question, when did the client change her/his loan type? Year: ________ Month: _____________ 12. If you answered “Yes” in the second last question, what type of loan(s) did the client have before? a. individual loans b. group loans c. another type of loan (describe it) __________________________
346
Please select (X) the option that best represents the degree to which you personally agree or disagree with the following sentence.
I totally agree I somewhat agree
I agree only a little
I neither agree, nor do I disagree
I disagree a little
I somewhat disagree
I totally disagree
13. During the last year this client (individual loan) or her/his group (group loan) has been punctual in paying her/his/its loans according to the documents concerning her/his/its credit history.
347
Appendix L: Correlations for Apros Group Loans Table L.1a Pearson Correlations, Apros Group Loans
n = 182; * = Correlation is significant at the 0.05 level (2-tailed); ** = Correlation is significant at the 0.01 level (2-tailed). Coding for variables was as follows: sex: 1 = “male”, 2 = “female”; females in group (categories): 1 = 0%-60%, 2= 61%-99%, 3= 100%; environment: 1= rural (< 15,000 people); 2= urban (> 15,000 people); repayments: 1 = “I totally disagree (that the client is punctual)”, 7 = “I totally agree”; variables 7 to 9 (sales, profits, and savings): 1 = “I totally disagree”, 9 = “I totally agree”; variables 10 to 15 (group sanctions, community sanctions, community reputation, group relations, community relations, and solidarity): 1 = “not at all probable”, 7 =” totally probable”; marital status: 1 = married, 2 = not married; age of youngest child: 1= 0.3-8 years old, 2 = 9-17 years old, 3 = 18-40 years old, 4 = no children; businesss ownership: 1 = zero %, 2 = less than 50%, 3 = 50%, 4 = more than 50%, 5 = 100%; other loans: 1 = “no”, 2 = “yes”; training: 1= no training; 2 = 1 form of training (business, health or other), 3 = 2 forms of training; 4 = all (3) forms of training; frequency of meetings: 1 = once a week; 2 = once a fortnight; 3 = once a month; 4 = less than once a month; 5 = never; survey application: 1 = read to client; 2 = self-administered; control variables 31 and 32 (screening and monitoring): 1 = “I totally disagree”, 9 = “I totally agree”.
350
Table L.1b Pearson Correlations, Apros Group Loans
n = 182; * = Correlation is significant at the 0.05 level (2-tailed); ** = Correlation is significant at the 0.01 level (2-tailed). Coding for variables was as follows: marital status: 1 = married, 2 = not married; age of youngest child: 1= 0.3-8 years old, 2 = 9-17 years old, 3 = 18-40 years old, 4 = no children; businesss ownership: 1 = zero %, 2 = less than 50%, 3 = 50%, 4 = more than 50%, 5 = 100%; other loans: 1 = “no”, 2 = “yes”; training: 1= no training; 2 = 1 form of training (business, health or other), 3 = 2 forms of training; 4 = all (3) forms of training; frequency of meetings: 1 = once a week; 2 = once a fortnight; 3 = once a month; 4 = less than once a month; 5 = never; survey application: 1 = read to client; 2 = self-administered; control variables 31 and 32 (screening and monitoring): 1 = “I totally disagree”, 9 = “I totally agree”.
352
References Abbink, K., Irlenbusch, B., & Renner, E. (2006). Group size and social ties in microfinance institutions. Economic Inquiry, 44(4), 614-628. Abrahamson, M. (1983). Social research methods. Englewood Cliffs, N.J.: Prentice Hall. Adler, P. S., & Kwon, S.-W. (2002). Social capital: Prospects for a new concept. Academy of Management Review, 27, 17-40. ADMIC. (n.d.). Asesoría a microempresas. Retrieved October 15, 2009, from http://www.admic.org.mx Ahlin, C., & Townsend, R. M. (2007). Using repayment data to test across models of joint liability lending. Economic Journal, 117, F11-F51. Ailon, G. (2008). Mirror, mirror on the wall: Culture’s Consequences in a value test of its own design. Academy of Management Review, 33(4),
885-904. Ailon, G. (2009). A reply to Geert Hofstede. Academy of Management Review, 34(3), 571-573. Algesheimer, R., Dholakia, U. M., & Herrmann, A. (2005). The social influence of brand community: Evidence from European car clubs. Journal of Marketing, 69, 19-34. Apros. (n.d.). Microfinanzas. Retrieved July 20, 2011, from http://www.aprosfinanzas.com.mx Armendáriz de Aghion, B., & Morduch, J. (2000). Microfinance beyond group lending. Economics of Transition, 8(2), 401-420. Armendáriz de Aghion, B., & Morduch, J. (2004). Microfinance: Where do we stand? In C. Goodhart (Ed.). Financial development and economic growth: Explaining the links (pp. 135-148). Basingstoke, UK: Palgrave Macmillan. Armendáriz de Aghion, B., & Morduch, J. (2005). The economics of microfinance. Cambridge, Massachusetts: The MIT Press. Armstrong, J. S., & Overton, T. S. (1977). Estimating nonresponse bias in mail surveys. Journal of Marketing Research, 14, 396-402. Babbie, E. (1998). The practice of social research (8th ed.). Belmont, CA: Wadsworth. Babbie, E. (2004). The practice of social research (10th ed.). Belmont, CA: Wadsworth/Thomson Learning. Barboza, G. A., & Barreto, H. (2006). Learning by association: Micro credit in Chiapas, Mexico. Contemporary Economic Policy, 24(2), 316-331. Barboza, G., & Trejos, S. (2009). Micro credit in Chiapas, México: Poverty reduction through group lending. Journal of Business Ethics, 88,
283-299. Barker, J. R. (1993). Tightening the iron cage: Concertive control in
Barley, S. R. (2006). When I write my masterpiece: Thoughts on what makes a paper interesting. Academy of Management Journal, 49(1), 16-20.
353
Barry, T. (Ed.) (1992). Mexico: A country guide. Alburquerque, NM: The Inter-Hemispheric Education Resource Center. Bentler, P. M., & Wu, E. J. C. (2002). EQS for Windows: User’s guide. Encino, CA: Multivariate Software, Inc. Berk, R. A. (1983). An introduction to sample selection bias in sociological data. American Sociological Review, 48, 386-398. Bernard, H. R. (1995). Research methods in anthropology: Qualitative and quantitative approaches (2nd ed.). Walnut Creek, CA: AltaMira. Bernard, H. R. (2000). Social research methods: Qualitative and quantitative approaches. Thousand Oaks, CA: Sage. Besley, T., & Coate, S. (1995). Group lending, repayment incentives and social collateral. Journal of Development Economics, 46, 1-18. Bhatt, N., & Tang, S. Y. (2001). Delivering microfinance in developing countries: Controversies and policy perspectives. Policy Studies Journal, 29(2), 319-333. Bird, S. R., Sapp, S. G., & Lee, M. Y. (2001). Small business success in rural communities: Explaining the sex gap. Rural Sociology, 66(4), 507-531. Blalock, H. M. (1982). Conceptualization and measurement in the social sciences. Beverly Hills, CA: Sage. Blumberg, R. L. (1989a). Making the case for the gender variable: Women and the wealth & well-being of nations. Washington DC: Agency for International Development. Blumberg, R. L. (1989b). Entrepreneurship, credit, and gender in the informal sector of the Dominican Republic. In USAID, Women in development: A.I.D.’s experience, 1973-85 (vol. 2). Washington, DC: USAID, Center for Development Information and Evaluation. Blumberg, R. L. (1991). Income under female versus male control: Hypotheses from a theory of gender stratification and data from the third world. In R. L. Blumberg (Ed.), Gender, family, and economy: The triple overlap (pp. 97-127). Newbury Park, CA: Sage. Blumberg, R. L. (2005). Women’s economic empowerment as the “magic potion” of economic development? Paper presented at the 100th Annual Meeting of the American Sociological Association, Philadelphia, August. Bolender, R. (n.d.). Feminist conflict theory. Retrieved May 23, 2009, from http://www.bolender.com/Sociology/Articles/Feminist%20Conflict
%20Theory.htm Brehm, S. S., Kassin, S. M. & Fein, S. (1999). Social psychology (4th ed.). Boston: HoughtonMifflin. Brush, C. G. (1992). Research on women business owners: Past trends, a new perspective, and future direction. Entrepreneurship Theory and Practice, 16(4), 5-30. Brush, C. G., Carter, N. M., Gatewood, E. J., Greene, P. G., & Hart, M. M. (Eds.) (2006). Women and entrepreneurship: Contemporary classics. Cheltenham, UK: Edward Elgar. Bruton, G. D. (2010). Business and the world’s poorest billion – the need for
354
an expanded examination by management scholars. The Academy of Management Perspectives, 24(3), 6-10. Bruton, G. D., Khavul, S., & Chavez, H. (2011). Microlending in emerging economies: Building a new line of inquiry from the ground-up. Journal of International Business Studies, 42, 718-739. Buvinic, M., & Lycette, M. A. (1988). Women, poverty and development in the Third World. In J. P. Lewis (Ed.), Strengthening the poor: What have we learned? (pp. 149-162). New Brunswick, USA: Transaction Books. Buvinic, M., & Yudelman, S. W. (1989). Women, poverty and development in the Third World. New York: Foreign Policy Association, Headline Series,
No. 289. Byrne, B. M. (2006). Structural equation modeling with EQS: Basic concepts, applications, and programming (2nd ed.). New York: Routledge. CAME (n.d.). CAME en cifras. Retrieved July 20, 2011, from http://www.came.org.mx/cameCifras.asp Campbell, D. T. & Stanley, J. C. (1963). Experimental and quasi-experimental designs for research. Chicago: Rand McNally & Company. capital. (n.d.). Retrieved November 27, 2007, from Encyclopædia Britannica Online:
http://0-search.eb.com.millenium.itesm.mx:80/eb/article-9020146 Carloni, A. S. (1987). Women in development: A.I.D.’s experience, 1973-1985, vol. 1 synthesis paper, AID program evaluation report no. 18. Washington, DC: US Agency for International Development. Cassar, A., Crowley, L., & Wydick, B. (2007). The effect of social capital on group loan performance: Evidence from field experiments. Economic Journal, 117, F85-F106. Centro de Investigación y Docencia Económicas (CIDE). (2006). Evaluación de Resultados del Programa Nacional de Financiamiento al Microempresario (PRONAFIM) Correspondiente al Ejercicio Fiscal 2006, Evaluación Parcial: Enero – Agosto de 2006. Mexico D.F.: CIDE. Chang, S-J., van Witteloostuijn, A., & Eden, L. (2010). From the Editors: Common method variance in international business research. Journal of International Business Studies, 41, 178-184. Charlton, S. E. M. (1984). Women in Third World development. Boulder: Westview Press. Chen, M. A. (1997). A guide for assessing the impact of microenterprise services at the individual level. Washington D.C.: Assessing the Impact of Microenterprise Services (AIMS). Clark, M. H. (1991). Gender issues in microenterprise assistance. Studies in Third World Societies, 44, 109-133. Compartamos Banco. (n.d.). Credit. Retrieved July 31, 2008, from
Conde Bonfil, C. (2009). Realidad, mitos y retos de las microfinanzas en México. Querétaro, Mexico: El Colegio Mexiquense & la Colmena Milenaria. Delgado Wise, R., Márquez Covarrubias, H., & Rodríguez Ramírez, H. (2009).
355
Seis tesis para desmitificar el nexo entre migración y desarrollo. Migración y Desarrollo, 12, 27-52. DeVellis, R. F. (2003). Scale development: Theory and applications. Thousand Oaks, CA: Sage. Dowla, A., & Barua, D. (2006). The poor always pay back: The Grameen II story. Bloomfield, CT: Kumarian Press. Downing, J. (1990). Gender and the growth and dynamics of microenterprises. Washington, DC: US Agency for International Development; Private Enterprise Bureau. EGADE (2004). Compartamos: Empresarios creadores de empresarios. Case written by students of EGADE-Tecnológico de Monterrey, Monterrey, Mexico. Ely, R., & Padavic, I. (2007). A feminist analysis of organizational research on sex differences. Academy of Management Review, 32(4), 1121-1143. Erez, M., & Earley, P. C. (1993). Culture, self-identity and work. New York: Oxford University. Erez, M., & Somech, A. (1996). Is group productivity loss the rule or the exception? Effects of culture and group-based motivation. Academy of Management Journal, 39(6), 1513-1537. Farley, J. E. (2003). Sociology (5th ed.). Upper Saddle River, New Jersey: Prentice Hall. Fernando, J. L. (1997). Nongovernmental organizations, micro-credit, and empowerment of women. Annals of the American Academy of Political and Social Science, 554, 150-177. Fischer, E. M., Reuber, A. R., & Dyke, L. S. (1993). A theoretical overview and extension of research on sex, gender, and entrepreneurship. Journal of Business Venturing, 8(2), 151-168. Fisher, J. (1994). Third World NGOs: A missing piece to the population puzzle. Environment, 36(7), 6-11, 37-41. Fowler, F. J. (2002). Survey research methods, (3rd ed.). Thousand Oaks, CA: Sage. Geertz, C. (1973). The interpretation of cultures. U.S.A.: Basic Books. Gelfand, M. J., Bhawuk, D. P. S., Nishii, L. H., & Bechtold, D. J. (2004). Individualism and collectivism. In R. J. House, P. J. Hanges, M. Javidan, P. W. Dorfman, & V. Gupta (Eds.), Culture, leadership, and organizations: The GLOBE study of 62 societies (pp. 437-512). Thousand Oaks, CAL: Sage. Ghosh, A. (2004). Learning in strategic alliances: A Vygotskian perspective. The Learning Organization, 11(4/5), 302-311. Giné, X., & Karlan, D. S. (2006). Group versus individual liability: A field experiment in the Philippines. World Bank Research Working Paper 4008. Glesne, C. (1992). Becoming qualitative researchers. White Plains, NY:
Addison-Wesley Longman. Goetz, A. M., & Sen Gupta, R. (1996). Who takes the credit? Gender, power, and control over loan use in rural credit programs in Bangladesh. World Development, 24(1), 45-63.
356
Gomez, R., & Santor, E. (2003). Do peer group members outperform individual borrowers? A test of peer group lending using Canadian micro-credit data. Bank of Canada Working Paper 2003-33. Goodenough, W. H. (2003). In pursuit of culture. Annual Review of Anthropology, 32, 1-12. Granovetter, M. (1985). Economic action and social structure: The problem of embeddedness. American Journal of Sociology, 91(3), 481-510. Granovetter, M. (1992). Problems of explanation in economic sociology. In N. Nitin & R. G. Eccles (Eds.), Networks and organizations: Structure, form, and action (pp. 25-56). Boston: Harvard Business School. Griffin, D. (1996). Non government organisations and aid. Development Bulletin, 39, 43-45. Griffin, D. (2008). Gender, group loans and the creation of capital by Mexican microfinance institutions, 13th Annual Conference, Texas A&M International University, Center for the Study of Western Hemispheric Trade, Laredo, conference proceedings (CD). Griffin, D. (2009). Gender, loan methodology, environment, and the formation of capital by microfinance institutions. 69th annual conference of the Academy of Management, Best Papers Proceedings. Grootaert, C., Narayan, D., Nyhan Jones, V., & Woolcock, M. 2004. Measuring social capital: An integrated questionnaire. Working paper no. 18, World Bank, Washington D.C. Haase, D. (2006). Gender, microfinance and the informal sector in Nicaragua. University of Wisconsin-Madison, dissertation. Haase, D. (2007). Closing the gender gap. ESR Review, 9(2), 4-9. Haig-Muir, M. (1996). Gender and development: Study guide. Geelong, Australia: Deakin University. Hair, J. F., & Anderson, R. E. (2010). Multivariate data analysis (10th ed.). Upper Saddle River, NJ: Prentice Hall. Hair, J. F., Anderson, R. E., Tatham, R. L., & Black, W. C. (1995). Multivariate data analysis with readings (4th ed.). Upper Saddle River, NJ: Prentice Hall. Hammond, A. L., & Prahalad, C. K. (2004). Selling to the poor. Foreign Policy, 142, 30-37. Harris, M. (1979). Cultural materialism: The struggle for a science of culture. New York: Random House. Harrison, D. A., McLaughlin, M. E., & Coalter, T. M. (1996). Context, cognition, and common variance: Psychometric and verbal protocol evidence. Organizational Behavior and Human Decision Processes, 68, 246-261. Hart, S. L. (2005). Capitalism at the crossroads: The unlimited business opportunities in solving the world’s most difficult problems. Upper Saddle River, NJ: Wharton School. Hashemi, S. M., Schuler, S. R., & Riley, A. P. (1996). Rural credit programs and women’s empowerment in Bangladesh. World Development, 24(4),
635-653. Hatch, M. J. (1997) Organization theory: Modern, symbolic and postmodern
357
perspectives. Oxford: Oxford University. Hatch, M. J., & Cunliffe, A. L. (2006). Organization theory: Modern, symbolic and postmodern perspectives. Oxford: Oxford University, 2006. Hermes, N., & Lensink, R. (2007). The empirics of microfinance: What do we know? Economic Journal, 117, F1-F10. Hoebel, E. A. (1975). La naturaleza de la cultura. In H. L. Shapiro (Ed.), Hombre, cultura y sociedad (pp. 231-245). México D.F.: Fondo de Cultura Económica. Hofstede, G. (1980). Culture’s consequences: International differences in
work-related values. Beverly Hills, California: Sage. Hofstede, G. (1992). Motivation, leadership, and organization: Do American theories apply abroad? In H. W. Lane, J. J. DiStefano, L. L. Wright and R. W. Blake, International Management Behavior: From policy to practice (2nd ed.) (pp. 98-122). Boston: PWS-Kent. Hofstede, G. (1997). Cultures and organizations: Software of the mind. New York: McGraw Hill. Hofstede, G. (2001). Cultures consequences: Comparing values, behaviors, institutions, and organizations across nations (2nd ed.). Thousand Oaks, CA: Sage. Hofstede, G. (2002). Dimensions do not exist: A reply to Brendan McSweeney. Human Relations, 55(11), 1355-1361. Hofstede, G. (2009). Who is the fairest of them all? Galit Ailon’s mirror. Academy of Management Review, 34(3), 570-571. House, R. J., Hanges, P. J., Javidan, M., Dorfman, P. W., and Gupta, V. (Eds.) (2004). Culture, leadership, and organizations: The GLOBE Study of 62 societies. Thousand Oaks, CAL: Sage. Hox, J. J. (1995). AMOS, EQS, and LISREL for Windows: A comparative review. Structural Equation Modeling, 2(1), 79-91. Iacobucci, D. (2010). Structural equations modeling: Fit indices, sample size, and advanced topics. Journal of Consumer Psychology, 20, 90-98. INEGI (2005). In Conteo de población y vivienda 2005. Retrieved August 1, 2010, from
Islam, T. (2007). Microcredit and poverty alleviation. Aldershot, Hampshire, UK: Ashgate. Jacobsen, J. P. (1998). The economics of gender (2nd ed.). Malden, MA: Blackwell. Jacobson, J. L. (1993). Closing the gender gap in development. In L. Starke (Ed.), State of the world 1993: A Worldwatch Institute report on progress toward a sustainable society (pp. 61-79). New York: W. W. Norton and Company. Kabeer, N. (2001). Conflicts over credit: Re-evaluating the empowerment potential of loans to women in rural Bangladesh. World Development, 29(1), 63-84. Kalleberg, A. L., & Leicht, K. T. (1991). Gender and organizational performance:
358
Determinants of small business survival and success. Academy of Management Journal, 34(1), 136-161. Karlan, D. S. (2005). Using experimental economics to measure social capital and predict financial decisions. American Economic Review, 95(5),
1688-1699. Karlan, D. S. (2007). Social connections and group banking. Economic Journal, 117, F52-F84. Karsten, M. F. (1994). Management and gender: Issues and attitudes, Westport, CT: Praeger. Kennedy, L. (1999). Cooperating for Survival: Tannery pollution and joint action in the Palar Valley (India). World Development, 27(9), 1673-1691. Kevane, M., & Wydick, B. (2001). Microenterprise lending to female entrepreneurs: Sacrificing economic growth for poverty alleviation? World Development, 29(7), 1225-1236. Khan, M. R. (1999). Microfinance, wage employment and housework: A gender analysis. Development in Practice, 9(4), 424-436. Khandker, S. R. (1998). Fighting poverty with microcredit: Experience in Bangladesh. Oxford: Oxford University Press. Khandker, S. R. (2005). Microfinance and poverty: Evidence using panel data from Bangladesh. World Bank Economic Review, 19(2), 263-286. Khandker, S. R., Khalily, B., & Khan, Z. (1995). Grameen Bank: Performance and sustainability. World Bank Discussion Paper 306, Washington D.C. Khavul, S. (2010). Microfinance: Creating opportunities for the poor? The Academy of Management Perspectives, 24(3), 58-72. Khavul, S., Bruton, G. D., & Wood, E. (2009). Informal family business in Africa. Entrepreneurship Theory and Practice, 33(6), 1219-1238. Kim, U., Triandis, H. C., Kagitcibasi, C., Choi, S.-C., & Yoon, G. (Eds.) (1994). Individualism and collectivism: Theory, methods, and applications. Thousand Oaks, CA: Sage. Kuper, A. (1999). Culture: The anthropologists’ account. Harvard, MA: Harvard University. Kuper. A. (2001). Cultura: La version de los antropólogos. Barcelona: Paidós. Laffont, J. J., & Rey, P. (2003). Moral hazard, collusion and group lending. Draft, IDEI, University of Toulouse and University of Southern California. Lewis, J. P. (Ed.) (1988). Strengthening the poor: What have we learned? New Brunswick, NJ: Transaction Books. Li, F., & Aksoy, L. (2007). Dimensionality of individualism-collectivism and measurement equivalence of Triandis and Gelfand’s scale. Journal of Business and Psychology, 21(3), 313-329. Lin, N. (2001). Social capital: A theory of social structure and action. Cambridge: Cambridge University. Lincoln, Y.S., & Guba, E.G. (1985). Naturalistic inquiry. Beverly Hills, CA: Sage. London, T., & Hart, S. L. (2004). Reinventing strategies for emerging markets: beyond the transnational model. Journal of International Business Studies, 35, 350-370.
359
Loscocco, K. A., Robinson, J., Hall, R. H., & Allen, J. K. (1991). Gender and small business success: An inquiry into women’s relative disadvantage. Social Forces, 70(1), 65-85. Markus, H. R., & Kitayama, S. (1992). The what, why, and how of cultural psychology: A review of Shweder’s “Thinking Through Cultures”. Psychological Inquiry, 3(4), 357-364. Maruyama, G. M. (1998). Basics of structural equation modeling, Thousand Oaks, CA: Sage. Matienzo, R. (1993). Loan profitability and impact in the RD-12 project. Dhaka: Canadian Resource Team. Mayoux, L. (2001). Tackling the down side: Social capital, women’s empowerment and microfinance in Cameroon. Development and Change, 32, 421-450. McKee, K. (1989). Microlevel strategies for supporting livelihoods, employment, and income generation of poor women in the third world: The challenge of significance. World Development, 17(7), 993-1006. McKernan, S. M. (2002). The impact of microcredit programs on
self-employment profits: Do noncredit program aspects matter? Review of Economics and Statistics, 84(1), 93-115.
McSweeney, B. (2002a). Hofstede’s model of national cultural differences and their consequences: A triumph of faith – a failure of analysis. Human Relations, 55(1), 89-118. McSweeney, B. (2002b). The essentials of scholarship: A reply to Geert Hofstede. Human Relations, 55(11), 1363-1372. microcredit. (2008). Retrieved July 31, 2008, from Encyclopædia Britannica Online: http://search.eb.com/eb/article-9389468 Miles, M. B., & Huberman, A. M. (1994). Qualitative data analysis: An expanded sourcebook. Thousand Oaks, CA: Sage. Mintzberg, H. (1998). Strategy safari: A guided tour through the wilds of strategic management. New York: Free Press. Moore, G. (1990). Structural determinants of men’s and women’s personal networks. American Sociological Review, 55(5), 726-735. Morduch, J. (1999). The microfinance promise. Journal of Economic Literature, 37, 1569-1614. Morduch, J. (2000). The microfinance schism. World Development, 28(4),
617-629. Muktananda, Swami (1977). Satsang with Baba: Questions and answers between Swami Muktananda and his devotees, Vol. 3. Ganeshpuri, Maharashtra, India: Shree Gurudev Ashram. Muravyev, A., Talavera, O. & Schafer, D. (2009). Entrepreneurs’ gender and financial constraints: Evidence from international data. Journal of Comparative Economics, 37, 270-286. Myers, D. G. (1996). Social psychology (5th ed.). New York: McGraw-Hill. Nachtigall, C., Kroehne, U., Funke, F., & Steyer, R. (2003). (Why) Should we use SEM? Pros and cons of structural equation modelling. Methods of Psychological Research Online, 8(2), 1-22.
360
Nafziger, E. W. (1997). The economics of developing countries (3rd ed.). Upper Saddle River, NJ: Prentice Hall. Navajas, S., Schreiner, M, Meyer, R. L., Gonzalez-Vega, C., & Rodriguez-Meza, J. (2000). Microcredit and the poorest of the poor: Theory and evidence from Bolivia. World Development, 28 (2), 333-346. Nebel, B. J., & Wright, R. T. (2000), Environmental science: The way the world works (7th ed.). Upper Saddle River, NJ: Prentice Hall. Newland, K. (1979). The sisterhood of man (A Worldwatch Institute book). New York: W. W. Norton. Patton, M. Q. (2002). Qualitative research and evaluation methods (3rd ed.). Newbury Park, CA: Sage. Peredo, A. M., & Chrisman, J. J. (2006). Toward a theory of community-based enterprise. Academy of Management Review, 31(2), 309-328. Pitt, M. M., & Khandker, S. R. (1998). The impact of group-based credit programs on poor households in Bangladesh: Does the gender of participants matter? Journal of Political Economy, 106(5), 958-996. Pitt, M. M., Khandker, S. R., & Cartwright, J. (2006). Empowering women with microfinance: Evidence from Bangladesh. Economic Development and Cultural Change, 54(4), 791-831. Powell, G. N., & Greenhaus, J. H. (2010). Sex, gender, and the work-to-family interface: Exploring negative and positive interdependencies. Academy of Management Journal, 53(3), 513-534. Prahalad, C. K. (2005a). The fortune at the bottom of the pyramid. Upper Saddle River, NJ: Wharton School. Prahalad, C. K. (2005b). ICICI Bank: Innovations in finance. In C. K. Prahalad, The fortune at the bottom of the pyramid (pp. 289-318). Upper Saddle River, NJ: Wharton School. Prasad, R. M. (2009). Loan hurdles: Do banks discriminate against women entrepreneurs? Academy of Management Perspectives, 23(4), 91-93. Pretty, J. (2003). Social capital and the collective management of resources. Science, 302, 1912-1914. Pretty, J., & Ward, H. (2001). Social capital and the environment. World Development, 29(2), 209-227. Rahman, A. (1999). Micro-credit initiatives for equitable and sustainable development: Who pays? World Development, 27(1), 67-82. Rankin, K. N. (2002). Social capital, microfinance, and the politics of development. Feminist Economics, 8(1), 1-24. Raykov, T., & Marcoulides, G. A. (2006). A first course in structural equation modelling (2nd ed.). Mahwah, NJ: Lawrence Erlbaum. Remenyi, J. (1991). Where credit is due. London: Intermediate Technology Publications. Remenyi, J. (1999a). Microfinance for poverty reduction: Unit guide. Geelong, Australia: Deakin University. Remenyi, J. (1999b). An interpretive essay on microfinance: Is microfinance a panacea for poverty? In J. Remenyi, Microfinance for poverty reduction: Unit guide (pp. 8-26). Geelong, Australia: Deakin University.
361
Remenyi, J. (2000). Is there a ‘state of the art’ in microfinance? In J. Remenyi & B. Quinoñes, Microfinance and poverty alleviation: Case studies from Asia and the Pacific (pp. 25-61). London: Pinter. Riding, A. (1985). Distant neighbors: A portrait of the Mexicans. New York: Vintage Books. Robins, J. A., Tallman, S., & Fladmoe-Linquist, K. (2002). Autonomy and dependence of international cooperative ventures: An exploration of the strategic performance of U.S. ventures in Mexico. Strategic Management Journal, 23, 881-901. Rosintan, D. M., Panjaitan-Drioadisuryo, R. D. M., & McCloud, K. (1999). Gender, self-employment and microcredit programs: An Indonesian case study. Quarterly Review of Economics and Finance, 39, 769-779. Saad, G. (2006). Applying evolutionary psychology in understanding the Darwinian roots of consumption phenomena. Managerial and Decision Economics, 27, 189-201. Sadoulet, L. (1999). Credit for the poor: An analysis of microfinance contracts with applications to Guatemala. Princeton, NJ: Princeton University, dissertation. Safilios-Rothschild, C. (1984). The role of family in development. In S. E. M. Charlton, Women in Third World development (pp. 45-51). Boulder: Westview Press. Salinas Occelli, C. E. (2005). Political and social roots of economic vices and virtues: Evidence from Mexico. Cambridge, MA: Harvard University, dissertation. Samuelson, P. A., & Nordhaus, W. D. (2001). Economics (17th ed.). New York: McGraw-Hill Irwin. Sánchez, S. M., & Pagán, J. A. (2001). Explaining gender differences in earnings in the microenterprise sector. In E. G. Katz & M. C. Correia (Eds.), The economics of gender in Mexico: Work, family, state, and market
(pp. 174-203). Washington D. C.: The World Bank. Sarhad Rural Support Programme (n.d.). Microfinance programme of SRSP. Retrieved July 31, 2008, from
http://www.srsp.org.pk/srsp-competencies/microfinance-srsp.html Schaefer, R. T. (2004). Sociology: A brief introduction (5th ed.). New York: McGraw Hill. Schreiber, J. B., Nora, A., Stage, F. K., Barlow, E. A., & King, J. (2006). Reporting structural equation modeling and confirmatory factor analysis: A review. Journal of Educational Research, 99(6), 323-337. Schumacker, R. E., & Lomax, R. G. (2004). A beginner’s guide to structural equation modelling (2nd ed.). Mahwah, New Jersey: Lawrence Erlbaum Associates. Seelos, C., & Mair, J. (2007). Profitable business models and market creation in the context of deep poverty: A strategic view. Academy of Management Perspectives, 21, 49-63. Sen, A. (2000). Development as freedom. New York: Anchor Books. Shweder, R. A., & Bourne, E. J., (1982). Does the concept of the person vary? In
362
A. J. Marsella & G. M. White (Eds.), Cultural conceptions of mental health and therapy (pp. 97-137). Dordrecht, Holland: D. Reidel.
Simanowitz, A., & Walter, A. (2002). Ensuring impact: Reaching the poorest while building financially self-sufficient institutions, and showing improvement in the lives of the poorest women and their families. In S. Daley-Harris (Ed.), Pathways out of poverty: Innovations in microfinance for the poorest families (pp. 1-74). Bloomfield, CT: Kumarian.
Singelis, T. M., Triandis, H. C., Bhawuk, D. P. S., & Gelfand, M. J. (1995). Horizontal and vertical dimensions of individualism and collectivism: A theoretical and measurement refinement. Cross-Cultural Research, 29, 240-275.
Singleton, R. A., Straits, B. C., & Miller Straits, M. (1993). Approaches to social research (2nd ed.). New York: Oxford University. Stiglitz, J. E. (1990). Peer monitoring and credit markets. World Bank Economic Review, 4(3), pp. 351-366. Tigges, L. M., & Green, G. P. (1994). Small business success among men- and women-owned firms in rural areas. Rural Sociology, 59(2), 289-310. Triandis, H., & Gelfand, M. J. (1998). Converging measurement of horizontal and
vertical individualism and collectivism. Journal of Personality and Social Psychology, 74(1), 118-128.
Vander Zanden, J. W. (1990). The social experience: An introduction to sociology (2nd ed.). New York: McGraw-Hill. Varian, H. (1990). Monitoring agents with other agents. Journal of Institutional and Theoretical Economics, 146, 153-174. Velasco, C., & Marconi, R. (2004). Group dynamics, gender and microfinance in Bolivia. Journal of International Development, 16, 519-528. Walker, B. W. (1986). Authentic development in Africa. New York: Foreign Policy Association. Webb, J. W., Tihanyi, L., Ireland, R. D., & Sirmon, D. G. (2009). You say illegal,
I say legitimate: Entrepreneurship in the informal economy. The Academy of Management Review, 34(3), 492-510.
Weiten, W., & Lloyd, M. A. (1997). Psychology applied to modern life: Adjustment in the 90s (5th ed.). Pacific Grove, CA: Brooks/Cole. Williamson, O. E. (Ed.) (1995). Organization theory: From Chester Barnard to the present and beyond. New York: Oxford University. Worchel, S., Cooper, J., Goethals, G. R., & Olson, J. M. (2002). Psicología social. México: Thomson. Wydick, W. B. (1996). Credit access for household enterprises in developing countries under asymmetric information. Berkeley, CA: University of California at Berkeley, dissertation. Wydick, W. (1999). Can social cohesion be harnessed to repair market failures? Evidence from group-based lending in Guatemala. Economic Journal, 109(457), 463-475. Wydick, B. (2001). Group lending under dynamic incentives as a borrower discipline device. Review of Development Economics, 5(3), 406-420. Wydick, B. (2002). Microfinance among the Maya: Tracking the progress of
363
borrowers. Development and Change, 33(3), 489-509. Yin, R. K. (2003). Case study research: Design and methods (3rd ed.). Thousand Oaks, CA: Sage. Young, E. M. (1997). World hunger. London: Routledge. Yunus, M. (2003). Banker to the poor: Micro-lending and the battle against world poverty. New York: PublicAffairs. Zeller, M. (1998). Determinants of repayment performance in credit groups: The role of program design, intra-group risk pooling and social cohesion. Economic Development and Cultural Change, 46(1), 599-620.