40
Wirral Open Space Assessment Update - December 2012 1 LOCAL DEVELOPMENT FRAMEWORK FOR WIRRAL CORE STRATEGY LOCAL PLAN WIRRAL OPEN SPACE ASSESSMENT UPDATE DECEMBER 2012

Wirral Open Space Assessment Update - December 2012 1
LOCAL DEVELOPMENT FRAMEWORK FOR WIRRAL
CORE STRATEGY LOCAL PLAN
WIRRAL OPEN SPACE ASSESSMENT UPDATE
DECEMBER 2012

Wirral Open Space Assessment Update - December 2012 2
[blank for copying]

Wirral Open Space Assessment Update - December 2012 3
Contents 1 Introduction 05 2 Methodology 13 3 Analysis of Current Provision 16 Parks and Gardens 18 Natural and Semi-Natural Greenspace 21 Outdoor Sports Facilities 24 Amenity Greenspace 27 Provision for Children and Young People 30 Allotments and Community Gardens 32 Cemeteries and Church Yards 35 Indoor Recreation 36 4 Appendices 37

Wirral Open Space Assessment Update - December 2012 4
[blank for copying]

Wirral Open Space Assessment Update - December 2012 5
1 Introduction
Definition of Open Space 1.1 The most complete description of open space comes from the Council of Europe Recommendation No.
R (86)11 of the Committee of Ministers States on Urban Open Space, which revised by the Institute of Leisure and Amenity Management states:
“Urban parks and green spaces are an essential part of the urban heritage and infrastructure, being a strong element in the architectural and landscape character of towns and cities, providing a sense of place and engendering civic pride. They are important for enabling social interaction and fostering community development, as well as providing an outdoor classroom for biological and ecological studies. Public green spaces help to conserve natural systems, supporting ecosystems and providing the contrast of designed landscapes and conserved wildlife habitats within our urban settlements”.
1.2 Open space can also offer significant benefits for health and wellbeing. 1.3 The Town and Country Planning Act 1990 defines open space as land laid out as a public garden or
used for the purpose of public recreation or previously used as a burial ground but does not go far enough in recognising the variety of open space types, both private and public, that is currently available within the Borough.
1.4 Open space for the purpose of developing this report is the collective term that pulls together the
provision of parks and public gardens, natural open spaces including nature reserves and public woodlands, facilities for outdoor sports, amenity areas, children’s play areas, allotments, cemeteries and crematoria
1.5 This Open Space Assessment was developed prior to the publication of the National Planning Policy
Framework (NPPF), in line with previous guidance under Planning Policy Guidance Note 17, which has now been cancelled.
1.6 Calculations have been undertaken at a Settlement Area level to accord with those areas defined within
the emerging Core Strategy for the Borough. 1.7 The audit on which this study is based was undertaken by independent consultants, Strategic Leisure,
during July and August 2008. The audit examined the range and quality of provision in the Borough’s parks and open spaces, natural green spaces, allotments, children’s play areas, outdoor sports facilities, cemeteries and crematoria.
1.8 Each site was visited and evaluated by auditors who assessed the sites against national best practice
methodologies. The results of the audit were then collated to provide an analysis of the various types of open space within the Borough.
1.9 The outcome is an analysis of the type, quantity, quality and accessibility of open space based on latest
available local evidence. The typologies for Wirral are identified in Figure 1.1 below.

Wirral Open Space Assessment Update - December 2012 6
Figure 1.1 – Wirral Open Space Typologies
Typology Primary Purpose
Parks and Gardens:
Intensively managed sites providing accessible, high quality opportunities for formal and informal recreation and children’s play including community events.
Natural and Semi Natural Green Space
Less intensively managed sites, including woodlands, providing accessible opportunities for informal recreation and the appreciation of nature and wildlife including wildlife conservation, biodiversity and environmental education.
Outdoor Sports Facilities
Sites providing for participation in formal outdoor sports such as pitch sports, tennis, bowls, athletics or countryside and water sports.
Amenity Green Space
Smaller scale sites providing opportunities for informal activities close to home or work or for the enhancement of the appearance of residential or other areas.
Provision for Children and Young People
Sites and facilities specifically designed and managed for play and social interaction by children and young people, such as equipped play areas, ball courts, skateboard parks and teenage shelters.
Allotments
Sites providing opportunities for people who wish to grow their own produce offering benefits for the promotion of sustainability, health and social inclusion.
Cemeteries and Churchyards
Sites which may provide additional opportunities for quiet contemplation and natural wildlife.
1.10 The audit included all open space across the Borough to which there was legitimate public access. The
majority of sites were under the ownership and management of Wirral Council but the audit also included privately owned land with public access and land held and managed for open space and recreation by other bodies such as Registered Social Landlords, the National Trust, the Woodland Trust and the Port Sunlight Village Trust.
1.11 Private land with no public access, including domestic gardens, agricultural land and the wider
countryside, the public rights of way network, beaches, coastal promenades and walkways were not included.
1.12 The collection and analysis of data has been restricted to sites within the administrative boundary of the
Metropolitan Borough of Wirral.

Wirral Open Space Assessment Update - December 2012 7
The Importance of Open Space
1.13 Open space is important for formal and informal recreation, local amenity and quality of life but can also
contribute to the wider social agendas of helping to improve mental and physical health, local pride and identity, environmental education, environmental quality and biodiversity.
Health 1.14 The health benefits of open space are well documented. Access to good quality, well maintained open
space has significant impact on our physical health and mental well being. They provide opportunities to enjoy the natural world and to get involved in a wide range of leisure activities; they encourage people to walk more, to participate in sport or to simply enjoy the green and natural environment. The more attractive and accessible the green space is, the more likely it is to be used by a wide range of people. It has long been accepted that physical activity is a major contributor to good health and can reduce coronary heart problems, diabetes, certain cancers and mental health problems. Trees and woodlands can also help to reduce the effect of urban pollution and allotments can provide an opportunity for the promotion of more sustainable and organic lifestyles. There are also health benefits associated with access to more wild and natural areas in terms of their benefits to mental health and stress relief.
Sense of Place and Civic Pride 1.15 Well managed, good quality open spaces can improve the appearance of an area and can attract
tourists and visitors. Good quality open spaces and areas for wildlife can also help to create a positive image for an area, helping to attract inward investment and new residents, supporting local regeneration and housing market renewal. At the local level they can stimulate local pride and make people feel good about where they live and work.
1.16 Research by national organisations such as the Commission for the Built Environment (Does Money
Grow on Trees? CABE 2005) indicates that property values can be higher, by as much as 10%, in areas with good quality open space. Open spaces can also contribute to community cohesion by bringing people together, by providing meeting venues and by providing social spaces for a wide variety of events and activities. They can form an essential part of urban heritage, such as at Birkenhead Park and Port Sunlight Village, exert a major influence on urban fabric and play an integral role in providing for balanced and sustainable communities.
Education 1.17 Open spaces can provide a valuable resource for all-age education as outdoor classrooms, spaces for
training in vocations such as nature conservation, horticulture, community work, landscaping, forestry and sports development and can provide an important environment for children to learn and play through physical exercise and social interaction.
Environment 1.18 Open spaces can provide an essential role in supporting diversity, by providing habitat and a rich
variety of flora and fauna. This is of particular importance in an increasingly urbanised society where urban expansion has meant that true countryside has become increasingly distant from most people. Open space is being recognised as having an increasingly important role to play in mitigating the effects of climate change, through urban cooling and the provision of shade and shelter, helping to store carbon or providing temporary storage of flood water. Open spaces can also act as part of a wider network of wildlife corridors that allow the migration of plants and animals from one area to another, acting as important stepping stones between urban and rural habitats.
Economy
1.20 There are also economic benefits in terms of the attraction of visitors and tourists and the provision of
employment in the provision and maintenance of sports and other community facilities, including retailing.

Wirral Open Space Assessment Update - December 2012 8
Current Policies 1.21 The Council’s existing Unitary Development Plan (UDP), which was adopted in February 2000, provides
for the protection of urban greenspace, sports grounds, allotments and children’s play facilities. It also provides for the provision of artificial playing pitches and floodlighting, sites for new children’s play equipment, open space within new housing developments and for new facilities for sport and recreation at Wirral Sports Centre, the Bebington Oval Sports Centre and Leasowe Recreation Centre.
1.22 Sites to be protected or promoted for new development were shown on a site-specific Proposals Map.
Recreation sites within the Green Belt were not, however, idenitified on the Proposals Map because of the additional protection provided in national policy for open land in the Green Belt, which also specifically permits the provision of facilities for outdoor sport and outdoor recreation.
Urban Greenspace 1.23 Section 8 of the UDP deals with policies for Urban Greenspace. Policy GRE1 provided for the supply
and distribution of accessible public open space close to where people live, located within a comfortable walking distnace from their homes, to provide for a range of recreational opportunities within each area of the Borough.
1.24 The UDP used two quanitifiable measures to assess the provision of accessible public open space – a
minimum standard for overall supply to relate the total amout of available land to the number of people resident wthin an area and a network analysis to relate the location of available land with its accessibility to local people.
1.25 The minimum standard for the supply of accessible public open space was 2.4 hectares for every
thousand people, applied to each local area with a distinct and separate community identity. A local deficiency is indicated where the total area of accessible public open space available to that community, when compared to the total resident population, falls below that standard.
1.26 The network analysis was based on the principle that no part of the Primarily Residential Area should
be further than a comfortable walking distance away from a local park or similar space available for public use, taken in the UDP to be 400 metres. The basic network was therefore defined by drawing 400 catchment areas around all accessible public open spaces of 1.5 hectares and above, illustrated on a map within the adopted Written Statement. Areas of deficiency were identified as falling outside the catchment of this basic network.
1.27 The UDP also recognised that the basic network was also supplemented by smaller spaces, intended to
serve a more limited catchment area, with a secondary role often as local play space for children, which was also worthy of protection, particularly where they served an area otherwise outside the catchment of a local park but that these smaller spaces should not be relied upon to provide for the main recreational needs of local residents.
1.28 The implications of both these quantifiable measures were to be taken together in assessing overall
deficiencies within an area but priority was to be given to maintaining the basic network of accessible public open space.
1.29 The standard of 2.4 hectares for every thousand people was based on the total area recommended in
the National Playing Field Association (now Fields in Trust) 6-acre standard but did not protect the different types of provision specified in that standard on the basis that the overall content of provision within each space up to that level was a matter for individual demand–led site-management decisions. No provision was made for the assessment of quality in the UDP.
1.30 Sites for specific protection within the urban area were identified on the Proposals Map under Proposal
GR2. The amount of land exceeded the standard in some areas to reflect the inclusion of whole sites such as established district parks. Many Urban Greenpace sites also included other facilities such as playing fields, tennis courts, bowling greens, games courts, play areas and allotments and other supporting facilities such as chnaging rooms and car parks, as an indication that the land would continue to be protected as open space, even if the facilities themselves were subsequently removed.

Wirral Open Space Assessment Update - December 2012 9
1.31 Policy GR1 provides for the protection of land designated as Urban Greenspace unless the site was to
continue in use for open air recreation or alternative provision of equivalent community benefit was to be made available, which normally means the provison of an appropriate equivalent replacement facility in a nearby location.
1.32 Policies for Urban Greenspace have successfully protected the majority of the sites designated under
Proposal GR2. The only sites lost have related to the remodelling of social housing estates where the layout and location of the open space had attracted prolonged anti-social behaviour. Examples include Grenville Road Open Space (GR2/43, which was replaced by new housing and a smaller play area at Strathlorne Close); Bidston Community Woodland (GR2/13, which has now been developed for private housing in return for a commuted sum to fund additional provision elsewhere within the Beechwood Estate); a poor quality school playing field provided as part of Tollemache Recreation Ground (part of GR2/5, which was replaced by a new school playing field at Bidston Hill and a replacement open space adjacent to the existing play area); and a smaller site at Harding Aveue, Bebington (GR2/59, which was given over as gardens to surrounding residents following a local petition).
1.33 Smaller more partial losses have also been allowed at Greasby Road Open Space (GR2/196, to
facilitate the construction of a new medical centre), Pasture Road Open Space (GR2/149, for a new medical centre which has not yet been constructed); Hillhouse Grounds (GR2/219, which allowed the loss of a narrow landscape strip to faciliatate an adjoing housing develoment); and Gautby Road Recreation Ground (GR2/6, to faciltate the provision of a new industrial acesss road to the Valley Road Industrial Estate).
1.34 A number of other sites have also been lost to school re-construction and remodelling projects, for
example at Weatherhead High School (GR2/102, which provided an improved configuration of school sports facilities on backland amenity grassland adjacent to the M53 Motorway); and Mosslands High School, Wallasey (GR2/102, which provided for improvements to School Lane Playing Fields).
1.35 Smaller greenfield sites which were not shown for protection on the Proposals Map have, however,
been allowed to be developed because of their proximity to larger open spaces, such as Fairview South in Bromborough, which has now been developed for housing.
1.36 While Policy GR1 allows for additional facilities to be provided for visitors, sport or play and for the
protection of visual amenity or nature conservation value, it cannot however require any particular type or quality of facility or maintenance to be provided or retained within any particular site.
1.37 Policy GR3 and Proposal GR4 provide a similar protection for urban allotments. No allocated sites
have been lost to development, although a large area of disused plots at Love Lane Allotments, designated under Proposal GR2/129 was formally transferred to the adjacent parkland at Central Park in Liscard.
1.38 Although no specific provision was made for new sites in the UDP, additional space has been provided
at Coronation Buildings, West Kirby (on disused land in the Green Belt) and at Birkenhead Park (on a disused school playing field designated for protection under Proposal GR2/30). Public allotments also benefit from additional statutory protection under legislation separate to the Planning Acts.
1.39 Policy GR3 and Proposal GR4, again, cannot require any particular type or quality of facility or
maintenance to be provided or retained within any particular site. 1.40 Policy GR6 in the UDP applied the standard of 2.4 hectares for every thousand people to the provision
of new open space in new family housing developments in areas not otherwise served by a local park, which has led to the provision of over 12.7ha of new open space and 7 new childrens play areas.
1.41 Improvements were also provided in lieu of on-site provsion at Newton Park, where a stand of mature
trees was agreed to be retained as part of the on-site provision of publicly accessible open space, which would have prevented the safe on-site provision of children’s play equipment beneath them or required their removal. Policy GR6 was also used alongside a land swap with a developer to provide the new community park at Noctorum Way (under Proposal HS2 and Proposal GR2/36).

Wirral Open Space Assessment Update - December 2012 10
1.42 Additional community open space has, however, also been provided on un-allocated areas as part of a variety of public funding initiatives including The Gorse, New Brighton; Rock Park Pocket Park; Prenton Dell; and Holt Hill, Tranmere and through the reclamation of waste disposal sites at Bidston Moss (36.33ha) and Bromborough Landfill (25.59ha, which is ongoing).
1.43 Limitations with Policy GR6 include its exclusive application to new family housing, rather than flat or
appartment schemes; and the thresholds and conditions that were required to get through the public inquiry process, which mean that development within an easy walking distance of an existing local park does not make any contribution to the increasing demands that it may place on that or any other open space within the area.
1.44 In some cases developers have also provided fewer dwellings to avoid the requirement to provide
additional open space and fall below the threshold of 36 dwellings that is necessary to ensure that the provison of a reasonable sized and useful open space is a viable proposition.
1.45 Although Policy GR6 provides for the provison of an equipped children’s play area, no provision is
made for alternative forms of provision that may be more appropriate to the type of development or locality. Difficulties have also been experienced where purchasers do not realise that their new home will be in close proximity to a childrens play area or where new residents have been unable to contribute to discussions about the type or location of on-site provision agreed when planning permission was orignally granted.
1.46 In all cases, the size, value and location of the new provision being made has been limited by the scale
and location of the residential development being proposed and constructed. 1.47 Recent developments have also sought to establish resident management companies to avoid the
additional costs associated with meeting the Council’s adoption standards.
Sport and Recreation
1.48 Section 9 of the UDP deals with Sport and Recreation and included proposals for new facilities based
on the Council’s then current assessments of local need. 1.49 While the overall provision of formal outdoor playing space was tested against the NPFA (now Fields in
Trust) 6-acre standard, no ongoing standard was applied for the provision of individual types of facility: based on the likely availability of public resources; the assumption that the overall content of provision within each protected outdoor space would continue to be a matter for individual demand–led site-management; and the absence of national policy support at that time. Again, no provision was made for the assessment of quality in the UDP.
1.50 The lack of a policy for particular types of sports facility has not, however, led to the loss of many
facilities to development. The main losses have been bowling greens, for example, at the former Warren Club, Wallasey and Stork Social Club, Bromborough, both to residential development; and the removal of a green that could not be maintained at a designated Urban Greenspace in Port Sunlight (GR2/77). Other facilities have also continued to be removed from sites where they can no longer be maintained to an appropriate standard, such as the former tennis courts at Central Park, Liscard (GR2/129) and at Meols Lower Green Recreation Ground (GR2/175).
1.51 Standards for playing fields were, however, included in Policy RE5, based on the (then) national
standard of 1.21 hectares for every thousand people, which was eventually superseded by the Wirral Playing Pitch Strategy, funded by Sport England and adopted by the Council in 2004, which showed a local demand for only 1.0 hectare for every thousand people. The Wirral Playing Pitch Strategy did, however, directly address the quality of existing provision, in terms of assessing the capacity for play at each site including issues such as drainage, levels of use and the need for additional facilites to meet latent demand. Work on an update to the Playing Pitch Strategy is expected to begin towards the end of 2012.
1.52 Policy RE5 and Policy RE7, an equivalent policy for school playing fields, subsequently ceased to
remain in force following a Direction issued by the Secretary of State in September 2007, on the basis that they were out-of-date and merely re-stated national policy for the protection of playing fields.

Wirral Open Space Assessment Update - December 2012 11
1.53 Sports grounds and playing fields identified for specific protection within the urban area have however
continued to be retained on the UDP Proposals Map under Proposal RE6. 1.54 The only site to be lost, at Moreton Sports Ground (Proposal RE6/6) was developed for housing
following replacement provision of a playing pitch with changing rooms and car park in the Green Belt at nearby Upton Park. Planning appeals against the refusal of planning permission have however been dismissed at Moreton Sports Ground (Proposal RE6/6, prior to replacement provision being secured), Glenavon Road Playing Field (Proposal RE6/15) and for a small residential scheme on part of the Old Parknonians Association Sports Ground (Proposal RE6/13). A major development at Upton Cricket Club (Proposal RE6/8) was refused but subsequently withdrawn. A planning application for residential development at Inglebrough Road (Proposal RE6/19) with replacement provision proposed at Woodchurch Leisure Centre, is currrently being considered.
1.55 The proposal to provide additional replacement sports facilities to allow additional industrial
development at Premier Brands (Proposal RE6/7) has not been implemented, following the lapse of outline planning permission, the loss of a planning appeal against the refusal of permission for residential development on one of the employment sites at Reeds Lane and the disuse of the existing factory playing fields.
1.56 A number of sites, which have fallen out of use have however been re-used, including The Glen,
Woodchurch Road (former Old Instonians RUFC, Green Belt); Elm Grove, Hoylake (Green Belt); Prices Sports Ground (Proposal RE6/21); Bromborougn Pool Cricket Ground (Proposal RE6/22); Birkenhead Wayfarers Cricket Ground (Proposal GR2/12); Conway Playing Fields (Proposal GR2/40); and Victoria Park in Poulton (Proposal RE6/5).
1.57 School playing fields previously subject to Policy RE7 are also still shown on the UDP Proposals Map.
Sites at Claremount School, Mosslands Lower School, Calday Grammar, Upton Hall Convent and sites associated with the on-site remodelling of a number of other school sites have been replaced by alternative sports facilities. Additional controls outside the planning system require the disposal or change in the use of a school playing field to be confirmed by the Secretary of State.
1.58 Policy RE8 has successfully seen the construction of thirteen new artificial turf facilities at Caldy, West
Kirby, Pensby and Woodchurch (Green Belt), Bidston Sports Centre (RE2/3) Bebington Oval (Proposal RE2/1 and Proposal GR2/48), Birkenhead High School, Weatherhead High School, Upton Hall Convent, Oldershaw School, Park High Lower School (Proposal RE7) and Birkenhead Park RUFC (RE6/10).
1.59 Proposals RE2 to RE4 also provided for the provision of additional facilities for sport and recreation at
specific sites, to meet needs identified in adopted sport and recreation strategies. 1.60 The land for Beechwood swiming pool (Proposal RE4) was subseqently developed as a Multi-Use
Games Area; the swimming pool identified for Bromborough and Eastham (Proposal RE3) has subsequently provided as part of a hotel and at an indoor health and fitness facility; sites at the Bebington Oval (Proposal RE2/1) and Bidston Sports Centre (Proposal RE2/3) have been further developed to provide floodlit games courts; land at Leasowe Recreation Centre has been used as a central venue for mini-soccer by the Wallasey Junior League (Proposal RE2/2); and indoor and outdoor facilities have been provided as part of a new-build, dual-use facility at the Pensby Schools (Proposal RE3).
1.61 A series of new sports halls have also been provided at Woodchurch, Park High, Birkenhead School,
Birkenhead High School, St Anslems College, Wirral Grammar for Boys, Bebington High School, Weatherhead School, Mosslands School, Wallasey School, Hilbre High School, South Wirral High School and smaller more local facilities at Christchurch CE Primary, St Jospehs RC Primary, Rock Ferry Primary and Gilbrook School. Proposals where public funding has not been available have not, however, been implemented.
1.62 A revised Built Facilities Strategy is also currently in preparation. 1.63 Policy RE11 provides for the protection and replacement of childrens play equipment, where new
development is proposed that could lead to the removal of an existing facility.

Wirral Open Space Assessment Update - December 2012 12
1.64 As with the majority of policies mentioned above, Policy RE11 has not been successful at securing the
reinstatement or replacement of facilities or equipment that have had to be removed for safety reasons or which cannot continue to be maintained at an appropriate standard, where no future development proposal is envisaged.
1.65 Proposal RE12 identified six sites for the provision of new play equipment, of which only one has
subsequently been provided, at Holm Lane Recreation Ground (RE12/3). New and replacement play equipment, including MUGAs and outdoor basketball facilities, have however been provided with a number of other existing open spaces, including new sites at Bedford Road, Rock Ferry; Lincoln Street; Beechwood; and Pembroke Court, as part of proposals independent from Policy RE11 or Proposal RE12.
1.66 A summary of the overall balance of change in the provision of open space since the UDP was placed
on deposit in July 1994 is shown in Appendix 1. The current distribution of publicly accessible open space is shown in Appendix 2.
National Policy 1.67 The National Planning Policy Framework, which replaced the previous more detailed advice in Planning
Policy Guidance Note 17, in March 2012, now states that
“73. Access to high quality open spaces and opportunities for sport and recreation can make an important contribution to the health and well-being of communities. Planning policies should be based on robust and up-to-date assessments of the needs for open space, sports and recreation facilities and opportunities for new provision. The assessments should identify specific needs and quantitative or qualitative deficits or surpluses of open space, sports and recreational facilities in the local area. Information gained from the assessments should be used to determine what open space, sports and recreational provision is required.
74. Existing open space, sports and recreational buildings and land, including playing fields, should not be built on unless:
● an assessment has been undertaken which has clearly shown the open space, buildings or land to be surplus to requirements; or ● the loss resulting from the proposed development would be replaced by equivalent or better provision in terms of quantity and quality in a suitable location; or ● the development is for alternative sports and recreational provision, the needs for which clearly outweigh the loss.”

Wirral Open Space Assessment Update - December 2012 13
2 Methodology 2.1 The audit was undertaken in three stages:
• Stage 1 - Initial work undertaken to establish an open space database.
• Stage 2 - Digital mapping.
• Stage 3 – Site visits to all identified sites above 0.2 hectares in size.
Stage 1 2.2 An initial audit was carried out to identify a comprehensive list of sites for both public and private
provision and the setting of the initial typologies and standards for parks and green space.
Stage 2 2.3 The initial audit was refined using GIS to define accurate site boundaries, identify land owners and
maintenance responsibilities and identify any other features that may be contained within each site to enable the broad type of each site to be identified.
Stage 3 2.4 A site visit and general quality audit was undertaken of all sites of 0.2ha or above unless the site
contained some sort of fixed equipment for sport or play, to confirm the features contained within each site and the broad classification of each site to guide the later data analysis contained within this report.
Initial Quality Audit 2.5 A quality audit of all sites where public access was permitted was undertaken by consultants Strategic
Leisure during summer 2008 and provides a snapshot of the overall condition of sites across the Borough against a common set of criteria broadly based on the national quality standard for parks, the Green Flag Award scheme.
2.6 A pro-forma was produced to enable the information to be recorded in a consistent manner and to allow
the following criteria to be considered:
• Welcoming
• Good and safe access
• Signage
• Equal access for all
• Equipment and facilities
• Personal security
• Dog fouling
• Quality of facilities
• Litter and waste management
• Grounds maintenance
• Conservation of natural features, wild fauna and flora
• Provision of appropriate marketing information
• Building and infrastructure maintenance
• Arboriculture and woodland management
• Conservation of landscape features
• Conservation of buildings and structures
• Appropriate provision for the community
2.7 Further information was also captured to identify:
• Outdoor activities for children
• Outdoor sports facilities
• Toilets, changing rooms and refreshment provision
• Park furniture 2.8 The quality assessment was based on a subjective view of the level and extent to which each facility
was seen as being ‘fit for purpose’ and considered factors such as accessibility, safety, management, maintenance and overall impression. It also considered the presence of fixtures such as benches, bins,

Wirral Open Space Assessment Update - December 2012 14
gates, signage hedges trees and paths. 2.9 Scores were allocated to each feature to provide a means of comparing sites by type. The score was
then translated into a percentage to enable further comparative analysis of the overall quality of provision within each area.
2.10 A list of the criteria applied to the scoring of each typology is summarised in Figure 2.2 below:
Figure 2.2 –Wirral Typology
TYPOLOGY ASSESSMENT CRITERIA
Parks and Gardens • Entrance areas
• Presence and quality of signage and information
• Boundary fencing and hedges
• Tree management
• The quality of key furniture including seats, bins, toilets
• The quality of maintenance, grass cutting, pathways
• Cleanliness The quality of specific facilities including play provision, bowling greens and multi-use games areas was included in the separate assessment for Outdoor Sports Facilities and Provision for Children and Young People.
Natural & Semi Natural Green Space
• Entrance areas
• Presence and quality of signage and information
• Boundary fencing and hedges
• Tree management mature and young trees
• The quality of key furniture including seats, bins
• Natural Grass Areas
• The quality of maintenance, grass cutting, pathways
• Cleanliness
Outdoor Sports Facilities • Entrance areas
• Presence and quality of signage and information
• Boundary fencing and hedges
• Tree management mature and young trees
• The quality of key furniture including seats, bins
• The quality of maintenance, grass cutting, pathways
• Cleanliness
• Facility Assessment (pitches, greens, courts etc)
Amenity Green Space • Presence and quality of signage and information
• Boundary fencing and hedges
• Tree management
• The quality of key furniture including seats, bins
• The quality of maintenance, grass cutting, pathways
• Cleanliness
Provision for Children and Young People
• Overall site features including access gates, whether the area is pollution and noise free, presence of shade, access for the disabled, appropriate signage, locally related features and seating
• Ambience including layout, visual appeal, presence of litter or graffiti
• Equipment for Toddlers, Juniors and Teenagers have been assessed as discrete elements within the overall play value assessment and considered play opportunities with regards to:
� Balancing

Wirral Open Space Assessment Update - December 2012 15
TYPOLOGY ASSESSMENT CRITERIA
� Jumping � Crawling � Gliding � Rotating � Sliding � Rocking � Ball Play � Wheeled Play � Agility � Sand and Water Play
Allotments • Entrance areas
• The presence of water supply
• Whether the site is served by toilets
• Secure fencing around the site
• Signage to identify management, usage arrangements, special events and the availability of plots
• The presence of facilities such as composting bins, a shop and car parking.
Cemeteries and Churchyards
• Main entrance safety and cleanliness
• Signage
• Upkeep and safety of the graves/memorials
• Quality of roads and pathways
• Provision of bins and seats
• Boundary fencing and hedges
2.11 The initial quality score only records the quality of the site at the time of the site visit and against the
criteria chosen for the assessment. The Council is currently preparing its own local standards for levels of provision and maintenance to be applied across the Borough on the Council’s own sites.
2.12 For the assessment of allotments, the pro-forma was modified to take account of audit guidance from
the National Association of Allotment and Leisure Gardeners Association. 2.13 For the assessment of children’s play, the pro-forma was modified to take account of factors identified
in the Royal Society for the Prevention of Accidents (ROSPA) Play Value Assessment. 2.14 The quality scores recorded for each site are recorded in Appendix 3 to this report.
Assessing Accessibility 2.15 An assessment of accessibility has also been undertaken to identify the number of households likely to
fall within a reasonable catchment area for each of the sites identified. 2.16 A distance of 400m was used for sites likely to provide publicly accessible open space, based on the
walking distance applied in the existing Unitary Development Plan for Wirral. 2.17 For more demand led facilities, such as outdoor sports and allotments, a distance of 1000m was used
to follow best practice advocated by Sport England and the Fields in Trust (Formerly the NPFA). 2.18 The adopted thresholds for each type of open space are identified in Figure 2.3;
Figure 2.3 - Accessibility Threshold by Strategic Grouping
Typology Accessibility Distance Threshold
Parks and Gardens 400 metres Natural and Semi Natural Green Space 400 metres Outdoor Sports Facilities 1000 metres Amenity Green Space 400 metres

Wirral Open Space Assessment Update - December 2012 16
Provision for Children and Young People 400 metres Allotments 1000 metres
2.19 The accessibility considerations are based on the number of residential addresses within each of the
distance thresholds calculated using GIS digital mapping based on the Council’s Local Land and Property Gazetteer.
3 Analysis of Current Provision 3.1 This section summarises the findings of the audit and identifies the key issues that have emerged for
the quantity, quality and accessibility of provision for each type of open space.
3.2 All the sites identified have been plotted using GIS and the size of each site determined electronically, to provide an analysis of the level of provision across the Borough and within each Settlement Area.
3.3 Appendix 4 shows the boundaries used for each of the Settlement Areas identified in the emerging
Core Strategy Local Plan for Wirral and lists the areas of the Borough falling within each Settlement Area. Appendix 5 shows the final inventory and classification of each site within each Settlement Area and typology.
3.4 Population figures are based on the ONS mid-year estimates for 2010.
Analysis by Overall Type and Quantity of Provision
3.5 Figure 3.1 summarises the overall quantity of open space in Wirral by type:
Figure 3.1 Summary of Open Space by Typology
Typology Number of sites
Total area (hectares)
Provision per 1,000 population (hectares)
Parks and Gardens 49 607.90 1.97ha/1,000
Natural and Semi Natural Green Space 83 506.27 1.64ha/1,000
Outdoor Sports Facilities 244 1199.38 3.88ha/1,000
Amenity Green Space 138 118.26 0.38ha/1,000
Provision for Children and Young People 141 33.62 0.11ha/1,000
Allotments 47 54.06 0.18ha/1,000
Cemeteries and Churchyards 54 110.60 0.36ha/1,000
3.6 The calculations for Outdoor Sports Facilities, Provision for Children and Young People and Allotments,
includes provision made within other typologies, such as Parks and Gardens, which often perform a wide range of alternative functions. Areas of open space within other typologies that may also be natural and semi-natural have not, however, been separately identified.
3.7 There is limited and often conflicting advice on national standards of provision, the most common of
which are referred to below. 3.8 Fields in Trust (formerly the National Playing Fields Association) recommend 1.6-1.8 ha of open space
for formal sport for youth and adult use with a minimum of 1.2ha per 1000 being for pitch sport. 3.9 The figure for Outdoor Sports Facilities identified in Figure 3.1 includes facilities such as school playing
fields and golf courses, which are normally excluded from the Fields in Trust calculations, which only seek to measure facilities which are available for use by the wider community. Past experience has shown that the level of community use of school playing fields can vary quite widely, year on year, depending on the local management of each school facility. Separate figures for individual sports are

Wirral Open Space Assessment Update - December 2012 17
provided in later sections of this report. 3.10 Fields in Trust also recommend 0.6-0.8 ha per 1000 for children’s playing space (including fixed play
and play space within housing areas). Fixed provision for children and young people, amenity greenspace and more general provision for play within parks can all contribute towards meeting this requirement.
3.11 English Nature (now Natural England) provided advice on standards for natural green space provision
in 1996, known as the Accessible Natural Green Space Standard (ANGSt), issued alongside ‘A Space for Nature’. The standards recommended were:
• an accessible natural green space of at least 2 hectares in size, no more than 300 metres (assumed to represent a 5 minute walk) from home.
• at least one accessible 20 hectare site within two kilometres of home.
• one accessible 100 hectare site within five kilometres of home.
• one accessible 500 hectare site within ten kilometres of home.
• Statutory Local Nature Reserves at a minimum level of one hectare per thousand population. 3.12 Sites classified as Natural and Semi-Natural Greenspace and natural and semi-natural greenspace
provided in sites classified within other typologies can all contribute towards these standards. 3.13 The ANGSt model was reviewed by Natural England in 2003 in ‘Accessible Natural Green Space
Standards in Towns and Cities: A Review and Toolkit’, which identified a number of difficulties with the original approach, including with the definition of natural green space and the exclusion of man-made types of vegetation, which can often also have a high biodiversity value.
3.14 Natural England has yet to adopt revised standards following the review but recommends that the
ecological value of green space should be determined through a Phase 1 Habitat survey, which goes beyond the scope of the assessment undertaken for this more general audit.
3.15 The separate Wirral Biodiversity Audit and Liverpool City Regional Ecological Framework identify the
main statutory and non-statutory nature conservation sites within the Borough, as well as priority habitats, potential wildlife corridors and linkages, priority species and critically important areas for maintaining favourable conservation status of important species and habitats. Sites of Biological and Earth Science Importance are designated on the Unitary Development Plan Proposals Map and further information on the designation of Local Wildlife Sites can be found on the Council’s website.
3.16 Under ANGSt, there would be a requirement for up to 313 ha of land to be officially designated as a
Local Nature Reserve. At present Wirral has only ten sites designated as Local Nature Reserves covering 187ha, implying a potential requirement for a further 126ha of land to be designated as Local Nature Reserve.
3.17 Guidance on assessing allotments is currently vague and informal. The ‘Growing in the Community’
guidance advocated by the Local Government Association and guidance from the National Association of Allotment and Leisure Gardeners identifies some of the issues that need to be considered.
3.18 The Thorpe Report (1969) recommended a minimum standard of 0.2 hectares per 1000 population for
allotments, equivalent to 18 plots per 1000 households based on a plot of 300 square yards. . Applied to Wirral, the Thorpe recommendations would require an additional 7.7 hectares to be provided. The National Society for Allotments would currently recommend 20 standard 300 square yard plots per 1000 households, equivalent to 0.5ha per 1000 population.
3.19 Appendices 6 to 13 show the existing distribution of sites within each typology across the Borough as a
whole.
Overall Quality of Provision
3.20 Initial data on the quality of existing provision has been gathered through the general site assessments
undertaken during each site visit.

Wirral Open Space Assessment Update - December 2012 18
3.21 The analysis indicated that lower quality scores, which often relates to the absence of facilities such as signage, benches, bins and good quality footpaths, tend to be concentrated in the Settlement Areas associated with poorer areas in the east of the Borough.
Accessibility
3.22 Accessibility has been calculated by using the recommended distance thresholds for specific types of
open space from Figure 2.3 by counting the number of residential properties within the catchment area of each site.
3.23 Appendices 14, 15, 22 and 29 to 31 show the catchments for the sites within each typology, across the
Borough as a whole. 3.24 Further work is needed to confirm the local requirement for publicly accessible open space within each
Settlement Area, to confirm the most appropriate local accessibility thresholds for each type of open space and to establish future standards for the quality of provision based on local consultation.
Analysis by Typology 3.25 The position with regard to each separate type of open space is considered in turn below.
Parks and Gardens 3.26 Parks and Gardens provide accessible, high quality opportunities for a range of informal recreation
activities, formal sporting opportunities and community events. The typology includes urban parks, country parks and formal public gardens. Many parks also include important facilities for outdoor sport and recreation, children and young people and additional natural and semi-natural open space.
Quantity – Parks and Gardens 3.27 The audit revealed a total of 55 sites occupying 608 hectares of land and providing a current standard
of 1.97 hectares (ha) for every 1,000 residents across the Borough as a whole, which includes:
• 7 large parks above 20ha in size (406.81 ha or 1.32 ha per 1,000 people) including 5 Country Parks (328.17ha) (note: sites such as Bidston Hill, Thurstaston Common and Dibbinsdale have been classified within the natural and semi natural typology).
• 42 local parks and gardens (201.09ha or 0.65ha per 1,000 people). 3.28 A summary of the quantity of parks and gardens serving each Settlement Area is shown in Figure 3.3..
Figure 3.3 Provision of Parks and Gardens by Settlement Area
Settlement Area
Area population (mid-2010)
Total sites
Total hectares
Hectares per
1,000
Surplus /Deficit
ha
Surplus/Deficit
Ha/1000
Other Sites within 400m
1 Wallasey 58,200 7 45.31 0.78 -69.34 -1.19 100.89
2 Commercial Core
1,700 1 1.40 0.82 -1.95 -1.15 86.99
3 Birkenhead 83,000 6 102.00 1.23 -61.51 -0.74 4.65
4 Bromborough and Eastham
54,500 8 27.97 0.51 -79.40 -1.46 55.20

Wirral Open Space Assessment Update - December 2012 19
Settlement Area
Area population (mid-2010)
Total sites
Total hectares
Hectares per
1,000
Surplus /Deficit
ha
Surplus/Deficit
Ha/1000
Other Sites within 400m
5 Mid Wirral 52,900 4 25.08 0.47 -79.13 -1.50 224.14
6 Hoylake and West Kirby
24,700 6 16.47 0.67 -32.19 -1.30 172.49
7 Heswall 28,100 5 19.49 0.69 -35.87 -1.28 151.34
8 Rural Areas 5,700 12 370.18 64.94 358.95 62.97
Total 308,800 49 607.90 1.97
*data combines four site entries at the Diamond, Port Sunlight and two site entries at Meols Lower Green Recreation Ground into
single sites. The whole of Wirral Country Park is classified within Settlement Area 8. 3.29 The final column takes account of the wider pattern of provision, where a site in an adjacent Settlement
Area may also serve the same catchment population. This is particularly relevant to sites falling within the rural areas in Settlement Area 8 which are often provided to serve the adjacent urban populations in Settlement Areas 1 – 7, which can have a significant effect on the overall level of provision available to each local community.
3.30 With the additional provision included, only Birkenhead (Area 3) and Bromborough and Eastham (Area
4) continue to have a lower than average level of provision. 3.31 The inclusion of the larger Country Parks, which can also provide a more local function for some
communities, can also have a significant effect on the totals for some of the Settlement Areas. Even excluding the larger parks (greater than 20ha in size), most Settlement Areas still maintain a reasonable level of provision, with the exception of Wallasey (Area 1) and Birkenhead (Area 3).
Figure 3.4 Provision of Smaller Parks and Gardens by Settlement Area
Settlement Area
Area population (Mid-2010)
Total sites
Total hectares
Hectares per
1,000
Surplus /Deficit
ha
Surplus/Deficit
Ha/1000
Other Sites within 400m
1 Wallasey 58,200 6 24.16 0.42 -13.67 -0.23 12.80
2 Commercial Core
1,700 1 1.40 0.82 0.30 0.17 8.35
3 Birkenhead 83,000 5 44.51 0.54 -9.44 -0.11 4.65
4 Bromborough and Eastham
54,500 8 27.97 0.51 -7.46 -0.14 14.10
5 Mid Wirral 52,900 4 25.08 0.47 -9.31 -0.18 25.65
6 Hoylake and West Kirby
24,700 6 13.66 0.55 -2.40 -0.10 3.63
7 Heswall 28,100 5 19.49 0.69 1.23 0.04 3.37
8 Rural Areas 5,700 7 44.82 7.86 41.12 7.21
Total 308,800 42 201.09 0.65

Wirral Open Space Assessment Update - December 2012 20
Quality – Parks and Gardens 3.32 The key criteria applied to Parks and Gardens are set out in Figure 3.4.
Figure 3.4 Parks and Gardens Quality Criteria
Parks and Gardens
• Entrance areas
• Presence and quality of signage and information
• Boundary fencing and hedges
• Tree management
• The quality of key furniture including seats, bins, toilets
• The quality of maintenance, grass cutting, pathways
• Cleanliness
3.33 A summary of the quality scores for each Settlement Area is shown in Figure 3.5. The quality of
individual facilities such as play areas and playing pitches have been scored separately and are considered in a later section of this report. Settlement Areas that are rated above or equal to the overall average for quality are indicated in green, and those that rated below the Borough Figure 3.5 Parks and Gardens Summary Quality Scores by Settlement Area
Settlement Area Area population (Mid 2010)
Total sites
Quality Range (%)
Average quality score
1 Wallasey 58,200 7 43% - 66% 58%
2 Commercial Core 1,700 1 71% 71%
3 Birkenhead 83,000 6 29% - 45% 36%
4 Bromborough and Eastham 54,500 8 15% - 58% 42%
5 Mid Wirral 52,900 4 34% - 60% 46%
6 Hoylake and West Kirby 24,700 6 29% - 64% 48%
7 Heswall 28,100 5 39% - 47% 43%
8 Rural Areas 5,700 12 26% - 81% 53%
Total 308,800 49 15% - 81% 50%
3.34 Analysis of the data shows:
• The Borough-wide average score for the quality of Parks and Gardens sites is 50%.
• There is a significant variation in the range of quality scores for individual sites – from 15% to 81%.
• Birkenhead (Area 3) had the lowest average quality score. Bromborough and Eastham (Area 4) and Heswall (Area 7) also have lower than average quality scores.
• Low scores largely occur because seven of the 56 sites had no litter bins (13%); 26 had no signage (47%) and 13 had no seating (24%). Only eight sites had lighting (15%) and eight sites offered toilets (15%).
3.35 Sites would normally be expected to achieve a score of 75% to qualify for the Award of a Green Flag.

Wirral Open Space Assessment Update - December 2012 21
Accessibility – Parks and Gardens 3.36 Approximately half the households in the Borough are within an easy walking distance of a park or
garden.
Figure 3.6 Accessibility Threshold by Settlement Area
3.37 Analysis of the data shows the following key issues:
• The Commercial Core (Area 2) has the greatest number of households within the catchment of a Park and Garden site with 63% of all households within 400m of a park or garden.
• More than half the households in Hoylake and West Kirby (Area 6), Heswall (Area 7) and the Rural Area (Area 8) were within 400m of a Park and Gardens.
• Mid Wirral has the lowest percentage of households within the catchment a Park and Garden site. 3.38 The analysis of Parks and Gardens needs to be viewed in the context of the overall provision of open
space within each Area. A Settlement Area may, for example, be deficient in Parks and Gardens but have a surplus of other types of green space that may also be able to serve some of the functions of a local park.
3.39 Appendix 14 shows the distribution of Parks and Gardens within each Settlement Area for catchments
of both 400m and 1000m.
Natural and Semi Natural Green Space
3.40 Natural and Semi Natural green spaces are areas of unmanaged or managed land that promote a
wildspace or countryside experience. These sites, take a variety of forms, which are often important for their contribution to biodiversity and habitats for flora and fauna as well as provision for informal recreation and the appreciation of nature and include sites such as Local Nature Reserves. The typology can include green corridors, woodlands, scrubland, wetland and other nature conservation and wildlife areas.
Quantity – Natural and Semi Natural Green Space 3.41 The audit revealed a total of 83 sites within the Natural and Semi Natural Green Space typology,
occupying 506 hectares of land providing a current standard of 1.64ha for every 1,000 residents across the Borough as a whole, including:
• 10 Nature Reserves (187.14 ha or 0.60 ha per 1,000).
• 73 more general natural areas (319.17 ha or 1.02ha per 1,000).
Settlement Area
Number of households in
Area
No. of households within 400m catchment
% of households
within catchment area
% of households
outside catchment area
1 Wallasey 28,719 14,063 49% 51%
2 Commercial Core
1,392 880 63% 37%
3 Birkenhead 42,474 19,527 46% 54%
4 Bromborough and Eastham
24,955 11,682 47% 53%
5 Mid Wirral 24,502 10,855 44% 56%
6 Hoylake and West Kirby
11,886 7,386 62% 38%
7 Heswall 13,134 7,784 59% 41%
8 Rural Areas 2,597 1,323 51% 49% Total 149,659 73,500 49% 51%

Wirral Open Space Assessment Update - December 2012 22
3.42 The breakdown of total space by Settlement Area is shown in Figure 3.7 below.
Figure 3.7 Provision of Natural and Semi Natural Green Space by Settlement Area
Settlement Area Area population (Mid 2010)
Total sites
Total hectares
Hectares per
1,000
Surplus /Deficit
ha
Surplus/ Deficit
Ha/1000
Other Sites
Within 400m
1 Wallasey 58,200 3 17.43 0.30 -78.02 -1.34 49.60
2 Commercial Core
1,700 2 40.98 24.11 38.19 22.47 63.60
3 Birkenhead 83,000 12 65.40 0.79 -70.72 -0.85 66.30
4 Bromborough and Eastham
54,500 15 44.32 0.81 -45.06 -0.83 65.74
5 Mid Wirral 52,900 13 26.46 0.50 -60.30 -1.14 30.96
6 Hoylake and West Kirby*
24,700 7 44.38 1.80 3.87 0.16 32.50
7 Heswall 28,100 6 43.15 1.54 -2.93 -0.10 88.37
8 Rural Areas 5,700 25 224.15 39.32 214.80 37.68
Total 308,800 83 506.27 1.64
*Hilbre Island has not been included but provides an additional 10.03ha of accessible public open space adjacent to Settlement Area 6
3.43 The figures in Figure 3.7 do not include large areas of natural and semi natural green space associated
with many of the Borough’s larger open spaces and Country Parks, which are classified under a separate typology as Parks and Gardens or intertidal coastal areas, which can also provide additional opportunities for local recreation at low tide.
3.44 The headline analysis shows lower than average provision of Natural and Semi Natural Green Space
within five Settlement Areas but when other provision within 400m of each Settlement Area boundary is considered, only Wallasey (Area 1), Birkenhead (Area 3) and Mid Wirral (Area 5) continue to show a shortfall against the Borough average.
Quality – Natural and Semi Natural Green Space 3.45 The key criteria applied to Natural and Semi Natural Green Space are set out in Figure 3.8. .
Figure 3.8 Natural and Semi Natural Green Space Assessment Criteria
Natural & Semi Natural Green Space
• Entrance areas
• Presence and quality of signage and information
• Boundary fencing and hedges
• Tree management mature and young trees
• The quality of key furniture including seats, bins
• Natural Grass Areas
• The quality of maintenance, grass cutting, pathways
• Cleanliness
3.46 A summary of the quality scores for each Settlement Area is shown below in Figure 3.9. This analysis
does not include any assessment of the intrinsic value or condition of the site for biodiversity or geodiversity.

Wirral Open Space Assessment Update - December 2012 23
Figure 3.9 Natural and Semi Natural Green Space Summary Quality Scores by Settlement Area
Settlement Area Area population
Total sites
Quality Range (%)
Average quality score
1 Wallasey 58,200 3 17% - 46% 30%
2 Commercial Core 1,700 2 22% - 25% 24%
3 Birkenhead 83,000 12 2% - 59% 25%
4 Bromborough and Eastham* 54,500 15 0% – 49% 23%
5 Mid Wirral 52,900 13 6% - 62% 25%
6 Hoylake and West Kirby* 24,700 7 25% - 40% 33%
7 Heswall 28,100 6 26% - 37% 32%
8 Rural Areas* 5,700 25 0% - 65% 33%
Total 308,800 83 0% - 65% 28%
*Hilbre Island has not been included here but had a Quality Score of 26.67%. Sites at Prenton Dell (Site ID. 143) and
Bromborough Dock Nature Area (Site ID.9) were not subject to a quality audit. 3.47 Analysis of the data collected shows the following key issues:
• The Borough wide average score for the quality of Natural and Semi Natural Green Space sites was 28%.
• There is a wide variation in the range of quality scores achieved – from 2% to 65%.
• Low scores are largely accounted for by the fact that 51 sites lacked signage (61% of sites), 63 sites had no litter bin (76%) and 63 sites had no seating for visitors (76%).
• Five Settlement Areas show lower than average scores.
Accessibility – Natural and Semi Natural Green Space
3.48 Approximately a third of households in the Borough are within easy walking distance of a natural and semi natural green space site.
Figure 3.10 Accessibility Threshold by Settlement Area
Settlement Area
Number of households in
Area
No. of households within 400m catchment
% of households
within catchment area
% of households
outside catchment area
1 Wallasey 28,719 3,531 12% 88%
2 Commercial Core
1,392 10 1% 99%
3 Birkenhead 42,474 8,681 20% 80%
4 Bromborough and Eastham
24,955 13,288 53% 47%
5 Mid Wirral 24,502 11,695 48% 52%
6 Hoylake and West Kirby
11,886 6,741 57% 43%
7 Heswall 13,134 5,123 39% 61%
8 Rural Areas 2,597 455 18% 82% Total 149,659 49,524 33% 77%

Wirral Open Space Assessment Update - December 2012 24
3.49 Figure 3.10 demonstrates that:
• Hoylake and West Kirby (Area 6) and Bromborough and Eastham (Area 4) have the highest proportion of households within 400m of a natural and semi natural green space.
• Residents in the eastern Settlement Areas have the poorest access to areas of Natural and Semi Natural greenspace.
3.50 A Settlement Area may have a lower than average provision of Natural and Semi Natural Green Space
but may also have access to other types of green space that may nevertheless serve a similar function, for example, through the provision of natural or semi natural open space as part a larger Park or Garden.
3.51 Appendix 15 shows the distribution of Natural and Semi-Natural Greenspace within each Settlement
Area, for catchments of both 400m and 1000m.
Outdoor Sports Facilities
3.52 This typology includes a variety of sports facilities (public and private) providing for participation in
outdoor sports, including facilities such as playing pitches, bowling greens, tennis courts and golf courses. Some of these facilities are provided on sites within other typologies, particularly within sites classified as Parks and Gardens.
3.53 School playing fields have been identified separately. Although some school playing fields are also
available for use by the wider community, dependent on local management decisions, the actual number that may be available for non-educational use varies year on year and cannot consistently be predicted.
3.54 Other more informal facilities, such as multi-use games areas (MUGAs) and outdoor basketball facilities
have been included under the assessment of Provision for Children and Young People.
Quantity – Outdoor Sports Facilities 3.55 The audit has revealed a total of 1205.56ha of land occupied by an outdoor sports facility on 326 sites,
providing a current standard of 3.90ha for every 1,000 residents across the Borough as a whole. 3.56 The overall breakdown, which includes sports facilities provided within all of the other typologies,
includes;
• 19 facilities for golf including thirteen 18-hole golf courses (637.49ha or 2.06ha per thousand people).
• 136 facilities providing sports pitches, tennis courts, bowling greens or athletics tracks including artificial turf courts or pitches (409.89ha or 1.33ha per thousand people); and
• 92 school playing fields (152ha). 3.57 The breakdown of facilities, excluding golf and school playing fields, is shown in Figure 3.11 below.
Figure 3.11 Provision of Outdoor Sports Facilities by Settlement Area
Settlement Area Area population (Mid 2010)
Total sites
Total hectares
Hectares per
1,000
Surplus /Deficit
ha
Surplus/ Deficit
Ha/1000
Other Sites
Within 400m
1 Wallasey 58,200 28 47.41 0.81 -30.00 -0.52 20.41
2 Commercial Core
1,700 1 6.37 3.75 4.11 2.42 33.67
3 Birkenhead 83,000 27 59.03 0.71 -51.36 -0.62 35.95

Wirral Open Space Assessment Update - December 2012 25
Settlement Area Area population (Mid 2010)
Total sites
Total hectares
Hectares per
1,000
Surplus /Deficit
ha
Surplus/ Deficit
Ha/1000
Other Sites
Within 400m
4 Bromborough and Eastham
54,500 16 73.96 1.36 1.47 0.03 39.55
5 Mid Wirral 52,900 10 28.41 0.54 -41.95 -0.79 51.95
6 Hoylake and West Kirby*
24,700 12 28.64 1.16 -4.21 -0.17 29.01
7 Heswall 28,100 9 13.32 0.47 -24.05 -0.86 10.05
8 Rural Areas 5,700 33 152.75 26.80 145.17 25.47
Total 308,800 136 409.89 1.33
3.58 Analysis of the data shows:
• the majority of provision is made outside the urban area within the rural areas in Settlement Area 8.
• Wallasey (Area 1), Birkenhead (Area 3) and Heswall (Area 7) continue to have below average levels of provision even when other sites within adjacent Settlement Area are considered.
3.59 Appendices 16 to 21 provide a further breakdown of the current pattern of supply and demand for
individual sports including football, rugby, cricket, tennis, bowling and hockey. 3.60 In terms the analysis for individual sports:
• Wallasey (Area 1) has a higher than average level of provision for bowling.
• there is only limited provision for cricket in Wallasey (Area 1) and Mid-Wirral (Area 5).
• there is a higher than average level of provision for tennis in the west of the Borough.
• there is limited provision for football in areas of high demand in Wallasey (Area 1) and Birkenhead (Area 3).
• only one site is currently used for lacrosse (in Area 3)
• there is a good distribution of ATPs across the Borough, although many have been provided with particular requirements in mind.
• the Borough has only one formal athletics facility, at the Bebington Oval. 3.61 The total provision for grass pitches is currently 1.02ha for every thousand people, which would rise to
1.03ha per thousand if artificial turf pitches were included. 3.62 The Council’s latest Playing Pitch Assessment from 2004, which is currently being up-dated, suggested
that playing pitches should be provided at an overall level of 1.00ha for every thousand people, to meet existing and latent demand.
Quality – Outdoor Sports Facilities 3.63 Quality inspections were only undertaken on sites where open public access was available based on
the criteria set out in Figure 3.12. A significant number of sites have not therefore been quality scored. 3.64 No assessment has been made of the internal quality of pitch side facilities such as changing rooms or
club facilities, the quality of playing surfaces or the provision of sports-related floodlighting, besides a general subjective overall assessment of each site.

Wirral Open Space Assessment Update - December 2012 26
Figure 3.12 Assessment Criteria for Outdoor Sports Sites Outdoor Sport • Entrance areas
• Presence and quality of signage and information
• Boundary fencing and hedges
• Tree management mature and young trees
• The quality of key furniture including seats, bins
• The quality of maintenance, grass cutting, pathways
• Cleanliness
• Facility Assessment (pitches, greens courts) 3.65 The results set out in Figure 3.13 below only refer to the audited facilities (total number 45):
Figure 3.13 Public Outdoor Sports Facilities Summary Quality Scores by Settlement Area
Settlement Area Area population
Total sites
Quality Range (%)
Average quality score
1 Wallasey 58,200 8 9% – 36% 24%
2 Commercial Core 1,700 1 77% 77%
3 Birkenhead 83,000 5 13% - 44% 31%
4 Bromborough and Eastham 54,500 12 15% - 66% 37%
5 Mid Wirral 52,900 2 38% - 39% 38%
6 Hoylake and West Kirby 24,700 3 25% - 53% 49%
7 Heswall 28,100 2 40% - 43% 41%
8 Rural Areas 5,700 12 15% - 70% 36%
Total 308,800 45 9% - 77% 42%
3.66 Analysis of the data shows:
• There is a wide variation in the range of quality scores achieved – from 9% to 77%
• Sites in Wallasey (Area 1) scored poorly, achieving an average of only 24%
• The average score for the Commercial Core (Area 2) was based on the score for only one site, at the Wirral Indoor Tennis Centre.
3.67 Many private sites were not rated for quality. The quality of private sites often tends to be higher, owing
the greater level of control over misuse or informal play and the better quality of pitch-side facilities.
Accessibility – Outdoor Sport
3.68 The majority of households in the Borough are within 1000m of an outdoor sports site:

Wirral Open Space Assessment Update - December 2012 27
Figure 3.14 Accessibility Thresholds by Settlement Area
Settlement Area Number of
households in Area
No. of households
within 1,000m catchment
% of households within
catchment area
% of households outside
catchment area
1 Wallasey 28,719 28,719 100% 0%
2 Commercial Core 1,392 706 51% 49%
3 Birkenhead 42,474 42,474 100% 0%
4 Bromborough and Eastham
24,955 24,955 100% 0%
5 Mid Wirral 24,502 24,502 100% 0%
6 Hoylake and West Kirby
11,886 11,886 100% 0%
7 Heswall 13,134 13,015 99%. 1%
8 Rural Areas 2,597 2,305 89% 11%
Total 149,659 148,562 99% 1%
3.69 Appendix 22 shows the current distribution of sites providing outdoor sports facilities across the
Borough and Appendices 23 to 28 show the pattern of accessibility for different types of provision, for catchments of both 400m and 1000m.
Amenity Green Space 3.70 Amenity Green Space (AGS) includes smaller open spaces in housing areas, village greens, informal
recreational space and hard-surfaced areas designed for pedestrians, which may function both as casual recreation areas close to home or work as well as providing for visual amenity.
3.71 They are often provided as a supplement to larger spaces such as Parks and Gardens and assume a
greater local importance where larger spaces are not otherwise available within the immediate vicinity.
Quantity – Amenity Green Space
3.72 The audit revealed a total of 138 sites classified as AGS providing 118 hectares, at a current standard
of 0.38ha for every 1,000 residents across the Borough as a whole. 3.73 The breakdown of total Amenity Green Space by Settlement Area is shown in Figure 3.15 below.
Figure 3.15 Quantitative Provision of Amenity Green Space by Settlement Area
Settlement Area
Area Population (Mid 2010)
Total sites
Total hectares
Hectares per
1,000
Surplus / Deficit
ha
Surplus/ Deficit
Ha/1000
Other Sites
Within 400m
1 Wallasey 58,200 32 41.09 0.71 18.97 0.33 0
2 Commercial Core
1,700 0 0 0 -0.65 -0.38 13.11
3 Birkenhead 83,000 32 30.85 0.37 -0.69 -0.01 5.35

Wirral Open Space Assessment Update - December 2012 28
Settlement Area
Area Population (Mid 2010)
Total sites
Total hectares
Hectares per
1,000
Surplus / Deficit
ha
Surplus/ Deficit
Ha/1000
Other Sites
Within 400m
4 Bromborough and Eastham
54,500 32 19.43 0.36 -1.28 -0.02 6.51
5 Mid Wirral* 52,900 28 18.23 0.34 -1.87 -0.04 4.08
6 Hoylake and West Kirby
24,700 8 3.39 0.14 -6.00 -0.24 0
7 Heswall 28,100 4 2.46 0.09 -8.22 -0.29 0
8 Rural Areas 5,700 2 2.81 0.49 0.64 0.11
Total 308,800 138 118.26 0.38
* Sites at Home Farm Close (Site ID8940), Hoole Road (Site ID 939), New Hey Road (Site ID854) and Carr Bridge Road Backland (Site ID943) in Woodchurch were locked with no access at the time of auditing and have not therefore been included.
3.74 Analysis of the data in Figure 3.15 shows that:
• Wallasey (Area 1) and Birkenhead (Area 3) have higher than average levels of Amenity Green Space.
• Taking account of additional provision within 400m, only Hoylake and West Kirby (Area 6) and Heswall (Area 7) have a lower than average level of provision
3.75 The provision of Amenity Green Space needs to be considered alongside the local provision of other
types of open space such as Parks and Gardens, Natural and Semi-Natural Green Space and Provision for Children and Young People.
Quality – Amenity Green Space
3.76 The key criteria for Amenity Green Space are set out in Figure 3.16.
Figure 3.16 Assessment Criteria for Amenity Green Space
Amenity Green Space • Presence and quality of signage and information
• Boundary fencing and hedges
• Tree management
• The quality of key furniture including seats, bins
• The quality of maintenance, grass cutting, pathways
• Cleanliness
3.77 A summary of the quality scores for each Settlement Area is shown below in Figure.3.17. Analysis of
the data shows:
• a notable variation in the quality scores – from 7% to 72%.
• AGS in Mid-Wirral (Area 5) and Bromborough and Eastham (Area 4) scored lowest.
• Low scores are largely accounted for by the fact that only 30 sites had litter bins (22%), only 29 had seating (21%) and only 22 sites had lighting (16%).
• In terms of cleanliness sites scored an average of 65%.
Wirral Open Space Assessment Update - December 2012 29
Figure 3.17 Amenity Green Space Summary Quality Scores by Settlement Area
Settlement Area Area population
Total sites
Quality Range (%)
Average quality score
1 Wallasey 58,200 32 10% - 60% 39%
2 Commercial Core 1,700 0 0 0
3 Birkenhead 83,000 32 17% - 72% 36%
4 Bromborough and Eastham 54,500 32 0% - 58% 32%
5 Mid Wirral 52,900 28 0% - 58% 28%
6 Hoylake and West Kirby 24,700 8 28% - 57% 44%
7 Heswall 28,100 4 25% - 50% 40%
8 Rural Areas 5,700 2 20% - 53% 36%
Total 308,800 138 0% - 72% 32%
Accessibility – Amenity Green Space
3.78 Just over half the households in the Borough were within 400m of an Amenity Green Space. For many
households, the absence of an AGS may however be made up by access to a site classified within another typology, which may also have a wider range of facilities.
Figure 3.18 Accessibility thresholds by Settlement Area
Settlement Area Number of
households in Area
No. of households within 400m catchment
% of households within
catchment area
% of households outside
catchment area
1 Wallasey 28,719 20,249 71% 29%
2 Commercial Core 1,392 197 14% 86%
3 Birkenhead 42,474 24,171 57% 43%
4 Bromborough and Eastham
24,955 16,334 65% 35%
5 Mid Wirral 24,502 10,634 77% 23%
6 Hoylake and West Kirby
11,886 4,748 67% 33%
7 Heswall 13,134 2,740 26% 74%
8 Rural Areas 2,597 1,224 89% 11%
Total 149,659 80,297 54% 46%

Wirral Open Space Assessment Update - December 2012 30
3.79 Analysis of the data in Figure 3.18 shows that access to AGS is lowest within the Commercial Core (Area 2) and Heswall (Area 7).
3.80 Appendix 29 shows the distribution of Amenity Greenspace within each Settlement Area, for
catchments of both 400m and 1000m.
Provision for Children and Young People
3.81 Provision for Children and Young People consists of areas specifically designed or set aside for play
and social interaction involving children and young people, such as equipped play areas, multi-use games areas (MUGA), teen shelters, BMX tracks and skateboard parks.
Quantity – Children and Young People 3.82 The audit revealed a total of 141 sites occupying 33.62ha or a current standard of 0.11ha per 1000
residents across the Borough as a whole. 3.83 A number of facilities for Children and Young People were provided in sites falling within other open
space typologies. The breakdown of total space, by Settlement Area, is shown in Figure 3.19: Figure 3.19 Quantitative Provision for Children and Young People by Settlement Area
Settlement Area Area population (Mid 2010)
Total sites
Total hectares
Hectares per
1,000
Surplus/ Deficit
ha
Surplus/ Deficit Ha/1000
Other Sites
Within 400m
1 Wallasey 58,200 28 6.12 0.11 -0.28 -0.01 0
2 Commercial Core
1,700 2 0.80 0.47 0.61 0.36 6.85
3 Birkenhead 83,000 35 10.09 0.12 0.96 0.01 2.08
4 Bromborough and Eastham
54,500 18 4.44 0.08 -1.56 -0.03 0.25
5 Mid Wirral 52,900 19 6.07 0.11 0.25 0.01 0.97
6 Hoylake and West Kirby
24,700 13 3.23 0.13 0.51 0.02 0.14
7 Heswall 28,100 7 0.84 0.03 -2.25 -0.08 0.89
8 Rural Areas 5,700 19 2.03 0.36 1.40 0.25
Total 308,800 141 33.62 0.11
3.84 An analysis of the data in Figure 3.19 illustrates a lower than average provision in Wallasey (Area 1),
Bromborough and Eastham (Area 4) and Heswall (Area 7).
Quality – Provision for Children and Young People 3.85 Quality Inspections were undertaken for each of the sites with fixed play equipment and looked at a
variety of criteria including the overall appearance and ambience of the site, the type of equipment by age range, the play value of the entire designated play area and the different types of activity that the play area would allow, including:

Wirral Open Space Assessment Update - December 2012 31
• Balancing • Jumping
• Climbing • Rotating
• Crawling • Sliding
• Gliding • Rocking
• Group Swinging • Agility Bridges
• Single Swinging • Viewing Platform
• Ball Play • Wheeled Play 3.86 A summary of the quality scores for each Settlement Area is shown in Figure 3.20. Only stand-alone
play provision was scored, as a more general assessment of provision for play had also formed part of the scores undertaken for each of the other typologies. Figure 3.20 Provision for Children and Young People Summary Quality Scores by Settlement Area
Settlement Area Area population
Total sites
Quality Range (%)
Average quality score
1 Wallasey 58,200 9 25% - 82% 41%
2 Commercial Core 1,700 2 23% - 38% 30%
3 Birkenhead 83,000 18 7% - 55% 32%
4 Bromborough and Eastham 54,500 4 41% - 49% 45%
5 Mid Wirral 52,900 9 21% - 75% 37%
6 Hoylake and West Kirby 24,700 2 45% - 70% 57%
7 Heswall 28,100 0 0 0
8 Rural Areas 5,700 1 39% 39%
Total 308,800 45 7% - 82% 35%
3.87 Analysis of the data shows:
• A significant variation in the quality scores – from 7% to 82%.
• The Commercial Core (Area 2) had the lowest overall quality rating.
• Facilities in Hoylake and West Kirby (Area 6) obtained the highest average score. 3.88 Quality scores were mainly affected by a lack of signage, seating, litter bins and self-closing gates.
Accessibility – Children and Young People 3.89 Over half the Borough’s households were within 400m of a site with fixed play equipment:
3.90 Analysis of the data shows that:
• Outside the rural areas, Heswall (Area 7) had the lowest proportion of households within 400m of an equipped play area
• The highest levels of accessibility were in Wallasey (Area 1), Birkenhead (Area 3) and Mid-Wirral (Area 5).

Wirral Open Space Assessment Update - December 2012 32
Figure 3.21 Accessibility Threshold by Settlement Area
3.91 Appendix 30 shows the distribution of Provision for Children and Young People within each Settlement
Area, for catchments of both 400m and 1000m.
Allotments and Community Gardens 3.92 Allotments and Community Gardens provide areas with natural features for cultivation of fruit, flowers
and vegetables that involve working with people, plants and, in appropriate circumstances, animals. Most allotment sites are managed by the Council, but some are also privately managed, either by trust, or by another type of private organisation.
3.93 The value of allotments is being reappraised at a local and national level. Traditionally provided in urban
areas to allow people space to grow their own fruit and vegetables, public interest in allotments has increased due to increased concerns about the links between health and food and the desire to grow home produce.
Quantity – Allotments
3.94 The audit revealed a total of 47 sites, occupying 54 hectares of land, providing a current standard of 0.18ha for every 1,000 residents across the Borough as a whole – the equivalent of 7 plots for every 1,000 residents, based on a recommended plot size of 250 square metres. These sites can be classified as follows:
• Council managed allotments – 42 sites (total 48.30 hectares).
• Trust/privately managed allotments – 3 sites (total 1.08 hectares)
• Self-managed - 2 sites (total 2.6 hectares)
3.95 A number of allotment sites are provided within Parks and Gardens. 3.96 The breakdown of total space by Settlement Area is shown in Figure 3.22. Analysis of the data shows:
• The majority of sites are in Wallasey (Area 1), Birkenhead (Area 3) and Bromborough and Eastham (Area 4)
• There are no allotments in Heswall (Area 7)
Settlement Area Number of households
in Area
No. of households within 400m catchment
% of households
within catchment area
% of households
outside catchment area
1 Wallasey 28,719 18,436 64% 36% 2 Commercial Core
1,392 974 70% 30%
3 Birkenhead 42,474 25,482 60% 40% 4 Bromborough and Eastham
24,955 12,558 50% 50%
5 Mid Wirral 24,502 15,487 63% 37% 6 Hoylake and West Kirby
11,886 6,608 56% 44%
7 Heswall 13,134 4,972 38% 62% 8 Rural Areas 2,597 494 19% 81% Total 149,659 85,011 57% 43%
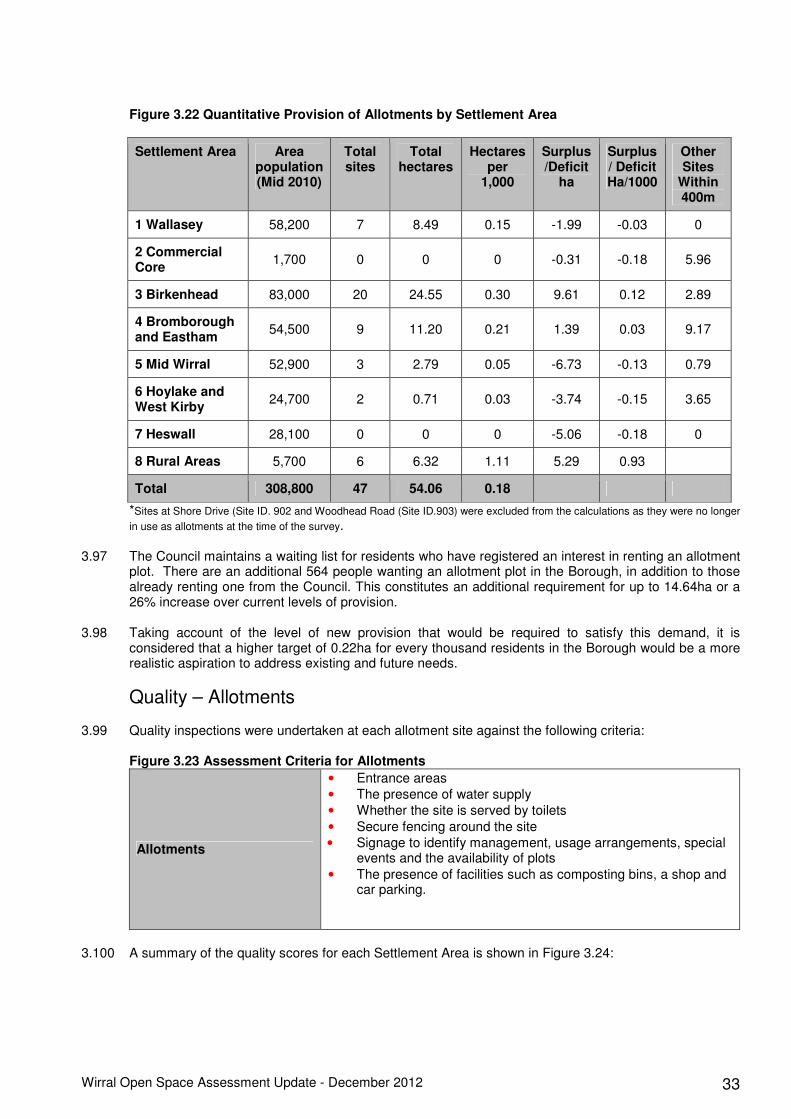
Wirral Open Space Assessment Update - December 2012 33
Figure 3.22 Quantitative Provision of Allotments by Settlement Area
Settlement Area Area population (Mid 2010)
Total sites
Total hectares
Hectares per
1,000
Surplus /Deficit
ha
Surplus/ Deficit Ha/1000
Other Sites
Within 400m
1 Wallasey 58,200 7 8.49 0.15 -1.99 -0.03 0
2 Commercial Core
1,700 0 0 0 -0.31 -0.18 5.96
3 Birkenhead 83,000 20 24.55 0.30 9.61 0.12 2.89
4 Bromborough and Eastham
54,500 9 11.20 0.21 1.39 0.03 9.17
5 Mid Wirral 52,900 3 2.79 0.05 -6.73 -0.13 0.79
6 Hoylake and West Kirby
24,700 2 0.71 0.03 -3.74 -0.15 3.65
7 Heswall 28,100 0 0 0 -5.06 -0.18 0
8 Rural Areas 5,700 6 6.32 1.11 5.29 0.93
Total 308,800 47 54.06 0.18
*Sites at Shore Drive (Site ID. 902 and Woodhead Road (Site ID.903) were excluded from the calculations as they were no longer
in use as allotments at the time of the survey. 3.97 The Council maintains a waiting list for residents who have registered an interest in renting an allotment
plot. There are an additional 564 people wanting an allotment plot in the Borough, in addition to those already renting one from the Council. This constitutes an additional requirement for up to 14.64ha or a 26% increase over current levels of provision.
3.98 Taking account of the level of new provision that would be required to satisfy this demand, it is
considered that a higher target of 0.22ha for every thousand residents in the Borough would be a more realistic aspiration to address existing and future needs.
Quality – Allotments 3.99 Quality inspections were undertaken at each allotment site against the following criteria:
Figure 3.23 Assessment Criteria for Allotments
Allotments
• Entrance areas
• The presence of water supply
• Whether the site is served by toilets
• Secure fencing around the site
• Signage to identify management, usage arrangements, special events and the availability of plots
• The presence of facilities such as composting bins, a shop and car parking.
3.100 A summary of the quality scores for each Settlement Area is shown in Figure 3.24:

Wirral Open Space Assessment Update - December 2012 34
Figure 3.24 Provision for Allotments Summary Quality Scores by Settlement Area
Settlement Area Area population
Total sites
Quality Range (%)
Average quality score
1 Wallasey 58,200 7 18% – 45% 31%
2 Commercial Core 1,700 0 0 0
3 Birkenhead 83,000 20 0% - 49% 25%
4 Bromborough and Eastham 54,500 9 4% - 53% 26%
5 Mid Wirral 52,900 3 20% - 42% 33%
6 Hoylake and West Kirby 24,700 2 27% - 38% 32%
7 Heswall 28,100 0 0 0
8 Rural Areas 5,700 6 24% - 52% 36%
Total 308,800 47 0 – 53% 19%
3.101 Analysis of the data illustrates the following key issues:
• The average quality score for allotment sites across the Borough as a whole was low.
• There is a wide variation in quality scores – from 4% to 53%
• Birkenhead (Area 3) and Bromborough and Eastham (Area 4) have some of the lowest average scores.
• Allotments in the Rural Area (Area 8) had the highest quality scores
• 24 sites lacked signage indicating contact information or whether the site had any vacant plots, 20 of which were Council managed
• 34 sites did not provide any car parking, which is an important asset for people without facilities to secure gardening tools or equipment on-site.
Accessibility – Allotments
Figure 3.25 Accessibility Threshold by Settlement Area
Settlement Area Number of
households in Area
No. of households
within 1,000m catchment
% of households within
catchment area
% of households outside
catchment area
1 Wallasey 28,719 23,287 81% 19%
2 Commercial Core 1,392 203 15% 85%
3 Birkenhead 42,474 33,668 79% 21%
4 Bromborough and Eastham
24,955 18,689 75% 25%
5 Mid Wirral 24,502 14,622 60% 40%
6 Hoylake and West Kirby
11,886 10,074 85% 15%
7 Heswall 13,134 0 0% 100%
8 Rural Areas 2,597 1,149 44% 56%
Total 149,659 101,692 68% 32%

Wirral Open Space Assessment Update - December 2012 35
3.102 Just over two thirds of the Borough’s households were within 1000m of an allotment site. Figure 3.27
shows the breakdown within each Settlement Area: 3.103 Besides Heswall (Area 7), which had no allotment provision, Mid-Wirral (Area 5) and the Commercial
Core (Area 2) had the highest proportion of households outside the catchment threshold for an allotment site.
3.104 Appendix 31 shows the distribution of Allotment sites within each Settlement Area, for catchments of
both 400m and 1000m.
Cemeteries and Churchyards 3.105 Cemeteries and churchyards can provide a valuable additional contribution to the portfolio of open
space provision within an area. For many, they can provide a place for quiet contemplation in addition to their primary purpose as a final resting place and can provide a strong link to local history and heritage. They can also have wildlife conservation and biodiversity value.
3.106 Although many have restricted access and are not created with the intention of providing informal or
passive recreation opportunities, they still provide a useful resource for the local community.
Quantity – Cemeteries 3.107 The audit revealed 46 church yards (23.5 hectares) and nine publicly managed cemetery sites,
occupying 86.75 hectares, equivalent to a current provision of 0.33ha per 1000 residents. As their primary function is for the burial of the dead no further quantitative analysis has been undertaken.
Quality – Cemeteries 3.108 Site assessments were undertaken at the nine publicly managed cemeteries. 3.109 The criteria against which the sites were assessed included:
• Main entrance safety and cleanliness
• Signage
• Upkeep and safety of graves/memorials
• Quality of roads and pathways
• Provision of bins and seats
• Boundary fencing and hedges 3.110 Whilst the quality of cemeteries may be of relevance, they are not treated as local parks and it is not
thought necessary to reflect any variance in quality at Settlement Area level. The overall average quality for cemeteries was, however, found to be 65% across the Borough as a whole.
Data Summary 3.111 Appendix 32 shows the pattern of overall provision within each Settlement Area for each typology.

Wirral Open Space Assessment Update - December 2012 36
Indoor Sport and Recreation 3.112 Comments received in response to public consultation requested the further information should also be
provided on provision for indoor sport and recreation. 3.113 The Council is currently in the process of preparing a new Built Facilities Strategy but additional data on
the provision and distribution of facilities such as sports halls, gymnasiums and swimming pools has now been included in Appendices 33 to 36.
3.114 Further work is being undertaken to identify the scale and pattern of privately provided health and
fitness facilities.

Wirral Open Space Assessment Update - December 2012 37
3 Appendices

Wirral Open Space Assessment Update - December 2012 38
Appendices List
Appendix 1: Schedule of Changes since July 1994 Appendix 2: Provision of publicly accessible open space (composite map) Appendix 3: Schedule of Audit Site Scores
Appendix 4: Key to Settlement Areas Appendix 5: Schedule of Open Space by Settlement Area Appendix 6: Provision of Open Space in Wirral (composite map) Appendix 7: Parks and Gardens Appendix 8: Natural and Semi Natural Appendix 9: Amenity Green Space Appendix 10: Outdoor Sports Appendix 11: Provision for Children and Young People Appendix 12: Allotments Appendix 13: Cemeteries and Churchyards Appendix 14a: Parks and Gardens 400m Buffer Appendix 14b: Parks and Gardens 1000m Buffer Appendix 15a: Natural and Semi Natural 400m Buffer Appendix 15b: Natural and Semi Natural 1000m Buffer Appendix 16: Football Pitches Demand Profile Appendix 17: Rugby Pitches Demand Profile Appendix 18: Cricket Pitches Demand Profile Appendix 19: Tennis Courts Demand Profile Appendix 20: Bowling Greens Demand Profile Appendix 21: Hockey Pitches Demand Profile Appendix 22a: Outdoor Sports Facilities 400m Buffer Appendix 22b: Outdoor Sports Facilities 1000m Buffer Appendix 23a: Football Pitches 400m Buffer Appendix 23b: Football Pitches 1000m Buffer Appendix 24a: Rugby Pitches 400m Buffer Appendix 24b: Rugby Pitches 1000m Buffer Appendix 25a: Cricket Pitches 400m Buffer Appendix 25b: Cricket Pitches 1000m Buffer Appendix 26a: Bowling Greens 400m Buffer Appendix 26b: Bowling Greens 1000m Buffer Appendix 27a: Tennis Courts 400m Buffer Appendix 27b: Tennis Courts 1000m Buffer Appendix 28a: Artificial Turf Pitches 400m Buffer Appendix 28b: Artificial Turf Pitches 1000m Buffer Appendix 29a: Amenity Green Space 400m Buffer Appendix 29b: Amenity Green Space 1000m Buffer Appendix 30a: Provision for Children and Young People 400m Buffer Appendix 30b: Provision for Children and Young People 1000m Buffer Appendix 31a: Allotments 400m Buffer Appendix 31b: Allotments 1000m Buffer Appendix 32a: Borough Overview by Settlement Area Appendix 32b: Borough Overview by Settlement Area including sites within 400m Buffer Appendix 33a: Schedule of Sports Halls, Gymnasiums and Studios Appendix 33b: Summary of Sports Halls, Gymnasiums and Studios by Settlement Area

Wirral Open Space Assessment Update - December 2012 39
Appendix 34: Swimming Pools Appendix 35: Squash Courts Appendix 36: Map showing public and private Swimming Pools Appendix 37: Indoor Sports Halls Appendix 38: Gymnasiums

Wirral Open Space Assessment Update - December 2012 40
[blank for copying]


