163
LOCAL ENERGY PLAN LOCAL ENERGY PLAN 2015-2025 SERVICE MANAGER 0
| Date post: | 06-Feb-2018 |
| Category: |
Documents |
| Upload: | duongkhanh |
| View: | 214 times |
| Download: | 0 times |

LOCAL ENERGY PLAN
LOCAL ENERGY PLAN2015-2025
SERVICE MANAGER
0

LOCAL ENERGY PLAN
The municipality of Niksic
LOCAL ENERGY PLAN OF THE MUNICIPALITY NIKSIC
2015 – 2025
december, 2014. year
Service manager
LOCAL ENERGY PLAN
CONTENT
1. INTRODUCTION..........................................................................................................................................7
1.1 The purpose of the local energy plan......................................................................................7
1.2 Objectives, measures and roadmap........................................................................................7
1.3 The legislative framework........................................................................................................... 8
1.4 Basic information about geographic and socio-economic characteristics of the municipality of Niksic.................................................................................................................................12
1.4.1. Geographical position and climate characteristics of the municipality.......................12
1.4.2. Demographics and settlements......................................................................................................14
1.4.3. Economic indicators...........................................................................................................................17
2. Energy supply, production and distribution of energy..........................................................21
2.1 Energy supply................................................................................................................................. 21
2.1.1. Coal.............................................................................................................................................................21
2.1.2. Wood..........................................................................................................................................................21
2.1.3. Electrical energy...................................................................................................................................22
2.1.4. Oil and oil products.............................................................................................................................25
2.2 Energy production in the territory of the local government.....................................27
2.2.1. The production of electricity...........................................................................................................27
2.2.2. The system for district heating......................................................................................................28
2.2.3 Other forms of energy generation …………………………………………………………………… 28
3. Analysis of energy consumption in local government............................................................30
3.1 Energy use per type of energy source..................................................................................30
3.1.1. Use of electrical energy......................................................................................................................30
3.1.2. Use of coal and woody biomass for obtaining useful heat.................................................33
3.1.3. The use of oil and oil products in traffic.....................................................................................34
3.2 Use of energy by sectors.............................................................................................................36
3.2.1. Use of energy in households............................................................................................................37
3.2.2. Use of energy in the services sector.............................................................................................40
3.2.2.1 Sector E: Water supply and removing waste....................................................41
3.2.2.2 Sector D: Supply of electric energy........................................................................44
3.2.2.3 Sector P: Education......................................................................................................46

LOCAL ENERGY PLAN
3.2.2.4 Sector Q: Health and social care.............................................................................48
3.2.2.5 Sector R: Arts, entertainment and recreation..................................................52
3.2.2.6 Sector O: State and local government..................................................................53
3.2.2.7 Sector J: Information and communication.........................................................56
3.2.2.8 Sector S: Other service activities...........................................................................56
3.2.2.9 Sector G: Wholesale trade and retail....................................................................57
3.2.2.10 Sector I: Accommodation and food services.....................................................58
3.2.2.11 Sector K: Financial and insurance activities......................................................60
3.2.3. Existing energy consumption in industry.................................................................................61
3.2.3.1 Sector C: Manufacturing industry..........................................................................62
4. Analysis of emissions.............................................................................................................................65
5. A rough estimate of the planned energy consumption..........................................................68
6. Analysis of the energy potential of the municipality of Niksic............................................71
6.1 Analysis of the possibilities of energy production..........................................................71
6.2 Analysis of the possibility of using energy efficiency measures...............................72
6.2.1. Households..............................................................................................................................................72
6.2.2. The service sector................................................................................................................................73
6.2.2.1 The public services sector.........................................................................................73
6.2.2.2 Commercial services....................................................................................................74
6.2.3. The industry...........................................................................................................................................75
6.2.4. Traffic........................................................................................................................................................75
6.3 Analysis of the potential of renewable energy sources................................................75
6.3.1. Hydro Plant potential.........................................................................................................................76
6.3.2. Solar energy............................................................................................................................................77
6.3.3. Wind energy...........................................................................................................................................77
6.3.4. Municipal waste....................................................................................................................................77
7. Defining of the energy goals...............................................................................................................79
7.1 Defining the local energy concept..........................................................................................79
7.2 The objectives of national strategies, programs and plans in energetics.............80
7.3 Defining goals and indicators in local government........................................................81
7.3.1. The objectives in systems for energy supply...........................................................................81
7.3.2. Objectives for energy production.................................................................................................81
7.3.3. The objectives for increasing energy efficiency......................................................................82
7.3.4. Informing of citizens and employed............................................................................................82

LOCAL ENERGY PLAN
8. Analysis of measures to achieve the objectives in local energetics..................................83
8.1 Measures to improve energy supply and energy source.............................................83
8.1.1. E.1.: Improving of security and quality of electricity supply............................................83
8.1.2. E.2.: Development of distribution networks............................................................................83
8.1.3. E.3.: Improving practices of supplying wood fuels................................................................83
8.1.4. E.4.: Develop a feasibility study of the use of district heating in the city core..........84
8.2 Measures to increase energy production...........................................................................84
8.2.1. P.1.: The construction of small hydropower plants..............................................................84
8.2.2. P.2: Utilization of residues from the forest and wood processing industries for energy purposes......................................................................................................................................................85
8.2.3. P.3: Develop a feasibility study on the remaining potentials............................................85
8.3 Measures for improvement of energy efficiency.............................................................85
8.3.1. Cross-sectoral measures...................................................................................................................86
8.3.1.1 M.1.: Establishing energy management systems.............................................86
8.3.1.2 M.2.: Installing of modern devices for measuring energy consumption86
8.3.1.3 M.3.: Regular reviews of boilers for heating.....................................................87
8.3.1.4 M.4.: Encouraging utilization renewable energy sources and implementation of energy efficiency measures....................................................................87
8.3.1.5 M.5.: Application of the new regulatory framework for buildings..........88
8.3.1.6 M.6 Improving the energy characteristics of existing facilities in accordance with EU directives, standards and examples of good practice..............89
8.3.2. Households..............................................................................................................................................89
8.3.2.1 D.1: Enhancing ways of using fuel wood.............................................................89
8.3.2.2 D.2: Enhancing energy performance of buildings..........................................90
8.3.2.3 D.3.: Using energy-efficient appliances...............................................................90
8.3.3. Service sector.........................................................................................................................................91
8.3.3.1 Measures for public services....................................................................................91
8.3.3.1.1 U.1.: Establishing the information system and energy management system by the authorities of the Municipality..................................................................91
8.3.3.1.2 U.2.: The adoption of plans and programs and the implementation of energy efficiency measures.......................................................................................................92
8.3.3.1.3 U.3.: The inclusion of energy efficiency guidelines in local spatial planning documents.....................................................................................................................92
8.3.3.2 Commercial services....................................................................................................93
8.3.3.3 Industry.............................................................................................................................93

LOCAL ENERGY PLAN
8.3.3.3.1 Implementation of energy management systems.....................................93
8.3.3.3.2 Raising the technical capacity of the industrial enterprises................94
8.3.3.4 Traffic................................................................................................................................. 94
8.3.3.4.1 S.1.: Improving energy efficiency in transport...........................................94
8.3.3.4.2 S.2.: Improving of transport infrastructure.................................................95
8.4 Measures of raising awareness and increase the level of information..................95
8.4.1. N.1.: Increasing the level of informing of citizens..................................................................95
8.4.2. N.2.: Awareness raising and training of technical staff.......................................................96
9. Financial resources for the realization of the plan...................................................................97
9.1 Financing sources..........................................................................................................................97
9.2 Financing of projects....................................................................................................................98
9.2.1. Measures to improve energy supply and energy...................................................................98
9.2.2. Measures to increase energy production..................................................................................99
9.2.3. Measures for improvement of energy efficiency....................................................................99
9.2.3.1 Households....................................................................................................................100
9.2.3.2 Service sector...............................................................................................................100
9.2.3.2.1 Public services........................................................................................................100
9.2.3.2.2 Commercial services...........................................................................................101
9.2.3.3 Industry.......................................................................................................................... 101
9.2.3.4 Traffic...............................................................................................................................101
9.2.4. Measures of increasing awareness and raising awareness............................................102
10. SUMMARY........................................................................................................................................... 103
BIBLIOGRAPHY............................................................................................................................................... 112

LOCAL ENERGY PLAN
1. INTRODUCTION
1.1 Purpose of making Local energy plan
Local energy plan through a comprehensive review of current consumption and production of electricity and energy, and discusses the possibilities for more efficient supply of energy, its distribution and use, define actions for improving the local energetic. Local energy plan represents a legal obligation of local governments in accordance with the Law on Energy („Official Gazette of Montenegro “, number 28/10), but also the opportunity to use the principles defined in the Energy Development Energy Policy of Montenegro until 2030 and Energy Development Strategy of Montenegro until 2025 recognize concrete activities that can be realized at each of the local governments. Local energy plan has been prepared for a period of ten years and refers to the entire area of the municipality of Niksic.
Local energy plan at the level of local governments transferred three priorities Energy Development defined by the Energy Policy of Montenegro until 2030, as follows: security of energy supply, sustainable energy development and the development of a competitive energy market. Local energy plan is the link between priorities and strategic objectives defined at national level and the realization of concrete activities that contribute to achieving the same level of the municipality.
1.2 Objectives, measures and roadmap
The objectives of the Local Energy Plan are:
Identification of the current state of of consumption and production of electricity and energy in the area of the Municipality, as well as roughly define a plan for future energy needs (Chapters 1-5);
Identification of the potential for more efficient use, distribution, and energy production and energy, as well as the use of its own natural resources to meet energy needs of energy production in the municipality of Niksic (Chapter 6);
Defining activities taking into account the current state of development priorities of the Municipality, potential and planned future consumption, are steps towards a sustainable energy development on the territory of municipality (Chapters 7-9).

LOCAL ENERGY PLAN
The way of reaching these goals concrete activities, the roadmap is provided in Chapter 8, the definition of measures for the further development of the energy sector in accordance with the defined objectives. Local energy Plan represents a official, statutorily obliged document, local government and therefore the objectives, activities and deadlines defined by this plan represent liabilities units of local self-government.
1.3 The legislative framework
Local energy plan has its place in the strategic and legislative framework of Montenegro especially in the field of energy. Therefore, in the field of energy and energy development planning at the local level, the most important are the following documents, namely:
At the national level:o The Energy policy of Montenegro until 2030 (2011)o The Energy Development Strategy of Montenegro until 2025 (2008)o The Energy Efficiency Strategy of Montenegro (2006)o Program development and use of renewable energy sources (not adopted)
Strategic Development Plan of the Municipality of Niksic (2014-2019)o Spatial and urban plan of the Municipality of Niksic (in progress)o Local energy plan (in preparation) o Energy Efficiency Program (not adopted)o Plan on Energy Efficiency (not adopted).
The energy policy of Montenegro until 2030, adopted in 2011 defines three main priorities of energy development in Montenegro, targets and measures. Priorities energy development are:
sustainable energy development, security of supply and development of a competitive energy market.
In addition to the clear direction to the efficient production, distribution and consumption of energy, energy policy focuses on the use of national resources, especially renewable energy sources to increase domestic production. Moreover, energy policy defines the growth of human resources for energy planning at the local level as a strategic and systematic measures which gives importance to local energy plans.

LOCAL ENERGY PLAN
Energy Development Strategy of Montenegro until 2025, represents a comprehensive document Montenegrin energy which analyzes the current situation, and make projections on the development of energy needs and trends to 2025 and provide guidance for energy progress and sustainable development, namely:
increase energy efficiency; greater use of renewable energy sources; revitalization of existing and construction of new power facilities; achieving a balance between energy development and environmental protection.
In addition to cooperation with local governments in the implementation of specific activities related to their geographical area, the strategy has a clear responsibility to local governments in the establishment of district heating. In accordance with the Law on Energy, the Energy Development Strategy of Montenegro following a five-year action plans for the implementation of the strategy. The activities defined in the Action Plan, which started in the past period or in progress, in which the local government had direct involvement relate to education about the introduction of energy management in the public sector, energy saving projects in the public sector particularly education and health sectors, projects of reconstruction and extension of electricity network, construction of small hydropower projects and the like.
Local energy plan must comply with the guidelines and strategic objectives defined in the Strategy. In 2011, the Ministry in charge of Energy has launched the initiative the update strategy and preparing the Energy Development Strategy of Montenegro until 2030. As this document is not adopted, but it is only a draft published to the public in 2012 so it will be the preparation of a local energy plan to rely on the guidelines defined by the current strategy.
Energy Efficiency Strategy adopted in 2006 presents an overview of the current situation in Montenegro and identify areas in which they most significant savings can be achieved, with special emphasis on the field of building construction. The role of local government been recognized by this strategy as one of the most important after the state authorities, and through support for energy efficiency projects, the implementation of energy efficiency measures in their own facilities, by creating a basis for financial and administrative monitoring of energy consumption, the implementation of demonstration projects and informing citizens. Basic principles of the Energy Efficiency Strategy are contained in the Energy Development Strategy of Montenegro.
In accordance with the Law on Energy Efficiency ("Official Gazette", no. 29/10), an energy efficiency strategy following a three-year action plans which aim to defining concrete measures for achieving the national goal of energy efficiency. Action Plan for the period from 2010 to 2012, defines the activities to improve energy efficiency for

LOCAL ENERGY PLAN
achieving the goal of 2% reduction in final energy consumption by 2012 compared to the mean value for the period from 2002 to 2006. The action plan has focused on the household sector, public buildings and raising awareness of energy efficiency measures.
In accordance with the Energy Law, in order to achieve the national target for the share of renewable energy in the total final energy consumption, which is set at 33% by the year 2020, the Government has an obligation to the adoption of the Programme for development and use of renewable energy sources. The program defines the dynamics of implementation of projects using renewable sources of energy to produce electricity as well as heat, as well as incentive measures of certain technologies in order to achieve the objective in an optimal way. As the program has not been adopted, local energy plan will focus on current strategic and legaslative framework.
Besides this strategic framework, which is directly related to the guidelines for the development of the energy sector, given that energy development is closely linked to the development of the economy, it is necessary to have the insight and other national strategies, such as, but not limited to the Sustainable Development Strategy of Montenegro and the Regional Development Strategy of Montenegro.
The Energy Law adopted in 2010 defines the rights and obligations of energy entities, and therefore the local governments. In accordance with the Energy Law of local government shall have the following rights and obligations:
The adoption of a ten-year local energy plan which plans the needs and ways of energy supply, as well as measures for energy efficiency, renewable energy and cogeneration;
Submission of the annual report on the implementation of the local energy plan to the ministry responsible for energy affairs later than 31 March of the previous year;
Jurisdiction over heat supply, which includes: o Issuance of authorizations for facilities the production of heat for district
heating and / or cooling as well as heat distribution (procedure for issuing energy permits closer to the criteria defined in the Regulations for the energy permit, the contents of requests and the register of energy permits);
o Keeps the register of the heat for district heating / cooling or heat or industrial;
o Preparation of annual balance of the amount of heat produced and delivered in accordance with the above obligations;
o Prescribes detailed conditions and manner, including the tariff system for heat supply;
Public announcement for the construction of energy facilities in the case defined in article 65 of the Act.
Besides the Energy Law, the obligations and rights of local governments to the energy field defines the Law on Energy Efficiency. Besides before the above obligations and rights, it defines the following obligations and rights of local governments:

LOCAL ENERGY PLAN
The passing a three-year program of energy efficiency, with the consent of the ministry responsible for energy, based on the Strategy and Action Plan, which contains a proposal of measures for improving energy efficiency, dynamics and manner of implementation of measures and necessary means and methods for their provision (can be from the state budget);
Adoption of Annual Energy Efficiency Plan which is an integral part of the local government budget;
Submit the report on the implementation of of the plan of energy efficiency to the ministry responsible for energy affairs latest by 1 March of the previous year (defines more closely Rulebook on the content of the report on the implementation of the plan to improve energy efficiency in local government units);
Receive expert assistance from the ministry authorized for energy operations in the preparation of plans and programs of energy efficiency;
Established and kept energy information systems by, as well as manage energy more in facilities used by for carrying out activities of local authorities, public services and public companies founded by the local administration (defines more closely the Regulations on Information System in energy consumption and how to provide data on annual energy consumption );
Informs citizens about the opportunities, the importance and effects of the energy efficiency measures;
Determines incentive measures for implementation of energy efficiency measures in their area.
In addition to the above mentioned of the Energy Law and the Law on energy efficiency, given that for the purpose of energy production can use natural resources such as water, forest residues, waste, etc., when defining rights and obligations when constructing of energy facilities shall be applied other relevant legislation, including:
The Law on Organisation of Planning and Building Construction; Law on Concessions; Law on Waters; The Law on Environmental Protection, etc.
LOCAL ENERGY PLAN
1.4 Basic information about geographic and socio-economic characteristics of the municipality of Niksic
1.4.1. Geographical position and climate characteristics of the Municipality
Niksic is located in the same named a karst field in the central part of Montenegro. Hoogte fields from 600m to 660m in Slivlja on Vidrovan. Geographical coordinates are 18 ° 57 his '28' 'longitude and 42º 46' 29 '' north. It is the second Montenegrin town. From the Adriatic Sea is only thirty kilometers the air line, but in view of the completion of the Risan-Zabljak, represents a significant point in linking the coast and the north of the country.
Slika 1.1 The geographical position of Niksic municipality and local communities map
The emergence of civilization in this space are inhabited by the Illyrians, Romans, Eastern Goths, and Slavs from the sixth century. The Roman fort Anderba, resulting in Niksic field in the I - om century, were crushed Ostrogoths in V a century and raised the their fortress Anagastum, after which the Slovenian settlement called later Onogošt. The Turks conquered it in mid XV - th century and beginning of the XVIII - th and turned into a fortification. Present name the town was named after the tribe Nikšići. After multiple attempts throughout history, the Montenegrin army was freed in September 1877.years. Thereafter followed his rapid development. Niksic is the largest municipality in Montenegro, covers an area of 2,065 km2, accounting for 14.95% of its territory. It borders with six Montenegrin municipalities: Kotor, Cetinje, Danilovgrad, Kolasin, Šavnik and Plužine. To the west the border with Bosnia and Herzegovina.

LOCAL ENERGY PLAN
RELIEF
The geological composition and structure prevail limestones of Cretaceous age, in Nikšićkoj Parish upper Triassic age. The Pleistocene layers accumulated flows of Zeta and Gracanica thick around 17m. On the Upper Triassic limestones and dolomites are deposits of bauxite, with several active mines.
Relief Niksic field, in which the city is located, is distinguished relatively flat bottom, a very jagged edge and quite steep sides. From of its bottom, which is of Quaternary drifts, protruding numerous limestone - dolomite hills and heads, of which the highest Trebješka head which is high 762 m above sea level. The rim of Niksic field is so jagged that has a large number of journals and several smaller fields that have their local names (Upper Field, Krupačko field, Slansko field and the central part of the field). The field as a whole has a triangular form and surrounded on all sides by mountains, so it is a closed depression. From the valley of Zeta limestone separated by a narrow bar off Budoš - Kunak. On its eastern and northeastern mountains Prekornica, Stitovo, Maganik, Zurim and Vojnik. To the west stretches the mountain Njegoš, a plateau in the southwest of Old Montenegro, with whom in the immediate vicinity fields and towering mountains Budoš and Pusti Lisac. The field is wedged between the mountains and its surface is 66.5 km2. Its long axis is 18.5 km over a width of an average oko3,5km.
CLIMATE
Climate Niksic field is advantageous, since they feel maritime impacts, and the impact of continentality is most evident in the larger daily and the annual temperature ranges. The mean annual air temperature is 10,7◦, and the average annual precipitation is 1,993 mm. Temperatures reaching the highest level in July and August, and the lowest in January and February. Maximum amount of rainfall in November and December, while the minimum in July and August. The average relative humidity is 68.6%. Niksic has a high value of insolation, about 2,220 hours per year. The dominant winds are north and south. In the Pleistocene water layers of fine sand and marl clay developed a relatively dense network of short watercourses that the edges of fields sink. The longest and most important river Niksic field is Zeta. Its largest tributaries are Bistrica, Mrkošnica and Gracanica. Because of the small bandwidth capacity abyss part of Niksic field during abundant winter precipitation is occasionally flooded. The field is located approximately 300 wells, 30 small and large flows and a large number of the abyss, even 886. In the municipality of Niksic there are artificial lakes: Krupac, Slano, Vrtac, Liverovići, Grahovsko lake and Bilećko lake.

LOCAL ENERGY PLAN
Biodiversity
Due to its geographical location and very specific geomorphological, geological, hydrological, hydrogeological, soil, climate, biodiversity and other characteristics, the municipality of Niksic represents, especially for the protection of the environment, an extremely valuable area. The Secretariat for Spatial Planning and Environmental Protection of the Municipality of Niksic is proposed to be put under the protection of the following objects of nature: Studenačka heads, estavela Gornjepoljski source, intermittent source Virski stream, site Bjeloševska bar (typical example of preserved traces of glaciation - valley glaciers), district Zabran King Nicholas in Morakovo, endemic species of maple Acer intermedium, district Orijen the Bijela Gora, locality Velika Osječenica shortage of plant community Dioscorea- Carpinetum orientalis, forest pine whitebark pine (Pinus heldreichii) on Stitovo, Prekornica, community forest Acer Tilietummixtum.
1.4.2. Demographics and settlements
According to results of the 2011 census the municipality Niksic it was 72 824 inhabitants, which is 11.6% of the total population of Montenegro. Of this town 57 278, in Niksic field with the town of 63 280 inhabitants, in the Zupi Niksickoj 3 731 inhabitants in the southern zone with Bogetici 424 inhabitants, in the western zone it was 1 638 inhabitants in the northern zone of 485 inhabitants.
The population density is 36.45 inhabitants / km2, which the Municipality of Niksic inclusion into the group municipalities with mean density. The population density is 1.23 times less than the density at the level of Montenegro, which is 44.8 inhabitants / km2.
In the period 1991-2003. the number of inhabitants in the municipality of Niksic increased by 1 404, while in the coming census period declined by 2 458 inhabitants.In the same periods in the city's population grew by 2 563, respectively decreased by 1 242.
In the observed period, only the village settlements in Niksic field had a constant population growth in the first period 500, and the second much smaller for the 55 residents, thanks to the growing number of residents in three villages: Milocani, Ozrinici and Rastovac. Other product areas of the municipality had been constant declining population, with the intensity of decline increased in the last intercensal period.
In the central area of the first period, the population had grown to 2 742, while the second has decreased by 1 982nd In the neighborhoods of Zupa Nikšićka population in the first period fell to 134, and the second for 303 inhabitants.

LOCAL ENERGY PLAN
In other villages of the central areas of the population in the first period (1991-2003. G.) Declined by 187, while the second (2003-2011. G.). Of the 30 villages of the area population growth had 3 arches, Bogetići and Vitasojevici (although it's a small growth), while the rest of the decline.
West area (which we due to the large number of settlements divided the southwest and northwest) in the first period (1991-2003. G.) lost 1 152 531 inhabitants in the second emigration. In the southwest area has 24 villages in the first period, the population had dropped to 585, and in the second period to 269. In the field of population growth in the period 2003-2011. years had only two settlements and to Nudo (slightly larger) and Podbozur (very small increase only 1 resident), while all other settlements had a decline in population, of which the largest Brestice (from 51 to 10 people).
Northwestern in the first period lost 567 inhabitants, while in the second 262nd. Of the 17 villages in this area 3 had an increase in population in the last intercensal period (2003-2011). Koravlica (index 221.4), Petrovići and Podvrs, the resort Miruše population stagnated, while the other declined.
In the first period (1991-2003. G.) North area has lost 186 residents, and the second (2003-2011. G.) was considerably more 321 inhabitants. In this area, population growth was only occur Javljem, in Vrbič he stagnated, while the other 16 settlements declined. Resorts Vrbica and Wednesday have less than 10 inhabitants and below 20 settlements Ubla, Zaljutnica and Štitari.
It is important to point out that even in the western and northern area of the village population size small, in fact, no one village which has 200 inhabitants, more than 100 residents in the western area of 41 settlements have all 11 of them, while in the northern area of 18 villages only village Dubočke has over 100 inhabitants. In the central area (part of the settlement outside Niksic field and Zupa Nikšićke) 2 settlements (Dragovoljići and arches) have with over 300 inhabitants, 1 (Šipačno) has over 200 inhabitants, and 5 settlements of over 100 people. Population large settlements over 500 inhabitants are mainly in Niksic field and 4 (Source, Milocani, Rastovac and Ozrinići), of which 2 are over 1 000, and one (Ozrinići) over 2 000 inhabitants. Zupa Nikšićkoj two settlements (Dučice and Kuta) are category 501-1000 inhabitants.

LOCAL ENERGY PLAN
Picture 1.2 – Population in the period 1991-2011. y.
In contrast to the the number of inhabitants number of households was constantly increasing in the municipality of Niksic with 19 495 in 1991 to 21 140 in the 2003 and 21 634 in 2011 (but the intensity of growth declined - in the period 1991-2003, the number of households increased by 1 545, and in the following period 2003-2011. g. for only 494) due to stratification of households (the division of larger to smaller households). Meanwhile, the average household size has decreased from 3.8 to 3.3 members.

LOCAL ENERGY PLAN
Picture 1.3 Movement the number of households in the period 1991-2011.g.
1.4.3. Economic Indicators
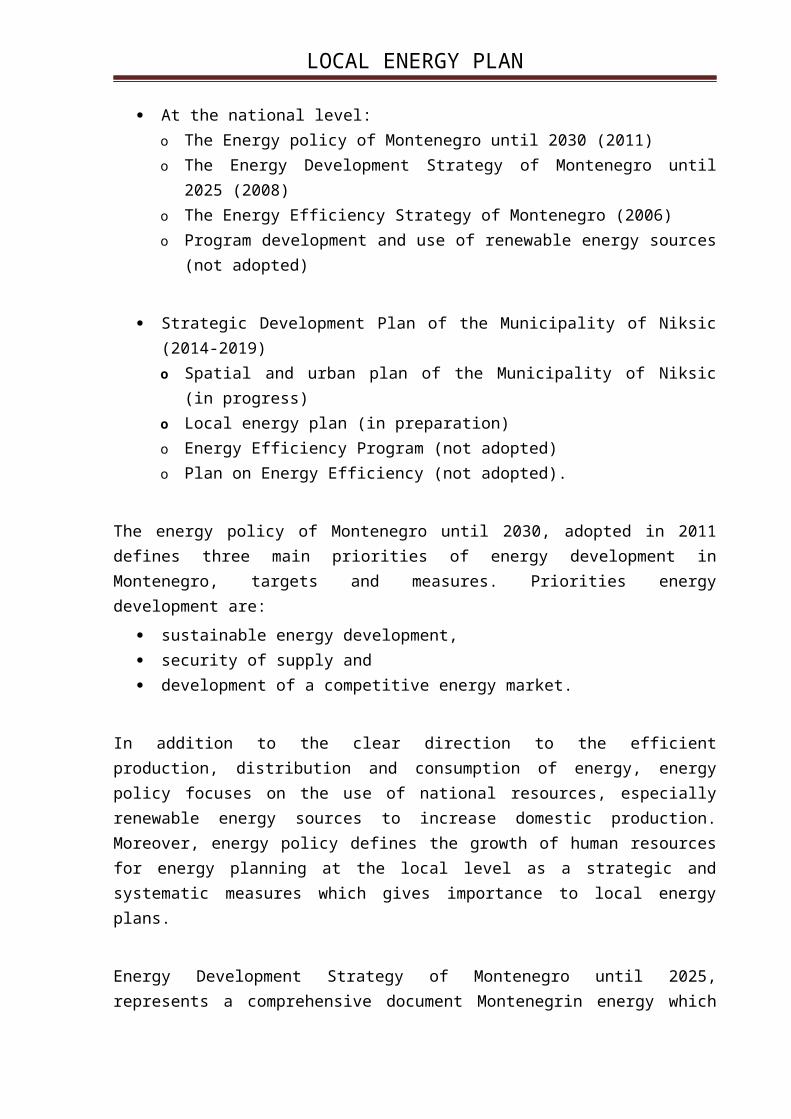
Municipality of Niksic with development index of 89% is the average local government development index. Positive trends in the active population is related to the reduction of the illiterate population and the increasing number of households, while the other indicators are negative.
After development index, below the Municipality of Niksic are the following municipalities: Andrijevica, Berane, Bijelo Polje, Kolasin, Mojkovac, Pljevlja, Rozaje, Savnik, Zabljak, Cetinje, Ulcinj and Plužine. This index is the largest of the Municipality of Budva and is 362%.
Picture 1.4 Development Index Municipality in Montenegro

LOCAL ENERGY PLAN
The total development of an area substantially is determined by the degree of development of its economy. Thus, the Niksic looked better or worse depending on the state of its economy. The economic recession in the nineties along with inefficiencies and structural unadjustment inherited from the period of self-management of the economy have contributed to the unsatisfactory situation in Niksic economy. In the second half of the nineties, the decline in economic activity has stopped. After 2000, there is a rapid economic recovery. Economic growth is more dynamic and stable In the period from 2006 to 2009 nikšićka economy has undergone significant changes compared to the previous year, and are reflected in the growth of gross domestic product, growth investments, real estate development, combating the gray economy and reduce unemployment. The period from 2010 to 2013. Niksic is stagnation and decline in economic activity, which resulted in the closure of a number of enterprises, growing unemployment rates, reduction of fiscal revenues in the final declining levels of investment. All countries in transition are faced with the initial constraints for development of entrepreneurship and small and medium-sized enterprises, such as the low level of business knowledge (especially in the field of management), regulatory and administrative barriers, limited access to available sources of funding, inadequate access to sources of business and market information and restrictions on the availability of specialized business services.
According to the structure of economic activity the most common is commercial activity, followed by the manufacturing industry. The structure of enterprises by size are the most numerous small businesses and micro-entities (1691), followed by medium-sized enterprises (23) and large enterprises (7).

LOCAL ENERGY PLAN
Manufacturing indus-try
13.24%
Wholesale trade of and retail
26.60%
Transportation and storage1.63%
Agriculture, hunting and forestry
43.93%
Real estate activities4.70%
Building and Construction
6.88% Others3.02%
Picture 1.5 The structure of income per activities in the municipality of Niksic for 2010
Planned and achieved budgets of Niksic municipality in the period 2008-2014 are presented in the Table 1.1.
Year Planned(€) Achieved(€) Realized(%)
2008. 30.689.252,40 25.326.243,38 82,5
2009. 28.712.132,00 16.545.026,22 57,6
2010. 25.677.985,43 15.830.165,49 61,6
2011. 27.063.950,62 17.799.559,37 65,7
2012. 30.638.363,80 15.222.779,59 49,7
2013. 35.742.711,00 19.802.695,84 55,4
2014. 36.310.852,00 - -
Table 1.1 Planned and realized budget of the municipality Niksic 2008-2104th year.

LOCAL ENERGY PLAN
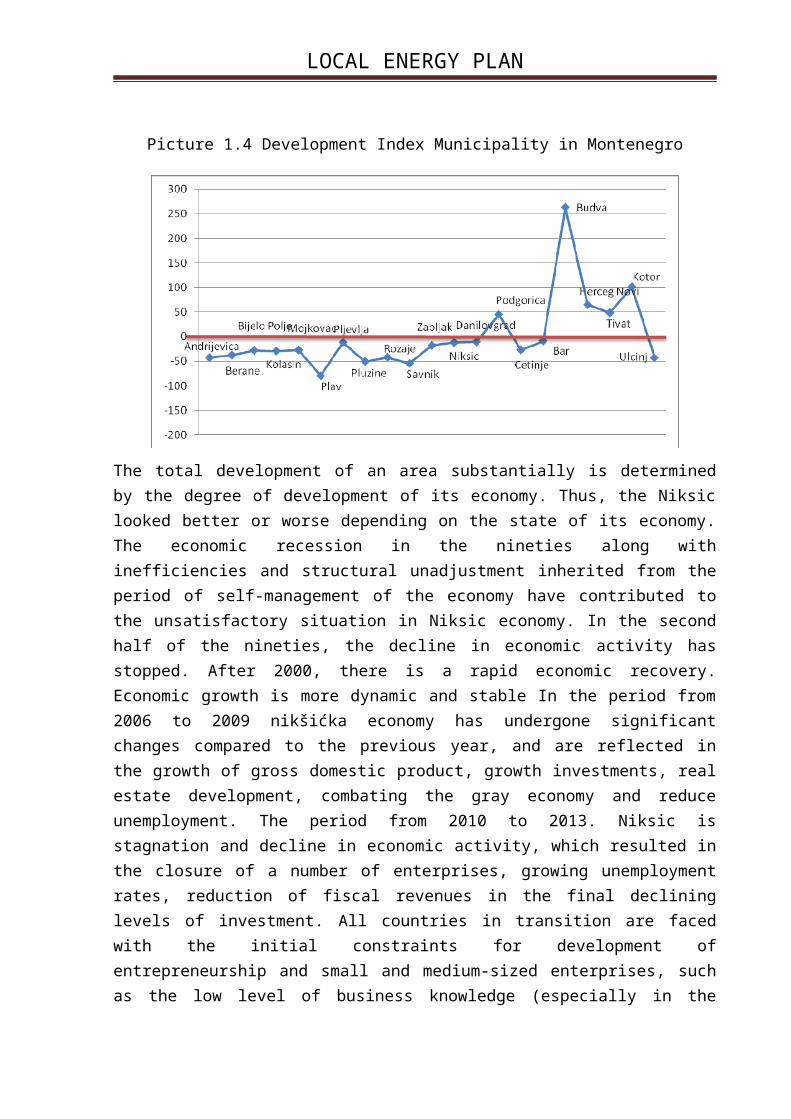
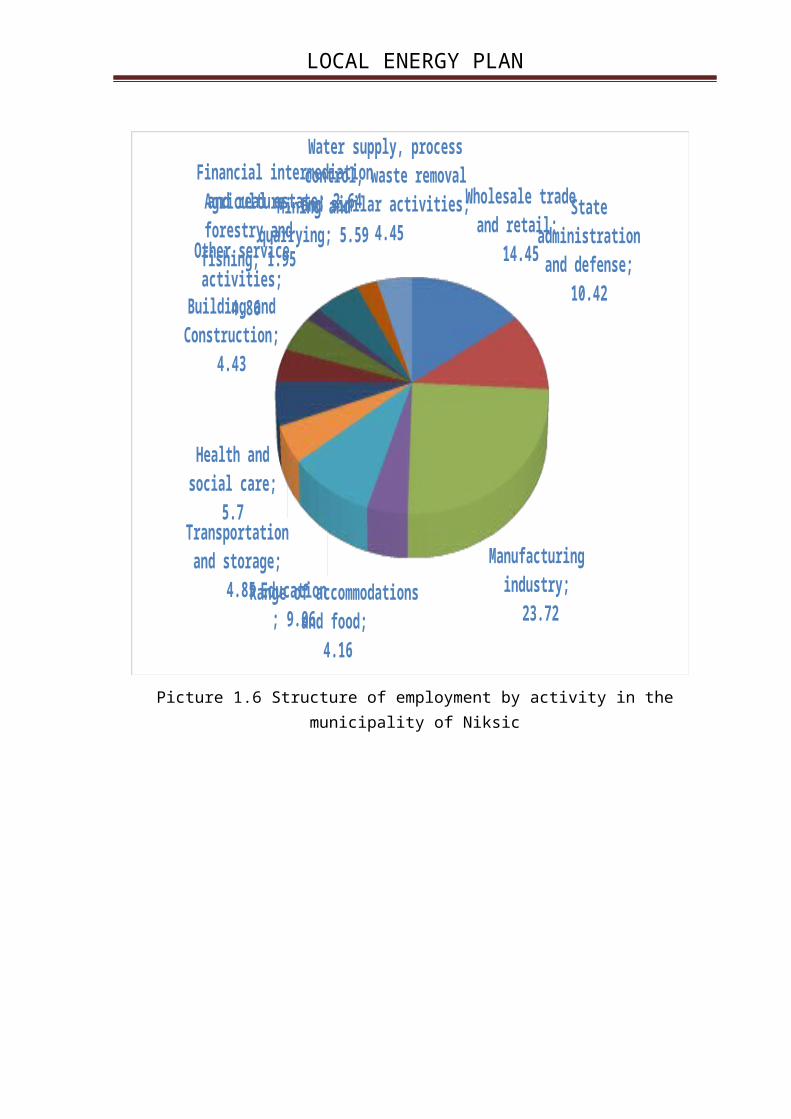
It is essential to the sustainable economic development of the Municipality of Niksic based on diverse, environmentally friendly, locally, regionally and beyond oriented economy that is flexible enough to use their own natural and human resources, including energy services. Just opening new real, marketable and profitable workplaces, and for the shortest appropriate period of time, especially for the young and educated, can stop depopulation in Niksic.
Picture 1.6 Structure of employment by activity in the municipality of Niksic
Wholesale trade and retail; 14.45
State administration and defense; 10.42
Manufacturing in-dustry; 23.72Range of accommodations and
food; 4.16
Education; 9.06
Transportation and storage;
4.85
Health and social care; 5.7
Building and Construction;
4.43
Other service activ-ities; 4.86
Agriculture, forestry and fishing; 1.95
Mining and quarry-ing; 5.59
Financial intermediation and real estate; 2.64
Water supply, process control, waste removal and similar activ-
ities; 4.45

LOCAL ENERGY PLAN
2. Supply of energy, production and distribution of energy
The deep socio-economic changes during the last 20 years, particularly in the industrial sector, have also caused a significant restructuring of the energy needs.
2.1 Supply of energy
2.1.1. Coal
Does not have documented data on deliveries of coal, and as for the consumption, we came to the knowledge that '' Steel Plant Niksic“ consumes significant amounts of coal for their production.
2.1.2. Wood
Fuelwood is very popular energy resource in the area of the Municipality, particularly during the heating season. Consumption of heating wood in the category of households 2011. g. amounted to (MONSTAT, 2013), 97 926 m3 and 72 320 m3 in the city and 25 605 m3 in rural areas. Number of households used the firewood was 18 554, respectively 13973 and 4581 in urban households in rural areas.
Supplying wood energy is dominantly of retailers (67 568 m3, or 69%), while the remaining 30 357 m3, or 31% of their forests.
In addition to the household, it is realistic to assume that the firewood is used to a lesser extent in other sectors (bakeries, restaurants, dryers meat, etc.). At this moment we do not possess documented statistical data on the consumption of firewood. In the absence of reliable data, for the needs of this document will be taken estimate of 4% of household consumption, or 3917 m3. So overall calculative consumption of firewood in the municipality of Niksic is 101 843 m3.

LOCAL ENERGY PLAN
2.1.3. Electrical energy
Electrical energy during the last two decades is increasing its relative participation the energy demand in Niksic. However, due to the reduction in total energy consumption due to the quenching of industrial capacity, depopulation and decline in living standards, the input electrical energy in absolute amounts is not a significant increase.
The input electrical energy consumption area of the Municipality of Niksic 2006. amounted to 261 GWh and remained at almost the same level until 2013. with minor variations, which are shown in Picture 2.3
Picture 2.3 Input electricity Municipality of Niksic in the period 2006 to 2013. y.
The greatest value of 261 GWh was achieved in 2006. and 2008 g. The participation of the Municipality of Podgorica in Montenegro total consumption amounted to 2010 g. 8.05%, and 2013 y. 7.6%.The area ED Niksic is characterized by a very large area and dissection of consumption, and the concept of customer supply is realized through 110/35/10 kV system transformation. Transmission network in the Niksic is difficult to observe as a separate entity, because it is part of the electricity transmission system in Montenegro. On this territory there are two 110/35 kV transformer stations TS Nikšić and TS Vilusi. The whole area except the part about Vilusi is supplied from a single 110 kV supply points, 110/35 kV TS Niksic being the oldest transformer stations in Montenegro (in operation since 1956) with the transformer units 63 and 3 x 10 MVA (three single-phase transformers), while the 110/35 kV substation Vilusi (one transformer capacity of 10 MVA) is only supplied Vilusi area. Power supply (as well as the Ironworks Niksic) is realized via three 110 kV transmission line from TS Perućica to TS Niksic and 110 kV
2006 2007 2008 2009 2010 2011 2012 2013235
240
245
250
255
260
265
261
245
261
258259
256257
247
Chart Title
GWh

LOCAL ENERGY PLAN
power line between TS Trebinje and TS Niksic, located in BiH in which the rigid connection associated TS Vilusi.
Category Total City consumption Rural consumption
2010 2011 2010 2011 2010 2011
110 kV 1 1 0 0 1 1
35 kV 2 2 0 0 2 2
10 kV 33 36 27 30 6 6
Other consumption
2494 2771 2064 2307 430 464
Households 29681 30091 21981 22257 7700 7834
Total 32211 32901 24072 24594 8139 8307
Table 2.1 Number of consumers by categories of consumption of the Municipality of Niksic
Picture 2.4 The Municipality of Niksic in relation to the transmission network of Montenegro

LOCAL ENERGY PLAN
Data on lengths of cable (KK) and overhead lines (VV) distribution network are given in the following Table 2.2.
TIP lines Length
110 kV air 90 km
110 kV cable 0 (during construction 5km) km
35kV air 75 km
35kV cable 10 km
10kV air 990 km
10kV cable 65 km
NN air networks 1200 km
NN network cable distribution 14 km
Table 2.2 Data of lengths of cable (KK) and overhead lines (VV)
Cross sections are very different and range from 4x16 mm2 to 4x185 mm2 for LV network, 3x35 mm2 up to 3x185 mm2 10 kV network and of 3x50 mm2 to 4x1x400 mm2 35 kV network.
Installed power of transformers ranging over a wide range, as well as on whether the TS on the town or a rural area. Thus transformers 35/10 kV appear in the range of 2.5 kVA up to 12.5 kVA and 10 / 0.4 kV in the range of 30 kVA to 1000 kVA. Transformers 35 / 0.4 kV, 6 / 0.4 kV and 35/6 kV are present in a small number, a power are ranging from 100 kVA to 4000 kVA. Transformers 35 / 0.4 kV, 6 / 0.4 kV and 35/6 kV are present in a small number, a power are ranging from 100 kVA to 4000 kVA. Transformers in the municipality of Niksic and oil are embedded in the TS different types: residential, tower, MBTS, BTS and pillar, earmarked facility or part of another object.
Data on the number of distribution transformers urban and extraurban areas are shown in the following table, Table 2.3.
Location Voltage levels
Number of transformer
stations
Power of transformer stations (MVA)
Niksic TS 35/10 kV 3 61,5Zupa TS 35/10 kV 1 2,5Vilusi TS 35/10 kV 1 2,5Total TS 35/10 kV 5 66,5
Location Voltage Number of Power transformer-
LOCAL ENERGY PLAN
levels transformer-stations
stations (MVA)
Niksic TS 10/0,4 kV 225 90,59Zupa TS 10/0,4 kV 28 2,58Vilusi TS 10/0,4 kV 109 7,21Golija TS 10/0,4kV 12 0,71
TS that are not owned by ED
Niksic
TS 10/0,4kV 92 47
Total TS 10/0,4kV 466 148,39Table 2.3 Number of distribution transformers
The area from Niksic is very much by area and is characterized by large intentedness of consumption. The concept power to load in ED Niksic is currently realized supply of two 110 kV supply points (TS Niksic and TS Vilusi), although practically the entire region and the town of Niksic (except areas Vilusi) supplied only from TS Niksic which is the oldest transformer stations in Montenegro (put into operation in 1956).
2.1.4. Petroleum and Petroleum Products
Supplying in motor fuels and LPG provides across 8 petrol stations (owned by 3 '' Jugopetrol AD Kotor'', BS “Neksan DOO“, BS “Gitanes“, BS “Z-Petrol“, BS “Petrol Vjeniko '', BS “Petrol“).
In the municipality of Niksic most represented are owned by BS ’’Jugopetrol AD Kotor''. Traded quantities of fuel (m3) to BS Nikšić1, Nikšić2 and Nikšić3 property '' Jugopetrol AD Kotor '' for the period 2012 to 2013. are presented in Table 2.4
Jugopetrol AD Kotor
2012. 2013.
Petrol 3187 2925
Diesel 8464 8948
LPG 526 477
Table 2.4 Traded quantities fuels with BS owned by '' Jugopetrol AD Kotor ''
Company Neksan within its a retail sale facility owns five tanks with total volume of 300,000 liters. Table 2.5 shows the quantities of petroleum products (m3), which is a company Neksan delivered during 2012 and 2013.

LOCAL ENERGY PLAN
GS Neksan
2012. 2013.
Petrol 777 689
Diesel 2928 3086
Fuel oil 201 25
Oil fuel (t) 2,447 1,338
Table 2.5 Traded quantities fuels with BS Neksan
Traded quantities of fuel (m3) with a BS Gitanes are shown in Table 2.6
GS Gitanes
2012. 2013.
Petrol 650 585
Diesel 3686 2637
LPG 781 497
Table 2.6 Traded quantities fuels with BS Gitanes
The total traded quantity of fuel (petrol, diesel and LPG in m3) in the municipality of Niksic for the period between 2012 and 2013. with all the existing petrol station is shown in Table 2.7.
Company 2012 2013
Jugopetrol 12177 12350
Gitanes 5117 3719
Neksan 3906 3800
TOTAL 21200 19869
Table 2.7 Total traded quantity of fuel
In addition to the fuels in transport, for needs of active boiler is used in heating oil, electricity, coal and pellet. According to current knowledge, the consumption of fuel oil in 25 active boiler room amounted 2011 g. 1026t, and 1200 m3. The realistic assumption is that this balance is not covered at least 10%, so it can reckon with heating oil consumption of 1,320 m3.
2.2 Energy production in the territory of the local government
2.2.1. The production of electricity

LOCAL ENERGY PLAN
On the territory of the Municipality of Podgorica is the oldest large hydropower plants in Montenegro, was put into operation in 1960. It is named after the well Perućica, which rises near the hydroelectric power plant.
Its installed power is 307 MW and potential annual production of around 1,300 GWh. Useful accumulation is 353 h / m³. For the production of electrical energy "HE Perućica" uses of water basin of the river Gornja Zeta, respectively waters entering the Niksic field and at a favorable decline at a short distance between Niksic field and Bjelopavlicka plains. Confluence area of "HE Perućica" is 850 km².
Picture 2.5 Power house HE ''Perućica''
"HE Perućica" consists of the following objects:
Accumulation: "Krupac", "Slano" and "Vrtac" The system of channels, Sedimentation, Compensation reservoir, The headrace tunnel entering facility, Pipeline with 3 pipes under pressure, The powerhouse for 8 aggregates, Switchgears of 110 kV and 220 kV, The headrace tunnel 3323.27 m, Pipeline no. 3 diameter of 2.65 + 2.5 m.
The power house HE "Perućica" was installed 7 double turbines type "Pelton" with generators horizontal properties of the total installed capacity of 307 MW. Five units have an installed power of 40 MVA and two each 65 MVA. It is planned to incorporate the eighth power of 65 MVA of aggregate for whom they built all supply and drainage organs, auxiliary and common actuators and specific location for installation in the powerhouse.
LOCAL ENERGY PLAN
In the period from 12 March 1960 - 31 December 2011 HE"Perućica" produced 44,135,327 MWh or an average of 848,756 MWh (respectively 849 GWh) of electricity. Record 2010 produced 1,434,852 MWh.
EPCG in 1992 started with the realization of the modernization process and training Hydro power plants "Perućica", that includes works on revitalization and modernization of the production process, to bringing plant equipment and facilities at a level that will reduce the risk of breakdowns and ensure safety of operation as well as increase operational readiness and guarantee the current production. By this program, in its first phase also comprises reconstruction realized hydro and electrical equipment on generators 1, 2, 3 and 4 and two home aggregates.
HPP Production ( GWh )
2011 2012 2013
''Perućica'' 629 808 1334
Table 2.8 Production Perućica in the period 2011-2013. year
2.2.2. A district heating system
The municipality of Niksic no the district heating or gasification district heating system, but there are 36 active boiler rooms of different capacities for oil, electricity, coal and firewood for heating individual complex public institutions: education, health, culture and public administration. It is realistic to assume that a few non-commercial or commercial entities supply heat from the boiler room to the different types of energy.
More detailed data on institutions, hot surfaces and power boilers are given in section 3.2.2.
2.2.3. Other forms of energy generation
In other forms of energy generation in Niksic Municipality may be mentioned devices for obtaining of heat on the principle of heat pumps (air conditioners), or combustion wood, coal or LPG stoves, cookers, fireplaces and the like.

LOCAL ENERGY PLAN
3. Analysis of energy consumption in local government
3.1 Energy use per type of energy source energy
3.1.1. Use of electrical energy
Due to the universal application possibilities, electricity is in the municipality of Niksic used for energy transformations in for example thermal and mechanical, light, chemical energy in all sectors.
The structure of consumption ED Municipality of Niksic is characterized (Table 3.1 and Figure 3.1) stagnation observed parameters spending at all levels, as well as energy purchased with small oscillations. In Table 3.1 and Picture 3.1 shows the data downloaded and delivered energy consumer categories, as well as losses for ED Municipality of Niksic for the period 2006 to 2013. g.
Years Purchased energy
Delivered on consumers(GWh) Losses Losses
(GWh) HouseholdsOther
consumption10 kV
35 kV
Total (GWh) (%)
2006 261 118.6 33.5 25.4 4.9 182 82 31.4
2007 245 116.4 37.6 27.6 4.9 186 62 26.1
2008 261 117.4 37.5 30 4.6 189 74 28.3
2009 258 119.2 38.3 27.8 1.6 186 75 29
2010 259 120.5 38.1 28.1 1.3 188 70 27
2011 256 119 40.3 32.5 1.4 193 63 24.6
2012 257 116.3 40.2 31.9 1.2 190 67 26
2013 247 115.9 41.2 30.4 1.1 189 58 23.4
Table 3.1 Electricity balance of the Municipality of Podgorica for the period 2006-2013. y.
Here, special attention was given to a very high electrical losses. The maximum value of 31.4% was achieved in 2006. The average value of the stated percentage losses in the period 2006 to 2013. y. amounted to 26.87%.
From Table 3.1, as well as the image is 3.1 obviously that they were obtained (input) energy in the observed period had an annual oscillations of up to 6.5% with a maximum amount 2006-2008. g. of 261 GWh.

LOCAL ENERGY PLAN
In Figure 3.1 gives a diagram of the percentage share of individual categories for the three reference years (2006, 2010 and 2013 g.). During this period, almost all spending categories are held constant amount households (around 120 GWh), other consumption (about 40 GWh), 10 kV (about 30 GWh), while varied losses (58 GWh in 2013 g. To 82 GWh, 2006. g.) and 35 kV consumption (1.1 GWh in 2013 g. to 4.9 GWh in 2006).
Picture 3.1 Electricity balance of Niksic municipality for the period 2006-2013. g.
Picture 3.2 Share (%) categories of expenditure for 2006, 2010 and 2013.
The specific electricity consumption per capita of Niksic municipality amounted to 2011 g. 1130 kWh / capita in the category of households 3777 kWh / home. The corresponding values at the national level 2011 amounts 3576 kWh / home. It follows
Domaćinstva OP 10 kV 35 kV Gubici0
5
10
15
20
25
30
35
40
45
50
2006 2007 2008 2009 2010 2011 2012 20130
50
100
150
200
250
300
Nabavljena en. Domaćinstva Ostala potrošnja10 kV 35 kV Gubici
Year
GWh

LOCAL ENERGY PLAN
that the specific values of total consumption in the category of households Municipality of Niksic above the national average for 5%.
In Table 3.2 and Picture 3.3 presents the energy balances on a monthly basis for 2012 and 2013.
Foreclosed energy Handed over to consumers
Losses The percentage of losses
Month (MWh) (MWh) (MWh) (%)
2012 2013 2012 2013 2012 2013 2012 2013
January 28.655 27.220 18.884 18.327 9.771 8.893 34.1 32.7
February 27.419 24.574 16.780 16.961 10.639 7.613 38.8 30.9
March 23.465 25.443 17.008 17.675 6.457 7.767 27.5 30.5
April 21.667 20.106 15.344 15.321 6.323 4.785 29.2 23.8
May 18.230 17.627 14535 14.468 3.668 3.159 20.2 17.9
June 16.644 16.803 14.123 14.249 2.521 2.554 15.5 15.2
July 17.127 16.686 14.320 14.019 2.807 2.667 16.4 16
August 17.023 16.767 14.297 14.568 2.726 2.199 16.1 13.1
September 16.805 16.666 13.467 13.889 3.308 2.777 19.9 16.7
October 19.525 19.329 14.933 15.214 4.591 4.115 23.5 21.3
November 22.129 20.654 16.551 15.580 5.578 5.074 25.2 24.6
December 28.228 25.286 19.336 18.203 8.892 6.983 31.5 27.6
TOTAL 256.889 247.161 189.579 188.573 67.311 58.588 26.2 23.7
Table 3.2 Electricity balance sheets of Niksic municipality on a monthly basis for 2010. and 2011.

LOCAL ENERGY PLAN
Picture 3.3 Losses in the municipality of Niksic on a monthly basis for 2012 and 2013 y.
3.1.2. Use of coal and biomass for obtaining useful heat
As indicated in section 2.1.1 '' Steel Works Plant '’ consumes significant amounts of coal for their production. In Table 3.3 presents the balance sheets of coal consumption in the period from 2013-2014. years.
Steel Plant Niksic – Balance of coal consumption (t)
2013. 2378,56
2014. 1812,64
Table 3.3 Consumption of coal in the Ironworks Nikšić for the period 2013-2014. year
Fuelwood is used particularly in the heating season for space heating and for other needs (cooking, water heating, restaurants, bakeries, meat driers etc.). The dominant consumption of firewood in the category of households, particularly in rural areas. According to the data MONSTAT 2013, 18 544 households is 2011 g. spent the 97 925 m3, ie an average of 5.3 m3 / home. Comparing the average consumption at the national level of 5.5 m3 / home, it can be concluded that consumption In Nikšić Municipality close to the national average.
I II III IV V VI VII VIII IX X XI XII0
2,000
4,000
6,000
8,000
10,000
12,000
Losses for 2012. i 2013. year
2012 2013
MW
h

LOCAL ENERGY PLAN
When, in the absence of accurate data, other consumption of firewood assessed at 4% of household consumption, (3917 m3), we get that the total consumption of firewood in the municipality of Niksic amounts 101 843 m3.
3.1.3. The use of oil and oil products in traffic
The total traded quantities of petroleum products in transport is not possible to precisely delineate the local needs of the Municipality of Niksic and in transit. After all, part of the vehicles registered in the municipality of Niksic certain amount of fuel refuel outside of our community.
In Table 3.4 presents an overview of registered vehicles in the municipality of Niksic in the period 2011 - 2013. From this we may conclude that the share of passenger vehicles in the total number of registered vehicles in 2013 g. amounted to 87.65%.
Year MotorcyclePassenger
carsVan Buses ATVs
Special duty
vehicles
Towing vehicles
TrailersFarm
Tractor TOTAL
2011 118 16899 93 166 1557 206 153 247 25 19481
2012 135 17041 85 172 1507 193 150 243 13 19590
2013 121 17889 88 194 1528 98 149 215 16 20408
Table 3.4 The registered vehicles in the municipality of Niksic in the period 2011 - 2013.
The analysis of existing databases of registered passenger vehicles in Montenegro by type of motor fuel used, adopted the following results for consumption by fuel type for 2013: 4.199 m3 gasoline and diesel 14.671 m3, or a total of 18.870 m3.
Based on the available data on traffic fuels with GS "Jugopetrol" (3 gas stations), in Picture 3.4 is presented quarterly to the consumption of fuels for the year 2012.
In Figure 3.5 is presented quarterly to the consumption of fuels for the year 2013 with a BS Jugopetrol (3 gas stations), GS '’Neksan'’, GS '’Gitanes'' in the municipality of Niksic. Available quarterly data are presented in Table 3.5.

LOCAL ENERGY PLAN
Picture 3.4 Seasonal variation of fuels with a GS Jugopetrol AD Kotor
Picture 3.5 Seasonal variation of traffic fuels with a BS in the field of Niksic
2013. g. Q1 Q2 Q3 Q4
Petrol 917 1107 1195 872
Diesel 3106 3911 4283 3369
LPG 210 233 353 176
Table 3.5 Quarterly display traffic fuels with a GS in the field of Niksic
3.2 Using energy by sector
Q1 Q2 Q3 Q40
500
1000
1500
2000
2500
3000
662804
935783
1620
2092
2517
2235
107 130 168 121
Gas Station Jugopetrol 2012. year
Benzin Dizel TNG
Q1 Q2 Q3 Q40
500
1000
1500
2000
2500
3000
3500
4000
4500
9171107 1195
872
3106
39114283
3369
210 233 353176
GS Jugopetrol+GS Neksan+GS Gitanes 2013. year
Benzin Dizel TNG

LOCAL ENERGY PLAN
Based on the above sub-balance for each type of energy, using known conversion factors for natural and equivalent units in Table 3.6 is derived balance of final energy consumption of the Municipality of Niksic for 2011.g. This 2011 g. is taken as a reference because it is the largest number of statistical data presented for the year, from census data, studies MONSTAT on wood energy, etc. Graphic representation of the balance is shown in Total final consumption in the municipality of Niksic 2011 was 2655.39 TJ.
The balance of final energy consumption is shown in Table 3.6 and Picture 3.6.
Consumption in natural and equivalent units
Units Coal Fuel oil PropellantsElectrical
powerFirewood Oil fuel
Natural[t] [t] [t] GWh m3 [t]
4760 1118 21200 193 101843 -
Equival. (TJ) 49,71 44,17 904,18 694,8 962,53 -
Table 3.6 Balance of final energy consumption for Niksic in 2011.
Picture 3.6 Balans structure of energy consumption in 2011.
Based on the structure of the balance of final energy consumption shown in Table 3.6 and Picture 3.6 it can be concluded that the largest share has fuelwood (36.2%) and motor fuel (34%), while in final consumption of energy the lowest share has fuel oil with 1 , 7%.
In the following sections, will be presented analysis of energy use per household sectors, services, industry and transport.
Coal1.9%
Fuel oil1.7%
Motor fuel 34.0%
El. Energy26.2%
Firewood36.2%
Ugalj Lož ulje Pogonsko gorivo El. Energija Ogrijevno drvo

LOCAL ENERGY PLAN
3.2.1. Energy use in households
Households category, especially after the drastic reduction of industrial production, has become a category with a dominant share in the energy balance in Niksic. In this category, there is a significant potential for energy efficiency, particularly with regard to rationalization and substitution of energy consumption for space heating. To this end, it is presented a brief analysis of the housing stock, particularly with regard to the availability of energy sources for heating.
On the terithory of Niksic Municipality from cenzus data 2011. there is 26 894 apartments.
The ratio of the number of dwellings by number of households is 1.24. Number of apartments that are constantly used is 21 109 (78.1%), while the remaining 21.9% of homes is abandoned, or are used only seasonally. The total area occupied dwellings is 1,421,405 m².
According to installation equipment, 99% for residential dwellings are connected to the electricity grid, while 2 287 flats with a total area of 217 721 m², or 9% of the apartments, equipped with installations for connection to systems for heating, and 2 203 (9%) of the total housing area of 165 269 m² are air-conditioned.
Based on Table 3.1, in Picture 3.7 is shown annual consumption values realized electricity Municipality of Niksic (lossless) and the corresponding annual consumption in the household category for the period 2006 to 2013. The diagram indicates the small oscillations of both indicators during the period. Average household participation in the realized energy accounted for 62.5% of the oscillations of about 3%.
The average household electricity consumption amounted to 2011 g. 3,777 kWh / hohl., Which is 5% above the average in Montenegro (3,576 kWh / hohl.).
Picture 3.7 Realized elekticity of Niksic (lossless) and household consumption in period 2011-2013.
Electricity consumption in households on a monthly basis for 2012 and 2013. is shown in Table 3.7 and graphically in Picture 3.8. Maximum consumption of 2013 g. was recorded in December (11,492 MWh), and the minimum in June (8,596 MWh), and the ratio of the maximum (winter) and minimum (summer) consumption is 1.33.

LOCAL ENERGY PLAN
Months Handed to consum Households Share of households
(MWh) (MWh) %
2012 2013 2012 2013 2012 2013
January 18.884 18.327 11.663 11.492 61,8 62,7
February 16.780 16.961 10.429 10.109 62,2 59,6
Mart 17.008 17.675 10.637 10.713 62,5 60,3
2006 2007 2008 2009 2010 2011 2012 20130
20
40
60
80
100
120
140
160
180
200
Realizovana el. Energija Domaćinstva
GWh

LOCAL ENERGY PLAN
Months Handed to consum Households Share of households
April 15.344 15.321 9.426 9.497 61,4 61,9
May 14.535 14.468 9.208 9.193 63,4 63,5
June 14.123 14.249 8.778 8.899 62,2 62,5
July 14.320 14.019 8.518 8.596 59,5 61,3
August 14.297 14.568 8.649 8.859 57,9 60,8
September 13.467 13.889 8.270 8.654 61,4 62,3
October 14.933 15.214 9.171 9.493 61,4 62,3
November 16.551 15.580 9.824 9.610 59,3 61,7
December 19.336 18.303 11.764 10.774 60,8 58,7
Table 3.7 Electricity consumption in households on monthly basis in Niksic in 2012 and 2013.
When it comes to space heating, according to a study MONSTAT - FODEMO 96% of households 2011. g. used the firewood, and 3% electricity. In addition, urban population for space heating only uses firewood.
Electricity consumption in households on monthly basis in Niksic in 2012. and 2013.
Picture 3.8 Electricity consumption in households on monthly basis in Niksic in 2012 and 2013.
The households sector uses motor fuels used for private road vehicles. According to Table 3.6, of 19 481 total registered vehicles in the municipality of Niksic 2011 g. is registered 16 899 passenger cars and 118 motorcycles, representing a share of 87%. A
Januar
FebruarMart April Maj Jun Jul
Avgust
SeptembarOkto
bar
Novembar
Decembar0
2,000
4,000
6,000
8,000
10,000
12,000
2012 2013
MW
h

LOCAL ENERGY PLAN
small percentage of passenger cars are official, and the remaining 13% of the vehicles in Table 3.6 (buses, trucks, etc.) have higher average fuel consumption, while the share of private cars in the consumption of fuel can be estimated at 83%. With regard to the type of heating device, age of the housing, the materials from which they were made, and the like. potential for efficient use of energy in the household sector is significant, it will be subject to processing in section 6.2.
3.2.2. Energy use in the service sector
Before analyzing the energy balance in the following industry sectors (services, industry and transport), it was necessary to specify what is implied under certain industries. According to the classification (KD2010), which is in line with the European NACE rev.2, activities are divided into 21 sections, marked by the letters A - U (MONSTAT, Classification of Economic Activities 2010). The structure of the representation activities of the Municipality of Podgorica is illustrated in Picture 1.6 in section 1.4.
At least 14 sectors (E, G, H, I, J, K, F, M, N, O, P, Q, R, S, and conditionally and D and U) 3 can be joined services. Through various documents still interfere earlier and more recent classifications, which causes considerable confusion. The largest number of counted services sectors may nominate an earlier term social activities. However, within this section attention will be focused on the energy consumption of utility services (E), public administration (O), social services (P, Q, R), information and communication (J) and commercial and other services (G, I, K, L, M, N, S, U). Sector H (transport, storage) is excluded from this heading because it is subject to review in a special section 3.2.4.
3.2.2.1 Section E: Water supply and disposal
Niksic city water is supplied from three sources:
Source Gornji Vidrovan, on the angles 664 m.alt.
Source Donji Vidrovan, on the angles 653 m.alt.
Source Poklonci, on the angels 625 m.alt.
The total amount of water from all sources in the minimum is about 400 l / s, which is on the border needs of the city and suburbs. Water distribution is done by pumping plant Duklo PS, PS Lower Vidrovan, PS shrine and borehole wells B1 and B2.
OBJECT m.alt. FUNCTION
Gornji Vidrovan 664 Main source
Donji Vidrovan 653 Source

LOCAL ENERGY PLAN
OBJECT m.alt. FUNCTION
Poklonci 625 Source – borehole type
Pumping plant Duklo 624 Main plant
Trebjesa (bottom) 691 Reservoir area
Table 3.8 Objects of water distribution Municipality Niksic
Water supply system of the city consists of springs, wells and pumping plants, chlorine station, reservoirs, hidro plants and primary and secondary networks.
The sources from which supplies the city and its suburbs are Vidrovan Upper, Lower Vidrovan and chapel.
Average with pumping stations is supplied about 350 l / s treated - chlorinated water. In the period of increased consumption, due to higher temperatures and for agricultural needs, in the period June - September volume of water moving up to 600 l / s.
Gornji Vidrovan is the main source of which is regulated and put into operation in 1983.. The source is closed, physically and technically protected and has identified and labeled sanitary protection zones.
Donji Vidrovan the source is impounded in 1929 and 1954, sometimes the only source of water supply in the system. This source over the entire year used to supply the northern part of Niksic field (Vidrovan, Gornji Polje, Rastovac, Milocani and Sipacno), and during the dry summer months July - September and supply the city and suburbs.
Poklonci is a new source put into operation at the end of September 2008. This source is well type, maximum capacity of 200 l / s. Used only in the dry season (August - September) due to reduced inflow from vidrovanskih sources in the mentioned period the year. This source is borehole type, maximum capacity of 200 l / s. Used only in the dry season (August - September) due to reduced inflow from vidrovan sources in the mentioned period the year. Well pumps are located at a depth of 28-30 m, physically and technically protected.
The wells B1 and B2, which are located within the Donji Vidrovan was put into operation in 1999, the small capacity, minimum 20 l / s and 10 l / s, but are also used in the dry season.
It is characteristic that the water quality parameters from all three sources have approximately the same value.
Pumping station Duklo is the main facility through which are supplied the city and all its suburbs exept Vidrovan, Gornje Polje, Rastovca, Milocani and Sipacno. It was put into operation in 1983 and without major delays workls for a full 29 years. It consists of three pumping generators with 315 kW centrifugal pumps with a capacity of 200-400 l / s.
Pumping station Donji Vidrovan is repeatedly reconstructed and consists of two 45 kw generators with a capacity of 40 l / s. The pumps are a new generation with variable.

LOCAL ENERGY PLAN
Borehole pumping station of Poklonci consists of five well pumps capacity of 30-40 l / s, supporting centrifugal equipment, control board with full control and automatic control.
Pumping station for Šipačno put into operation in September of the current year is contemporary - with automation and frequency regulation. Through this pumping station performs the distribution of water for the village Šipačno and in the future for the village of Orah.
Chlorination station is located on the Donji Vidrovan and consists of three modern chlorinator. For water treatment is used chlorine gas. At the PS Poklonci there is a modern gas chlorinator for treatment of water from that source.
Reservoir area has a capacity of 7,500 m3 and consists of three tanks per 2,500 m3, which are on Trebjesa at a height of 69 m relative to PS Duklo.
Water pumps are built for ensuring proper water supply for consumers who are at higher elevations Dragova Luka - 2 pcs, Rubeža - 2 pcs and Vitalac-1 pc.
Water treatment plant and pumping station in Grahovo along with about 4500 m of primary pipeline consists of water supply system for supplying drinking water to the population of the village.
Pumping stations, wells and reservoirs JP '' Water and Sewerage '' represent a significant consumer of electricity in the municipality of Niksic.
Primary and secondary water supply network is made of various materials (cast iron, steel, asbestos - cement, polyethylene, PVC and galvanized pipe) and of different ages from 1931 until today. The network is very jagged and its length is about 450 km, and recorded and processed in GIS approximately 273,998.90 m which is over 60% Because of the age, different materials, and decline in the quality of materials to maintain is expressed a number of failures that ranges up to 2,000 annually.
Consumption of electricity for water supply systems of the Municipality of Niksic for the period 2011 - 2013. are shown in Table 12.3, and graphically in Picture 3.14. Pumping station Duklo is conn ected to the 35 kV and borehole pumping station Poklonci is situated at 10kV high voltage network.
Facilities for water supply (wells, pumping stations and reservoirs)
2011 4.961.347
2012 4.872.266
2013 4.580.405
Table 3.9 Consumption of electricity for water supply systems of the Municipality of Niksic for the period 2011 - 2013. ( kWh)

LOCAL ENERGY PLAN
In addition to the above amount, PE Water and Sewerage Niksic uses a certain amount of electricity and fuels for the administration building and official vehicles. Data on the consumption are listed in Table 3.10.
Energy source 2011 2012 2013
Elektricity (MWh) 124 122 122
Fuel (t) 72 71 63
Table 3.10 Consumption of elekricity and fuel PE Water and Sewerage
The activity of disposing of waste is in public ownership Niksic. This company maintains cleanliness of public areas of the Municipality, within which the works are performed collecting, storing and disposal of municipal waste, natural and artificial waste, cleaning streets, pavements, squares and other public areas..
Number of households which are using garbage collection services is 15,803, while the total number of enterprises, institutions and institutions that uses garbage collection service is 1074. Location of waste disposal is a temporary dump Mislov do, which is 6 km from Niksic.
For the activities mentioned above PUC has specialized fleet. First of all they are 4 skip garbage container 5 m3 and 8 trucks for emptying containers of 1.1 m3 and 4 tractors with shore for winter maintenance of roads and some smaller vehicles. Fuel used by vehicles of the utility is diesel fuel and its consumption in the period 2011 to 2013 is given in Table 3.11.
Fuel 2011 2012 2013
Diesel fuel 240 150 117
Table 3.11 Consumption of fuel for PE in a period 2011.-2013.
In addition to the consumption of fuels u PUC Niksic uses and electricity to the administrative building. Annual consumption for the completed facilities in the last three years are shown in Table 3.12.
Year 2011 2012 2013
MWh 244,44 223,33 240
Table 3.12 Consumption of electricity for administrative building PUC Niksic

LOCAL ENERGY PLAN
3.2.2.2 Sector D: Supply of electricity
Sector D includes the production and supply of electricity, gas, steam and hot water system using a network of pipelines, trunk pipelines and mains power cables. Due to the lack of network systems for the supply of gas, steam and hot water, in this brief review will be mentioned only energy requirements for activity drives Electricity Distribution in Niksic.
In addition to electricity for the needs of the business object, the Electricity Niksic uses fuel for off-road vehicles for the construction and maintenance of wide spread network voltages from 0.4 to 35 kV. Data on electricity consumption for buildings Electric Power Niksic are given in Tables 3.13 and 3.14.
Year 2011 2012 2013
MWh 184 181 183
Table 3.13 Electricity consumption for buildings Electric Power Niksic
Year 2011 2012 2013
MWh 1 304 1 274 1 248
Table 3.14 Electricity consumption for buildings Electric Power Niksic
Local government has established a register of public lighting in Niksic. We have data that public lighting in the municipality makes 12,572 columns with the same number of lamps.
Total electricity consumption for 2012. amounted to 4,512 MWh. The monthly consumption is given in Table 3.15 and Picture 3.10.
Year 2012
January 474
February 202
Mart 259
April 318
May 284
June 248
July 394
August 351
September 422
October 493

LOCAL ENERGY PLAN
Year 2012
November 542
December 519
Table 3.15. Consumption of electicity for public lightening for 2012. (MWh)
Picture 3.10 Consumption of electicity for public lightening for 2012. (monthly consumption)
3.2.2.3 Sector P: Education
This sector includes education at all levels from pre-school to higher education and all professions.
Preschools (14 educational units) have a total inner surface of 3828 m2 facilities
Electricity consumption preschools is shown in Table 3.16.
Fuel oil consumption for heating the building of an educational unit "Radost" is shown in Table 3.17.
Year 2011 2102 2013
MWh 505 441 469
Table 3.16 Electricity consumption of preschools
Januar
Februar
MartApril Maj
Jun Jul
Avgust
Septembar
Oktobar
Novembar
Decembar
0
100
200
300
400
500
600
474
202
259
318284
248
394351
422
493542
519
2012. year
MW
h

LOCAL ENERGY PLAN
Year 2011 2012 2013
Quantity (l) 20.000 13.000 11.400
Table 3.17 Fuel oil consumption of an educational unit "Radost"
In the municipality of Niksic works a total of 25 elementary schools, half of which is in the metropolitan area. The total area of buildings in city schools is approximately 31,000 m2.
Elementary schools use electricity, fuel oil and wood for heating buildings. A number of rural schools consumes a negligible amount of energy for heating.
The total power consumption is as in Table 3.18.
Year 2011 2012 2013
MWh 561 489 503
Table 3.18 Electicity consumption of elementary schools
Fuel oil consumption of urban elementary schools in the municipality of Niksic in the period from 2011. to 2013. is presented in Table 3.19.
2011 2012 2013
Quantity (t) 227 213 190
Table 3.19 Fuel oil consumption of urban elementary schools in the period from 2011. to 2013.
It may be noted that in 2013 there was a reduction in the consumption of fuel oil compared to the previous two years, in comparison to 2011 y. for20%.
In Niksic work four high schools, Gymnasium School of Electrical, Mechanical School and Economic catering school. The total area of school buildings is approximately 20 805 m2 including: Gymnasium 7 200 m2, Central Economic catering school 5 228 m2, Central Electro Technical College 3 458 m2 and Mechanical School 4 619 m2. For heating builings of 3 secondary schools use fuel oil with an average consumption for 2013. is 58 000 l. Gimnasium for heating of it's building uses LPG with an average consumption of 50, 000 l per year. The electricity consumption of secondary schools (excluding Central Mechanical School, for which there are no data) is shown in Table 3.20.
Year 2011 2012 2013
MWh 195 176 171

LOCAL ENERGY PLAN
Year 2011 2012 2013
Table 3.20 Electricity consumption of secondary schools
As far as higher education institutions in Niksic exist 2 faculties, namely: Faculty of Arts and Faculty of Sport and Physical Education, which is located within the economically catering school. We do not have any data on electricity consumption of Faculty of Philosophy, while data on the consumption of fuel oil for heating presented in Table 3.21.
Year 2011 2012 2013
Quantity 91 000 l 130 000 l 150 000 l
Table 3.21. Consumption of fuel oil for Faculty of Philosophy and student dormitory
3.2.2.4 Sector Q: Health and social care
This sector includes activities in the field of health and social work, starting from health care provided by trained medical professionals in hospitals and healthcare institutions, to care and health care in institutions for permanent accommodation (residential care) and social work activities without the participation of health professionals.
In the municipality of Niksic health system is organized on the primary (PHI Health Niksic) and the secondary level (General hospital Niksic). In Niksic there is a Unit for emergency medical assistance and PHI '' Dr Jovan Bulajić 'Brezovik for lung disease.
PHI SB for Lung Diseases 'Dr Jovan Bulajić' Brezovik was officially established in 1951. Other facilities are gradually built after World War II until 1951, when it declared as the central and the only specialized institution in Montenegro, this type.
The hospital consists of a complex of VI organizational units and has 140 beds.
Health Centre Nikšić has a total area of 5 600 sq. It is composed of active and two regional units Kličevo and parishes serving the suburbs.
Health Center is a significant consumer of electricity and its consumption is presented in Table 3.22.
Year 2011 2012 2013
MWh 803 865 992

LOCAL ENERGY PLAN
Table 3.22. Electricity consumption of PHI Health Nikšić
Picture 3.11 Graphic display of electricity consumption of the Health center Niksic from 2011 - 2013. year
Picture 3.12 Graphic display of electricity consumption of the General Hospital from 2011 -2013. year
The general hospital is significantly larger consumer of electricity from the health center. The total area of hospital facilities that provide services is 10 354 m². Electricity consumption for the last 3 years is shown in Table 3.23.
2011 2012 20130
500
1000
1500
2000
2500
1636
1892
2187
General Hospital
MW
h
2011 2012 20130
200
400
600
800
1000
1200
803865
992
Health centerM
Wh

LOCAL ENERGY PLAN
Year 2011 2012 2013
MWh 1 636 1 892 2 187
Table 3.23 Electricity consumption of General hospital Niksic
The total power consumption of General Hospital and Health Centre is shown in Table 3.23 and the chart in Picture 3.23.
Table 3.23 The total power consumption of General Hospital and Health Centre
Object 2011(MWh)
2012 (MWh)
2013 (MWh)
PHI Health 803 865 992
General Hospital 1636 1892 2187
Total 2439 2757 3179
Picture 3.13 Graphic display of electricity for Health and General Hospital
Buildings of Health Centre and General Hospital for heating use fuel oil. Fuel oil consumption for Health is around 120,000 liters per year, while the consumption for General Hospital is shown in Table 3.24.
Year 2011 2012 2013
Quantity (l) 206. 482 192.702 165.000
Table 3.24. Fuel oil con sumption for General Hospital
2011 2012 20130
500
1000
1500
2000
2500
3000
3500
803 865992
1636
1892
2187
2439
2757
3179
Dom zdravlja Opšta bolnica Ukupno
MW
h

LOCAL ENERGY PLAN
PHI SH for Lung Diseases 'Dr Jovan Bulajić' Brezovik is also a significant consumer of electricity. Consumption of these health institutions is shown in Table 3.25.
Year 2011 2012 2013
MWh 1687 1754 1643
Table 3.25 Elecrticity consumption PHI SH “ Jovan Bulajić”
For the purposes of this Special Hospital heating fuel oil is used, and the amount spent in the period from 2011 to 2013. is presented in Table 3.26
Year 2011 2012 2013
Quantity (l) 107.500 105.217 92.905
Table 3.26 Fuel oil consumption PHI SH “Jovan Bulajić”
When it comes to social protection, in the municipality of Niksic there is a center for social work PJ Red Cross. At this point there are no data about the surface and the energy consumption of the building of the Red Cross. The building of the Red Cross is relatively small consumer of electricity.
There are no data available on electricity consumption for Health and the Center for Social Work, we only have information on the cost of electricity. It is made assumption about the price of EUR 0.1 kWh to roughly had information on electricity consumption. So adopting the aforementioned assumption on the price of kWh leads to the consumption of electricity by the Centre for Social Work presented in Table 3.27.
Year 2011 2012 2013
kWh 46922 31388 40633
Table 3.27 Electricity consumption of Centre for social work
Center for Social Work uses fuel oil as an energy source for heating. Fuel oil consumption in the period from 2011 to 2013. is presented in Table 3.28.
Year 2011 2012 2013
Quantity (l) 3923 6891 6552
Table 3.28 Fuel oil consumption of Centre for social work

LOCAL ENERGY PLAN
3.2.2.5 Sector R: Arts, entertainment and recreation
Overall, this sector includes activities that meet a variety of cultural, entertainment or recreational needs and interests, including the execution of events, museum work, maintenance of gambling, sports and recreational activities. When it comes to the Municipality of Nikšić, then in this sector special interest have the activity of the Cultural Center which is covering the Castle of King Nikola, museum and library, then PI
The total area of the Cultural Centre is 3 570 m². Electricity consumption for the period from 2011 to 2013 is presented in Table 3.29.
Year 2011 2012 2013
MWh 81 105 103
Table 3.29. Electricity consumption for Cultural Centre
Cultural Center for heating Administration building gets 2 per ton of fuel oil by the Founder, although the minimum energy required to 8 tons, which would be the cost of electricity in the administration building were greatly reduced.
From sports facilities with energy aspect of importance is the Sports Center Niksic, total covered area of 18 500 m², which consists of the following parts:
Great Hall
Hall B (temporarily pool hall)
Connection block (planned construction of a bowling alley with 6 lanes and the pub-total area of approximately 1 200 m²)
Tennis courts
Football field
Tables 3.30. and 3.31. provides an overview of the consumption of electricity and energy for heating
Year 2011 2012 2013
MWh 860 797 718
Table 3.30. Electricity consumption for Sports center Niksic
Year 2011 2012 2013
Steam(t) 245.92 207,49 146.55

LOCAL ENERGY PLAN
Year 2011 2012 2013
Gas(kg) 1999 3001 2250
Table 3.31. Consumption of energies sources (steam and gas) for heating of Sports center Niksic
PU "Zahumlje" Niksic has an area of 779 m² in the following table presents the electricity consumption for the last 3 years.
Year 2011 2012 2013
MWh 148 158 140
Table 3.32. Electricity consumption PU “ Zahumlje”
3.2.2.6 Sector O: State and local government
Overall, this sector includes the activities of public administration performing the state administration.
More specifically, includes the adoption of laws and judicial interpretation of laws and related regulations, as well as the implementation of programs that are based on these laws and regulations, legislative power, taxation, national defense, public order and safety, immigration services, foreign affairs and performance of state administration. This sector also includes compulsory social insurance.
Local government carries out activities in a building that was built in 1962 and whose area is 5 550.68 m², while the total heated area is 3 662 m².
Heating of the building is provided from own boiler, with the involvement of 43 tons of fuel oil per year.
Electricity consumption of administrative building of the Municipality for the last 3 years is presented in Table 3.33.
Year 2011 2012 2013
MWh 284 293 288
Table 3.33. Electricity consumption of administrative building of the Municipality
For the purposes of the local and state authorities who are in the municipality of Niksic is used several buildings, some of which are important for energy consumption: MUP

LOCAL ENERGY PLAN
building, the building of the Municipal Court premises PIO Fund and Labour Bureau Niksic.
The building of the Basic Court in Niksic was built in 1959 and occupies an area of 1 653 m². The facility uses two boilers, one 243 KW power, and the other 42 KW Zgrada
Electricity consumption for the last 3 years is presented in Table 3.34.
Year 2011 2012 2013
MWh 195 196 205
Table 3.34. Electricity consumption of the Municipal court
Picture 3.14 Graphic display of electricity consumption Basic Court (Month View)
In Picture 3.14 apparent seasonal variations in power consumption. As can be seen electricity in a significant increase in the period of the heating season.
MUP building Niksic was built in 1959 and a total area of 2050 m². For heating the building used oil and its consumption is presented in Table 3.35.
Year 2011 2012 2013
Quantity (t) 32 35 30
Januar
Februarmart April Maj Jun Jul
Avgust
SeptembarOkto
bar
Novembar
Decembar0
5000
10000
15000
20000
25000
30000
35000
Chart Title
2013. year
kWh

LOCAL ENERGY PLAN
Table 3.35. Consumption of fuel oil for MUP building Niksic
Year 2012 2013
MWh 141 187
Table 3.36. Electricity consumption of MUP building Nikšić
3.2.2.7 Sector J: Information and communication
This sector includes the production and distribution of information and cultural products, and provides the means to transmit or distribute these products, as well as data or communications.
In the context of energy needs here especially important is telecommunication center (Mail) Niksic, which has all the facilities in the municipality of Niksic: Velimlje (building area of 40 m²), Vracenovici (building area of 73 m²), Caradje-Krstac (building area of 77 m²), Ducice (building area 122 m²), Vilusi (45 m² surface facilities), Grahovo (size 38 m²), Rastovac (59m²), Klicevo (61m²) and 3 Mails in the narrow part of the total area of 1166 m².
The average consumption of electricity per annum is 306 MWh.
For the purpose of heating the working premises of common objects "Montenegro Telekom AD" and the Post Office is used oil in an amount of 16 000 m³ per year.
Mail Centre Niksic has four official vehicles on average annually spend 11348.28 liters of motor fuel.
In this sector is significant and consumption RTV Niksic that their activities are performed in two buildings, namely: building area of 330 m² radio and television building area of 450 m². Power consumption is shown in Table 3.37.
Year 2011 2012 2013
MWh 159 200 243
Table 3.37. Electricity consumption of RTV Niksic

LOCAL ENERGY PLAN
3.2.2.8 Sector S: Other service activities
This area includes all service activities not mentioned elsewhere: special services Bus stations, fire stations, Funeral and related activities.
Power consumption of the Protection and Rescue are shown in Table 3.38.
Year 2011 2012 2013
MWh 65 66 63
Table 3.38 Power consumption of the Protection and Rescue
Department of Protection and Rescue has a specific consumption of fuel for their vehicles whose quantities are unknown at this time
Bus station Niksic is a significant consumer of electricity in the service sector. Power consumption Bus Station Niksic is shown in Table 3.39.
Year 2011 2012 2013
MWh 109 130 146
Table 3.39 Power consumption Bus Station Niksic
For heating Bus Station Niksic uses oil. Fuel oil consumption in 2011 amounted to 7000 l, 2012 l 4113 until 2013, did not use oil as a fuel for heating, and 3:39 in the table may notice an increase in electricity consumption in 2013.
For funeral service is used electrical energy in a relatively small amount of around 20 MWh.
3.2.2.9 Sector G: Wholesale and retail
This sector includes trade in all commodities wholesale and retail trade (sale without transformation) and services in the sale of goods. Sector is associated and repair of motor vehicles and motorcycles.
According to the data from Picture 1.6 and 1.7 this sector employs 14.45% of the total employed in the territory of the Municipality, and accounts for 26.6% of the revenue of the company. It was registered. 1345 business units for trade services until 2012.
Energy needs in this sector (lighting, refrigeration for food storage and space heating) is mostly meet electricity and for transport of goods are used motor fuels.

LOCAL ENERGY PLAN
The largest consumers of electricity in the wholesale and retail in the municipality of Niksic are: Tempo, Roda markets (21 Purchase), Okov and Neck.
Consumption of electricity (MWh) previously mentioned major consumer of electricity in the sector of wholesale and retail is shown in Picture 3.15.
Picture 3.15 Electricity consumption for Roda markets, Tempo, Okov i Neckom
3.2.2.10 Sector I: Accommodation and food services
The sector includes the provision of services short-stay accommodation (hotels, motels, etc.). Visitors and other travelers. Includes accommodation provision for a longer period for students, students, workers and others. Some of the accommodation can offer accommodation only, while others offer a combination of accommodation, food (restaurants) and / or recreational services.
In the municipality of Niksic there are 7 Hotels, Resorts' hut '', 15 restaurants, 10 fast food establishments and 220 coffee bars. For energy needs use electricity, fuels, wood, and hotels are used for heating oil, natural gas and peeled.
Roda marketi Tempo Okov Neckom0
500
1000
1500
2000
2500
3000
2011 2012 2013
MW
h

LOCAL ENERGY PLAN
Total accommodation capacity of hotels in the municipality of Niksic is about 220 beds without Hotels ‘’Onogošt '' which is from 2012 in bankruptcy and which has 256 beds.
Table 3.40 and Picture 3.16 shows the annual balance of electricity consumption in the period 2011. to 2013. The objects of the hotel '' Vucje '', '' Marshal '', '' Sindčel '', '' Trebjesa 'tourist village 'Koliba '.
MWh 2011 2012 2013
Vucje 110 32 64
Trebjesa 254 260 258
Marshal 14 15 11
Koliba 92 95 93
Sindcel 90 91 89
Table 3.40 P Electricity consumption of hotels in Nikšić
Picture 3.16 Electricity consumption of hotels in Nikšić
Vučje Trebjesa Marshal Koliba Sindčel0
50
100
150
200
250
300
2011 2012 2013
MW
h

LOCAL ENERGY PLAN
This review should add PU students dormitory “Braća Vucinic” area of 1 198 m2. Power consumption of the Public Institution for the period from 2011 to 2013. is presented in Table 3.41.
Year 2011 2012 2013
MWh 566 520 556
Table 3.41 Power consumption of the Public Institution student dormitory ''Braća Vučinić''
3.2.2.11 Sector K: Financial and insurance activities
This sector includes financial services, including insurance, reinsurance, pension funds and support activities in the performance of financial services.
In the municipality of Niksic exist a large number of banks, of which only domestic is First Bank of Montenegro.
In addition to this bank in Niksic there are a number of branches of other banks: Erste Bank, Montenegrin Commercial Bank, Hypo Alpe Adria Bank, Commercial Bank AD Budva, Montenegro Societe Generale, NLB Montenegro Bank, Atlas Bank and Mortgage Bank AD.
In the area of the Municipality of Nikšić there are three of insurance company '' Lovćen '', '' Sava '' - Insurance and 'Uniqa' '.
Information on electricity consumption in the period 2011 to 2013. year for CKB, First Bank of Montenegro and Erste Bank are shown in Picture 3.17 in Table 3.42.
Table 3.42 Electricity consumption of financial institucions

LOCAL ENERGY PLAN
2011 2012 2013
CKB 47080 46830 60940
ERSTE 35220 37508 36330
FIRST BANK OF MONTENGRO 26868 21492 22404
Picture 3.17 Electricity consumption for CKB, Erste banku i First bank CG
3.2.3. Existing energy consumption in industry
Industry is an activity in with production of various products and processing of raw mineral, vegetable, animal or artificial origin. According to the Classification of activities here include B sectors (mining and quarrying) and C (manufacturing industry)
Activities ore (bauxite red) are currently negligible because the '' Bauxite mine 'Niksic in bankruptcy since 2013 and was declared bankrupt 02/26/2014. year, but not analyzed and the energy consumption of the Sector B.
3.2.3.1 Sector C: Manufacturing
Manufacturing is defined as the mechanical or chemical processing of raw materials and assembly of parts or components in order to develop new products, regardless of whether the work is performed on the machine or by hand, in the factory, in the house of a person or to any other place .
2011 2012 20130
10000
20000
30000
40000
50000
60000
70000
CKB Erste Prva banka Crne Gore
kWh

LOCAL ENERGY PLAN
Since a large number of industrial enterprises in the late 90s of the last century, now works DOO Pivara Trebjesa, Zeljezara , Nikšićki Mill AD, IM '' Goranović '', bakeries and dairies.
Tosyali Group aims to increase its product portfolio by taking "Ironworks" Niksic. "Ironworks" Niksic will increase its capacity and actual production versatility as having Tosyali Group.
.
"Ironworks" Niksic is one of the largest consumers of electricity in the municipality of Niksic. Electricity consumption for 'Ironworks Niksic' 'in the period 2011 to 2013. is presented in Table 3.43.
Year 2011 2012 2013
GWh 85 47 86
Table 3.43 Electricity consumption for 'Ironworks Niksic'
The first brewery "Onogošt" was founded in 1896. Thanks to generations of brewers and beer, whose quality and name long ago crossed the borders of the former and present state, Nikšićko Beer has become the most recognizable - Montenegrin brand. In 2012.year Canadian-American company Molson Coors Brewing Company becomes a wholly owned Trebjesa which is transformed from a shareholding in a company with limited liability.
Electricity consumption in the period from 2011. to 2013. is presented in Table 3.44.
Year 2011 2012 2013
MWh 4800 5169 4986
Table 3.44 Electricity consumption dor brewery “Trebjesa”
Since the LTD '' Trebjesa 'uses steam for heating the working area, does not have a gauge for steam consumption, therefore no data on the consumption of energy for heating.
D.O.O. Trebjesa has 60 official vehicles (25 passenger, 27 vans, trucks 5 and 3 vans).
Annual average fuel consumption is 140 000 liters.
In the municipality of Niksic in the baking industry were the most common bakers 'Trend'.
Electricity consumption for bakers 'Trend' with a total area of 1050 m2 is shown in table 3.45.
Year 2011 2012 2013
MWh 400 450 440

LOCAL ENERGY PLAN
Table 3.45 Electricity consumption for bakers 'Trend'
Company Šljukić Co. LTD Dairy "Srna" was established in 1999, a factory was built in 2003. The company owns a facility for milk processing area of about 850 m2, stockroom area of about 250m2, and the land around the factory area of 4000m2.
Consumption of electricity and fuel oil for processing plant milk '' Srna '' is shown in Table 3.46.
Year 2011 2012 2013
kWh 18824 14721 16247
Fuel oil (l) 84400 97388 109000
Table 3.46 Consumption of electricity and fuel oil for processing plant milk '' Srna ''
Nikšic mlin AD was founded in 1951 with headquarters in Niksic. Deals with acquisition, production, processing and trade of grains as well as products from them. Since 2008, the majority owner of the company is Agroglobe from Novi Sad. Year 2014 is the year of the last reconstruction Niksic mlin. The total area is 12,035 m2.
Electricity consumption for AD '' Nikšićki Mill '' is shown in Table 3.47. For space heating is also used electricity.
Year 2011 2012 2013
MWh 2934 4458 3329
Table 3.47 Electricity consumption for AD Nikšić Mlin
Meat Industry Goranović privately owned family Goranovic, which deals with this type of activity since1986 y. The main activity performed by the meat industry Goranovic is the production of finished meat products.
With daily production capacity of 40 000 kg of dried meat products and meat Meat Industry Goranović is leading economic entity in the production of finished meat products in Montenegro.

LOCAL ENERGY PLAN
Picture 3.18 Electricity consumption for factory and slaughterouse
The surfaces of buildings owned by the IM Goranović: 4,570 m2 - factory and 5,042 m2 - slaughterhouses.
Consumption of electricity for the plant and a slaughterhouse in the period from 2011. to 2013. is shown in table 3.48.
IM Goranovic uses fuel oil as an energy source for heating. Consumption of fuel oil (t) in the period from 2011. to 2013. is shown in the table is 3.49.
Year 2011 2012 2013
Fuel oil (t) 73,860 58,280 59,680
Table 3.49 Consumption of fuel oil for IM Goranovic
2011 2012 20130
500
1000
1500
2000
2500
3000
3500
4000
4500
5000
4200 4289 4174
101 167 187
IM Goranovic
IM fabrika IM klanica
MW
h

LOCAL ENERGY PLAN
4. Analysis of emissions
The inventory of greenhouse gas emissions (GGE) presented in this chapter refers to the final energy consumption. Based on the balance of energy consumption for the base year 2011, which is analyzed in detail in the previous chapter, and defined emission factors (Table 4.1) for a particular type and manner of use of fuels (IPCC), was calculated level of emissions expressed in CO2 equivalent (Table 4.2) a graphical representation is given in Picture 4.1.
Source of energy Pollutant Factor Unit Source
Electricity CO2eq 0,571 tCO2/MWh EPCG
Fuel oil CO2eq 69,3 tCO2/TJ IPCC 2006
Petrol CO2eq 3,18 kg CO2/kg petrol
Diesel CO2eq 3,14 kg CO2/kg petrol
Petrol SO2 40 ppm
Diesel SO2 8 ppm
Petrol CO 132 gr/kg petrol http://www.sepa.gov.rs/dowload/COPERT.pdf
Diesel CO 4,7 gr/kg petrol
Petrol NOx 14,5 gr/kg petrol
Diesel NOx 11 gr/kg petrol
Petrol NMVOC 14 gr/kg petrol
Diesel NMVOC 1,1 gr/kg petrol
Petrol PM2.5 0,037 gr/kg petrol
Diesel PM2.5 1,7 gr/kg petrol
Table 4.1 Emission factors for the energy balance of the municipality of Niksic
Total emissions GGE are estimated at approximately 188.4 Gg CO2 eq, which is approximately 5.7% of total emissions GGE Montenegro (First National Communication to the UNFCCC Montenegro). It can be seen from Tables 4.2 and 4.1 to the Great dominant share in total emissions GGE has the power consumption. That part is calculated based on the emission factor for electricity (Table 4.1), and is directly determined by the type of plants that are used for the production of electricity in Montenegro. As in the production of electricity in Montenegro a dominant share has TE Pljevlja, it has its impact on the emission factor mentioned most. With the changing structure of production (construction of new renewable energy sources), there will be a change in the emission factor, and thus the share of electricity consumption in total emissions GGE in Niksic. Therefore, the results presented in Table 4.2 and Picture 4.1 concerning electricity consumption should be taken only as a potential to reduce
LOCAL ENERGY PLAN
emissions GGE. Reducing emissions GGE caused by power consumption is achieved by improving energy efficiency in the dominant consumers of electricity and construction of renewable energy sources.
After consumption of electricity, the most important part of the emissions GGE has a consumption of fuels (37.2%). Given that almost the entire consumption of fuels belongs to the transport sector when the final energy consumption is concerned, it is clear that the reductions achieved GGE together with measures to improve energy efficiency in this sector.
Oil has the lowest impact on emissions which was expected taking into account his small volume of use in comparison to other energy sources. However, in order to reduce emission levels is recommended its substitution with some less intense source of emissions GGE.
Year Fuel oil Petrol Coal Diesel Electricity Total
2011 3060 15 753 5045 54 356 110 203 188 417
Table 4.2 Total greenhouse gas emissions due to energy consumption, expressed in [tCO2eq]
Picture 4.1 Structure of greenhouse gas emissions due to energy source
In addition to greenhouse gas emissions and energy consumption causes emissions of other pollutants that are not included in greenhouse gases: sulfur dioxide (SO2), carbon monoxide (CO), nitrogen oxides (NOx), non-methane organic compounds (NMVOC) and particulate matter (PM2. 5, where the 2.5 is mark for particle size in microns). Assessment of their emissions data in Table 4.3.
Fuel oil1.6% Petrol
8.4%
Diesel28.8%
Coal2.7%
El. En-ergy
58.5%

LOCAL ENERGY PLAN
Type of fuel SO2 CO NOx NMVOC PM2.5
[t] [t] [t] [t] [t]
Petrol - 654,928 71,833 69,356 O,183
Diesel - 81,363 190,421 19,042 29,428
Table 4.3 Pollutant emissions due to energy consumption
All the more stringent EU regulations regarding the protection of the environment, and thus the emission of pollutants in air, water and the environment, determines the need for constant monitoring of energy consumption because the energy sector is recognized as the largest source of negative impacts on the environment.

LOCAL ENERGY PLAN
5. A rough estimate of the planned energy consumption
With regard to the period of 10 years for that brings local energy plan, it will be performed a rough estimate of the balance of power consumption for 2018. and 2025. The starting points are the following external and internal (local) determinants of this plan.
Both globally and locally, the main drivers of energy demand are population growth, economic and technological development and energy prices.
The population density is 36.45 inhabitants / km2, which puts the Municipality of Niksic into the group of municipalities with medium density. The population density is 1.23 times less than the density at the level of Montenegro, which is 44.8 inhabitants / km2.
In the period 1991-2003. the number of inhabitants in the municipality of Niksic increased by 1 404, while in the next census period declined by 2 458 inhabitants. Population trends, apropos the growth and decline of the population in some parts of the municipality is provided in Subchapter 1.4.
Niksic economic realities of the past year was marked by the privatization of the largest collective, some of which were implemented successfully and some not. All countries in transition are faced with the initial constraints for development of entrepreneurship and small and medium-sized enterprises, such as the low level of business knowledge (especially in the field of management), regulatory and administrative barriers, limited access to available sources of funding, inadequate access to sources of business and market information and restrictions on the availability of specialized business services.
According to the relevant estimates, the trend of energy consumption is in parallel with GDP growth will continue in the foreseeable future. In the period from 1980 to 2008 at the global level for every 1 percent increase in GDP growing demand for energy in the percentage of 0.59%. Here for the prognosis is not possible to apply a similar correlation because since 2004. in statistical yearbooks Montenegro does not show the GDP at the municipal level.
As far as energy prices, current trends can not be transposed to the future period, because the basic assumption is that Montenegro in the process of accession to the EU to fully liberalize its energy market and become part of a single EU electricity market. Here are a number of reasons to expect further growth in the price of energy, especially electricity.
With plans document of development of Municipality Nikšić from 2014 y. Are defined strategic questions connected with : economic development, environment infrastructure and social activities. Using available resources to drive economic development were identified following objectives:
1. Modernization and expansion of existing facilities through privatization and recapitalization;

LOCAL ENERGY PLAN
2. Development of small and medium-sized enterprises, which requires investigation works for the exploitation of mineral resources and construction of small hydropower plants;
3. The development of ecotourism through the mountain and health-recreation tourism;
4. Development of agriculture based on individual sector;
The development of local areas through the dispersion of economic capacity.
Construction of the road Risan - Niksic - Zabljak, which passes through the municipal area, in addition to the direct impact on the development of settlements located along the way, will have a positive indirect impact on economic valuation, primarily the development of transit tourism (better access, convergence and connecting North, Central and South region, etc.).
The development of agriculture, animal husbandry, agriculture, industry and tourism conditional increase in the consumption of fuel, so the average annual growth rate of fuel to be 1.2%.
Also, due to the intensification of industry, commerce and the increased volume and quality of tourism and other services, while reducing network losses to 5-7% and applying other energy efficiency measures, it is reasonable to assume an annual growth rate of electricity as well as at the national level of 1.3 %.
The other two power sources - firewood and fuel oil should be at the expense of the necessary activation of the significant energy efficiency potential in the field of heating in all sectors, remain at the current level, with what is expected to be firewood in one of the more effective substitute fuels such as wood the chips, pellets and briquettes.
Jedinice Godina Energent
Coal Oil fuel Fuel oil Propellants Electricity Firewood
x1000 t x1000 t x1000 t x1000 t GWh x1000 m3
Natural 2011 4,760 - 1,118 21,200 193 101,843
2018 4,760 - 1,118 22,981 210,56 101,843
2025 4,760 - 1,118 24,356 221,09 101,843
Equival. (TJ)
2011 49,71 - 44,17 904,18 694,80 962,53
2018 49,71 - 47,88 1020,13 758,02 962,53
2025 49,71 - 50,75 1105,82 807,29 962,53
Table 5.1 Projections of the balance of energy consumption

LOCAL ENERGY PLAN
Lož ulje Pog. goriva Ugalj El. energija Ogr. drvo0
200
400
600
800
1000
1200
201120182025
Picture 5.1 Energy balances of the energy consumption for 2011, 2018. and 2025.
Based on the results forecasts, final consumption to 2018 g. TJ would be 2838.18 and 2025. 2976 TJ. The average annual growth rate of final energy consumption by 2025. for the Municipality of Niksic would amounted to 0.93%.

LOCAL ENERGY PLAN
6. Analysis of the energy potential of the Municipality of Niksic
This chapter provides an analysis of the possibilities of increasing the use of renewable energy sources in order to obtain electricity, as well as the application of EE measures in the municipality of Niksic with emphasis on the state's energy system.
6.1 Analysis of the potential for energy productionIn the municipality of Niksic is located HEP Perucica which is not far from the Glava Zete, and she uses waters of the Niksic field. Niksic field catchment area covers an area of 850 km2 in the topographical sense, while the catchment area is 1170 km2. With built-in dual turbines with total installed capacity of 307 MW. Perućica’s facility is in use over 45 years and individual equipment, plant and facilities are at the end of its life. A significant portion of these elements (some of which have a protective function, or are necessary for the safe operation of the plant) is not in use, with the inability to repair, upgrade or replacement. The power plant has seven aggregates with total installed capacity of 307 MW, but due to the inadequate response of turbine regulators can currently work only with 285 MW. Therefore, in 1984 the "Program of modernization and training Perućica" is adopted, which, however, until today has not experienced the full implementation due to various problems of the planned schedule. In addition, at HPP Perućica there is also talk about installation of the unit in the eighth power, strength of 58.5 MW, which would increase the expected production of hydroelectric power. According to the analysis of Energoprojekt this increase would be 13.2 GWh / year, according to the analysis of EPCG 31.8 GWh / year.
The territory of the municipality of Niksic is supplied with electricity from the transmission system of 110 kV transmission line Trebinje-Vilusi- Niksic, Perućica - Niksic 3, three transmission lines and substations TS 110/35 kV Vilusi and TS110 / 35 Niksic - Steel Plant. Installed capacity of transformers in the TS 110 / 35kV Vilusi 10mV and in TS110 / 35 Niksic 93MVA for the distribution and 126MVA and distribution for the Niksic steel plant.
Planned construction of 400 kV transmission line Tivat - Brezna - Podgorica, and 400/110 Brezna would lead to another reliable connection of the Municipality of Niksic 110kV transmission line Brezna - Niksic. This substation is necessary to Wind Farms in Krnovo linked to the transmission system. The construction of 110kV transmission line Brezna – Krnovo is planned.
City Niksic is currently fed with three substations 35 / 10kV (Bistrica, Trebjesa and Kličevo). New transformer station Bistrica was built next to the old, with the capacity of 20MVA and TS Trebjesa was completely rebuilt and the capacity is 20,5MVA.
TS Kličevo currently has a capacity of 25MVA and during the work phase I are works on the transition to the voltage level of the capacity 40MVA 110/10. With planned

LOCAL ENERGY PLAN
construction of phase II (building a new plant 10kV) this part of the city's energy is satisfied.
The planned development of the 35kV network provides the transition of 10kV switchgear Duklo in 35/10 Duklo thus significantly improved the supply of this part of the city.
Implementation of these plans Niksic Municipality would have a good supply of electricity at 35kV level.
Implementation of these plans would create the possibility of joining with eventual production capacity of electricity generation from biomass and communal waste.
On the other hand, in the municipality of Niksic currently has no district heating system, however, exact center of the Municipality of Niksic could be related to a smaller district heating system using local energy sources such as fuel wood or wood chips or communal waste.
6.2 Analysis of the possibility of using energy efficiency measuresAnalysis of the possibilities of EE measures application in final energy demand sectors: households, services, industry and traffic are provided in this chapter. However, before the sectoral analysis are discussed possibilities of energy savings in buildings that are common to the household sector, industry and services.
Due to the high energy consumption in buildings EE is a priority of today's architecture and energetics. The greatest potential of energy and environmental savings is in the field of heating and cooling of residential and non-residential buildings. A number of international regulations as well as local strategies and action plans for EE, pointing to the urgent need to implement technical standards and exploitation measures for reducing energy consumption in buildings, even to the level of so-called. zero energy consumption. Using EU measures and EU standards in the design phase and construction, including energy certification of buildings contributes not only to a more comfortable stay in the building, but its longer life and environmental protection.
6.2.1. Households
The characteristics of the buildings, energy systems, or devices for heating and cooling of the building, climatic conditions and user habits influence on energy consumption in the building. Lack of natural gas and low, subsidized electricity prices in the past have resulted in excessive direct use of electricity for space heating and water heating for domestic use. Regardless of the social and economic vulnerability of the sector, rising energy prices already affect their rational consumption and substitution with cheaper and more available energy. Doing so there is no only consider the energy that is wasted in residential and other working facilities, but also the energetic quality of the devices

LOCAL ENERGY PLAN
used in buildings (cookers, refrigerators, water heaters, washing machines and dishwashers, etc.) and their rational use.
The largest part of the object is built of brick and concrete, thermal protection in the majority of residential buildings in the municipality was not performed during the construction phase and not in use of the facility. Thermal insulation of buildings is one of the great potential for energy savings. Insufficient thermal insulation leads to the increased heat loss in winter, cold peripheral structures, damages caused by condensation (moisture) and overheating of the space during the summer. As a consequence there is a structural damage, and a uncomfortable and unhealthy living and work, increasing the cost of maintenance and use of space and greater environmental pollution. Extremely important parameter is the period in which the building was constructed. Thus, due to the construction method and the lack of non-compliance on heat protection, in the period of the largest residential construction from 1950 to 1980, built a series of residential and non-residential buildings with average energy consumption for heating of over 200 kWh / m2.
On the territory of the Municipality of Podgorica through the list of 2011 there are 26 894 apartments where space heating is via storage heaters, stoves and own central heating system (9% is equipped with this system). These are mainly old buildings that are not insulated, so it is necessary to consider the possibility of their reconstruction in the direction of increasing thermal protection and heating systems all with the aim of energy savings, which is in the building sector is significant.
Average old buildings annually consume 200-300 kWh / m2 of energy for heating, standard insulated buildings under 100, modern low-energy buildings below 40, and passive and buildings "almost zero power" 15 kWh / m2 or less. This means that energy consumed in standard isolated house today may heat 3 to 4 low energy, or 8 to 10 passive houses. Considering that about 40% of the energy is consumed in buildings, the EU introduced regulations to ensure the reduction of consumption. The key document is the Directive on the Energy Performance of Buildings Directive 2002/91 / EC for new buildings and for existing buildings whose renovation is in progress. Directive 010/31 / EU EPBD was adopted in May 2010. which enhance the energy requirements whereby all EU countries should improve its regulations in Directive 2002 for the construction of new facilities.
6.2.2. Service sector
The service sector includes on the one hand economic activities engaged in services, and on the other public activities, such as the work of local and national government, and educational and health institutions. Considering that according to their energy needs, and the responsibility for the implementation of measures vary considerably, in this subsection will be analyzed separately.
6.2.2.1 Public service sector
Significant potential for EE is in the public service sector in the Municipality, or buildings used for the needs of municipal and state agencies and local governments, as well as

LOCAL ENERGY PLAN
buildings used for the functioning of educational and health institutions.
EU Directives and national legislation specifically obliges local authorities to be a good example in demonstrating and application of EE measures. Thus, Article 7 of the Law on Energy Efficiency oblige local governments that for a period of three years, bring the EE improvement program which would, in addition to the dynamics and resources, include:
- plan adaptation and maintenance of buildings that use the local government bodies, public services and public companies founded by the local government to carry out their activities,
- plans for improving the system of communal services (public lighting, water supply, waste management and traffic),
- specific measures of EE in buildings that are protected as a monument.
Article 8 of the same law stipulates the obligation of local governments to deliver a program of the EE improvement to competent Ministry in order to assess its compliance with the Energy Efficiency Action Plan adopted by the Government for a period of three years.
In the municipality of Niksic in preschools, primary education institutions, institutions of secondary education and higher education institutions that are given in Section 3.2 are used as energy fuel oil in one institution TNG.
Electricity is used for lighting and appliances and in some preschools.
The EE potential in these facilities is based on reducing heat loss through exterior walls and windows and skylights as in the case where this has not been done by replacing boilers, repairs of the system.
The potential of energy efficiency in public services is mainly reflected in measures that will reduce energy consumption for heating of premises, the lighting as well as for the transportation. Therefore, it is clear that the greatest potential for energy efficiency is in improving the energy performance of buildings, as well as the systems used for heating of the area. In order to more closely define this potential it is necessary to do a database of consumers in public institutions, or an information system, as well as introduce energy management system which would be introduction to define the optimal measures to improve energy efficiency in this sub-sector.
6.2.2.2 Commercial services
Energy needs in trading companies are primarily related to the heating rooms in which the activity is carried out, for refrigeration cabinets, lighting and operation of electronic devices needed in the work of enterprises, as well as energy consumption for transportation of goods. Since it is a smaller enterprises, similar as for the households, the potential of energy efficiency is largest in the district heating and cooling rooms and in use of energy-efficient appliances, lighting as well as for energy purposes.
In the area of the Municipality of Nikšić are 7 hotel, resort 'Koliba', 15 restaurants, 10 fast food establishments and about 220 coffee bars. For energy needs they use electricity, fuels, wood but hotels for heating uses oil, gas and pellet.

LOCAL ENERGY PLAN
The hotel capacity in the Municipality of Niksic is about 220 beds without Hotel „ Onogošt'' which is from 2012 in bankruptcy and which has 256 beds.
The table 3:37 and on the picture 3:35 in Chapter 3.2. presents the annual balance of electricity consumption in the period 2011 to 2013. for objects of the hotel '' Vučje '', '' Marshal '', '' Sindčel '', '' Trebjesa 'and tourist complex' Koliba '.
However, as tourism, especially mountain tourism is the priority of the development of municipality, it is necessary to include guidelines for sustainable energy development, ie the use of thermal insulation materials, efficient heating systems and the potential use of renewable energy sources as one of the main criteria in the development of new catering facilities. This is significantly expressed and for the reason that in a mountainous area power system has been developed for needs of low-consumption by the local population.
It is necessary to define the regulations in the field of building with special emphasis on tourism facilities where will be defined the maximum energy consumption in new buildings, including tourist buildings. Also, it should define the use of renewable energy sources in accordance with current legislation in the European Union.
6.2.3. Industy
From the industrial capacity the Municipality of Nikšić today work LLC Trebjesa, Steel, Mill, IM '' Goranović '', Bakeries and Dairies.
However, for the calculation of energy efficiency potential in these industrial plants, it is necessary to carry out energy audits of facilities that will make energy consumption report on the basis of which will get more information on the processes, balance and efficiency in plants. Based on the general review of energy consumption and analysis of opportunities for energy savings and the definition of energy efficiency measures, we can work to introduce the energy management systems in industrial plant with defining the most efficient and effective measures that can be implemented in an industrial facility.
6.2.4. Traffic
The traffic in the municipality of Niksic is in the road and railway form. The dominant consumption is in passenger cars, because according to the review from 2013, of 20408 registered vehicles, the number of passenger vehicles is 17889. Therefore, the focus of energy efficiency measures should be focused on passenger vehicles. It is necessary to emphasize that measures to improve energy efficiency should be made at the national level, which would apply in the area of local government. It is necessary to organize the register of motor vehicles, which will give precise information about the characteristics of vehicles on Montenegrin roads and find a sustainable fiscal and other incentive measures in order to reduce the age of vehicles in Montenegro, which is 12.5 years. Also, it is necessary to define the tax system in a way to stimulate the sales of motor vehicles of less power, which results in lower consumption of fuel and reducing emissions of CO2 / km. Local authorities should consider the possibility of reducing the use of private vehicles for the local transport. It should affirm the use of alternative means of transport and walking, such as riding a bike in the summer months when tourist visit are largest.

LOCAL ENERGY PLAN
Besides, it must be created infrastructure by building bicycle paths and pedestrian zones.
6.3 Analisys of the potential of renewable energy sources The Municipality of Nikšić has natural resources that can be used to produce energy at the local level. Among these resources are significant: the potential of solar energy, hydropower potential, wind potential, the potential of utilization of biomass in a sustainable way and the possibility of eventual use of residue from agriculture and the livestock farming and waste.
6.3.1. Hydropower potential
In the area of the Municipality of Niksic there is a large number of watercourses, ten lakes, a lot of specific karst springs, as well as the wealth of groundwater. Hydropower potential of the municipality of Niksic is primarily based on the construction of small hydropower plants on watercourses Zaslapnica, Zeta (Zeta with an angle of backflow up to the level of ground water of SHP Chapter of Zeta), Gračanica and Grahovsko Lake (Grahovo). Energy Development Strategy Montenegro up to 2025.god., as well as the strategy of development of small hydropower plants in Montenegro are strategic documents which support activities for the construction, use and maintenance of small hydropower plants.
By building the small hydropower plants do not pollute the air, it prevents the risk of flooding because they allow water regulation, it can be used for water supply and irrigation, build a pond in sports and recreational purposes.
Watercourse Zaslapnica
Zaslapnica river, rises above the village Zaslap at elevation 760 m asl and slopes towards the village Nudolu (with beans) in narrow steep canyon at the beginning of the watercourse, by picking up a lot of small sources, and after the flow of about 6 km at an elevation of approximately 350 meters above sea level, flows into the river Sušica and this river in a river Trebišnjica. On the basis of private initiatives, for energy exploitation of Slapnice is proposed this watercourse, which is energetically investigated. On Zaslapnica are planned three SHP plants with installed capacity of 1 MW, whose annual production would be 3.6 GWh.
Zeta
Zeta River is formed in the upper field of the river Susica and Rastovca. Zeta generally flows south to the village Zavrh, where it loses part of waters on the existing estavelles, and the water appears in the accumulation of Krupac. From here Zeta moving east toward Glibovac, then turns away to the south-east and east to the compensation reservoir, where the tunnel and pipeline dovodi do "Perućica". Before the construction of the hydropower system and regulation of the riverbed of Zeta this watercourse is

LOCAL ENERGY PLAN
assembled to southern rim of Nikšić field (Budoške ponds and Slivlje) and after a few kilometers appeares on the hot Glave Zeta. Since this spring, and the spring of Perućica and Oboštice, resulting watercourse Donja Zeta, which flows into the River Moraca. The total length of the river Zeta is about 85 km.
At the initiative of EPCG, for energy utilization is proposed Donja Zeta (locality Rošca) with an angle of backflow up to the level of ground water of SHP Glava Zeta.
Gracanica
Gračanica river originates at the Moravian Blace at elevation 1120 m asl. The river bed is
reconstructed and it was built a concrete arch dam and reservoir Liverovići. Volume accumulation of approximately 9.2 million m3, is intended for accumulation and leveling the waters of the river Gracanica in order to obtain electricity waters on the HE Ozrinići (not completed) and the supply of industrial water Steelworks of Niksic.
At the initiative of the EPCG of Montenegro for energy exploitation is proposed reservoirs Liverovići and Gračanica water stream upstream of the reservoir.
When determining conditions for the use of watercourses and reservoirs for the production of SHP electricity, it is necessary to take into account the design solution from the technical documentation of the hydropower system optimization of project "Perućica". Tender documents for the concession for exploration of watercourses and the construction of 11 the small hydropower plants.
Grahovsko jezero
Based on the initiative of EPCG for energy exploitation is proposed reservoirs Grahovo. The volume of the reservoir is approximately 1,222,580 m3. Dam "Grahovo" belongs to defend of stone with upstream wall according to the type, on which is made watertight screen "gunning" concrete.
6.3.2. Solar energy
The entire territory of the municipality of Niksic has significant potential of solar radiation that can be used to generate electricity for water heating and space heating as well as in some transition periods. The annual insolation of the Municipality of of Niksic is 2200 h / year.
Depending on the technology that is used, solar energy is used in households, industry and the hospitality industry, especially in cases where the low voltage network is not available or the quality of the supply is very low. In such cases it is possible to use solar radiation to generate electricity of smaller capacity in which the the produced electric energy accumulates, and as such is used as needed. Possibility to build solar power plants are analyzed in the study of valorization of space in purpose of space solar energy from renewable sources.

LOCAL ENERGY PLAN
6.3.3. Wind energy
Wind energy potential in the municipality of Niksic is important, but its use is limited to a small concentration of the power per unit area, change of direction, the direction of speed, strength as well as changes in temperature and air composition. Besides already stated, it is necessary to have good existing transport infrastructure of electricity grid, which is a good basis for the development of the project for the use of wind potential. Area of Krnovo is planned as a location for the construction of wind farms that in the first phase would have an installed power of 50 MW and an annual production of 115 GWh and in the second phase, an additional 22MW and annual production of 50.6 GWh.
6.3.4. Communal waste
Municipal solid waste and other waste, excluding radioactive and other hazardous wastes are increasingly being used as an energy source. Incineration of waste in waste incineration plants can produce electricity and heat, along with other products (metal, glass, plastics, fertilizers and clay). In the world today there are advanced technologies for industrial waste treatment, some of which emphasize greater energy production (complete combustion of the waste), and some in the production of fertilizers.
In Montenegro, so far this problem has not been solved, even with the utility, not the energy aspect, although lately there are several initiatives in the research and design of such facilities. It is estimated that in Montenegro annually forms 200-250 thousand tons of municipal solid waste, which is the ability to build a 3-5 industrial plants for its incineration, depending on capacity. Capacities are in principle standardized at 50-100 thousand tons of waste per year. Within these power plants are 7-15 MW for electricity and 10-20 MW for thermal energy production, which depends on the applied technology and capacity. It is anticipated that the potential locations for such facilities would be close to major cities (Podgorica and Niksic) with regard to volume of waste generated.
This study provides the possibility of building such a facility with electricity capacity of 10 MW, also with an investment cost of about 3,200 EUR / kW. It is assumed that such a plant, due to the efficiency of the cogeneration process, can produce at the same time heat and thermal energy, and supply the specified number of households the relatively near the plant. Of course, for a decision on the construction and selection of plant parameters will be required to perform additional analysis.
The potentials of renewable energy sources are mostly in rural areas, where is the medium and low-voltage network less developed. It is necessary to build new TSi and reconstruct power lines with considering of the possibility of joining the new facilities for the production of electricity. In order to join the planned new distributed powers to the electricity grid during 2011-2012.god., Study on connection and operation of distributed energy sources in the electricity system was done, in which are proposed

LOCAL ENERGY PLAN
technical recommendations as well as connection of the planned analysis of SHP. Accordingly, as the distributed sources are, especially small hydropower, usually built in rural areas where the radial low-voltage network is, construction of all systems, except the micro-system, requires investment in upgrading the existing electricity network.
Connection of planned energy sources to power system will be defined through development of Local study on location as a planning document that defines the location and method of connection.
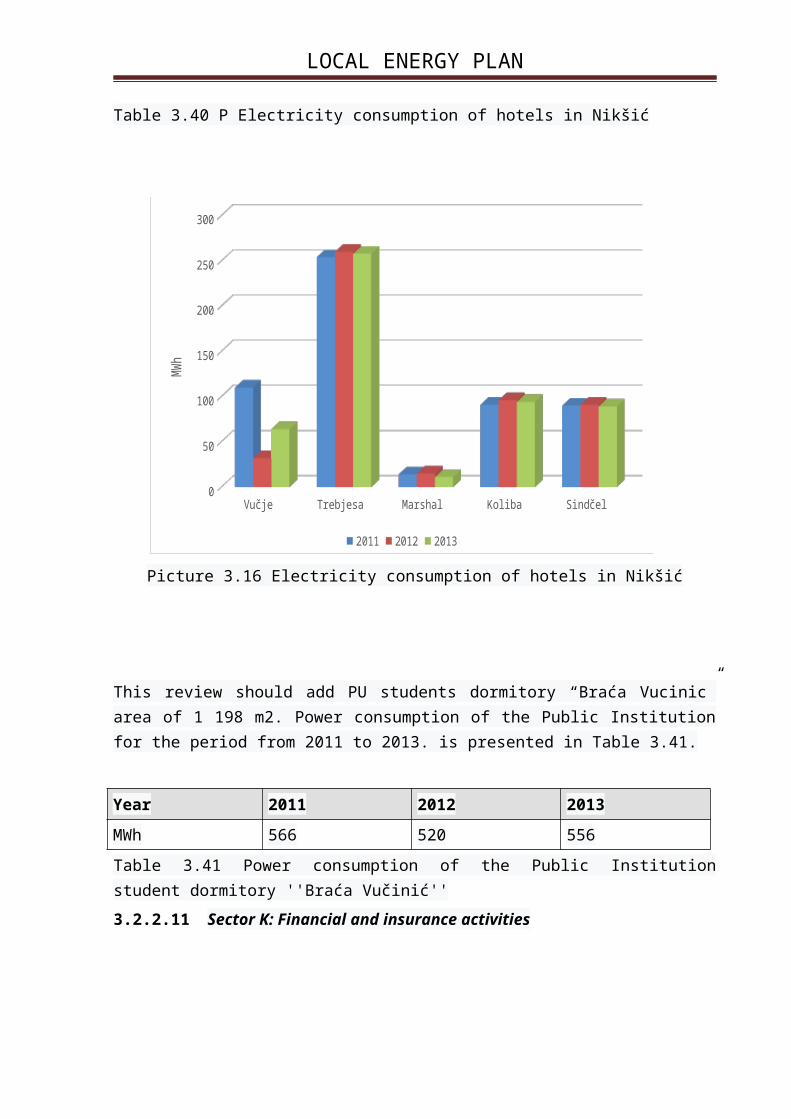
LOCAL ENERGY PLAN
7. Defining energy goals
Chapter defines the energy concept of the Municipality, which is based on the national guidelines and objectives in the energy sector. Also, this section defines the goals for the implementation of the Energy Plan of the Municipality of Niksic in the next ten years.
7.1 Definition of the local energy concept
Strategic development plan of the Municipality of Niksic defines vision as a middle-income municipality with low level of unemployment and better living conditions secured by increased economic activities of small and medium-sized enterprises and sustainable ways of using natural resources. In order to achieve this vision are defined four priorities in development : improved economic production system and growth of living standards, infrastructure and spatial planning of the territory, environmental protection and improvement of the functioning of public services and social life of the citizens. In this regard, economic system is meant to support the development of industry and services, tourism and agriculture and rural life. Sustainable energy development permeates through all of these priorities as one of the preconditions for their realization. Therefore, one of the conditions for the development of defined branches, economy improving quality and security of energy supply, which also helps improve the conditions of life, are improving the functioning of public services and infrastructure development of the municipality. Implementation of energy efficiency measures especially in households and buildings used for public services, helps to improve the living conditions and quality of public services. Finally, the development of distributed energy helps the economic development of the Municipality which affects providing for the the realization of planned objectives. Therefore, sustainable energy development should encourage achieving the vision of development of the Municipality through increased local production of energy, more efficient distribution of energy as well as more efficient use of energy in all sectors of consumption, especially the household sector and public services.
Due to the above, the concept of local energy development of the municipality of Niksic is based on:
Providing of the high-quality and constant access to energy;
Use of local resources for energy production and energy;
Increased efficiency in production and distribution of electricity and heat;
Efficiency of energy use, electricity and heat, and energy in all sectors, with a focus on households;
The increase of the capacity of municipal services to monitor energy projects and
• The decline in growth rate of consumption of fuel.

LOCAL ENERGY PLAN
By following these guidelines Municipality of Nikšić will provide the energy, economic and environmental optimum development of local energy. By adopting this plan, the Municipality of Nikšić takes active participation in the control and encouraging the development of energy, aware that energy development is one of the main pillars of economic development of the municipality.
7.2 Objectives of the national strategies, olans and programs in the energy sector
General guidelines of the Energy Development are defined in the Energy Policy of Montenegro until 2030, section 1.3, namely:
sustainable development of the energetics;
development of the competitive market and
security of energy supply.
Country Montenegro, a country which has opened accession negotiations with the EU, has an obligation to follow the EU energy policy through harmonization of national strategies, legislation and regulations with the EU. EU has defined energy development until 2020. with the policy of 20-20-20 to 2020 g., or 20% reduction in energy consumption by 2020. compared to the final energy consumption from 1990 g., increasing the share of renewable energy to 20% of total final energy consumption by 2020. and reduce emissions of the influence of greenhouse gases by 20% compared to the level in 1990. by 2020. In order to achieve this objective for the whole EU, a single goal for each of the EU member states are defined.
Montenegro, as a signatory of the Treaty establishing the Energy Community, has so far defined targets for energy saving and RES share. Namely, Montenegro has adopted a target of 9% savings of final energy consumption by 2018. compared to the average for the period 2002 to 2006. and a decrease of 58.9 ktoe (2466.5 TJ) of the final energy consumption expressed in primary energy equivalent. At the end of 2012. a target of 33% share of RES in gross final energy consumption by 2020 has been defined, or an increase of 6.5% compared to the reference year 2009.
Energy Development Strategy of Montenegro until 2025. provides guidelines for energy development, energy development goals at the national level and measures for achieving the goals, and it is based on an Action Plan for the Implementation of the Energy Development Strategy for the period 2008-2012. Last year, The Strategy of Energy Development to 2030 g., Green Book was prepared, which was given at a public hearing. In accordance with the Law on Energy Efficiency, three-year action plans define specific actions for achieving the goal of energy saving. Program of development and use of renewable energy, which should define a way of reaching the target share of renewable energy by 2020. is not made at the national level. Currently, Action Plan of Energy Development Strategy for the period 2008-2012. and g. Action Plan for Energy

LOCAL ENERGY PLAN
Efficiency for 2010-2012. g. are adopted, but deadlines for their implementation are expired.
There is a noticeable lack or obsolescence of strategic development documents at the national level in the energy sector. But, based on the existing strategic documents and action plans, it can be concluded that priority in achieving the objectives of EE are: application in buildings or primarily public service sector and households, as well as services and industry, then efficient energy production and distribution, as well as efficient use of resources in the production of heat and industrial processes, and ultimately using energy-efficient appliances in all sectors.
On the other hand, the priority for the development of RES, represent an efficient use of resources that are already used for energy purposes, mainly hydropower and biomass, and the emphasis is given on increased, but the optimal use of local resources for energy production and energy. Under optimal use of resources, they are considered renewable energy sources whose valorization is the most economical and effective solution with the least impact on the environment.
7.3 Defining objectives and indicators in local governmentBased on the general or national objectives defined in section 7.1. for all sectors, this section defines the objectives per sector for a period of 10 years, but depending on the level and trends of consumption described in Chapter 3, as well as analysis of the potential given chapter 6.
7.3.1. The objectives in the systems for energy supply
The most important distribution system of energy power is EES, which is highly developed in the previous period, and subsequently branched, but the state of the power system, especially the low-voltage network is relatively poor in rural areas. Very large losses in the the electricity network are pronounced, which must be reduced in the time required for the realization of this plan. It is a small number of information when it comes to district heating systems, but from the data that are available it is understandable that it was poorly maintained and efficient systems, the majority of which are not operational. In order to protect the environment, it is necessary to carry out the substitution of oil and petroleum products in boilers for central heating with wood fuels, fuels which have little impact on the environment, but which are at the same time and energy that can be produced in the municipality of Niksic.
C.1. Improving the quality of electricity supply, reducing the cumulative duration of the outage end customer in accordance with the standards of quality of supply and
C.2. Reduction of losses in the electricity network on 6% of total supplied electricity by 2025.
LOCAL ENERGY PLAN
7.3.2. The objectives of energy production
From the aspect of energy production from RES, the greatest potential is in the utilization of wind power by building wind farms and improving ways of using biomass.
The goal is to be produced electricity in wind power and biofuel power plants in the much significant amount in the relation to the electricity delivered from the reference year in the Municipality of Niksic. The plan is to be produced electricity and to be increased by 30% by 2025. and so to deliver the electricity produced in the power of Montenegro.
It is necessary to create a market of wood fuel, pellets, briquettes and wood chips in a way that remains from the forest and wood processing industries are used as fuels for the production of wood fuel which should be used in the Municipality and exported. The objectives of energy production are:
C.3. Production of electricity by building power plants of at least 30% more than the current production until 2025 .;
C.4. Increase of capacity for the production of wood fuel, pellets, briquettes and wood chips, the production capacity of a minimum of 10,000 t/year by 2025 .;
7.3.3. The goals for increasing of energy efficiency
In accordance with the energy consumption, the major energy consumers represents the household sector, followed by the transport sector, then the services and industry. From the standpoint of potential of EE, households sector has the greatest potential. The goal of EE in the municipality until 2025. is 15.4% and 1.3% per year. In the final consumption of primary energy it is possible to save 250 TJ, or for the next 10 years by 25 TJ per year.
Increase of EE promotes by the following objectives:
C.5. Constant monitoring of energy consumption in public buildings and businesses with the reduction of the final energy consumption in public services by 20% by 2025.
C.6. Replacement of energy-efficient equipment for heating in households and in the service sector by 2025. 10% of primary energy consumption;
C.7. Improvement of energy performance of buildings, ie in all the buildings in which they perform public services with built-in insulation and 20% of residential buildings by 2025., savings of 7.5%;
C.8. Increasing the efficiency of traffic by organizating of the public transport and the use of more efficient vehicles by 2018 g. With savings of 5% of consumption in the traffic sector, savings of up to 2025 g. 0.7% of primary energy;

LOCAL ENERGY PLAN
7.3.4. Awareness of citizens and employes
C.9. Increased percentage of informed citizens about the efficient use of resources in the municipality and the possibilities to 30% by 2018, and 60% by 2025 .;
Organized and established practice of education on the efficient use of energy and proper use of processes and technologies by all enterprises in the services sector and industry to 2018 g.

LOCAL ENERGY PLAN
8. Analysis of measures to achieve the objectives of the local energy
8.1 Measures to improve the energy supplyThe most important system of energy supply in the whole territory of Montenegro, and especially the Municipality, is the EES. Planned construction of 400 kV transmission line Tivat - Brezna - Podgorica, and TS 400 / 110kV, and 110/10 Kličevo town of Niksic would be pleased with the energy from the power system of Montenegro.
8.1.1. E.1.: Improving the safety and quality of electricity supply
The realization of the planned works on the transmission network in city area of the Municipality of Niksic will have a stable supply of energy at 10kV and higher level.
It is necessary to improve the reliability of the 10kV network.
8.1.2. E.2.: Development of the distribution network
Taking into consideration herein, as previously defined priorities and strategic orientations for the further development of the Municipality, this measure includes the following activities, which involve cooperation of local government, EPCG and the ministry responsible for energy affairs, including:
Defining rural areas in which need to focus / priority in the reconstruction and improvement of the existing distribution network and
Defining the urban areas which need to be reconstruct and improve the existing distribution network
The measure predicts the improvement of TS 10 kV network (in the city the construction of new lines, and in non-urban areas modernize air network).
With planned construction of phase II (building a new plant 10kV) this part of the city's energy will be met.
With the planned development of 35 kV network it is planned to move 10kV switchgear Duklo in 35/10 Duklo thus significantly improved the supply of this part of the city.
Implementation of these plans would create the possibility of joining the eventual production capacity of electricity generation from biomass and waste.
Also following the development of the network on medium-level and in order to reach high-quality supply of consumers it is necessary to constantly develop and improve LV network.

LOCAL ENERGY PLAN
8.1.3. E.3.: Improving the practice of wood fuels supplying
On the territory of the Municipality in order to meet the needs for heat, most households use firewood which procurement is given in the subsection 3.1.
With this measure is stipulated that it is necessary to define how and when the supply is wood by regulation at the national level , as well as the characteristics of firewood which is allowed to supply households in order to achieve a higher degree of efficiency of the use of this energy source.
8.1.4. E.4.: Develop a feasibility study on the use of district heating system in the city center
Buildings in the city center of Niksic municipality is currently supplying with heat via a central heating system of their own boiler room , which are mainly on fuel oil and electricity or using devices that use electricity. Since it is necessary to completely abolish the use of electricity for heating on the one hand and also to find a more effective way of heating metropolitan area local communities in collaboration with the Ministry of Sustainable Development and the Government of Austria, which funded the study, has started production of the study "Biomass Project Identification Study Montenegro". In preparing the study it needs to be analyzed the possibility of using biomass potential in the municipality, and then do it, and establish the cost of a plant as well as the entire district heating system. The plant would be a cogeneration type.
8.2 Measures to increase energy productionThe territory of the municipality of Niksic has a rich natural resources, including significant potential of wind and hydropower Zeta River. By further exposing, the measures which should be undertaken for the period of implementation of the plan are defining in order to meet the goals of energy production as it has been defined in the previous section.
8.2.1. P.1.: The construction of small hydropower plants
According to analyzes made so far, it is estimated that the level of Montenegro greatest development potential among renewable energy sources have large hydro, small hydro and wind.
Currently in Montenegro are completed a concession to 13 streams with the planned construction of SHP 35, with a total installed capacity of approximately 100 MW and planned production estimated at approximately 300 GWh per year.
By law on Water and the accompanying Decision on determining of waters of importance for Montenegro are defined watercourses that are of national significance. Water flows of jurisdiction of national importance are the responsibility of the Ministry, while streams of local importance are managed by the municipal level.
Using the hydropower potential in the electric power purposes depends on the energy of the watercourse itself. Therefore, in the territory of Niksic municipality on the basis of existing studies and research, there are two streams at which it is possible to build a SHP namely: Gracanica river and river Zaslapnica. On the river Zaslapnica is planned to build

LOCAL ENERGY PLAN
three of which are one of SHP with signed the concession agreement. For river Gračanica there is no record.
It is important to note that while defining the use of a particular watercourse important to define a clear upper and lower corners of the utilization of the same as well as the amount of water that must be left in the river flow both for the reduction of environmental impacts or environmental flow, and to meet the water needs of the local population. It is recommended that the local government in accordance with its legal obligations keeps a register of the existing water and the use of water themselves by residents and other users.
Study of connection of distributed sources to power system of Montenegro has shown which are needed strengthening and widening of the existing power system in order to connect to the system on the basis of the concession agreement signed with the Government of Montenegro.
8.2.2. P.2: Utilization of residues from the forest and wood processing industries for energy purposes
In the municipality of Niksic is currently used exclusively firewood of biomass. The potential of biomass is given in section 2.1. How fuelwood is energy source which is obtained from the forest, usage of firewood is necessary to regulate in cooperation with the forestry sector at the state level, establish regulations that enhance the use of forest resources for energy purposes, which will be based on the European directives and examples of good practice. It is necessary to define the types of forests that can be used for firewood and use of forest residues, its storage and cutting for use for energy purposes. On wood type and its moisture depends significantly heating value of fuel wood, and consequently the amount of firewood needed for heating.
In Montenegro, until recently, was practically solitary exploiting existing wood waste, mainly using dry sawdust and waste wood industry. In order to use a complete biomass it is necessary to make preparations for the use of energy, including biomass collecting, transport and its further processing and use.
8.2.3. P.3: Develop a justification study of other potential
Potential of use of renewable energy and thus use of residues from agricultural activities, as well as municipal and other waste is defined in section 6.3. Analysis of cost-efficiency of these potentials for energy purposes should be done taking into account potential cooperation with neighboring municipality ie construction of regional plant.
In the future we expect an increased interest in the use of biomass due to the growing needs of industry, the need for reduction of waste materials, more stringent regulations for environmental protection, as well as the ever-growing demands for greater utilization of renewable energy sources.
Even it has been achieved a significant results in the field of biomass utilization there is still need to invest significant resources and conducte the intensive research with the aim of increasing the efficiency of technology for biomass utilization and optimization

LOCAL ENERGY PLAN
of existing technical and technological systems.
8.3 Measures to improve energy efficiencyMeasures to improve energy efficiency in the municipality of Niksic will be discussed at two levels, namely:
measures to improve EE in several sectors of final consumption or cross-sectoral measures
specific measures by individual sectors of final consumption, as described in section 6.2.
It should be noted that the energy policy in Montenegro, in accordance with the legislation, leads on national level, and that the responsibility for defining the policy in the energy sector is at the national level. An exception from this, are district heating systems which are under the jurisdiction of local governments. However, in applying of the policy of the energy sector is very important presence of local governments, or their cooperation with both state-run and with other stakeholders such as the private sector, NGOs, public and financial institutions. Cross-sectoral measures to improve EE in the municipality, are highly interdependent with measures at the national level, such as measures defined with an action plans for EE and the Action Plan for Energy Efficiency 2010-2012, and in their definition of it taken into consideration.
8.3.1. Cross-sectional measures
Cross-sectoral measures to improve EE Municipality of Niksic for implementation in the next ten years are given in this section.
8.3.1.1 M.1.: Establishment of energy management systems
The measure of the establishment of energy management systems or energy management refers primarily to the service sector and industry. Establishing of energy management systems involves defining the boundaries of the system which is operated, the energy policy of this system, energy managers, the main and most important customers, monitoring of energy consumption, as well as defining priorities and measures of implementation of measures to improve the energy management. This process of establishing an energy management system is clearly defined and described in the international standard EN ISO 50001 Energy Management Systems - Requirements with guidance for use. Energy Management System, as described in the standard can be applied to smaller systems such as one building, hotel, etc., as well as on system of industrial production, which involves several processes, facilities and needs.
The introduction of energy management systems is done once, but the system is maintained and is a continuous process of improvement of energy use in a given system. Instructions on energy efficiency measures and guidelines for their implementation

LOCAL ENERGY PLAN
defines Recommendations for the establishment and operation of an energy management system.
8.3.1.2 M.2.: Installation of modern devices for energy consumption measuring
This measure is considered as cross-sectoral measure because it relates to households, services and industry. The basis for improving EE represents the installation of modern, high quality and precision measuring devices for energy consumption, with which it is possible and simple monitoring of energy consumption.
Operator of the distribution system in the course of 2012. has started to implement these measures in order to clearly define the power consumption by end customers and better positioned and established technical losses on the existing electricity network. The measure is carried out at regular intervals prescribed by law and implemented in the service industry.
8.3.1.3 M.3.: Regular inspections of heating boilers
In accordance with the Law on energy efficiency, it is necessary to ensure the implementation of regular energy audits of heating boilers with power exceeding than 20 kW and air conditioning system capacity greater than 12 kW.
Energy audits is necessary to conduct authorized persons who have acquired the status in accordance with legal regulations. The adoption of new legislation at national level is delayed, but recently we expect to adopt them. Regulations on regular energy audits of heating boilers and air conditioning systems that define the procedure for obtaining the status of authorized persons, which certainly has the effect of increased energy efficiency, or monitoring the effectiveness of existing systems that are used for the production of useful energy for heating and / or cooling. These regulations are adopted at national level, but their implementation is at both national and local levels.
In the municipality this measure is mainly applied in the service sectors or industries. In most cases, use and manner of use of heating boilers is not done in a satisfactory manner, and regular inspections and quality system by authorized persons may significantly contribute to improving the quality of use of the system, which achieves extend of the service life of these devices.
This is also a continuous measure, which is carried out at regular intervals prescribed by law and implemented in the service industry.
8.3.1.4 M.4.: Encouraging the use of renewable energy sources and energy efficiency measures
Local government in accordance with the Law on Energy Efficiency has an obligation to determine the incentives for EE improvement in all sectors of the territory of local self-government.
Incentives, which is implemented by the Municipality, may include:
installation of thermal insulation materials for building residential and service sector;

LOCAL ENERGY PLAN
replacement of heating equipment with more energy efficient and installation of central heating systems especially in the household sector;
construction of warehouses for storage of biomass for use during the heating season;
The use of distributed sources of electricity in order to sharewiththe the power system
elimination of the use of electricity for heat generation;
the reduction of reactive energy offacility;
use of biogas or solar radiation in order to produce heat at specific micro-locations where it appears worthwhile.
In the event that the incentives introduce at national and / or local level, it is necessary to ensure that the implementation of the measures taken performs in a proper manner by qualified installers, to organize adequate supervision of works, that encouragement includes the installation of new energy efficient equipment in accordance with EU regulations and standards, and to show that a solution that encourages represents a measure with the greatest effect on the efficiency of energy use or reduce the impact on the environment. Also, it is necessary to make the organization for successful control of implemented stimulus measures.
Incentive measures may be in the form of financial relief, or covering part of the costs involved in implementing measures financed by the municipality or with the help of donors, as well as with the reduction of certain fees and taxes paid to local government.
8.3.1.5 M.5.: Implementation of the new regulatory framework for buildings
The Law on Energy Efficiency defines rights and obligations, responsibilities and competencies in the field of EE and defines mechanisms for their implementation. The emphasis in law was EE in buildings, all in accordance with the European directives in this area. Based on the Act, it was necessary to adopt a set of laws in this area, which consists of:
Regulations on minimum requirements of EE building, with which is planned to determine the minimum requirements regarding EE buildings, types of buildings that in accordance with the purpose does not meet the minimum energy characteristics and methodology of calculating the energy performance of buildings;
Regulations on the methodology of calculating energy performance of buildings, which stipulates to determine the mode of certification of buildings, the manner of determining the energy class of the building, the layout and content of the table with the primary energy performance of public buildings, the contents of the certificate and the register of issued certificates on the energy performance of buildings and building types that in accordance with the purpose are not certified;
Regulations on the methodology of the energy audits;

LOCAL ENERGY PLAN
Regulations on regular energy audits of systems for air conditioning and heating;
Regulations on the training program for energy audits, content requirements for the issue of the register of authorized persons;
Regulations on contents of the energy efficiency of buildings.
The implementation of the new regulations will contribute to the EE state of being in the building sector, a sector that is dominant in consumption of households, as well as in the service sector, and it is therefore important and very significant for this local government.
Montenegro are harmonizing with the relevant regulations of the European Union, which is constantly improving regulations, especially in the energy sector, but judging by the ambitious commitments in accordance with Directive 2010/31 / EU it is realistic to expect that the Montenegrin legislation in this area will dynamically improve. Therefore, this measure represents the constant activity of local government, as well as the household sector and other services to apply and implement the regulations in force for the improvement of EE in buildings, while the Municipality, especially the energy manager of the Municipality recommends regularly meet with the progress of legislation in this area in the EU.
8.3.1.6 M.6 The improvement of energy performance of existing buildings in accordance with EU directives, standards and best practices
Kad se radi o postojećim objektima, prilikom rekonstrukcije ili kupovine objekata, potrebno je voditi računa o energetskoj potrošnji i ugrađivati postrojenja i uređaje u skladu sa važećim EU propisima. Sektor domaćinstava, gdje je trenutno stanje postojećih objekata u kojima domaćinstva žive takvo da je primjena mjera EE za postojeće objekte jedna od najbitnijih aktivnosti u poboljšanju efikasnosti korišćenja energije. Kad su u pitanju komercijalne usluge, odnosno trgovina na veliko i malo i ugostiteljske djelatnosti, na teritoriji Opštine, energetska potrošnja se obično poistovjećuje sa energetikom potrošnjom objekata u kojima se obavljaju djelatnosti, pa mjere poboljšanja energetskih karakteristika zgrada su značajne za poboljšanje EE u sektoru usluga.
Stoga je potrebno implementirati mjere koje doprinose smanjenju toplotnih gubitaka samih objekata, kao i sistema za proizvodnju i distribuciju toplote, odnosno tople vode zavisno od korišćenja. Ovom mjerom se daje poseban akcenat na postojeće zgrade.
Pri implementaciji ove mjere, lokalna samouprava može imati presudnu ulogu kako informisanjem građana o mogućim uštedama i poboljšanjima konfora nakon primjene gore opisanih mjera ili korišćenja efikasnijih uređaja za grijanje, tako i davanjem podsticaja za implementaciju istih. Ove aktivnosti lokalne uprave trebaju biti u koordinaciji sa sličnim mjerama na nacionalnom nivou kako ne bi došlo do duplog podsticanja istih mjera.
Takođe, na nacionalnom nivou je potrebno donositi propise koji se odnose na označavanje energetski-efikasnih uređaja, pa je njihovim usvajanjem za očekivati da će se više koristiti uređaji većih klasa EE.
LOCAL ENERGY PLAN
8.3.2. Households
8.3.2.1 D.1: Improving ways of using firewood
During 2011-2012. g. efforts were made to obtain accurate data on the consumption of firewood in Montenegro. Ministry responsible for energy and the MONSTAT are in 2012. g. completely changed the official methodology of the consumption of wood fuel in Montenegro. The new methodology is performed based on the methodology of the European Bureau of Statistics, Eurostat. Based on the new methodology, MONSTAT 2013. published official data on the consumption of wood fuels in the whole territory of Montenegro. The consumption of wood fuel in the future will be followed based on the established methodology, every second or third year. Results obtained on the basis of the newly established methodology multiply exceed the statistical data on which they were based on current energy balance of this energy source.
On the territory of the Municipality, as described in Section 3.1.2, woody biomass or fuel wood and pieces of bark from sawmills are used in 90% of households. Firewood represents 36% of the total energy used in the municipality. Therefore, the application of measures to improve ways of using firewood is an important measure of EE or rational use of energy. This measure includes:
implementation of the regulations on the use of forests for energy purposes withdescribed measures,
Identification of possible storage of biomass in line with EU standards and practices,
Identification of the characteristics of biomass, fuel wood and other wood fuels that can be used or distributed by retailers,
determine the characteristics of the device for heating or using woody biomass that are available to end users, ie households.
8.3.2.2 D.2: Improving the energy performance of buildings
Considering that this is the biggest share of energy consumption of buildings in the household sector, ie consumption in family houses and a large number of collective housing units it can be expected that this measure is a priority in EE activities in the municipality.
Therefore, this measure can be realized through encouraging of setting thermal insulation on the external walls and roofs of buildings housing the collective or individual objects. Later may encourage the replacement of facade openings, windows and doors, with those with better thermal characteristics or lower coefficient of thermal conductivity compared to the existing ones.
Households in the Municipality of Niksic right now, during the heating season do not heat up all the rooms in the house. Local government should stimulate increased comfort in the heating season in households, on the way to increase the heating surface in households, which is achieved by providing favorable conditions for the installation of wood biomass furnace with integrated central heating.

LOCAL ENERGY PLAN
This measure should be implemented continuously and to determine the criteria by which households can obtain the rights to the stimulus when implementing these measures.
8.3.2.3 D.3.: The use of energy-efficient equipment
Most of the energy used by households is used for purposes of space heating and cooking. On the territory of the Municipality of Niksic for this purpose is mostly used firewood, and it is a small percentage of the demand for electricity that we use for heating. It is necessary to introduce this measure, which should include the replacement of inefficient heating devices that are predominantly used in households with more efficient devices or central heating systems.
It is necessary to adopt on a national level and at the local level to implement regulations that will define the minimum EE devices that burns firewood and other wood fuels. It is expected to adopt the regulations pertaining to energy efficiency devices in households in the foreseeable future.
In addition, with respect that the Montenegro is approaching the EU energy policy, it is necessary for the duration of this energy plan, or as soon as possible to reduce the number of households for heating using electrical energy. The use of electricity for heating regardless of the efficiency of the device that is used represents the most inefficient way of obtaining useful heat. This activity should be implemented at the local level but the most by informing citizens about efficient ways of heating, as well as at the national level by ban on the use of such devices.
Except for the purposes of domestic heating and lamps are used for lighting rooms, as well as other electrical devices and appliances. For this it is necessary to initiate several activities:
informing of citizens about the benefits of using more efficient lamps, as well as the possibilities of savings by replacing light bulbs, light regulation, as well as using the appropriate number and type of lamps;
implementing of regulations whose adoption at the national level is expected for both the characteristics of the building, as well as for efficient devices used in households;
Providing incentives to households by the local government to adhere to good practice.
Certainly, local government and the competent ministry can help partial grants to replace inefficient appliances that are currently used in households with new efficient devices, with special emphasis on devices that are used to produce heat.
This measure should be implemented at the national level in order to have the best effect, but it will certainly have a major impact on the energy consumption of the municipality and will require coordinated efforts of local and state administration.

LOCAL ENERGY PLAN
8.3.3. Service sector
EU measures in the services sector will be presented in detail for the public service, which includes the following sectors: water supply and disposal (E), Electricity (D), Education (P), health and social work (Q) Arts, entertainment and Recreation (R) and state and local government (O), given in the analysis of sectoral consumption of Subchapter 3.2.
8.3.3.1 Public service measures8.3.3.1.1 U.1.: Establishing the information system and energy management system by
the authorities of the Municipality
On the territory of the Municipality, local government must prepare the infrastructure for setting up energy management system, which also represent the legal obligation. Infrastructure is reflected in the development of an information system for energy consumption, which must contain information about the buildings and facilities that are used for the operation of local government, public institutions and companies, public lighting and traffic. Data on these objects include general information, or a list of objects that use energy, energy consumption data and indicators relevant in terms of energy consumption, ie perceiving the degree of EE. The establishment of an information system is working once but the same must be continuously enhanced. This information system, although is in a database with an interface, is not necessarily a significant financial cost, but can be prepared using simple software that are already available to local government and public institutions.
After that, the measure provides setting the overall energy management system which requires organizational and technical activities. As a result of these measures is a system that is responsible for a particular person or group of persons, which has resulted in proposing economically viable EE measures and use of resources for energy production and presentation of the results of implemented measures and further planning. Energy Management System includes all buildings, institutions, services, transportation, and public lighting under the jurisdiction of local governments.
Also, it is necessary to establish the energy management system, which should contain detailed information on the characteristics of the building in which the activities within the jurisdiction of local governments. It is necessary to make a program for conducting energy audits, and to develop a special database for completed energy audits and to issue certificates on the energy performance of buildings, which will be part of the energy management system. Full energy audit of facilities under the Rules of regular energy audits of systems for air conditioning and heating is necessary. The program for performing energy audits in buildings in which local government authorities carry out activities should be carried out over a period of five years from the date of adoption of the plan.
8.3.3.1.2 U.2.: The adoption of plans and programs and the implementation of energy efficiency measures
Niksic Municipality, in accordance with the Law on Energy Efficiency, has an obligation to the adopt three-year energy efficiency program and on the basis of them annual plans.

LOCAL ENERGY PLAN
This measure includes the legally required reporting to the relevant ministry in the form defined by the Regulations on the content of the report on the implementation of the plan of EEI local governments.
Based on the energy management system, the Municipality of Niksic defines the priority projects program, EE, while the EE plan defining projects which are planned to be implemented in the course of a given year. Municipality of Nikšić is responsible to provide funding through the state or local budgets, international funds, or through collaboration with the private sector. By implementing of such projects, they can be used as examples of good practice to inform the public and stimulate other sectors of the implementation of similar measures on the basis of the results obtained by means of a concrete example.
8.3.3.1.3 U.3.: The inclusion of energy efficiency guidelines in local spatial planning documents
Guidelines for improving EE and RES are involved in spatial planning at national and regional level, so the same should include when preparing local spatial planning documents. Development of spatial planning documents is done on the basis of the Law on Spatial Planning, which has already defined that the planning documents working respectively to the guidance of EEI. These guidelines should follow potentials described in Chapter 6, and depend on the location to which it relates.
During the planning of planning documents it is necessary to specifically take into account the energy supply systems for new buildings. It is necessary to planning documents made in coordination with the development plans of the electricity distribution system, and in particular provide a way of heat supply of new buildings and facilities.
In the implementation of some of the inter-sectoral measures to new facilities it is necessary to bear in mind the planned heating system. Therefore, if you are planning decentralized use of wood fuel, it is important to plan and space for storage of the same order at the time of the heating season used in accordance with recommended practice or performance.
8.3.3.2 Commercial services
Commercial services include the following sectors: Information and Communication Technology (IS), Wholesale and retail trade (G), accommodation and food services (I), Financial and insurance activities (K) and Other service activities (S). The Intergovernmental measures, which have already been described in the previous section, which apply for commercial services are:
Establishment of energy management systems;
Installation of modern devices for measuring energy consumption;
Implementation of the new regulatory framework for buildings - particularly in the wholesale and retail trade and catering facilities;

LOCAL ENERGY PLAN
Regular inspection of boilers and air conditioning systems - particularly retail, hospitality, etc.;
Encouraging the use of renewable energy and the increase – of especially distributed energy resources;
Use of energy-efficient devices.
8.3.3.3 Industry
In the municipality of Niksic industry is mainly based on the manufacturing industry.
8.3.3.3.1 Implementation of energy management systems
Implementation of energy management system in accordance with industrial systems currently is a voluntary decision by the company itself, except in cases of large industrial consumers.
Energy management system can be established in accordance with EN ISO 50001 and represents a systematic approach to energy use in industry, which can be easier to implement if the industry has already implemented similar systems management in accordance with other standards. The aim of the implementation of energy management systems is primarily to establish, in the next period and improving indicators of EE industrial systems, which results in better overall business.
This measure is used in industrial systems, with continuous monitoring and periodic improving and modifying the system in accordance with changes in the industrial system, ie the company.
Usually the first step in the establishment of energy management presents an overview of the current situation, which can be done by energy audits on the best way. Action Plan for Energy Efficiency 2010-2012 envisages the introduction of training for certification of persons for the production of industrial energy audits. When the system of industrial energy auditors revive, this person will be relevant to making energy audits, and by then the energy management system can initiate a systematic review of the current state of energy consumption and the processes and technologies used.
8.3.3.3.2 Increasing of technical capacities in industrial enterprises
This measure is in line with measures to increase awareness and to raise of level of informing and giving importance to training employees to improve EE, ie increasing energy savings of specific industrial plants. The processes in manufacturing industries themselves can be very energetic intensive, especially in cases where the equipment is used appropriately and in inappropriate conditions. Therefore, it is necessary to periodic implement these measures, which leads to an increase in both awareness of energy consumption, as well as technical knowledge workers who can be a crucial factor in improving of EE industrial plants. The introduction of energy management in industrial plants on the territory of municiipality, and that use of large amounts of energy, aims to constantly monitoring of energy consumption, but it is left up to the management of the enterprise.
LOCAL ENERGY PLAN
8.3.3.4 Traffic 8.3.3.4.1 S.1.: Improving of energy efficiency in traffic
The transport sector is a significant consumer of energy of Municipality, and the sector for significant emissions of greenhouse gases. Although this sector is a major consumer of energy and at the national level, Montenegro is late with the fulfillment of obligations in the EE and use of renewable energy in the traffic sector. The European regulations for more than 10 years improving the sector. On the basis of the obligations established by the Energy Community, Montenegro is obliged to up to 2020 g. uses 10% of RES based on the total power consumption of the sector. It is expected that Montenegro in upcoming period define and regulate the manner of use of of RES in transport, and to identify measures to improve energy efficiency, which has the effect of reducing emissions of greenhouse gases. This measure includes the constant improvement of fleet energy-efficient, as well as vehicles that use alternative energy sources or electricity or biofuels. This measure should encourage local and state authorities, as well as to apply in their fleets in order to give an example of good practice.
For the implementation of these measures by the citizens for the vehicles used in private use an important role play informing citizens about the possibilities of savings and positive effects of the application of these measures, as well as potential relief when registering vehicles or financial incentives when purchasing a vehicle. Therefore this measure overlaps in one part with measures for playinforming citizens.
8.3.3.4.2 S.2.: Improving of traffic infrastructure
Although the projects to improve the traffic infrastructure does not represent a direct measure of the EE, this measure can be planned together with the previous measures to help improve local roads which are used to connect urban municipalities with a significant tourist and local centers. In addition, construction of roundabouts at busy intersections can contribute to reducing traffic congestion and reduce the energy consumption at these locations.
8.4 Measures to raise awareness and increase the level of informing
8.4.1. N.1.: Increasing of the level of informing of citizens
Raising of informing of citizens is one of the important measures of the EE in all sectors of final consumption. Informing involves on the one hand the availability of quality data on the consumption of energy, energy use patterns and potential energy, as well as the importance and effects of application of EE measures. Studies have shown that up to 10% energy savings in various sectors can be achieved only by changes in the behavior of energy users. In order to avoid changes in the way of energy use it is necessary to make available to all sectors at the local level information on the proper use of the device, the most efficient use of energy as well as simple opportunities for saving energy.
It is necessary to organize the info center for the EE in the municipality with informational materials and examples of efficient appliances. In order to implement this

LOCAL ENERGY PLAN
measure, which is manifested by the constant activities that can be grouped into the following specific measures:
Organize public meetings, discussions, cultural events with the theme of efficient use of energy, ie energy savings;
Available info phone lines on which interest can be informed about the opportunities offered by the local government, state institutions or financial institutions;
Creating and making available leaflets with examples of good practice and ways of saving and efficient use of energy that are relevant to the practice of energy use in the municipality;
Availability of information on activities related to the efficient use of resources on the municipal website, with links to useful web sites in Montenegro and the region;
Cooperation with NGOs and other international organizations in order to promote the sustainable use of energy;
Promoting and informing of citizens about the details of the activities of EE and RES that the Municipality do and plan on running their facilities;
Capacity building of employees in the information office, as well as energy managers of the Municipality through the continued presence and monitoring of training and seminars on the EE and RES theme.
8.4.2. N.2.: Raising of the awareness and training of technical staff
Besides informing of citizens, it is necessary to raise the informing and knowledge of employees in institutions, companies in the service sector, including public and commercial services, as well as in the industrial sector. Specifically, certain measures will be simply related to the awareness of employees about the importance of energy efficiency and energy savings, as well as measures relating to the optimal use of equipment or processes necessary to perform the work of a particular institution or company. This measure involves raising of awareness of local government about the possibilities of new energy facilities on the territory of municiipality, as well as the opportunities that local government has in cooperation with private companies.
Therefore, this measure is an activity that is repeated at certain intervals, depending on the activity with which the certain companies or institutions dealing with as well as the technologies and processes used.

LOCAL ENERGY PLAN

LOCAL ENERGY PLAN
9. Financial resources for the implementation of the plan
The energy plan of Nikšić defines measures to improve the energy at the local level in the application of EE measures and by increasing the production of energy on its territory, especially by using RES. This chapter provides opportunities of project financing ie the measures envisaged by the plan, and proposes levels of incentives priority measures from the Municipality of Niksic in order to improve the situation in the local energy sector and the overall life of the citizens in the municipality.
9.1 Sources of fundingMunicipality of Niksic, as well as other local governments in Montenegro is an independent unit in accordance with the Law on Local Self-Government. Financing of Municipality is made from its own resources and collecting of taxes and grants and donations from the Budget of Montenegro. The annual budget of the municipality in the period 2009-2013 are shown in Table 9.1.
Budget 2009 2010 2011 2012 2013
Own revenues [€]
7.927.115,03 8.220.957,35 6.848.827,35 7.607.686,55 9.516.181,02
Donations and grants [€]
528.914,66 106,000,00 64.500,00 120.000,00 202.474,15
Total budget [€] 16.629.391,20
15.834.505,86
17.806.717,74 15.362.591,82 20.080.202,05
Tabela 9.1 Budžeti Opštine Nikšić u periodu 2009-2013. g.
On the other hand, as Montenegro became a candidate for EU enlargement, the possibility of using EU funds for development projects opens to Montenegro, especially if the proposed projects help sustainable development of local self-government in line with EU policy. In addition to EU funds, cross-border cooperation projects are promoting(SEE, MED, etc.), where the municipality can exchange experiences and cooperate with local governments to neighboring countries, as well as with non-governmental, private, government, educational and research institutions.
When Montenegro access to the EU, many possibilities to use EU funds and programs will open in order to help developing of sustainable local governments as well as the application of EE measures and the development of distributed energy based on the use of renewable energy, considering that these measures are an integral part of the EU energy policy. Therefore, it is advisable that the Municipality set as one of its priorities increasing the capacity of units for the preparation and proposals for funding through the EU program to be able to use as many of the opportunities now and in the future.

LOCAL ENERGY PLAN
In addition to Europe, there are also international funds such as the Global Environmental Fund (GEF), Sustainable Energy Initiative (SEI) Sustainable Energy for All, and the like, as well as international banks that offer technical assistance as well as financial support for the realization of projects, such as the European investment Bank (EIB), the European Bank for Reconstruction and development (EBRD), the German Development Bank (KfW) and others.
Also, as the local government, in order to exchange experiences and help in finding funding for the implementation of energy projects that promote sustainable development, the municipality may join the international associations and programs to support the development of sustainable energy at the local level. The municipality is already a member of the Association of Municipalities of Montenegro, through which it can connect with these and similar institutions in the region and Europe and have access to training related to better organization and methods of implementation and projects in the field of energy.
During the planning of larger capital investments, the municipality should consider the possibility of cooperation with the private sector. In the area of energy projects, this cooperation can be achieved through public-private partnerships. Public-private partnerships can take different forms, form where local or state administration does not include much more than the mere submission of a specific local or state property for use, usually in the form of concessions or leases land to form where the local government through a joint venture company is included in implementation and management of the project. When we talk about energy projects legislative and regulatory framework should be improved at the national level to facilitate this cooperation at local and national level.
Although Montenegro has so far not taken hold, services of EEI can also generate energy performance contract, in which the implementation of EE measures paid according to the agreed level of EEI and the fulfillment of other agreed conditions with respect to the achieved improvements.
9.2 Finansiranje projekata
Chapter 8 describes the measures to improve energy supply, increase energy production, as well as measures to improve EE, and here are given funding sources of individually described measures, which may be made by: EPCG, local budgets, with donor assistance to local government, as and in cooperation with private companies through public-private partnerships, usually obtaining access to resources or concessions.
9.2.1. Measures to improve energy supply and energy
The distribution system of Montenegro, at this moment FC EPCG Distribution, will manage the entire medium and low voltage power system of Montenegro, while the Montenegrin Electric Transmission System carries out the high-voltage electric power

LOCAL ENERGY PLAN
system. Therefore, the implementation of measures E.1 is a direct responsibility of EPCG and CGES.
The development of distribution network, measure A2 is the responsibility of EPCG, but it is necessary good coordination between local government representatives and representatives of EPCG in defining development plans of the distribution network. Local government should turn out their demands in terms of the development vision of its territory, but study on the development distribution network in order to connect distributed generation is done in coordination with representatives of EPCG. Special elaborates on the connection of small hydro power plants in the power system, defines the location and separation of competences between the distribution system operators and new producers of electricity.
In the implementation of measures E.3 ie improvement of practice of supplying wood fuel has the main responsibility ministry responsible for forest management, and the ministry responsible for energy affairs.
9.2.2. Measures to increase energy production
Financing of the construction of small hydropower plants in accordance with the measure P1 can be organized from the local budget or donor assistance to local government, and in cooperation with private companies through public-private partnerships, usually with giving for usage this resource, ie concession. In accordance with the legal framework in Montenegro, the local government has the right of local water management, and therefore by the definition of public-private partnerships on the same.
Implementation of P.2 measure, ie use the rest of the forest and wood-processing industry is an obligation to the relevant ministries and local governments. This measure can be implemented on the initiative of a third party especially in the case of utilization of residues from the wood processing industry.
Measure P.3, which refers to the potential use of biomass for energy purposes, can be implemented on the initiative of a third party as well as the neighboring local government or of the local government in order to resolve issues of environmental waste disposal. Also, on the initiative of a third party can be carried out and a study on the possible enhancement of the water potential of the Zeta River, Zaslapnica and Gracanica. Studies should be done in accordance with European policies, standards and good practice when it comes to the area of the environment.
Also, on the initiative of a third party can be carried out and a study on the possible enhancement of the water potential of the Zeta River, Zaslapnica and Gracanica. Studies should be done in accordance with European policies, standards and good practice when it comes to the area of the environment.
9.2.3. Measures to improve energy efficiency
When describing measures to improve energy efficiency, it has been described the cross-sectoral measures, ie measures which have an impact on many sectors of final consumption. The financing of cross-sectoral measures is the responsibility of the

LOCAL ENERGY PLAN
authorities that are responsible to the objects that are required to fulfill the described measures. Eg. the establishment of energy management systems, measure M1, a measure that should be financed by the authorities who are responsible over the facilities in which it plans to establish a system of energy management in service sectors, public and commercial, and industrial sectors.
Installing of modern equipment for measuring energy consumption, a measure of M2 is a direct responsibility of the companies that manage these systems, and electric grid, EPCG.
When it comes to measures M.5, M.6 and M.3 implementation of the new regulatory framework for buildings, improving ofthe energy performance of existing buildings and planning new ones in accordance with EU directives, standards and examples of good practice and regular inspections of boilers for heating the implemented at the national level. Local government should implement regulations during the construction of new or existing buildings in which are considered public responsibilities of local government ie to comply with regulations when it comes to review the defined system. Also, the owners of buildings in the service sector and industry, which are subject to new regulations are required to finance measures in order to meet legal obligations.
The municipality, in accordance with the Law on Energy Efficiency, has an obligation to provide incentives for the application of EE and RES. In addition to measures that are established at the national level, the municipality may define specific measures to increase the use of RES and EE which creates a stimulating environment for their faster implementation. Measure M4, encouraging the use of RES and EE increase is implemented together with measures in the area of new production facilities, P.2 measure, as well as measures for households D.2. and D.3 where it is necessary to define incentives to promote greater use of renewable energy sources and increasing energy efficiency. Technologies that need to be encouraged as described in Chapter 8.
It is proposed that the Municipality for the construction of new facilities on its territory uses reducing of communal fees for facilities to implement these measures. Incentive measure can be stimulating, but has given good results in the territories of other local governments that have implemented. In addition, incentive schemes can be implemented funded by the local budget, and in cooperation with donor institutions. Incentives should be used to implement measures for citizens and households and legal entities of the municipality. Detailed budget to fund technologies that are encouraged by the Municipality to be defined in three-year programs EE.
9.2.3.1 Households
Improving of ways of using firewood in households, measure D1, is achieved with a measure P.2, and do not require special funding for its implementation.
Implementation of measure D2 and D3 should be encouraged by the Municipality and the Ministry responsible for energy affairs, so as to co-finance implementation of EE measures for buildings as well as energy-efficient replacement unit.

LOCAL ENERGY PLAN
9.2.3.2 Service sector9.2.3.2.1 Public services
Described measures of EE, measures U.1 - U.3, public services:
Establishment of an information system and power management of the municipality;
The adoption of plans and programs and implementation of EE measures and
Inclusion of energy efficiency guidelines in local spatial planning documents.
They must be fully funded by the local government. Detailed budget for the financing of these measures by the local government is required to define the three-year programs in EE, which defines the obligation of all local governments. Projects defined by EEprograms can be financed and by the establishing of public-private partnerships on the way to a third party enters into an agreement on energy performance, as explained in section 9.1.
Turning guidelines EE in local spatial planning documents, U.3 measures are required for local government bodies, and does not require special funding for their implementation.
9.2.3.2.2 Commercial services
The plan also provides the measures to improve EE in commercial services, which measures are described in the section explaining cross-sectoral measures. Financing of the measures is the responsibility of the administration which perform commercial services. You can not predict separate incentives for improving the energy efficiency measures this sub-sector, but also the incentives established by the local government or the competent ministry should provide and their use by commercial providers.
9.2.3.3 Industry
Proposed measures for the implementation of the EU in the industrial sector are financed by the authorities that govern these industrial facilities. Measures may be financed from its own funds, seeking favorable credit lines for their implementation, as well as funding from a third party in accordance with Subchapter 9.1. During the implementation of this plan incentives to energy efficiency in the industrial sector have not been envisaged, and general incentives for improving energy efficiency and greater use of renewable energy, M.4 measures should define the conditions under which they can be utilized in the industrial sector.
9.2.3.4 Traffic
Measure S1, EE improvement in traffic is mostly implemented at the national level, so that this plan does not provide for specific financial resources for its implementation. Under this measure the gradual replacement of the fleet with more efficient vehicles that need to be funded by the government are involve, ie for companies whose work is used fleet with certain incentives from the national level.
Measure S.2, improving transport infrastructure is implemented in other capital assets, so for its implementation are not provided special funding of this plan.

LOCAL ENERGY PLAN
When implementing new measures local governments may seek financial assistance from international or EU funds and international programs of local governments, given that the implementation of these measures affect not only the sustainability of local energy, reducing dependence on imported fossil fuels and emissions of greenhouse gases but also helps raising citizens' awareness and changing their behavior towards energy use.
9.2.4. Measures to increase awareness and raising of informing
Measure N1 that affects general awareness raising and informing of citizens, including public discussions, events and info line operation, are funded by the local government and the national budget, help of other actors such as international institutions, local companies, etc.
On the other hand, the rate of N2, which is related to increasing of informing and raising of awareness about energy and resource efficiency as well as the proper use of technology by employees is funded by the institution / company where workers are employed and whose staff trains.

LOCAL ENERGY PLAN
10. SUMMARY
The objectives of the Plan and roadmap
The objectives of the Local Energy Plan are: Define the current state of the consumption and production of electricity and
energy in the municipality of Niksic, and plan for future energy needs (Chapters 1-5);
Identification of the potential for more efficient use, distribution, and energy production and energy, as well as the use of its own natural resources to meet energy needs of energy production in the municipality of Niksic (Chapter 6);
Defining activities taking into account the current state of development priorities of the municipality of Niksic, resources and planned future consumption, are steps towards sustainable energy development in the municipality of Niksic (Chapters 7-9).
Defining activities which taking into account the current state of development priorities of the municipality of Niksic, resources and planned future consumption, are steps towards sustainable energy development in the municipality of Niksic (Chapters 7-9).
The way to achieve these objectives, specific activities, the roadmap is provided in Chapter 8, through the definition of measures for the further development of the energy sector in accordance with the defined objectives. Local energy plan is a formal, legally binding document of local government and therefore the objectives, activities and limits defined in this plan represents a commitment of the local self-government.
In this plan of 2011. was taken as a reference because it is the largest number of data statistically documented and available for that year, from the state list (demography, employability, housing), Studies on the consumption of fuel wood and so on. With regard to the legal obligation to local energy plans are prepared for a ten-year period, this plan contains projections for the year 2025, with a presentation of the energy balance for 2018.
As a documentary basis of energy projections were used baseline study of spatial plans and data collected during the preparation of this plan with the help of the Working Group of local government and other reference sources. However, despite the efforts of processor, an input data to the conclusion of this document have not been able to provide. Missing data more relevant to energy balances are approximated by empirical estimates of the reference literature. Pored nedostatka pouzdanih podataka o potrošnji energije u industriji i komercijalnim uslugama, nijesu na raspolaganju relevantni podaci o nekim objektima koji su u nadležnosti državne ili lokalne samouprave. In addition to

LOCAL ENERGY PLAN
the lack of reliable data on energy consumption in industry and commercial services are not available relevant data on some objects that are under the jurisdiction of state or local government. That would be the basis for the introduction of the energy management system that would be able to monitor the consumption of buildings in local government.
Systems for energy supply
Consumers of Niksic municipality are supplied with electricity, petroleum products (motor fuels and heating oil), wood fuel and charcoal.
The territory of the municipality of Niksic is supplied with electricity from the transmission system with 110kV transmission line Trebinje-Vilusi- Niksic, Perućica - Niksic 3 three transmission lines and substations TS 110/35 kV Vilusi I TS110 / 35 Niksic – Željezara. Installed capacity of transformers in the TS 110 / 35kV Vilusi 10mV, and TS110 / 35 Niksic 93MVA to 126MVA and distribution for the Zeljezara Niksic.
Area ED Niksic is characterized by a very large area and dissection of consumption, and the concept of supply to customers is realized through 110/35/10 kV system transformation.
Transmission network in the field of Niksic is difficult to observe as a separate entity, because it is part of the electricity transmission system in Montenegro. The whole area except for the part about Vilusi is powered from a single 110 kV supply point, 110/35 kV TS Nikšić which is the oldest transformer stations in Montenegro (in operation since 1956) with the transformer units 63 and 3 x 10 MVA (three single-phase transformers), while the 110/35 kV substation Vilusi (one transformer capacity of 10 MVA) powered only Vilusi area. Power supply of region (as well as the Željezara Niksic) is implemented by three 110 kV transmission line from TS Perućica to Niksic and 110 kV power line between TS and TS Niksic Trebinje, located in BiH in which the rigid connection associated TS Vilusi.
Supply of motor fuels and LPG is provided over 8 petrol stations (owned by 3 '' Jugopetrol AD Kotor, '' BS 'Neksan DOO' 'BS' Gitanes' 'BS' 'Z-Petrol' 'BS' Petrol Vjeniko '', BS 'Petrol' ').
Supplying wood energy is predominantly of retailers (67 568 m3, or 69%), while the remaining 30 357 m3, or 31% of their forests.
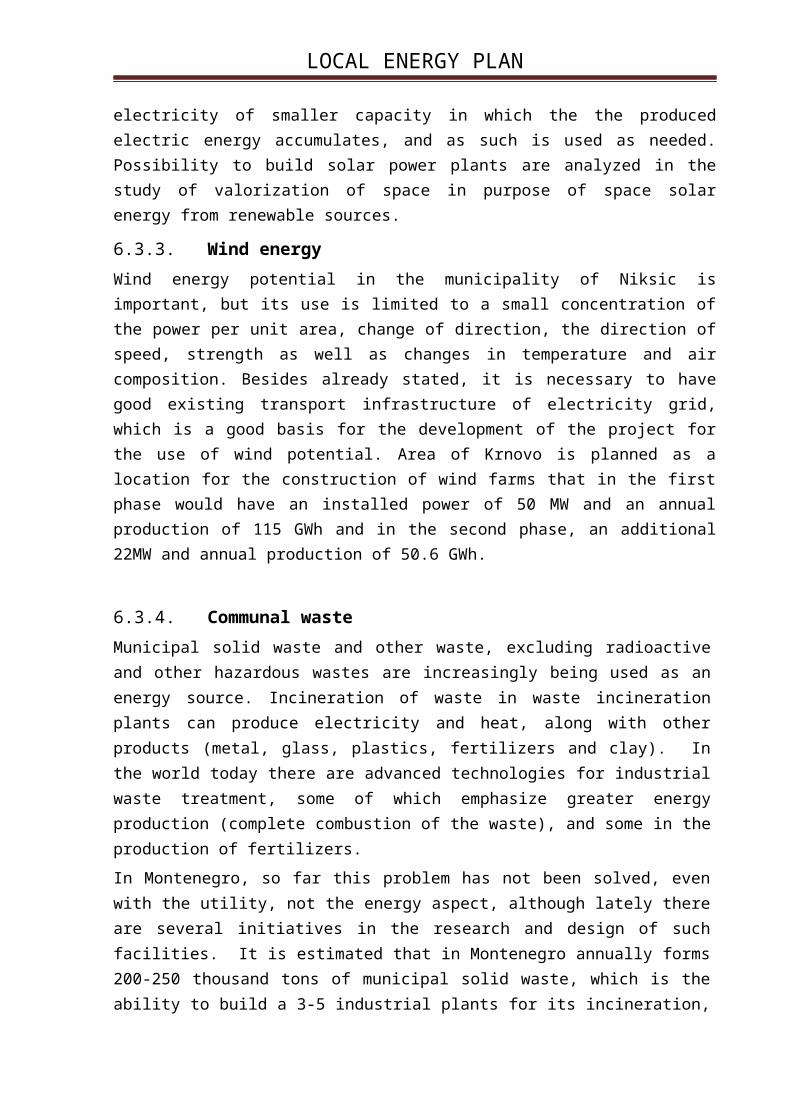
LOCAL ENERGY PLAN
The balance of the final consumption of 2011. by energy
The balance of the final consumption of 2011. 5 makes energy and electricity (193 GWh), motor fuels (21,200 t), firewood (101 843 m3), heating oil (1020 t) and coal (4 760 t). The equivalent units of total final consumption in the municipality of Niksic 2011 was 2655.39 TJ.
Emissions of greenhouse gases
The inventory of greenhouse gas emissions (GGE) refers to the final energy consumption. Based on the balance of energy consumption for the base year 2011, which is analyzed in detail in the previous chapter, and defined emission factors for a particular type and manner of use of fuels (IPCC), was calculated level of emissions expressed in CO2 equivalent . Total emissions GGE are estimated at approximately 188.4 Gg CO2 eq, which is approximately 5.7% of total emissions GGE Montenegro.Great dominant share in total emissions GGE has the power consumption. Reducing emissions GGE caused by power consumption is achieved by improving energy efficiency in the dominant consumers of electricity and construction of renewable energy sources.
After consumption of electricity, the most important part of the emissions GGE has a consumption of fuels (37.2%). Given that almost the entire consumption of fuels belongs to the transport sector when the final energy consumption is concerned, it is clear that the reductions achieved GGE together with measures to improve energy efficiency in this sector.
Forecast of energy balance by 2025.
Niksic economic realities of the past year was marked by the privatization of the largest collective, some of which were implemented successfully and some not. All countries in transition are faced with the initial constraints for development of entrepreneurship and small and medium-sized enterprises, such as the low level of business knowledge (especially in the field of management), regulatory and administrative barriers, limited access to available sources of funding, inadequate access to sources of business and market information and restrictions on the availability of specialized business services.
According to the relevant estimates, the trend of energy consumption is in parallel with GDP growth will continue in the foreseeable future. In the period from 1980 to 2008 at the global level for every 1 percent increase in GDP growing demand for energy in the percentage of 0.59%. Here for the prognosis is not possible to apply a similar correlation

LOCAL ENERGY PLAN
because since 2004. in statistical yearbooks Montenegro does not show the GDP at the municipal level.
The development of agriculture, animal husbandry, agriculture, industry and tourism conditional increase in the consumption of fuel, so the average annual growth rate of fuel to be 1.2%.
Also, due to the intensification of industry, commerce and the increased volume and quality of tourism and other services, while reducing network losses to 5-7% and applying other energy efficiency measures, it is reasonable to assume an annual growth rate of electricity as well as at the national level of 1.3 %.
Based on the results forecasts, final consumption to 2018 g. TJ would be 2838.18 and 2025. 2976 TJ. The average annual growth rate of final energy consumption by 2025 for the Municipality of Nikšić would amounted to 0.93%.
The energy potential of the Municipality
In this plan are analyzed in detail the possibility of using energy efficiency measures in sectors households, services, industry and transport, as well as the potential of renewable energy sources in the municipality.
Analysis of the possibilities of application of EE measures in final energy demand sectors: households, services, industry and transportation are provided in this chapter. However, before the sectoral analysis are discribed possibilities of energy savings in buildings that are common to the household sector, industry and services.
Due to the high energy consumption in buildings EE is a priority of today's architecture and energy. The greatest potential for energy and environmental savings is in the field of heating and cooling of residential and non-residential buildings. A number of international regulations and local strategies and action plans for EE, pointing to the urgent need to implement technical standards and exploitation measures to reduce energy consumption in buildings, even to the level of so-called. zero energy consumption. The application of EE measures and standards in the design phase and construction, including energy certification of buildings contributes not only to a more comfortable stay in the building, but its longer life and environmental protection.
Given that Montenegro as a member of the Energy Community undertook obligation to. achieve energy savings of 9% until 2018 y. EU directives and national legislation specifically obliges local government to lead by example in demonstrating and implementing energy efficiency measures. Thus, Article 7 of the Law on Energy Efficiency oblige local governments that for a period of three years, bring the EEI program which, in addition to the dynamics and resources included:
• plan adaptation and maintenance of buildings that used to carry out the activities of local authorities, public services and public companies, founded by the local government;

LOCAL ENERGY PLAN
• plans for improving the system of utilities (public lighting, water supply, waste management and transport);
• specific energy efficiency measures in buildings that are protected as a monument.
While in the building sector have the greatest potential for energy savings (at least 25% of current energy consumption), the plan has noted opportunities for energy savings in other sectors of consumption. In doing so, considering the high share of fuels in the balance of 34% in greenhouse gas emissions by 37.3%, a significant savings would be achieved in the transport sector.
Niksic Municipality has natural resources that can be used to produce energy at the local level. Among these resources are significant: the potential of solar energy, hydropower potential, wind potential, the potential utilization of biomass in a sustainable way and the possibility of eventual use of residue from agriculture and livestock farming and waste.
In the municipality of Niksic is located HE Perućica not far from Chapter of Zeta, which uses water Niksic field. Catchment area Niksic field covers an area of 850 km2 in the topographical sense, while the catchment area is 1170 km2. With built-in dual turbines with total installed capacity of 307 MW.
The plant has seven aggregate total installed capacity of 307 MW, but due to the inadequate response of turbine can currently only work with 285 MW.
In addition, at Perućica think about the installation of the unit in the eighth power, strength of 58.5 MW, which would increase the expected production of hydroelectric power. According to the analysis Energoprojekt that increase would amounted to 13.2 GWh / year, according to the analysis of EPCG 31.8 GWh / year.
Planned construction of 400 kV transmission line Tivat - Brezna - Podgorica, and 400/110 Brezna get to another trusted connection Municipality of Niksic 110kV transmission line Brezna - Niksic. This substation is necessary to connect Wind Farms in Krnovo to the transmission system. It is planned construction of 110kV transmission line Brezna-Krnovo.
The planned development of the 35kV network provides for the transition 10kV switchgear Duklo in 35/10 Duklo thus significantly improved the supply of this part of the city. Implementation of these plans Niksic Municipality would have a good supply of electricity at 35kV level.
The realization of these plans would create the possibility of joining the eventual production capacity of electricity generation from biomass and municipal waste.
In the area of the Municipality of Niksic exist a large number of watercourses, six lakes, a lot of specific karst springs, as well as the wealth of groundwater. Hydropower potential
LOCAL ENERGY PLAN
of Niksic municipality is primarily based on the construction of small hydropower plants on rivers Zaslapnica, Zeta (Zeta with the level of backed up to the level of the lower water head of SHP Zeta), Gracanica and Grahovsko Lake (Akumulation Grahovo). Energy Development Strategy of Montenegro until 2025.god., As well as the strategy of development of small hydropower plants in Montenegro are strategic documents that support the activities of the construction, use and maintenance of small hydroelectric power plants.
The construction of small hydropower plants do not pollute the air, preventing the risk of flooding because they allow water regulation, can be used for water supply and irrigation, build a pond and sports and recreational purposes.
The entire territory of the municipality Niksic has significant potential of solar radiation that can be used to generate electricity and to heat water and space heating in some transitional periods. Annual insolation of Niksic municipality is 2200 h / year. Depending on the technology used, solar energy is used in households, industry and the hospitality industry, especially in cases where the low voltage network is not available or the quality of power supply is very low.
Wind energy potential in the municipality of Niksic is significant, but its use is limited to a small concentration of power per unit area, changing direction, the direction of speed, strength and temperature and air composition. In addition, it is necessary to have good existing transport infrastructure, electricity network, which provides a good basis for the development of the project for the use of wind potential. Area Krnovo is planned as a location for the construction of wind farms, which in the first phase would have an installed power of 50 MW and an annual production of 115GWh and the second phase, an additional 22MW and annual production of 50.6 GWh.
Municipal solid waste and other waste, excluding radioactive and other hazardous waste being increasingly used as an energy source. Incineration of waste in waste incineration plants can produce electricity and heat, in addition to other products (metal, glass, plastics, fertilizers and clay).
The objectives and the concept of the Energy Development Municipality
Strategic Development Plan of the Municipality of Niksic defines vision as medium developed municipalities with low levels of unemployment and better living conditions secured by increased economic activities of small and medium enterprises and a sustainable way of using natural resources. In order to achieve this vision defined four priorities for development include: improved economic production system and growth of living standards, infrastructure and spatial planning of the territory, preserving the environment and improving the functioning of public services and social life of the citizens.
Sustainable energy development is pervasive through all these priorities as one of the preconditions for their realization. Therefore, one of the conditions for the development

LOCAL ENERGY PLAN
of defined economic sectors improve the quality and security of energy supply, which also affects the improvement of living conditions, improving the functioning of public services and infrastructure development of the municipality. Implementation of energy efficiency measures especially in households and buildings used for public services helping to improve living conditions and quality of public services. Finally, the development of distributed energy helps the economic development of the Municipality which affect the possibility of the realization of planned objectives. Therefore, sustainable development of energy should be encouraged achieving the vision of development of the Municipality through increased local production of energy, more efficient distribution of energy as well as more efficient use of energy in all sectors of consumption, especially the household sector and public services.
Due to the above, the concept of local energy development in the municipality of Niksic is based on:
Provide high-quality and constant access to energy;
Using local resources to produce energy and energy products;
Increased efficiency in production and distribution of electricity and heat;
Efficient use of energy, electricity and heat, and energy in all sectors, with emphasis on;
Increasing the capacity of municipal services to monitor energy projects and
Reducing the level of growth in consumption of motor fuels.
In order to achieve this sustainable energy concept of the Municipality of Niksic to 2025 g., In this plan for all areas of the system from the supply of energy to informing citizens, are defined a total of 10 goals.
In accordance with the above are defined the following objectives of the system for the supply of energy.
C.1. Improving the quality of electricity supply by reducing the cumulative duration of the outage final customers in accordance with the standards of quality of electric energy supply until 2025..
C.2. . Reduction of losses in the electricity network to 6% of the total electricity supplied by 2025.
The objectives of energy production are:
C.3. Production of electricity by building power plants of at least 30% more than current production until 2025;

LOCAL ENERGY PLAN
C.4. The increase in capacity for the production of wood fuel pellets, briquettes and chips production capacity of at least 10,000 t / yr by 2025 .;
Increase EE promote the following objectives:
C.5. Constant monitoring of energy consumption in public buildings and businesses by reducing final energy consumption in public services by 20% by 2025.
C.6. Replacing energy-efficient equipment for heating in households and the service sector by 2025. 10% of primary energy consumption;
C.7. Improving the energy performance of buildings, ie. in all buildings used for public services with built-in insulation and 20% of residential buildings by 2025. saving 7.5%;;
C.8. Increasing the efficiency of traffic organization of public transport and the use of more efficient vehicles by 2018 g. With savings of 5% of the consumption in the transport sector, savings of up to 2025 g. 0.7% of primary;
The objectives of the awareness of citizens:
C.9. Increased percentage of informed citizens on the effective use of resources in the municipality and the possibilities to 30% by 2018, and to 60% by 2025;
C.10. Organized and established practice of education on efficient use of energy and the proper use of processes and technologies by all enterprises in the services sector and industry by 2018.
For the realization of the above objectives in Chapter 8 detaily is specified 23 concrete measures, namely: 4 measures in the field of improvement of energy supply, three measures in the field of increasing energy production and 16 sectoral measures in the field of improving energy efficiency. For each measure defines entities responsible for its implementation, priority level, indicators of realization. Particularly are specified cross-sectoral measures to improve energy efficiency in the municipality, which are interdependent with measures at the national level.

LOCAL ENERGY PLAN
Sources of Funding
Indicative financial requirements and sources of finance said measures are discussed in Chapter 9. Depending on the energy sector, administrative competence and ownership are closely analyzed models of financing. The municipality, in accordance with the Law on Energy Efficiency, has an obligation to provide incentives for the implementation of energy efficiency and use of renewable energy sources. In addition to measures that are established at the national level, municipalities can define specific measures in these areas that create a stimulating environment for their faster implementation.
An important source of funding are EU and international funds such as the Global Environmental Fund (GEF), the Sustainable Energy Initiative (SEI) Sustainable Energy for All and others. These are the funds of the grant of international banks. Also, international banks are offering technical assistance and financial support for the realization of projects, such as the European Investment Bank (EIB), the European Bank for Reconstruction and Development (EBRD), German Development Bank (KFW) and others.
Also, as the local government in order to exchange experiences and to assist in finding funding for the implementation of energy projects that promote sustainable development, the municipality can join international associations and programs to support the development of sustainable energy at the local level.
By following the above guidelines municipality will provide the energy, economic and environmental optimum development of local energy. The adoption of this plan, the municipality takes active participation in controlling and encouraging the development of energy, aware that energy development is one of the main pillars of its economic and overall development.
LOCAL ENERGY PLAN
LOCAL ENERGY PLAN
BIBLIOGRAPHY
Laws:
[ 1. ] Energy Law („Službeni list CG“, br. 28/10)
[ 2. ] Law on Energy Efficiency („Službeni list CG“, br.29/10)
[ 3. ] Law on ratification of the Agreement between the European Community and the Republic of Montenegro on establishing the Energy Community („Službeni list CG“, br.66/06)
[ 4. ] Law on Spatial Planning and Construction („Službeni list CG“, br. 51/08)
[ 5. ] Environmental Law („Službeni list CG“, br. 48/08)
[ 6. ] Law on Concessions („Službeni list CG“, br. 08/09)
[ 7. ] Water Act („Službeni list RCG“ br. 27/07, „Službeni list CG“ br. 32/11 i 47/11)
[ 8. ] The Law on Regional Development („Službeni list CG“, br. 20/2011)
[ 9. ] The Law on Local Self-Government ("Službeni list RCG" br. 42/03, 28/04, 75/05, 13/06, "Službeni list CG“ br. 88/09, 03/10 i 38/12 )
[ 10. ] Law on Waste Management („Službeni list RCG“ br. 80/05)
[ 11. ] Law on National Parks („Službeni list RCG“ br. 47/91, 17/92 i 27/94)
[ 12. ] Law on ratification of the Kyoto Protocol („Službeni list RCG“ br. 17/07)
[ 13. ] Law on Forests („Službeni list RCG“ br. 74/10)
[ 14. ] Law on Classification of Activities and Registry of Classification Units ("Službeni list SRJ", br. 31/96, 34/96-ispr., 12/98, 59/98 i 74/99)
[ 15. ] Classification of Economic Activities 2010 - Statistical Classification of Activities of Montenegro with explenation- MONSTAT, 2011.
Strategies and action plans
[ 1. ] Energy Policy of Montenegro until 2030, the Ministry of Economy, 2011.
[ 2. ] The Energy Development Strategy of Montenegro by 2025 (White Paper), Ministry of Economy, 2007.
[ 3. ] The Energy Development Strategy of Montenegro by 2030 (Green Paper), the Ministry of Economy, 2012. Reviews.
[ 4. ] The Energy Development Strategy of Montenegro by 2025 - Action Plan (2008-2012), the Ministry of Economy, 2008.
[ 5. ] The Strategy of development of small hydro power plants in Montenegro, Transformers,.
[ 6. ] The strategy of valorization of space for the purpose of producing energy from renewable solar resources, vision development of solar photovoltaic farms in

LOCAL ENERGY PLAN
Montenegro, Government of Montenegro, 2011.
[ 7. ] Action Plan for Energy Efficiency - EEAP, 2010-2012, the Ministry of Economy, 2010.
[ 8. ] National Strategy for Sustainable Development of Montenegro, 2007.
[ 9. ] The Regional Development Strategy of Montenegro, 2010-2014, the Government of Montenegro, 2011.
[ 10. ] Spatial and urban plan of the Municipality of Niksic.
Rules, regulations, directives and the EU
[ 1. ] Regulation on Criteria for Issuing Energy Permits, Contents of the application and the register of authorizations (“Službeni list CG”, br. 49/10);
[ 2. ] Regulation on detailed conditions to be met by a legal entity to measure and explore the potential of renewable energy sources (“Službeni list CG”, br. 28/11);
[ 3. ] Ordinance on the content of the report on the implementation of the plan to improve energy efficiency in local governments, the Ministry of Economy, 2011.
[ 4. ] Regulation on the information system of energy consumption and how to provide data on annual energy consumption, the Ministry of Economy, 2012.
[ 5. ] Regulation on Border Regulations on limit values of energy consumption for the determination of large consumers, content EEI plans and reports on the implementation of the plan, the Ministry of Economy, 2012.
[ 6. ] Regulation on types and classification of plants for the production of energy from renewable sources and high efficiency cogeneration, ("Službeni list CG", br. 28/10)
[ 7. ] Regulation on technical conditions for connection of small power plants to the distribution network, the Ministry of Economic Development, 2007.
[ 8. ] Regulation regarding the manner of exercising the rights and status of privileged power producers (“Službeni list CG”, br. 37/11);
[ 9. ] Decree on the manner of issuance, withdrawal and transfer of guarantees of origin of energy produced from renewable energy sources and high-efficiency cogeneration (“Službeni list CG”, br. 37/11);
[ 10. ] Decree on the tariff system for determining the incentive price of electricity from renewable sources and high efficiency cogeneration (“Službeni list CG”, br. 49/11);
[ 11. ] Decree on the tariff system for determining the incentive price of electricity from renewable energy sources and high efficiency cogeneration (Proposal), the Government of Montenegro ,2011.
[ 12. ] Guidance on energy efficiency measures and guidelines for their implementation, the Ministry of Economy, 2012.

LOCAL ENERGY PLAN
[ 13. ] Instructions on establishing the methodology for calculating the indicative target to improve energy efficiency, the Ministry of Economy, 2011.
[ 14. ] The rules for the functioning of the electricity distribution system, Elektroprivreda Crne Gore AD Niksic, 2012.
[ 15. ] Directive 2012/27/EU of the European Parliament and of the Council on energy efficiency, amending Directives 2009/125/EC and 2010/30/EU and repealing Directives 2004/8/EC and 2006/32/EC
[ 16. ] The Directive on the energy performance of buildings 2002/91/EC (EPBD)
[ 17. ] The Directive on the energy performance of buildings (010/31/EU EPBD)
[ 18. ] MEST EN ISO 50001 Energy management systems - Requirements with guidance for use.
Studies and other primary sources
[ 1. ] Study on connection and operation of distributed energy resources in the power system of Montenegro
[ 2. ] Montenegro in XXI century - in the competitiveness era, Montenegrin Academy of Sciences and Arts (73/1), 2010.
[ 3. ] Estimation of the potential of renewable energy sources in Montenegro, CETMA, 2007.
[ 4. ] Resource Map that includes the natural and cultural characteristics, geographical location, human and other resources to the evaluation of optimal directions of specialization in the region of Montenegro, the Government of Montenegro, 2011.
[ 5. ] The wood fuels: types, characteristics and benefits for heating, SNV, Podgorica 2011.
[ 6. ] The consumption of wood fuel in 2011 in Montenegro - A new energy balances for wood fuel, , 2013.
[ 7. ] Data on consumption of electricity (EPCG), reports energy audits and other data collected by the Working Group.


