31
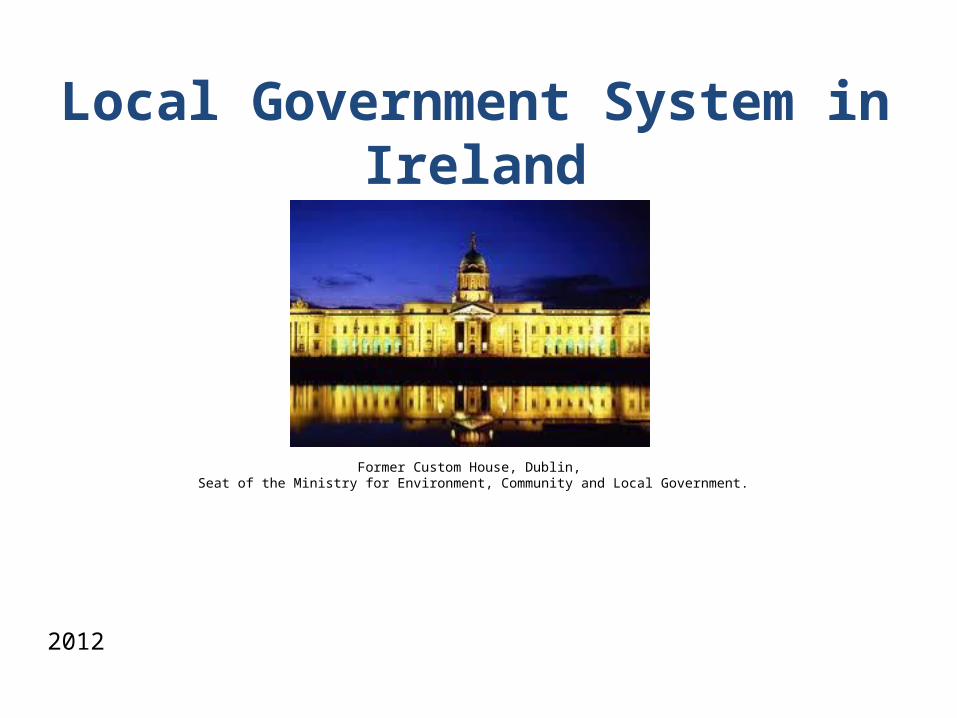
Local Government System in Ireland Former Custom House, Dublin, Seat of the Ministry for Environment, Community and Local Government. 2012
| Date post: | 26-Dec-2015 |
| Category: |
Documents |
| Upload: | howard-hicks |
| View: | 218 times |
| Download: | 0 times |
Local Government System in Ireland
Former Custom House, Dublin, Seat of the Ministry for Environment, Community and Local Government.
2012

Ireland: Basic Facts• Population: 4.6 million• Capital: Dublin / Baile Átha Cliath (1.2 million)• Surface Area: 70,208 km2• Population Density: 65 person / km2• GDP / Capita: €29,959• Public Finance Deficit: 90%+ of GDP• Currency: Euro• Main Exports: PharmaChem, ICT & Software, Food
Products.• Language: Irish (official) English (most widely spoken)

Since the partition of the island in 1921, Ireland (Éire) shares a border with Northern Ireland (UK).
The Belfast / Good Friday Agreement of 1998 has been endorsed by the peoples of both jurisdictions. This guarantees the current constitutional status of Northern Ireland and has established a devolved administration for Northern Ireland and north – south collaborative bodies.

Context: Political
• Declaration of Independence, 1919.• Secured Status of ‘Free State,’ 1922.• Current Constitution, 1937 - • Formally Declared a Republic, 1949.• Joined EU, 1973.
The flag of Ireland / Éire is green white and orange.Green represents Nationalism.Orange represents Unionism.White represents peace between both political traditions.The flag is modelled on the French tricolour.

Context: Institutional• Constitutional Status: Parliamentary Republic.• Head of State: President (7 year term).• Parliament: Bicameral (max. term of 5 years):
– Upper House elected by sectoral interests– Lower House universal franchise
• Centralised State – limited local self-government.
Áras an Uachtaráin, Official Residence of the PresidentInterior of Dáil Éireann, Lower House of the Irish Parliament (Oireachtas Éireann).
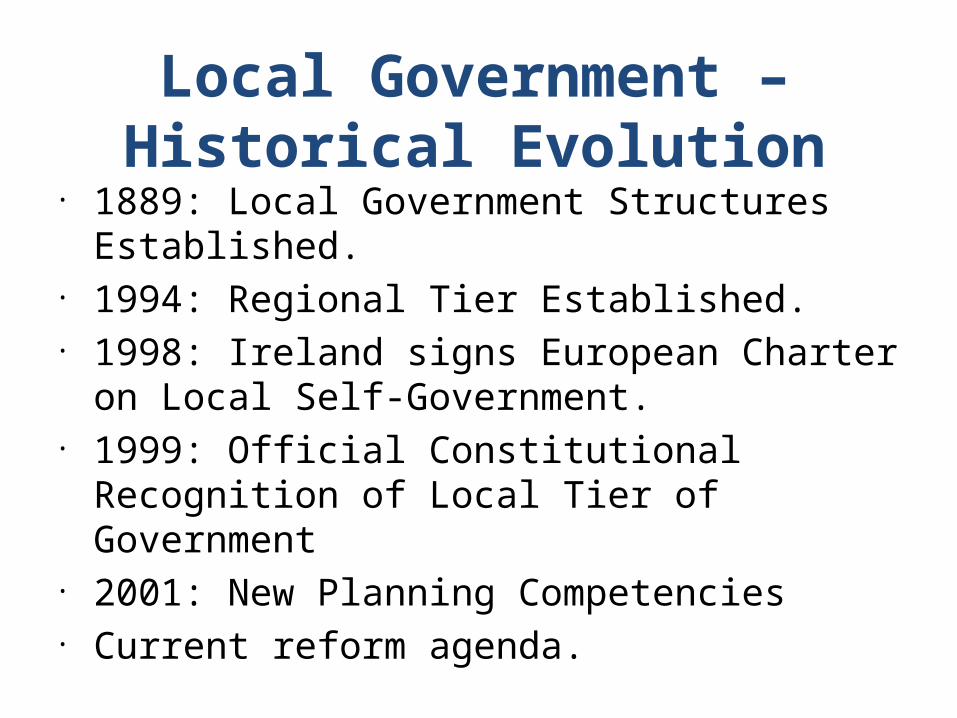
Local Government – Historical Evolution
• 1889: Local Government Structures Established.• 1994: Regional Tier Established.• 1998: Ireland signs European Charter on Local Self-
Government.• 1999: Official Constitutional Recognition of Local Tier
of Government• 2001: New Planning Competencies• Current reform agenda.

Cliquez pour éditer le format du plan de texte Second niveau de
plan Troisième
niveau de planQuatrième
niveau de plan Cinquièm
e niveau de plan
Sixième niveau de plan
Septième niveau de plan
Huitième niveau de plan
• Neuvième niveau de planClick to edit Master text styles
– Second level• Third level
– Fourth level» Fifth level
Ireland – Territorial System: Counties
Strongest Tier of Local Government.Directly Elected Councillors.
• 27 County Councils.• +3 New Councils (1994) due to
sub-division of Dublin.• 5 City Councils

Cliquez pour éditer le format du plan de texte Second niveau de
plan Troisième
niveau de planQuatrième
niveau de plan Cinquièm
e niveau de plan
Sixième niveau de plan
Septième niveau de plan
Huitième niveau de plan
• Neuvième niveau de planClick to edit Master text styles
– Second level• Third level
– Fourth level» Fifth level
Ireland – Territorial System: Regions
Newest Tier of Local GovernmentEU InfluenceComprised of groupings of counties
Main Functions• to promote the co-ordination of public
services at regional level, • to prepare Regional Planning Guidelines and
review regional development needs.• to encourage county and city compliance
with regional priorities.

Cliquez pour éditer le format du plan de texte Second niveau de
plan Troisième
niveau de planQuatrième
niveau de plan Cinquièm
e niveau de plan
Sixième niveau de plan
Septième niveau de plan
Huitième niveau de plan
• Neuvième niveau de planClick to edit Master text styles
– Second level• Third level
– Fourth level» Fifth level
Ireland – Territorial System: Regional Assembly Areas
• Two regional assembly areas:– Objective 1 in transition (2000 –
2006 ) South and East Regional Assembly Area - S & E
– Objective 1 (2000 – 2006) Border, Midlands, West Regional Assembly Area - BMW
– Note: these NUTS 2 regions which are made up of a number of regional authority areas do not constitute regional governments
Main Functions• to promote balanced regional
development• to monitor and co-ordinate spatial
planning

Authority No. Members Mandate Geographical Remit Functional Remit Central Government Interface
Regional Assembly
26 appointed by City and Council Councils
5 years BMW (Border, Midland and Western) Region, 13 Counties qualifying for Objective I status to 2006S&E (Southern and Eastern) Region- non Objective I.
Monitoring of Regional Programmes under the National Development Plan
Dept. of Finance and DoECLG
Regional Authority
appointed by City and Council Councils
5 years 3 to 5 local authority areas (combined City and County Council areas).
Formulation and monitoring of regional planning guidelines and overseeing aspects of National Spatial Strategy
DoECLG
County Council
Typically 25, elected.Range from 21 to 48
5 years Full County, including areas covered by Town Councils.
Local Service ProvisionSpatial Planning
DoECLG
City Council Cork 31, Dublin 52,Galway 15, Limerick 17Waterford 15. All elected councillors
5 years Within City Boundaries only.Problem has arisen of areas being under-bounded, most notably Limerick, and Waterford. These cities, and Galway applied to government for boundary extensions.
Local Service ProvisionSpatial Planning
DoECLG
Town Council
9 elected councillors, with the exceptions of Bray, Dundalk and Tralee, with 12 councillors
5 years Within Town Boundaries only. Urban sprawl in many towns has meant that many town councils have no jurisdiction in their suburbs/ urban fringe.
Local Service ProvisionSpatial Planning
DoECLG
SPCs (Strategic Policy Committees)
Range from 10 to 20, with a majority made up of elected councillors, and the others drawn from statutory bodies, social partners, local dev. and civil society.
Begin c. One month after election of Local Authority
Same as its Parent (City / County) Council.
One of: Planning and Economic Development, Environmental Protection and Waste Management, Arts and Culture, Housing, Infrastructure (or other priority areas as defined by the Council)
DoECLG
City / County Development Boards
Range from 25 to 35, with broadly similar numbers from local government, statutory bodies, social partners, local development and civil society
As above Council Boundaries. Community and Enterprise Development
Co-Ordination and Monitoring of agency-inputs into, and delivery of an agreed, multi-sectoral strategy for the council area.
Various
DoECLG = Department (i.e. Ministry) of Environment, Community and Local Government
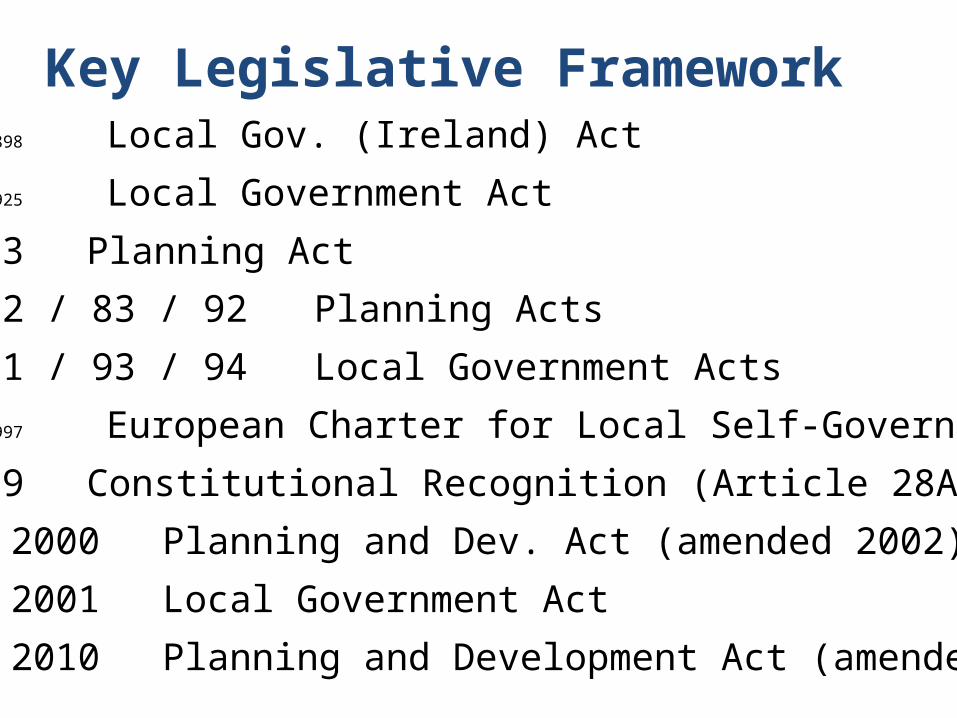
Key Legislative Framework1898 Local Gov. (Ireland) Act
1925 Local Government Act
1963Planning Act
1982 / 83 / 92 Planning Acts
1991 / 93 / 94 Local Government Acts
1997 European Charter for Local Self-Government
1999Constitutional Recognition (Article 28A)
2000Planning and Dev. Act (amended 2002)
2001Local Government Act
2010Planning and Development Act (amended)

Source: Department of Environment, Community and Local Government. www.environ.ie

Electoral Geography at County Level
• For electoral purposes, Counties are sub-divided into 3 – 8 districts (depending on demographics). These are known as ‘Electoral Areas.’
• Citizens in each ‘Electoral Area’ elect 3 – 8 councillors, who then form the County / City Council.
The following maps (next slides) illustrate the Electoral Areas in Limerick County (pop. 130,000) and Limerick City (pop. 60,000).
All EU citizens resident in Ireland may vote in local elections.

There are 28 members on the Council - 7 members in the Bruff and Castelconnell Electoral Areas, 5 members in the Newcastle and Rathkeale Electoral Areas and 4 members in the Kilmallock Electoral Area.
Council Meetings are normally held on the fourth Monday of each month(except August when there is no meeting) in the Council Chamber at County Hall. )
Election of Members to Limerick County Council
www.LimerickCoCo.ie

Local Electoral Areas in Limerick City
www.LimerickCity.ie
6 Members (Limerick North)
4 Members (Limerick East)
7 Members (Limerick South)
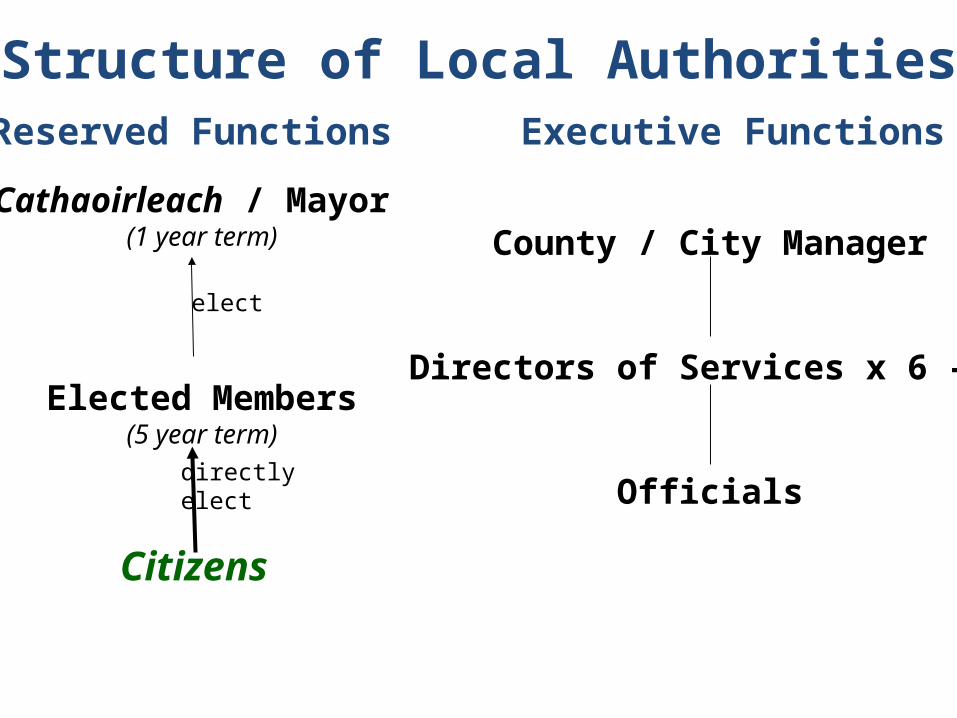
Structure of Local Authorities
Cathaoirleach / Mayor (1 year term)
Elected Members(5 year term)
County / City Manager
Directors of Services x 6 – 8
Officials
Citizens
directlyelect
elect
Reserved Functions Executive Functions

Local Government: Functions
• The principal services provided by the local authorities comprise:
– Housing and building– Road transportation and safety– Water supply and sewerage– Planning– Environmental protection– Recreation and amenities, and – to a very limited extent agriculture, education, health
and welfare.
• Local authorities have no role in policing, public transport or personal social services.

Functional Remit Housing and Building
Provision, Enforcement, Traveler Acc., Social
Road Transportation & SafetyConstruction, Improvement, Maintenance, Lighting,Traffic Management, Taxation, Licensing, Signage.
Water Supply and SeweragePublic & Group Schemes, Public Toilets
Development Incentives and ControlPhysical Planning Policy, Building – where and how,Industrial Promotion, Urban / Village Renewal
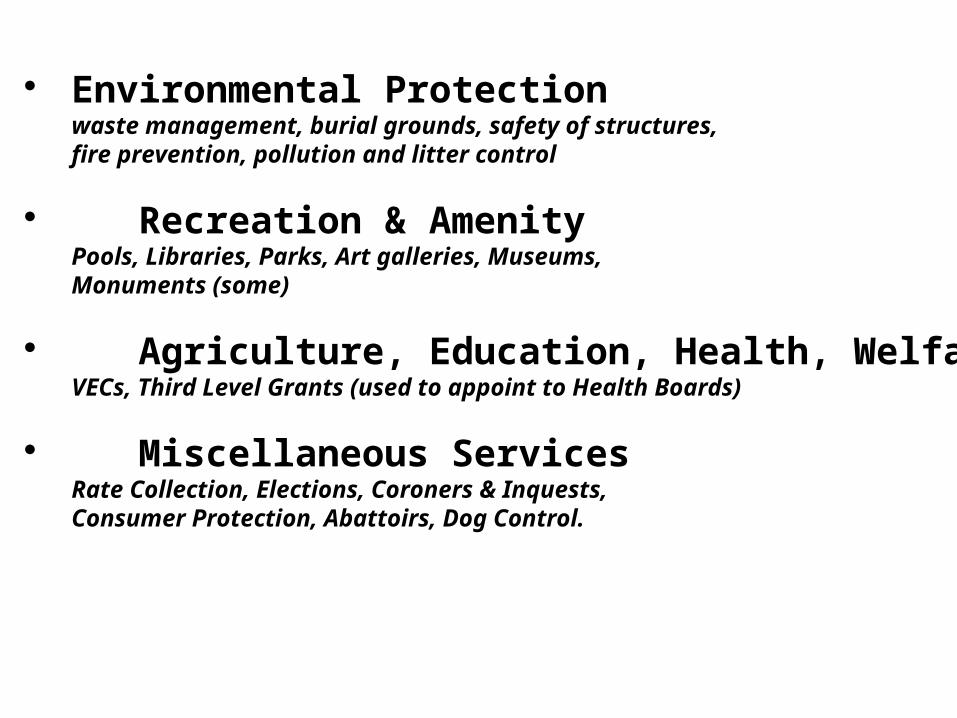
Environmental Protectionwaste management, burial grounds, safety of structures,fire prevention, pollution and litter control
Recreation & AmenityPools, Libraries, Parks, Art galleries, Museums,Monuments (some)
Agriculture, Education, Health, WelfareVECs, Third Level Grants (used to appoint to Health Boards)
Miscellaneous ServicesRate Collection, Elections, Coroners & Inquests,Consumer Protection, Abattoirs, Dog Control.

Functions Taken from Local Authorities
Health (Boards) since 2003School AttendanceCounty Committee for AgricultureNational Roads’ Projects

Rates on commercial and industrial buildings Income from goods and services (Housing Rents,
planning fees etc.) Exchequer grants Internal capital grants (sale of houses and land) Borrowing
Sources of Finance
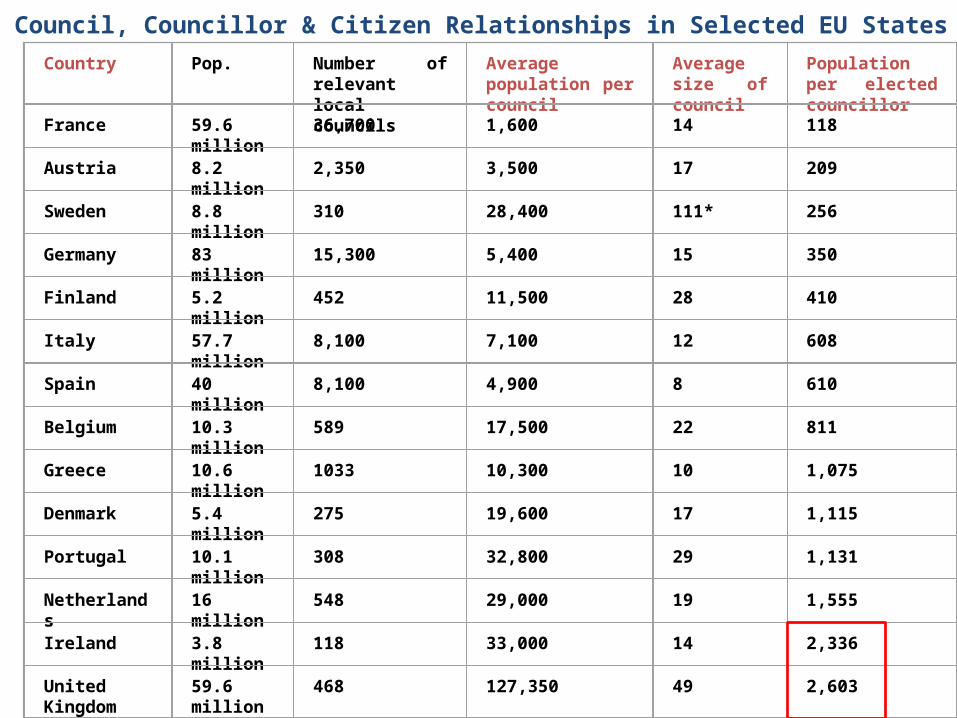
Country Pop. Number of relevant local councils
Average population per council
Average size of council
Population per elected councillor
France 59.6 million
36,700 1,600 14 118
Austria 8.2 million
2,350 3,500 17 209
Sweden 8.8 million
310 28,400 111* 256
Germany 83 million 15,300 5,400 15 350
Finland 5.2 million
452 11,500 28 410
Italy 57.7 million
8,100 7,100 12 608
Spain 40 million 8,100 4,900 8 610
Belgium 10.3 million
589 17,500 22 811
Greece 10.6 million
1033 10,300 10 1,075
Denmark 5.4 million
275 19,600 17 1,115
Portugal 10.1 million
308 32,800 29 1,131
Netherlands 16 million 548 29,000 19 1,555
Ireland 3.8 million
118 33,000 14 2,336
United Kingdom
59.6 million
468 127,350 49 2,603
Council, Councillor & Citizen Relationships in Selected EU States

Examples of EU Legislation bearing on Local Government
Urban Waste Water DirectiveLandfill DirectivePublic Procurement DirectivesWorking Time DirectiveEnvironmental Impact Assessment DirectivesWater Framework Directive
Health and Safety LegislationRecycling TargetsHabitats’ Directive
©2008 Marble Arch Caves Global Leopard
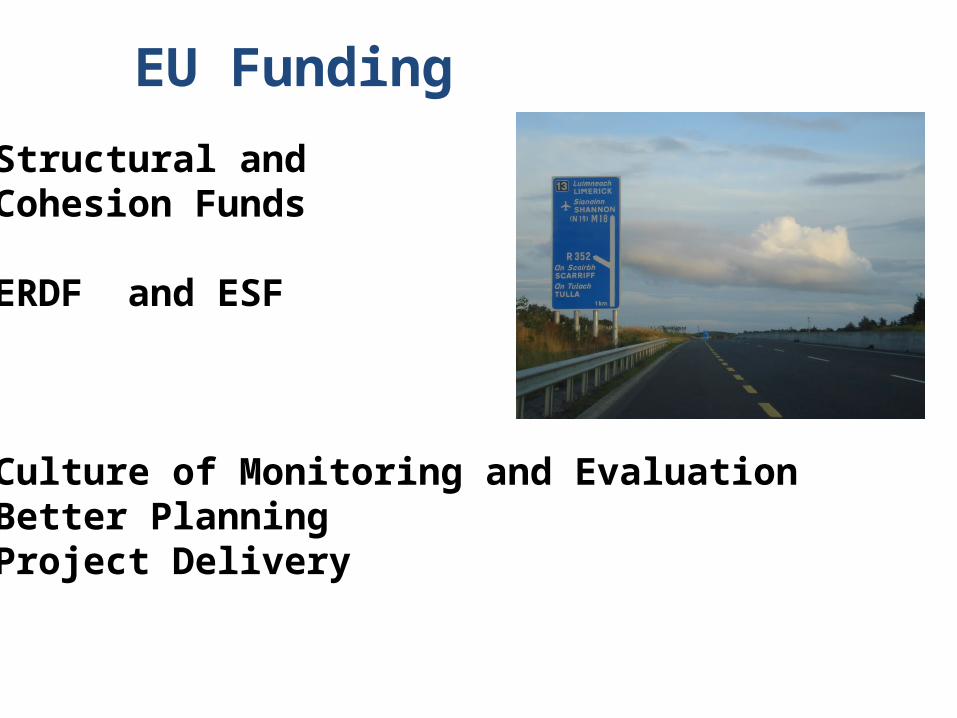
EU Funding
Structural and Cohesion Funds
ERDF and ESF
Culture of Monitoring and EvaluationBetter PlanningProject Delivery

EU-Led Institutional Reforms
Environmental Protection AgencyRegional AuthoritiesRegional AssembliesLocal Development Initiatives

Extract from 2010 Green Paper on Local Government Reform

Loca l E lections 2009
F ianna Fa il
F ine G ae l
Labour
G reen P arty
S inn Fe in
O ther
100 100 100
Local Elections 2009 Results
Percentage of the First Preference Vote obtained by Parties in each County
Fine Gael (Christian Democrats) is the dominant political party in Irish Local Government.
0 100km
N
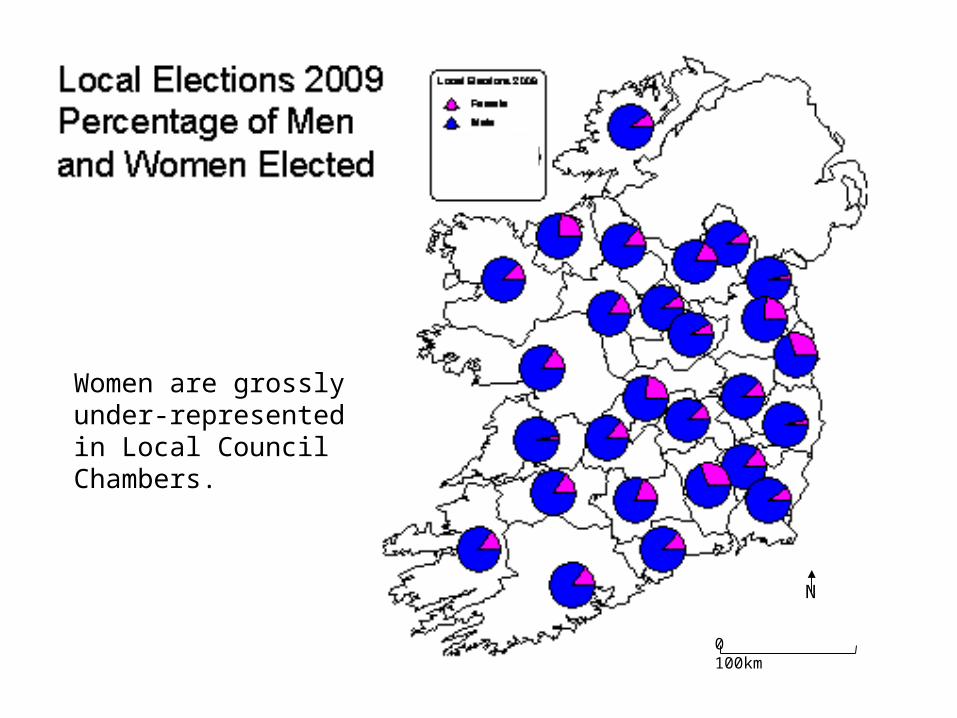
Women are grossly under-represented in Local Council Chambers.
0 100km
N

Irish Local Government in Context
Limited tradition of Local Self Government High degree of centralisation and Control by Central
Government Large local authorities (av. Pop 36,100) Single Tier – with fledgling regional tier Limited Functions and Competencies Inflexible County Delineations and Structures. Anticipated Reforms in Planning and Directly Elected
Mayors. Property Tax / Service Charge being introduced. Possible reforms to create sub-county structures.

Institutional Framework of Irish Local Government System
Domiciliary Irish and EU Citizens (aged 18 years and over)
Citizens in Urban Areas (excl. City Council Areas) All Citizens
29 County Councilswith between 21 and 48 members*
5 City Councils (Dublin, Cork, Limerick, Waterford, Galway)
with between 15 and 52 members
Council Mayor(formerly known as
Cathaoirleach)
* Most County Councils have between 23 and 28 members. Co. Cork, the largest county in Ireland has 48. The second largest council is Clare, with 32 members.
5 Borough Councilseach with 12 members
Mayor
75 Town Councilsmost with 9 memberseach
Elec
ted
by P
RSTV
fo
r 5 y
ear t
erm
Elec
ted
by P
RSTV
fo
r 5 y
ear t
erm
26 member Regional AssembliesFor 2 ‘super regions’
9 Regional Authorities
Nom
inat
e
Nom
inat
e
Appoint Nominees to
Vocational Education CommitteesHarbour CommissionersRegional Tourism AuthoritiesCity and County Enterprise BoardsLEADER and Urban Partnerships
National-level Bodies
Civil Society
Strategic PolicyCommittees
City / CountyDev. Boards
Arts’ CouncilAn Bórd Pleanala (Planning Appeals)An Comhairle Leabharlanna (Libraries’ Board)Environmental Protection AgencyFire Services’ CouncilHousing Finance AgencyLocal Government Services’ BoardsNational Building AgencyNational Roads Authority
Local-level Bodies
Mayor
Childcare Committees


