78
€100 Million Major Studio Local Slate Co-Financing Confidential Executive Summary © Saltire Entertainment, LLC 2010
| Date post: | 13-Jul-2015 |
| Category: |
Documents |
| Upload: | stuartpollok |
| View: | 169 times |
| Download: | 0 times |

€100 MillionMajor Studio LocalSlate Co-Financing
ConfidentialExecutive Summary
© Saltire Entertainment, LLC 2010

A Unique, Strategic Investment Opportunity
A slate of local films distributed in their home territories by one or more major motion picture studios.
© Saltire Entertainment, LLC 2010
France
Germany
Italy
Spain
United Kingdom

• Definitions
• International
• Growth Trends in International
• Local
• Studio Distribution
• Studio Comparisons
• Strategy
• Management
• Exhibit A
Table of Content
© Saltire Entertainment, LLC 2010

DEFINITIONS
© Saltire Entertainment, LLC 2010
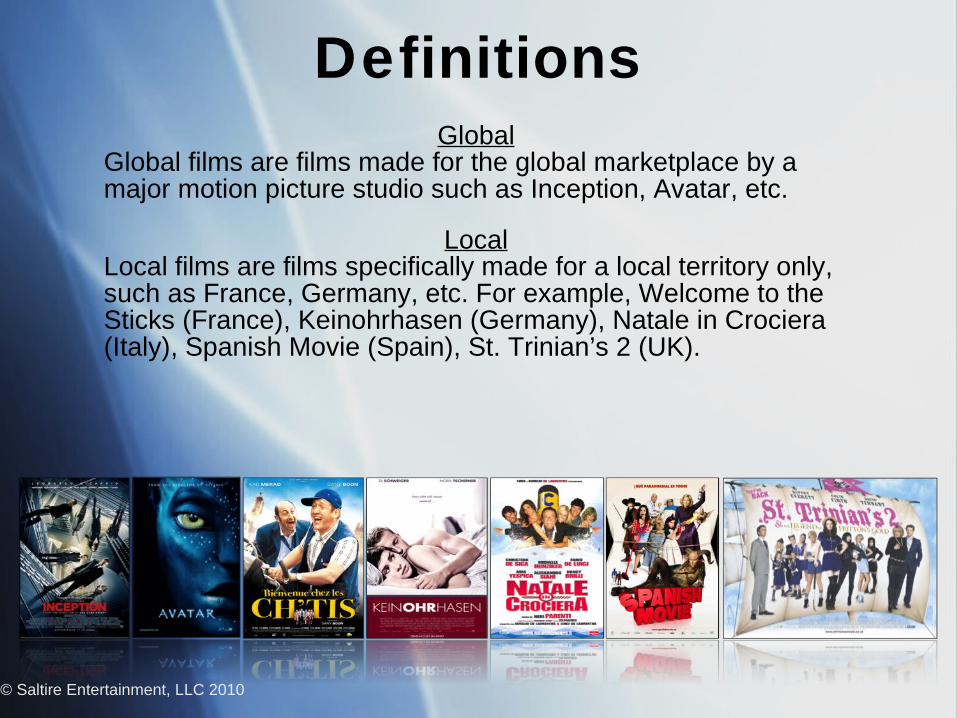
GlobalGlobal films are films made for the global marketplace by a major motion picture studio such as Inception, Avatar, etc.
LocalLocal films are films specifically made for a local territory only, such as France, Germany, etc. For example, Welcome to the Sticks (France), Keinohrhasen (Germany), Natale in Crociera (Italy), Spanish Movie (Spain), St. Trinian’s 2 (UK).
© Saltire Entertainment, LLC 2010
Definitions

© Saltire Entertainment, LLC 2010
INTERNATIONAL
© Saltire Entertainment, LLC 2010
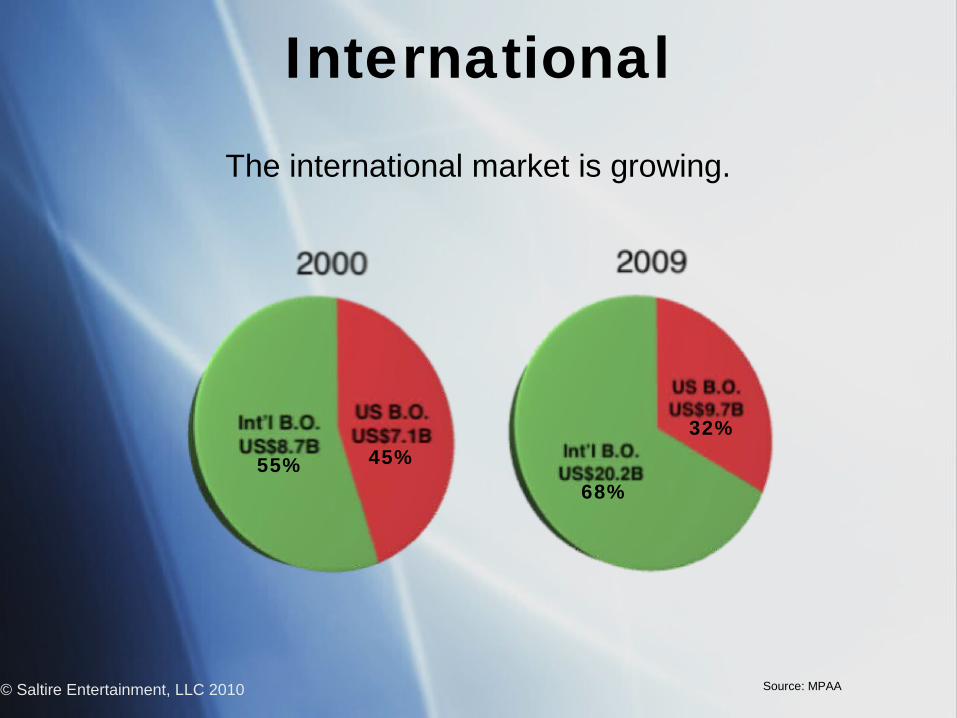
The international market is growing.
68%
32%
55% 45%
Source: MPAA
International

US Admissions
US admissions are essentially flat over the last decade.
A slight uptake in admissions in 2009 during the economic downturn is within 10-year historical parameters.
US Admissions
Source: MPAA/ European Audiovisual Observatory* 2009 are projected figures.© Saltire Entertainment, LLC 2010
International

US Box Office
• US box office is saturated and mature.
• Average annual growth of 3.2% (= total 36.6% from 2000 to 2009) is solely due to ticket price inflation, most recently fueled by the growth of 3D films.
US Box Office
© Saltire Entertainment, LLC 2010 Source: MPAA
International

Source: ESA/ MPAA/ Pollstar* US Concert Ticket Revenues are projections based on 90% of North American figures.© Saltire Entertainment, LLC 2010
US Competing Entertainment Options
Stronger overall growth in the US market is in competing entertainment options such as video games, concerts, sports and internet lifestyle.
Revenue: US Concert Ticket Revenues vs. US Video Games Software Sales vs. US
Box Office
International
International Box Office
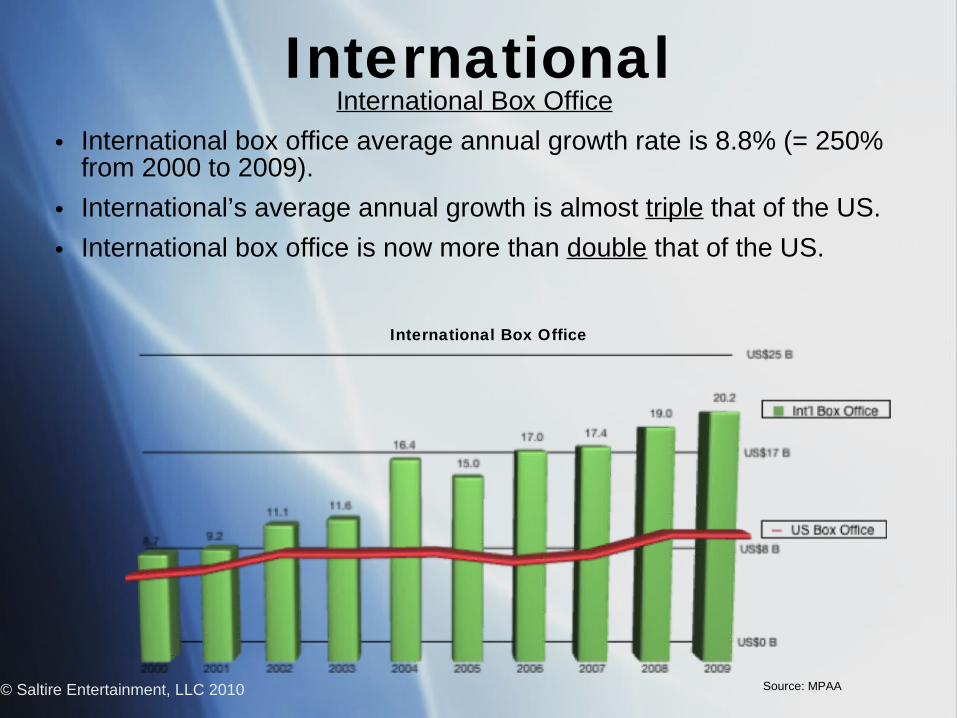
• International box office average annual growth rate is 8.8% (= 250% from 2000 to 2009).
• International’s average annual growth is almost triple that of the US.
• International box office is now more than double that of the US.
© Saltire Entertainment, LLC 2010 Source: MPAA
International Box Office
International

© Saltire Entertainment, LLC 2010 Source: MPAA
Number of Digital Screens, International vs. US
Total Screens
The total number of screens internationally and in the US is essentially flat.
11% of total number of screens worldwide are now digital.
Conversion to digital screens is expanding more rapidly internationally than in the US.
International
Summary Conclusion
International is the future growth engine of the film business.
© Saltire Entertainment, LLC 2010
International

GROWTH TRENDS IN INTERNATIONAL
© Saltire Entertainment, LLC 2010
Growth Trends in International
© Saltire Entertainment, LLC 2010
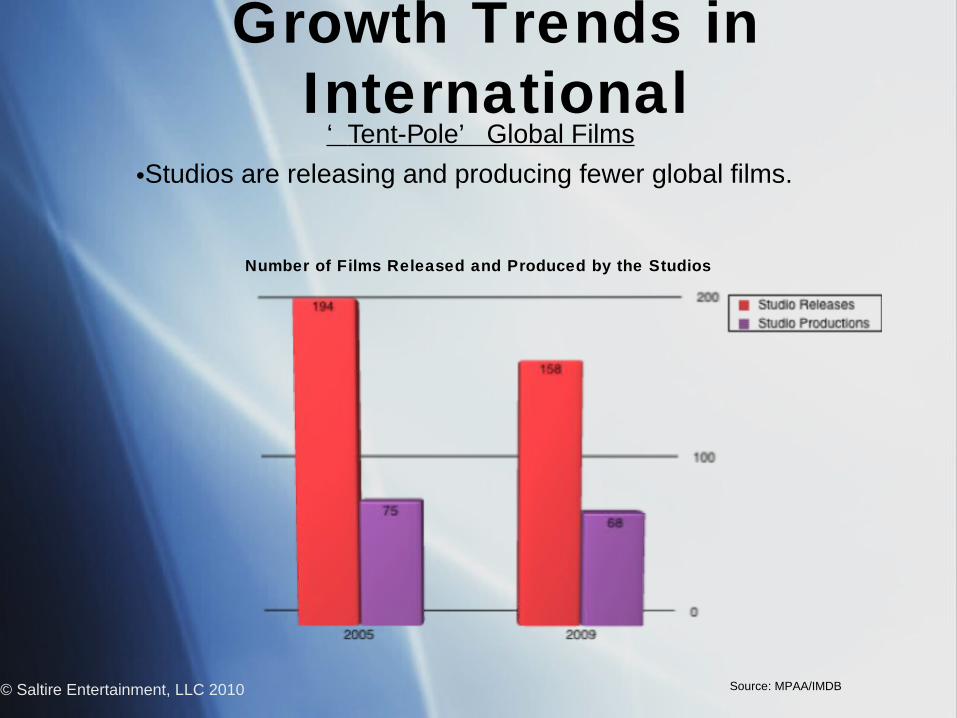
‘ Tent-Pole’ Global Films
•Studios are releasing and producing fewer global films.
Number of Films Released and Produced by the Studios
Source: MPAA/IMDB

© Saltire Entertainment, LLC 2010
‘ Tent-Pole’ Global Films
•While there are fewer ‘tent-pole’ global films they are gaining market share largely at the expense of mid-market global films.
Source: Box Office Mojo / MPAA
Growth Trends in International
Other FilmsUS$14.1B
70%
Top 10 Global Films
US$6.1B30%
Top 10 Global Films
US$3.5B23%
Other FilmsUS$11.5B
77%
International Box Office
Other FilmsUS$14.1B
70%

The Emergence of BRIC
• BRIC average annual box office growth rate is 15.7% (=108% from 2005 to 2009).
© Saltire Entertainment, LLC 2010Source: European Audiovisual Observatory
* Brazil 2005, India 2007 & 2009, and 2010 figures are projected.
Box Office of BRIC*
2.0
2.6
3.2
3.7
4.2
5.0
Growth Trends in International

© Saltire Entertainment, LLC 2010 Source: Various
Brazil: Average annual box office growth of 11.2% (= 70% from 2005 to 2009).
Russia: Average annual box office growth of 18% (= 129% from 2005 to 2009).
India: Average annual box office growth of 12.4% (= 77% from 2005 to 2009).
China: Average annual box office growth of 30.1% (= 272% from 2005 to 2009).
The Emergence of BRIC
Growth Trends in International

Local Film Market Share
• All-time record local market share has been achieved in 4 of the Big 5 in Europe in the last 5 years.
© Saltire Entertainment, LLC 2010
Source: European Audiovisual Observatory*Official UK statistics for market share reflects US inward investment
France:1st time ever Local films eclipsed Global films
Italy:All-time record Local share
Market Share of Local Films in European Big 5*
France:All-time record Local share
Germany: All-time record Local share
UK: All-time record Local share
Growth Trends in International
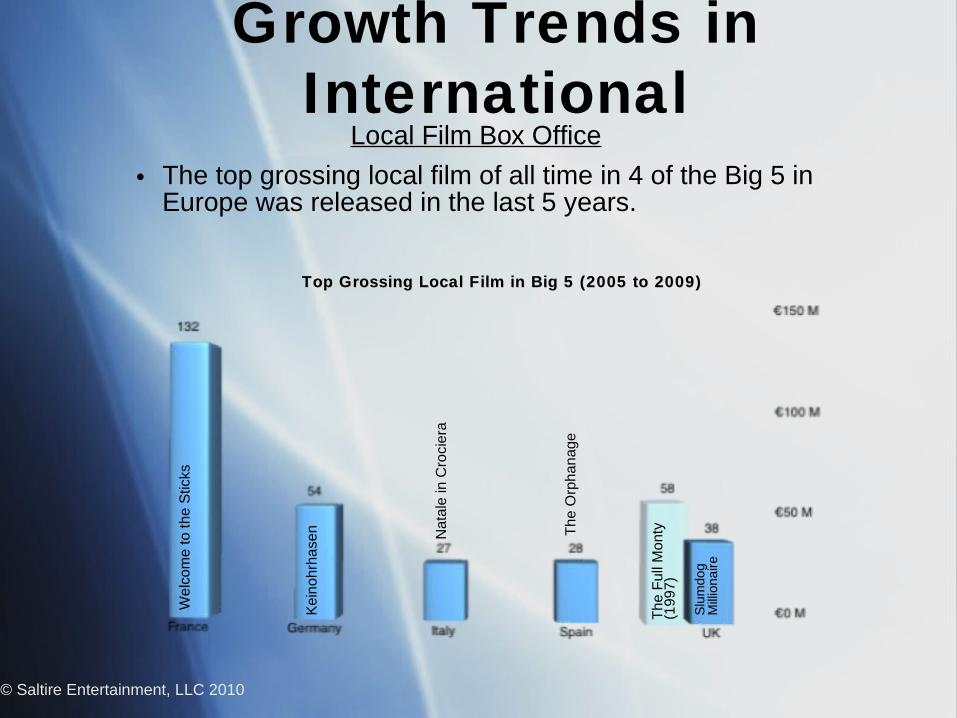
Local Film Box Office
• The top grossing local film of all time in 4 of the Big 5 in Europe was released in the last 5 years.
© Saltire Entertainment, LLC 2010S
lum
dog
Mill
iona
ire
Kei
nohr
hase
n The
Orp
hana
ge
Wel
com
e to
the
Stic
ks
Nat
ale
in C
roci
era
Top Grossing Local Film in Big 5 (2005 to 2009)Top Grossing Local Film in Big 5 (2005 to 2009)
The
Ful
l Mon
ty
(199
7)
Growth Trends in International
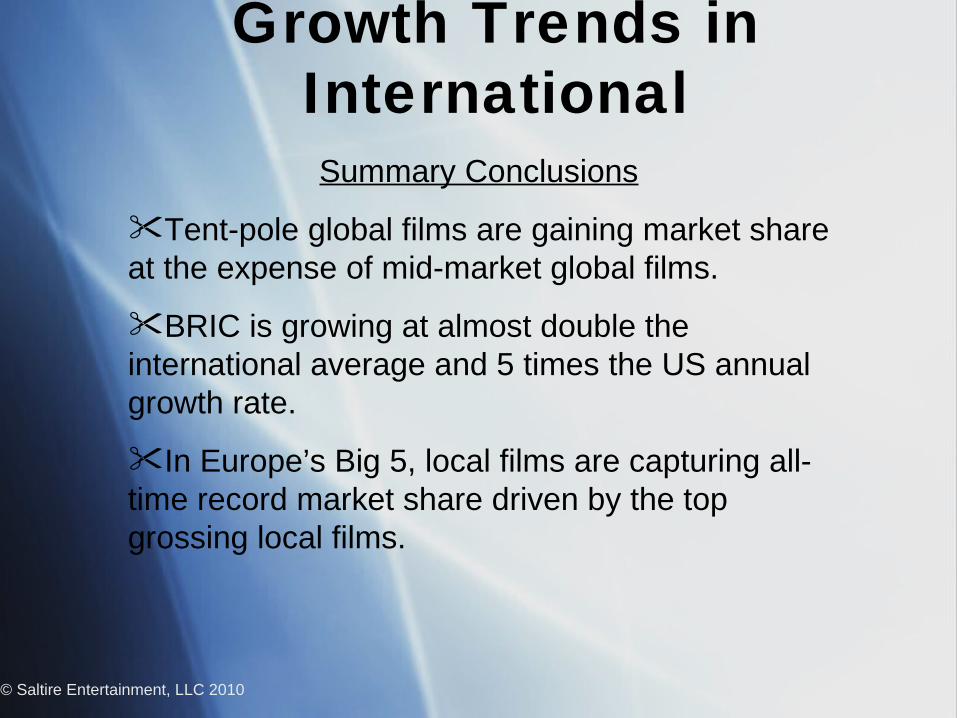
Summary Conclusions
Tent-pole global films are gaining market share at the expense of mid-market global films.
BRIC is growing at almost double the international average and 5 times the US annual growth rate.
In Europe’s Big 5, local films are capturing all-time record market share driven by the top grossing local films.
© Saltire Entertainment, LLC 2010
Growth Trends in International

© Saltire Entertainment, LLC 2010
LOCALThe Big 5: France, Germany, Italy, Spain, UK

Local Film Box Office
• The best performing local films in their home territories on average earn approximately two-thirds of the best performing global film’s box office in those markets.
© Saltire Entertainment, LLC 2010
Slu
mdo
g M
illio
naire
Kei
nohr
hase
n The
Orp
hana
ge
Wel
com
e to
the
Stic
ks
Nat
ale
in C
roci
era
Top Grossing Local Film in Big 5 vs. Top Grossing Global Film in Big 5 (2005 to 2009)Top Grossing Local Film in Big 5 vs. Top Grossing Global Film in Big 5 (2005 to 2009)
The
Ful
l Mon
ty
(199
7)
Ava
tar
Ava
tar
Ava
tar
Ava
tar
Ava
tar
Local

© Saltire Entertainment, LLC 2010
Local Film Box Office
Excluding Avatar, the best performing local films in their home territories on average earn roughly comparable box office to the best performing global films in those markets.
Top Grossing Local Film in Big 5 vs. Top Grossing Global Film in Big 5 w/o Avatar (2005 to 2009)Top Grossing Local Film in Big 5 vs. Top Grossing Global Film in Big 5 w/o Avatar (2005 to 2009)M
amm
a M
ia!
Pira
tes
of th
e C
arib
bean
: D
ead
Man
's C
hest
Ice
Age
: Daw
n of
the
Din
osau
rs
Slu
mdo
g M
illio
naire
Kei
nohr
hase
n The
Orp
hana
ge
Wel
com
e to
the
Stic
ks
Nat
ale
in C
roci
era
The
Ful
l Mon
ty
(199
7)
Ice
Age
: Daw
n of
the
Din
osau
rs
Ice
Age
: Daw
n of
the
Din
osau
rs
Local

Production Costs
• Local films in the Big 5 are much cheaper to produce than global films in the US.
Average Production Cost in 2009Average Production Cost in 2009
© Saltire Entertainment, LLC 2010 Source: Proprietary studio data / MPAA *2007 Figures
Local

Production Cost Leverage
• Production incentives reduce costs more for local films than for global films.
© Saltire Entertainment, LLC 2010
To Be Financed by
Studio Co-financing
Slate 50-60%Soft Monies
20 - 25%
Production Incentives
20-25%
Local
ProductionIncentives
20-30%
To Be Financed by
Studio Co-financing
Slate70-80%
Global
Local
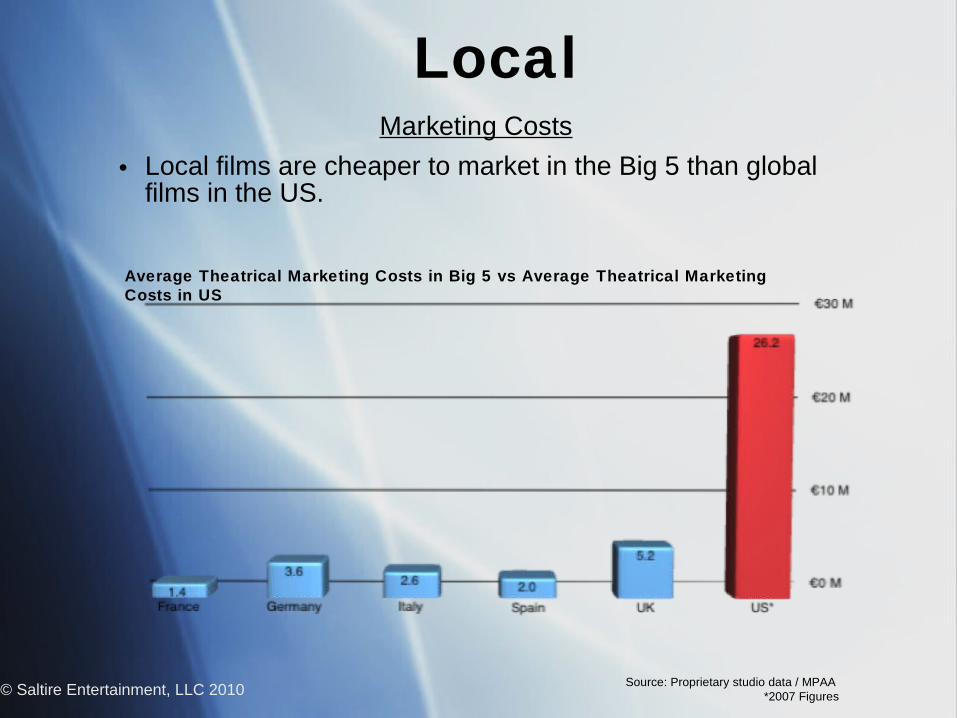
Marketing Costs
• Local films are cheaper to market in the Big 5 than global films in the US.
Average Theatrical Marketing Costs in Big 5 vs Average Theatrical Marketing Costs in US
Source: Proprietary studio data / MPAA *2007 Figures© Saltire Entertainment, LLC 2010
Local

Talent Participations
• Typically, local films share less revenues with talent than global films.
© Saltire Entertainment, LLC 2010
Financiers50%
Talent25-50%
Global
Financiers75%
Talent10-25%
Local
Net participant share tends to be comparable between Local and Global films.
Local
BRIC
•There is a lack of historical data on film performance in the BRIC territories.
•There is significant political risk in ‘closed economies’, particularly in China and Russia.
•The BRIC economies have challenging infrastructure deficiencies.
© Saltire Entertainment, LLC 2010
Local

Summary Conclusions
The ROI characteristics of local films are superior and require less capital than global films.
Local films in Europe’s Big 5 have a more stable and favorable investor climate compared to the BRIC economies.
© Saltire Entertainment, LLC 2010
Local

© Saltire Entertainment, LLC 2010
STUDIO DISTRIBUTION
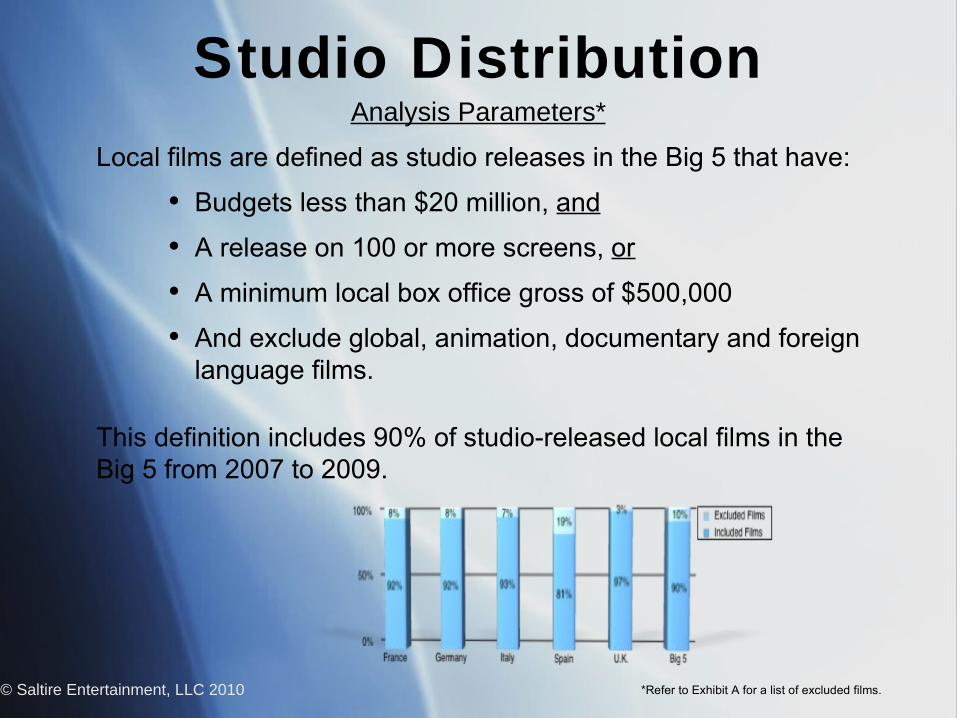
Analysis Parameters*
Local films are defined as studio releases in the Big 5 that have:
• Budgets less than $20 million, and
• A release on 100 or more screens, or
• A minimum local box office gross of $500,000
• And exclude global, animation, documentary and foreign language films.
This definition includes 90% of studio-released local films in the Big 5 from 2007 to 2009.
© Saltire Entertainment, LLC 2010
Studio Distribution
*Refer to Exhibit A for a list of excluded films.

Average Box Office Comparisons*
• On average, a local film distributed by a studio outperforms a local film distributed by a local distributor.
© Saltire Entertainment, LLC 2010
Average Box Office of Local Films in the Big 5 Distributed by Studios Vs. independent Distributors
(2007 to 2009)
Studio Distribution
*Refer to Exhibit A for a comparison of all films.

Average Box Office of Local Films in the Big 5 Distributed by Studios vs. independent Distributors
(2007 to 2009)
© Saltire Entertainment, LLC 2010
Average Box Office Comparisons By Territory*
On average, a local film distributed by a studio outperforms a local film distributed by a local distributor in Germany, Spain and UK.
Italy is the notable exception; local distributors in Italy outperform the studios.
By Territory
Studio Distribution
*Refer to Exhibit A for a comparison of all films.

No. of Screens for Local Films in the Big 5 Distributed by Studios vs. Local Distributors (2007
to 2009)
Screen Comparisons*
On average, a local film distributed by a studio is released on slightly more screens than a local film distributed by a local distributor.
Studio Distribution
© Saltire Entertainment, LLC 2010 *Refer to Exhibit A for a comparison of all films.
© Saltire Entertainment, LLC 2010
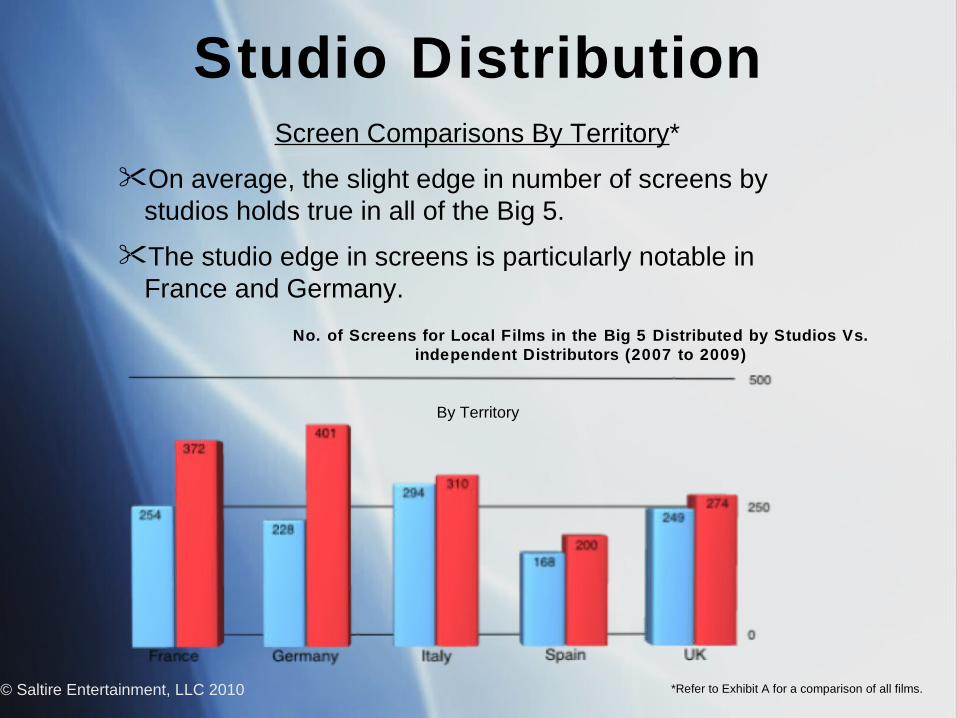
Screen Comparisons By Territory*
On average, the slight edge in number of screens by studios holds true in all of the Big 5.
The studio edge in screens is particularly notable in France and Germany.
Studio Distribution
No. of Screens for Local Films in the Big 5 Distributed by Studios Vs. independent Distributors (2007 to 2009)
By Territory
*Refer to Exhibit A for a comparison of all films.

Analysis of Studio Performance
© Saltire Entertainment, LLC 2010
Studio Distribution
Marketing Marketing Prowess:Prowess:
Studios have superior focus on marketing Studios have superior focus on marketing and brand/franchise awareness.and brand/franchise awareness.
Genre Bias:Genre Bias: Studios have genre bias toward action, Studios have genre bias toward action, comedies, horror, etc., rather than, say, comedies, horror, etc., rather than, say, adult dramas or auteur films.adult dramas or auteur films.
Cultural Factors:Cultural Factors: Local distributors have political, cultural Local distributors have political, cultural and regulatory imperatives to distribute and regulatory imperatives to distribute art-house films whereas the studios are art-house films whereas the studios are more market driven.more market driven.

Studio Strategic Advantages
• Studios are ramping up local production.
• Studios have superior economic leverage with exhibitors due to the pre-eminence of tent-pole global films.
• Local films distributed by the studios benefit from low overhead by ‘piggybacking’ on the studio distribution and marketing operations for global films.
• Studios represent a ‘one-stop’ deal-making opportunity for a diversified slate of local films across the Big 5.
© Saltire Entertainment, LLC 2010
Studio Distribution
© Saltire Entertainment, LLC 2010
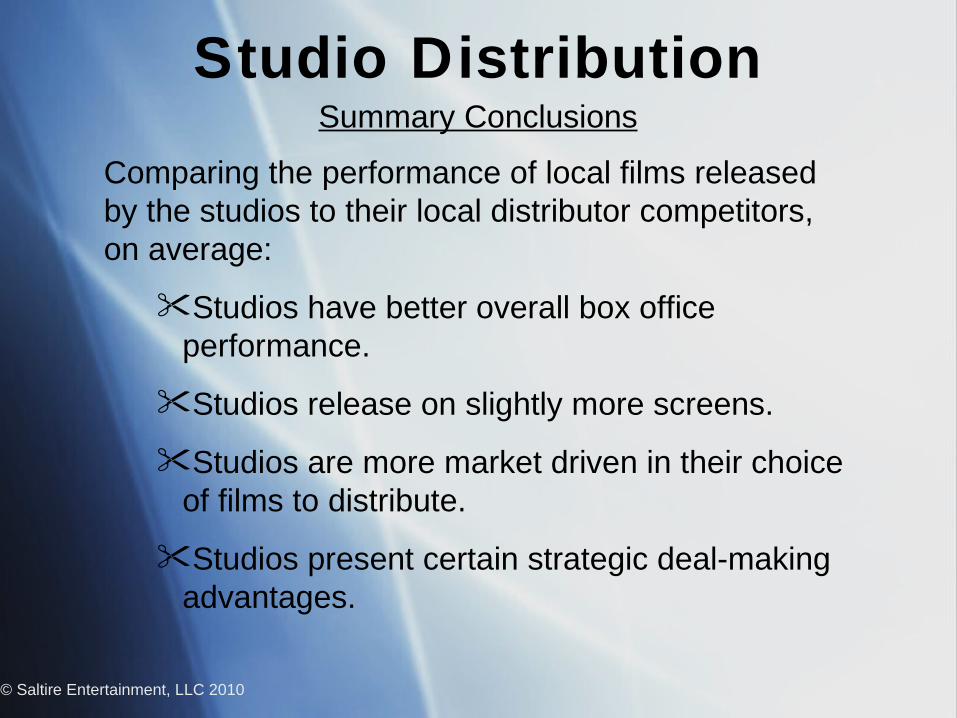
Summary Conclusions
Comparing the performance of local films released by the studios to their local distributor competitors, on average:
Studios have better overall box office performance.
Studios release on slightly more screens.
Studios are more market driven in their choice of films to distribute.
Studios present certain strategic deal-making advantages.
Studio Distribution

© Saltire Entertainment, LLC 2010
STUDIO COMPARISONS

© Saltire Entertainment, LLC 2010
Studio Comparisons
© Saltire Entertainment, LLC 2010
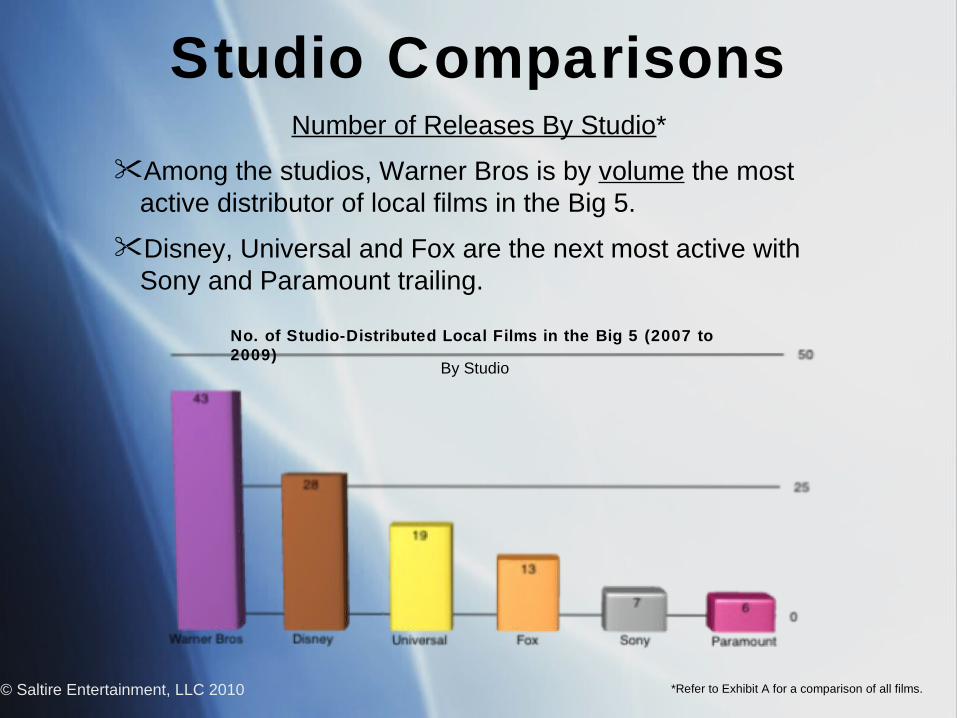
No. of Studio-Distributed Local Films in the Big 5 (2007 to 2009)
Number of Releases By Studio*
Among the studios, Warner Bros is by volume the most active distributor of local films in the Big 5.
Disney, Universal and Fox are the next most active with Sony and Paramount trailing.
By Studio
Studio Comparisons
*Refer to Exhibit A for a comparison of all films.
© Saltire Entertainment, LLC 2010
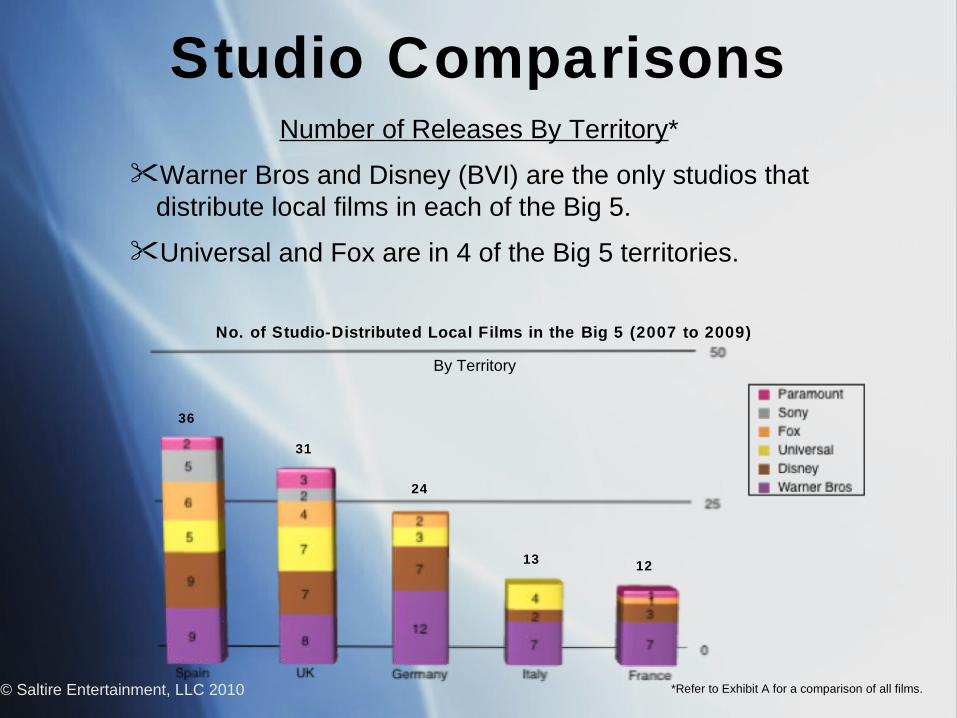
Number of Releases By Territory*
Warner Bros and Disney (BVI) are the only studios that distribute local films in each of the Big 5.
Universal and Fox are in 4 of the Big 5 territories.
Studio Comparisons
No. of Studio-Distributed Local Films in the Big 5 (2007 to 2009)
By Territory
36
31
24
13 12
*Refer to Exhibit A for a comparison of all films.
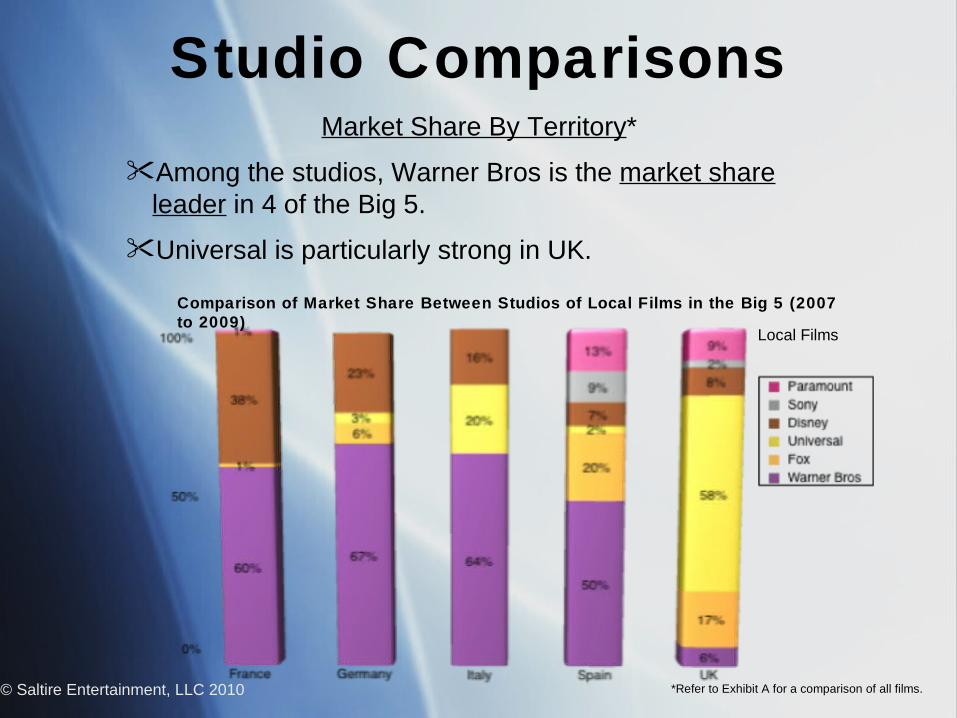
Comparison of Market Share Between Studios of Local Films in the Big 5 (2007 to 2009)
© Saltire Entertainment, LLC 2010
Market Share By Territory*
Among the studios, Warner Bros is the market share leader in 4 of the Big 5.
Universal is particularly strong in UK.
Local Films
Studio Comparisons
*Refer to Exhibit A for a comparison of all films.

© Saltire Entertainment, LLC 2010
Average Box Office Performance By Studio*
Universal and Warner Bros are the best performing studios gauged by box office average.
Sony’s average box office trails their studio competitors as none of their local films distributed in the Big 5 grossed €5 million.
Studio Comparisons
Comparison of Average Local Film Box Office Performance of Studio-Distributed Local Films in the Big
5 (2007 to 2009)By Studio
*Refer to Exhibit A for a comparison of all films.
Studio Comparisons
© Saltire Entertainment, LLC 2010
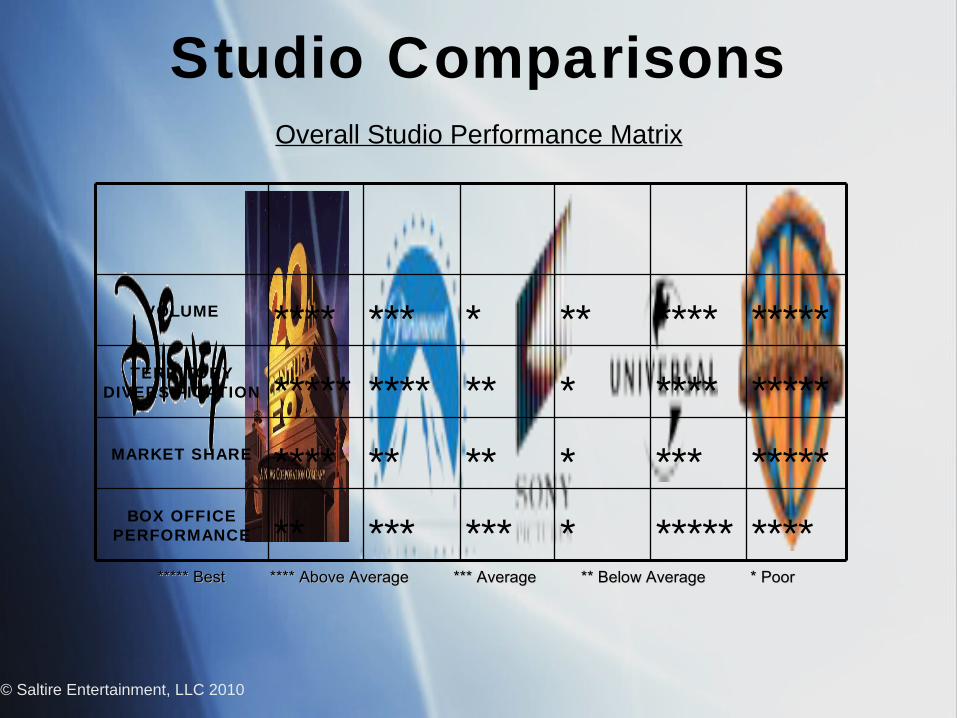
Overall Studio Performance Matrix
***** Best **** Above Average *** Average ** Below Average * Poor***** Best **** Above Average *** Average ** Below Average * Poor
VOLUME **** *** * ** **** *****TERRITORY
DIVERSIFICATION ***** **** ** * **** *****MARKET SHARE **** ** ** * *** *****
BOX OFFICE PERFORMANCE ** *** *** * ***** ****

© Saltire Entertainment, LLC 2010
STRATEGY

Capital CommitmentCapital Commitment
Strategy
© Saltire Entertainment, LLC 2010
€€50 million senior debt 50 million senior debt with 8% couponwith 8% coupon
€€50 million equity50 million equity

• One or more studio distributors
• 5 years; 30 to 50 films
• Target local films with budgets less than $20 million and a minimum release commitment of 100 screens
• Maximum acquisition/production cost capped at €5 million per film
• 50% acquisition; 50% production
• Build a diversified library portfolio across Big 5 territories
© Saltire Entertainment, LLC 2010
Strategy
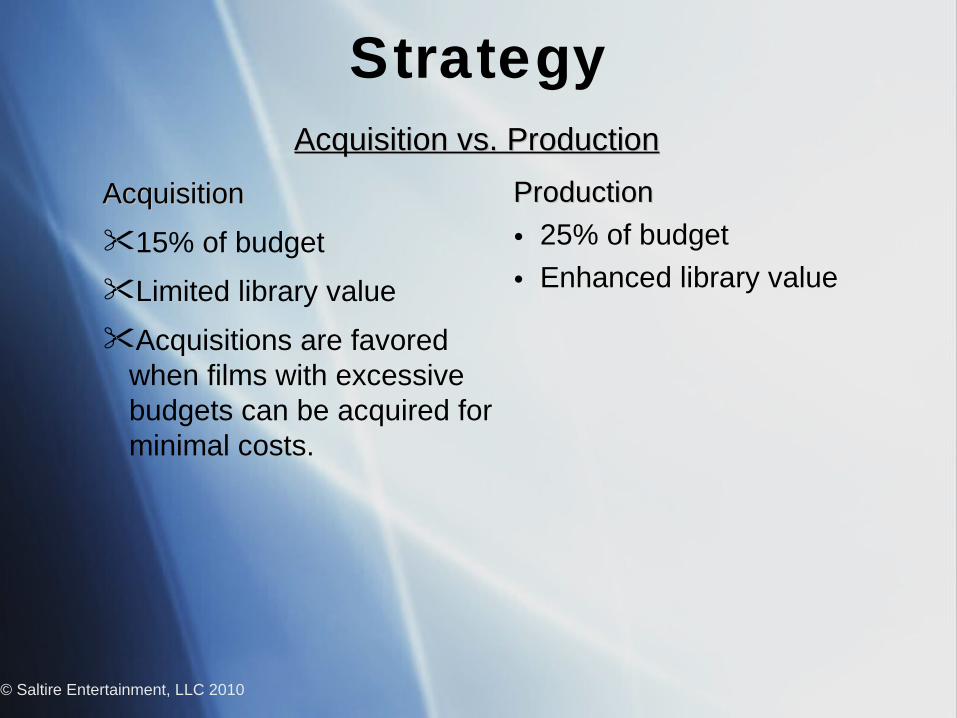
ProductionProduction
• 25% of budget
• Enhanced library value
Strategy
© Saltire Entertainment, LLC 2010
Acquisition vs. ProductionAcquisition vs. Production
AcquisitionAcquisition
15% of budget
Limited library value
Acquisitions are favored when films with excessive budgets can be acquired for minimal costs.

Television
• 50% pre-sold• 50% revenue
Strategy
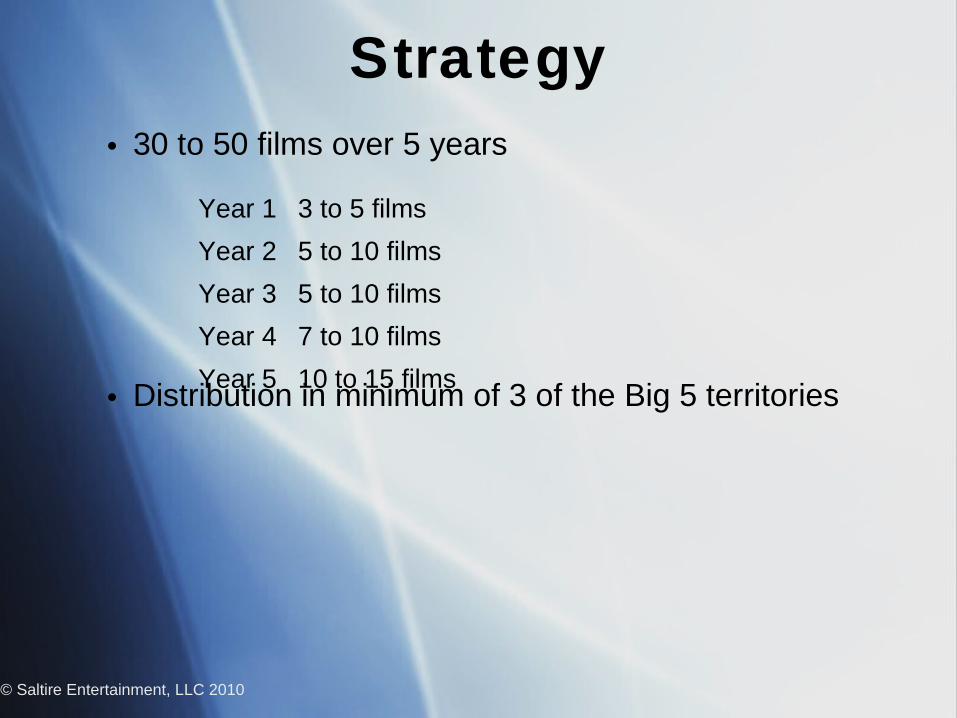
• 30 to 50 films over 5 years
• Distribution in minimum of 3 of the Big 5 territories
Strategy
© Saltire Entertainment, LLC 2010
Year 1 3 to 5 films
Year 2 5 to 10 films
Year 3 5 to 10 films
Year 4 7 to 10 films
Year 5 10 to 15 films
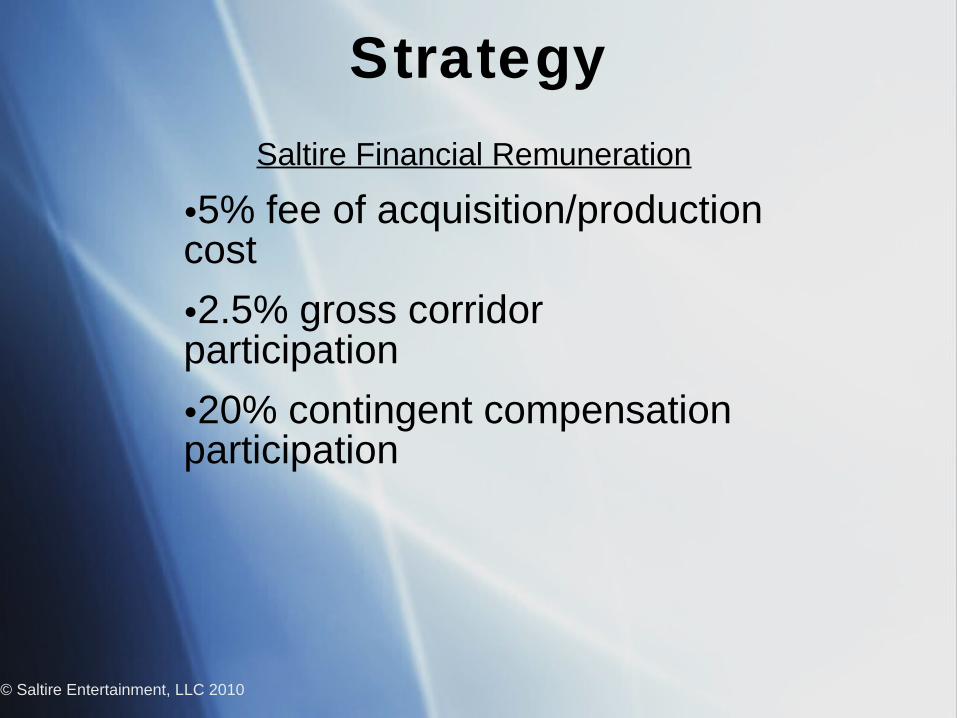
Saltire Financial Remuneration
•5% fee of acquisition/production cost
•2.5% gross corridor participation
•20% contingent compensation participation
Strategy
© Saltire Entertainment, LLC 2010

Investor ROIInvestor ROI
Strategy
© Saltire Entertainment, LLC 2010
High: 22%High: 22%Low: 10%Low: 10%

© Saltire Entertainment, LLC 2010
MANAGEMENT

Jim Miller, Chairman
• Former Head of Business Affairs at Warner Bros.
• Part of legendary WB troika with Terry Semel and Bob Daly for over a decade
Stuart Pollok, CEO
• Film executive with 15+ years of production and film finance experience
• Former Head of Production at Studio Hamburg International Production
• Former Executive Vice President at Prelude Pictures (Paramount)
• Former New York attorney at Paul, Weiss and Linklaters
© Saltire Entertainment, LLC 2010
Management
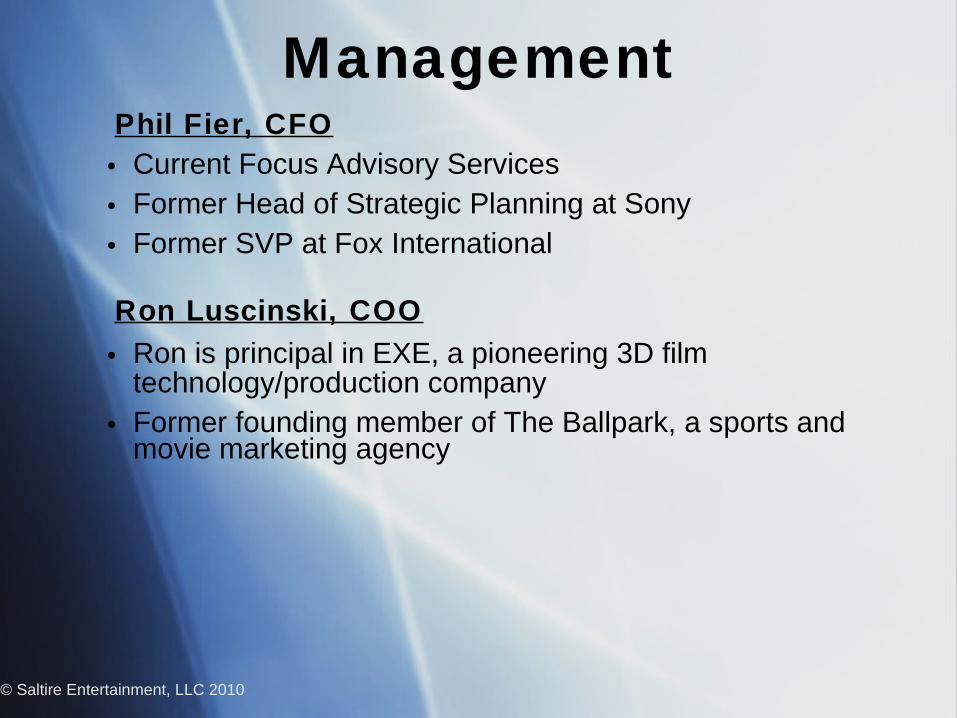
Phil Fier, CFO • Current Focus Advisory Services• Former Head of Strategic Planning at Sony• Former SVP at Fox International
Ron Luscinski, COO
• Ron is principal in EXE, a pioneering 3D film technology/production company
• Former founding member of The Ballpark, a sports and movie marketing agency
© Saltire Entertainment, LLC 2010
Management

© Saltire Entertainment, LLC 2010
EXHIBIT A

This Exhibit A is a comparison of all local films released in the Big 5, analyzed without regard to budget, number of release screens or box office performance.
The prior analysis of local films is limited to studio releases in the Big 5 with budgets less than $20 million and a release of 100 or more screens and a minimum local box office of $500,000.
The comparison shows that there are no material differences in the results caused by the limited pool of selected local films.
© Saltire Entertainment, LLC 2010

Average Box Office Comparisons of All Local Films*
• On average, when all local films are analyzed, the number of release screens or box office performance barely impacts the average performance of studio distributed films but severely decreases the performance of their local distributor competitors.
© Saltire Entertainment, LLC 2010
Studio Distribution
*All local films regardless of budget, screens or box office.
Average Box Office of Local Films in the Big 5 Distributed by Studios Vs. independent Distributors
(2007 to 2009)
© Saltire Entertainment, LLC 2010
Studio Distribution
Average Box Office of Local Films in the Big 5 Distributed by Studios vs. independent Distributors
(2007 to 2009)
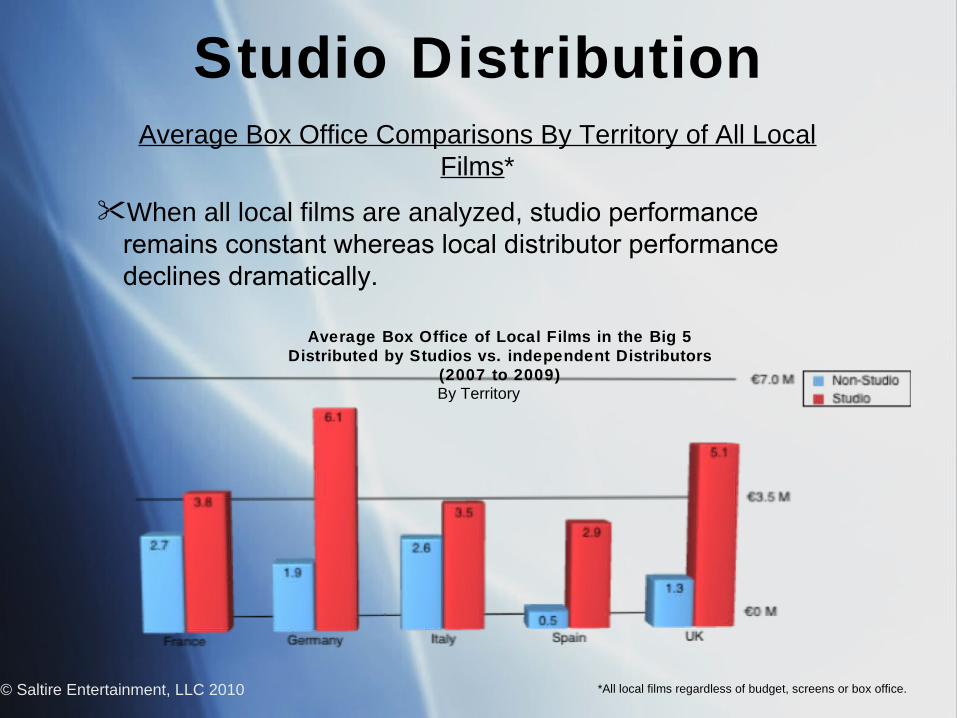
Average Box Office Comparisons By Territory of All Local Films*
When all local films are analyzed, studio performance remains constant whereas local distributor performance declines dramatically.
By Territory
*All local films regardless of budget, screens or box office.

Screen Comparisons of All Local Films*
When all local films are analyzed, the average number of screens for studio releases remains constant whereas local distributor screens decline dramatically.
Studio Distribution
© Saltire Entertainment, LLC 2010
No. of Screens for Local Films in the Big 5 Distributed by Studios vs. Local Distributors (2007
to 2009)
*All local films regardless of budget, screens or box office.

© Saltire Entertainment, LLC 2010
Studio Distribution
No. of Screens for Local Films in the Big 5 Distributed by Studios Vs. independent Distributors
(2007 to 2009)
Screen Comparisons of All Local Films By Territory*
When all local films are analyzed, the average number of screens for studio releases remains constant whereas local distributor screens decline dramatically.
By Territory
*All local films regardless of budget, screens or box office.

© Saltire Entertainment, LLC 2010
Number of Releases of All Local Films By Studio*
When all local films are analyzed, overall studio volume rank remains the same.
No. of Studio-Distributed Local Films in the Big 5 (2007 to 2009)
By Studio (All Local Films)
Studio Comparisons
*All local films regardless of budget, screens or box office.
© Saltire Entertainment, LLC 2010
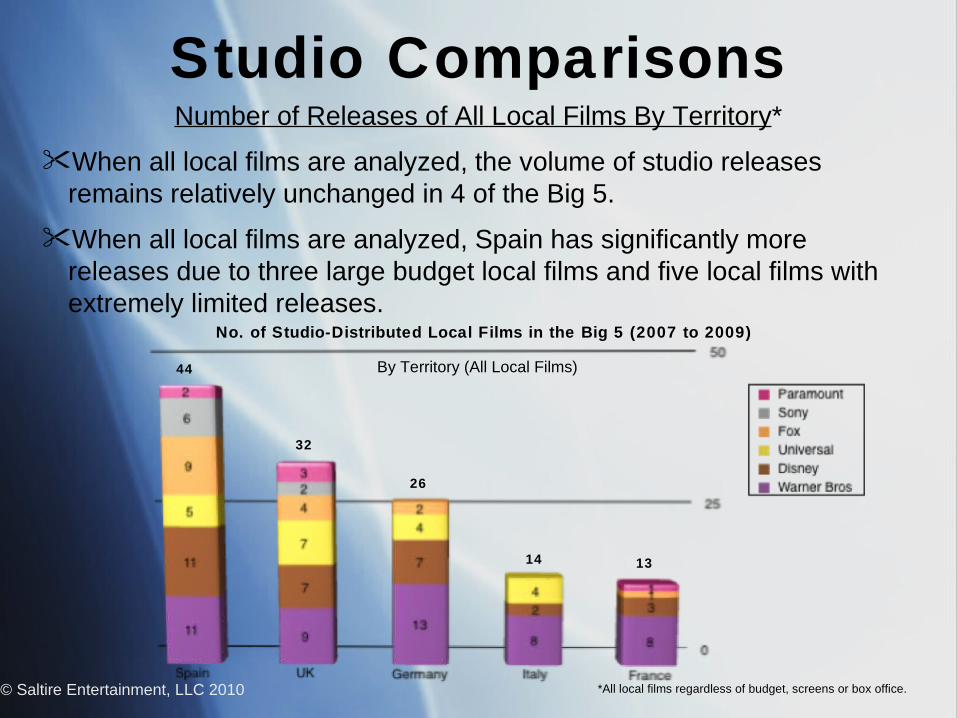
Number of Releases of All Local Films By Territory*
When all local films are analyzed, the volume of studio releases remains relatively unchanged in 4 of the Big 5.
When all local films are analyzed, Spain has significantly more releases due to three large budget local films and five local films with extremely limited releases.
No. of Studio-Distributed Local Films in the Big 5 (2007 to 2009)
By Territory (All Local Films)
Studio Comparisons
44
32
26
14 13
*All local films regardless of budget, screens or box office.

© Saltire Entertainment, LLC 2010
Market Share of All Local Films By Territory*
When all local films are analyzed, relative studio market share is unchanged except in Spain.
When all local films are analyzed, Fox’s market share in Spain increases significantly due solely to three large budget local films.
All Local Films
Studio Comparisons
Comparison of Market Share Between Studios of Local Films in the Big 5 (2007 to 2009)
*All local films regardless of budget, screens or box office.
© Saltire Entertainment, LLC 2010
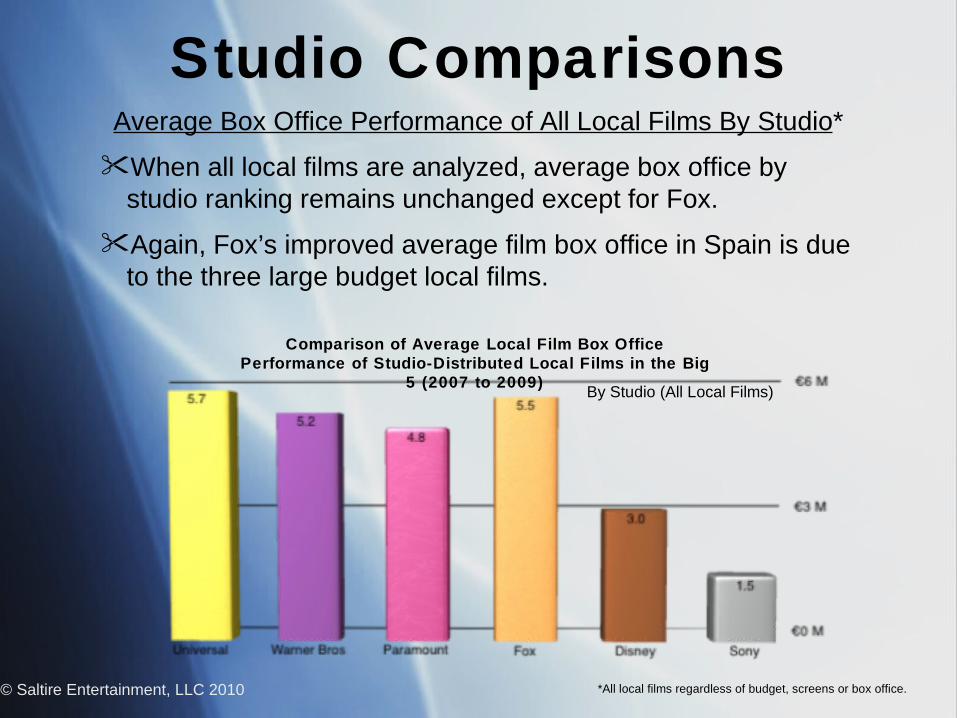
Average Box Office Performance of All Local Films By Studio*
When all local films are analyzed, average box office by studio ranking remains unchanged except for Fox.
Again, Fox’s improved average film box office in Spain is due to the three large budget local films.
Studio Comparisons
*All local films regardless of budget, screens or box office.
By Studio (All Local Films)
Comparison of Average Local Film Box Office Performance of Studio-Distributed Local Films in the Big
5 (2007 to 2009)

Excluded Studio-Released Films
© Saltire Entertainment, LLC 2010
TerritoryTerritory TitleTitle Reason for ExclusionReason for Exclusion
FranceFrance Micmacs à Tire-larigot (WB)Micmacs à Tire-larigot (WB) Budget (€27 million)Budget (€27 million)
GermanyGermany Morgen, Ihr Luschen! Der Ausbilder-Schmidt-Film Morgen, Ihr Luschen! Der Ausbilder-Schmidt-Film (UNIVERSAL)(UNIVERSAL)
Limited release (30 screens)Limited release (30 screens)
Berlin Am Meer (WB)Berlin Am Meer (WB) Limited release (59 screens)Limited release (59 screens)
ItalyItaly Tutta Colpa Di Giuda (WB)Tutta Colpa Di Giuda (WB) Limited release (74 screens)Limited release (74 screens)
SpainSpain Los Muertos Van Deprisa (BVI/DISNEY)Los Muertos Van Deprisa (BVI/DISNEY) Limited release (48 screens)Limited release (48 screens)
Wrap Up (BVI/DISNEY)Wrap Up (BVI/DISNEY) Limited release (20 screens)Limited release (20 screens)
Che: Part One (FOX)Che: Part One (FOX) Budget (€21 million)Budget (€21 million)
Che: Part Two (FOX)Che: Part Two (FOX) Budget (€28 million)Budget (€28 million)
Agora (FOX)Agora (FOX) Budget (€51 million)Budget (€51 million)
El Canto Del Loco - Personas: La Pelicula (SONY)El Canto Del Loco - Personas: La Pelicula (SONY) Limited release (35 screens)Limited release (35 screens)
La Edad de la Peseta (WB)La Edad de la Peseta (WB) Limited release (3 screens)Limited release (3 screens)
The Headless Woman (WB)The Headless Woman (WB) Limited release (4 screens)Limited release (4 screens)
UKUK Chemical Wedding (WB)Chemical Wedding (WB) Limited release (18 screens)Limited release (18 screens)
Studio Distribution

EXCLUDED SLIDES

International
•Worldwide concentration of box office on fewer, tent-pole Global films while US market stagnates
•The emergence of BRIC (Brazil, Russia, India and China)
•Rise of Local films
© Saltire Entertainment, LLC 2010
Growth Trends

© Saltire Entertainment, LLC 2010
Rise of Local Pop Cultures
• ‘World is flat’ phenomenon
• Rapid urbanization of cities
• Rise of the middle class with disposable income
Growth Trends

Summary Conclusion:
International is the future of the film business.
© Saltire Entertainment, LLC 2010 Source: MPAA
68%
32%
55% 45%
Growth Trends

© Saltire Entertainment, LLC 2010
LOCALThe Big 5: France, Germany, Italy, Spain, UK
Local
Local film trends:
Comparable box office to Global films
Record local film market share
© Saltire Entertainment, LLC 2010

Local ROI
Local films’ superior characteristics:
Reduced production costs
Enhanced production cost leverage
Lower marketing costs
Lower talent participations
BRIC issues
© Saltire Entertainment, LLC 2010
Studio Distribution
© Saltire Entertainment, LLC 2010
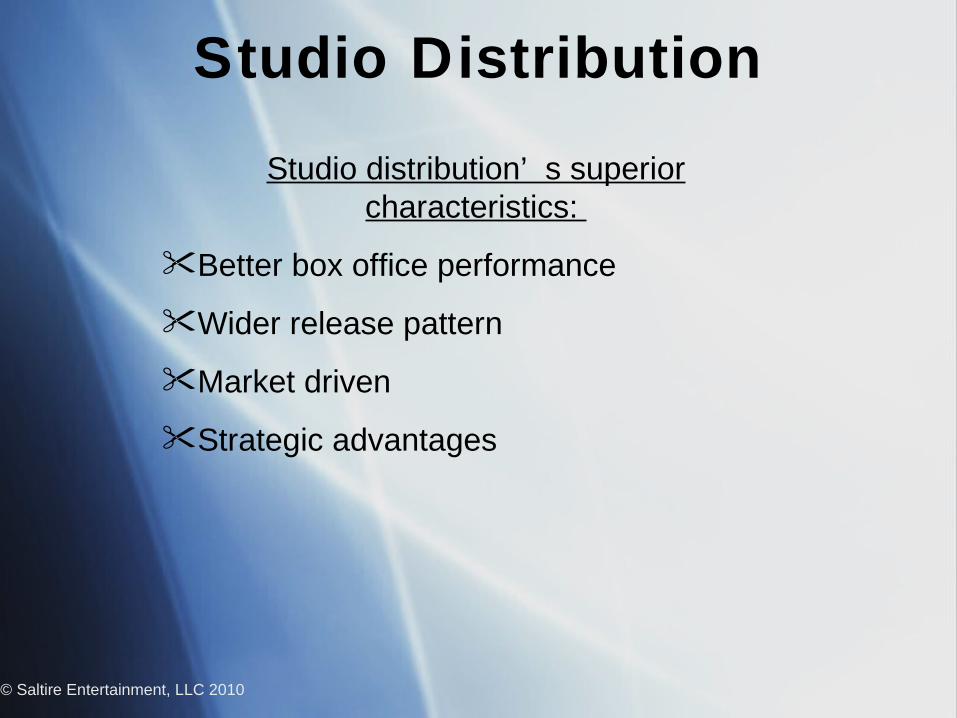
Studio distribution’ s superior characteristics:
Better box office performance
Wider release pattern
Market driven
Strategic advantages

© Saltire Entertainment, LLC 2010
Summary Conclusion
Warner Bros: best volume, best diversified portfolio, above average box office performance.
Universal: best box office performance, above average volume, above average diversified portfolio.
Disney: best diversified portfolio, above average volume, below average box office performance.
Fox: above average portfolio diversification, average volume, average box office performance.
Paramount: average box office performance, below average diversification, poor volume.
Sony: below average volume, poor portfolio diversification, poor box office performance.
Studio Comparisons
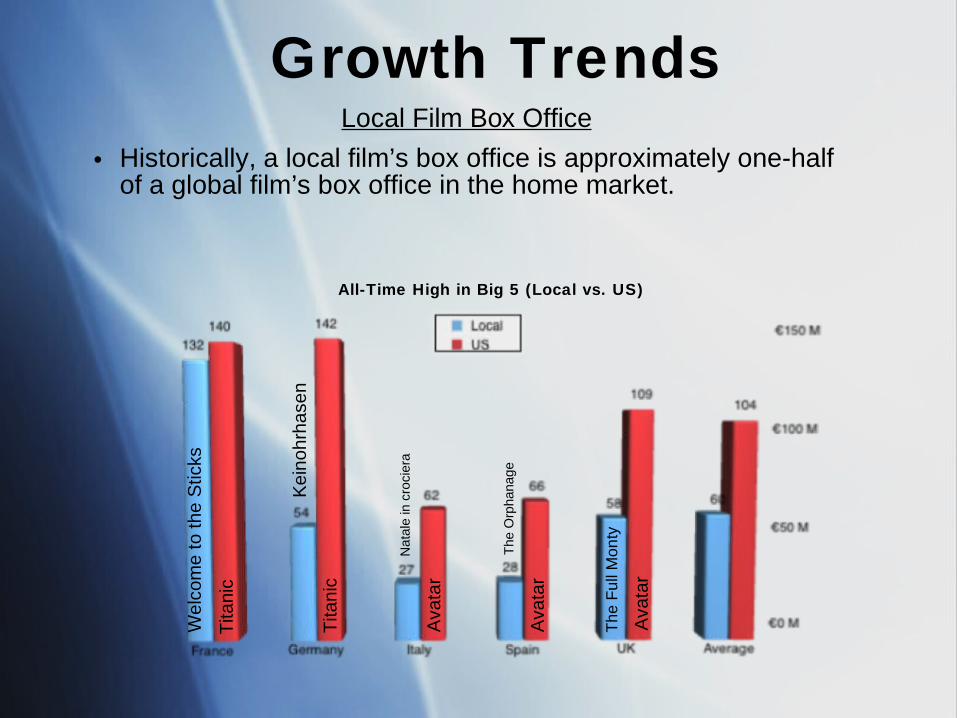
Local Film Box Office
• Historically, a local film’s box office is approximately one-half of a global film’s box office in the home market.
Growth Trends
All-Time High in Big 5 (Local vs. US)
Ava
tar
Tita
nic
Tita
nic
Ava
tar
Ava
tar
The
Ful
l Mon
ty
Kei
nohr
hase
n
The
Orp
hana
ge
Wel
com
e to
the
Stic
ks
Nat
ale
in c
roci
era


