20
LOCAL LABOUR MARKET PLAN 2012 & MINING STUDY OVERVIEW
| Date post: | 24-Dec-2015 |
| Category: |
Documents |
| Upload: | kathryn-flowers |
| View: | 213 times |
| Download: | 0 times |

LOCAL LABOUR MARKET PLAN 2012
& MINING STUDY OVERVIEW

WHO IS WORKFORCE PLANNING FOR SUDBURY &
MANITOULIN? Core funding - MTCU (Ministry
of Training, Colleges & Universities)
25 planning boards/areas across Ontario
Engage key partners across Sudbury & Manitoulin Districts
Address local labour market issues
Lead various partnership projects
Contribute to workforce-related actions
Build school-employer relations
Bridge divergent views - neutral voice
Annual local labour market report includes: data from Statistics Canada other evidence-based
research information from:
○ key business and sector leaders
○ community consultations

GEOGRAPHIC COVERAGE AREA
WPSM catchment

WHAT’S NEW?MINING:
Significant growth in mining (super-cycle) Mining clusters
Polymetallic mines Hardrock mining – supply & services Post-secondary mining education Mining research
Highlights First Nickel: full production at Lockerby mine by end of 2012 KGHM (bought out Quadra FNX): Victoria mine under construction (one of
riches deposits in decades) Xstrata: Nickel Rim South mine in operation for next 15+ years Vale: Totten mine production near end of 2013; Clarabelle Mine complex;
Clean AER project Ring of Fire (Cliff Natural Resources, Noront Resources) Various mining exploration initiatives & several open pit mines

WHAT’S NEW?
CONSTRUCTION Significant growth 446 building permits
2010 535 building permits
2011 At capacity right now Work continues to
increase Retirement of current
workers Youth not entering
trades Recruiting from
outside area
HEALTH Health Sciences North
New strategic direction – health care hub of excellence
Partnership with NOSM, Science North and Laurentian
Research focus- need for highly skilled professionals
Northeast LHIN (Local Health Integration Network) Health Human Resources’
project Developing online tool - HR
forecasting & job vacancies
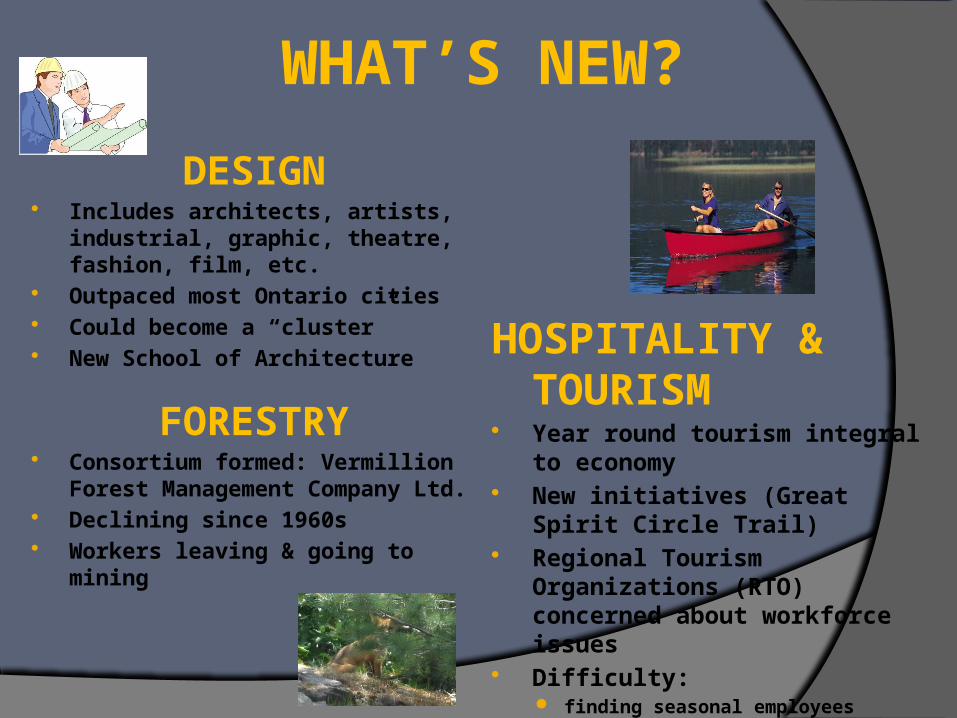
WHAT’S NEW?
DESIGN Includes architects, artists,
industrial, graphic, theatre, fashion, film, etc.
Outpaced most Ontario cities Could become a “cluster” New School of Architecture
FORESTRY Consortium formed: Vermillion
Forest Management Company Ltd.
Declining since 1960s Workers leaving & going to
mining
HOSPITALITY & TOURISM
Year round tourism integral to economy
New initiatives (Great Spirit Circle Trail)
Regional Tourism Organizations (RTO) concerned about workforce issues
Difficulty: finding seasonal employees retaining workforce sustaining & growing the industry

WHAT’S NEW?
EDUCATION Various opportunities for
students to develop skills (such as OYAP)*
Companies actively recruiting
Kenjgewin Teg Educational Institute (KTEI) offering college & university accredited course; pre-employment training; etc.
Range of academic & skilled trades’ programs – postsecondary
*Ontario Youth Apprenticeship Program
AGRICULTURE Manitoulin Island:
Northern Ontario Aquaculture Association (research; local hatcheries; etc.)
Manitoulin Abattoir (regulated & licensed abattoir; increase growth & sustainability)
NON-PROFIT Decreased funding - impacting
on workforce 72% increase in demand for
service (2009)
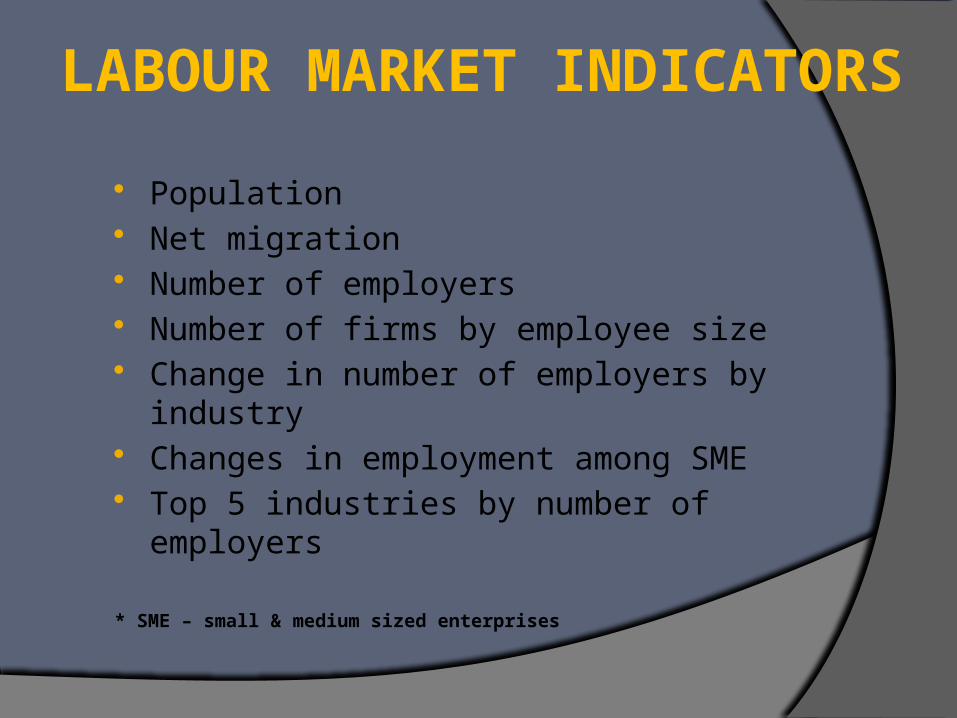
LABOUR MARKET INDICATORS
Population Net migration Number of employers Number of firms by employee size Change in number of employers by
industry Changes in employment among SME Top 5 industries by number of
employers
* SME – small & medium sized enterprises

MANITOULIN, SUDBURY (District), GREATER SUDBURY & ONTARIO
CENSUS POPULATION & PERCENTAGE CHANGE
2011 2006% change2006-2011
% change2001-2006
Manitoulin 13,048 12,631 3.3% N/A
Sudbury (District) 21,196 21,851 -3.0% -6.6%
Greater Sudbury 160,376 157,909 1.6% 1.7%
Ontario 12,851,821 12,160,282
5.7% 6.6%
Ontario minus Toronto CMA
7,268,757 7,047,133 3.1% 4.8%
Statistics Canada Census Profiles

0-17 years old
18-24 years old
25-44 years old
45-64 years old
65 years and older
-200 -150 -100 -50 0 50 100 150 200
Manitoulin Sudbury Greater Sudbury
NET MIGRATION 2005-06 to 2009-10
Statistics Canada (from taxfiler data)

NUMBER OF EMPLOYERSMANITOULIN, SUDBURY (District) AND GREATER SUDBURY
JUNE 2011Highest # of employers (NAICS) Total # of
employers Manitoulin 44-45 Retail Trade 130
23 Construction 98
72 Accommodation and Food 96
TOTAL # OF EMPLOYERS 846
Sudbury (District)
72 Accommodation and Food 168
44-45 Retail Trade 149
23 Construction 141
TOTAL # OF EMPLOYERS 1127
Greater Sudbury
44-45 Retail Trade 1066
23 Construction 951
53 Real Estate 901
TOTAL # OF EMPLOYERS 8212Statistics Canada - Canadian Business PatternsNAICS - North American Industry Classification System

NUMBER OF FIRMS BY EMPLOYEE SIZEMANITOULIN, SUDBURY (District) AND GREATER SUDBURY
June 2010 - JUNE 2011
0 1-19 20-99 100+
MANITOULIN
June 2010 358 420 37 6
June 2011 353 442 44 7
SUDBURY (District)
June 2010 523 570 67 15
June 2011 506 548 60 13
GREATER SUDBURY
June 2010 3433 3870 606 97
June 2011 3583 3918 617 94
Statistics Canada – Canadian Business Patterns

NOTABLE CHANGES IN THE NUMBER OF EMPLOYERS BY INDUSTRY
JUNE 2010 - JUNE 2011MANITOULIN SUDBURY (District) GREATER
SUDBURYNotable increasesAgricultureManufacturingReal estate/rentalProfessional/scientificEducational servicesHealth/social assistanceArts, entertainment, recreation
Agriculture AgricultureMiningConstructionRetail tradeFinance & insuranceReal estate/rentalProfessional/scientificManagement of companiesHealth/social assistanceArts, entertainment, recreation
Notable decreasesWholesale tradeTransportation & warehousingAccommodation & food
ConstructionManufacturingProfessional/scientificEducational servicesHealth/social assistanceOther servicesPublic administration
ManufacturingWholesale tradeAdministrative & supportEducational services
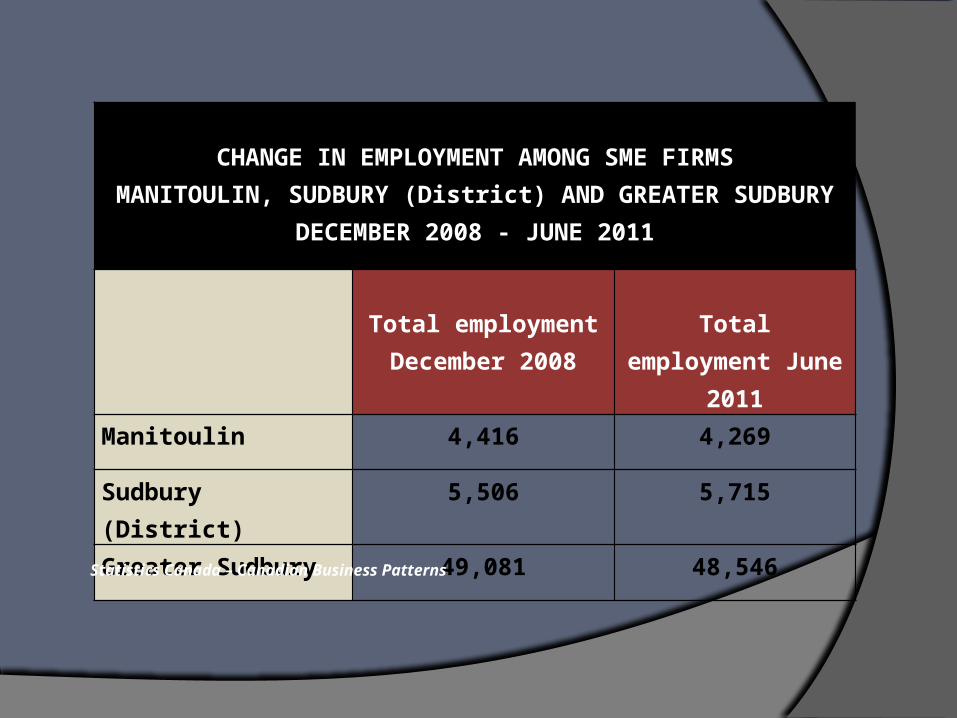
CHANGE IN EMPLOYMENT AMONG SME FIRMSMANITOULIN, SUDBURY (District) AND GREATER
SUDBURYDECEMBER 2008 - JUNE 2011
Total employment December 2008
Total employment
June 2011Manitoulin 4,416 4,269
Sudbury (District) 5,506 5,715
Greater Sudbury 49,081 48,546
Statistics Canada – Canadian Business Patterns

FIVE TOP INDUSTRIES BY NUMBER OF EMPLOYERSMANITOULIN, SUDBURY (District), GREATER SUDBURY AND
ONTARIO JUNE 2011
Manitoulin Sudbury (District)
Greater Sudbury
Ontario
1 Retail trade Accommodation & Food
Retail trade Prof Scientific Tech
2 Construction
Retail trade Construction
Construction
3 Accommodation& Food
Construction
Real Estate Real Estate
4 Agriculture Agriculture Prof Scientific
Tech
Retail trade
5 Other Services
Other Services
Other Services
Other Services

Consultations – workforce priorities
by industry/sector...
Health Mining Construction Agriculture & green-tech Hospitality & tourism

Consultations – issues
Retiring workforce Reduced birthrate Students not entering
trades Demand higher than
supply Lack of qualified talent
pool “Poaching” by big
business Women & Aboriginal
youth underrepresented in trades
Some locations – skilled workers but no local jobs
Parents do not see viability of skilled trades’ career
Cyclical nature of mining & construction
North not a destination area
Lack of marketing north
Unrealistic apprenticeship ratios
Some jobs (agriculture & tourism) not seen as viable career

PROJECTS & ACTIONS
Mining human resources study
Skilled trades promotional video
Manitoulin regional economic development roundtable
Promoting skilled trades (especially to women)
Promoting experiential learning opportunities (co-op, apprenticeships, etc.)
Cultivating the design industry
Greater Sudbury “integrative workforce strategy” proposal
Supporting low growth sectors (i.e. agriculture & tourism)
Support efforts to hire internationally trained workers
Support Learning City Initiative
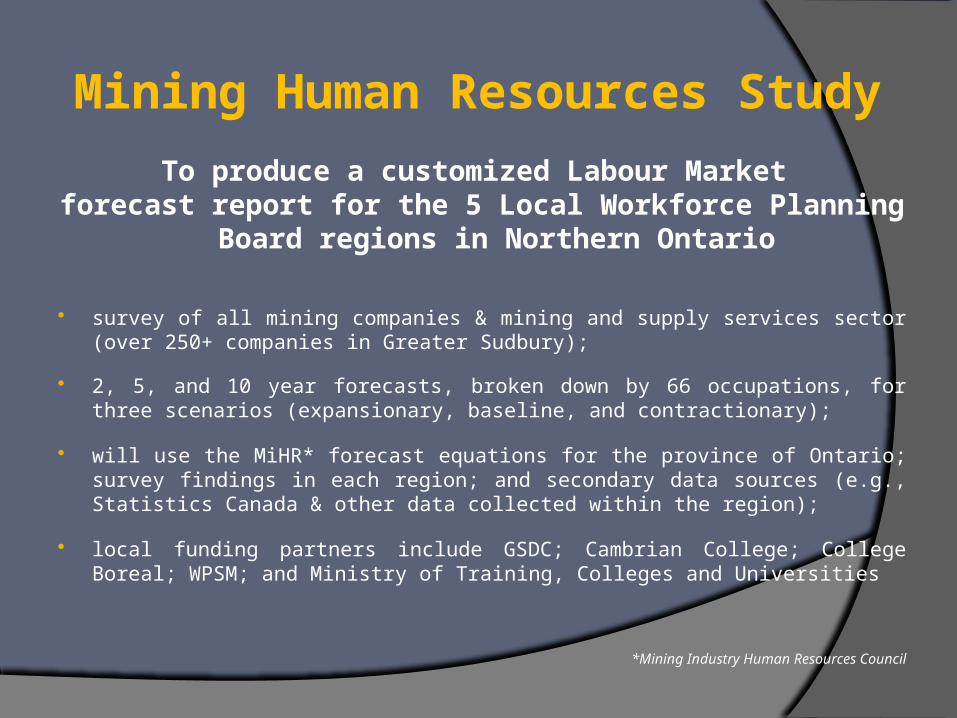
Mining Human Resources Study
To produce a customized Labour Market forecast report for the 5 Local Workforce Planning Board
regions in Northern Ontario
survey of all mining companies & mining and supply services sector (over 250+ companies in Greater Sudbury);
2, 5, and 10 year forecasts, broken down by 66 occupations, for three scenarios (expansionary, baseline, and contractionary);
will use the MiHR* forecast equations for the province of Ontario; survey findings in each region; and secondary data sources (e.g., Statistics Canada & other data collected within the region);
local funding partners include GSDC; Cambrian College; College Boreal; WPSM; and Ministry of Training, Colleges and Universities
*Mining Industry Human Resources Council

FOR MORE INFORMATION CONTACT
Reggie CaversonExecutive Director
www.planningourworkforce.ca


