2012 2013 + / – 2012 2013 + / – New Listings 3,887 4,530 + 16.5% 33,942 37,594 + 10.8% Closed Sales 2,900 3,392 + 17.0% 18,234 23,539 + 29.1% Median Sales Price* $163,000 $182,500 + 12.0% $160,000 $172,000 + 7.5% Average Sales Price* $213,846 $237,635 + 11.1% $210,600 $223,385 + 6.1% Percent of Original List Price Received* 92.4% 94.6% + 2.4% 91.9% 94.0% + 2.3% List to Close 143 134 - 6.3% 153 139 - 8.7% Days on Market Until Sale 104 96 - 7.4% 113 100 - 11.7% Cumulative Days on Market Until Sale 128 105 - 17.9% 141 114 - 19.1% Inventory of Homes for Sale 17,780 15,348 - 13.7% -- -- -- Months Supply of Inventory 7.6 5.4 - 29.6% -- -- -- + 12.0% Change in New Listings Change in Closed Sales Change in Median Sales Price August * Does not account for seller concessions. | Activity for one month can sometimes look extreme due to small sample size. | Note: CarolinaMLS did not include “showable” under contract listings in the “Pending Sales” stats before July 2012. Listing agents report listings as “Under Contract-Show” earlier in the transaction. As a result, the new “Pending Sales” stats trend higher and the new “Months Supply of Inventory” stats trend lower since July 2012. Local Market Update – August 2013 A RESEARCH TOOL PROVIDED BY THE CHARLOTTE REGIONAL REALTOR® ASSOCIATION Entire CarolinaMLS Area + 16.5% + 17.0% FOR MORE INFORMATION CONTACT A REALTOR® Year to Date Year to Date 2012 2013 August 2012 2013 ** Each dot represents the change in median sales price from the prior year using a 6-month weighted average. This means that each of the 6 months used in a dot are proportioned according to their share of sales during that period. Current as of September 9, 2013. All data from CarolinaMLS. Report provided by the Charlotte Regional REALTOR® Association. Powered by 10K Research and Marketing. Entire CarolinaMLS Area - 10% - 8% - 6% - 4% - 2% 0% + 2% + 4% + 6% + 8% + 10% 1-2008 7-2008 1-2009 7-2009 1-2010 7-2010 1-2011 7-2011 1-2012 7-2012 1-2013 7-2013 Change in Median Sales Price from Prior Year (6-Month Average)** b 33,942 18,234 37,594 23,539 New Listings Closed Sales Year to Date + 29.1% + 10.8% 3,887 2,900 4,530 3,392 New Listings Closed Sales August + 17.0% + 16.5%
Transcript
2012 2013 + / – 2012 2013 + / –
New Listings 3,887 4,530 + 16.5% 33,942 37,594 + 10.8%
* Does not account for seller concessions. | Activity for one month can sometimes look extreme due to small sample size. | Note: CarolinaMLS did not include “showable” under contract listings in the “Pending Sales” stats before July 2012. Listing agents report listings as “Under Contract-Show” earlier in the transaction. As a result, the new “Pending Sales” stats trend higher and the new “Months Supply of Inventory” stats trend lower since July 2012.
Local Market Update – August 2013 A RESEARCH TOOL PROVIDED BY THE CHARLOTTE REGIONAL REALTOR® ASSOCIATION
Entire CarolinaMLS Area
+ 16.5% + 17.0%
FOR MORE INFORMATION CONTACT A REALTOR®
Year to Date
Year to Date 2012 2013August 2012 2013
** Each dot represents the change in median sales price from the prior year using a 6-month weighted average.This means that each of the 6 months used in a dot are proportioned according to their share of sales during that period.
Current as of September 9, 2013. All data from CarolinaMLS. Report provided by the Charlotte Regional REALTOR® Association. Powered by 10K Research and Marketing.
Percent of Original List Price Received* 87.3% 90.5% + 3.7% 88.8% 85.7% - 3.5%
List to Close 226 114 - 49.6% 190 180 - 5.3%
Days on Market Until Sale 153 81 - 47.0% 135 131 - 3.6%
Cumulative Days on Market Until Sale 153 114 - 25.9% 128 140 + 9.7%
Inventory of Homes for Sale 96 80 - 16.7% -- -- --
Months Supply of Inventory 13.7 10.2 - 25.5% -- -- --* Does not account for seller concessions. | Activity for one month can sometimes look extreme due to small sample size. | Note: CarolinaMLS did not include “showable” under contract listings in the “Pending Sales” stats before July 2012. Listing agents report listings as “Under Contract-Show” earlier in the transaction. As a result, the new “Pending Sales” stats trend higher and the new “Months Supply of Inventory” stats trend lower since July 2012.
Change in Median Sales Price
A RESEARCH TOOL PROVIDED BY THE CHARLOTTE REGIONAL REALTOR® ASSOCIATION
Local Market Update – August 2013
August Year to Date
- 31.8% 0.0% + 33.5%Change in
New ListingsChange in
Closed SalesAlexander County
FOR MORE INFORMATION CONTACT A REALTOR®
Year to Date 2012 2013August 2012 2013
** Each dot represents the change in median sales price from the prior year using a 6-month weighted average.This means that each of the 6 months used in a dot are proportioned according to their share of sales during that period.
Current as of September 9, 2013. All data from CarolinaMLS. Report provided by the Charlotte Regional REALTOR® Association. Powered by 10K Research and Marketing.
Percent of Original List Price Received* 90.9% 86.0% - 5.4% 84.1% 84.4% + 0.4%
List to Close 233 272 + 16.8% 213 258 + 21.1%
Days on Market Until Sale 162 229 + 40.8% 144 169 + 17.3%
Cumulative Days on Market Until Sale 184 229 + 23.9% 203 175 - 13.5%
Inventory of Homes for Sale 131 111 - 15.3% -- -- --
Months Supply of Inventory 16.5 13.6 - 17.9% -- -- --* Does not account for seller concessions. | Activity for one month can sometimes look extreme due to small sample size. | Note: CarolinaMLS did not include “showable” under contract listings in the “Pending Sales” stats before July 2012. Listing agents report listings as “Under Contract-Show” earlier in the transaction. As a result, the new “Pending Sales” stats trend higher and the new “Months Supply of Inventory” stats trend lower since July 2012.
Change in Median Sales Price
A RESEARCH TOOL PROVIDED BY THE CHARLOTTE REGIONAL REALTOR® ASSOCIATION
Local Market Update – August 2013
August Year to Date
+ 18.8% - 11.1% - 42.1%Change in
New ListingsChange in
Closed SalesAnson County
FOR MORE INFORMATION CONTACT A REALTOR®
Year to Date 2012 2013August 2012 2013
** Each dot represents the change in median sales price from the prior year using a 6-month weighted average.This means that each of the 6 months used in a dot are proportioned according to their share of sales during that period.
Current as of September 9, 2013. All data from CarolinaMLS. Report provided by the Charlotte Regional REALTOR® Association. Powered by 10K Research and Marketing.
Percent of Original List Price Received* 92.5% 93.9% + 1.5% 92.1% 92.7% + 0.7%
List to Close 132 144 + 9.4% 150 149 - 0.7%
Days on Market Until Sale 97 110 + 13.1% 113 112 - 0.8%
Cumulative Days on Market Until Sale 126 119 - 5.4% 138 124 - 10.1%
Inventory of Homes for Sale 1,377 1,166 - 15.3% -- -- --
Months Supply of Inventory 8.2 5.4 - 33.6% -- -- --* Does not account for seller concessions. | Activity for one month can sometimes look extreme due to small sample size. | Note: CarolinaMLS did not include “showable” under contract listings in the “Pending Sales” stats before July 2012. Listing agents report listings as “Under Contract-Show” earlier in the transaction. As a result, the new “Pending Sales” stats trend higher and the new “Months Supply of Inventory” stats trend lower since July 2012.
Change in Median Sales Price
A RESEARCH TOOL PROVIDED BY THE CHARLOTTE REGIONAL REALTOR® ASSOCIATION
Local Market Update – August 2013
August Year to Date
+ 24.6% + 15.6% + 15.3%Change in
New ListingsChange in
Closed SalesCabarrus County
FOR MORE INFORMATION CONTACT A REALTOR®
Year to Date 2012 2013August 2012 2013
** Each dot represents the change in median sales price from the prior year using a 6-month weighted average.This means that each of the 6 months used in a dot are proportioned according to their share of sales during that period.
Current as of September 9, 2013. All data from CarolinaMLS. Report provided by the Charlotte Regional REALTOR® Association. Powered by 10K Research and Marketing.
Percent of Original List Price Received* 89.1% 92.9% + 4.3% 90.0% 91.5% + 1.7%
List to Close 137 142 + 4.3% 157 146 - 7.0%
Days on Market Until Sale 95 101 + 5.6% 114 109 - 4.9%
Cumulative Days on Market Until Sale 102 114 + 11.6% 135 129 - 4.2%
Inventory of Homes for Sale 1,460 1,407 - 3.6% -- -- --
Months Supply of Inventory 9.4 7.8 - 17.0% -- -- --* Does not account for seller concessions. | Activity for one month can sometimes look extreme due to small sample size. | Note: CarolinaMLS did not include “showable” under contract listings in the “Pending Sales” stats before July 2012. Listing agents report listings as “Under Contract-Show” earlier in the transaction. As a result, the new “Pending Sales” stats trend higher and the new “Months Supply of Inventory” stats trend lower since July 2012.
Change in Median Sales Price
A RESEARCH TOOL PROVIDED BY THE CHARLOTTE REGIONAL REALTOR® ASSOCIATION
Local Market Update – August 2013
August Year to Date
+ 20.0% + 5.4% + 13.6%Change in
New ListingsChange in
Closed SalesGaston County
FOR MORE INFORMATION CONTACT A REALTOR®
Year to Date 2012 2013August 2012 2013
** Each dot represents the change in median sales price from the prior year using a 6-month weighted average.This means that each of the 6 months used in a dot are proportioned according to their share of sales during that period.
Current as of September 9, 2013. All data from CarolinaMLS. Report provided by the Charlotte Regional REALTOR® Association. Powered by 10K Research and Marketing.
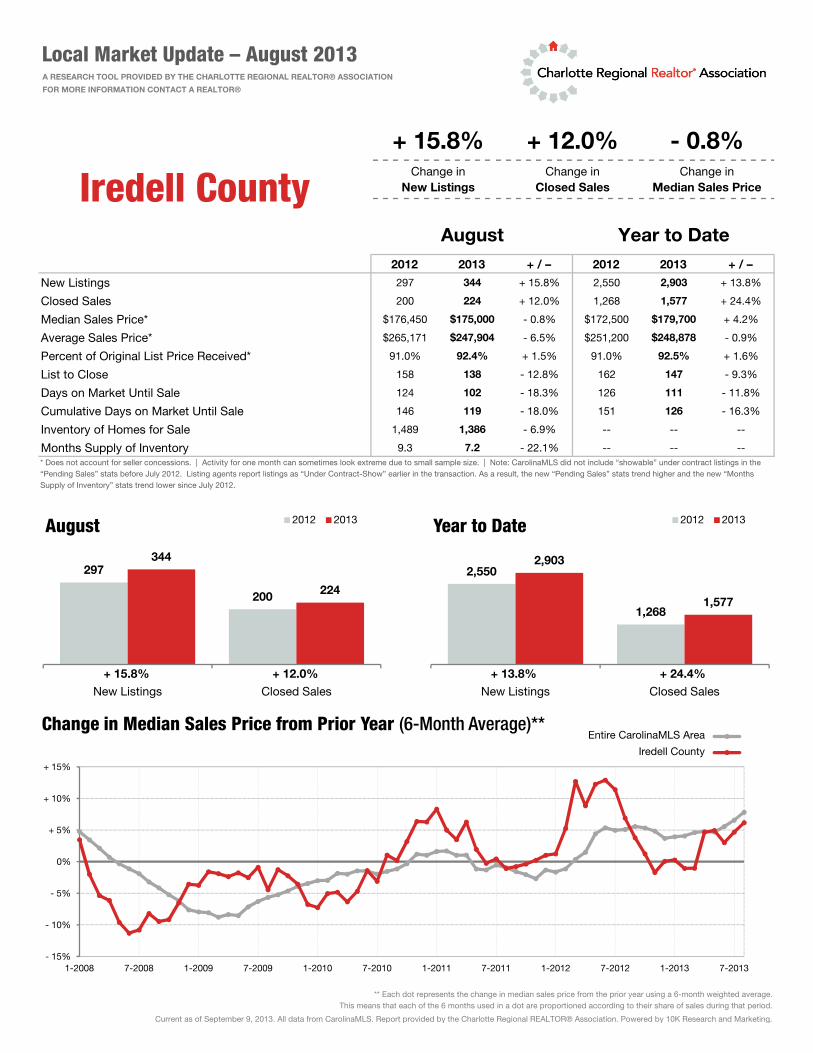
Percent of Original List Price Received* 91.0% 92.4% + 1.5% 91.0% 92.5% + 1.6%
List to Close 158 138 - 12.8% 162 147 - 9.3%
Days on Market Until Sale 124 102 - 18.3% 126 111 - 11.8%
Cumulative Days on Market Until Sale 146 119 - 18.0% 151 126 - 16.3%
Inventory of Homes for Sale 1,489 1,386 - 6.9% -- -- --
Months Supply of Inventory 9.3 7.2 - 22.1% -- -- --* Does not account for seller concessions. | Activity for one month can sometimes look extreme due to small sample size. | Note: CarolinaMLS did not include “showable” under contract listings in the “Pending Sales” stats before July 2012. Listing agents report listings as “Under Contract-Show” earlier in the transaction. As a result, the new “Pending Sales” stats trend higher and the new “Months Supply of Inventory” stats trend lower since July 2012.
Change in Median Sales Price
A RESEARCH TOOL PROVIDED BY THE CHARLOTTE REGIONAL REALTOR® ASSOCIATION
Local Market Update – August 2013
August Year to Date
+ 15.8% + 12.0% - 0.8%Change in
New ListingsChange in
Closed SalesIredell County
FOR MORE INFORMATION CONTACT A REALTOR®
Year to Date 2012 2013August 2012 2013
** Each dot represents the change in median sales price from the prior year using a 6-month weighted average.This means that each of the 6 months used in a dot are proportioned according to their share of sales during that period.
Current as of September 9, 2013. All data from CarolinaMLS. Report provided by the Charlotte Regional REALTOR® Association. Powered by 10K Research and Marketing.
Percent of Original List Price Received* 91.8% 93.1% + 1.4% 90.2% 92.5% + 2.5%
List to Close 162 165 + 1.5% 156 156 0.0%
Days on Market Until Sale 117 130 + 11.6% 119 114 - 3.7%
Cumulative Days on Market Until Sale 175 143 - 18.2% 165 138 - 16.0%
Inventory of Homes for Sale 616 565 - 8.3% -- -- --
Months Supply of Inventory 9.5 7.8 - 17.8% -- -- --* Does not account for seller concessions. | Activity for one month can sometimes look extreme due to small sample size. | Note: CarolinaMLS did not include “showable” under contract listings in the “Pending Sales” stats before July 2012. Listing agents report listings as “Under Contract-Show” earlier in the transaction. As a result, the new “Pending Sales” stats trend higher and the new “Months Supply of Inventory” stats trend lower since July 2012.
Change in Median Sales Price
A RESEARCH TOOL PROVIDED BY THE CHARLOTTE REGIONAL REALTOR® ASSOCIATION
Local Market Update – August 2013
August Year to Date
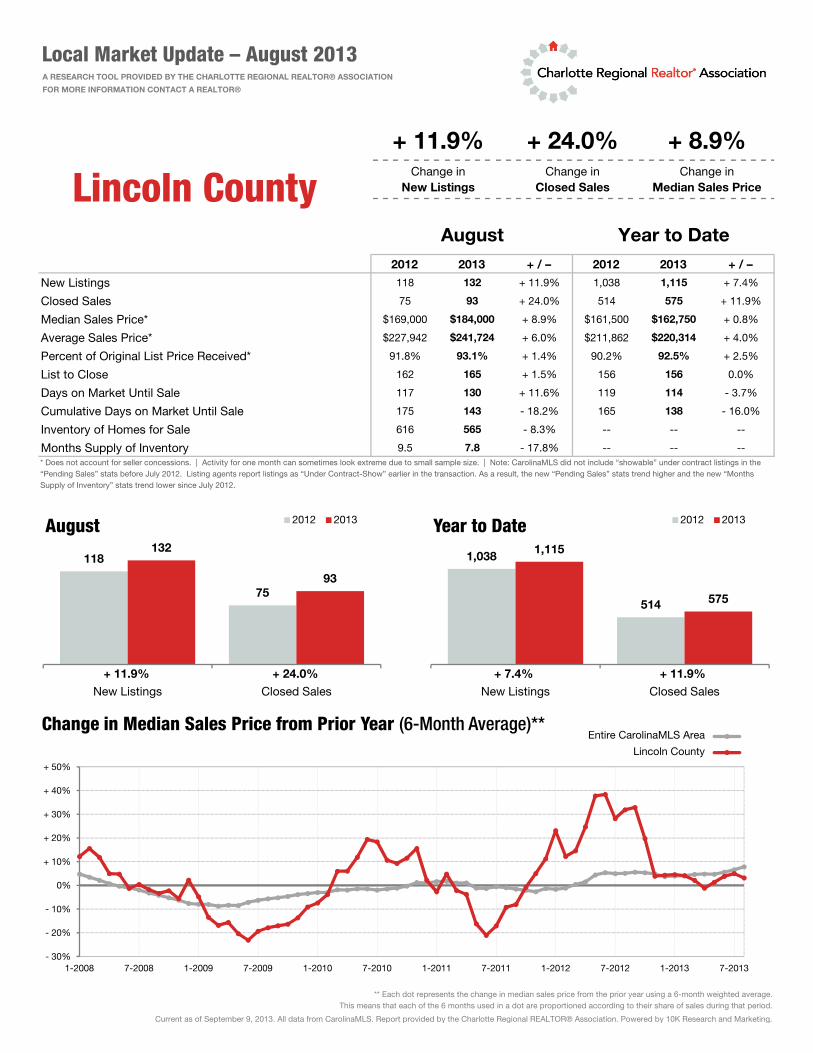
+ 11.9% + 24.0% + 8.9%Change in
New ListingsChange in
Closed SalesLincoln County
FOR MORE INFORMATION CONTACT A REALTOR®
Year to Date 2012 2013August 2012 2013
** Each dot represents the change in median sales price from the prior year using a 6-month weighted average.This means that each of the 6 months used in a dot are proportioned according to their share of sales during that period.
Current as of September 9, 2013. All data from CarolinaMLS. Report provided by the Charlotte Regional REALTOR® Association. Powered by 10K Research and Marketing.
Percent of Original List Price Received* 93.1% 95.5% + 2.6% 92.7% 95.4% + 2.9%
List to Close 140 121 - 13.3% 146 128 - 12.3%
Days on Market Until Sale 99 83 - 16.4% 108 88 - 18.7%
Cumulative Days on Market Until Sale 124 87 - 29.5% 139 101 - 27.4%
Inventory of Homes for Sale 6,501 4,840 - 25.5% -- -- --
Months Supply of Inventory 6.0 3.6 - 40.3% -- -- --* Does not account for seller concessions. | Activity for one month can sometimes look extreme due to small sample size. | Note: CarolinaMLS did not include “showable” under contract listings in the “Pending Sales” stats before July 2012. Listing agents report listings as “Under Contract-Show” earlier in the transaction. As a result, the new “Pending Sales” stats trend higher and the new “Months Supply of Inventory” stats trend lower since July 2012.
Change in Median Sales Price
A RESEARCH TOOL PROVIDED BY THE CHARLOTTE REGIONAL REALTOR® ASSOCIATION
Local Market Update – August 2013
August Year to Date
+ 15.6% + 18.1% + 11.6%Change in
New ListingsChange in
Closed SalesMecklenburg
County
FOR MORE INFORMATION CONTACT A REALTOR®
Year to Date 2012 2013August 2012 2013
** Each dot represents the change in median sales price from the prior year using a 6-month weighted average.This means that each of the 6 months used in a dot are proportioned according to their share of sales during that period.
Current as of September 9, 2013. All data from CarolinaMLS. Report provided by the Charlotte Regional REALTOR® Association. Powered by 10K Research and Marketing.
Percent of Original List Price Received* 94.1% 96.8% + 2.9% 94.0% 95.8% + 1.9%
List to Close 153 120 - 21.7% 147 131 - 10.9%
Days on Market Until Sale 105 88 - 16.4% 104 92 - 11.5%
Cumulative Days on Market Until Sale 124 91 - 26.9% 130 105 - 19.2%
Inventory of Homes for Sale 1,188 803 - 32.4% -- -- --
Months Supply of Inventory 6.6 3.5 - 46.2% -- -- --* Does not account for seller concessions. | Activity for one month can sometimes look extreme due to small sample size. | Note: CarolinaMLS did not include “showable” under contract listings in the “Pending Sales” stats before July 2012. Listing agents report listings as “Under Contract-Show” earlier in the transaction. As a result, the new “Pending Sales” stats trend higher and the new “Months Supply of Inventory” stats trend lower since July 2012.
Change in Median Sales Price
A RESEARCH TOOL PROVIDED BY THE CHARLOTTE REGIONAL REALTOR® ASSOCIATION
Local Market Update – August 2013
August Year to Date
+ 14.6% + 5.0% + 14.5%Change in
New ListingsChange in
Closed SalesMecklenburg -
(N) Area 01
FOR MORE INFORMATION CONTACT A REALTOR®
Year to Date 2012 2013August 2012 2013
** Each dot represents the change in median sales price from the prior year using a 6-month weighted average.This means that each of the 6 months used in a dot are proportioned according to their share of sales during that period.
Current as of September 9, 2013. All data from CarolinaMLS. Report provided by the Charlotte Regional REALTOR® Association. Powered by 10K Research and Marketing.
Percent of Original List Price Received* 91.5% 95.5% + 4.4% 91.7% 95.6% + 4.3%
List to Close 142 116 - 18.6% 137 132 - 3.6%
Days on Market Until Sale 96 78 - 19.1% 94 83 - 11.7%
Cumulative Days on Market Until Sale 118 86 - 26.5% 127 98 - 22.6%
Inventory of Homes for Sale 751 501 - 33.3% -- -- --
Months Supply of Inventory 6.0 3.3 - 46.0% -- -- --* Does not account for seller concessions. | Activity for one month can sometimes look extreme due to small sample size. | Note: CarolinaMLS did not include “showable” under contract listings in the “Pending Sales” stats before July 2012. Listing agents report listings as “Under Contract-Show” earlier in the transaction. As a result, the new “Pending Sales” stats trend higher and the new “Months Supply of Inventory” stats trend lower since July 2012.
Change in Median Sales Price
A RESEARCH TOOL PROVIDED BY THE CHARLOTTE REGIONAL REALTOR® ASSOCIATION
Local Market Update – August 2013
August Year to Date
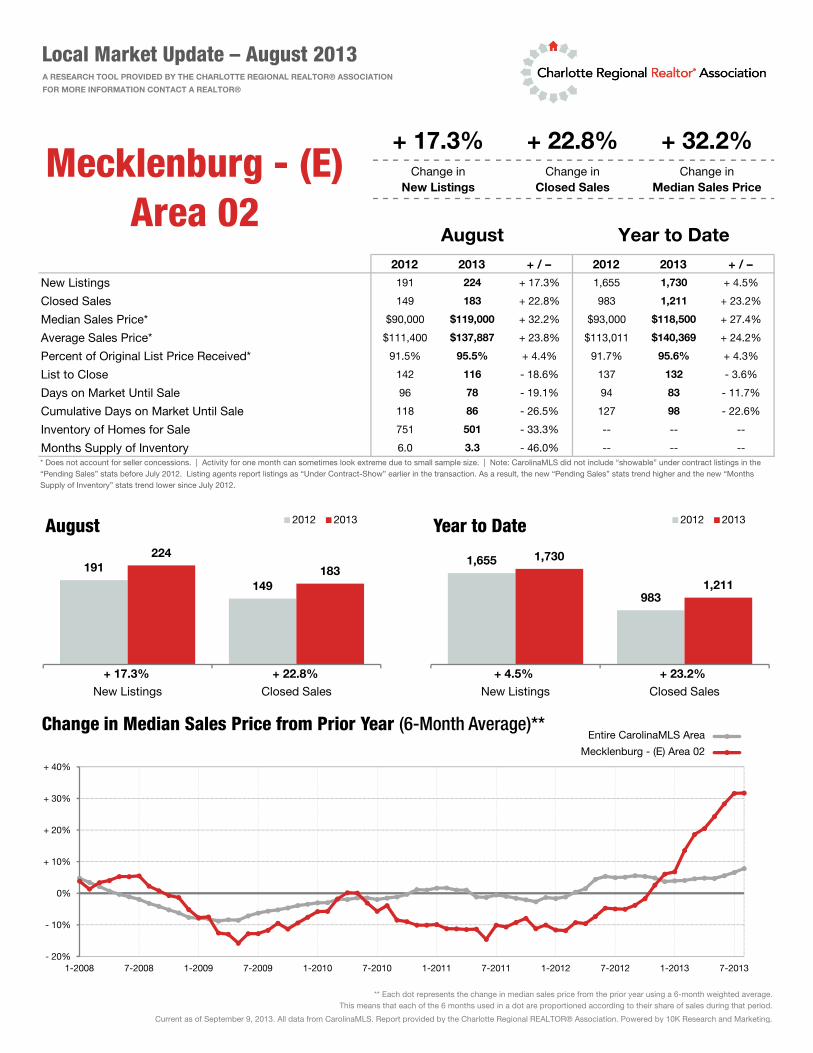
+ 17.3% + 22.8% + 32.2%Change in
New ListingsChange in
Closed SalesMecklenburg - (E)
Area 02
FOR MORE INFORMATION CONTACT A REALTOR®
Year to Date 2012 2013August 2012 2013
** Each dot represents the change in median sales price from the prior year using a 6-month weighted average.This means that each of the 6 months used in a dot are proportioned according to their share of sales during that period.
Current as of September 9, 2013. All data from CarolinaMLS. Report provided by the Charlotte Regional REALTOR® Association. Powered by 10K Research and Marketing.
Percent of Original List Price Received* 92.1% 93.2% + 1.2% 91.4% 94.2% + 3.1%
List to Close 133 126 - 5.7% 141 135 - 4.3%
Days on Market Until Sale 96 95 - 1.2% 103 99 - 4.4%
Cumulative Days on Market Until Sale 131 111 - 15.5% 137 123 - 10.7%
Inventory of Homes for Sale 529 378 - 28.5% -- -- --
Months Supply of Inventory 6.7 3.8 - 43.1% -- -- --* Does not account for seller concessions. | Activity for one month can sometimes look extreme due to small sample size. | Note: CarolinaMLS did not include “showable” under contract listings in the “Pending Sales” stats before July 2012. Listing agents report listings as “Under Contract-Show” earlier in the transaction. As a result, the new “Pending Sales” stats trend higher and the new “Months Supply of Inventory” stats trend lower since July 2012.
Change in Median Sales Price
A RESEARCH TOOL PROVIDED BY THE CHARLOTTE REGIONAL REALTOR® ASSOCIATION
Local Market Update – August 2013
August Year to Date
+ 16.4% + 10.2% - 7.0%Change in
New ListingsChange in
Closed SalesMecklenburg - (SE) Area 03
FOR MORE INFORMATION CONTACT A REALTOR®
Year to Date 2012 2013August 2012 2013
** Each dot represents the change in median sales price from the prior year using a 6-month weighted average.This means that each of the 6 months used in a dot are proportioned according to their share of sales during that period.
Current as of September 9, 2013. All data from CarolinaMLS. Report provided by the Charlotte Regional REALTOR® Association. Powered by 10K Research and Marketing.
Percent of Original List Price Received* 93.3% 95.6% + 2.5% 92.5% 95.5% + 3.2%
List to Close 122 127 + 3.7% 142 117 - 17.6%
Days on Market Until Sale 95 89 - 6.8% 112 83 - 26.3%
Cumulative Days on Market Until Sale 128 89 - 30.7% 148 99 - 33.2%
Inventory of Homes for Sale 686 544 - 20.7% -- -- --
Months Supply of Inventory 6.1 3.8 - 37.6% -- -- --* Does not account for seller concessions. | Activity for one month can sometimes look extreme due to small sample size. | Note: CarolinaMLS did not include “showable” under contract listings in the “Pending Sales” stats before July 2012. Listing agents report listings as “Under Contract-Show” earlier in the transaction. As a result, the new “Pending Sales” stats trend higher and the new “Months Supply of Inventory” stats trend lower since July 2012.
Change in Median Sales Price
A RESEARCH TOOL PROVIDED BY THE CHARLOTTE REGIONAL REALTOR® ASSOCIATION
Local Market Update – August 2013
August Year to Date
+ 3.2% + 35.9% + 11.5%Change in
New ListingsChange in
Closed SalesMecklenburg - (SSE) Area 04
FOR MORE INFORMATION CONTACT A REALTOR®
Year to Date 2012 2013August 2012 2013
** Each dot represents the change in median sales price from the prior year using a 6-month weighted average.This means that each of the 6 months used in a dot are proportioned according to their share of sales during that period.
Current as of September 9, 2013. All data from CarolinaMLS. Report provided by the Charlotte Regional REALTOR® Association. Powered by 10K Research and Marketing.
Percent of Original List Price Received* 92.4% 95.2% + 3.0% 93.0% 95.4% + 2.6%
List to Close 146 109 - 25.4% 147 119 - 19.0%
Days on Market Until Sale 100 78 - 22.0% 117 83 - 28.7%
Cumulative Days on Market Until Sale 127 85 - 32.6% 148 95 - 36.1%
Inventory of Homes for Sale 1,122 856 - 23.7% -- -- --
Months Supply of Inventory 5.5 3.4 - 38.3% -- -- --* Does not account for seller concessions. | Activity for one month can sometimes look extreme due to small sample size. | Note: CarolinaMLS did not include “showable” under contract listings in the “Pending Sales” stats before July 2012. Listing agents report listings as “Under Contract-Show” earlier in the transaction. As a result, the new “Pending Sales” stats trend higher and the new “Months Supply of Inventory” stats trend lower since July 2012.
Change in Median Sales Price
A RESEARCH TOOL PROVIDED BY THE CHARLOTTE REGIONAL REALTOR® ASSOCIATION
Local Market Update – August 2013
August Year to Date
+ 18.6% + 16.5% + 12.4%Change in
New ListingsChange in
Closed SalesMecklenburg - (S)
Area 05
FOR MORE INFORMATION CONTACT A REALTOR®
Year to Date 2012 2013August 2012 2013
** Each dot represents the change in median sales price from the prior year using a 6-month weighted average.This means that each of the 6 months used in a dot are proportioned according to their share of sales during that period.
Current as of September 9, 2013. All data from CarolinaMLS. Report provided by the Charlotte Regional REALTOR® Association. Powered by 10K Research and Marketing.
Percent of Original List Price Received* 95.4% 96.1% + 0.7% 92.3% 94.8% + 2.7%
List to Close 126 138 + 9.8% 154 128 - 16.9%
Days on Market Until Sale 90 74 - 17.2% 118 86 - 26.8%
Cumulative Days on Market Until Sale 111 73 - 33.8% 150 97 - 35.4%
Inventory of Homes for Sale 424 311 - 26.7% -- -- --
Months Supply of Inventory 4.9 2.8 - 43.1% -- -- --* Does not account for seller concessions. | Activity for one month can sometimes look extreme due to small sample size. | Note: CarolinaMLS did not include “showable” under contract listings in the “Pending Sales” stats before July 2012. Listing agents report listings as “Under Contract-Show” earlier in the transaction. As a result, the new “Pending Sales” stats trend higher and the new “Months Supply of Inventory” stats trend lower since July 2012.
Change in Median Sales Price
A RESEARCH TOOL PROVIDED BY THE CHARLOTTE REGIONAL REALTOR® ASSOCIATION
Local Market Update – August 2013
August Year to Date
- 0.7% + 26.3% + 9.1%Change in
New ListingsChange in
Closed SalesMecklenburg - (SSW) Area 06
FOR MORE INFORMATION CONTACT A REALTOR®
Year to Date 2012 2013August 2012 2013
** Each dot represents the change in median sales price from the prior year using a 6-month weighted average.This means that each of the 6 months used in a dot are proportioned according to their share of sales during that period.
Current as of September 9, 2013. All data from CarolinaMLS. Report provided by the Charlotte Regional REALTOR® Association. Powered by 10K Research and Marketing.
Percent of Original List Price Received* 94.2% 97.5% + 3.5% 93.6% 96.9% + 3.5%
List to Close 132 108 - 17.8% 151 123 - 18.5%
Days on Market Until Sale 88 67 - 23.4% 96 76 - 20.5%
Cumulative Days on Market Until Sale 92 69 - 24.7% 113 78 - 31.3%
Inventory of Homes for Sale 393 306 - 22.1% -- -- --
Months Supply of Inventory 5.1 3.2 - 37.1% -- -- --* Does not account for seller concessions. | Activity for one month can sometimes look extreme due to small sample size. | Note: CarolinaMLS did not include “showable” under contract listings in the “Pending Sales” stats before July 2012. Listing agents report listings as “Under Contract-Show” earlier in the transaction. As a result, the new “Pending Sales” stats trend higher and the new “Months Supply of Inventory” stats trend lower since July 2012.
Change in Median Sales Price
A RESEARCH TOOL PROVIDED BY THE CHARLOTTE REGIONAL REALTOR® ASSOCIATION
Local Market Update – August 2013
August Year to Date
+ 24.8% + 51.4% + 26.4%Change in
New ListingsChange in
Closed SalesMecklenburg - (SW) Area 07
FOR MORE INFORMATION CONTACT A REALTOR®
Year to Date 2012 2013August 2012 2013
** Each dot represents the change in median sales price from the prior year using a 6-month weighted average.This means that each of the 6 months used in a dot are proportioned according to their share of sales during that period.
Current as of September 9, 2013. All data from CarolinaMLS. Report provided by the Charlotte Regional REALTOR® Association. Powered by 10K Research and Marketing.
Percent of Original List Price Received* 91.7% 90.1% - 1.7% 89.6% 92.6% + 3.3%
List to Close 128 138 + 7.5% 137 133 - 2.9%
Days on Market Until Sale 85 98 + 15.0% 96 87 - 9.1%
Cumulative Days on Market Until Sale 123 95 - 23.0% 137 98 - 28.5%
Inventory of Homes for Sale 304 224 - 26.3% -- -- --
Months Supply of Inventory 6.0 4.0 - 33.0% -- -- --* Does not account for seller concessions. | Activity for one month can sometimes look extreme due to small sample size. | Note: CarolinaMLS did not include “showable” under contract listings in the “Pending Sales” stats before July 2012. Listing agents report listings as “Under Contract-Show” earlier in the transaction. As a result, the new “Pending Sales” stats trend higher and the new “Months Supply of Inventory” stats trend lower since July 2012.
Change in Median Sales Price
A RESEARCH TOOL PROVIDED BY THE CHARLOTTE REGIONAL REALTOR® ASSOCIATION
Local Market Update – August 2013
August Year to Date
- 1.3% + 9.3% + 61.2%Change in
New ListingsChange in
Closed SalesMecklenburg -
(W) Area 08
FOR MORE INFORMATION CONTACT A REALTOR®
Year to Date 2012 2013August 2012 2013
** Each dot represents the change in median sales price from the prior year using a 6-month weighted average.This means that each of the 6 months used in a dot are proportioned according to their share of sales during that period.
Current as of September 9, 2013. All data from CarolinaMLS. Report provided by the Charlotte Regional REALTOR® Association. Powered by 10K Research and Marketing.
Percent of Original List Price Received* 93.6% 96.4% + 3.0% 93.2% 96.5% + 3.5%
List to Close 130 98 - 24.7% 138 122 - 11.6%
Days on Market Until Sale 98 63 - 35.5% 99 82 - 17.2%
Cumulative Days on Market Until Sale 124 69 - 44.4% 129 92 - 28.4%
Inventory of Homes for Sale 446 358 - 19.7% -- -- --
Months Supply of Inventory 5.2 3.4 - 34.5% -- -- --* Does not account for seller concessions. | Activity for one month can sometimes look extreme due to small sample size. | Note: CarolinaMLS did not include “showable” under contract listings in the “Pending Sales” stats before July 2012. Listing agents report listings as “Under Contract-Show” earlier in the transaction. As a result, the new “Pending Sales” stats trend higher and the new “Months Supply of Inventory” stats trend lower since July 2012.
Change in Median Sales Price
A RESEARCH TOOL PROVIDED BY THE CHARLOTTE REGIONAL REALTOR® ASSOCIATION
Local Market Update – August 2013
August Year to Date
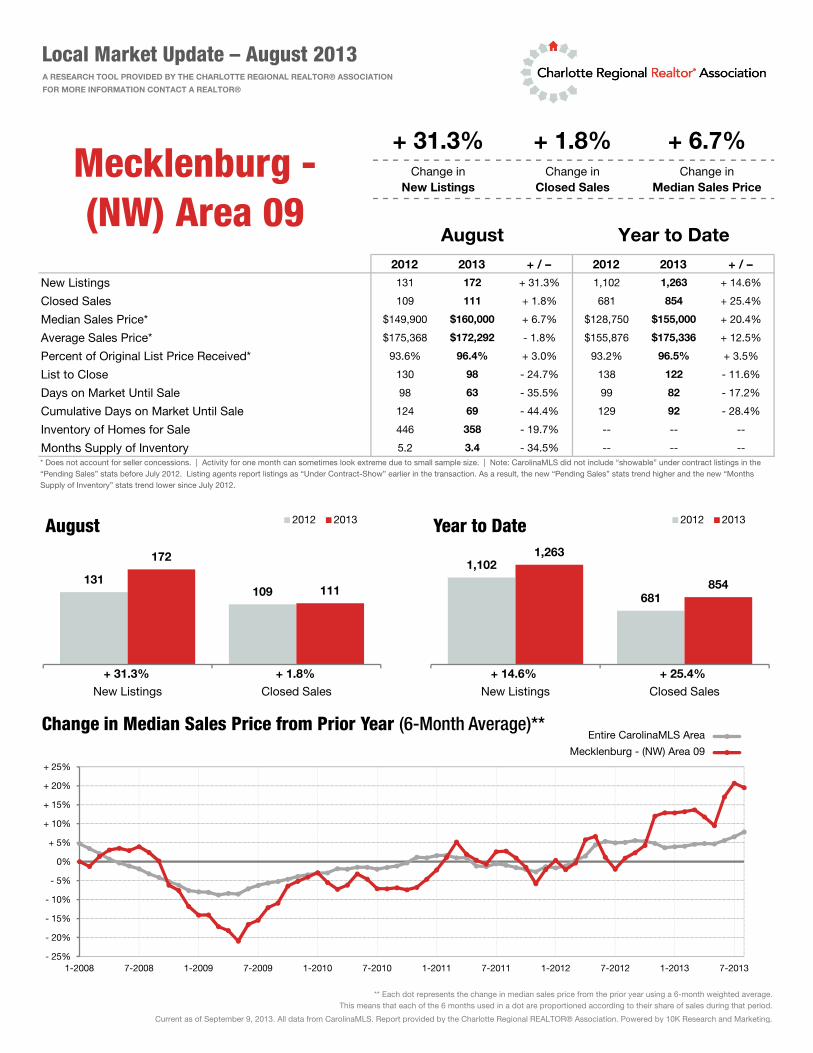
+ 31.3% + 1.8% + 6.7%Change in
New ListingsChange in
Closed SalesMecklenburg - (NW) Area 09
FOR MORE INFORMATION CONTACT A REALTOR®
Year to Date 2012 2013August 2012 2013
** Each dot represents the change in median sales price from the prior year using a 6-month weighted average.This means that each of the 6 months used in a dot are proportioned according to their share of sales during that period.
Current as of September 9, 2013. All data from CarolinaMLS. Report provided by the Charlotte Regional REALTOR® Association. Powered by 10K Research and Marketing.
Percent of Original List Price Received* 91.5% 93.4% + 2.1% 91.2% 93.1% + 2.1%
List to Close 159 156 - 2.1% 164 159 - 3.0%
Days on Market Until Sale 125 121 - 2.9% 130 119 - 7.8%
Cumulative Days on Market Until Sale 185 135 - 26.7% 179 139 - 22.0%
Inventory of Homes for Sale 1,168 1,123 - 3.9% -- -- --
Months Supply of Inventory 10.3 8.4 - 18.0% -- -- --* Does not account for seller concessions. | Activity for one month can sometimes look extreme due to small sample size. | Note: CarolinaMLS did not include “showable” under contract listings in the “Pending Sales” stats before July 2012. Listing agents report listings as “Under Contract-Show” earlier in the transaction. As a result, the new “Pending Sales” stats trend higher and the new “Months Supply of Inventory” stats trend lower since July 2012.
Change in Median Sales Price
A RESEARCH TOOL PROVIDED BY THE CHARLOTTE REGIONAL REALTOR® ASSOCIATION
Local Market Update – August 2013
August Year to Date
+ 31.7% + 6.9% - 3.6%Change in
New ListingsChange in
Closed SalesLake Norman /
Area 13
FOR MORE INFORMATION CONTACT A REALTOR®
Year to Date 2012 2013August 2012 2013
** Each dot represents the change in median sales price from the prior year using a 6-month weighted average.This means that each of the 6 months used in a dot are proportioned according to their share of sales during that period.
Current as of September 9, 2013. All data from CarolinaMLS. Report provided by the Charlotte Regional REALTOR® Association. Powered by 10K Research and Marketing.
Percent of Original List Price Received* 93.4% 95.3% + 2.0% 92.6% 93.8% + 1.3%
List to Close 150 163 + 9.1% 162 158 - 2.5%
Days on Market Until Sale 124 120 - 3.4% 125 121 - 3.1%
Cumulative Days on Market Until Sale 170 126 - 26.1% 161 146 - 9.1%
Inventory of Homes for Sale 440 393 - 10.7% -- -- --
Months Supply of Inventory 10.8 7.6 - 29.2% -- -- --* Does not account for seller concessions. | Activity for one month can sometimes look extreme due to small sample size. | Note: CarolinaMLS did not include “showable” under contract listings in the “Pending Sales” stats before July 2012. Listing agents report listings as “Under Contract-Show” earlier in the transaction. As a result, the new “Pending Sales” stats trend higher and the new “Months Supply of Inventory” stats trend lower since July 2012.
Change in Median Sales Price
A RESEARCH TOOL PROVIDED BY THE CHARLOTTE REGIONAL REALTOR® ASSOCIATION
Local Market Update – August 2013
August Year to Date
- 9.1% + 32.7% - 5.6%Change in
New ListingsChange in
Closed SalesLake Wylie / Area
15
FOR MORE INFORMATION CONTACT A REALTOR®
Year to Date 2012 2013August 2012 2013
** Each dot represents the change in median sales price from the prior year using a 6-month weighted average.This means that each of the 6 months used in a dot are proportioned according to their share of sales during that period.
Current as of September 9, 2013. All data from CarolinaMLS. Report provided by the Charlotte Regional REALTOR® Association. Powered by 10K Research and Marketing.
Percent of Original List Price Received* 93.3% 94.7% + 1.5% 92.7% 95.5% + 3.0%
List to Close 154 189 + 22.3% 171 148 - 13.5%
Days on Market Until Sale 113 115 + 2.5% 135 105 - 22.2%
Cumulative Days on Market Until Sale 135 107 - 20.2% 158 112 - 29.2%
Inventory of Homes for Sale 138 97 - 29.7% -- -- --
Months Supply of Inventory 6.6 3.9 - 41.0% -- -- --* Does not account for seller concessions. | Activity for one month can sometimes look extreme due to small sample size. | Note: CarolinaMLS did not include “showable” under contract listings in the “Pending Sales” stats before July 2012. Listing agents report listings as “Under Contract-Show” earlier in the transaction. As a result, the new “Pending Sales” stats trend higher and the new “Months Supply of Inventory” stats trend lower since July 2012.
Change in Median Sales Price
A RESEARCH TOOL PROVIDED BY THE CHARLOTTE REGIONAL REALTOR® ASSOCIATION
Local Market Update – August 2013
August Year to Date
+ 19.4% + 16.0% - 10.7%Change in
New ListingsChange in
Closed SalesUptown / Area 99
FOR MORE INFORMATION CONTACT A REALTOR®
Year to Date 2012 2013August 2012 2013
** Each dot represents the change in median sales price from the prior year using a 6-month weighted average.This means that each of the 6 months used in a dot are proportioned according to their share of sales during that period.
Current as of September 9, 2013. All data from CarolinaMLS. Report provided by the Charlotte Regional REALTOR® Association. Powered by 10K Research and Marketing.
Percent of Original List Price Received* 85.7% 84.7% - 1.2% 84.8% 81.6% - 3.8%
List to Close 157 304 + 94.2% 233 337 + 44.6%
Days on Market Until Sale 120 272 + 126.6% 171 234 + 36.4%
Cumulative Days on Market Until Sale 119 306 + 156.4% 172 242 + 40.3%
Inventory of Homes for Sale 333 304 - 8.7% -- -- --
Months Supply of Inventory 27.6 26.4 - 4.1% -- -- --* Does not account for seller concessions. | Activity for one month can sometimes look extreme due to small sample size. | Note: CarolinaMLS did not include “showable” under contract listings in the “Pending Sales” stats before July 2012. Listing agents report listings as “Under Contract-Show” earlier in the transaction. As a result, the new “Pending Sales” stats trend higher and the new “Months Supply of Inventory” stats trend lower since July 2012.
Change in Median Sales Price
A RESEARCH TOOL PROVIDED BY THE CHARLOTTE REGIONAL REALTOR® ASSOCIATION
Local Market Update – August 2013
August Year to Date
+ 18.2% - 30.0% + 47.1%Change in
New ListingsChange in
Closed SalesMontgomery
County
FOR MORE INFORMATION CONTACT A REALTOR®
Year to Date 2012 2013August 2012 2013
** Each dot represents the change in median sales price from the prior year using a 6-month weighted average.This means that each of the 6 months used in a dot are proportioned according to their share of sales during that period.
Current as of September 9, 2013. All data from CarolinaMLS. Report provided by the Charlotte Regional REALTOR® Association. Powered by 10K Research and Marketing.
Percent of Original List Price Received* 86.4% 90.1% + 4.3% 86.7% 88.2% + 1.7%
List to Close 165 150 - 9.3% 187 180 - 3.7%
Days on Market Until Sale 130 99 - 23.3% 135 137 + 1.8%
Cumulative Days on Market Until Sale 162 104 - 35.4% 157 152 - 3.1%
Inventory of Homes for Sale 433 420 - 3.0% -- -- --
Months Supply of Inventory 15.9 12.4 - 21.9% -- -- --* Does not account for seller concessions. | Activity for one month can sometimes look extreme due to small sample size. | Note: CarolinaMLS did not include “showable” under contract listings in the “Pending Sales” stats before July 2012. Listing agents report listings as “Under Contract-Show” earlier in the transaction. As a result, the new “Pending Sales” stats trend higher and the new “Months Supply of Inventory” stats trend lower since July 2012.
Change in Median Sales Price
A RESEARCH TOOL PROVIDED BY THE CHARLOTTE REGIONAL REALTOR® ASSOCIATION
Local Market Update – August 2013
August Year to Date
+ 25.0% + 16.7% + 24.4%Change in
New ListingsChange in
Closed SalesStanly County
FOR MORE INFORMATION CONTACT A REALTOR®
Year to Date 2012 2013August 2012 2013
** Each dot represents the change in median sales price from the prior year using a 6-month weighted average.This means that each of the 6 months used in a dot are proportioned according to their share of sales during that period.
Current as of September 9, 2013. All data from CarolinaMLS. Report provided by the Charlotte Regional REALTOR® Association. Powered by 10K Research and Marketing.
Percent of Original List Price Received* 93.8% 96.1% + 2.5% 93.0% 95.0% + 2.2%
List to Close 138 134 - 2.9% 146 137 - 6.2%
Days on Market Until Sale 102 94 - 7.5% 108 97 - 10.2%
Cumulative Days on Market Until Sale 126 102 - 19.1% 137 111 - 18.7%
Inventory of Homes for Sale 1,618 1,330 - 17.8% -- -- --
Months Supply of Inventory 7.0 4.5 - 35.6% -- -- --* Does not account for seller concessions. | Activity for one month can sometimes look extreme due to small sample size. | Note: CarolinaMLS did not include “showable” under contract listings in the “Pending Sales” stats before July 2012. Listing agents report listings as “Under Contract-Show” earlier in the transaction. As a result, the new “Pending Sales” stats trend higher and the new “Months Supply of Inventory” stats trend lower since July 2012.
Change in Median Sales Price
A RESEARCH TOOL PROVIDED BY THE CHARLOTTE REGIONAL REALTOR® ASSOCIATION
Local Market Update – August 2013
August Year to Date
+ 8.4% + 11.7% + 11.2%Change in
New ListingsChange in
Closed SalesUnion County
FOR MORE INFORMATION CONTACT A REALTOR®
Year to Date 2012 2013August 2012 2013
** Each dot represents the change in median sales price from the prior year using a 6-month weighted average.This means that each of the 6 months used in a dot are proportioned according to their share of sales during that period.
Current as of September 9, 2013. All data from CarolinaMLS. Report provided by the Charlotte Regional REALTOR® Association. Powered by 10K Research and Marketing.
Median Sales Price* $0 $185,000 -- $102,950 $185,000 + 79.7%
Average Sales Price* $0 $185,000 -- $102,950 $185,000 + 79.7%
Percent of Original List Price Received* 0.0% 86.1% -- 92.5% 86.1% - 6.9%
List to Close 0 448 -- 155 448 + 189.0%
Days on Market Until Sale 0 427 -- 139 427 + 207.2%
Cumulative Days on Market Until Sale 0 427 -- 139 427 + 207.2%
Inventory of Homes for Sale 8 7 - 12.5% -- -- --
Months Supply of Inventory 8.0 3.5 - 56.3% -- -- --* Does not account for seller concessions. | Activity for one month can sometimes look extreme due to small sample size. | Note: CarolinaMLS did not include “showable” under contract listings in the “Pending Sales” stats before July 2012. Listing agents report listings as “Under Contract-Show” earlier in the transaction. As a result, the new “Pending Sales” stats trend higher and the new “Months Supply of Inventory” stats trend lower since July 2012.
Change in Median Sales Price
A RESEARCH TOOL PROVIDED BY THE CHARLOTTE REGIONAL REALTOR® ASSOCIATION
Local Market Update – August 2013
August Year to Date
-- -- --Change in
New ListingsChange in
Closed SalesCherokee County,
SC
FOR MORE INFORMATION CONTACT A REALTOR®
Year to Date 2012 2013August 2012 2013
** Each dot represents the change in median sales price from the prior year using a 6-month weighted average.This means that each of the 6 months used in a dot are proportioned according to their share of sales during that period.
Current as of September 9, 2013. All data from CarolinaMLS. Report provided by the Charlotte Regional REALTOR® Association. Powered by 10K Research and Marketing.
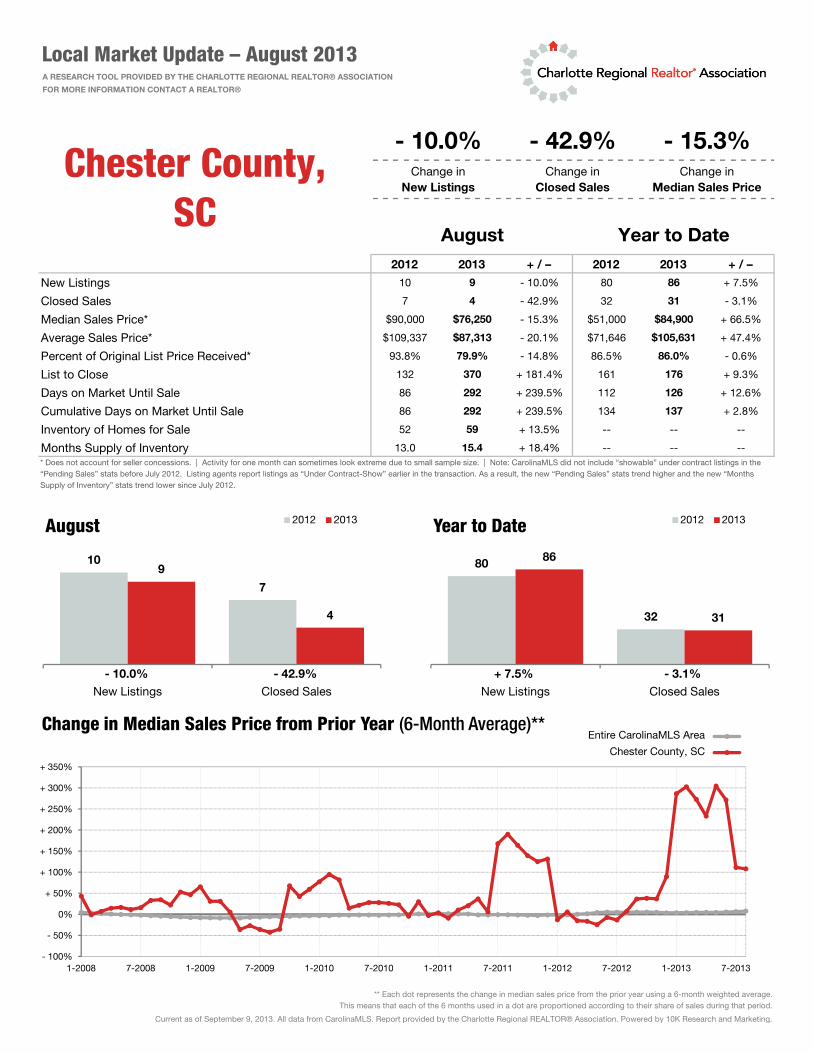
Percent of Original List Price Received* 93.8% 79.9% - 14.8% 86.5% 86.0% - 0.6%
List to Close 132 370 + 181.4% 161 176 + 9.3%
Days on Market Until Sale 86 292 + 239.5% 112 126 + 12.6%
Cumulative Days on Market Until Sale 86 292 + 239.5% 134 137 + 2.8%
Inventory of Homes for Sale 52 59 + 13.5% -- -- --
Months Supply of Inventory 13.0 15.4 + 18.4% -- -- --* Does not account for seller concessions. | Activity for one month can sometimes look extreme due to small sample size. | Note: CarolinaMLS did not include “showable” under contract listings in the “Pending Sales” stats before July 2012. Listing agents report listings as “Under Contract-Show” earlier in the transaction. As a result, the new “Pending Sales” stats trend higher and the new “Months Supply of Inventory” stats trend lower since July 2012.
Change in Median Sales Price
A RESEARCH TOOL PROVIDED BY THE CHARLOTTE REGIONAL REALTOR® ASSOCIATION
Local Market Update – August 2013
August Year to Date
- 10.0% - 42.9% - 15.3%Change in
New ListingsChange in
Closed SalesChester County,
SC
FOR MORE INFORMATION CONTACT A REALTOR®
Year to Date 2012 2013August 2012 2013
** Each dot represents the change in median sales price from the prior year using a 6-month weighted average.This means that each of the 6 months used in a dot are proportioned according to their share of sales during that period.
Current as of September 9, 2013. All data from CarolinaMLS. Report provided by the Charlotte Regional REALTOR® Association. Powered by 10K Research and Marketing.
Percent of Original List Price Received* 91.4% 79.6% - 12.9% 85.6% 80.9% - 5.5%
List to Close 108 538 + 397.8% 188 249 + 32.4%
Days on Market Until Sale 79 467 + 490.7% 141 202 + 43.4%
Cumulative Days on Market Until Sale 170 467 + 174.5% 149 208 + 39.9%
Inventory of Homes for Sale 47 44 - 6.4% -- -- --
Months Supply of Inventory 20.9 13.8 - 33.8% -- -- --* Does not account for seller concessions. | Activity for one month can sometimes look extreme due to small sample size. | Note: CarolinaMLS did not include “showable” under contract listings in the “Pending Sales” stats before July 2012. Listing agents report listings as “Under Contract-Show” earlier in the transaction. As a result, the new “Pending Sales” stats trend higher and the new “Months Supply of Inventory” stats trend lower since July 2012.
Change in Median Sales Price
A RESEARCH TOOL PROVIDED BY THE CHARLOTTE REGIONAL REALTOR® ASSOCIATION
Local Market Update – August 2013
August Year to Date
+ 40.0% + 50.0% - 43.5%Change in
New ListingsChange in
Closed SalesChesterfield County, SC
FOR MORE INFORMATION CONTACT A REALTOR®
Year to Date 2012 2013August 2012 2013
** Each dot represents the change in median sales price from the prior year using a 6-month weighted average.This means that each of the 6 months used in a dot are proportioned according to their share of sales during that period.
Current as of September 9, 2013. All data from CarolinaMLS. Report provided by the Charlotte Regional REALTOR® Association. Powered by 10K Research and Marketing.
Median Sales Price* $0 $0 -- $283,500 $224,900 - 20.7%
Average Sales Price* $0 $0 -- $283,500 $224,900 - 20.7%
Percent of Original List Price Received* 0.0% 0.0% -- 87.4% 93.7% + 7.2%
List to Close 0 0 -- 284 232 - 18.3%
Days on Market Until Sale 0 0 -- 272 191 - 29.7%
Cumulative Days on Market Until Sale 0 0 -- 272 651 + 139.8%
Inventory of Homes for Sale 2 2 0.0% -- -- --
Months Supply of Inventory 2.0 2.0 0.0% -- -- --* Does not account for seller concessions. | Activity for one month can sometimes look extreme due to small sample size. | Note: CarolinaMLS did not include “showable” under contract listings in the “Pending Sales” stats before July 2012. Listing agents report listings as “Under Contract-Show” earlier in the transaction. As a result, the new “Pending Sales” stats trend higher and the new “Months Supply of Inventory” stats trend lower since July 2012.
Change in Median Sales Price
A RESEARCH TOOL PROVIDED BY THE CHARLOTTE REGIONAL REALTOR® ASSOCIATION
Local Market Update – August 2013
August Year to Date
- 100.0% -- --Change in
New ListingsChange in
Closed SalesFairfield County,
SC
FOR MORE INFORMATION CONTACT A REALTOR®
Year to Date 2012 2013August 2012 2013
** Each dot represents the change in median sales price from the prior year using a 6-month weighted average.This means that each of the 6 months used in a dot are proportioned according to their share of sales during that period.
Current as of September 9, 2013. All data from CarolinaMLS. Report provided by the Charlotte Regional REALTOR® Association. Powered by 10K Research and Marketing.
Percent of Original List Price Received* 0.0% 0.0% -- 81.8% 0.0% - 100.0%
List to Close 0 0 -- 205 0 - 100.0%
Days on Market Until Sale 0 0 -- 188 0 - 100.0%
Cumulative Days on Market Until Sale 0 0 -- 188 0 - 100.0%
Inventory of Homes for Sale 1 7 + 600.0% -- -- --
Months Supply of Inventory 0.7 7.0 + 950.0% -- -- --* Does not account for seller concessions. | Activity for one month can sometimes look extreme due to small sample size. | Note: CarolinaMLS did not include “showable” under contract listings in the “Pending Sales” stats before July 2012. Listing agents report listings as “Under Contract-Show” earlier in the transaction. As a result, the new “Pending Sales” stats trend higher and the new “Months Supply of Inventory” stats trend lower since July 2012.
Change in Median Sales Price
A RESEARCH TOOL PROVIDED BY THE CHARLOTTE REGIONAL REALTOR® ASSOCIATION
Local Market Update – August 2013
August Year to Date
-- -- --Change in
New ListingsChange in
Closed SalesKershaw County,
SC
FOR MORE INFORMATION CONTACT A REALTOR®
Year to Date 2012 2013August 2012 2013
** Each dot represents the change in median sales price from the prior year using a 6-month weighted average.This means that each of the 6 months used in a dot are proportioned according to their share of sales during that period.
Current as of September 9, 2013. All data from CarolinaMLS. Report provided by the Charlotte Regional REALTOR® Association. Powered by 10K Research and Marketing.
Percent of Original List Price Received* 93.5% 95.7% + 2.4% 94.2% 95.4% + 1.3%
List to Close 151 141 - 6.8% 161 136 - 15.5%
Days on Market Until Sale 109 100 - 7.7% 112 99 - 12.1%
Cumulative Days on Market Until Sale 129 108 - 16.4% 138 110 - 20.3%
Inventory of Homes for Sale 367 372 + 1.4% -- -- --
Months Supply of Inventory 5.9 4.3 - 26.7% -- -- --* Does not account for seller concessions. | Activity for one month can sometimes look extreme due to small sample size. | Note: CarolinaMLS did not include “showable” under contract listings in the “Pending Sales” stats before July 2012. Listing agents report listings as “Under Contract-Show” earlier in the transaction. As a result, the new “Pending Sales” stats trend higher and the new “Months Supply of Inventory” stats trend lower since July 2012.
Change in Median Sales Price
A RESEARCH TOOL PROVIDED BY THE CHARLOTTE REGIONAL REALTOR® ASSOCIATION
Local Market Update – August 2013
August Year to Date
+ 21.6% + 91.4% + 4.1%Change in
New ListingsChange in
Closed SalesLancaster County,
SC
FOR MORE INFORMATION CONTACT A REALTOR®
Year to Date 2012 2013August 2012 2013
** Each dot represents the change in median sales price from the prior year using a 6-month weighted average.This means that each of the 6 months used in a dot are proportioned according to their share of sales during that period.
Current as of September 9, 2013. All data from CarolinaMLS. Report provided by the Charlotte Regional REALTOR® Association. Powered by 10K Research and Marketing.
Percent of Original List Price Received* 0.0% 0.0% -- 0.0% 0.0% --
List to Close 0 0 -- 0 0 --
Days on Market Until Sale 0 0 -- 0 0 --
Cumulative Days on Market Until Sale 0 0 -- 0 0 --
Inventory of Homes for Sale 0 0 -- -- -- --
Months Supply of Inventory 0.0 0.0 -- -- -- --
Change in Median Sales Price
A RESEARCH TOOL PROVIDED BY THE CHARLOTTE REGIONAL REALTOR® ASSOCIATION
Local Market Update – August 2013
August Year to Date
-- -- --Change in
New ListingsChange in
Closed SalesUnion County, SC
FOR MORE INFORMATION CONTACT A REALTOR®
** Each dot represents the change in median sales price from the prior year using a 6-month weighted average.This means that each of the 6 months used in a dot are proportioned according to their share of sales during that period.
Current as of September 9, 2013. All data from CarolinaMLS. Report provided by the Charlotte Regional REALTOR® Association. Powered by 10K Research and Marketing.
Union County, SC
Entire CarolinaMLS Area
* Does not account for seller concessions. | Activity for one month can sometimes look extreme due to small sample size. | Note: CarolinaMLS did not include “showable” under contract listings in the “Pending Sales” stats before July 2012. Listing agents report listings as “Under Contract-Show” earlier in the transaction. As a result, the new “Pending Sales” stats trend higher and the new “Months Supply of Inventory” stats trend lower since July 2012.
Percent of Original List Price Received* 94.6% 95.5% + 1.0% 93.5% 94.6% + 1.2%
List to Close 149 130 - 12.5% 155 142 - 8.4%
Days on Market Until Sale 108 94 - 13.1% 110 104 - 4.8%
Cumulative Days on Market Until Sale 128 106 - 17.0% 135 119 - 11.6%
Inventory of Homes for Sale 1,376 1,345 - 2.3% -- -- --
Months Supply of Inventory 6.9 5.6 - 19.0% -- -- --* Does not account for seller concessions. | Activity for one month can sometimes look extreme due to small sample size. | Note: CarolinaMLS did not include “showable” under contract listings in the “Pending Sales” stats before July 2012. Listing agents report listings as “Under Contract-Show” earlier in the transaction. As a result, the new “Pending Sales” stats trend higher and the new “Months Supply of Inventory” stats trend lower since July 2012.
Change in Median Sales Price
A RESEARCH TOOL PROVIDED BY THE CHARLOTTE REGIONAL REALTOR® ASSOCIATION
Local Market Update – August 2013
August Year to Date
+ 19.1% + 27.8% + 10.5%Change in
New ListingsChange in
Closed SalesYork County, SC
FOR MORE INFORMATION CONTACT A REALTOR®
Year to Date 2012 2013August 2012 2013
** Each dot represents the change in median sales price from the prior year using a 6-month weighted average.This means that each of the 6 months used in a dot are proportioned according to their share of sales during that period.
Current as of September 9, 2013. All data from CarolinaMLS. Report provided by the Charlotte Regional REALTOR® Association. Powered by 10K Research and Marketing.
Percent of Original List Price Received* 93.0% 95.2% + 2.4% 92.5% 94.7% + 2.4%
List to Close 140 128 - 8.7% 148 134 - 9.5%
Days on Market Until Sale 100 90 - 10.6% 109 95 - 13.2%
Cumulative Days on Market Until Sale 124 97 - 21.8% 138 109 - 21.2%
Inventory of Homes for Sale 12,463 10,199 - 18.2% -- -- --
Months Supply of Inventory 6.8 4.5 - 34.1% -- -- --* Does not account for seller concessions. | Activity for one month can sometimes look extreme due to small sample size. | Note: CarolinaMLS did not include “showable” under contract listings in the “Pending Sales” stats before July 2012. Listing agents report listings as “Under Contract-Show” earlier in the transaction. As a result, the new “Pending Sales” stats trend higher and the new “Months Supply of Inventory” stats trend lower since July 2012.
Change in Median Sales Price
A RESEARCH TOOL PROVIDED BY THE CHARLOTTE REGIONAL REALTOR® ASSOCIATION
Local Market Update – August 2013
August Year to Date
+ 16.4% + 17.0% + 12.3%Change in
New ListingsChange in
Closed SalesCharlotte-Gastonia-
Rock Hill MSA
FOR MORE INFORMATION CONTACT A REALTOR®
Year to Date 2012 2013August 2012 2013
** Each dot represents the change in median sales price from the prior year using a 6-month weighted average.This means that each of the 6 months used in a dot are proportioned according to their share of sales during that period.
Current as of September 9, 2013. All data from CarolinaMLS. Report provided by the Charlotte Regional REALTOR® Association. Powered by 10K Research and Marketing.