Local regularization of tilt projections reduces artifacts in electron tomography Mauro Maiorca a,b,⇑ , Coralie Millet a,b , Eric Hanssen a,b,d , Brian Abbey b,c , Edmund Kazmierczak e,1 , Leann Tilley a,b,⇑,1 a Department of Biochemistry and Molecular Biology, Bio21 Molecular Science and Biotechnology Institute, The University of Melbourne, Vic. 3010, Australia b Australian Research Council Centre of Excellence for Coherent X-ray Science, Australia c Department of Physics, La Trobe University, Vic. 3071, Australia d Electron Microscopy Unit, Bio21 Molecular Science and Biotechnology Institute, The University of Melbourne, Melbourne, Vic. 3010, Australia e Department of Computer Science and Software Engineering, The University of Melbourne, Vic. 3010, Australia article info Article history: Received 17 December 2013 Received in revised form 5 March 2014 Accepted 10 March 2014 Available online 14 March 2014 Keywords: Non-linear diffusion Electron tomography Gold artifact reduction Plasmodium Image reconstruction abstract Electron tomography produces very high resolution 3D image volumes useful for investigating the struc- ture and function of cellular components. Unfortunately, unavoidable discontinuities and physical con- straints in the acquisition geometry lead to a range of artifacts that can affect the reconstructed image. In particular, highly electron dense regions, such as gold nanoparticles, can hide proximal biological structures and degrade the overall quality of the reconstructed tomograms. In this work we introduce a pre-reconstruction non-conservative non-linear isotropic diffusion (NID) filter that automatically iden- tifies and reduces local irregularities in the tilt projections. We illustrate the improvement in quality obtained using this approach for reconstructed tomograms generated from samples of malaria para- site-infected red blood cells. A quantitative and qualitative evaluation for our approach on both simulated and real data is provided. Ó 2014 Elsevier Inc. All rights reserved. 1. Introduction Electron tomography (ET) is an important technique for the high-resolution imaging of 3D structure for a large range of life and materials science samples. In particular, the application of ET to elucidate the 3D architecture of biological samples provides new insights into their function (Downing et al., 2007; Leis et al., 2009; Milne and Subramaniam, 2009; Vanhecke et al., 2011). The method involves generating sections of tissues or cells (usually 100–400 nm) and preparing the sections for electron microscopy (EM). In many cases the samples are processed using chemical fix- ation, plastic embedding and staining with heavy metals (Frey et al., 2006; Gan and Jensen, 2012; McIntosh et al., 2005). Alterna- tively samples can be snap-frozen, sectioned if required, and exam- ined using a cryo-EM stage (Dubochet et al., 1988; McDonald and Auer, 2006; Pierson et al., 2011). In some cases labeling of specific subcellular compartments or proteins is achieved using immuno- gold-tagged antibodies or protein A. This can be performed either before or after fixation and processing of the samples (Hanssen et al., 2010b). Once the biological sample sections have been prepared they are examined in an electron microscope with a tiltable stage oper- ating at accelerating voltages of 120–300 kV. Images of the sam- ples are collected at different projection angles over a tilt range of at least 120°. The imaging dose is kept to a minimum, and for cryo-stabilized samples should be less than 10,000 e /nm 2 , in an effort to prevent beam damage and thus preserve the biological architecture. After tilt series acquisition, the images are aligned, of- ten making use of colloidal gold fiducial particles deposited onto the sample for this purpose (Kremer et al., 1996; Mastronarde, 1997; Penczek et al., 1995). The final 3D sample volume is obtained using volumetric reconstruction techniques (Herman, 2009) and processed using different segmentation tools to identify specific features (Ali et al., 2012; Kremer et al., 1996; Mumcuoglu et al., 2012; Nguyen and Ji, 2008). The requirement for low electron doses leading to short expo- sure times means that noise-related artifacts are an important is- sue in ET and can severely degrade the quality of the http://dx.doi.org/10.1016/j.jsb.2014.03.009 1047-8477/Ó 2014 Elsevier Inc. All rights reserved. Abbreviations: NID, non-linear isotropic diffusion; ET, electron tomography; FBP, filtered back projection; SIRT, simultaneous iterative reconstruction techniques. ⇑ Corresponding authors at: Department of Biochemistry and Molecular Biology, Bio21 Molecular Science and Biotechnology Institute, The University of Melbourne, Vic. 3010, Australia. E-mail addresses: [email protected](M. Maiorca), ltilley@unimelb. edu.au (L. Tilley). 1 These authors contributed equally. Journal of Structural Biology 186 (2014) 28–37 Contents lists available at ScienceDirect Journal of Structural Biology journal homepage: www.elsevier.com/locate/yjsbi
Local regularization of tilt projections reduces artifacts in electrontomography
http://dx.doi.org/10.1016/j.jsb.2014.03.0091047-8477/� 2014 Elsevier Inc. All rights reserved.
Abbreviations: NID, non-linear isotropic diffusion; ET, electron tomography; FBP,filtered back projection; SIRT, simultaneous iterative reconstruction techniques.⇑ Corresponding authors at: Department of Biochemistry and Molecular Biology,
Bio21 Molecular Science and Biotechnology Institute, The University of Melbourne,Vic. 3010, Australia.
Mauro Maiorca a,b,⇑, Coralie Millet a,b, Eric Hanssen a,b,d, Brian Abbey b,c, Edmund Kazmierczak e,1,Leann Tilley a,b,⇑,1
a Department of Biochemistry and Molecular Biology, Bio21 Molecular Science and Biotechnology Institute, The University of Melbourne, Vic. 3010, Australiab Australian Research Council Centre of Excellence for Coherent X-ray Science, Australiac Department of Physics, La Trobe University, Vic. 3071, Australiad Electron Microscopy Unit, Bio21 Molecular Science and Biotechnology Institute, The University of Melbourne, Melbourne, Vic. 3010, Australiae Department of Computer Science and Software Engineering, The University of Melbourne, Vic. 3010, Australia
a r t i c l e i n f o a b s t r a c t
Article history:Received 17 December 2013Received in revised form 5 March 2014Accepted 10 March 2014Available online 14 March 2014
Electron tomography produces very high resolution 3D image volumes useful for investigating the struc-ture and function of cellular components. Unfortunately, unavoidable discontinuities and physical con-straints in the acquisition geometry lead to a range of artifacts that can affect the reconstructed image.In particular, highly electron dense regions, such as gold nanoparticles, can hide proximal biologicalstructures and degrade the overall quality of the reconstructed tomograms. In this work we introducea pre-reconstruction non-conservative non-linear isotropic diffusion (NID) filter that automatically iden-tifies and reduces local irregularities in the tilt projections. We illustrate the improvement in qualityobtained using this approach for reconstructed tomograms generated from samples of malaria para-site-infected red blood cells. A quantitative and qualitative evaluation for our approach on both simulatedand real data is provided.
� 2014 Elsevier Inc. All rights reserved.
1. Introduction Auer, 2006; Pierson et al., 2011). In some cases labeling of specific
Electron tomography (ET) is an important technique for thehigh-resolution imaging of 3D structure for a large range of lifeand materials science samples. In particular, the application of ETto elucidate the 3D architecture of biological samples providesnew insights into their function (Downing et al., 2007; Leis et al.,2009; Milne and Subramaniam, 2009; Vanhecke et al., 2011). Themethod involves generating sections of tissues or cells (usually100–400 nm) and preparing the sections for electron microscopy(EM). In many cases the samples are processed using chemical fix-ation, plastic embedding and staining with heavy metals (Freyet al., 2006; Gan and Jensen, 2012; McIntosh et al., 2005). Alterna-tively samples can be snap-frozen, sectioned if required, and exam-ined using a cryo-EM stage (Dubochet et al., 1988; McDonald and
subcellular compartments or proteins is achieved using immuno-gold-tagged antibodies or protein A. This can be performed eitherbefore or after fixation and processing of the samples (Hanssenet al., 2010b).
Once the biological sample sections have been prepared theyare examined in an electron microscope with a tiltable stage oper-ating at accelerating voltages of 120–300 kV. Images of the sam-ples are collected at different projection angles over a tilt rangeof at least 120�. The imaging dose is kept to a minimum, and forcryo-stabilized samples should be less than 10,000 e�/nm2, in aneffort to prevent beam damage and thus preserve the biologicalarchitecture. After tilt series acquisition, the images are aligned, of-ten making use of colloidal gold fiducial particles deposited ontothe sample for this purpose (Kremer et al., 1996; Mastronarde,1997; Penczek et al., 1995). The final 3D sample volume is obtainedusing volumetric reconstruction techniques (Herman, 2009) andprocessed using different segmentation tools to identify specificfeatures (Ali et al., 2012; Kremer et al., 1996; Mumcuoglu et al.,2012; Nguyen and Ji, 2008).
The requirement for low electron doses leading to short expo-sure times means that noise-related artifacts are an important is-sue in ET and can severely degrade the quality of the
M. Maiorca et al. / Journal of Structural Biology 186 (2014) 28–37 29
reconstruction (Arslan et al., 2006; Baumeister et al., 1999; Caoet al., 2010; Fernández and Martínez, 2010; Frangakis and Hegerl,2001; van der Heide et al., 2007). The development of filteringalgorithms can help to improve the quality of the reconstructedimages and if coupled with further processing such as segmenta-tion and rendering can help to identify important biological struc-tures. Improving the quality of reconstructed tomograms forfurther processing is consequently a topic of key importance.
The physical structure of the microscope stage where samplesare mounted limits the angles at which the sample can be tilted,from about �70� to +70�. The limited range of angles in turn meansthat the sequence of tomographic tilt projections have a ‘‘wedge’’of missing data in the Fourier domain (Saghi and Midgley, 2012).The result is that there is ‘‘streaking’’ of features where the signalis poor in the direction of the missing wedge (Radermacher,1992). A particular problem arises where regions of high electronabsorption (or scattering) are located proximal to regions of lowabsorption. Gold nanoparticles embedded in biological tissues forimmunolabelling purposes or as fiducial markers for aligning tiltprojections represent such a case. The strongly scattering gold par-ticles can produce exponential edge-gradient effects that obscurefeatures from surrounding regions. Tomograms reconstructed fromsuch projection images exhibit streak artifacts around the gold par-ticles such that the tomograms in these regions cannot be used forobtaining reliable quantitative information. For cryo-ET, where thebiological features under investigation have particularly low con-trast, such artifacts pose significant challenges when trying tointerpret the reconstructed data.
One way of reducing streak artifacts is by interpolation of datain the tilt projections. For example a family of partial diffusionequations has been used to create interpolated missing regions inpre-reconstruction data (Köstler et al., 2006), and feature-drivenadaptive interpolation has been used to reduce streak artifacts inET volumes (Cao et al., 2010). However these processes, and themethod of interpolation itself, can lead to the introduction ofnew artifacts. In the case of ET of biological samples the high noiselevels and low contrast of the observed biological structures meanthat the usefulness of adaptive interpolation methods is limited.
Methods for removing the contribution from regions of highelectron density prior to reconstruction have been developed usinginterpolation in-painting or simply by replacing the regions of highsignal with pixels of an average gray value (Cope et al., 2011).These techniques can be successful when the high-signal regionsare distal from the structures of interest. Unfortunately, these ap-proaches have limited usefulness for regularization of the artifactsproduced by the gold particles used for immunolabelling in ET ofbiological samples. This is because the gold particles are, by design,proximal to the structures of interest (Jimenez and Post, 2012;Koster and Klumperman, 2003; Moritz et al., 1995). Modifyingthe acquisition geometry, for example, by collecting dual tilt series(Guesdon et al., 2013) has been shown to reduce the problem, butsome distortion of the image still persists.
A third approach to solving the problem of streaking due to thepresence of the gold particles is via deconvolution of the recon-structed image with an estimated Point Spread Function (PSF)(Tchelidze et al., 2006). Unfortunately an accurate estimate forthe PSF is not straightforward in ET as it depends on the specificacquisition geometry and settings as well as the type of recon-struction algorithm used, which may vary substantially betweendifferent studies.
Our group recently introduced a method for improving thequality of ET reconstructions based on a local electron densityredistribution using a conservative diffusive approach (Maiorcaet al., 2012). This type of approach is well-established for conven-tional image processing and filtering (Weickert, 1996a). This meth-od, when applied to ET reduces the degradation of reconstructed
volumes, whilst minimizing reconstruction artifacts and facilitat-ing the supervized segmentation of the data (McMillan et al.,2013). However, a conservative approach is not sufficient whenattempting to recover the signal from regions affected by severe lo-cal inhomogeneities in electron absorption. In the present paperwe propose a non-conservative approach that specifically targetsthe highly non-regular regions surrounding the gold nanoparticleswithout affecting the rest of the image.
2. Materials and methods
2.1. Sample preparation and ET
Plasmodium falciparum (3D7 strain) was cultured in human redblood cells using established protocols (Spycher et al., 2008). Tro-phozoite-infected red blood cells were harvested, fixed, embeddedin epoxy resin, and sectioned (100–250 nm) as described previ-ously (Hanssen et al., 2010a). In some cases infected red blood cellswere permeabilized with Equinatoxin II (EqtII) (Hanssen et al.,2008), before labeling with primary antibodies and gold-labeledprotein A (6 nm Aurion). The ET sections were stained and layeredwith gold fiducials (10 nm). Grids were mounted on a single tileholder and imaged using a Tecnai G2 F30 transmission electronmicroscope operating at 300 kV (Advanced Microscopy Facility,Bio21 Institute, Melbourne). Tilt projections were recorded be-tween about �66� and +66� at 2� intervals and aligned with IMOD(http://bio3d.colorado.edu/imod/) (Kremer et al., 1996; Mastronarde,1997), as described previously (Abu Bakar et al., 2010; Hanssenet al., 2008). Volumes were reconstructed using Filtered BackProjection (FBP, IMOD (Kremer et al., 1996)) or SimultaneousIterative Reconstruction Techniques (SIRT, tomo3d (Agulleiro andFernandez, 2011)). Erasing gold particles using a fiducial model(Cope et al., 2011) was performed using the Ccderaser programin IMOD.
2.2. Simulation
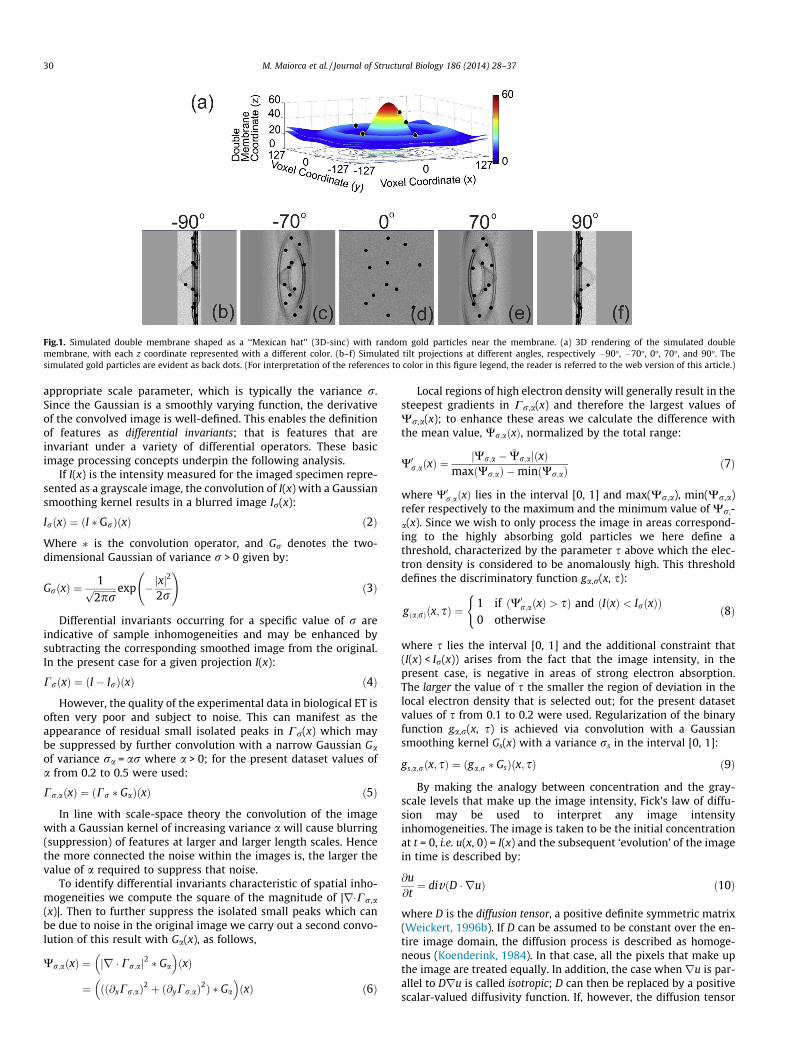
A synthetic volume of 256 � 256 � 64 voxels was created, usinga simulated pixel spacing of 1 nm. Pixel intensity values were uni-formly distributed within 295 grayscale levels, with zero mean foreach tilt projection. The volume contained three normally distrib-uted classes of pixel intensities values with interclass distances of242.5 and 23 grayscale levels, full width at half maximum (FWHM)of 50, 35 and 15 grayscale levels, designed to represent respec-tively gold nanoparticles, a double membrane, and the background.The gold nanoparticles were modeled as hard spheres with a diam-eter of 10 pixels, whilst the double membrane was simulated usingtwo 3D-sinc functions of the form:
sinðxÞx; x 2 R3 ð1Þ
The sample structure was rendered using IMOD and is pre-sented in Fig. 1. To create a simulated dataset, projections of thesynthetic volume were generated using Xmipp (Sorzano et al.,2004). The final volumes were reconstructed using both FBP(Kremer et al., 1996) and SIRT (Agulleiro and Fernandez, 2011).
2.3. Local regularization
In tilt projection images, an important source of intensity irreg-ularity arises from local spatial differences in the electron densitywithin the sample. Scale-space theory allows the representationof such multi-scale signals as a series of smoothed images param-eterized by a smoothing kernel known as the ‘scale parameter’.Within this theory local spatial inhomogeneities can bedetermined by convolution with a Gaussian characterized by the
Fig.1. Simulated double membrane shaped as a ‘‘Mexican hat’’ (3D-sinc) with random gold particles near the membrane. (a) 3D rendering of the simulated doublemembrane, with each z coordinate represented with a different color. (b–f) Simulated tilt projections at different angles, respectively �90�, �70�, 0�, 70�, and 90�. Thesimulated gold particles are evident as back dots. (For interpretation of the references to color in this figure legend, the reader is referred to the web version of this article.)
30 M. Maiorca et al. / Journal of Structural Biology 186 (2014) 28–37
appropriate scale parameter, which is typically the variance r.Since the Gaussian is a smoothly varying function, the derivativeof the convolved image is well-defined. This enables the definitionof features as differential invariants; that is features that areinvariant under a variety of differential operators. These basicimage processing concepts underpin the following analysis.
If I(x) is the intensity measured for the imaged specimen repre-sented as a grayscale image, the convolution of I(x) with a Gaussiansmoothing kernel results in a blurred image Ir(x):
IrðxÞ ¼ ðI � GrÞðxÞ ð2Þ
Where ⁄ is the convolution operator, and Gr denotes the two-dimensional Gaussian of variance r > 0 given by:
GrðxÞ ¼1ffiffiffiffiffiffiffiffiffiffi
2prp exp � jxj
2
2r
!ð3Þ
Differential invariants occurring for a specific value of r areindicative of sample inhomogeneities and may be enhanced bysubtracting the corresponding smoothed image from the original.In the present case for a given projection I(x):
CrðxÞ ¼ ðI � IrÞðxÞ ð4Þ
However, the quality of the experimental data in biological ET isoften very poor and subject to noise. This can manifest as theappearance of residual small isolated peaks in Cr(x) which maybe suppressed by further convolution with a narrow Gaussian Gaof variance ra = ar where a > 0; for the present dataset values ofa from 0.2 to 0.5 were used:
Cr;aðxÞ ¼ ðCr � GaÞðxÞ ð5Þ
In line with scale-space theory the convolution of the imagewith a Gaussian kernel of increasing variance a will cause blurring(suppression) of features at larger and larger length scales. Hencethe more connected the noise within the images is, the larger thevalue of a required to suppress that noise.
To identify differential invariants characteristic of spatial inho-mogeneities we compute the square of the magnitude of |r�Cr,a(x)|. Then to further suppress the isolated small peaks which canbe due to noise in the original image we carry out a second convo-lution of this result with Ga(x), as follows,
Wr;a xð Þ ¼ jr � Cr;aj2 � Ga
� �xð Þ
¼ ðð@xCr;aÞ2 þ ð@yCr;aÞ2Þ � Ga
� �xð Þ ð6Þ
Local regions of high electron density will generally result in thesteepest gradients in Cr,a(x) and therefore the largest values ofWr,a(x); to enhance these areas we calculate the difference withthe mean value, �Wr;aðxÞ, normalized by the total range:
W0r;aðxÞ ¼jWr;a � �Wr;ajðxÞ
maxðWr;aÞ �minðWr;aÞð7Þ
where W0r;aðxÞ lies in the interval [0, 1] and max(Wr,a), min(Wr,a)refer respectively to the maximum and the minimum value of Wr,-a(x). Since we wish to only process the image in areas correspond-ing to the highly absorbing gold particles we here define athreshold, characterized by the parameter s above which the elec-tron density is considered to be anomalously high. This thresholddefines the discriminatory function ga,r(x, s):
gða;rÞðx; sÞ ¼1 if ðW0r;aðxÞ > sÞ and ðIðxÞ < IrðxÞÞ0 otherwise
(ð8Þ
where s lies the interval [0, 1] and the additional constraint that(I(x) < Ir(x)) arises from the fact that the image intensity, in thepresent case, is negative in areas of strong electron absorption.The larger the value of s the smaller the region of deviation in thelocal electron density that is selected out; for the present datasetvalues of s from 0.1 to 0.2 were used. Regularization of the binaryfunction ga,r(x, s) is achieved via convolution with a Gaussiansmoothing kernel Gs(x) with a variance rs in the interval [0, 1]:
gs;a;rðx; sÞ ¼ ðga;r � GsÞðx; sÞ ð9Þ
By making the analogy between concentration and the gray-scale levels that make up the image intensity, Fick’s law of diffu-sion may be used to interpret any image intensityinhomogeneities. The image is taken to be the initial concentrationat t = 0, i.e. u(x, 0) = I(x) and the subsequent ‘evolution’ of the imagein time is described by:
@u@t¼ divðD � ruÞ ð10Þ
where D is the diffusion tensor, a positive definite symmetric matrix(Weickert, 1996b). If D can be assumed to be constant over the en-tire image domain, the diffusion process is described as homoge-neous (Koenderink, 1984). In that case, all the pixels that make upthe image are treated equally. In addition, the case whenru is par-allel to Dru is called isotropic; D can then be replaced by a positivescalar-valued diffusivity function. If, however, the diffusion tensor
M. Maiorca et al. / Journal of Structural Biology 186 (2014) 28–37 31
is a function of the differential structure of the time-evolving image,then the diffusion process is inhomogeneous. In this situation thediffusion depends on the image evolution and the resulting diffu-sion filters are non-linear. Diffusion that is independent of t is de-scribed as linear.
The prototype non-linear diffusion paradigm (Perona and Malik,1990) employed a filter based on the equation ou/ot = div(g(|ru|2)ru) , with diffusivities such as g(|ru|2) = (1 + |ru|2/K)�1 where K isa constant, positive parameter. Since this filter utilizes a scalar dif-fusivity rather than a diffusion tensor we define it here as beingisotropic (Weickert, 1996a). This filter has the property of blurringregions with differential invariants that appear throughout the en-tire image (e.g. noise) whilst preserving regions with large localirregularities (i.e. edges). In the present case we only wish to blurregions subject to severe local distortions due to high electronabsorption (i.e. gold particles) whilst leaving the rest of the imageunaltered, thus we propose to replace the diffusion tensor with thefunction gs,a,r(x, s), given in Eq. (9). This leads to the followingmodification of the Perona–Malik filter:
@u@t¼ divðgs;a;r � rusÞðx; sÞ ð11Þ
where us(x, 0) = Is(x) is the image I(x) convolved with a Gaussian, Gb
of user-defined variance rb P 0if the local image values have beenclassified as being due to the gold particles according the criterionin Eq. (12). If the image values do not contain any gold particlesthe image is left unaltered, i.e.:
IsðxÞ ¼ðI � GbÞðxÞ if ðW0 > sÞ and ðI < IrÞIðxÞ otherwise
(ð12Þ
As rb is increased sample features at larger length scales will besmoothed. In fact we note that letting rb ?1 produces the equiv-alent method to that described by (Cope et al., 2011). In this meth-od, the gold particles are replaced with pixels of average grayscalevalue. This effectively eliminates shadowing artifacts when thetomogram is reconstructed, but also eliminates the positions ofthe gold particles, which provide key information regarding thelocations of proteins of interest.
Isotropic diffusion allows the filtered regions to be uniformlyinfluenced by the surrounding area which partially compensatesfor the loss of information due to the high electron absorption.The time-evolution of the image u(x, t) in Eq. (11) is approximatedvia an iterative procedure using an explicit time discretization ap-proach. Each iteration corresponds to an additional small ‘step’ intime and will result in increased diffusion within the filtered re-gions. The process is repeated, with each new time-evolved u(x,t) acting as the input for the next step until a satisfactory resultfor the image is obtained (the supervized stop condition) (Weick-ert, 1996a,b; Frangakis and Hegerl, 2001; Mendrik, 2009). Eventu-ally further time evolution of u(x, t) will lead to the boundary of thegold particles becoming blurred.
3. Results
We present the pre-NID algorithm as an approach to regularizeregions surrounding gold nanoparticles in electron tomogramswithout affecting the rest of the image. Implementing the pre-NID algorithm requires setting five parameters, namely: a, s, r,rb and the number of iterations. The parameters a, s and r controlthe behavior of the discriminatory function, enabling the auto-matic selection of gold particles. The parameters rb and the num-ber of iterations control the degree of diffusion, and thus the levelof smoothing. We start by choosing a value for r. Smaller values ofr will better preserve the shape of the gold particles, but may gen-erate false positives, while larger values of r will ensure fewer false
positives but will be associated with some distortion of the shapeof the gold particles. We suggest using the radius of the gold par-ticles (in pixels) as the initial r value. The parameter a is usuallywithin the interval [0, 1] and provides further control for the selec-tion of gold particles taking into account the noise in the image.Increasing the value of a will cause blurring (suppression) of fea-tures at larger length scales; if the regions of noise within the im-age are more connected, a larger value of a is required to suppressthat noise. However, the price to pay for this suppression is thatthe original shape of the gold will not be preserved. Finally weuse the value of s to discriminate gold particles from the other fea-tures. The typical value of s is in the range [0, 1]; increasing the va-lue of s has the effect of locally increasing sensitivity at the price ofdecreased specificity in the selection of gold particles. Smaller val-ues of s have the opposite effect.
We initially tested the pre-NID filter using both simulated dataand real ET data from biological samples. For the simulated data(Fig. 1) we randomly added synthetic gold beads to the syntheticdouble membrane described by two sinc functions in Eq. (1) (Mai-orca et al., 2012). A control ground truth was generated by makingprojections from the synthetic volume at angles from �90� to +90�in 0.05� increments using two tilt axes, perpendicular to eachother. Data were reconstructed using IMOD (Kremer et al., 1996)with the following parameters used for the pre-NID: r = 4.0,a = 0.3, s = 0.2, rb = 8.0, and 15 iterations (see Section 2.3). Thesame parameters were used for the second tilt axis, which was ro-tated horizontally with respect to the first axis by 90�.
Reconstructions of the simulated data are shown in Fig. 2 as yx(top row) and yz (bottom row) views. For the control image Fig. 2athe data covers the full range of angles (i.e. with no missingwedge); hence, no artifacts are apparent. Reconstructions from asingle tilt simulated dataset from �70� to +70� in 2� increments(i.e. with a missing wedge) are presented without (Fig. 2b) andwith (Fig. 2c) pre-NID processing. The missing information due tothe lack of high angle tilt projections is evident in the xy views ofboth processed and unprocessed images; e.g. the double sinc fea-tures intersecting the yz plane representing the membrane arenot reconstructed as full circles. Moreover, the streaks aroundthe gold particles are clearly visible in both the xy and yz viewsof the unprocessed reconstruction. In the pre-NID treated data,the positions of the gold particles are retained, but the streak arti-facts are substantively reduced, as revealed in both the xy and yzviews. This is particularly evident in the region adjacent to the goldparticle (indicated by the arrow). The simulated dual tilt recon-structions (Fig. 2d and e) show a partial recovery from the missingwedge artifacts, but the data without pre-NID processing (Fig. 2d)retain significant streak artifacts that would affect segmentation ofthe structures (e.g. see arrowed region). These artifacts are signifi-cantly reduced in the pre-NID processed data (Fig. 2e).
For the first biological test sample (Fig. 3), we used P. falcipa-rum-infected red blood cells that had been harvested, purifiedand permeabilized to release hemoglobin, then fixed, embeddedin resin, sectioned (100 nm) and stained with uranyl acetate andlead citrate. The sections were examined, data collected at a defo-cus of �2.5 lm, and a region of interest in the host red blood cellcytoplasm was chosen that includes an electron-dense vesicle.The properties of these 80 nm vesicles have been previously re-ported (Hanssen et al., 2008). Tilt projection images of the sectionwere recorded between �65� and +65� at 2� intervals and thedatatsets were aligned using programs available through IMOD.As a ground truth control (Fig. 3a) we first collected a tilt seriesfrom the section prior to decoration with fiducial markers. Thesample was then layered with colloidal gold particles (10 nm)and the same region was re-imaged under the same conditionsand the image data was processed without (Fig. 3b) or with(Fig. 3c) the pre-NID filter using r = 3.5, a = 0.2, s = 0.1, rb = 4.5
Fig.2. Reconstruction of synthetic double membrane with random spherical gold particles. For the control data (a) FBP reconstructions were obtained from projections over180� (i.e. from �90� to +90�) with 0.05� increments. For simulation of single tilt ET data (b, c) FBP reconstructions were generated using projections from �70� to +70� with 2�increments. For simulation of dual tilt data (d, e) the FBP reconstructions were obtained as for (b, c) plus a second acquisition with the tilt axis at relative to the first data set.The two datasets were combined using the IMOD package (Kremer et al., 1996; Mastronarde, 1997). Tomogram slices from tilt projections subjected to pre-NID processing areshown in (c) and (e); each tilt stack has been iterated 15 times, r = 4.0, a = 0.3, rb = 8.0, s = 0.2.
Fig.3. Pre-NID treatment of tilt projections of a biological sample prepared with and without gold fiducials. Tilt projections were collected from a 100 nm section through a P.falciparum-infected red blood cell, in a region with an 80 nm electron dense vesicle, before (a) and after (b, c) deposition of 10 nm gold fiducials onto the surface. The datasetswere aligned using the IMOD package. The tilt projections at 33� are displayed. Pre-NID processing was applied to (c) using a = 0.2, s = 0.1, rb = 4.5, r = 3.5, and 20 iterations.Intensity profiles of two lines (L1, L2) intersecting gold particles and the red blood cell membrane (RBCM) are shown in (d) and (e). The intensity profiles show that the IMOD32-bit grayscale values are decreased in the regions of gold particles but remain unaltered in the rest of the image.
32 M. Maiorca et al. / Journal of Structural Biology 186 (2014) 28–37
and 20 iterations. Intensity profiles through individual tilt projec-tion images (at +33�) illustrate the effect of the pre-NID processing(Fig. 3d and e). In data collected without fiducials (Fig. 3a) a cleardifference in signal is apparent between the weakly stained hostcell cytoplasm and the electron-dense vesicle. In the sample con-taining the gold particles (Fig. 3b) the scattering from these struc-tures is so strong that they occupy most of the dynamic range ofthe image (Fig. 3d and e). Upon pre-NID processing (Fig. 3c), theintensity of the signal from the gold particles is reduced substan-tively, permitting better analysis of the signal from the vesicle.The intensity profiles confirm that the image is not altered in re-gions outside the areas of the gold particles (Fig. 3d and e). We
have also compared the local pre-NID filter to the Perona and Malik(P-M) filter (Suppl. Fig. 1) for a simulated 1D line profile throughone of the gold particles. The data clearly illustrate how the pre-NID filter greatly reduces the contribution to the electron absorp-tion by the gold whilst preserving the integrity of the surroundingimage. This is in contrast to the P–M filter which results in the en-tire profile being smoothed.
The control, processed and unprocessed test datasets werereconstructed using Filtered Back Projection (FBP) and Simulta-neous Iterative Reconstruction Technique (SIRT). The recon-structed test volumes were manually rigidly aligned to thecontrol dataset, and the overlapping area between the test and
Fig.4. Pre-NID treatment of an electron tomogram of a biological sample prepared with and without gold fiducials. A tomogram was generated using FBP from the sampledescribed in Fig. 3. Scale bars, 40 nm. Images have been processed using a = 0.2, s = 0.1, rb = 4.5, r = 3.5 and 20 iterations. xy (a, c) and yz (b, d) views. (Left) Reconstruction ofground truth sample before addition of gold particles. (Middle) Reconstruction generated after addition of 10 nm gold particles. (Right) Reconstruction of processedprojections. The filtered image presents less obvious metal shadow artifact (MA) around gold particles (GP) than the unfiltered version. Furthermore, the biological structuresare more easily identified, including the red blood cell membrane (RBCM), an electron-dense vesicle (EDV), membrane features such as a Maurer’s cleft (MC) and theparasitophorous vacuole membrane (PVM). (e) Analysis of the grayscale intensity values in the region indicated by the red rectangle. (For interpretation of the references tocolor in this figure legend, the reader is referred to the web version of this article.)
M. Maiorca et al. / Journal of Structural Biology 186 (2014) 28–37 33
control datasets was selected as the region of interest. Also, theintensity values of processed and unprocessed test datasets werelinearly stretched in order to match the intensity levels of the con-trol dataset. A visual assessment of FBP reconstructed data is pre-sented in Fig. 4. Row (a) shows a virtual section (in xy view) nearthe surface of the reconstructed volume. These data reveal thered blood cell membrane (RBCM), the parasitophorous vacuolemembrane (PVM) surrounding the intracellular parasite, and inthe red blood cell, an electron-dense vesicle (EDV) and another cis-ternal membrane features known as a Maurer’s cleft (MC). In theunprocessed test sample it is clear that the gold fiducials introducestreak artifacts that may obscure relevant details (a and b). This isagain evident in the higher magnification image shown in (c andd). In particular, the red blood cell membrane is partially obscuredin the xy view and almost completely hidden in the yz view. Theseartifacts are ameliorated in the pre-NID processed images (righthand column). The retrieval of the membrane structure in the
region close to the gold particle (indicated with a red rectangle)is illustrated in the analysis of the intensity values (e). The mem-brane feature is recognized in the processed data (asterisk) but lostin the unprocessed data. Edges of the gold particles in the pro-cessed image appear slightly blurred, an effect that is evident aftera high number of iterations (i.e. >20) of the pre-NID algorithm;fewer iterations reduces the blur around the gold, but at the costof reduced artifact reduction.
In an effort to quantitatively assess the improvement in the pre-NID treated image compared to the untreated image in regionsclose to and further from the gold particles, we compared thesum of squares difference (SSD) between unprocessed or processeddata and the control data (i.e. before addition of the gold particles):
SSD ratio ¼ SSDU
SSDP¼
Xx
jIUðxÞ � ICðxÞj2Xx
jIPðxÞ � ICðxÞj28x 2 M ð13Þ
Table 1Ratios of the sum of squares differences (SSD) as defined in Eq. (13). The raw imagedata, and first and second directional derivatives of the image, were analyzed in the x,y and z axes. Values greater than one indicate an improvement in the processed imagecompared with the unprocessed image.
Reconstruction type FBP SIRT
Mask type Goldproximal
Golddistal
Goldproximal
Golddistal
Image 4.26 1.19 3.38 1.101st Derivative x direction 2.64 1.04 3.38 1.101st Derivative y direction 3.37 1.06 2.58 1.031st Derivative z direction 4.56 1.09 3.42 1.062nd Derivative x direction 1.90 1.03 3.93 1.062nd Derivative y direction 1.66 1.03 1.54 1.022nd Derivative z direction 2.63 1.07 1.61 1.02
Fig.5. Pre-NID treatment of an electron tomogram with immunolabelling, processed usisection of a P. falciparum-infected red blood cell labeled with protein A-gold. ReconstrUnprocessed. (c, f and j) Processed FBP. (d, h and l) Processed SIRT. Images were processeless obvious metal shadow artifacts (MA) around the gold particles (GP) than the unfilt
34 M. Maiorca et al. / Journal of Structural Biology 186 (2014) 28–37
where IU and IP are, respectively, the unprocessed and processedreconstructed test images, and IC is the control image. The ratio iscomputed in regions of the image delineated by a mask M. Twomasks were created, one containing values outside, but proximalto, the gold particles (in a radius of 5 voxels), and the other in regionsdistal to the gold particles (with a radius above 5 voxels). The resultsare shown in Table 1. The SSD ratios are high in the region close tothe gold particles indicating that NID processing provides significantimprovement in the data in this region. The ratios are slightly greaterthan one in the distal regions of the tomogram, indicating a smalloverall improvement in the processed data. Improvements are notedin the raw data and in first and second directional derivatives (cor-responding to the identification of edges and changes in gradation,Table 1) suggesting that the processed data is more suitable for auto-matic segmentation and feature analysis.
ng different reconstruction methods. Tilt projections were collected from a 250 nmuctions performed using both FBP and SIRT. Scale bar, 50 nm. (a, b, e, g, i and k)d using a = 0.3, s = 0.1, r = 3.5, rb = 2.5, and 3 iterations. The filtered images presentered versions.
Fig.6. Cryo electron tomogram. Virtual section through a cryo electron tomogram of microtubules in a P. falciparum gametocyte. Scale bars = 50 nm. Panel (a) shows anunprocessed view of a longitudinal section through the tomogram, revealing microtubules (MT), ribosomes (R), the red blood cell membrane (RBCM), and a colloidal goldparticle exhibiting streak artifacts. Panel (b) shows the processed tomogram with reduced artifacts around the gold. The image was processed using a = 0.45, s = 0.12, r = 5,rb = 2, and 10 iterations. Panels (c) and (d) show xy and xz details of unprocessed and processed data. The artifact around the gold is significantly reduced, while the rest of theimage is preserved.
M. Maiorca et al. / Journal of Structural Biology 186 (2014) 28–37 35
We also examined the ability of pre-NID processing to improvethe quality of immunogold-labeled samples. For this preparation,P. falciparum-infected red blood cells were harvested and Equina-toxin II-permeabilized, then labeled with an antibody recognizingthe virulence protein, PfEMP1, followed by protein A-gold (6 nm),prior to fixation, resin-embedding, sectioning (250 nm) and stain-ing. Tilt projections were recorded between �66� and +66� at 2�intervals and the datatsets aligned and reconstructed using eitherthe FBP or SIRT algorithms (Fig. 5). Previous studies have suggestedthat SIRT offers better reconstructions for such limited datasets(Gilbert, 1972) but we observed streak artifacts in tomogramsreconstructed using either algorithm in the xy views (Fig. 5a, b, eand g) and in the yz view (Fig. 5i and k). The pre-NID processing,however, substantively reduced artifacts when used before eitherFBP- or SIRT-based reconstructions, as demonstrated in Fig. 5c, d,f, h, j and l.
We compared the results of pre-NID processing with an existing‘inpainting’ method that replaces the regions of high signal withpixels of an average gray value (Cope et al., 2011). Our pre-NID fil-ter permits automatic identification of the gold particles. Forexample for this study we analyzed a total of 226 gold particles.The efficiency of the automatic identification of gold particle wasassessed by printing Eq. (8) as an image volume to a file and over-laying it onto the original data. Manual verification revealed thatthe gold particles were correctly selected in >90% of cases. Manualselection of the gold particles will also be available upon imple-mentation in IMOD. Importantly the positions of the gold particlesare still clearly evident in the tomograms after pre-NID processing.By contrast the inpainting method requires manual definition ofeach of the gold particles and assignment of an average particlediameter. As shown in Suppl. Fig. 2a, the inpainting method givesa similar improvement in the retrieval of information in the re-gions around the gold shadows. However this method is not appli-cable in the case of immunogold labels, where the informationabout the location of the gold particles is important.
Cryo electron tomography permits 3D visualization of cryo-sec-tions or thin regions of whole cells (Cyrklaff et al., 2007; Kudrya-shev et al., 2010), but is particularly susceptible to streakingartifacts. We examined the ability of pre-NID processing to im-prove the quality of P. falciparum samples prepared for cryo elec-tron tomography. For this sample sexual stage P. falciparum
gametocytes were mounted on carbon-coated grids, plunge frozenin liquid ethane then transferred to liquid nitrogen for imaging ona cryo stage. Tilt series were collected every 2� between �70� and+70�. The image data was processed without (Fig. 6a) or with(Fig. 6b) the pre-NID filter using a = 0.45, s = 0.12, r = 5, rb = 2,and 10 iterations. In the unprocessed tomograms streak artifactsare evident around the gold particle in the field of view. These arti-facts are substantively reduced in the pre-NID-processed tomo-grams (Fig. 6 a, b, red arrows, and panels c and d). By contrastother features such as microtubules (MT) and ribosomes (R) thatdo not have the sharp gradient differential characteristic of goldparticles, are not affected by the pre-NID processing.
4. Discussion
Tomography is a widely used method in electron microscopy torecreate 3D volumes from a series of 2D images acquired at differ-ent tilt angles. Unfortunately, the physical constraints of the sam-ple stage often lead to acquisition geometry irregularities and apaucity of data, as the tilt angles are typically restricted to around�70� to +70�. Under those conditions, the problem of tomographicreconstruction using standard techniques such as FBP is consideredto be ‘‘ill-posed’’. As a consequence, reconstruction algorithms gen-erally produce visible artifacts in the reconstructed volume. Inaddition, as the results in this paper show, artifacts can arise fromthe gold particles used for immunolabelling or as fiducial particlesin ET which might hide proximal biological structures. For in-stance, in our biological test sample, several sections of the redblood cell membrane are obscured by distortions around the goldfiducials, thus making it impossible to ascertain the continuity ofthe membrane (which is clear in the data collected before additionof fiducials). As ET is specifically employed to resolve such fineultrastructural information, the need to address the issue of arti-facts is evident.
In this paper we provide a scale space based approach toanalyzing and accounting for the grayscale irregularities in tiltprojection data caused by gold nanoparticles. We also describe atwo-step non-linear isotropic diffusion filter for reducing thoseirregularities prior to reconstruction. We show that the processedtilt projections produce reconstructed volumes with fewer artifacts,
36 M. Maiorca et al. / Journal of Structural Biology 186 (2014) 28–37
allowing us to pick out more structural details in the regions prox-imal to the gold. When our pre-NID filter was employed, we ob-served improvements in the reconstructed tomograms, especiallyin regions proximal to the gold particles and in the yz views. Theimprovements were evident for both resin-embedded and cryo-stabilized biological samples, for gold particles used as fiducialson the sample surface as well as immunogold labels embeddedwithin the sample, and when either FBP or SIRT were used forthe reconstruction process.
The locally smoothed regions in tilt projections remainedsmooth in the reconstructed volumes and information obscuredby streak artifacts in our biological test sample was partially recov-ered after pre-NID processing. We anticipate that pre-NID process-ing will prove very useful for facilitating feature segmentation,especially for samples with low intrinsic contrast (e.g. cryo samplesor samples of weakly contrasting polymer) or with high densitiesof gold particles. Our methods will be made available by distribut-ing the source code (in IMOD) and our simulated and test images(CCDB).
There are five parameters that need to be set in the pre-NID ap-proach, namely: a, s, r, rb and the number of iterations. Theseparameters enable the automatic selection of gold particles andcontrol the level of smoothing. For the data analyzed in this studywe used r values close to the radius of the gold particles (in pixels),a values from 0.2 to 0.5, s values from 0.1 to 0.2, rb values from 2.0to 8.0 and numbers of iterations from 3 to 20. This parameter rangewill be suitable for many studies, but additional work may be re-quired for a comprehensive characterization of the parameterspace. We also note that the method could be implemented in aparallel manner, since each projection can be treated indepen-dently using pre-NID filtering.
Acknowledgments
The authors acknowledge support from the Australian ResearchCouncil and the Australian National Health and Medical ResearchCouncil. We thank David Mastronarde, Boulder Laboratory for 3DEM of Cells, University of Colorado, USA, for useful discussionsand input.
We would also to acknowledge Dr Benedicta Arhatari (La TrobeUniversity, Australia), Nico Persch and Prof. Joachim Weickert(Mathematical Image Analysis Group, Saarland University, Ger-many), Dr Adriënne Mendrik (Image Sciences Institute, UtrechtUniversity, the Netherlands); and Dr Marek Cyrklaff (Universityof Heidelberg, Germany) for helpful discussions.
Appendix A. Supplementary data
Supplementary data associated with this article can be found, inthe online version, at http://dx.doi.org/10.1016/j.jsb.2014.03.009.
References
Abu Bakar, N.A., Klonis, N., Hanssen, E., Chan, C., Tilley, L., 2010. Digestive-vacuolegenesis and endocytic processes in the early intraerythrocytic stages ofPlasmodium falciparum. J. Cell Sci. 123, 441–450.
Agulleiro, J.I., Fernandez, J.J., 2011. Fast tomographic reconstruction on multicorecomputers. Bioinformatics 27, 582–583.
Ali, R.A., Landsberg, M.J., Knauth, E., Morgan, G.P., Marsh, B.J., et al., 2012. A 3Dimage filter for parameter-free segmentation of macromolecular structuresfrom electron tomograms. PLoS One 7, e33697.
Arslan, I., Tong, J.R., Midgley, P.A., 2006. Reducing the missing wedge: high-resolution dual axis tomography of inorganic materials. Ultramicroscopy 106,994–1000.
Baumeister, W., Grimm, R., Walz, J., 1999. Electron tomography of molecules andcells. Trends Cell Biol. 9, 81–85.
Cao, M., Zhang, H.B., Lu, Y., Nishi, R., Takaoka, A., 2010. Formation and reduction ofstreak artefacts in electron tomography. J. Microsc. 239, 66–71.
Cope, J., Heumann, J., Hoenger, A., 2011. Cryo-electron tomography for structuralcharacterization of macromolecular complexes. Curr. Protoc. Protein Sci., 13(Chapter 17, Unit17).
Cyrklaff, M., Kudryashev, M., Leis, A., Leonard, K., Baumeister, W., et al., 2007.Cryoelectron tomography reveals periodic material at the inner side ofsubpellicular microtubules in apicomplexan parasites. J. Exp. Med. 204, 1281–1287.
Downing, K.H., Sui, H., Auer, M., 2007. Electron tomography: a 3D view of thesubcellular world. Anal. Chem. 79, 7949–7957.
Dubochet, J., Adrian, M., Chang, J.J., Homo, J.C., Lepault, J., et al., 1988. Cryo-electronmicroscopy of vitrified specimens. Q. Rev. Biophys. 21, 129–228.
Fernández, J.J., Martínez, J.A., 2010. Three-dimensional feature-preserving noisereduction for real-time electron tomography. Digit. Signal Process. 20, 1162–1172.
Frangakis, A.S., Hegerl, R., 2001. Noise reduction in electron tomographicreconstructions using nonlinear anisotropic diffusion. J. Struct. Biol. 135, 239–250.
Frey, T.G., Perkins, G.A., Ellisman, M.H., 2006. Electron tomography of membrane-bound cellular organelles. Annu. Rev. Biophys. Biomol. Struct. 35, 199–224.
Gan, L., Jensen, G.J., 2012. Electron tomography of cells. Q. Rev. Biophys. 45, 27–56.Gilbert, P., 1972. Iterative methods for the three-dimensional reconstruction of an
object from projections. J. Theor. Biol. 36, 105–117.Guesdon, A., Blestel, S., Kervrann, C., Chretien, D., 2013. Single versus dual-axis cryo-
electron tomography of microtubules assembled in vitro: limits andperspectives. J. Struct. Biol. 181, 169–178.
Hanssen, E., Sougrat, R., Frankland, S., Deed, S., Klonis, N., et al., 2008. Electrontomography of the Maurer’s cleft organelles of Plasmodium falciparum-infectederythrocytes reveals novel structural features. Mol. Microbiol. 67, 703–718.
Hanssen, E., McMillan, P.J., Tilley, L., 2010a. Cellular architecture of Plasmodiumfalciparum-infected erythrocytes. Int. J. Parasitol. 40, 1127–1135.
Hanssen, E., Goldie, K.N., Tilley, L., 2010b. Ultrastructure of the asexual blood stagesof Plasmodium falciparum. Methods Cell Biol. 96, 93–116.
Herman, G.T., 2009. Fundamentals of Computerized Tomography: ImageReconstruction from Projections, second ed. Springer Publishing Company,Incorporated.
Jimenez, N., Post, J.A., 2012. A novel approach for intracellular 3D immuno-labelingfor electron tomography. Traffic 13, 926–933.
Koenderink, J., 1984. The structure of images. Biol. Cybern. 50, 363–370.Koster, A.J., Klumperman, J., 2003. Electron microscopy in cell biology: integrating
structure and function. Nat. Rev. Mol. Cell Biol. (Suppl.), 6–10.Köstler, H., Prümmer, M., Rüde, U., Hornegger, J., 2006. Adaptive variational
sinogram interpolation of sparsely sampled ct data. In: IEEE Computer Society,ICPR, vol. 3, pp. 778–781.
Kremer, J.R., Mastronarde, D.N., McIntosh, J.R., 1996. Computer visualization ofthree-dimensional image data using IMOD. J. Struct. Biol. 116, 71–76.
Kudryashev, M., Lepper, S., Stanway, R., Bohn, S., Baumeister, W., et al., 2010.Positioning of large organelles by a membrane-associated cytoskeleton inPlasmodium sporozoites. Cell. Microbiol. 12, 362–371.
Leis, A., Rockel, B., Andrees, L., Baumeister, W., 2009. Visualizing cells at thenanoscale. Trends Biochem. Sci. 34, 60–70.
Maiorca, M., Hanssen, E., Kazmierczak, E., Maco, B., Kudryashev, M., et al., 2012.Improving the quality of electron tomography image volumes using pre-reconstruction filtering. J. Struct. Biol. 180, 132–142.
Mastronarde, D.N., 1997. Dual-axis tomography: an approach with alignmentmethods that preserve resolution. J. Struct. Biol. 120, 343–352.
McIntosh, R., Nicastro, D., Mastronarde, D., 2005. New views of cells in 3D: anintroduction to electron tomography. Trends Cell Biol. 15, 43–51.
McMillan, P.J., Millet, C., Batinovic, S., Maiorca, M., Hanssen, E., et al., 2013. Spatialand temporal mapping of the PfEMP1 export pathway in Plasmodiumfalciparum. Cell. Microbiol. 15, 1401–1418.
Mendrik, A.M., Vonken, E.J., Rutten, A., Viergever, M.A., van Ginneken, B., 2009.Noise reduction in computed tomography scans using 3-D anisotropic hybriddiffusion with continuous switch. IEEE Trans. Med. Imaging 28, 1585–1594.
Milne, J.L., Subramaniam, S., 2009. Cryo-electron tomography of bacteria: progress,challenges and future prospects. Nat. Rev. Microbiol. 7, 666–675.
Moritz, M., Braunfeld, M.B., Sedat, J.W., Alberts, B., Agard, D.A., 1995. Microtubulenucleation by gamma-tubulin-containing rings in the centrosome. Nature 378,638–640.
Mumcuoglu, E.U., Hassanpour, R., Tasel, S.F., Perkins, G., Martone, M.E., et al., 2012.Computerized detection and segmentation of mitochondria on electronmicroscope images. J. Microsc. 246, 248–265.
Nguyen, H., Ji, Q., 2008. Shape-driven three-dimensional watersnake segmentationof biological membranes in electron tomography. IEEE Trans. Med. Imaging 27,616–628.
Penczek, P., Marko, M., Buttle, K., Frank, J., 1995. Double-tilt electron tomography.Ultramicroscopy 60, 393–410.
Perona, P., Malik, J., 1990. Scale-space and edge detection using anisotropicdiffusion. IEEE Trans. Pattern Anal. Mach. Intell. 12, 629–639.
Pierson, J., Vos, M., McIntosh, J.R., Peters, P.J., 2011. Perspectives on electron cryo-tomography of vitreous cryo-sections. J. Electron. Microsc. (Tokyo) 60 (Suppl. 1),S93–S100.
Radermacher, M., 1992. Weighted back-projection methods. In: Frank, J. (Ed.),Electron Tomography: Three-dimensional Imaging with the TransmissionMicroscope. Plenum Press, New York, pp. 91–115.
M. Maiorca et al. / Journal of Structural Biology 186 (2014) 28–37 37
Saghi, Z., Midgley, P.A., 2012. Electron tomography in the (S) TEM: from nanoscalemorphological analysis to 3D atomic imaging. Annu. Rev. Mater. Res. 42, 59–79.
Sorzano, C.O., Marabini, R., Velazquez-Muriel, J., Bilbao-Castro, J.R., Scheres, S.H.,et al., 2004. XMIPP: a new generation of an open-source image processingpackage for electron microscopy. J. Struct. Biol. 148, 194–204.
Spycher, C., Rug, M., Pachlatko, E., Hanssen, E., Ferguson, D., et al., 2008. TheMaurer’s cleft protein MAHRP1 is essential for trafficking of PfEMP1 to thesurface of Plasmodium falciparum-infected erythrocytes. Mol. Microbiol. 68,1300–1314.
Tchelidze, P., Sauvage, C., Bonnet, N., Kilian, L., Beorchia, A., et al., 2006. Electrontomography of amplified nanogold immunolabelling: improvement of qualitybased on alignment of projections with sinograms and use of post-reconstruction deconvolution. J. Struct. Biol. 156, 421–431.
van der Heide, P., Xu, X.-P., Marsh, B.J., Hanein, D., Volkmann, N., 2007. Efficientautomatic noise reduction of electron tomographic reconstructions based oniterative median filtering. J. Struct. Biol. 158, 196–204.
Vanhecke, D., Asano, S., Kochovski, Z., Fernandez-Busnadiego, R., Schrod, N., et al.,2011. Cryo-electron tomography: methodology, developments and biologicalapplications. J. Microsc. 242, 221–227.
Weickert, J., 1996a. Theoretical foundations of anisotropic diffusion in imageprocessing. In: Kropatsch, W. et al. (Eds.), Theoretical Foundations of ComputerVision, vol. 11. Springer Vienna, pp. 221–236.
Weickert, J., 1996b. Anisotropic diffusion in image processing. University ofKaiserslautern.