ORIGINAL ARTICLE Local seismic network for monitoring of a potential nuclear power plant area Timo Tiira & Marja Uski & Jari Kortström & Outi Kaisko & Annakaisa Korja Received: 30 April 2015 /Accepted: 26 October 2015 /Published online: 5 November 2015 # The Author(s) 2015. This article is published with open access at Springerlink.com Abstract This study presents a plan for seismic moni- toring of a region around a potential nuclear power plant. Seismic monitoring is needed to evaluate seismic risk. The International Atomic Energy Agency has set guidelines on seismic hazard evaluation and monitoring of such areas. According to these guidelines, we have made a plan for a local network of seismic stations to collect data for seismic source characterization and seismotectonic interpretations, as well as to monitor seismic activity and natural hazards. The detection and location capability of the network were simulated using different station configurations by computing spatial azimuthal coverages and detection threshold magni- tudes. Background noise conditions around Pyhäjoki were analyzed by comparing data from different sta- tions. The annual number of microearthquakes that should be detected with a dense local network centered around Pyhäjoki was estimated. The network should be dense enough to fulfill the requirements of azimuthal coverage better than 180° and automatic event location capability down to ML ∼ 0 within a distance of 25 km from the site. A network of 10 stations should be enough to reach these goals. With this setup, the detection threshold magnitudes are estimated to be ML= −0.1 and ML=0.1 within a radius of 25 and 50 km from Pyhäjoki, respectively. The annual number of earthquakes detected by the network is estimated to be 2 (ML ≥∼ −0.1) within 25 km radius and 5 (ML ≥∼−0.1 to ∼0.1) within 50 km radius. The location accuracy within 25 km radius is estimated to be 1–2 and 4 km for horizontal coordinates and depth, respectively. Thus, the network is dense enough to map out capable faults with horizontal accuracy of 1–2 km within 25 km radius of the site. The estimation is based on the location accuracies of five existing networks in northern Europe. Local factors, such as seismic noise sources, geology and infrastructure might limit the station con- figuration and detection and location capability of the network. Keywords Seismology . Seismic monitoring . Seismicity . Tectonics . Seismic hazard . Nuclear power plant 1 Introduction Sites of nuclear power plants must be evaluated for seismic risk and monitored for seismicity (IAEA, 3.30, 2010). A new nuclear power plant is planned to be constructed at Hanhikivi, Pyhäjoki, Northern Ostrobothnia. Pyhäjoki is situated in the Central part of the Fennoscandian Shield, a region characterized by low intraplate seismicity (Fig. 1). European Union’ s directive (2009/71/EURATOM 9) recommends the op- erators to follow IAEA ’ s guidelines on seismic hazard evaluation and monitoring of the area. According to IAEA (3.30, 2010) guidelines, a network of sensitive J Seismol (2016) 20:397–417 DOI 10.1007/s10950-015-9534-8 T. Tiira (*) : M. Uski : J. Kortström : O. Kaisko : A. Korja Institute of Seismology, Department of Geosciences and Geography, University of Helsinki, HelsinkiPOB 68, FIN-00014, Finland e-mail: [email protected]
Transcript
ORIGINAL ARTICLE
Local seismic network for monitoring of a potential nuclearpower plant area
Timo Tiira & Marja Uski & Jari Kortström &
Outi Kaisko & Annakaisa Korja
Received: 30 April 2015 /Accepted: 26 October 2015 /Published online: 5 November 2015# The Author(s) 2015. This article is published with open access at Springerlink.com
Abstract This study presents a plan for seismic moni-toring of a region around a potential nuclear powerplant. Seismic monitoring is needed to evaluate seismicrisk. The International Atomic Energy Agency has setguidelines on seismic hazard evaluation and monitoringof such areas. According to these guidelines, we havemade a plan for a local network of seismic stations tocollect data for seismic source characterization andseismotectonic interpretations, as well as to monitorseismic activity and natural hazards. The detection andlocation capability of the network were simulated usingdifferent station configurations by computing spatialazimuthal coverages and detection threshold magni-tudes. Background noise conditions around Pyhäjokiwere analyzed by comparing data from different sta-tions. The annual number of microearthquakes thatshould be detected with a dense local network centeredaround Pyhäjoki was estimated. The network should bedense enough to fulfill the requirements of azimuthalcoverage better than 180° and automatic event locationcapability down to ML∼0 within a distance of 25 kmfrom the site. A network of 10 stations should be enoughto reach these goals. With this setup, the detectionthreshold magnitudes are estimated to be ML=−0.1and ML=0.1 within a radius of 25 and 50 km fromPyhäjoki, respectively. The annual number of
earthquakes detected by the network is estimated to be2 (ML≥∼ −0.1) within 25 km radius and 5 (ML≥∼−0.1to ∼0.1) within 50 km radius. The location accuracywithin 25 km radius is estimated to be 1–2 and 4 kmfor horizontal coordinates and depth, respectively. Thus,the network is dense enough to map out capable faultswith horizontal accuracy of 1–2 kmwithin 25 km radiusof the site. The estimation is based on the locationaccuracies of five existing networks in northernEurope. Local factors, such as seismic noise sources,geology and infrastructure might limit the station con-figuration and detection and location capability of thenetwork.
Sites of nuclear power plants must be evaluated forseismic risk and monitored for seismicity (IAEA, 3.30,2010). A new nuclear power plant is planned to beconstructed at Hanhikivi, Pyhäjoki, NorthernOstrobothnia. Pyhäjoki is situated in the Central partof the Fennoscandian Shield, a region characterized bylow intraplate seismicity (Fig. 1). European Union’sdirective (2009/71/EURATOM 9) recommends the op-erators to follow IAEA’s guidelines on seismic hazardevaluation and monitoring of the area. According toIAEA (3.30, 2010) guidelines, a network of sensitive
T. Tiira (*) :M.Uski : J. Kortström :O.Kaisko :A.KorjaInstitute of Seismology, Department of Geosciences andGeography, University of Helsinki, HelsinkiPOB 68, FIN-00014,Finlande-mail: [email protected]
seismographs having a recording capability for micro-earthquakes should be installed to acquire more detailedinformation on potential seismic sources when a nuclearpower plant site is evaluated. The operation period ofthe seismograph network should be long enough toobtain data for seismotectonic interpretation (IAEA,3.30, 2010), and the monitoring of natural hazards shallcommence no later than the start of construction andshall continue up until decommissioning (IAEA, 5.1,2003). Strongmotion accelerographs should be installedpermanently within the site area. The data processing,reporting, and network operation are advised to belinked to the regional and/or national networks. TheIAEA (2010) sets special requirements for intraplateregions, where longer observation periods should beused, capable faults and sources at larger distancesshould be taken into consideration, and maximum mag-nitudes should be assumed larger.
When a dense, local seismic network is set up, nu-merous small earthquakes are expected to be recorded
within a relatively short time period. Local seismicnetworks have better location accuracy and sourcedepths can be evaluated more reliably than with moresparse regional networks. Seismotectonic interpretationand seismic hazard evaluation can be improved with alarger amount of accurately located earthquakes.
In the preliminary geological and geophysical studiesof the Pyhäjoki area (Kuivamäki et al. 2011; Korja et al.2010; Pihlaja et al. 2011; Poutanen et al. 2011 andPutkinen and Valpola 2011) no capable faults could beidentified within a radius of 25 km. The data sets didnot, however, cover all of the offshore areas and theaccuracy of epicenter locations close to Pyhäjoki wasrather low (Kukkonen 2011). In order to attach seismicevents to single faults or shear zones, more events withbetter hypocenter location accuracy are sought for.
The focus of this study is to outline a plan for a localseismograph network centered around Pyhäjoki. Thenetwork should serve to collect data for seismic sourcecharacterization and seismotectonic interpretations as
Fig. 1 A seismicity map of Pyhäjoki area for the period 1626–2010. Macroseismic and instrumental epicenters are denoted byblue and red dots, respectively. Macroseismic data is from
Mäntyniemi and Ahjos (1990). Three concentric circles have a110, 50, and 25 km radii from Pyhäjoki (black square). Seismicityzones: SZ Skellefteå; BBZ Bothnian Bay-Finnmark; KZ Kuusamo
398 J Seismol (2016) 20:397–417
well as to monitor seismic activity and natural hazardsthroughout the lifetime of the planned facility. First, anideal network configuration without the restrictions ofinfrastructure, geographical barriers or geologicalboundaries is searched for. Modifications to the idealconfiguration are expected in the deployment phase.
There are many methods for estimation of the lowestmagnitude of events that a seismic network is able todetect (Sereno and Bratt 1989; Gomberg 1991; Woessnerand Wiemer 2005; Schorlemmer and Woessner 2008).They are usually used to evaluate the performance of anexisting seismic network or completeness of an earth-quake catalog. We try to estimate what kind of network isneeded to fulfill certain level of performance.We use datafrom existing networks of different sizes in the samelarger region to calculate estimated spatial distributionof the magnitude of the smallest detectable earthquake.An estimate for accuracy of the hypocentral locationsproduced by the planned network is formed by studyingperformance of the existing networks of about similarsize in the region, and by comparing the geographicallayout of the planned network to those of the existingnetworks. The event detection and location performanceof a local seismic network around Pyhäjoki will be sim-ulated and recommendations on the optimal configura-tion of the network will be given. The simulations arebased on automatic event bulletin data sets published bythe Institute of Seismology, University of Helsinki(ISUH). The activity rate of microearthquakes belowthe current detection threshold is estimated by using theFennoscandian earthquake catalog (FENCAT; Ahjos andUski 1992). The azimuthal coverage and threshold mag-nitude is computed for different types of station configu-rations and the results are presented as maps.
2 Noise conditions and their effect on earthquakedetection and location capability
The location capability of a seismic network depends onthe detection capability, on the background noise leveland on the geometrical configuration of the network.The event detection capability of a seismic station de-pends strongly on its background noise level and signalto noise ratio (SNR) (Bolt 1976). In automatic detectionprograms, the amplitude generated by an event is re-quired to be larger than the background noise by a presetthreshold (Ambuter and Solomon 1974). Lower thresh-old values can be used if the noise conditions are
favorable or the risk of increased number of false detec-tions is manageable (Bratt et al. 1990).
Background noise conditions around Pyhäjoki areanalyzed by using existing waveform data sets fromthe closest permanent station OUF, situated 29 km eastof Pyhäjoki. The calculations are performed with thePQLX software (McNamara and Boaz 2005), whichuses the power spectral density technique ofMcNamara and Buland (2004). The results are com-pared with those from the station KU6 (Fig. 2). Notethat the average of low period (high frequency) noise isslightly higher at OUF but its variation is smaller than atKU6. KU6 is part of the FNSN permanent station net-work. It belongs also to the Kuusamo local network(KULN) (Uski et al. 2011) in north-eastern Finland.Most of the low magnitude (ML<1) earthquakes usedin the current study have been detected by KULN tem-porary network. The typical station spacing of KULNnetwork is 40 km. Although the noise conditions areroughly similar at the two stations, OUF has a bit higheraverage noise level than KU6 at high frequencies (peri-od below 0.1 s), which are used in detecting weaksignals at short distances. The local magnitude scale(Uski and Tuppurainen 1996) is calibrated to Richter’sreference curve at 60 km.
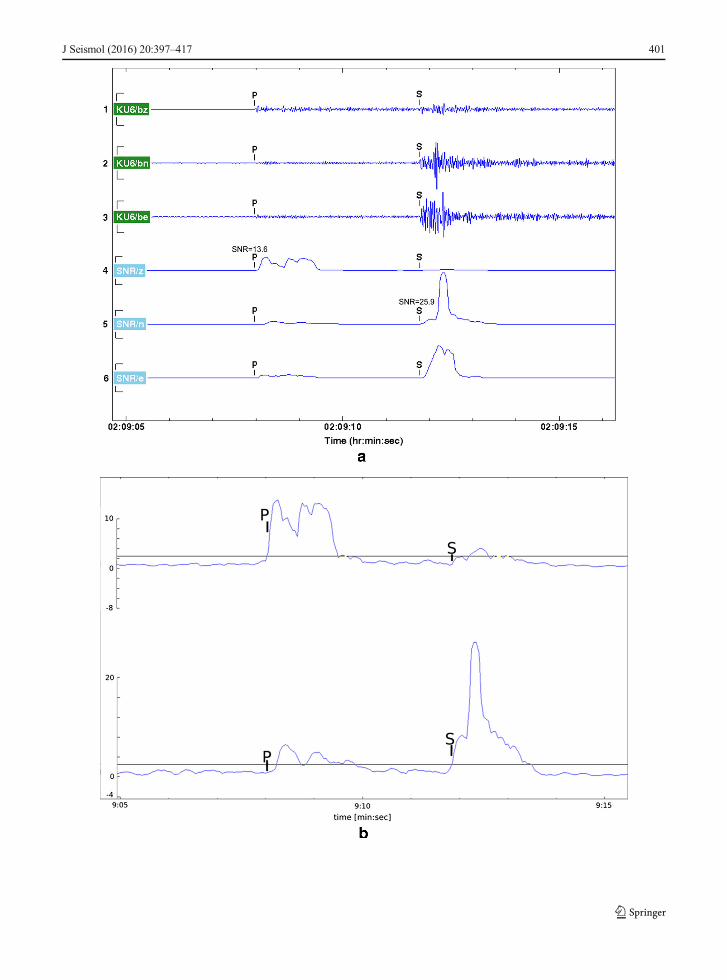
Figure 3a shows an example of filtered three-channel(3-C) recordings and their SNR at KU6. Note that SNRis well above the detection threshold (2.2) used in auto-matic analysis (Fig. 3b). The studied event is a localearthquake ofML −0.1 at a distance of 21 km fromKU6.It is the weakest event of which both the P- and S-waveonsets have been automatically detected by KULN.Prior to detection, the signal was filtered with a band-pass filter of 10–30 Hz. Note that the SNR levels arewell above the detection thresholds used in the automat-ic analysis (Fig. 4). Based on the roughly similar levelsof background noise in the KULN and Pyhäjoki areas,the network around Pyhäjoki is expected to have similarability to record small earthquakes and other seismicevents as KULN.
3 Automatic location system of ISUH
ISUH has an in-house-designed automatic data process-ing system, which utilizes the available on-line 3-C andarray stations in Finland and in the neighboring coun-tries (Fig. 4). The automatic detection routine suggestsinitial locations of seismic events with single station
J Seismol (2016) 20:397–417 399
back azimuth determination and associates the initiallocations with detections from other stations. At single3-C stations the detection is based on software by Ruudand Husebye (1992), which uses the back azimuthdetermination and phase identification method ofRoberts et al. (1989) to produce automated single-station event bulletins. The seismic array stationsFINES and ARCES in southern Finland and in northernNorway, respectively, use processing methods and soft-ware developed by NORSAR (Bache et al. 1990) toproduce single station event bulletins.
The single station results are combinedwith a programwhich continuously reads the locations from other singlestation bulletins. It calculates theoretical P- and S-wavearrival times for each station and for each source. SuitableP- and S-onset times are searched from initial detectionlogs using a chosen time window. If three or more sta-tions have phases associated with the same source, theyare run through location program HYPOSAT(Schweitzer 2001) to improve the source parameters.
The back azimuth value, which is obtained from 3-Cdetectors and array detectors, is also used for location.This method allows the usage of low detection thresholdsat single stations—a necessity in detecting weak signals.The relatively high rate of false alarms in single stationdetection logs is manageable with association rules.
The automatic event processing using this methodstarted in 2007. Last significant upgrade to the systemwas in 2010 when the Swedish National SeismicNetwork (SNSN; Bödvarsson et al. 2006), operated bythe University of Uppsala, provided six stations for theISUH automatic on-line analysis. This improved the
Fig. 2 Background noise level atstations OUF and KU6 displayedas power spectral densityfunctions. The power spectraldensities are calculated from1 week of continuous recordingfor the same time period at bothstations. The gray lines denote theglobal average of low and highnoise level models (Peterson1993). The white dashed linesdenote 10th and 90th percentiles.The black dashed line shows themedian
Fig. 3 a An example showing 3-C recording of a low magnitudeearthquake (ML −0.1) at KU6, 21 km from the source. Thetopmost three traces (vertical, north, and east) are filtered (band-pass 10–30 Hz) recordings and the bottom three traces are corre-sponding SNR traces of the waveforms. b Partial enlargement ofvertical Z and horizontal N traces in b. The black lines show thedetection threshold
b
400 J Seismol (2016) 20:397–417
J Seismol (2016) 20:397–417 401
detection capability in the Finnish-Swedish border zonein Lapland and in the Bothnian Bay.
The station network that is currently used in automat-ic processing is shown in Fig. 4. At present, it consists of17 stations operated by ISUH, 4 stations operated by theSodankylä Geophysical Observatory, University ofOulu, 7 stations operated by University of Uppsala, 3stations operated by the Geological Survey of Estonia,and 1 station operated by NORSAR, Norway.
Similar automatic location system with parameterssuitable for local area network has been used to locateseismic events at KULN. Data from the local network inPyhäjoki area will be processed with a similar systemthat is tuned for local conditions.
4 Seismicity statistics for Pyhäjoki area
Pyhäjoki is a seismically quiet area located betweenthree zones of increased seismic activity: Skellefteå(SZ) in the west, Bothnian Bay Zone–Finnmark (BBZ)in the north-west and Kuusamo (KZ) in the north-east
(Fig. 1) (Korja et al. 2015). The earthquake observationsfrom the area date back to the eighteenth century. Thestrongest historical earthquake took place in 1737 on theeast coast of Bothnian Bay, 85 km south-west ofPyhäjoki. It has been assigned with a macroseismicmagnitude of 4.1. No event of magnitude greater than4.0 has been recorded in the area during semi-instrumental (1956–1970) and instrumental (1971–2011) era. Furthermore, only three instrumental events,with magnitudes (ML) ranging from 1.7 to 2.3, havebeen detected within 25 km of Pyhäjoki (Fig. 1). Theearthquake information has been retrieved fromFENCAT catalog (Institute of Seismology, Universityof Helsinki 2015; Ahjos and Uski 1992).
In the following, the annual number of microearth-quakes that should be detected with a dense local net-work centered around Pyhäjoki is estimated. In order tocalculate a Gutenberg-Richter (G-R) frequency-magnitude curve (Gutenberg and Richter 1944) repre-sentative for the area, the source region must be defined.The region must be large enough to include a sufficientnumber of earthquakes for statistical analysis, but small
Fig. 4 On-line seismic stationsused by ISUH in automatic eventprocessing on a map of maximumazimuthal gap. A triangle denotes3-C station and a star seismicarray. Stations OUF and KU6 aremarked with yellow and red fill,respectively. Pyhäjoki plant areais marked with a square
402 J Seismol (2016) 20:397–417
enough to exclude the neighboring regions with differ-ent seismotectonic characteristics. An area with a radiusof 110 km around Pyhäjoki is estimated to fulfill therequirements (Fig. 1). From this, we have excludedseismicity along the southernmost part of the BBZ andthe Skellefteå region in eastern coast of Sweden, theseismically most active area in Sweden, since thoseevents belong to different seismotectonic environments.The study focuses on instrumentally recorded earth-quakes because it is not straightforward to determinethreshold magnitude (Mt) for historical data sets or tocompare macroseismic and instrumental magnitudes.The earthquake information has been retrieved fromFENCAT catalog (Institute of Seismology, Universityof Helsinki 2015; Ahjos and Uski 1992).
Frequency-magnitude distribution of earthquakes isgenerally approximated by the G-R-relation (Gutenbergand Richter 1944):
log10 Nð Þ ¼ a−bM ; ð1Þ
where N is the cumulative number of earthquakes withmagnitude equal to or greater than M occurring in aspecified space and time window. Intercept a measuresthe activity rate and slope b defines the ratio of small tolarge earthquakes.
Over long time periods and large spatial scales, the bvalues of tectonic earthquakes approximate 1.0, i.e., thedistribution of earthquake size is invariant with respectto scale. The shorter the time interval or the smaller thearea, the more the fit is degraded by insufficient datasampling. In continental interiors, the recurrence periodsof large earthquakes may exceed the time interval stud-ied. Furthermore, at low magnitudes the data may beincomplete due to the detection threshold of the seismicnetwork.
In seismic hazard assessment, the G-R -relation hasbeen used to predict the recurrence periods of rare largeearthquakes from the number of weaker but more com-mon events. Conversely, some studies have demonstrat-ed that earthquake self-similarity extends at least downto magnitude ML∼0 (Abercombie 1996 and referencestherein). These results suggest that the G-R -relation canalso be applied in estimating the number of microearth-quakes from the occurrence rate of stronger events (e.g.,Häge and Joswig 2009). This approach is also used inthis study to estimate the number of microearthquakesthat could be detected with a dense local network aroundPyhäjoki.
Figure 5 shows a time-magnitude distribution ofinstrumental earthquakes located within a 110-km dis-tance from Pyhäjoki. The plot reveals different levels ofcompleteness in the local catalog. The first change (A)occurred in late 1970s when digital three-partite arraysin southern and central Finland became fully operation-al, allowing for systematic use of instrumental detection,location and magnitude determination methods.Modernization of SNSN, a dense digital network nowcovering all of Sweden, began in 1998 (B) and by theend of the same year, the upgrade of FNSN to a digitalhigh-frequency network was completed. The most sig-nificant increase in number of events as well as decreasein observed Mt occurred around 2004 (C) when SNSNstarted providing parameter data to FENCAT. However,the majority of thosemicroearthquakes are located in theSwedish side of the Bothnian Bay, at a distance of 50–110 km from Pyhäjoki (cf. Fig. 1). The time period of1979–2011 was chosen for subsequent analysis becauseof an average constant seismicity above Mt of 1.6 andhomogeneity of local magnitudes. To exclude earth-quakes of a different seismotectonic zone (southernmostend of BBZ), events in area bordered by latitude 65.0and longitude 23.5 in south-west edge were left out ofthe analysis.
Figure 6 shows the frequency-magnitude distributionof the earthquakes located within 110 and 50 km ofPyhäjoki during 1979–2010. The values a(110 km)=1.24±0.14 and b(110 km)=0.85±0.06 were obtained bylinear least squares regression analysis with Mt=1.7.The spatial coverage of seismicity is rather heteroge-neous, as only 7 of the 70 events fall within the 50 kmradius (cf. Fig. 1). However, by assuming that the ob-tained b value is a representative value of the wholevolume, the activity rate of a(50 km)=0.72±0.12 isobtained. The catalog is complete only for magnitudeslarger than 1.7, resulting in a dataset with a very narrowmagnitude range, between M=1.7 and M=3.2. Theaccuracy of the fit is limited due to the scarcity of eventsof higher magnitude (ML≥2.4). The expected rates ofearthquake occurrences within 110, 50 and 25 km areaof Pyhäjoki are given in Table 1.
5 Simulation of automatic networks
A modern local seismic network is designed to exploitautomatic event detection and location routines. Thelocation accuracy of the network depends mainly on
J Seismol (2016) 20:397–417 403
its spatial configuration and SNR. The amplitude ofseismic waves attenuates with distance. Thus the mag-nitude of the smallest detectable earthquake depends onthe range of epicentral distances. The location accuracyis influenced by azimuthal gap. Azimuthal gap is themaximum angle separating two adjacent seismic sta-tions, both measured from the epicenter of an earth-quake (Fig. 7). If azimuthal gap is more than 180°, thelocation accuracy degrades significantly. The detectioncapability of a network can be evaluated based on therelationship between magnitude and observationdistance.
In the following, the automatic location capability ofPyhäjoki network is investigated by analyzing the rela-tion between magnitude and distance at which both P-and S-phases can be automatically detected. The under-lying assumption is that Pyhäjoki area has similar atten-uation characteristics and noise conditions to other partsof Finland. Preliminary studies of seismic noise condi-tions in the area support this assumption (Valtonen et al.2012; Korja et al. 2010). The data comprise the earth-quakes detected by FNSN supplemented with smallermagnitude earthquakes detected by KULN. The data setincludes 259 earthquakes located within the
Fig. 5 A time-magnitudedistribution of earthquakesrecorded within 110 km (filledcircles) and 50 km (open circles)distance of Pyhäjoki during1970–2010. Gray filled circlesdenote earthquakes which wereexcluded from the analysis sincebelong to different seismotectonicenvironments. The letter symbolsmark the most significant changesin catalog completeness, see textfor more details
Fig. 6 Magnitude-frequencycurves for earthquakes recordedwithin 110 and 50 km radius ofPyhäjoki during 1979–2010. N isthe cumulative annual number ofearthquakes with magnitude Mgreater than or equal to a certainvalue. Gray and black lines showthe b value determined for the110 km data that is also applied tothe 50 km data
404 J Seismol (2016) 20:397–417
Fennoscandian Shield (Figs. 8 and 9). First, for eachautomatically detected earthquake the largest epicentraldistance where both P- and S-phases have been detectedis selected. The maximum distance is associated with amanually reviewed magnitude. Then, gross error analy-sis is performed to weed out outliers from the data set(Wang et al. 2011). Only one event is excluded after theanalysis (Fig. 9). There are only few events with
maximum detection distance above 500 km in the dataset because the automatic processing of FNSN data doesnot search for events with larger epicentral distance than500 km. Most events larger than magnitude 2.0 in theregion occur farther than 500 km from the stations.Consequently, the number of earthquakes at magnitudeslarger than 2.0 in the database is small and their distancerange is biased. Therefore, the analysis is limited to theevents below magnitude 2.0 (Fig. 9).
Groundmotion can be expressed in a simplified formwith formula (see e.g. Joyner and Boore 1981; Liu andTsai 2005):
log Yð Þ ¼ Aþ BM−log10 Rð Þ þ CR ð2Þwhere Y is ground motion,M is magnitude, R is distanceto hypocenter and A, B, andC are coefficients. If groundmotion is assumed to be constant for the detectionthreshold, the magnitude can be expressed with formula:
M ¼ blog10 Dð Þ þ aDþ c ð3Þwhere D is distance from earthquake source, M ismagnitude, a and b are coefficients of anelasticattenuation and geometrical spreading, and c is abaseline correction. The difference between epicen-tral and hypocentral distances is neglected sincedepth range of the earthquakes is small comparedto epicentral distance.
The data are weighed according to the number ofpoints in the magnitude bins. Bin width is 0.1 magnitudeunits. By fitting the function (2) with the least squaresmethod to the data (Fig. 10), the following equation isobtained:
M ¼ 0:93log10 Dð Þ þ 0:0015D−1:3 ð4Þ
The capability to automatically detect seismic eventscan be tested with seismic network simulations. Therelation (4) between magnitude and the maximum de-tection distance (Fig. 10) is applied to calculate theminimum detectable magnitude maps (Figs. 11, 12a,13a, 14a, 15a, 16a, and 17a) for the study area.
Themaps are calculated by forming a 0.1×0.1 degreegrid over the area. Every grid point is a possible earth-quake epicenter from which the distances to the stationsare calculated. The distance used in the simulations isthe distance to the third closest station of the simulatednetwork at any point. This ensures that there will bephase readings from at least three stations, as required
Table 1 Annual frequency of earthquakes with magnitude ML≥−1.0 within 110, 50, and 25 km radius of Pyhäjoki
ML 110 km 50 km 25 km
−1.0 123 37 9
−0.8 83 25 6
−0.6 56 17 4
−0.4 38 11 3
−0.2 26 8 2
0.0 17 5 1
0.2 12 4 1
0.4 8 2 1/2 years
0.6 5 2 1/2 years
0.8 4 1 1/4 years
1.0 2 1 1/5 years
2.0 1/3 years 1/10 years 1/38 years
3.0 1/20 years 1/68 years 1/270 years
Fig. 7 Azimuthal gap. An earthquake epicenter is denoted by star,seismic stations by triangles and epicenter-to-station paths bydashed lines. The arrows denote azimuthal gaps, the red one beingthe maximum gap
J Seismol (2016) 20:397–417 405
by ISUH automatic location process. This epicentraldistance is then converted to the minimum detectablemagnitude at the grid point by using Eq. (4). The sim-ulations are aimed at achieving a good detection capa-bility within 25 km radius of Pyhäjoki.
Another demand for Pyhäjoki network is a goodazimuthal coverage within the 25 km radius area. Themaximum azimuthal gap is directly related to networkgeometry and provides a quantitative measure on howconsistently an event is surrounded by stations. It is one
of the most useful criteria in the estimation of locationaccuracy (Bondár et al. 2004). Thus, maximum azi-muthal gap is calculated at every point of the grid. Agood azimuthal coverage could be gained by simplysurrounding the area of interest with stations consistent-ly. This demand cannot be fully met offshore and thusthe azimuthal coverage will remain poorer offshore thanonshore.
Each simulation of the minimum detectable magni-tude involves also the closest surrounding stations
Fig. 8 The data set of automatically located earthquakes fromsimilar geological environments to Pyhäjoki. The events includedin the study are marked with dots (FNSN) and triangles (KULN)
and the events excluded with crosses. The magnitudes of theevents are expressed with the proportional sizes of the symbols
406 J Seismol (2016) 20:397–417
available from the existing networks of FNSN andSNSN, although they are not displayed on thesimulation maps. In the maximum azimuthal gapcalculations, only those stations visible on themaps are used. This shows the realistic azimuthalcoverage for events with minimum detectable mag-nitude, which are hardly seen by far-off stations.The results are presented in Figs. 11, 12, 13, 14,15, 16, and 17b.
Figures 12a, 13, 14, 15, 16, and 17b show the simu-lation results for 7 different station configurations com-prising 6–14 stations. The average threshold magnitudeand azimuthal coverage of the networks are summarized
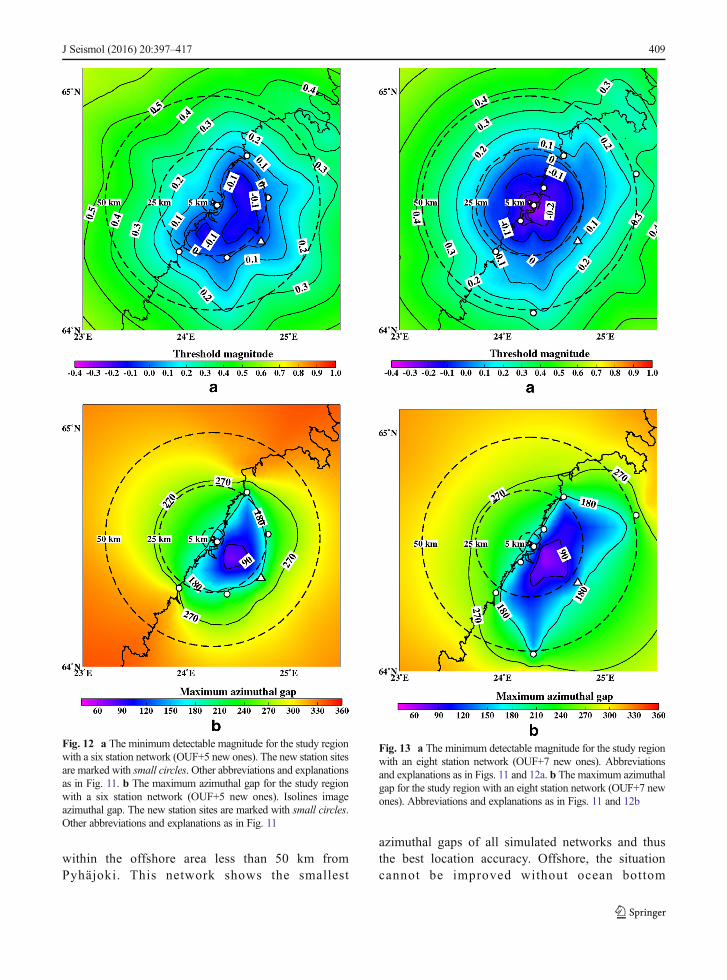
in Table 2. The network consisting of six stations(Fig. 12a, b) has the capability to detect earthquakesdown to magnitude 0.0 onshore within 25 km from thesite. Offshore, the detection capability is slightly worseup tomagnitude 0.3. The azimuthal gap is less than 180°onshore but 200°–270° offshore within 25 km from thesite. The network with six stations has three stations onthe coast, one station 25 km from the Pyhäjoki site, andtwo stations 50 km from the Pyhäjoki site. Figure 13a, bshow the results of the eight stations network with twomore stations near the coast. The location of Pyhäjoki atthe shoreline sets limitations for the design of an equallyspaced network over the whole study area. The denser
Fig. 9 Amagnitude-distance plotof the events in Fig. 8. The dataincluded is presented with graydots and the data excluded withcrosses
Fig. 10 The calculated fit to therelationship between magnitudeand maximum P- and S-wavedetection distance. The fit isdrawn with black line and thenon-simultaneous functionprediction bounds for 95% valueswith dashed lines. Themagnitude-distance -pairs aredrawn with gray dots
J Seismol (2016) 20:397–417 407
network at the shoreline gives more uniform detectioncapability for both onshore and especially for offshoreareas within 25 km distance of Pyhäjoki. The azimuthalgap in offshore area remains about the same as with thesix stations network. In onshore area the azimuthal gapis smaller especially in the area 25–50 km from thePyhäjoki site. The stations farther inland improve theazimuthal coverage. The next simulated network shownin Fig. 14a, b consists of 10 stations. The two additionalstations are placed on the islands of Ulkokalla (south-west from Pyhäjoki) and Hailuoto (north fromPyhäjoki). In this case, the offshore detection capabilityhas improved. Within 25 km offshore from the site, thedetection threshold magnitude is 0.1 or smaller.Onshore, the detection thresholds remain about the samecompared to the eight station network. The azimuthalgap is smaller than 180° for most of the area within25 km radius. The largest azimuthal gap within 25 kmfrom the site is only 193°. In the area 25–50 km from thePyhäjoki site the azimuthal gap is clearly smaller thanwith the 8 station network. By increasing the number ofstations to 12 (Fig. 15a, b) the detection capability
improves onshore. There are no significant changes inazimuthal gap compared to Fig. 14b. The two addedstations are located onshore about 25 km from thePyhäjoki site. Thus, their effect is minimal on offshorearea. Figures 16a, b and 17a, b show results from twodifferent network configurations with 14 stations. Thedifference between networks in Fig. 16a, b compared tonetworks in Fig. 17a, b is that in the first network(Fig. 16a, b) the added two stations are 25 km fromthe Pyhäjoki site and in the latter network (Fig. 17a, b)they are 50 km from Pyhäjoki. The network inFig. 16a, b improves the detection capability but theazimuthal gap does not improve compared to 12station network. The network in Fig. 17a, b im-proves the azimuthal coverage significantly but thedetection capability improves only slightly com-pared to 12 station network. In Fig. 16a, a detec-tion threshold of magnitude −0.2 or better is ob-tained in over 50 % of the onshore area within25 km from Pyhäjoki. This network shows thebest detection capability of all tested networks. InFig. 17b, the azimuthal gap is smaller than 180°
Fig. 11 The minimum detectablemagnitude by automatic locationsystem for the study region usingthe current station configurationof FNSN. Isolines showminimum detectable magnitude.The dashed circles denote areaswith radii of 5, 25 and 50 km fromthe power plant site, which ismarked with a star. Permanentseismic station OUF is markedwith a triangle
408 J Seismol (2016) 20:397–417
within the offshore area less than 50 km fromPyhäjoki. This network shows the smallest
azimuthal gaps of all simulated networks and thusthe best location accuracy. Offshore, the situationcannot be improved without ocean bottom
Fig. 12 a The minimum detectable magnitude for the study regionwith a six station network (OUF+5 new ones). The new station sitesare marked with small circles. Other abbreviations and explanationsas in Fig. 11. b The maximum azimuthal gap for the study regionwith a six station network (OUF+5 new ones). Isolines imageazimuthal gap. The new station sites are marked with small circles.Other abbreviations and explanations as in Fig. 11
Fig. 13 a The minimum detectable magnitude for the study regionwith an eight station network (OUF+7 new ones). Abbreviationsand explanations as in Figs. 11 and 12a. b The maximum azimuthalgap for the study region with an eight station network (OUF+7 newones). Abbreviations and explanations as in Figs. 11 and 12b
J Seismol (2016) 20:397–417 409
seismometers due to the lack of suitable islandsfor station installation. Adding new onshore sta-tions has not improved the detection threshold or
the azimuthal gap offshore compared to the net-work of 10 stations. Onshore, the average detec-tion threshold has improved about 0.1 magnitudes
Fig. 14 a The minimum detectable magnitude for the study regionwith a ten station network (OUF+9 new ones). Abbreviations andexplanations as in Figs. 11 and 12a. b The maximum azimuthal gapfor the study region with a ten station network (OUF+9 new ones).Abbreviations and explanations as in Figs. 11 and 12b
Fig. 15 a The minimum detectable magnitude for the studyregion with a 12 station network (OUF+11 new ones). Abbrevia-tions and explanations as in Figs. 11 and 12a. b The maximumazimuthal gap for the study region with a 12 station network(OUF+11 new ones). Abbreviations and explanations as in Figs. 11and 12b
410 J Seismol (2016) 20:397–417
in the area within 25 km from Pyhäjoki. Fartherfrom Pyhäjoki, the improvement is more clear. Interms of azimuthal gap, the improvement of
networks with more than 10 stations is observedmostly on onshore areas more than 25 km fromPyhäjoki. A uniform detection capability for
Fig. 16 a The minimum detectable magnitude for the study regionwith a 14 station network (OUF+13 new ones). Abbreviations andexplanations as in Figs. 11 and 12a. b The maximum azimuthal gapfor the study region with a 14 station network (OUF+13 new ones).Abbreviations and explanations as in Figs. 11 and 12b
Fig. 17 a The minimum detectable magnitude for the studyregion with a 14 station network (OUF+13 new ones), a differentgeometric configuration. Abbreviations and explanations as inFigs. 11 and 12a. b The maximum azimuthal gap for the studyregion with a 14 station network (OUF+13 new ones). Abbrevia-tions and explanations as in Figs. 11 and 12b
J Seismol (2016) 20:397–417 411
earthquakes ML≥0.0 for onshore areas and offshore onthe average within 21 km from the Pyhäjoki site can beobtained with a network of 10 stations.
6 Discussion
The simulation results show that a ten-station networkgives a good detection capability within 25 km radius ofPyhäjoki. Another demand for Pyhäjoki network isgood location accuracy. The azimuthal coverage of thestations has strong influence on the location accuracy.The simulated ten-station network gives a good azi-muthal coverage within 25 km radius from Pyhäjoki.From Table 1, we see that, within a radius of 25 km fromthe plant site, we can expect to record two earthquakes(ML≥∼ −0.1) per year and, from an area within a radiusof 50 km, 5 events (ML≥∼ −0.1 to ∼0.1) a year with anetwork of 10 stations. The occurrence rate of
earthquakes with ML≥2.0 is one earthquake in 10 yearswithin a radius of 50 km.
In the following, the location accuracy of the recom-mended seismic network of 10 stations will be estimatedby comparing it with other networks in Fennoscandiaand UK. Good azimuthal station coverage, sufficientnumber of seismic stations and short event-station dis-tances are a prerequisite for accurate hypocenter deter-mination (e.g., Bondár et al. 2004; Korja et al. 2010;Uski et al. 2011). The location accuracy is also affectedby reading errors and the applied velocity model.Because the uncertainties in event location cannot bederived directly from the geometry of a network, exam-ples from comparable set ups in geologically compara-ble areas are studied. In estimating future location accu-racy, we use results from two national networks, FNSN(Korja et al. 2015) and SNSN (Bödvarsson et al. 2006,2012), and from three local networks, KULN (Uski et al.2011), Pärvie (Lindblom 2011), and Posiva (Saari and
Table 2 Comparison of the simulated networks and FNSN
FNSN Pyhä 6 Pyhä 8 Pyhä 10 Pyhä 12 Pyhä 14 v.1 Pyhä 14 v.2
Mt 5 km 0.90 0.03 −0.26 −0.26 −0.26 −0.26 −0.26Mt 25 km 0.90 0.04 −0.08 −0.08 −0.10 −0.13 −0.10Mt 50 km 0.88 0.21 0.15 0.12 0.08 0.04 0.05
A 90° 5 km 0 % 0 % 0 % 0 % 0 % 0 % 0 %
A 90° 25 km 0 % 6 % 17 % 17 % 20 % 26 % 26 %
A 90° 50 km 0 % 1 % 4 % 4 % 5 % 6 % 12 %
A 180° 5 km 0 % 50 % 50 % 100 % 100 % 100 % 100 %
A180° 25 km 0 % 46 % 46 % 89 % 89 % 89 % 89 %
A 180° 50 km 0 % 12 % 27 % 53 % 53 % 53 % 68 %
Average threshold magnitude (Mt) and azimuthal coverage (A) within a radius of 5, 25 and 50 km from Pyhäjoki are summarized. Thesimulated networks of 6–12 stations are named BPyhä 6^ etc. The two different network configurations of 14 stations in Fig. 16a, b and inFig. 17a and b are marked with BPyhä 14 v.1^ and BPyhä 14 v.2^, respectively
Table 3 Comparison of the seismic networks used in the study
Network Number of stations Median station spacing (km) Threshold magnitude Location uncertainty (km)within the network
FNSN 2011 22 96 0.9 3–5
Kuusamo 2011 6 40 0.5 1–2
Pärvie 2007-10 15 23 –0.5 1–2
SNSN 2011 63 66 0.5 2
Posiva 2011 5 4 −1.0 0.2
Pyhäjoki 10 10 21 −0.1 1–2
Location uncertainties are from standard event processing
412 J Seismol (2016) 20:397–417
Malm 2010). The three local seismic networks havebeen operating on the Fennoscandian Shield during thelast decade.
The relatively sparse FNSN (Fig. 4) provides anaverage epicenter location uncertainty of 3–5 km(Korja et al. 2010) and threshold magnitude of ∼0.9(Fig. 11) within a radius of 25 km from Pyhäjoki. TheFNSN automatic processing system uses data from 32stations. The average station spacing of the FNSN isabout 100 km. In SNSN standard processing, the medi-an epicentral uncertainty is ca. 2 km and the thresholdmagnitude is 0.5. The SNSN consists of 66 seismicstations (Bödvarsson et al. 2012) and it has a stationspacing of 66 km.
A dense local seismic network (Posiva) has beenoperating around the underground rock characterizationfacility in Olkiluoto, south-western Finland since 2002.The network of five stations is equipped with threecomponent 1-Hz geophones suitable for investigatingtectonic seismicity (Saari and Malm 2010). WithinOlkiluoto and its surroundings, the threshold magnitudeis approximately ML −1.0 and the horizontal locationerror less than 0.2 km (Saari, pers. comm., 2011).
Seismically active Kuusamo area has beenmonitoredwith a temporary network KULN since 2003. In itspresent composition, the network consists of one on-line broad-band station (KU6, see Fig. 4) and five off-line short-period stations within a radius of ca. Fiftykilometers around the permanent broad-band stationMSF. The data of station MSF of the University ofOulu is included in the FNSN automatic processingsystem. Uski et al. (2011) estimate that when the azi-muthal gap is less than 160° and the event-to-stationdistances are less than 250 km, the epicenter locationaccuracy is 0.5 and 1–2 km for local explosions andearthquakes, respectively. Furthermore, the uncertaintyof unconstrained focal depths is estimated to be 4 km.
A dense temporary network has been operatingaround Pärvie end-glacial fault in northern Sweden dur-ing 2007–2010 (Lindblom 2011). In addition to eighttemporary stations deployed around the fault, data fromseven permanent stations have been used in the seismicanalyses. Within the network of temporary stations,Lindblom (2011) has estimated the threshold magnitudeto be −0.5 and the hypocenters to have average horizon-tal and depth uncertainties of 1–2 and 4 km, respective-ly. The location uncertainties have been further reducedby relocation with PStomo_eq, a three-dimensional lo-cal earthquake travel time tomography code by
Tryggvason et al. (2002). On average, the uncertaintiesof PStomo_eq locations are 0.5 km in horizontal direc-tions and 1.5 km in depth, for events with good azi-muthal coverage. The Pärvie network and the simulatedPyhäjoki networks have similar station spacing and thusthe uncertainties in the standard event location withinthe networks should be of the same order, i.e. 1–2 and4 km in horizontal and vertical directions, respectively.
Location statistics for the different networks are sum-marized in Table 3. It is worth noting that the estimatesof magnitude threshold in Table 3 agree rather well withthe maximum detection distances derived from Eq. (4)in Fig. 10. The slightly lower value reported for thePärvie network is acquired by the usage of a waveformcross-correlation technique (see Lindblom 2011).
If the aim of the network is to have good detectioncapability (an event detection threshold of magnitude0.0 or lower and azimuthal gap smaller than 180°)within 25 km distance from the site then a minimumof 10 seismic stations will be required. The comparisonwith other networks indicates the horizontal locationaccuracy to be about 1–2 km within the network. Withthis type of station setting it is possible to map andacquire information on capable faults within 25 kmradius of the site. With the estimated threshold magni-tudes, Mt=−0.1 and Mt=0.1 within a radius of 25 and50 km from Pyhäjoki, respectively, and the annual num-ber of earthquakes detected by the network is estimatedto be 2 (ML≥∼ −0.1) within 25 km radius and 5 (ML≥∼−0.1 to ∼0.1) within 50 km radius (Table 1.). Thesimulations are based on minimum detection thresholdmagnitude. On favorable conditions, a magnitude 0.5earthquake can be detected at 200 km distance in thestudy area. Some events will be detected at distance andmagnitude ranges which do not have complete detectionrecords. This will increase total number of detectedearthquakes in the area. After some earthquakes aredetected, correlation detectors can be used to find small-er but similar events (Gibbons et al. 2007). Correlationdetectors can give detection thresholds down to onemagnitude unit lower than traditional STA/LTA detec-tors (Schaff 2008).
Thus, the network is also suitable for acquiring infor-mation on faults within a distance of 25–50 km from thesite which is important in intraplate area. The locationaccuracy is decreasing close to the 50 km ring and thefocal mechanism of potential future events may beambiguous. Some extra stations will be needed if thenetwork was to function at maximum capability full
J Seismol (2016) 20:397–417 413
time and even during occasional mechanical collapsesof the stations. The proposed station on the island ofUlkokalla is easily reached for maintenance only be-tween April and October. If the station encounteredtechnical problems over a winter period, waveform datafrom the station would be inaccessible for months.Another station on the island of Ulkokalla or Maakalla(4 km from Ulkokalla) would ensure a continuous dataflow from offshore areas.
The depth range of earthquakes within radius of50 km from Pyhäjoki during the last 50 years has beenfrom 3 to 28 km and most of the earthquakes are locatedin depth range from 7 to 10 km. Within the 10 stationnetwork (Fig. 14a) the largest distance to the nearest 3stations is 20 km but smaller in most of the area within25 km radius from Pyhäjoki. The typical depth of anearthquake is estimated to be from 7 to 10 km or more.The exact accuracy of the depth is difficult to estimate.Results from other networks indicate that the accuracyof depth could be about 3–4 km. This has been deducedby comparing the ten-station network setup with theKULN and Pärvie networks and results obtained fromthese networks (Uski et al. 2011 and Lindblom 2011). Inthe KULN, the accuracy of depth is about 4 km (Uskiet al. 2011) and typical station spacing about 40 km. Theautomatic source locations can be fine tuned later bymanual review of arrival times and by the application ofthree dimensional velocity models or relative event lo-cation methods, such as PStomo_eq or HypoDD(Waldhauser and Ellsworth 2000; Ma and Eaton2011). Lindblom (2011) has estimated the accuracy ofdepth determination to be 4 km in the Pärvie networkarea. The Pärvie network has 15 stations but the area islarger and the station spacing varies more in the Pärvienetwork than in the Pyhäjoki 10 station network. Alsonoise conditions affect to hypocentral accuracy. ThePyhäjoki network is in an area with more human activitythan the KULN or Pärvie networks. The noise levels inPyhäjoki network are probably higher. The Pärvie net-work consists partly of temporary stations which havemore poor noise conditions than permanent seismicstations (Lindblom 2011). The Pyhäjoki network willconsist of permanent seismic stations which usually aremore carefully installed than temporary stations andthus tend to have lower noise levels.
The theoretical simulation is based on data fromFNSN and KULN, for which the station sites have beencarefully selected. The permanent stations lie on bed-rock in quiet areas with minimum amount of seismic
background noise. The selected station configuration of10 stations in Fig. 14a does not present final network,but a planned network that will give satisfactory resultsaccording to the network simulation. The final locationswill be selected after noise study has been made in thearea. According to preliminary noise studies, the noiselevels are comparable to other locations in Finland(Valtonen et al. 2012; Korja et al. 2010). Since the areahas abundance of bed rock outcrops, seismometers ofmost stations can be installed on bed rock. The studyarea has peat production plants and some small quarriesproducing seismic background noise. The area has alsowindmill parks, which produce seismic noise. Locationsof these facilities will be taken into account whenselecting the final station sites.
The pass band of instrument response of the seis-mometers at the stations should be wide enough in orderto record signals in the whole expected frequency range.This is especially important for source mechanism stud-ies that make use of spectral or time domain amplituderatios and for the studies of ground motion acceleration.The highest frequency can be expressed in terms of thecorner frequency (fc), i.e. the point at which the high-frequency part of the earthquake spectra starts to decay.At epicentral distance of 100 km, the theoretical S-wavecorner frequency as a function of event magnitude canbe approximated as follows (e.g., Eaton 1977; Lee andStewart 1981):
log f cð Þ ¼ 2:1−0:5ML ð5Þ
Theoretical corner frequencies of S-waves for differ-ent small local magnitudes (ML) are shown in Table 4.When selecting a high-frequency recording system formicro-earthquake monitoring, sampling rate is an im-portant factor. The seismograph should be programmedto record the events in enough detail to accurately
Table 4 Relation between theoretical S-wave corner frequencyand sampling rate
Sampling rate (Hz) fc (Hz) ML
1000 400 −1.0500 200 −0.4315 126 0.0
250 100 0.2
200 80 0.4
The corresponding magnitudes are also calculated
414 J Seismol (2016) 20:397–417
reproduce the whole earthquake spectrum. In general,the sampling rate should be 2.5 times the highest ex-pected frequency. Because the corner frequencies for P-waves are generally higher than those for S-waves (e.g.,Molnar et al. 1973) a sampling rate of 500 Hz wouldensure that both P- and S-wave frequency spectra isrecorded down to magnitude ∼0. However, earthquakeswith magnitude close to the detection threshold of thenetwork are generally too weak for thorough spectralanalysis. Earthquakes of ML=0.2 have S-wave cornerfrequency around 100 Hz. For these and larger events, asampling rate of 250 Hz will be adequate. It will also bemore cost-effective when using real-time data transfer.We cannot rule out possibility of recording larger eventsthan previously observed in the study area since loca-tions of intraplate earthquakes are difficult to predict.Their return period is very long, especially inPrecambrian crust, and they usually lack accompanyingsurface ruptures (Gangopadhyay and Talwani 2003).Even moderate-size earthquakes (M=5–6) may producesignals with energy in frequencies down to 0.1 Hz orlower (Havskov and Alguacil 2004). The stationsshould be capable of recording frequency range between0.01 and 100 Hz. In any case, the capability of the wholenetwork should be evaluated after an operation of fullyear and later at regular intervals. If needed, the sam-pling rate may be increased later. A thoroughmethod forevaluating the performance of hypocenter location of aseismic network has been presented by D’Alessandroet al. (2011). A similar method should be applied afterthe network has produced enough data for evaluation.
The network should also include strong motion in-struments (IAEA 3.32, 2010) because they may be theonly instruments recording the intense shaking of largeevents during which regular seismograph may be off-scale. Both the high-frequency and the strong motionrecorders should be 3-C devices (IAEA 3.32, 2010).The network should also have a maintenance plan anda plan for replacing stations during mechanical prob-lems. Additional stations could be used to fill the azi-muthal gaps caused by station shut-downs.
7 Conclusions
Based on the IAEA (2010) documentation and output ofthis study, it is recommend that the network to beinstalled around Pyhäjoki should be dense enough tofulfill the requirements of azimuthal coverage better
than 180° and automatic event location capability downto ML∼0 within a distance of 25 km from the site.
One seismograph station, including 3-C high-frequen-cy and strong motion seismographs (accelerographs),should be deployed in the site area. In addition, thenetwork should comprise at least nine high-frequency 3-C stations within a radius of 50 km from the site.
With this setup the threshold magnitudes are estimat-ed to be Mt=−0.1 and Mt=0.1 within a radius of 25 and50 km from Pyhäjoki, respectively. The annual numberof earthquakes detected by the network is estimated tobe 2 (ML≥∼ −0.1) within 25 km radius and 5 (ML≥∼−0.1 to ∼0.1) within 50 km radius.
Within a 25-km distance from Pyhäjoki, the earth-quake location accuracy is anticipated to be 1–2 and4 km for horizontal coordinates and depth, respectively.It can be further improved by the application of localvelocity models and relative location schemes.
A sampling rate of 250 Hz is recommended because itenables both cost efficient real-time data transfer and esti-mation of micro-earthquake spectrum down to ML=0.2.
It is recommended to link the data processing, anal-ysis and reporting to the national analysis procedure,and thus the recordings of the stations should be pub-licly available on-line.
The theoretical network simulations do not take intoaccount local factors, such as seismic noise sources,geology and infrastructure, which limit the number ofsites available for good-quality seismic stations.
Acknowledgments The fully automatic seismic bulletins usedin this study are based on real-time data from the Institute ofSeismology, University of Helsinki and the cooperative seismo-logical agencies: Sodankylä Geophysical Observatory of the Uni-versity of Oulu, Department of Earth Sciences of the University ofUppsala in Sweden, Geological Survey of Estonia and NORSARin Norway.
Open Access This article is distributed under the terms of theCreative Commons Attribution 4.0 International License (http://creativecommons.org/licenses/by/4.0/), which permits unrestrict-ed use, distribution, and reproduction in any medium, providedyou give appropriate credit to the original author(s) and the source,provide a link to the Creative Commons license, and indicate ifchanges were made.
References
Abercombie RE (1996) The magnitude-frequency distribution ofearthquakes recorded with deep seismometers at Cajon Pass,southern California. Tectonophysics 261:1–7
J Seismol (2016) 20:397–417 415
Ahjos T, Uski M (1992) Earthquakes in northern Europe in 1375–1989, Tectonophysics 207, 1–23. Updated catalogue (1375–2009). Available at: http://www.seismo.helsinki.fi
Ambuter BP, Solomon SC (1974) An event-recording system formonitoring small earthquakes. Bull Seismol Soc Am 64:1181–1188
Bache TC, Bratt SR, Wang J, Fung RM, Kobryn C, Given JW(1990) The intelligent monitoring system. Bull Seismol SocAm 80:1833–1851
Bödvarsson R, Lund B, Roberts R, Slunga R (2006) Earthquakeactivity in Sweden. Study in connection with a proposednuclear waste repository in Forsmark or Oskarshamn, SKBReport R-06-67, Sweden, 39 pp. Available at: http://www.skb.se
Bödvarsson R, Shomali H, Lund B (2012) Swedish NationalSeismic Network (SNSN) – present status and ongoing de-velopment. In: Abstracts of The 43rd Nordic SeismologySeminar, 4. http://www.seismo.helsinki.fi/nordic2012/Nordic_seminar_2012_programme.pdf
Bolt BA (1976) Nuclear explosions and earthquakes, The partedveil. Freeman, San Francisco, 309 pp
Bondár I, Myers SC, Engdahl ER, Bergman EA (2004) Epicentreaccuracy based on seismic network criteria. Geophys J Int156:483–496
Bratt SR, Swanger HJ, Stead RJ, Ryall F, Bache TC (1990) Initialresults from the intelligent monitoring system. Bull SeismolSoc Am 80:1152–1173
D’Alessandro A, Luzio D, D’Anna G, Mangano G (2011) Seismicnetwork evaluation through simulation: an application to theItalian National seismic network. Bull Seismol Soc Am 101:1213–1232
Eaton JP (1977) Frequency response of the USGS short periodtelemetered seismic system and its suitability for networkstudies of local earthquakes. U.S. Geol Surv Open File Rep77–844, 1–45
Gangopadhyay A, Talwani P (2003) Symptomatic features ofintraplate earthquakes. Seismol Res Lett 74:863–883
Gibbons SJ, Bøttger Sørensen M, Harris DB, Ringdal F (2007)The detection and location of low magnitude earthquakes innorthern Norway using multi-channel waveform correlationat regional distances. Phys Earth Planet Inter 160:285–309
Gomberg J (1991) Seismicity and detection/location threshold inthe Southern Great Basin seismic network. J Geophys Res96:16401–16414
Gutenberg B, Richter CF (1944) Frequency of earthquakes inCalifornia. Bull Seismol Soc Am 34:185–188
Häge M, Joswig M (2009) Microseismic feasibility study: detec-tion of small magnitude events (ML<0.0) for mapping activefaults in the Betic Cordillera (Spain). Ann Geophys 52:117–126
Havskov J, Alguacil G (2004) Instrumentation in earthquakeseismology, series: modern approaches in geophysics, vol22. Springer, Berlin
Institute of Seismology, University of Helsinki (2015) FENCAT,http://www.helsinki.fi/geo/seismo/english/bulletins/index.html. Accessed 26 June 2015
International Atomic Energy Agency (IAEA) (2003) Site evalua-tion for nuclear installations. Safety Requirements Series No.NS-R-3, Vienna, 28 pp
International Atomic Energy Agency (IAEA) (2010) Seismic haz-ards in site evaluation for nuclear installations. Specific safetyguide SSG-9, Vienna, 60 pp
Joyner WB, Boore DM (1981) Peak horizontal acceleration andvelocity from strong-motion records including records fromthe 1979 Imperial Valley, California, earthquake. BullSeismol Soc Am 71:2011–2038
Korja A, Kortström J, Lindblom P, Mäntyniemi P, Uski M,Valtonen O (2010) Compilation of seismic database andseismic hazard assessment around Pyhäjoki. GeologicalSurvey of Finland, Commissioned research reportM210E2010, 38 pp. 4 appendixes. (in Finnish with Englishabstract)
Korja A, Hellqvist N, Koskinen P, Kosonen E,Mäntyniemi P, UskiM, Valtonen O, Airo M, Huotari-Halkosaari T, Kallio J,Laine M, Nironen M, Sutinen R, Grigull S, Stephens M,Högdahl K, Lund B (2015) Seismotectonic framework andseismic source area models in Fennoscandia, northernEurope. Report S-63. Institute of Seismology, University ofHelsinki, Helsinki, 284 pp
Kuivamäki A, Wennerström M, Vaarma M, Härmä P, Nyholm T,Turunen T (2011) Simon Karsikon ja Pyhäjoen Hanhikivenmahdollisilla ydinvoimalan sijoitusalueilla mahdollisestitapahtuneiden nuorten (postaglasiaalisten) kallioliikuntojenselvittäminen. Vaihe I. Kallioperäaineistojen kokoaminen,tulkinta ja analysointi. Geologian tutkimuskeskus, Etelä-Suomen yksikkö, report M210E2010. 41 pp. 9 appendixes.(in Finnish)
Kukkonen I (2011) Yhteenvetoraportti postglasiaalisten siirrostenselvityksistä Simon Karsikon ja Pyhäjoen Hanhikivenmahdollisilla ydinvoimalan sijoitusalueilla. Geologiantutkimuskeskus , Ete lä -Suomen yksikkö, repor tM210E2010. 12 s. (in Finnish)
Lee WHK, Steward W (1981) Advances in geophysics: principlesand applications of microearthquake networks. Academic,New York, 293 pp
Lindblom E (2011) Microearthquake study of end-glacial faults innorthern Sweden, Phil.Lic. Thesis (Department of EarthSciences, Univ. Uppsala, Sweden) 57 pp
Liu K-S, Tsai Y-B (2005) Attenuation relationships of peak groundacceleration and velocity for crustal earthquakes in Taiwan.Bull Seismol Soc Am 95:1045–1058
Ma S, Eaton DW (2011) Combining double-difference relocationwith regional depth-phase modelling to improve hypocentreaccuracy. Geophys J Int 185:871–889
Mäntyniemi P, Ahjos T (1990) A catalog of Finnish earthquakes in1610–1990. Geophysica 26:17–35
McNamara DE, Boaz RI (2005) Seismic noise analysis system,power spectral density probability density function: stand-alone software package. United States Geological SurveyOpen File Report, NO. 2005–1438, 30pp
McNamara DE, Buland RP (2004) Ambient noise levels in thecontinental United States. Bull Seismol Soc Am 94:1517–1527
Molnar P, Tucker BE, Brune JN (1973) Corner frequencies of Pand S waves and models of earthquake sources. Bull SeismolSoc Am 63:2091–2104
Peterson J (1993) Observation and modeling of seismic back-ground noise. US Geol Surv Tech Rept 93–322:1–95
Pihlaja J, Mäkinen K, Hirvasniemi H, Pohjola R (2011) SimonKarsikon ja Pyhäjoen Hanhikiven mahdollisi l la
ydinvoimalan sijoitusalueilla mahdollisesti tapahtuneidennuorten (postaglasiaalisten) kallioliikuntojen selvittäminen.Vaihe I. Maaperäaineistojen kokoaminen, tulkinta jaanalysointi Simon Karsikon alueella. Geologiantutkimuskeskus, Pohjois-Suomen yksikkö, reportM210E2010. 6 pp. 5 appendices. (in Finnish)
Poutanen M, Häkli P, Kallio U, Nyberg S, Rouhiainen P, SaaranenV (2011) Geodeettisten havaintoaineistojen kokoaminen,käsittely ja analyysi Simon-Pyhäjoen alueelta mahdollisenydinvoimalan sijoitusalueen liikuntojen selvittämiseksi.Geodeettinen laitos, selvitys 5.4.2011, 37 pp. (in Finnish)
Putkinen N, Valpola S (2011) Pyhäjoen Hanhikiven nuoretsiirrokset Lidar aineistosta tulkittuna. Geologiantutkimuskeskus , Länsi-Suomen yksikkö, reportM210E2010. 2 pp. 2 appendixes. (in Finnish)
Roberts RG, Christoffersson A, Cassidy F (1989) Real-time eventdetection, phase identification and source location estimationusing single station three-component seismic data. Geophys JInt 97:471–480
Ruud BO, Husebye ES (1992) A new three component detectorand automatic single- station bulletin production. BullSeismol Soc Am 82:221–237
Saari J, Malm M (2010) Local seismic network at the Olkiluotosite. Annual report for 2009,Working report 2010–33. PosivaOy, 40pp
Schaff DP (2008) Semi-empirical statistics of correlation detectorperformance. Bull Seismol Soc Am 98:1495–1507. doi:10.1785/0120060263
Schorlemmer D, Woessner J (2008) Probability of detecting anearthquake. Bull Seismol Soc Am 98:2103–2117
Schweitzer J (2001) HYPOSAT—an enhanced routine to locateseismic events. Pure Appl Geophys 158:277–289
Sereno TJ Jr, Bratt SR (1989) Seismic detection capability atNORESS and implications for the detection threshold of ahypothetical network in the Soviet Union. J Geophys Res 94:10397–10414
Tryggvason A, Rögnvaldsson ST, Flovenz OG (2002) Three-dimensional imaging of the P- and S-wave velocity structureand earthquake locations beneath southwest Iceland.Geophys J Int 151:848–866
Uski M, Tuppurainen A (1996) A new local magnitudescale for the Finnish seismic network. Tectonophysics261:23–37
Uski M, Tiira T, Grad M, Yliniemi J (2011) Crustal seismicstructure and depth distribution of earthquakes in theArchean Kuusamo region, Fennoscandian Shield. J Geodyn53:61–80. doi:10.1016/j.jog.2011.08.005
Valtonen O, Kortström J, Korja A (2012) Pyhäjoen seisminenpaikallisverkko – vaihe 1, Report T-88. Institute ofSeismology, University of Helsinki, Helsinki, 26 pp. (inFinnish)
Waldhauser F, Ellsworth W (2000) A double-difference earth-quake location algorithm: method and application to thenorthern Hayward fault. Bull Seismol Soc Am 90:1353–1368
Wang X,Wang Z-y,Wen K-L, Chen H-C (2011) The developmentof Matlab toolbox for gross error in measurement.Proceedings of International Conference on System Scienceand Engineering (ICSSE). doi:10.1109/ICSSE.2011.5961947, 461–466
Woessner J, Wiemer S (2005) Assessing the quality of earthquakecatalogs: estimating the magnitude of completeness and itsuncertainties. Bull Seismol Soc Am 95:684–698


![Seismic Monitoring Strategies for Deep Longwall Coal … · Seismic Monitoring Strategies for Deep Longwall Coal ... [2016]. Seismic monitoring strategies for deep longwall coal ...](https://static.documents.pub/doc/80x56/5b40c06e7f8b9a2f138d8854/seismic-monitoring-strategies-for-deep-longwall-coal-seismic-monitoring-strategies.jpg)


