Localized heavy rainfall that occurred in theToshima, Chiyoda, Shinjuku, and Bunkyo wards ofTokyo, Japan on 5 August 2008, causing 5 deaths andthe flooding of 34 houses above floor level, wasobserved by the National Research Institute for EarthScience and Disaster Prevention (NIED) X-band polari-metric radar (MP-X). Preliminary analyses of the radardata reveal the following characteristics of the rainfallevent. Heavy rainfall occurred in a small area over ashort period. The extents of the areas over which 1-houraccumulated rainfall was greater than 50 and 80 mmwere about 20 and 5 km2, respectively. The maximumtotal rainfall amount (123 mm) from 11:30 to 13:30 LSTwas observed by MP-X over Edogawa ElementarySchool. The thunderstorm initially developed rapidly.Only 15 minutes after the onset of rainfall, a precipita-tion rate in excess of 100 mm h‒1 was observed, continu-ing for 35 minutes from 11:55 to 12:30 LST. The maxi-mum rainfall rate (153 mm h‒1) was observed by a rain-gauge over Edogawa Elementary School at around12:10 LST. A comparison of MP-X data with surfacerain-gauge data reveals that MP-X provides moreaccurate rainfall information than conventional radar,making it useful in monitoring localized heavy rainfall.
1. Introduction
Isolated thunderstorms occurred across the Kantoarea of Japan on 5 August 2008 as a result of unstableatmospheric conditions caused by a moist southerly airflow encountering a stationary frontal system. Local-ized heavy rainfall associated with one of the thunder-storms caused flooding in downtown Tokyo. Fivesewerage workers became missing, presumed drowned,in a sewerage tunnel in the Zoshigaya district ofToshima-ward, Tokyo, following a sudden rise in waterlevel (Bureau of Sewerage of Tokyo MetropolitanGovernment 2008). Thirty-four houses in the Chiyoda,Shinjuku, and Bunkyo wards of Tokyo were floodedabove floor level (Bureau of General Affairs of TokyoMetropolitan Government 2008).
Because the rainfall was concentrated in a smallarea, it was not sufficiently detected by operationalradar or the rain gauge network of the AutomatedMeteorological Data Acquisition system (AMeDAS)operated by the Japan Meteorological Agency (JMA). Incontrast, the X-band polarimetric research radar net-work (X-NET; Maki et al. 2008) detected the localizedrainfall with high temporal and spatial resolution. Thispaper describes the results of a preliminary analysis ofX-band polarimetric radar data observed at Ebina city,Kanagawa Prefecture, which is one of the researchradars of X-NET.
2. X-band polarimetric radar observations
Recent studies on radar measurements of rainfallreveal that polarimetric radar is a useful tool in mete-orological and hydrological applications (e.g., Bringi andChandrasekar 2001 and references therein). The applica-tion of the differential propagation phase as a powerfulmeasure of rainfall has led to strong interest in polari-metric radar because differential phase measurementhas a weaker dependence on variable drop size, rainfallattenuation, beam blockage, hail presence and errorsassociated with the calibration of radar hardware (e.g.,Matrosov et al. 1999; Chandrasekar et al. 2002;Matrosov et al. 2002; Anagnostou et al. 2004; Maki et al.2005b; Matrosov et al. 2005; Park et al. 2005; Maki et al.2006). Radar that operates at relatively short wave-lengths, such as X-band (3 cm wavelength) radar, is themost useful in dedicated hydrological applicationsbecause it is possible to achieve fine spatial resolution, iseasy to set up in urban or mountainous areas, and is lessexpensive than S- and C-band wavelength radar.
The success of X-band polarimetric radar has led toa re-evaluation of its usefulness in operational rainfallmeasurements. The construction of an X-band polari-metric radar network in the Tokyo Metropolitan Area(X-NET) was initiated in 2006 to study urban meteoro-logical disasters (Maki et al. 2008). Figure 1 shows theobservation area of an X-NET radar (MP-X) establishedat Ebina city, Kanagawa prefecture, Japan. MP-X hasbeen in operation since 2003, with the aim of providingimproved, quantitative, polarimetric estimates of pre-cipitation (Maki et al. 2005a).
To estimate rainfall distribution, volume-scan radardata are collected every 5 minutes from PPI scans at
89
Localized Heavy Rainfall Near Zoshigaya, Tokyo, Japan
on 5 August 2008 Observed by X-band Polarimetric Radar
— Preliminary Analysis —
Atsushi Kato and Masayuki Maki
National Research Institute for Earth Science and Disaster Prevention, Tsukuba, Japan
Fig. 1. Location and observation area of an X-band polarimetricradar (MP-X) operated by NIED. The dashed rectangle repre-sents the analysis area (15 km × 15 km), which includes the sitein Zoshigaya where the sewerage workers were washed awayduring the storm (small rectangle).
Kato and Maki, Localized Heavy Rainfall Observed by X-band Polarimetric Radar
five elevation angles (from 0.7° to 4.5°). The rain rate iscalculated using the composite method, as proposed byPark et al. (2005). This approach is based on R-KDP andR-Z relationships, where R, KDP, and Z are the rain rate,specific differential phase, and reflectivity factor, re-spectively. The rain rate is interpolated from the radarcoordinates (1° × 0.1 km) onto a Cartesian horizontalgrid (0.5 km × 0.5 km) using a Cressman weightingscheme (Cressman 1959). The three dimentional weight-ing function w is products of horizontal and verticalweighting function (wh, wv) using Cressman function (i.e.,w = wh × wv). These are calculated with a radius andaltitude of influence respectively. The radius of influ-ence is linear function of the distance from the radar.The altitude of influence is a height of the melting band,which is 1km below 0°C altitude estimated by the opera-tional mesoscale forecast (MSM). The radius of influencenear Zoshigaya was 0.51 km and the altitude of weightcenter (i.e., height of interpolated value) was 1.58 km.The interpolation method above is useful for monitor-ing heavy rainfall.
The target area of the present study is outlined bythe dashed rectangle in Fig. 1. This includes the site atwhich five sewerage workers went missing on 5 August2008 in a sewerage tunnel beneath Zoshigaya districtfollowing a sudden rise in water levels. The torrentialrainfall that fell on this day also caused flood damage.
Figure 2 shows rainfall distribution on 5 August2008 at 12:10 LST in the Kanto Plain observed by MP-X.Supplement 1 shows the temporal evolution of convec-tive echo cells. Most of the convective cells are pulsetype; i.e., their life times are typically 20‒30 minutes anddo not produce severe rainfall. The echo cells formedrandomly around the Tokyo Bay area and movedslowly northeastward. Sounding data recorded at 9:00LST on 5 August reveal that the wind at 700 hPa atTateno, Ibaraki was from the southwest at about 3 m s‒1,consistent with the movement of the thunderstorms.From 12:00 to 13:00 LST, echo cells were stagnant inthe target area. From 13:00 LST, the movement direc-tion of echo cells changed to northwestward. The indi-vidual echo cells were so small in horizontal extent thatsome were inadequately detected by the surface rain-gauge network operated by JMA; however, the NIED
MP-X succeeded in detecting and monitoring thedetailed structure of heavy rainfall in the target area.The following sections consider the results of a prelimi-nary analysis of these MP-X radar data.
3. Results
Figure 3a shows rainfall distribution within targetarea, as observed by MP-X. Supplement 2 showstemporal changes in the rainfall distribution. Accordingto Supplement 2a, MP-X detected a single thunderstorm(echo cell “A”) in the southern part of the target area(35.65°N 139.68°E) at 11:05 LST, with an echo intensityof 10‒20 mm h‒1 and horizontal extent of about 3 km.The echo cell developed rapidly during the following 5minutes, with rainfall intensity in the southern part ofthe echo cell increasing to 40‒60 mm h‒1. The echo cellmoved northeastward from 11:20 to 11:30 LST, main-taining its intensity, and intensified at 11:35 LST, witha rainfall rate exceeding 60 mm h‒1 observed at 11:35LST in its southeast part (echo cell “B”). This strong raincore moved north-northeastward while increasing in in-tensity and size.
A new echo cell (“C”) with an intensity below 10 mmh‒1 appeared about 2 km northwest of Zoshigaya at11:35 LST. The rain rate increased in the southwest partof the echo cell, reaching 40‒60 mm h‒1; three echo cellsbecame aligned north-northeastward over Zoshigaya by11:45 LST. The central echo cell (“D”) of these three de-veloped over rain gauge (E) in Fig. 3a, and showed anincrease in rain rate to 100 mm h‒1 by 11:55 LST. From11:55 to 12:10 LST, a merging of strong rainfall areasappears to have occurred between echo cell “D” andecho cell “B”, originating from the southeast. The echocell maintained a maximum rain rate above 100 mmh‒1 for 35 minutes (from 11:55 to 12:30 LST).
Figure 3b and Supplement 2b show rainfall distribu-tion and temporal changes in the distribution observedby JMA operational C-band radar, which operates every10 minutes with a spatial resolution of 1 km. The radar-derived rainfall estimates were adjusted based onAMeDAS rain-gauge data. There exists a clear differ-ence in rainfall distribution between Figs. 3a and 3b(Supplements 2a and 2b). The JMA radar did not ade-quately detect the long-lasting echo cell “D”, and failedto detect some of the detailed structure provided by MP-X. The comparison demonstrates the advantage of X-band polarimetric radar over conventional methods interms of quantitative estimates of precipitation.
The long-lasting, strong echo cell “D” in Fig. 3a
90
Fig. 2. MP-X rainfall distribution at 12:10 in the Kanto Plain.△: AMeDAS rain gauges operated by JMA. The dotted rectan-gle represents the analysis area, which includes Zoshigaya andflooded areas. Gray radial areas in the figure represent extinc-tion regions where the radar signals are below noise levels dueto severe rainfall attenuation. The time change of the distribu-tion from 10:00 to 13:30 LST is given in Supplement 1.
Fig. 3. (a) MP-X radar rainfall distribution of 0.5 × 0.5 km gridand (b) JMA radar rainfall distributions of 1 × 1 km grid at12:10 LST in the analysis area.△: AMeDAS rain gauges (JMA),○: rain gauges (Tokyo Metropolitan Government), □: site inZoshigaya where five sewerage workers were washed awayduring the storm. The time change of the distribution from11:00 to 14:00 LST is given in Supplement 2.
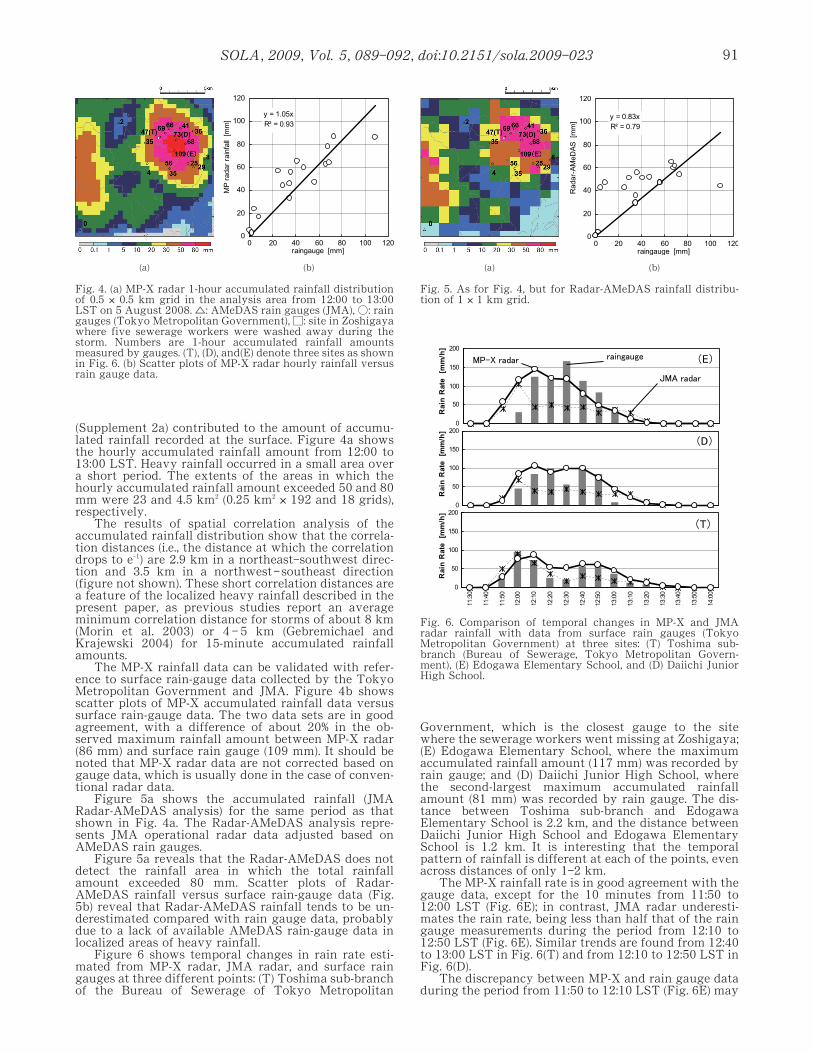
(Supplement 2a) contributed to the amount of accumu-lated rainfall recorded at the surface. Figure 4a showsthe hourly accumulated rainfall amount from 12:00 to13:00 LST. Heavy rainfall occurred in a small area overa short period. The extents of the areas in which thehourly accumulated rainfall amount exceeded 50 and 80mm were 23 and 4.5 km2 (0.25 km2 × 192 and 18 grids),respectively.
The results of spatial correlation analysis of theaccumulated rainfall distribution show that the correla-tion distances (i.e., the distance at which the correlationdrops to e‒1) are 2.9 km in a northeast‒southwest direc-tion and 3.5 km in a northwest‒southeast direction(figure not shown). These short correlation distances area feature of the localized heavy rainfall described in thepresent paper, as previous studies report an averageminimum correlation distance for storms of about 8 km(Morin et al. 2003) or 4 ‒ 5 km (Gebremichael andKrajewski 2004) for 15-minute accumulated rainfallamounts.
The MP-X rainfall data can be validated with refer-ence to surface rain-gauge data collected by the TokyoMetropolitan Government and JMA. Figure 4b showsscatter plots of MP-X accumulated rainfall data versussurface rain-gauge data. The two data sets are in goodagreement, with a difference of about 20% in the ob-served maximum rainfall amount between MP-X radar(86 mm) and surface rain gauge (109 mm). It should benoted that MP-X radar data are not corrected based ongauge data, which is usually done in the case of conven-tional radar data.
Figure 5a shows the accumulated rainfall (JMARadar-AMeDAS analysis) for the same period as thatshown in Fig. 4a. The Radar-AMeDAS analysis repre-sents JMA operational radar data adjusted based onAMeDAS rain gauges.
Figure 5a reveals that the Radar-AMeDAS does notdetect the rainfall area in which the total rainfallamount exceeded 80 mm. Scatter plots of Radar-AMeDAS rainfall versus surface rain-gauge data (Fig.5b) reveal that Radar-AMeDAS rainfall tends to be un-derestimated compared with rain gauge data, probablydue to a lack of available AMeDAS rain-gauge data inlocalized areas of heavy rainfall.
Figure 6 shows temporal changes in rain rate esti-mated from MP-X radar, JMA radar, and surface raingauges at three different points: (T) Toshima sub-branchof the Bureau of Sewerage of Tokyo Metropolitan
Government, which is the closest gauge to the sitewhere the sewerage workers went missing at Zoshigaya;(E) Edogawa Elementary School, where the maximumaccumulated rainfall amount (117 mm) was recorded byrain gauge; and (D) Daiichi Junior High School, wherethe second-largest maximum accumulated rainfallamount (81 mm) was recorded by rain gauge. The dis-tance between Toshima sub-branch and EdogawaElementary School is 2.2 km, and the distance betweenDaiichi Junior High School and Edogawa ElementarySchool is 1.2 km. It is interesting that the temporalpattern of rainfall is different at each of the points, evenacross distances of only 1‒2 km.
The MP-X rainfall rate is in good agreement with thegauge data, except for the 10 minutes from 11:50 to12:00 LST (Fig. 6E); in contrast, JMA radar underesti-mates the rain rate, being less than half that of the raingauge measurements during the period from 12:10 to12:50 LST (Fig. 6E). Similar trends are found from 12:40to 13:00 LST in Fig. 6(T) and from 12:10 to 12:50 LST inFig. 6(D).
The discrepancy between MP-X and rain gauge dataduring the period from 11:50 to 12:10 LST (Fig. 6E) may
91
Fig. 6. Comparison of temporal changes in MP-X and JMAradar rainfall with data from surface rain gauges (TokyoMetropolitan Government) at three sites: (T) Toshima sub-branch (Bureau of Sewerage, Tokyo Metropolitan Govern-ment), (E) Edogawa Elementary School, and (D) Daiichi JuniorHigh School.
Fig. 4. (a) MP-X radar 1-hour accumulated rainfall distributionof 0.5 × 0.5 km grid in the analysis area from 12:00 to 13:00LST on 5 August 2008.△: AMeDAS rain gauges (JMA),○: raingauges (Tokyo Metropolitan Government),□: site in Zoshigayawhere five sewerage workers were washed away during thestorm. Numbers are 1-hour accumulated rainfall amountsmeasured by gauges. (T), (D), and(E) denote three sites as shownin Fig. 6. (b) Scatter plots of MP-X radar hourly rainfall versusrain gauge data.
(a) (b)
Fig. 5. As for Fig. 4, but for Radar-AMeDAS rainfall distribu-tion of 1 × 1 km grid.
(a) (b)
Kato and Maki, Localized Heavy Rainfall Observed by X-band Polarimetric Radar
reflect the nature of the vertical rainfall profile. MP-Xrainfall information is derived from PPI scans at fiveelevation angles (from 0.7° to 4.5°). The rain rate at acertain grid point is calculated from the value in the 3-Dspace of influence using Cressman interpolationmethods. Thus, it is possible that MP-X radar detectsupper rainfall that is not observed by a surface raingauge. This possibility is especially likely during theearly stages of convective rainfall. The effect of weigh-ing function (wh, wv) and the radius and altitude of influ-ence on the estimated rainfall amount maybe necessaryto examine for the quantitative precipitation estimate(QPE).
4. Conclusion
The present paper describes the results of a prelimi-nary analysis of localized heavy rainfall that occurredon 5 August 2008 in the Tokyo Metropolitan Area,Japan and that resulted in five casualties and floodingabove floor level in 34 houses. We analyzed data for thisevent from an X-band polarimetric research radaroperated by NIED, operational C-band radar data col-lected by JMA, Radar-AMeDAS rainfall analysis data,and surface rain-gauge data collected by the TokyoMetropolitan Government.
X-band polarimetric radar data reveal the detailedspatial structure of the localized rainfall distribution,which was not adequately detected by JMA operationalradar. According to MP-X data, the heavy rainfall wasconcentrated in a small area and occurred over a shortperiod. The extents of the areas in which the 1-houraccumulated rainfall amount exceeded 50 and 80 mmwere about 20 and 5 km2, respectively. MP-X radar ob-servations indicate a progressive increase in the rainrate at the target site, with a maximum accumulatedrainfall amount of 70 mm h‒1 over a 10-minute periodduring the initial stages of the storm. The accumulatedrainfall amount exceeded 50 mm (the critical rainfallamount for urban flooding in Tokyo) within 30 minutesof the onset of rainfall.
Although MP-X radar could detect the localizedrainfall of 5 August 2008, the temporal resolution of theobservations is not necessarily sufficient. The evolutionof a pulse-type thunderstorm occurs within 5 minutes.Radar observations with greater temporal resolution aretherefore required to detect and monitor localized heavyrainfall. A further study is also necessary to understandthe mechanism of the development of the localizedheavy rainfall presented in this paper. Useful data inthis regard would include the three-dimensional windfield retrieved from multiple X-NET Doppler radar dataand microphysical properties derived from polarimetricradar parameters. The present analysis is ongoing andwill be further summarized in subsequent publications.
Acknowledgments
We are grateful to Drs. Misumi, Iwanami, Maesaka,and Shimizu of the National Research Institute forEarth Science and Disaster Prevention for their con-structive comments. We also thank the Tokyo Metro-politan Government for kindly providing surface rain-gauge data.
Supplements
1. The time change of MP-X rainfall distribution in theKanto Plain as shown in Fig. 2 from 10:00 to 13:30LST is given in Supplement 1.
2. The time change of (a) MP-X radar rainfall distribu-tion and (b) JMA radar rainfall distributions in the1analysis area as shown in Fig. 3 from 11:00 to 14:00LST is given in Supplement 2.
References
Anagnostou, E. N., M. N. Anagnostou, W. F. Krajewski, A.Kruger, and B. J. Miriovsky, 2004: High-resolution rainfallestimation from X-band polarimetric radar measure-ments. J. Hydrometeor., 5, 110‒128.
Bringi, V. N., and V. Chandrasekar, 2001: Polarimetric Dopplerweather radar. Cambridge Univ. Press, 636 pp.
Bureau of General Affairs of Tokyo Metropolitan Government,2008: Report on damages caused by heavy rainfalls on 5August 2008. http://www.bousai.metro.tokyo.jp/press/200805-03.pdf, (in Japanese).
Bureau of Sewerage of Tokyo Metropolitan Government, 2008:Accident analysis report on the accident during the recon-struction work of Zoshigaya main sewage line. http://www.gesui.metro.tokyo.jp/oshi/infn0382/jikochousahoukoku.pdf, (in Japanese).
Chandrasekar, V., E. Gorgucci, and V. N. Bringi, 2002: Evalua-tion of polarimetric radar rainfall algorithms at X-band.Proc. 2nd European Conf. on Radar Meteorology (ERAD),Delft, Netherlands, 277‒281.
Cressman, G. P., 1959: An operational objective analysissystem. Mon. Wea. Rev., 87, 367‒374.
Gebremichael, M., and W. F. Krajewski, 2004: Assessment ofthe statistical characterization of small-scale rainfall vari-ability from radar: Analysis of TRMM Ground ValidationDatasets. J. Appl. Meteor., 43, 1180‒1199.
Maki, M., K. Iwanami, R. Misumi, S.-G. Park, H. Moriwaki, K.Maruyama, I. Watabe, D.-I. Lee, M. Jang, H.-K. Kim, V. N.Bringi, and H. Uyeda, 2005a: Semi-operational rainfall ob-servations with X-band multi-parameter radar, Atmos. Sci.Letters, 6, 12‒18.
Maki, M., T. Maesaka, R. Misumi, K. Iwanami, S. Suzuki, A.Kato, S. Shimizu, K. Kieda, T. Yamada, H. Hirano, F.Kobayashi, A. Masuda, T. Moriya, Y. Suzuki, A. Takahori,D.-I. Lee, D.-S. Kim, V. N. Chandrasekar, and Y. Wang,2008: X-band polarimetric radar network in the Tokyometropolitan area ‒X-NET‒ , Proc. 5th European Conf.Radar in Meteorology and Hydrology, 5 pp (in CD). Helsinki,Finland.
Maki, M., K. Maruyama, K. Iwanami, R. Misumi, and T.Maesaka, 2006: Comparison of X-band multi-parameterradar rainfall estimates with conventional radar rainfallestimates adjusted with raingauge network data, Proc. 4thEuropean Conf. on Radar in Meteorology and Hydrology,206‒209.
Maki, M., S.-G. Park, and V. N. Bringi, 2005b: Statistical error ofrain rate estimators due to natural variations of raindropsize distributions for 3-cm wavelength polarimetric radar.J. Meteor. Soc., Japan, 83, 871‒893.
Matrosov, S. Y., R. A. Kropfli, R. F. Reinking, and B. E. Martner,1999: Prospects for measuring rainfall using propagationdifferential phase in X- and Ka-radar bands. J. Appl.Meteor., 38, 766‒776.
Matrosov, S. Y., K. A. Clark, B. E. Martner, and A. Tokay, 2002:X-band polarimetric radar measurements of rainfall. J.Appl. Meteor., 41, 941‒952.
Matrosov, S. Y., D. E. Kingsmill, B. E. Martner, and F. M. Ralph,2005: The utility of X-band polarimetric radar for quanti-tative estimates of rainfall parameters. J. Hydrometeor., 6,248‒262.
Morin, E., W. F. Krajewski, D. C. Goodrich, X. Gao, and S.Sorooshian, 2003: Estimating rainfall intensities fromweather radar data: The scale-dependency problem. J.Hydrometeor., 4, 782‒797.
Park, S.-G., M. Maki, K. Iwanami, V. N. Bringi, and V.Chandrasekar, 2005: Correction of radar reflectivity anddifferential reflectivity for rain attenuation at X-bandwavelength. Part II: Evaluation and application, J. Atmos.Oceanic Technol., 22, 1621‒1632.
Manuscript received 25 December 2008, accepted 30 April 2009SOLA: http://www.jstage.jst.go.jp/browse/sola/