20
Prepared for: TNS Opinion Date of Issue: 9.12.2014 Locally Produced Food : 201407120 : Global © TNS 2014 1

Prepared for: TNS Opinion
Date of Issue: 9.12.2014
Locally Produced Food : 201407120 : Global
© TNS 20141

1.
1
2
INTERVIEWING - Interviewing was conducted by online self-
completion in Poland, Spain, UK, France and Germany , and
by face to face in Bulgaria, Czech Republic and Hungary.
LOW BASES -Where unweighted base figures are less than
100, date should be treated cautiously, as large margins of
error are possible
SAMPLE SIZE – a total sample of 8362 adults were
interviewed.
Methodology
ABBREVIATIONS USED
- = 0%
* = less than 0.5%
TERMS OF CONTRACT - "No press release or publication of the
findings of this survey shall be made without the advance
approval of TNS. Such approval will normally only be refused on
grounds of inaccuracy or misrepresentation". Confidential to
client.
TECHNICAL INFORMATION – Further methodological
information can be made available on request
This study was conducted in Poland, Spain, Hungary, Bulgaria
the Czech Republic, the UK, France and Germany via
Ncompass, an Internet omnibus survey
WEIGHTING – The sample has been weighted to represent
the adult population in each given country.
© TNS 20142

2.
QUALITY AND INFORMATION SECURITY
TNS demonstrates commitment to Quality and Information Security by defining, promoting and supporting processes that are designed to
continually improve performance and increase efficiency, satisfy our clients, and ensure that the required Information Security controls are in place.
Client satisfaction is in the mind of every employee, ensuring the final product meets the agreed specification and delivery time. In addition,
Information Security is integral to our business to ensure we meet the requirements of our clients as well as our own. We make the following
commitments:
ISO 9001: 2008 – the international process standard for service complaints TNS in the UK and/or its employees are members
of a number of recognised market research bodies including:
ESOMAR – European Society of Opinion and Marketing Research
MRS – Market Research
To provide the training and resources to all staff to enable them to meet this policy
To set and review objectives and our performance regularly in order to achieve continual improvement in Quality and
Information Security
To ensure that applicable legal, regulatory and business requirements are taken into account
To establish and maintain a management framework for identifying and reducing risk, including relevant criteria for evaluating
such risk. TNS in the UK is registered in accordance with:
ISO 20252: 2006 – the international standard for market research
© TNS 20143

Page
number
Table name Table title Base
1 TG1Q1. To what extent do you agree or disagree with each of the following statements about
locally produced food? - Summary TableBase: All respondents
2 T2
Q1. To what extent do you agree or disagree with each of the following statements about
locally produced food? - Purchasing locally produced food supports job creation in the
region
Base: All respondents
3 T3
Q1. To what extent do you agree or disagree with each of the following statements about
locally produced food? - The production of local food respects rigorous environmental
standards
Base: All respondents
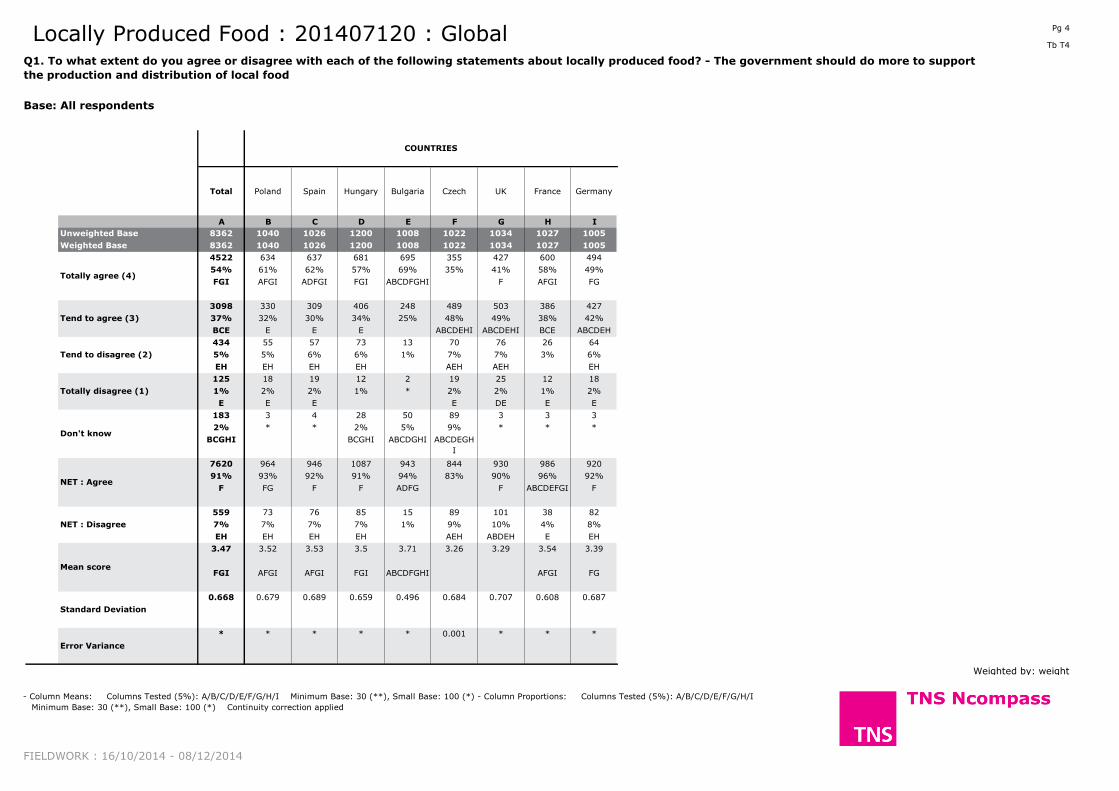
4 T4
Q1. To what extent do you agree or disagree with each of the following statements about
locally produced food? - The government should do more to support the production and
distribution of local food
Base: All respondents
5 T5
Q1. To what extent do you agree or disagree with each of the following statements about
locally produced food? - It is possible to have a complete balanced diet based on locally
produced food.
Base: All respondents
6 TG6 Q2. How often do you do the following ...? - Summary Table Base: All respondents
7 T7Q2. How often do you do the following ...? - You try to find out if the food you are buying
is produced locally Base: All respondents
8 T8Q2. How often do you do the following ...? - You buy food from the shop closest to where
you live (supermarket or some other retail shop)Base: All respondents
9 T9Q2. How often do you do the following ...? - You buy food directly from farmers (for
example farmers markets or farmers shops)Base: All respondents
10 T10Q2. How often do you do the following ...? - When eating out, you try to eat at
restaurants which use locally produced foodBase: All respondents
Locally Produced Food : 201407120 : Global
ToC 4

Page
number
Table name Table title Base
Locally Produced Food : 201407120 : Global
11 TG11Q3. To what extent do you agree or disagree with each of the following statements about
locally produced food? - Summary TableBase: All respondents
12 T12
Q3. To what extent do you agree or disagree with each of the following statements about
locally produced food? - It is difficult to find information about where to buy locally
produced food
Base: All respondents
13 T13
Q3. To what extent do you agree or disagree with each of the following statements about
locally produced food? - There are not enough places to buy locally produced food in the
area where you live
Base: All respondents
14 T14Q3. To what extent do you agree or disagree with each of the following statements about
locally produced food? - The prices for locally produced food are too highBase: All respondents
15 T15Q3. To what extent do you agree or disagree with each of the following statements about
locally produced food? - Buying locally produced food means the choice is too limitedBase: All respondents
ToC 5

Pg 1
Tb TG1
Purchasing locally
produced food supports
job creation in the
region
The production of local
food respects rigorous
environmental standards
The government should
do more to support the
production and
distribution of local food
It is possible to have a
complete balanced diet
based on locally
produced food.
A B C D
8362 8362 8362 8362
8362 8362 8362 8362
3988 2089 4522 2872
48% 25% 54% 34%
BD ABD B
3478 4213 3098 3650
42% 50% 37% 44%
C ACD AC
564 1264 434 1101
7% 15% 5% 13%
C ACD AC
155 275 125 323
2% 3% 1% 4%
AC AC
177 520 183 416
2% 6% 2% 5%
ACD AC
7466 6302 7620 6522
89% 75% 91% 78%
BD ABD B
719 1539 559 1424
9% 18% 7% 17%
C ACD AC
3.38 3.03 3.47 3.14
BD ABD B
0.698 0.753 0.668 0.802
* * * *
Weighted by: weight
Locally Produced Food : 201407120 : GlobalQ1. To what extent do you agree or disagree with each of the following statements about locally produced food? - Summary Table
Base: All respondents
FIELDWORK : 16/10/2014 - 08/12/2014
Overlap formulae used - Column Means: Columns Tested (5%): A/B/C/D Minimum Base: 30 (**), Small Base: 100 (*) - Column Proportions: Columns Tested (5%): A/B/C/D Minimum Base: 30 (**), Small Base: 100 (*)
Continuity correction applied
Unweighted Base
Weighted Base
Totally agree (4)
Tend to agree (3)
Tend to disagree (2)
Totally disagree (1)
Error Variance
Don't know
NET : Agree
NET : Disagree
Mean score
Standard Deviation

Pg 2
Tb T2
Total Poland Spain Hungary Bulgaria Czech UK France Germany
A B C D E F G H I
8362 1040 1026 1200 1008 1022 1034 1027 1005
8362 1040 1026 1200 1008 1022 1034 1027 1005
3988 571 589 551 598 333 395 510 440
48% 55% 57% 46% 59% 33% 38% 50% 44%
FGI ADFGHI ADFGHI FG ADFGHI F FGI FG
3478 375 352 498 298 486 544 465 461
42% 36% 34% 42% 30% 48% 53% 45% 46%
BCE E E BCE ABCDE ABCDEFHI ABCE ABCE
564 63 61 97 49 106 71 37 81
7% 6% 6% 8% 5% 10% 7% 4% 8%
EH H H EH ABCEGH H EH
155 17 21 24 20 21 19 10 23
2% 2% 2% 2% 2% 2% 2% 1% 2%
H
177 14 3 30 43 76 4 5 2
2% 1% * 2% 4% 7% * 1% *
CGHI CI CGHI ABCDGHI ABCDEGH
I
7466 945 941 1049 896 819 939 975 900
89% 91% 92% 87% 89% 80% 91% 95% 90%
F DF ADEF F F DF ABCDEFGI F
719 80 82 121 69 127 90 47 103
9% 8% 8% 10% 7% 12% 9% 5% 10%
H H H EH H ABCEGH H EH
3.38 3.46 3.48 3.35 3.53 3.2 3.28 3.44 3.31
FGI ADFGI ADFGI FG ABDFGHI F ADFGI F
0.698 0.686 0.7 0.718 0.691 0.718 0.672 0.614 0.715
* * * * * 0.001 * * 0.001
Weighted by: weight
Locally Produced Food : 201407120 : GlobalQ1. To what extent do you agree or disagree with each of the following statements about locally produced food? - Purchasing locally produced food supports
job creation in the region
Base: All respondents
FIELDWORK : 16/10/2014 - 08/12/2014
- Column Means: Columns Tested (5%): A/B/C/D/E/F/G/H/I Minimum Base: 30 (**), Small Base: 100 (*) - Column Proportions: Columns Tested (5%): A/B/C/D/E/F/G/H/I
Minimum Base: 30 (**), Small Base: 100 (*) Continuity correction applied
COUNTRIES
Unweighted Base
Weighted Base
Totally agree (4)
Tend to agree (3)
Tend to disagree (2)
Totally disagree (1)
Error Variance
Don't know
NET : Agree
NET : Disagree
Mean score
Standard Deviation

Pg 3
Tb T3
Total Poland Spain Hungary Bulgaria Czech UK France Germany
A B C D E F G H I
8362 1040 1026 1200 1008 1022 1034 1027 1005
8362 1040 1026 1200 1008 1022 1034 1027 1005
2089 280 264 416 255 178 238 240 218
25% 27% 26% 35% 25% 17% 23% 23% 22%
FI FI FI ABCEFGHI F F F F
4213 565 562 474 343 460 652 608 549
50% 54% 55% 40% 34% 45% 63% 59% 55%
DEF ADEF ADEF E DE ABCDEFI ABDEFI ADEF
1264 148 169 163 160 161 122 148 192
15% 14% 16% 14% 16% 16% 12% 14% 19%
G G G G ABDGH
275 35 27 47 47 33 22 27 38
3% 3% 3% 4% 5% 3% 2% 3% 4%
G ACGH
520 12 4 100 203 190 - 4 8
6% 1% * 8% 20% 19% * * 1%
BCGHI G ABCGHI ABCDGHI ABCDGHI G
6302 845 826 890 598 638 890 848 767
75% 81% 81% 74% 59% 62% 86% 83% 76%
EF ADEFI ADEFI EF ABCDEFHI ADEFI EF
1539 184 196 210 207 194 143 175 230
18% 18% 19% 17% 21% 19% 14% 17% 23%
G G G G G G ABCDFGH
3.03 3.06 3.04 3.15 3 2.94 3.07 3.04 2.95
FI FI FI ABCEFGHI FI FI
0.753 0.742 0.726 0.822 0.866 0.751 0.654 0.697 0.749
* 0.001 0.001 0.001 0.001 0.001 * * 0.001
Weighted by: weight
Locally Produced Food : 201407120 : GlobalQ1. To what extent do you agree or disagree with each of the following statements about locally produced food? - The production of local food respects
rigorous environmental standards
Base: All respondents
FIELDWORK : 16/10/2014 - 08/12/2014
- Column Means: Columns Tested (5%): A/B/C/D/E/F/G/H/I Minimum Base: 30 (**), Small Base: 100 (*) - Column Proportions: Columns Tested (5%): A/B/C/D/E/F/G/H/I
Minimum Base: 30 (**), Small Base: 100 (*) Continuity correction applied
COUNTRIES
Unweighted Base
Weighted Base
Totally agree (4)
Tend to agree (3)
Tend to disagree (2)
Totally disagree (1)
Error Variance
Don't know
NET : Agree
NET : Disagree
Mean score
Standard Deviation
Pg 4
Tb T4
Total Poland Spain Hungary Bulgaria Czech UK France Germany
A B C D E F G H I
8362 1040 1026 1200 1008 1022 1034 1027 1005
8362 1040 1026 1200 1008 1022 1034 1027 1005
4522 634 637 681 695 355 427 600 494
54% 61% 62% 57% 69% 35% 41% 58% 49%
FGI AFGI ADFGI FGI ABCDFGHI F AFGI FG
3098 330 309 406 248 489 503 386 427
37% 32% 30% 34% 25% 48% 49% 38% 42%
BCE E E E ABCDEHI ABCDEHI BCE ABCDEH
434 55 57 73 13 70 76 26 64
5% 5% 6% 6% 1% 7% 7% 3% 6%
EH EH EH EH AEH AEH EH
125 18 19 12 2 19 25 12 18
1% 2% 2% 1% * 2% 2% 1% 2%
E E E E DE E E
183 3 4 28 50 89 3 3 3
2% * * 2% 5% 9% * * *
BCGHI BCGHI ABCDGHI ABCDEGH
I
7620 964 946 1087 943 844 930 986 920
91% 93% 92% 91% 94% 83% 90% 96% 92%
F FG F F ADFG F ABCDEFGI F
559 73 76 85 15 89 101 38 82
7% 7% 7% 7% 1% 9% 10% 4% 8%
EH EH EH EH AEH ABDEH E EH
3.47 3.52 3.53 3.5 3.71 3.26 3.29 3.54 3.39
FGI AFGI AFGI FGI ABCDFGHI AFGI FG
0.668 0.679 0.689 0.659 0.496 0.684 0.707 0.608 0.687
* * * * * 0.001 * * *
Weighted by: weight
Locally Produced Food : 201407120 : GlobalQ1. To what extent do you agree or disagree with each of the following statements about locally produced food? - The government should do more to support
the production and distribution of local food
Base: All respondents
FIELDWORK : 16/10/2014 - 08/12/2014
- Column Means: Columns Tested (5%): A/B/C/D/E/F/G/H/I Minimum Base: 30 (**), Small Base: 100 (*) - Column Proportions: Columns Tested (5%): A/B/C/D/E/F/G/H/I
Minimum Base: 30 (**), Small Base: 100 (*) Continuity correction applied
COUNTRIES
Unweighted Base
Weighted Base
Totally agree (4)
Tend to agree (3)
Tend to disagree (2)
Totally disagree (1)
Error Variance
Don't know
NET : Agree
NET : Disagree
Mean score
Standard Deviation

Pg 5
Tb T5
Total Poland Spain Hungary Bulgaria Czech UK France Germany
A B C D E F G H I
8362 1040 1026 1200 1008 1022 1034 1027 1005
8362 1040 1026 1200 1008 1022 1034 1027 1005
2872 369 469 374 337 188 295 456 386
34% 35% 46% 31% 33% 18% 29% 44% 38%
FG DFG ABDEFGI F FG F ABDEFGI ADEFG
3650 505 417 495 313 459 495 481 483
44% 49% 41% 41% 31% 45% 48% 47% 48%
E ACDE E E E ACDE CDE ACDE
1101 125 113 195 100 176 212 68 113
13% 12% 11% 16% 10% 17% 21% 7% 11%
EH H H ABCEHI H ABCEHI ABCDEHI H
323 35 24 82 51 63 29 19 20
4% 3% 2% 7% 5% 6% 3% 2% 2%
CHI H ABCGHI CGHI ABCGHI
416 6 3 55 208 136 2 3 3
5% 1% * 5% 21% 13% * * *
BCGHI BCGHI ABCDFGHI ABCDGHI
6522 874 886 869 650 647 790 937 869
78% 84% 86% 72% 64% 63% 76% 91% 86%
DEF ADEFG ADEFG EF EF ABCDEFGI ADEFG
1424 160 137 276 150 239 241 87 133
17% 15% 13% 23% 15% 23% 23% 8% 13%
CHI H H ABCEHI H ABCEHI ABCEHI H
3.14 3.17 3.3 3.01 3.17 2.87 3.02 3.34 3.23
DFG DFG ABDEFGI F DFG F ABDEFGI ADFG
0.802 0.765 0.757 0.884 0.878 0.824 0.778 0.685 0.725
* 0.001 0.001 0.001 0.001 0.001 0.001 * 0.001
Weighted by: weight
Locally Produced Food : 201407120 : GlobalQ1. To what extent do you agree or disagree with each of the following statements about locally produced food? - It is possible to have a complete balanced
diet based on locally produced food.
Base: All respondents
FIELDWORK : 16/10/2014 - 08/12/2014
- Column Means: Columns Tested (5%): A/B/C/D/E/F/G/H/I Minimum Base: 30 (**), Small Base: 100 (*) - Column Proportions: Columns Tested (5%): A/B/C/D/E/F/G/H/I
Minimum Base: 30 (**), Small Base: 100 (*) Continuity correction applied
COUNTRIES
Unweighted Base
Weighted Base
Totally agree (4)
Tend to agree (3)
Tend to disagree (2)
Totally disagree (1)
Error Variance
Don't know
NET : Agree
NET : Disagree
Mean score
Standard Deviation

Pg 6
Tb TG6
You try to find out
if the food you
are buying is
produced locally
You buy food from the shop
closest to where you live
(supermarket or some other
retail shop)
You buy food directly from
farmers (for example
farmers markets or farmers
shops)
When eating out, you
try to eat at
restaurants which use
locally produced food
A B C D
8362 8362 8362 8362
8362 8362 8362 8362
1539 4477 1396 811
18% 54% 17% 10%
CD ACD D
2846 2619 2748 2264
34% 31% 33% 27%
BD D BD
1893 804 2293 1995
23% 10% 27% 24%
B ABD B
1984 378 1850 3025
24% 5% 22% 36%
BC B ABC
100 84 75 268
1% 1% 1% 3%
ABC
6278 7900 6437 5070
75% 94% 77% 61%
D ACD AD
4385 7096 4144 3075
52% 85% 50% 37%
CD ACD D
3877 1182 4143 5020
46% 14% 50% 60%
B AB ABC
2.48 3.35 2.45 2.11
D ACD D
1.05 0.834 1.015 1.021
* * * *
Weighted by: weight
Locally Produced Food : 201407120 : GlobalQ2. How often do you do the following ...? - Summary Table
Base: All respondents
FIELDWORK : 16/10/2014 - 08/12/2014
Overlap formulae used - Column Means: Columns Tested (5%): A/B/C/D Minimum Base: 30 (**), Small Base: 100 (*) - Column Proportions: Columns Tested (5%): A/B/C/D Minimum Base: 30 (**), Small Base: 100 (*)
Continuity correction applied
Unweighted Base
Weighted Base
Yes, often (4)
Yes, sometimes (3)
Yes, rarely (2)
No, never (1)
Standard Deviation
Error Variance
Don't know
NET : Yes, total
NET : Yes -
always/sometimes
NET : Rarely/never
Mean score

Pg 7
Tb T7
Total Poland Spain Hungary Bulgaria Czech UK France Germany
A B C D E F G H I
8362 1040 1026 1200 1008 1022 1034 1027 1005
8362 1040 1026 1200 1008 1022 1034 1027 1005
1539 203 241 165 243 51 161 282 192
18% 20% 23% 14% 24% 5% 16% 27% 19%
DF DFG ABDFGI F ABDFGI F ABCDFGI DF
2846 353 406 353 346 199 363 425 401
34% 34% 40% 29% 34% 19% 35% 41% 40%
DF DF ABDEF F DF DF ABDEFG ABDEFG
1893 245 198 348 227 227 236 185 227
23% 24% 19% 29% 22% 22% 23% 18% 23%
CH CH ABCEFGHI H H H H
1984 228 177 319 166 515 267 132 180
24% 22% 17% 27% 16% 50% 26% 13% 18%
CEHI CEHI H BCEHI H ABCDEGH
I
CEHI H
100 11 4 14 26 30 7 2 5
1% 1% * 1% 3% 3% 1% * 1%
CH H H ABCDGHI ABCDGHI
6278 801 845 866 816 477 760 893 820
75% 77% 82% 72% 81% 47% 74% 87% 82%
F DF ABDFG F ABDFG F ABCDEFGI ABDFG
4385 556 647 518 590 250 524 708 592
52% 53% 63% 43% 59% 24% 51% 69% 59%
DF DF ABDEFG F ABDFG DF ABCDEFGI ABDFG
3877 472 375 668 392 742 503 317 407
46% 45% 37% 56% 39% 73% 49% 31% 41%
CEHI CEHI H ABCEGHI H ABCDEGH
I
CEHI H
2.48 2.52 2.69 2.31 2.68 1.78 2.41 2.84 2.6
DF DFG ABDFGI F ABDFG DF ABCDEFGI ADFG
1.05 1.043 1.016 1.015 1.026 0.938 1.037 0.973 0.992
* 0.001 0.001 0.001 0.001 0.001 0.001 0.001 0.001
Weighted by: weight
Locally Produced Food : 201407120 : GlobalQ2. How often do you do the following ...? - You try to find out if the food you are buying is produced locally
Base: All respondents
FIELDWORK : 16/10/2014 - 08/12/2014
- Column Means: Columns Tested (5%): A/B/C/D/E/F/G/H/I Minimum Base: 30 (**), Small Base: 100 (*) - Column Proportions: Columns Tested (5%):
A/B/C/D/E/F/G/H/I Minimum Base: 30 (**), Small Base: 100 (*) Continuity correction applied
COUNTRIES
Unweighted Base
Weighted Base
Yes, often (4)
Yes, sometimes (3)
Yes, rarely (2)
No, never (1)
Standard Deviation
Error Variance
Don't know
NET : Yes, total
NET : Yes -
always/sometimes
NET : Rarely/never
Mean score

Pg 8
Tb T8
Total Poland Spain Hungary Bulgaria Czech UK France Germany
A B C D E F G H I
8362 1040 1026 1200 1008 1022 1034 1027 1005
8362 1040 1026 1200 1008 1022 1034 1027 1005
4477 615 481 563 722 481 473 506 636
54% 59% 47% 47% 72% 47% 46% 49% 63%
CDFGH ACDFGH ABCDFGH
I
ACDFGH
2619 299 370 403 200 317 383 390 257
31% 29% 36% 34% 20% 31% 37% 38% 26%
EI E ABEFI BEI EI ABEFI ABDEFI E
804 84 121 171 47 123 95 83 80
10% 8% 12% 14% 5% 12% 9% 8% 8%
E E ABEHI ABEGHI ABEHI E E E
378 27 50 49 21 77 78 45 30
5% 3% 5% 4% 2% 8% 8% 4% 3%
BEI BEI E ABCDEHI ABCDEHI BE
84 15 4 14 17 24 5 3 2
1% 1% * 1% 2% 2% 1% * *
HI CHI HI CGHI ACGHI
7900 998 972 1137 970 921 951 979 973
94% 96% 95% 95% 96% 90% 92% 95% 97%
FG FG FG FG AFG FG ACDFG
7096 914 851 966 922 798 856 896 893
85% 88% 83% 81% 92% 78% 83% 87% 89%
DF ACDFG F ABCDFGH F CDFG ACDFG
1182 111 172 219 69 200 173 128 110
14% 11% 17% 18% 7% 20% 17% 12% 11%
BEI E ABEHI ABEHI ABEHI BEHI E E
3.35 3.47 3.25 3.25 3.64 3.2 3.22 3.32 3.49
CDFG ACDFGH ABCDFGH
I
DFG ACDFGH
0.834 0.756 0.85 0.85 0.675 0.934 0.899 0.805 0.769
* 0.001 0.001 0.001 * 0.001 0.001 0.001 0.001
Weighted by: weight
Locally Produced Food : 201407120 : GlobalQ2. How often do you do the following ...? - You buy food from the shop closest to where you live (supermarket or some other retail shop)
Base: All respondents
FIELDWORK : 16/10/2014 - 08/12/2014
- Column Means: Columns Tested (5%): A/B/C/D/E/F/G/H/I Minimum Base: 30 (**), Small Base: 100 (*) - Column Proportions: Columns Tested (5%):
A/B/C/D/E/F/G/H/I Minimum Base: 30 (**), Small Base: 100 (*) Continuity correction applied
COUNTRIES
Unweighted Base
Weighted Base
Yes, often (4)
Yes, sometimes (3)
Yes, rarely (2)
No, never (1)
Standard Deviation
Error Variance
Don't know
NET : Yes, total
NET : Yes -
always/sometimes
NET : Rarely/never
Mean score

Pg 9
Tb T9
Total Poland Spain Hungary Bulgaria Czech UK France Germany
A B C D E F G H I
8362 1040 1026 1200 1008 1022 1034 1027 1005
8362 1040 1026 1200 1008 1022 1034 1027 1005
1396 271 157 300 158 59 135 229 87
17% 26% 15% 25% 16% 6% 13% 22% 9%
FGI ACEFGI FI ACEFGI FI FI ACEFGI F
2748 368 344 478 273 291 302 389 303
33% 35% 34% 40% 27% 28% 29% 38% 30%
EFG EFGI EF ABCEFGI ACEFGI
2293 275 257 279 291 383 269 227 312
27% 26% 25% 23% 29% 37% 26% 22% 31%
DH H DH ABCDEGH
I
ABCDGH
1850 119 265 129 262 273 325 178 299
22% 11% 26% 11% 26% 27% 31% 17% 30%
BDH ABDH ABDH ABDH ABCDEFH BD ABDH
75 6 2 14 24 16 4 4 5
1% 1% * 1% 2% 2% * * *
C C ABCGHI CGHI
6437 915 759 1057 722 733 705 845 702
77% 88% 74% 88% 72% 72% 68% 82% 70%
CEFGI ACEFGHI GI ACEFGHI ACEFGI
4144 640 501 778 431 350 436 618 390
50% 62% 49% 65% 43% 34% 42% 60% 39%
EFGI ACEFGI EFGI ACEFGHI F F ACEFGI F
4143 394 523 408 553 656 594 405 611
50% 38% 51% 34% 55% 64% 57% 39% 61%
BDH BDH ABDH ABCDEGH ABCDH D ABCDEH
2.45 2.77 2.38 2.8 2.33 2.14 2.24 2.65 2.18
EFGI ACEFGHI FGI ACEFGHI FI F ACEFGI
1.015 0.967 1.031 0.941 1.038 0.882 1.037 1.011 0.958
* 0.001 0.001 0.001 0.001 0.001 0.001 0.001 0.001
Weighted by: weight
Locally Produced Food : 201407120 : GlobalQ2. How often do you do the following ...? - You buy food directly from farmers (for example farmers markets or farmers shops)
Base: All respondents
FIELDWORK : 16/10/2014 - 08/12/2014
- Column Means: Columns Tested (5%): A/B/C/D/E/F/G/H/I Minimum Base: 30 (**), Small Base: 100 (*) - Column Proportions: Columns Tested (5%): A/B/C/D/E/F/G/H/I
Minimum Base: 30 (**), Small Base: 100 (*) Continuity correction applied
COUNTRIES
Unweighted Base
Weighted Base
Yes, often (4)
Yes, sometimes (3)
Yes, rarely (2)
No, never (1)
Standard Deviation
Error Variance
Don't know
NET : Yes, total
NET : Yes -
always/sometimes
NET : Rarely/never
Mean score

Pg 10
Tb T10
Total Poland Spain Hungary Bulgaria Czech UK France Germany
A B C D E F G H I
8362 1040 1026 1200 1008 1022 1034 1027 1005
8362 1040 1026 1200 1008 1022 1034 1027 1005
811 137 104 101 59 49 144 149 69
10% 13% 10% 8% 6% 5% 14% 14% 7%
EFI ACDEFI EFI EF ACDEFI ACDEFI
2264 285 310 275 138 166 363 451 276
27% 27% 30% 23% 14% 16% 35% 44% 27%
DEF DEF ADEF EF ABCDEFI ABCDEFGI DEF
1995 276 266 226 221 209 220 277 300
24% 27% 26% 19% 22% 20% 21% 27% 30%
DF DEFG DEFG ADEFG ADEFG
3025 335 345 566 466 502 304 147 359
36% 32% 34% 47% 46% 49% 29% 14% 36%
BGH H H ABCGHI ABCGHI ABCGHI H GH
268 7 1 32 125 96 3 3 1
3% 1% * 3% 12% 9% * * *
BCGHI BCGHI ABCDFGHI ABCDGHI
5070 698 680 602 417 424 727 877 645
61% 67% 66% 50% 41% 41% 70% 85% 64%
DEF ADEF ADEF EF ADEFI ABCDEFGI ADEF
3075 422 413 376 197 215 507 600 345
37% 41% 40% 31% 19% 21% 49% 58% 34%
DEF ADEFI ADEFI EF ABCDEFI ABCDEFGI EF
5020 611 612 792 686 711 524 424 659
60% 59% 60% 66% 68% 70% 51% 41% 66%
GH GH GH ABCGH ABCGH ABCGH H ABCGH
2.11 2.22 2.17 1.92 1.76 1.74 2.34 2.59 2.05
DEF ADEFI DEFI EF ABCDEFI ABCDEFGI DEF
1.021 1.041 1.008 1.03 0.946 0.932 1.045 0.906 0.951
* 0.001 0.001 0.001 0.001 0.001 0.001 0.001 0.001
Weighted by: weight
Locally Produced Food : 201407120 : GlobalQ2. How often do you do the following ...? - When eating out, you try to eat at restaurants which use locally produced food
Base: All respondents
FIELDWORK : 16/10/2014 - 08/12/2014
- Column Means: Columns Tested (5%): A/B/C/D/E/F/G/H/I Minimum Base: 30 (**), Small Base: 100 (*) - Column Proportions: Columns Tested (5%): A/B/C/D/E/F/G/H/I
Minimum Base: 30 (**), Small Base: 100 (*) Continuity correction applied
COUNTRIES
Unweighted Base
Weighted Base
Yes, often (4)
Yes, sometimes (3)
Yes, rarely (2)
No, never (1)
Standard Deviation
Error Variance
Don't know
NET : Yes, total
NET : Yes -
always/sometimes
NET : Rarely/never
Mean score

Pg 11
Tb TG11
It is difficult to find
information about
where to buy locally
produced food
There are not enough
places to buy locally
produced food in the
area where you live
The prices for
locally
produced food
are too high
Buying locally
produced food
means the choice is
too limited
A B C D
8362 8362 8362 8362
8362 8362 8362 8362
2032 1903 1971 1475
24% 23% 24% 18%
BD D D
4047 3666 3783 4027
48% 44% 45% 48%
BC BC
1624 1963 1945 2115
19% 23% 23% 25%
A A ABC
437 599 390 515
5% 7% 5% 6%
ACD AC
222 231 273 230
3% 3% 3% 3%
A
6079 5569 5754 5502
73% 67% 69% 66%
BCD BD
2062 2562 2335 2630
25% 31% 28% 31%
AC A AC
2.94 2.85 2.91 2.79
BCD D BD
0.813 0.864 0.818 0.808
* * * *
Weighted by: weight
Locally Produced Food : 201407120 : GlobalQ3. To what extent do you agree or disagree with each of the following statements about locally produced food? - Summary Table
Base: All respondents
FIELDWORK : 16/10/2014 - 08/12/2014
Overlap formulae used - Column Means: Columns Tested (5%): A/B/C/D Minimum Base: 30 (**), Small Base: 100 (*) - Column Proportions: Columns Tested (5%): A/B/C/D Minimum Base: 30 (**), Small Base:
100 (*) Continuity correction applied
Unweighted Base
Weighted Base
Totally agree (4)
Tend to agree (3)
Tend to disagree (2)
Totally disagree (1)
Error Variance
Don't know
NET : Agree
NET : Disagree
Mean score
Standard Deviation

Pg 12
Tb T12
Total Poland Spain Hungary Bulgaria Czech UK France Germany
A B C D E F G H I
8362 1040 1026 1200 1008 1022 1034 1027 1005
8362 1040 1026 1200 1008 1022 1034 1027 1005
2032 372 246 311 312 164 212 241 174
24% 36% 24% 26% 31% 16% 20% 23% 17%
FGI ACDEFGHI FI FGI ACDFGHI F FI
4047 477 502 582 408 469 560 540 508
48% 46% 49% 49% 40% 46% 54% 53% 51%
E E E E E ABCDEF ABEF BEF
1624 153 215 210 137 229 222 205 253
19% 15% 21% 17% 14% 22% 21% 20% 25%
BE BE E ABDE BDE BE ABCDEH
437 34 58 80 78 42 38 39 69
5% 3% 6% 7% 8% 4% 4% 4% 7%
B B BFGH ABFGH ABFGH
222 4 4 17 73 118 2 2 2
3% * * 1% 7% 12% * * *
BCDGHI BCGHI ABCDGHI ABCDEGH
I
6079 849 749 893 720 633 772 781 681
73% 82% 73% 74% 71% 62% 75% 76% 68%
FI ACDEFGHI FI FI F FI AEFI F
2062 187 273 290 215 271 260 244 322
25% 18% 27% 24% 21% 27% 25% 24% 32%
BE BE B BE B B ABCDEFG
H
2.94 3.15 2.92 2.95 3.02 2.84 2.92 2.96 2.78
FI ACDEFGHI FI FI ACFGI FI FI
0.813 0.785 0.82 0.843 0.902 0.771 0.749 0.765 0.808
* 0.001 0.001 0.001 0.001 0.001 0.001 0.001 0.001
Weighted by: weight
Locally Produced Food : 201407120 : GlobalQ3. To what extent do you agree or disagree with each of the following statements about locally produced food? - It is difficult to find information about where
to buy locally produced food
Base: All respondents
FIELDWORK : 16/10/2014 - 08/12/2014
- Column Means: Columns Tested (5%): A/B/C/D/E/F/G/H/I Minimum Base: 30 (**), Small Base: 100 (*) - Column Proportions: Columns Tested (5%):
A/B/C/D/E/F/G/H/I Minimum Base: 30 (**), Small Base: 100 (*) Continuity correction applied
COUNTRIES
Unweighted Base
Weighted Base
Totally agree (4)
Tend to agree (3)
Tend to disagree (2)
Totally disagree (1)
Error Variance
Don't know
NET : Agree
NET : Disagree
Mean score
Standard Deviation

Pg 13
Tb T13
Total Poland Spain Hungary Bulgaria Czech UK France Germany
A B C D E F G H I
8362 1040 1026 1200 1008 1022 1034 1027 1005
8362 1040 1026 1200 1008 1022 1034 1027 1005
1903 302 200 365 244 204 242 230 116
23% 29% 20% 30% 24% 20% 23% 22% 12%
CFI ACEFGHI I ACEFGHI CFI I I I
3666 485 427 490 368 434 540 512 409
44% 47% 42% 41% 37% 42% 52% 50% 41%
E CDEI E E ABCDEFI ACDEFI
1963 197 285 240 220 212 208 226 375
23% 19% 28% 20% 22% 21% 20% 22% 37%
BDG ABDEFGH ABCDEFG
H
599 49 109 74 109 58 39 57 103
7% 5% 11% 6% 11% 6% 4% 6% 10%
BG ABDFGH G ABDFGH ABDFGH
231 8 4 31 67 114 5 1 1
3% 1% * 3% 7% 11% * * *
BCGHI HI BCGHI ABCDGHI ABCDEGH
I
5569 786 628 855 613 638 782 743 525
67% 76% 61% 71% 61% 62% 76% 72% 52%
CEFI ACDEFI I ACEFI I I ACDEFI ACEFI
2562 246 395 314 328 270 247 283 479
31% 24% 38% 26% 33% 26% 24% 28% 48%
BDFG ABDEFGH BDFGH B ABCDEFG
H
2.85 3.01 2.7 2.98 2.79 2.86 2.96 2.89 2.54
CI ACEFHI I ACEFHI CI CI ACEFI CEI
0.864 0.821 0.903 0.878 0.956 0.834 0.767 0.81 0.829
* 0.001 0.001 0.001 0.001 0.001 0.001 0.001 0.001
Weighted by: weight
Locally Produced Food : 201407120 : GlobalQ3. To what extent do you agree or disagree with each of the following statements about locally produced food? - There are not enough places to buy locally
produced food in the area where you live
Base: All respondents
FIELDWORK : 16/10/2014 - 08/12/2014
- Column Means: Columns Tested (5%): A/B/C/D/E/F/G/H/I Minimum Base: 30 (**), Small Base: 100 (*) - Column Proportions: Columns Tested (5%): A/B/C/D/E/F/G/H/I
Minimum Base: 30 (**), Small Base: 100 (*) Continuity correction applied
COUNTRIES
Unweighted Base
Weighted Base
Totally agree (4)
Tend to agree (3)
Tend to disagree (2)
Totally disagree (1)
Error Variance
Don't know
NET : Agree
NET : Disagree
Mean score
Standard Deviation

Pg 14
Tb T14
Total Poland Spain Hungary Bulgaria Czech UK France Germany
A B C D E F G H I
8362 1040 1026 1200 1008 1022 1034 1027 1005
8362 1040 1026 1200 1008 1022 1034 1027 1005
1971 292 231 345 299 214 259 182 149
24% 28% 22% 29% 30% 21% 25% 18% 15%
HI ACFHI HI ACFHI ACFGHI I FHI
3783 476 496 498 376 449 522 486 480
45% 46% 48% 42% 37% 44% 50% 47% 48%
DE E DE E ABDEF DE DE
1945 240 244 237 168 205 227 309 314
23% 23% 24% 20% 17% 20% 22% 30% 31%
DEF E DEF E ABCDEFG ABCDEFG
390 29 52 83 66 33 22 46 59
5% 3% 5% 7% 7% 3% 2% 4% 6%
BFG BFG ABFGH ABFG BG BFG
273 3 3 37 99 121 5 3 3
3% * * 3% 10% 12% * * *
BCGHI BCGHI ABCDGHI ABCDGHI
5754 768 727 843 675 663 781 669 629
69% 74% 71% 70% 67% 65% 76% 65% 63%
FHI AEFHI FHI FHI ACDEFHI
2335 269 296 320 234 238 248 356 373
28% 26% 29% 27% 23% 23% 24% 35% 37%
EFG EFG ABCDEFG ABCDEFG
2.91 3 2.88 2.95 3 2.94 2.99 2.79 2.72
HI ACHI HI HI ACHI HI ACHI
0.818 0.79 0.81 0.886 0.897 0.78 0.746 0.784 0.787
* 0.001 0.001 0.001 0.001 0.001 0.001 0.001 0.001
Weighted by: weight
Locally Produced Food : 201407120 : GlobalQ3. To what extent do you agree or disagree with each of the following statements about locally produced food? - The prices for locally produced food are too
high
Base: All respondents
FIELDWORK : 16/10/2014 - 08/12/2014
- Column Means: Columns Tested (5%): A/B/C/D/E/F/G/H/I Minimum Base: 30 (**), Small Base: 100 (*) - Column Proportions: Columns Tested (5%): A/B/C/D/E/F/G/H/I
Minimum Base: 30 (**), Small Base: 100 (*) Continuity correction applied
COUNTRIES
Unweighted Base
Weighted Base
Totally agree (4)
Tend to agree (3)
Tend to disagree (2)
Totally disagree (1)
Error Variance
Don't know
NET : Agree
NET : Disagree
Mean score
Standard Deviation

Pg 15
Tb T15
Total Poland Spain Hungary Bulgaria Czech UK France Germany
A B C D E F G H I
8362 1040 1026 1200 1008 1022 1034 1027 1005
8362 1040 1026 1200 1008 1022 1034 1027 1005
1475 155 154 348 272 138 170 117 120
18% 15% 15% 29% 27% 14% 16% 11% 12%
BCFHI H HI ABCFGHI ABCFGHI HI
4027 438 512 523 377 514 569 541 554
48% 42% 50% 44% 37% 50% 55% 53% 55%
BDE E BDE E BDE ABCDE ABDE ABCDEF
2115 354 288 227 189 216 266 305 270
25% 34% 28% 19% 19% 21% 26% 30% 27%
DEF ACDEFGHI DEF DEF ADEF DEF
515 87 67 67 83 61 28 62 60
6% 8% 7% 6% 8% 6% 3% 6% 6%
G ADFGI G G ADG G G G
230 6 4 35 87 93 1 2 1
3% 1% * 3% 9% 9% * * *
BCGHI BCGHI ABCDGHI ABCDGHI
5502 593 666 871 649 652 738 658 674
66% 57% 65% 73% 64% 64% 71% 64% 67%
B B ABCEFHI B B ABCEFH B B
2630 441 355 294 271 277 294 367 330
31% 42% 35% 24% 27% 27% 28% 36% 33%
DEF ACDEFGHI ADEFG ADEFG DEF
2.79 2.64 2.74 2.99 2.91 2.78 2.85 2.7 2.73
BCHI B ABCFGHI ABCFHI BH ABCHI B
0.808 0.836 0.793 0.85 0.924 0.773 0.713 0.75 0.745
* 0.001 0.001 0.001 0.001 0.001 * 0.001 0.001
Weighted by: weight
Locally Produced Food : 201407120 : GlobalQ3. To what extent do you agree or disagree with each of the following statements about locally produced food? - Buying locally produced food means the
choice is too limited
Base: All respondents
FIELDWORK : 16/10/2014 - 08/12/2014
- Column Means: Columns Tested (5%): A/B/C/D/E/F/G/H/I Minimum Base: 30 (**), Small Base: 100 (*) - Column Proportions: Columns Tested (5%): A/B/C/D/E/F/G/H/I
Minimum Base: 30 (**), Small Base: 100 (*) Continuity correction applied
COUNTRIES
Unweighted Base
Weighted Base
Totally agree (4)
Tend to agree (3)
Tend to disagree (2)
Totally disagree (1)
Error Variance
Don't know
NET : Agree
NET : Disagree
Mean score
Standard Deviation


