LocARNA-P: Accurate boundary prediction and improved
detection of structural RNAs
SEBASTIAN WILL,1,2 TEJAL JOSHI,3 IVO L. HOFACKER,4 PETER F. STADLER,4,5,6,7,8 and ROLF BACKOFEN1,9,10
1Chair for Bioinformatics, Institute of Computer Science, Albert-Ludwigs-Universitat, D-79110 Freiburg, Germany2Computation and Biology Group, CSAIL and Mathematics Department, MIT, Cambridge, Massachusetts 02139, USA3Center for Biological Sequence Analysis, Department of Systems Biology, Technical University of Denmark, DK-2800 Kongens Lyngby, Denmark4Department of Theoretical Chemistry, University of Vienna, A-1090 Wien, Austria5Bioinformatics Group, Department of Computer Science, Interdisciplinary Center of Bioinformatics, University of Leipzig, D-04107 Leipzig,Germany6Max-Planck-Institute for Mathematics in the Sciences, D-04103 Leipzig, Germany7Fraunhofer Institute for Cell Therapy and Immunology, D-04103 Leipzig, Germany8Santa Fe Institute, Santa Fe, New Mexico 87501, USA9Center for Biological Signaling Studies (BIOSS), University of Freiburg, D-79104 Freiburg, Germany
ABSTRACT
Current genomic screens for noncoding RNAs (ncRNAs) predict a large number of genomic regions containing potentialstructural ncRNAs. The analysis of these data requires highly accurate prediction of ncRNA boundaries and discrimination ofpromising candidate ncRNAs from weak predictions. Existing methods struggle with these goals because they rely on sequence-based multiple sequence alignments, which regularly misalign RNA structure and therefore do not support identificationof structural similarities. To overcome this limitation, we compute columnwise and global reliabilities of alignments based onsequence and structure similarity; we refer to these structure-based alignment reliabilities as STARs. The columnwise STARs ofalignments, or STAR profiles, provide a versatile tool for the manual and automatic analysis of ncRNAs. In particular, weimprove the boundary prediction of the widely used ncRNA gene finder RNAz by a factor of 3 from a median deviation of 47 to13 nt. Post-processing RNAz predictions, LocARNA-P’s STAR score allows much stronger discrimination between true- andfalse-positive predictions than RNAz’s own evaluation. The improved accuracy, in this scenario increased from AUC 0.71 toAUC 0.87, significantly reduces the cost of successive analysis steps. The ready-to-use software tool LocARNA-P producesstructure-based multiple RNA alignments with associated columnwise STARs and predicts ncRNA boundaries. We provideadditional results, a web server for LocARNA/LocARNA-P, and the software package, including documentation and a pipelinefor refining screens for structural ncRNA, at http://www.bioinf.uni-freiburg.de/Supplements/LocARNA-P/.
Keywords: de novo prediction of RNA; reliability of structural alignment; simultaneous alignment and folding
INTRODUCTION
Starting with findings of catalytic RNA (Guerrier-Takadaet al. 1983) and taking off with the discovery of microRNAs(Lagos-Quintana et al. 2001; Lau et al. 2001; Lee and Ambros2001) and the advent of genome-wide transcriptomics(Bertone et al. 2004; Cheng et al. 2005; The FANTOMConsortium et al. 2005), it has become obvious that RNA’scrucial role in living cells extends far beyond being a meretemplate for protein biosynthesis. Indeed, the majority
of transcripts might have primarily regulatory functions(Mattick et al. 2009). Elucidating the functional rolesof many newly discovered noncoding RNAs (ncRNAs)has thus become a central research interest in molecularbiology.
The function of many ncRNAs is determined by theirsecondary structure rather than their sequence. Such struc-tural ncRNAs can therefore be detected by their stable andevolutionarily conserved secondary structures. Recent ad-vances in computational RNomics originated numerousapproaches for this purpose (Rivas and Eddy 2001; Coventryet al. 2004; Washietl and Hofacker 2004; Washietl et al.2005a; Pedersen et al. 2006; Torarinsson et al. 2006; Uzilovet al. 2006; Yao et al. 2006; Bompfunewerer et al. 2008).Among these methods, EvoFold (Pedersen et al. 2006) and
10Corresponding author.E-mail [email protected] published online ahead of print. Article and publication date are
at http://www.rnajournal.org/cgi/doi/10.1261/rna.029041.111.
900 RNA (2012), 18:900–914. Published by Cold Spring Harbor Laboratory Press.
Cold Spring Harbor Laboratory Press on April 15, 2013 - Published by rnajournal.cshlp.orgDownloaded from
RNAz (Washietl et al. 2005a,b; Gruber et al. 2010) are ef-ficient enough to be applied to genome-wide surveys inmammals (Washietl et al. 2005b; Pedersen et al. 2006) andother metazoan clades (Missal et al. 2005, 2006).
The fast approaches EvoFold and RNAz rely on the givensequence-based whole-genome alignment; they cannot cor-rect potential misalignments, which prevent them fromidentifying conserved RNA structure. The idea of revisingthe alignment for ncRNA prediction, pioneered by MSARi(Coventry et al. 2004), is also realized in the EM-basedapproach CMfinder (Yao et al. 2006), which extends theidea from local sequence motif finders such as MEMEto the problem of finding local RNA structure motifs.Due to its high computational demands, CMfinder hasnever been applied to whole eukaryotic genomes; for ex-ample, in (Torarinsson et al. 2008), it has been appliedto the ENCODE region, covering only 1% of the humangenome.
Whereas EvoFold applies stochastic context-free gram-mars (SCFGs), an approach pioneered by qrna (Rivas andEddy 2001), RNAz is based on the evaluation of foldingthermodynamics and covariance. Both approaches classifyinput alignments either as nonstructural or as possessinga common RNA secondary structure.
Mainly motivated by efficiency reasons, both approachesrely on sequence-based multiple alignments. However, be-cause RNA structure is often more conserved than se-quence, sequence similarity can be weak even within well-established RNA families. Thus, many ncRNAs cannot bealigned well by pure sequence-based techniques, which failfor structural RNAs at pairwise sequence identities <60%(Gardner et al. 2005). Various algorithmic approacheshave been introduced to determine structural similaritiesand to derive consensus structure patterns for structuralRNAs with low sequence identity (Sankoff 1985; Gorodkinet al. 1997; Mathews and Turner 2002; Hochsmann et al.2003; Hofacker and Stadler 2004; Havgaard et al. 2005;Siebert and Backofen 2005; Will et al. 2007; Bradley et al.2008).
The first practical approaches for structure-based multi-ple alignment, e.g., RNAforester (Hochsmann et al. 2003)and MARNA (Siebert and Backofen 2005), depend on pre-dicted or known secondary structures. In practice, how-ever, these approaches are limited by the low accuracy ofstructure prediction from single sequences. This dilemmais overcome only by simultaneously computing an align-ment and the common secondary structure of two alignedsequences; the general problem was first solved by Sankoff(1985). The high complexity of the general problem isprohibitive for practical applications of this algorithm.Therefore, variants of Sankoff’s algorithm introduce simpli-fications of the general problem; there are two main classes.Programs such as FoldAlign (Havgaard et al. 2005), dynalign(Mathews and Turner 2002), and Stemloc-AMA (Bradleyet al. 2008) evaluate a loop-based energy model for RNA
during the alignment; the expensive energy evaluationhas to be compensated by strong, usually sequence-basedheuristics.
In contrast, PMcomp (Hofacker and Stadler 2004) andLocARNA (Will et al. 2007) evaluate a more lightweightenergy model during the alignment. To obtain good accu-racy, the base-pair weights in the lightweight energy modelare derived from base-pair probabilities in the single se-quences (due to McCaskill’s algorithm from McCaskill1990). By moving the expensive evaluation of the full-featured energy model to the pre-computation phase, thetotal computational cost is reduced significantly. Further-more, one can ignore very unlikely base pairs withoutcompromising the alignment accuracy. This reduces thecomplexity of these approaches effectively without requir-ing sequence-based heuristics, since most of the potentialbase pairs in RNA ensembles are improbable. This is called‘‘sparsity at the structure level’’ since RNA base-pair prob-ability matrices are sparse, i.e., they have only few significantentries.
We see the largest potential benefits of structure-basedmultiple alignment in its application to de novo predictionof structural ncRNA. There, it can overcome the funda-mental limitations of ncRNA prediction approaches thatrely on sequence-based alignment. However, there havebeen two caveats that prevented its application. First, manyapproaches need to use a sliding-window technique be-cause the boundaries of the ncRNAs are not known inadvance. This technique can result in poor structure modelsdue to an inaccurate folding context. Second, structure-based alignment has been computationally too demandingfor genome-wide screens.
To overcome these limitations, we propose a new pipe-line for structural ncRNA gene finding that uses fast ncRNAfinders like RNAz as a first filter. The coarsely predictedloci are then extended by genomic context and furtheranalyzed using the novel multiple sequence–structure align-ment approach LocARNA-P. LocARNA-P enables auto-mated analyses of multiple sequence–structure alignmentsthat as of yet have required manual inspection by experts;typically such analysis tasks are assessing the overall align-ment quality or finding the most reliably structurally alignedregions for locating putative ncRNAs. For the purpose ofautomated analysis, LocARNA-P provides fine-grained aswell as total reliability measures for structure-based align-ments, which we call STARs (structure-based alignmentreliabilities). STARs can be used for several important tasksin this pipeline, namely, for (1) detecting clusters of struc-tural ncRNAs predicted as putative ncRNA-containing re-gions by the ncRNA gene finder, (2) determining accuratencRNA boundaries using alignment reliabilities based onsequence and structural similarity, and (3) improving thepredictive power of ncRNA gene finding.
While more conventional RNA alignment methods, in-cluding LocARNA, compute ‘‘only’’ a multiple alignment
LocARNA-P: RNA boundary prediction and detection
www.rnajournal.org 901
Cold Spring Harbor Laboratory Press on April 15, 2013 - Published by rnajournal.cshlp.orgDownloaded from
based on sequence and structure similarity, LocARNA-Padditionally computes columnwise and global STARs basedon sequence and structural match probabilities. This enablesvarious further analysis and can even improve the multiplealignment quality. From LocARNA, LocARNA-P inheritsits accurate scoring model and parts of its algorithmicstructure. To allow large-scale applicability, a major designgoal of the LocARNA-P algorithm has been to preserve thelow time and space demands of LocARNA for the moreinvolved task of computing STARs. We emphasize that thetime for computing STARs by a straightforward, non-optimized algorithm grows with the sixth power of the se-quence length, which is prohibitive for most applications.Therefore, our approach is feasible for large-scale appli-cations, only because we reduce the complexity by a qua-dratic factor.
While approaches like RAF (Do et al. 2005) and ExpaRNA(Heyne et al. 2009) aim at speeding up Sankoff-style align-ment by means of further heuristics, the novelty ofLocARNA-P is the efficient calculation of match probabil-ities and reliabilities (STARs), which introduces a novelquality to Sankoff-style alignment.
Note that pairwise match probabilities for sequence–structure alignments have been computed previously byHofacker and Stadler (Hofacker et al. 2004) and Harmanciet al. (2008). However, we go far beyond these approachesin terms of LocARNA-P’s efficiency and the novel use ofmatch probability for RNA analysis. In contrast to the pre-vious approaches, which have not been evaluated on real-life data, LocARNA-P has been thoroughly benchmarkedand is readily applicable to large-scale data sets.
For evaluating our approach, we predicted the geneboundaries on a data set of 287 RNAz predictions in fly(Rose et al. 2007) that coincide with the FlyBase structuralncRNA annotations of Drosophila melanogaster. In thisdata set, we improved the boundary prediction of RNAzsignificantly. Note that, for the purpose of this article, werefrained from predicting boundaries for the unannotatedloci, since this would not strengthen our evaluation. Ourboundary predictions reveal additional information aboutthe genomic context of the ncRNAs. For instance, it detects39 or 59 sequence–structure conservation in flanking re-gions. Notably, by examples and in a systematic study on alltRNA loci, we observe that predictions covering flankingregions reveal true signals in the majority of cases. Fur-thermore, the visualization of the STAR profiles that un-derlie our automatic predictions supports the interpreta-tion by an expert. Finally, STAR profiles and boundaryprediction produce a powerful measure for discriminatingfalse and true positives in an ncRNA screen. We show thatthis measure significantly increases the specificity andsensitivity when post-processing an RNAz screen. Due tothe large number of ncRNA predictions from a genomicscreen, filtering ncRNA candidates for subsequent expen-sive experimental analysis is a highly relevant application.
We define structure-based multiple alignment reliabilitiesbased on pairwise match probabilities. For the case of se-quence alignment, a probability-based reliability measurewas introduced by the authors of Probcons (Do et al. 2008).Here, we extend this idea to structure-based alignment.
Initially, we consider two sequences, A and B, with theircorresponding base-pair probability matrices. These matri-ces are usually calculated from the respective sequence byMcCaskill’s partition function approach (McCaskill 1990).We are going to compute a high-quality alignment of thetwo sequences, based on sequence and structure similarity,together with additional information on the confidence inthe individual alignment columns and the predicted con-sensus structure; this confidence is expressed by column-wise STARs. These STARs facilitate the interpretation of thesequence–structure alignment and allow for further auto-mated analysis. Technically, the computed sequence–structurealignment is a pair consisting of a sequence alignmentA of Aand B and a secondary structure S of A. It is evaluated bya scoring function composed of sequence similarity andstructure similarity. A consists of a set of base matcheswritten as i z k, where i is a position in A, and k a posi-tion in B. The consensus secondary structure S for analignment A consists of a set of arc matches (i, j) z (k, l),where i z k 2 A and j z l 2 A are matches in A, and (i, j)and (k, l) are base pairs of respective sequences A and B.
We assign a similarity score to a pair (A;S). It combinesa log-odds score for the probabilities of matched basepairs with a Ribosum-like scoring of sequential matches(Klein and Eddy 2003) and uses affine gap cost. This scor-ing function provides substantial improvements over theoriginal scoring function of LocARNA, which has beenapplied in Will et al. (2007). We call this function theLocARNA scoring function, since it is shared withthe current version of LocARNA (see the Appendix forthe formal definition).
Match probabilities
We are going to define probabilities of single base matchesand arc matches in sequence–structure alignments. For thispurpose, we define probabilities of pairs (A;S) of align-ment and consensus structure. Such probabilities are de-fined under the assumption of a Boltzmann distributionover pairs (A;S) that is based on the scoring of LocARNA.
Computing match probabilities via a statistical mechanicsmodel has been introduced for sequence-based pairwisealignment by Probalign (Roshan and Livesay 2006). How-ever, the analogous approach has not been considered forstructure-based multiple alignment. By assuming a Boltzmann
Will et al.
902 RNA, Vol. 18, No. 5
Cold Spring Harbor Laboratory Press on April 15, 2013 - Published by rnajournal.cshlp.orgDownloaded from
distribution, our approach differs from methods that ob-tain probabilities from generative models such as hiddenMarkov models (HMMs) or stochastic context-free gram-mars (SCFGs). Such methods produce structures withprobabilities determined by given transition probabilities.The main advantage of the nongenerative approach takenhere is that the underlying similarity scores have a moreintuitive semantic.
The probability Pr[(A;S)|A,B] of a pair of alignmentand consensus structures (A;S) is calculated by dividingits Boltzmann weight by the total partition function. TheBoltzmann weight is obtained as exp[�b Sc(A;S)], wherewe apply the LocARNA scoring function Sc and control thedistribution by the inverse temperature b. As usual, the totalpartition function ZAB is the sum over the Boltzmannweights of all pairs (A;S). Once the probability of a pairof alignment and consensus structures is defined, we canintroduce base match and arc match probabilities. Theprobability of an arc match (i, j) z (k, l), where (i, j) and(k, l) are respective base pairs of A and B, is defined as thesum of all probabilities of pairs (A;S) that contain thismatch. Similarly, the probability Pr[i z k|A,B] of a basematch i z k is defined as the sum of the probabilities ofall alignment consensus structure pairs matching the twobases Ai and Bk. For later use, we introduce an exclusive basematch probability Pr[i zs k|A,B] of a match i z k that is notpart of a structural match. Since a naive inside/outsidealgorithm could compute such probabilities only with pro-hibitively high complexity, it is crucial for our approach thatwe reduce this complexity significantly. Further details areprovided in Materials and Methods and in the Appendix.
Columnwise STARs, boundary prediction,and global STAR scores
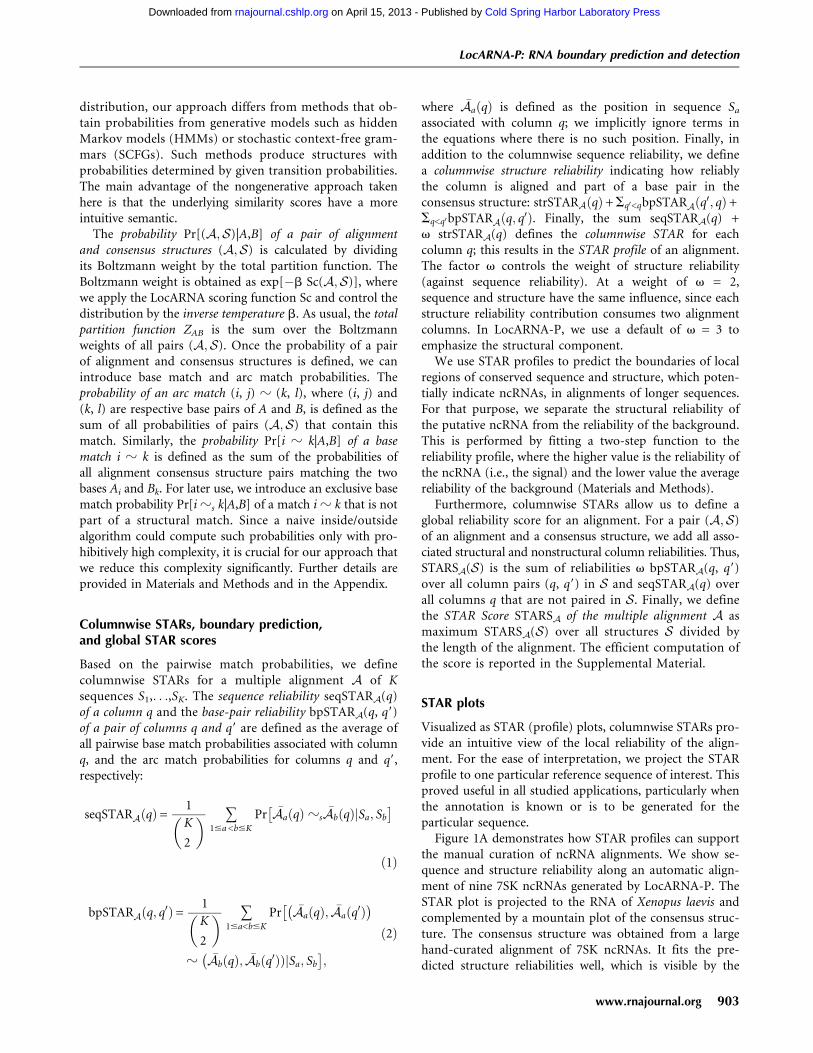
Based on the pairwise match probabilities, we definecolumnwise STARs for a multiple alignment A of Ksequences S1,. . .,SK. The sequence reliability seqSTARA(q)of a column q and the base-pair reliability bpSTARA(q, q9)of a pair of columns q and q9 are defined as the average ofall pairwise base match probabilities associated with columnq, and the arc match probabilities for columns q and q9,respectively:
seqSTARA qð Þ=1
K
2
� � +1#a <b#K
Pr �Aa qð Þ zs�Ab qð ÞjSa; Sb
� �
ð1Þ
bpSTARA q; q0ð Þ=1
K
2
� � +1#a<b#K
Pr �Aa qð Þ; �Aa q0ð Þ� ��
z �Ab qð Þ; �Ab q0ð ÞÞjSa; Sb
� �;
ð2Þ
where �Aa qð Þ is defined as the position in sequence Sa
associated with column q; we implicitly ignore terms inthe equations where there is no such position. Finally, inaddition to the columnwise sequence reliability, we definea columnwise structure reliability indicating how reliablythe column is aligned and part of a base pair in theconsensus structure: strSTARA qð Þ+ Sq0<qbpSTARA q0; qð Þ+Sq<q0bpSTARA q; q0ð Þ. Finally, the sum seqSTARA(q) +v strSTARA(q) defines the columnwise STAR for eachcolumn q; this results in the STAR profile of an alignment.The factor v controls the weight of structure reliability(against sequence reliability). At a weight of v = 2,sequence and structure have the same influence, since eachstructure reliability contribution consumes two alignmentcolumns. In LocARNA-P, we use a default of v = 3 toemphasize the structural component.
We use STAR profiles to predict the boundaries of localregions of conserved sequence and structure, which poten-tially indicate ncRNAs, in alignments of longer sequences.For that purpose, we separate the structural reliability ofthe putative ncRNA from the reliability of the background.This is performed by fitting a two-step function to thereliability profile, where the higher value is the reliability ofthe ncRNA (i.e., the signal) and the lower value the averagereliability of the background (Materials and Methods).
Furthermore, columnwise STARs allow us to define aglobal reliability score for an alignment. For a pair (A;S)of an alignment and a consensus structure, we add all asso-ciated structural and nonstructural column reliabilities. Thus,STARSA(S) is the sum of reliabilities v bpSTARA(q, q9)over all column pairs (q, q9) in S and seqSTARA(q) overall columns q that are not paired in S. Finally, we definethe STAR Score STARSA of the multiple alignment A asmaximum STARSA(S) over all structures S divided bythe length of the alignment. The efficient computation ofthe score is reported in the Supplemental Material.
STAR plots
Visualized as STAR (profile) plots, columnwise STARs pro-vide an intuitive view of the local reliability of the align-ment. For the ease of interpretation, we project the STARprofile to one particular reference sequence of interest. Thisproved useful in all studied applications, particularly whenthe annotation is known or is to be generated for theparticular sequence.
Figure 1A demonstrates how STAR profiles can supportthe manual curation of ncRNA alignments. We show se-quence and structure reliability along an automatic align-ment of nine 7SK ncRNAs generated by LocARNA-P. TheSTAR plot is projected to the RNA of Xenopus laevis andcomplemented by a mountain plot of the consensus struc-ture. The consensus structure was obtained from a largehand-curated alignment of 7SK ncRNAs. It fits the pre-dicted structure reliabilities well, which is visible by the
LocARNA-P: RNA boundary prediction and detection
www.rnajournal.org 903
Cold Spring Harbor Laboratory Press on April 15, 2013 - Published by rnajournal.cshlp.orgDownloaded from
good agreement of the flanks of the mountain plot andthe peaks of structure reliability. The general shape of theSTAR profile is in agreement with the experiences fromhand-curating the alignment, where the 59 and 39 ends ofthe sequences align very well and columns between posi-tions 150 and 250 are extremely variable (Gruber et al.2008a; Marz et al. 2009).
Locating structural ncRNAs using STAR profiles
Given a STAR profile projected to the sequence of thereference genome, we computationally predict the loca-tion of putative ncRNAs by fitting a two-step function asdescribed before.
Figure 1B shows the STAR plot for the microRNA clusterfrom position 90,800,800–90,801,699 of human chromo-some 13, generated from aligning 10 mammalian sequences.In particular, the structural component of the STAR profile(dark region) correlates well with the annotated micro-RNAs, which are indicated by thin lines. Fitting the two-step function results in a good prediction of the microRNAlocations (thick line on top). A larger example from fivemammalian sequences with lengths z5000 is given inFigure 1C. The figure profiles the human gene gas5,whose introns contain 10 C/D-box snoRNAs (Smith and
Steitz 1998). Identifying the C/D-boxsnoRNAs in this large genomic con-text is challenging due to their weakconservation signal for both sequenceand structure. Consequently, C/D-boxsnoRNAs have proven to be particu-larly hard to discover using de novostructural ncRNA predictors like RNAz.However, we correctly predicted eightof the 10 snoRNAs. We emphasize thatLocARNA-P nontrivially supports thecomputation of these very large instancesdue to optimally exploiting local folding(Supplemental Material).
Accurate boundariesof structural ncRNA
A common problem in the de novoprediction of ncRNAs is that only ap-proximate locations of structural RNAscan be identified. This problem is sharedeven by experimental approaches forncRNA detection such as tiling arraysand short read sequencing. We showthat the STAR profile plot combinedwith automated detection of high-re-liability regions yields accurate bound-aries of structural RNA.
To verify this claim, we generated adata set of true-positive predictions of a recent RNAz(Washietl et al. 2005a) screen (Rose et al. 2007) in Drosophilamelanogaster, which is based on a whole-genome alignmentof the 12 Drosophila genomes (Clark et al. 2007). In thisscreen, 120-nt-long alignment slices of the whole-genomealignment, called ‘‘windows,’’ at every 40 nt are evaluatedwith RNAz; the latter estimates a ‘‘class probability’’ P ofcontaining structural RNA. Each set of overlapping win-dows with RNAz P $ 0.5 in either orientation is combinedinto a ‘‘locus.’’ As true positives, we selected 287 out of theabout predicted 42,000 loci that overlap with at least oneof the FlyBase-annotated structural noncoding RNAs in D.melanogaster. For each of the loci, we selected all sequencesthat have at most 25% gaps in the whole-genome alignmentslice of the locus region. This filter criterion was proposedby Rose et al. (2007) to remove weakly aligned sequences.To enable prediction of ncRNA boundaries that exceedthe RNAz prediction and to add background signal, eachsequence was extended by genomic context. While largecontext increases the computational cost of the subsequentrealignment, its size should significantly exceed the ex-pected deviation between true ncRNA boundaries and RNAzprediction, which can be estimated from the annotation(cf. Fig. 2A). Thus, we added 100 nt upstream and down-stream, as long as we stay in the same syntenic block. For
FIGURE 1. STAR profile plots with annotations. In each profile plot, the dark regions indicatestructure reliability, the light regions represent sequence reliability, and the thin line shows thecombined column-reliability. The thick lines on top of B and C show the automatic predictionbased on the STAR profile; below we indicate the known annotation by thinner lines. (A) STARplot of an alignment of nine ncRNAs from the 7SK ncRNA family projected to the X. laevissequence. The profile is annotated with a mountain plot of the consensus structure. (B) STARplot for the LocARNA-P-alignment of the miRNA cluster hg18, chr13, positions 90800800–90801699, projected to the human sequence; the known microRNAs are easily detected usingour method. (C) STAR plot for the LocARNA-P alignment of the human gene gas5 (hg18,chr1, 172,099,662–172,103,748); the gene is aligned with four other mammalian sequences; theintrons of human gas5 host 10 C/D-box snoRNAs.
Will et al.
904 RNA, Vol. 18, No. 5
Cold Spring Harbor Laboratory Press on April 15, 2013 - Published by rnajournal.cshlp.orgDownloaded from
only nine of the 287 loci, only a shorter context wasavailable. These extended locus alignments consist of ataverage 8.5 sequences where the sequences have an averagelength of z325 and a maximal length of 560 nt.
For each locus, we realigned its extended sequences inboth orientations and calculated according STARs, bothperformed simultaneously by LocARNA-P. This resultedin a STAR profile per locus, which we projected to theD. melanogaster sequence. For predicting boundaries byfitting the two-step function to the profile, we constrainedthe fit to predict exactly one range. The predicted bound-aries were then compared with the boundaries of both theannotated ncRNA and the RNAz locus region.
We compare our predictions with the annotation inFlyBase for the assembly used by the RNAz screen. Notably,we make a single exception to this rule for microRNAs.Since we expect to identify their structural precursors in-stead of the (nonstructural) mature miRNA, we comparedour predictions with the pre-miRNA annotations frommiRBase.
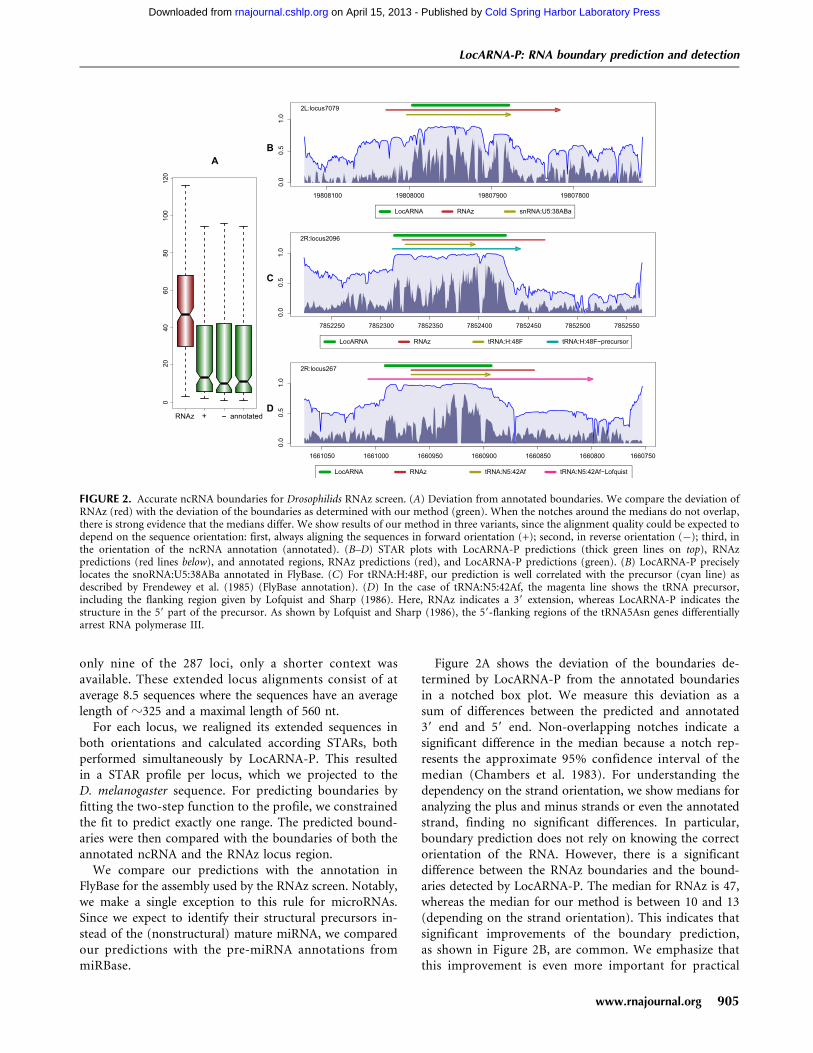
Figure 2A shows the deviation of the boundaries de-termined by LocARNA-P from the annotated boundariesin a notched box plot. We measure this deviation as asum of differences between the predicted and annotated39 end and 59 end. Non-overlapping notches indicate asignificant difference in the median because a notch rep-resents the approximate 95% confidence interval of themedian (Chambers et al. 1983). For understanding thedependency on the strand orientation, we show medians foranalyzing the plus and minus strands or even the annotatedstrand, finding no significant differences. In particular,boundary prediction does not rely on knowing the correctorientation of the RNA. However, there is a significantdifference between the RNAz boundaries and the bound-aries detected by LocARNA-P. The median for RNAz is 47,whereas the median for our method is between 10 and 13(depending on the strand orientation). This indicates thatsignificant improvements of the boundary prediction,as shown in Figure 2B, are common. We emphasize thatthis improvement is even more important for practical
FIGURE 2. Accurate ncRNA boundaries for Drosophilids RNAz screen. (A) Deviation from annotated boundaries. We compare the deviation ofRNAz (red) with the deviation of the boundaries as determined with our method (green). When the notches around the medians do not overlap,there is strong evidence that the medians differ. We show results of our method in three variants, since the alignment quality could be expected todepend on the sequence orientation: first, always aligning the sequences in forward orientation (+); second, in reverse orientation (�); third, inthe orientation of the ncRNA annotation (annotated). (B–D) STAR plots with LocARNA-P predictions (thick green lines on top), RNAzpredictions (red lines below), and annotated regions, RNAz predictions (red), and LocARNA-P predictions (green). (B) LocARNA-P preciselylocates the snoRNA:U5:38ABa annotated in FlyBase. (C) For tRNA:H:48F, our prediction is well correlated with the precursor (cyan line) asdescribed by Frendewey et al. (1985) (FlyBase annotation). (D) In the case of tRNA:N5:42Af, the magenta line shows the tRNA precursor,including the flanking region given by Lofquist and Sharp (1986). Here, RNAz indicates a 39 extension, whereas LocARNA-P indicates thestructure in the 59 part of the precursor. As shown by Lofquist and Sharp (1986), the 59-flanking regions of the tRNA5Asn genes differentiallyarrest RNA polymerase III.
LocARNA-P: RNA boundary prediction and detection
www.rnajournal.org 905
Cold Spring Harbor Laboratory Press on April 15, 2013 - Published by rnajournal.cshlp.orgDownloaded from
applications because RNA folding is well known to be verycontext-sensitive.
We investigated cases in which the LocARNA-P pre-diction differs from the given annotation to a greaterextent. Some of these cases are plainly due to incompleteor incorrect annotation. For example, for snoRNA U3(FlyBase ID snoRNA:U3:54Aa) and smnRNA:331, only par-tial genes are annotated. In the case of SnoRNA:3, theannotation is incorrect for the 2004 assembly used for theRNAz screen (Rose et al. 2007). In the current assembly,however, the annotation matches the predicted signal.
In many cases, the predicted extended signals may cor-respond to precursors with conserved structure, as in thecase of miRNAs. For tRNAs, we analyzed this source ofincongruence between prediction and annotation in moredetail. The tRNAs are known to undergo processing afterbeing transcribed as precursors. The annotated tRNA‘‘genes’’ are always the mature tRNAs. In contrast, theprecursor is in almost all cases unknown. There is noagreement in the literature as to the exact extent of theprecursor. Morl and Marchfelder (2001) estimate a lengthof only 5–15 nt for the 39 trailer, while recent deepsequencing data show that this length often exceeds 20 nt(e.g., Lee et al. 2009). Consistent with these findings, itis not surprising that our method very often predictsa signal that not only covers the complete mature tRNA,but also extends in both the 59 and 39 direction, indicatingthat the putative precursors may also form structures out-side of the range of the mature products of functionalimportance. In the two examples given in Figure 2, C and D(respective FlyBase IDs tRNA:H:48F and tRNA:N5:42Af),we compare the predictions with precursors described inthe literature. In the case of tRNA:N5:42Af, RNAz predictsa 39 extension, whereas LocARNA-P unveils a signal in the59-flanking region. The latter is consistent with the obser-vation (Lofquist and Sharp 1986) that the 59-flankingregions of the tRNA5
Asn genes differentially arrest RNApolymerase III.
This disagreement between RNAz and LocARNA-Pconcerning the 59- and 39-flanking regions motivated usto look at the length distributions of 59- and 39-flankingregions of tRNAs as predicted by LocARNA-P. If theseextensions were only due to random fluctuations, then onewould assume the same distribution for both 59 and 39
regions. However, Figure 3A shows that the distributionsare significantly different. Whereas the predicted 39 endscoincide well with the mature tRNA, LocARNA-P tendsto detect an additional structure signal in the 59 region.The nonrandomness of this signal strongly suggests thatLocARNA-P detects a true signal for structural conserva-tion in the 59 part of the tRNA precursors.
Improving discrimination power of ncRNA screens
All current predictors of structural RNA suffer from ahigh false discovery rate. In many cases, e.g., for exper-imental analysis, one is interested in selecting a smallset of high-confidence predictions. In an RNAz screen,the most straightforward and common method forthis purpose is to rely on RNAz’s own evaluation andincrease the threshold for positive predictions. Note thatRNAz evaluates a locus by the maximal ncRNA classprobability ‘‘RNAz max P’’ of the contributing windows,since RNAz originally predicts probabilities that eachsingle window contains ‘‘structural RNA’’ and thencombines overlapping windows with P $ 0.5 into a‘‘locus.’’
We propose an alternative strategy that rescores eachRNAz prediction based on its LocARNA-P STAR profileand boundary prediction. We compared the resultingLocARNA-P discriminator with the currently used RNAzmax P discriminator for discriminating RNAz loci, whichthemselves are predictions of the RNAz screen. To avoidconfusion, we emphasize that this differs from estimat-ing the false discovery rates of either tool RNAz orLocARNA-P.
FIGURE 3. (A) Distribution of predicted lengths of 59 and 39 flanking regions for tRNAs. The figure omits four outliers with 39-trailers longerthan 100. (B) Discriminating ncRNAs. ROC curves for discriminating RNAz loci, which are positives of an RNAz screen, by RNAz itself (usingRNAz max P) and after rescoring with LocARNA-P by the STAR discriminator.
Will et al.
906 RNA, Vol. 18, No. 5
Cold Spring Harbor Laboratory Press on April 15, 2013 - Published by rnajournal.cshlp.orgDownloaded from
For our experiment, we select a positive data set con-sisting of the 287 annotated RNAz loci in fly determined forthe previous experiment. For the negative set, we generated250 RNAz decoy alignments that consist of windows withRNAz P-score $ 0.5 by shuffling. For shuffling, we applya greedy strategy based on the tool rnazRandomizeAln.plof RNAz. The details are described in Materials andMethods. We preferred this strategy over a generate-and-test approach, which is computationally expensive sinceshuffling a large locus consisting of several windows willrarely result in a RNAz decoy locus.
The resulting Figure 3B shows that the novel strategyretains significantly more true positives for a given im-provement in specificity. The lower ROC curve displays theeffect of using a higher RNAz threshold between 0.5 and1.0, as commonly used to reduce the false discovery rate.The upper curve shows the characteristic of the STAR-based discriminator. For the negative set, we furthermoreextended the decoy loci alignments by their shuffledoriginal alignment context and obtained the context-extended sequences as described in the previous sectionfor the positive locus alignments. For positive and negativeexamples, we computed the LocARNA-P STAR profile ofthe corresponding locus. From these profiles, we predictedboundaries and determined the average columnwise STARinside and outside of the predicted boundaries. The ‘‘STARdiscriminator’’ is defined as the difference between averageinside and outside reliability.
The discriminative power of the two measures, given asthe area under the curve (AUC), is estimated at 0.71 forRNAz max P compared with 0.87 for the new STAR-basedmeasure. This suggests that LocARNA-P significantly im-proves the discriminative power over RNAz alone whenpost-processing de novo ncRNA screens by RNAz.
Correlation of the STAR score
The structure-based alignment reliability STAR is a novelfeature that has not been used in ncRNA screens before.11
Thus, we compared the STAR score with features thathave been previously applied to measure the quality ofsequence–structure alignment within the prediction ofncRNAs. To this end, we investigated how well certainfeatures—including the average pairwise sequence identity(APSI), the structural conservation index (SCI) (Washietlet al. 2005a), and the STAR score—correlate with align-ment quality on a benchmark set of 10-way (reference)alignments from the Rfam database. For each benchmarkalignment, we realigned the sequences using LocARNA-Pand compared the produced alignment with the referencealignment using the compalign score. The latter measures
the similarity between two multiple alignments; it refers tothe sum-of-pairs score (SPS) introduced with Bralibase 2.1(Wilm et al. 2006).
Correlation plots are provided as Supplemental Figure 1.We observed that the SCI does not correlate well with thequality of the alignments as measured by the compalignscore. APSI shows better correlation (0.69), which is ex-pected because sequences with high APSI are much easierto align than sequences with low APSI. However, thehighest correlation (0.78) is achieved by the STAR score.To rule out the possibility that this correlation is observedonly in LocARNA-P-generated alignments, we also calcu-lated the STAR scores for alignments that were producedby a second sequence–structure alignment method (Lara)(Bauer et al. 2007). We found a very strong correlation(0.99) between the STAR scores for the alignments of thedifferent methods. This finding indicates that LocARNA-PSTARs yield a very good general model of sequence–structurealignment.
DISCUSSION
Finding structurally conserved regions is one of the maintasks in the analysis of noncoding RNA. Approaches usingsequence alignments as input heavily rely on alignmentquality and are thus strongly limited by the low availabilityof high-quality alignments. Sankoff-style methods for thesimultaneous alignment and folding of the homologousRNA sequences overcome this limitation and are thus con-sidered the gold standard for that purpose. However, thebiological interpretation of such alignments poses majorproblems because straightforward resampling methods,which are routine in assessing the significance of pair-wise sequence alignments, are precluded by their exten-sive resource consumption.
By defining the sequence and structure similarity-basedalignment reliabilities STARs, we introduced novel mea-sures of the local and global quality of sequence–structurealignments. The STAR score can even be used to analyzethe quality of alignments computed by independent methods.Furthermore, they improve the prediction of ncRNAs.Columnwise STARs, which capture the confidence in spe-cific alignment columns, are calculated from match proba-bilities. In addition, we distinguish STARs for nonstructuraland structural columns, as well as STARs for structurallyaligned column pairs; we have shown that this efficientlydiscriminates structural regions from nonstructural regionsof the alignment. The STAR profile plots allow visual in-spection and interpretation.
The STAR score, based on columnwise STARs, turnedout to be highly correlated with the alignment quality ofsequence–structure alignments, where quality is understoodin terms of similarity to reference alignments measuredby the compalign score. The correlation is independent ofwhether these alignments were generated by LocARNA-P
11Interestingly, the term reliability has been used in the related contextof RNA structure prediction before, albeit obviously with a very differentdefinition (Knudsen and Hein 2003).
LocARNA-P: RNA boundary prediction and detection
www.rnajournal.org 907
Cold Spring Harbor Laboratory Press on April 15, 2013 - Published by rnajournal.cshlp.orgDownloaded from
or other tools. This result shows that STARs capture generalproperties of correct sequence–structure alignments. Re-markably, the structural conservation index (SCI), reportedin Gruber et al. (2008b) as the best method for detectingconserved secondary structure in sequence alignments, is amuch worse measure of the alignment quality of sequence–structure alignments.
Furthermore, the STAR profiles can even be used toimprove the computational prediction of ncRNA tran-scripts. We evaluated the two most important tasks ofsuch an analysis. Albeit we performed this study for a denovo ncRNA prediction by RNAz, the suggested refinementwould as well work for other RNA predictors. In addition,the method enables further analysis of deep-sequencingexperiments (RNA-seq); for example, it can detect struc-tural motifs in discovered transcripts, whereas RNA-seqcannot distinguish between structural and unstructural RNA.Furthermore, it is not straightforward to define the exactboundaries of transcripts from RNA-seq data (Langenbergeret al. 2009); among the reasons are processing of ncRNAprecursors, degradation products, and sequencing artifacts.Here, LocARNA-P provides additional hints on the trueboundaries.
In our study, we determined accurate ncRNA bound-aries for RNAz predictions from the projected STARprofiles; in particular, we improved the boundary accu-racy by a factor of 3 from a median deviation of 47 to13 nt. Boundary prediction is of particular importancebecause incorrect boundaries compromise all subsequentanalysis steps that require a model of the secondary struc-ture. Furthermore, based on the profile combined with thepredicted boundaries, we computed a new discriminator forncRNAs. Applied in the post-processing step of an RNAzscreen, this discriminator is significantly stronger indistinguishing true RNAz predictions from false-positivepredictions than the max P discriminator that is currentlyproposed by RNAz for this purpose. This improvement is ofparticular relevance because it reduces the number ofncRNA candidates for subsequent, more expensive, analy-sis steps.
MATERIALS AND METHODS
Efficient calculation of match probabilities
The match probabilities are efficiently calculated by LocARNA-Pusing dynamic programming for computing partition functionsinside and outside of subsequence pairs Ai . . . Aj and Bk . . . Bl.Finally, these partition functions are combined for obtainingprobabilities. The use of inside and outside algorithms for thispurpose is well known from stochastic context-free grammars.However, a naive application of this algorithm results in a veryhigh time complexity of O(n6) and space complexity of O(n4),where n is the length of the input sequence. This rapid growth ofspace and time requirements with the input size would limit thealgorithm to only small instances. As we describe in detail in the
Appendix, we calculate the match probabilities in a much lowercomplexity of O(n4) time and O(n2) space, which is essential forthe applicability of the approach in practice. This low complexityof LocARNA-P, as well as of LocARNA, results from the use ofsparsity at the structure level. LocARNA (Will et al. 2007)introduced this use of sparsity to Sankoff-style approaches. Thesame idea is found in FoldAlignM (Torarinsson et al. 2007) andwas later picked up by RAF (Do et al. 2005). Interestingly, RAF(Do et al. 2005) combines sparsity at the structure and sequencelevel, a combination first seen in Stemloc (Bradley et al. 2008),which further improves the efficiency of Sankoff-style methods atthe cost of strong sequence-based heuristics.
Predicting boundaries from a STAR profile
We predict the regions of conserved secondary structure from aSTAR profile by fitting a two-step function to the profile. Ex-tending the idea of least-squares fitting, the quality of a fit is thesum of square deviations plus a penalty D for each switch betweenthe values a and b. For a given a and b, the optimal fit is cal-culated by an exact approach using dynamic programming.Instead of fitting all profiles with the same a and b values, wedetermine optimal values of a and b for each STAR profile usinggradient descent optimization.
Formally, let f:{1, . . ., n} / R denote a STAR profile of lengthn, i.e., f(q) = seqSTARA(q) + v strSTARA(q). We fit a two-stepfunction g to f, such that g approximates f as well as possible.Therefore, we determine constants a and b, such that
+n
i = 1 f ið Þ � g ið Þð Þ2 + d f i� 1ð Þ; f ið Þð Þ D
is minimal for all g: 1, . . ., n / {a, b}, where d(x, x) = 0 andd(x, y) = 1 for x 6¼ y, D 2 R is a penalty for switching betweenthe values of g, and g(0): = a. Basically, we perform a least-squaredistance approximation of f extended by a penalty term. Thelarger value of a and b represents the signal level, whereas thesmaller value represents the background.
For given constants a and b, an optimal function g can becomputed by dynamic programming. For this purpose, we solvethe recursion equations
A ið Þ= f ið Þ�að Þ2 + min A i � 1ð Þ; B i � 1ð Þ+ Dð ÞB ið Þ= f ið Þ�bð Þ2 + min A i�1ð Þ+ D;B i � 1ð Þð Þ
ð3Þ
with initialization A(0) = 0 and B(0) = 0 for A(n) and B(n) andobtain g by traceback.
For finding optimal constants a and b, we formulate a partitionfunction variant of these equations. Minimizing the partitionfunction ZA(n) + ZB(n) by gradient descent optimization, wedetermine optimal constants a and b. Note that we choose tooptimize ZA(n) + ZB(n) instead of the cost A(n) + B(n), becausefor the partition function recursions, one can calculate partialderivatives. At sufficiently low temperature, such constants willalso minimize the cost A(n) + B(n). More details are given in theSupplemental Material.
Generating decoy locus alignments
Rose et al. (2007) define an ‘‘RNAz locus alignment’’ as a slice ofthe 12-flies whole-genome alignment that is covered by window
Will et al.
908 RNA, Vol. 18, No. 5
Cold Spring Harbor Laboratory Press on April 15, 2013 - Published by rnajournal.cshlp.orgDownloaded from
alignments of at most 120 columns with RNAz probability ofP $ 0.5 for either the + or � strand. A ‘‘decoy locus alignment’’ iscovered by windows with RNAz probability P $ 0.5 and hasidentical length, base composition, and gap pattern and similarconservation pattern to an existing RNAz locus alignment. How-ever, a decoy locus alignment is not contained in any genomealignment and therefore cannot be a true positive.
We generate such decoys from true RNAz locus alignmentsby gentle shuffling as described in Rose et al. (2007). Gentleshuffling randomly permutes alignment columns but exchangesonly columns with identical gap pattern and similar sequenceconservation. We apply gentle shuffling to successive non-over-lapping windows in the locus alignment but do not shuffleoverlapping windows to maintain the locality of the base com-position and conservation pattern. To speed up the approach forlarger loci, we apply a greedy strategy and allow several attemptsper window (at most 25 times) until RNAz evaluates to P $ 0.5.Each window of the resulting alignment is tested for coverage byRNAz P $ 0.5 windows in exactly the way of Rose et al. (2007).Finally, decoy context is generated by gentle shuffling of theoriginal context in the whole-genome alignment.
Benchmarks
We measure the performance of LocARNA-P using the Bralibase2.1 (Wilm et al. 2006) benchmark set. We have shown (Supple-mental Fig. 4) that there is a significant improvement in thequality of multiple alignment compared with competing methods(Supplemental Material).
Running LocARNA-P
Information on obtaining the LocARNA-P software can be foundunder Supplemental Material. The Supplemental Material providesextensive documentation of the software. The core functionalityof LocARNA-P is accessible via parameters of LocARNA’s mul-tiple alignment tool mlocarna. mlocarna provides a high-levelinterface to the low-level C++ tools for computing pairwisealignments and match probabilities in the LocARNA package.Reading multiple input sequences in fasta format, mlocarna withoption ‘‘probabilistic’’ computes a multiple alignment and col-umnwise STARs. All results, including columnwise sequence andstructure reliabilities, are written to text files. Further functional-ity, like computing the STAR score and estimating ncRNA bound-aries, is accessible via scripts. In particular, we provide scripts anddocumentation for running the refinement of an RNAz screen,including the generation of reliability profile plots.
SUPPLEMENTAL MATERIAL
Supplemental Material is available for this article on both thejournal site and at http://www.bioinf.uni-freiburg.de/Supplements/LocARNA-P/. LocARNA-P can be downloaded as part of theLocARNA software package, which is freely available under theGNU general public license.
ACKNOWLEDGMENTS
This work was supported by the German Research Foundation(grants BA 2168/3-1 as well as BA 2168/2-2, STA 850/7-1 [under
the auspices of SPP-1258 ‘‘Sensory and Regulatory RNAs inProkaryotes’’], the Excellence Initiative of the German Federaland State Governments [EXC 294 to R.B.], and WI 3628/1-1);ESF grant no. 14494 (administered by the Sachsische AufbauBank);the German Federal Ministry of Education and Research (BMBFgrant 0313921 FRISYS); and the Austrian Gen-AU project ‘‘Reg-ulatory ncRNAs.’’ We thank the anonymous reviewers for theirvaluable comments.
APPENDIX: THE LocARNA-P ALGORITHM
In this Appendix, we explain the dynamic programmingalgorithm of LocARNA-P and the necessary foundationsdue to LocARNA in formal detail. Recall that in the Re-sults, we defined probabilities for matches in the alignmentof two RNA sequences A and B with associated base-pairprobability matrices PA and PB, respectively. Suitable matricesare usually obtained from the respective RNA sequenceusing McCaskill’s algorithm (RNAfold -p). The probabil-ities are defined on the basis of the alignment score ofLocARNA, by assuming a Boltzmann distribution of align-ment consensus structure pairs. This allows building on theestablished LocARNA score. After describing the LocARNAscore and the algorithm of LocARNA, we present the algo-rithm of LocARNA-P, which efficiently computes theseprobabilities. The use of these probabilities in a probabi-listic consistency transformation for progressive multiplealignment and iterative alignment refinement is discussedin the Supplemental Material.
Preliminaries: RNA alignment by LocARNA
LocARNA is a Sankoff-style algorithm, which simulta-neously folds and aligns RNA sequences. The originalSankoff algorithm (Sankoff 1985) provides a general solu-tion to the problem of simultaneously computing an align-ment and a common secondary structure of the twoaligned sequences. Without heuristic restrictions, the prob-lem requires O(n6) CPU time and O(n4) memory, where nis length of the RNA sequences to be aligned. In contrastto Sankoff-style methods like FoldAlign (Havgaard et al.2005) and dynalign (Mathews and Turner 2002), PMcomp(Hofacker and Stadler 2004) and LocARNA use structuremodels of the RNAs, which are reasonably obtained usingMcCaskill’s algorithm (McCaskill 1990) on the basis of afull-featured energy model.
Alignment score
Define the single-stranded part of the alignment, denotedby As, by: if i z k 2 As, then there is no pair j zl such that(i, j) z (k, l) 2 S or (j, i) z (l, k) 2 S.
LocARNA determines the pair (A, S) that maximizes thescore function:
Sc A;Sð Þ= +i;jð Þz k;lð Þ2S
t i; j; k; lð Þ+ +izk2As
s i; kÞ � Ngapg;�
LocARNA-P: RNA boundary prediction and detection
www.rnajournal.org 909
Cold Spring Harbor Laboratory Press on April 15, 2013 - Published by rnajournal.cshlp.orgDownloaded from
where t(i, j; k, l) is the score for matching the arcs (i, j)and (k, l), s(i, k) is the similarity score for a (mis)matchof positions i and k in A and B, respectively, g is the gapscore parameter, and Ngap is the number of insertions anddeletions in the alignment A. Although we define andhenceforth discuss only linear gap cost to ease presenta-tion, the actual LocARNA score features affine gap cost,which is supported by LocARNA, as well as by our imple-mentation of LocARNA-P, with very moderate space andtime overhead.
We use arc-match scores
t i; j; k; lð Þ := CAij + CB
kl;
where CAij and CB
kl are base-pair scores that are derivedfrom the base-pairing probability matrices of the two in-dividual sequences. More precisely, we define:
CXij = log
PXij
pX0
.log 1
pX0
if PXij $ p�
�‘ otherwise;
(ð5Þ
where PXij is the equilibrium pairing probability for se-
quence X 2 {A, B} as computed by McCaskill’s algorithm(McCaskill 1990), PX
0 is the expected probability for apairing to occur at random in sequence X, and p* is thecut-off probability, below which the arcs are ignored.Formally, this is expressed by assigning �N as weight inthis case. We call base pairs with probability $p* ‘‘signif-icant.’’ The term log pX
ij
.pX
0 is the log-odds score for havinga specific base-pairing against the null model of a randompairing, and log 1=pX
0 is a normalization factor that trans-forms the weights to a maximum of 1. This normalizationis introduced to ease balancing the sequence score againstthe structure score.
LocARNA-P uses exactly the same scoring functionas LocARNA. However, it does not maximize the scoreaccording to this function but computes match probabil-ities based on this scoring function. How match probabil-ities relate to the scoring function is detailed in the ‘‘MatchProbabilities’’ section of Results.
Efficient alignment using base-pair probabilities
LocARNA maximizes its score by efficiently evaluating arecursion equation using dynamic programming. The es-sential improvement of LocARNA over PMcomp is due toconsidering only significant base pairs in predicted struc-tures. As we argued earlier (Will et al. 2007), by filtering wekeep only O(n) significant base pairs in each sequence andonly O(1) that share a given right end. Consequently,LocARNA improves the time complexity of PMcomp fromO(n6) to O(n4) and, even more importantly, the spacecomplexity from O(n4) to O(n2). The favorable time andspace complexity of LocARNA is retained when extendingthe approach for the computation of match probabilities
in LocARNA-P. Because of this structural analogy of thealgorithms, we review the recursion structure of LocARNAin detail.
Both PMcomp and LocARNA define two four-dimensional(4D) matrices M and D that are filled recursively. Mij;kl is de-fined as the maximal score of an alignment of subsequencesAi..j and Bk..l. Dij;kl is the best score of an alignment of Ai..j
and Bk..l with the additional condition that the base pairs (i, j)and (k, l) are matched. The LocARNA/PMcomp recursioncan be written in the form:
Mi i�1;k k�1 = 0
Mi j;k l = max
Mi j�1;k l�1 + s j; lð ÞMi j�1;k l�1 + g
Mi j;k l�1 + g
maxj0 l0 Mi j0�1;k l0�1 + Dj0 j;l0l
8>>><>>>:
Di j;k l = Mi + 1j + 1;k�1 l�1 + t i; j; k; lð Þ:
In contrast to PMcomp, LocARNA evaluates this re-cursion keeping only O(n2) entries in memory at any time.Due to the restriction to significant base pairs, the fourthcase of the M recursion runs over only O(1) pairs of sig-nificant base pairs; consequently, the total algorithm hasO(n4) time complexity.
For space complexity, we first observe that D-entriesare needed only for matches (i, j) z (k, l) of significantbase pairs, which are only O(n2) many matches. Thus, theD-matrix can be easily represented by a two-dimensional(2D) matrix indexed by base pairs. Second, due to thespecial structure of the M recursion, which fixes the leftsubsequence ends i and k, we can compute all entriesDid;kd recursing only to entries Mi+1d;k+1d.
12 Thus, a singleO(n2) sized M matrix is sufficient for the computation ofall Did;kd, since the matrix can be reused for all left ends iand k.
An extension that explicitly incorporates base-pairstacking without increasing complexity is described byBompfunewerer et al. (2008).
LocARNA-P’s core algorithm: Partition functionversion of LocARNA
The calculation of alignment match probabilities byLocARNA-P is based on partition functions. Recall thatthe probability of a pair of alignment and consensusstructure (A, S) is given by
Pr A;Sð ÞjA;B½ �= exp �bSc A;Sð Þð ÞZ�1AB
12We introduce notation using index d as a wildcard. For example,Mi+1d;k+1d refers to the matrix slice of entries Mi+1j;k+1l, where i + 1 # j # nand k + 1 # l # m. We freely use analogous notation in the following.
Will et al.
910 RNA, Vol. 18, No. 5
Cold Spring Harbor Laboratory Press on April 15, 2013 - Published by rnajournal.cshlp.orgDownloaded from
where the partition function ZAB for sequences A and B isdefined as
ZAB : = +A;Sð Þ of A;B
exp �bSc A;Sð Þð Þ
and b is a parameter that controls the distribution, calledthe ‘‘inverse temperature.’’
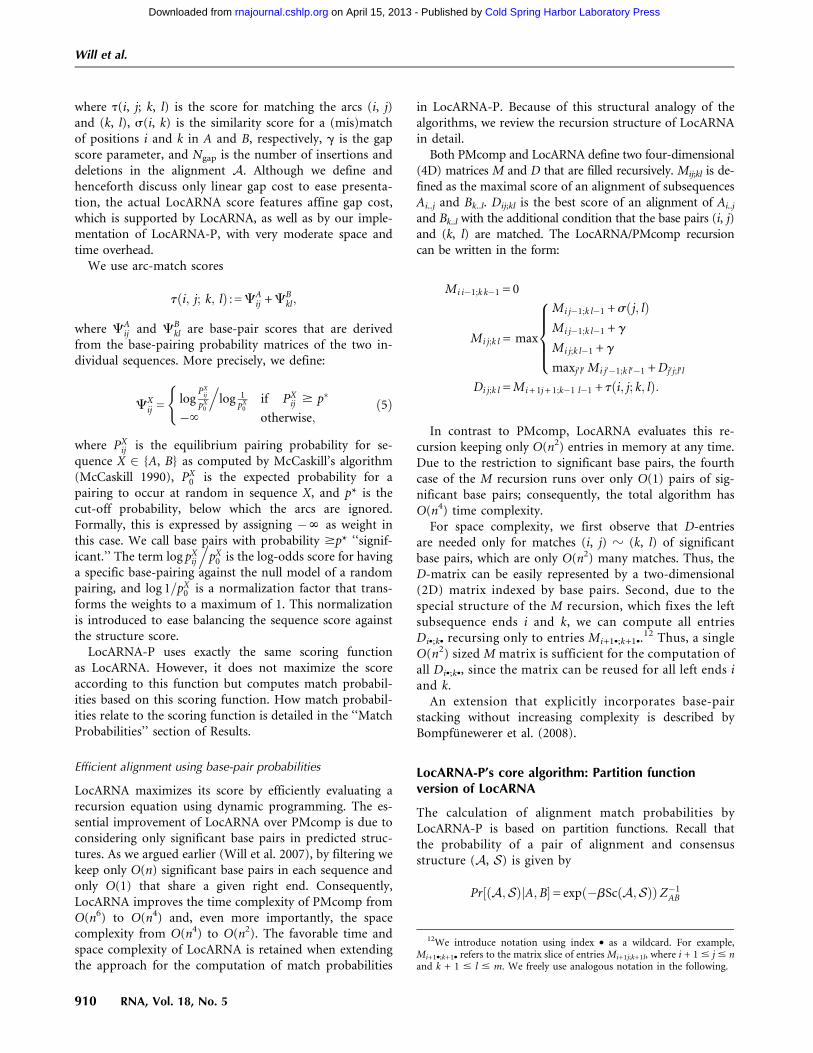
Calculating match probabilities in LocARNA-P consistsof three phases, which are comparable to the algorithmof Hofacker and Stadler (Hofacker et al. 2004) but gobeyond this algorithm in terms of complexity. First, aninside dynamic programming algorithm computes insidepartition functions. This part of the LocARNA-P algorithmhas the same recursion structure as the LocARNA algo-rithm. Second, a corresponding outside algorithm calcu-lates outside partition functions. We devise a dynamicprogramming algorithm that computes these values in thegiven complexity envelope. Finally, we show how to obtainthe single-base and base-pair match probabilities. Again,this phase remains within the complexity bounds.
Inside algorithm
We define two 4D matrices:
ZMi j;k l = + exp �b Sc A;Sð Þð Þ
A alignment ofAi::j and Bk::l;S consensus secondarystructure forA
��������
8>><>>:
9>>=>>;
and
ZDi j;k l = + exp �b Sc A;Sð Þð Þ
A alignment ofAi::j and Bk::l;S consensus secondarystructure forA;where i; jð Þz k; lð Þ 2 S
����������
8>>>><>>>>:
9>>>>=>>>>;
Note that ZDi j;k l is valid (and later has to be computed) only
for significant13 base pairs (i, j) and (k, l).The matrix entries are recursively computed by the
following equations (cf. Fig. 4A):
ZMi i�1;k k�1 = 1
ZMi j;k l = +
ZMi j�1;k l�1 � exp �bsðj; lÞð Þ
ZMi j�1;k l � exp �bgð Þ
ZMi j;k l�1 � exp �bgð Þ
+j0 l0ZMi j0�1;k l0�1 � ZD
j0 j;l0 l
8>>>>><>>>>>:
ZDi j;k l = ZM
i + 1j + 1;k�1 l�1 � exp �bt i; j; k; lð Þð Þ:
These equations are a direct translation of the LocARNArecursion to its partition function variant. The transla-tion is straightforward because the decomposition of theLocARNA recursion is unambiguous. Finally, the totalpartition function is obtained as ZAB = ZM
1n; 1 m.A good space and time complexity is achieved using
the same ideas as in the original LocARNA recursionfor maximizing the score. When evaluating the recursionfor ZM
1 n; 1 m, we compute and store the entries ZDi j; k l for
significant base pairs (i, j) and (k, l). A computation orderof increasing j � i avoids dependency conflicts. The entriesrequire O(n2) space due to the number of significant basepairs. Note that the matrix ZD is conveniently implementedas a 2D array that is indexed with base pairs. One entryZD
i j; k l depends only on entries of the matrix slice ZMi � ;k� and
other values in ZD. Therefore, efficient computation re-quires only O(n2) additional space for the matrix slice. Thematrix slice is implemented as a 2D array, which is reusedfor the computation of each ZD entry. Time complexity isonly O(n4), since computing one entry in ZM is performedin time O(1/p*) = O(1), when only significant base pairs areconsidered.
The outside algorithm needs to access ZD, hence thismatrix is kept in memory throughout.
Outside algorithm
The outside algorithm computes partition functions ofalignments outside of subsequences Ai..j and Bk..l and cor-responding consensus structures. An alignment of A and Boutside i..j and k..l contains only matches i9 z k9, wherei9 < i and k9 < k or j < i9 and l < k9.
We define
Z 0Mi j;k l = + exp �b Sc A;Sð Þð Þ
A alignment of A and Boutside i::j and k:: l;S consensus secondarystructure forA:
��������
8>><>>:
9>>=>>;
Z 0Di j;k l is valid only for i, j, k, and l, where significant basepairs (i, j) and (k, l) exist for PA and PB, respectively. Then,it is defined as Z 0Di j;k l : = Z 0Mi j;k l and is understood as thepartition function outside of the match of base pairs (i, j)and (k, l). Note that we introduce the extra matrix Z9D forpreparing the space optimization.
The matrix entries are recursively computed after ini-tialization Z 0Mi n; k m = ZM
1i�1; k�1 by
Z 0Mi j;k l = +
Z 0Mi j + 1;k l + 1 � expð�bsðj; lÞÞZ 0Mi j + 1;k l � exp �bgð ÞZ 0Mi j;k l + 1 � exp �bgð Þ+i0 < i;k0 < kZ 0Di0 j + 1;k0 l + 1 � ZM
and Z 0Di j;k l = Z 0Mi j;k l. An illustration of the underlying de-composition is given in Figure 4B.
So far, the recursion follows the lines of Hofacker andStadler (Hofacker et al. 2004). However, we restructure theevaluation of these recursions in LocARNA-P in order tomaintain the complexity bounds. For initialization, we usethe inside matrix slice ZM
�1;�1, which can be recomputed inO(n2) time.14
Then, we compute all entries Z 0Di j;k l for significant basepairs (i, j) and (k, l) in the order from outside to inside,i.e., for decreasing distances j � i. As in the case of theinside partition functions, Z9D is implemented as a 2Darray of size O(n2). For obtaining all entries Z 0Di�;k�, we filla matrix slice Z 0Mi�;k�. During this computation for fixed iand k, we recurse to four different kinds of matrix entries.First and second, we recurse to entries of matrices Z9D andZD. Both are maintained in O(n2) space, and dependenciesare resolved due to computation order. The same holds forthe third kind of entries in the matrix slice Z 0Mi�;k�, wheredependencies are resolved by computation of entries Z 0Mi j;k l
in the order of decreasing j and l. However, there is a fourthkind of entry, namely, those of the form ZM
�i;�k. This matrixslice is recomputed in O(n2) time each time before we startfilling a matrix slice Z 0Mi �;k � . Clearly, this slice adds anotherspace of O(n2). The space for the matrix slices Z 0Mi�; k� andZM�i;�k is reused for each left end i and k of significant base
pairs.Despite the necessary recomputation of slices ZM
�i;�k, thetime complexity is O(n4). Here, we argue again that sum-mations run only over pairs of significant arcs and, con-sequently, take constant time.
Calculation of alignment match probabilities
The probability of a structural alignment match is easilycomputed as
P i; jð Þz k; lð ÞjA;Bð Þ=1
ZAB� ZD
i j;k l � Z 0D
i j;k l
from the efficiently computed matrices ZD and Z9D.
Computing the probabilities of base matches requires acase distinction on the ‘‘immediately enclosing’’ arc match(i, j) z (k, l) of a base match x z y. P(x z y|A, B) isefficiently computed as
exp �bs x; yð Þð ÞZAB
+ði;jÞzðk;lÞ
Z 0Di j;k l
�exp �bt i; j; k; lð Þð Þ�ZM
i + 1x�1;k + 1y�1
�ZMx + 1j�1;y + 1 l�1
0BBB@
1CCCA
+ ZM1x�1;1y�1 � ZM
x + 1 n;y + 1m
0BBBBB@
1CCCCCA: ð6Þ
Note that we need to cover the case of no enclosing arcmatch explicitly.
The quadratic space envelope requires recomputation ofZM
i + 1�;k + 1� and ZM�k�1; �l�1, for each (i, j) z (k, l). Given ZD,
all ZMi + 1�;k + 1� can be clearly recomputed in O(n2). Note that
also all ZM�k�1; � l�1 can be recomputed in O(n2) by a right-
reducing variant of the given left-reducing recursion for thematrix ZM.
For efficient evaluation, one regroups the computationby iterating over all (i, j) z (k, l) and accumulating theprobability contributions of each arc pair to all P(x z y|A,B). In this way, recomputation causes a time complexity ofO(n4) for the computation of all base match probabilities.However, this computation is still an expensive step ofthe entire algorithm. Considering only pairs of arcs with amatch probability $p* (or some independently chosen cut-off probability) is a reasonable, easily applicable heuristicthat reduces the cost of this computation step in practice.
Received July 1, 2011; accepted January 18, 2012.
REFERENCES
Bauer M, Klau GW, Reinert K. 2007. Accurate multiple sequence–structure alignment of RNA sequences using combinatorialoptimization. BMC Bioinformatics 8: 271. doi: 10.1186/1471-2105-8-271.
Bertone P, Stoc V, Royce TE, Rozowsky JS, Urban AE, Zhu X, Rinn JL,Tongprasit W, Samanta M, Weissman S, et al. 2004. Globalidentification of human transcribed sequences with genome tilingarrays. Science 306: 2242–2246.
Bompfunewerer AF, Backofen R, Bernhart SH, Hertel J, Hofacker IL,Stadler PF, Will S. 2008. Variations on RNA folding and alignment:Lessons from Benasque. J Math Biol 56: 129–144.
FIGURE 4. Inside and outside decomposition by the recursions. (A) Inside. The gray inside regions correspond to the matrix ZM and the whiteinside region to ZD. (B) Outside. The gray outside regions correspond to entries in Z9M; the white outside region represents an entry of Z9D.
14In our implementation, we skip this recomputation, since the matrixis still available from the last step of the inside algorithm.
912 RNA, Vol. 18, No. 5
Will et al.
Cold Spring Harbor Laboratory Press on April 15, 2013 - Published by rnajournal.cshlp.orgDownloaded from
Bradley RK, Pachter L, Holmes I. 2008. Specific alignment of structuredRNA: Stochastic grammars and sequence annealing. Bioinformatics24: 2677–2683.
Chambers JM, Cleveland WS, Kleiner B, Tukey PA. 1983. Graphicalmethods for data analysis. Wadsworth/Cengage Learning, Florence, KY.
Cheng J, Kapranov P, Drenkow J, Dike S, Brubaker S, Patel S, Long J,Stern D, Tammana H, Helt G, et al. 2005. Transcriptional maps of10 human chromosomes at 5-nucleotide resolution. Science 308:1149–1154.
Clark AG, Eisen MB, Smith DE, MacCallum I. 2007. Evolution of genesand genomes on the Drosophila phylogeny. Nature 450: 203–218.
Coventry A, Kleitman DJ, Berger B. 2004. MSARI: Multiple sequencealignments for statistical detection of RNA secondary structure.Proc Natl Acad Sci 101: 12102–12107.
Do CB, Mahabhashyam MSP, Brudno M, Batzoglou S. 2005. ProbCons:Probabilistic consistency-based multiple sequence alignment. Ge-nome Res 15: 330–340.
Do CB, Foo C-S, Batzoglou S. 2008. A max-margin model for efficientsimultaneous alignment and folding of RNA sequences. Bioinfor-matics 24: i68–i76.
The FANTOM Consortium and RIKEN Genome ExplorationResearch Group and Genome Science Group. 2005. The transcrip-tional landscape of the mammalian genome. Science 309: 1559–1563.
Frendewey D, Dingermann T, Cooley L, Soll D. 1985. Processing ofprecursor tRNAs in Drosophila. Processing of the 39 end involvesan endonucleolytic cleavage and occurs after 59 end maturation.J Biol Chem 260: 449–454.
Gardner PP, Wilm A, Washietl S. 2005. A benchmark of multiplesequence alignment programs upon structural RNAs. Nucleic AcidsRes 33: 2433–2439.
Gorodkin J, Heyer L, Stormo G. 1997. Finding the most significantcommon sequence and structure motifs in a set of RNA sequences.Nucleic Acids Res 25: 3724–3732.
Gruber AR, Kilgus C, Mosig A, Hofacker IL, Hennig W, Stadler PF.2008a. Arthropod 7SK RNA. Mol Biol Evol 25: 1923–1930.
Gruber AR, Bernhart SH, Hofacker IL, Washietl S. 2008b. Strategiesfor measuring evolutionary conservation of RNA secondarystructures. BMC Bioinformatics 9: 122. doi: 10.1186/1471-2105-9-122.
Guerrier-Takada C, Gardiner K, Marsh T, Pace N, Altman S. 1983.The RNA moiety of ribonuclease P is the catalytic subunit of theenzyme. Cell 35: 849–857.
Harmanci AO, Sharma G, Mathews DH. 2008. PARTS: Probabilisticalignment for RNA joint secondary structure prediction. NucleicAcids Res 36: 2406–2417.
Havgaard JH, Lyngso RB, Stormo GD, Gorodkin J. 2005. Pairwiselocal structural alignment of RNA sequences with sequence simi-larity less than 40%. Bioinformatics 21: 1815–1824.
Heyne S, Will S, Beckstette M, Backofen R. 2009. Lightweightcomparison of RNAs based on exact sequence–structure matches.Bioinformatics 25: 2095–2102.
Hochsmann M, Toller T, Giegerich R, Kurtz S. 2003. Local similarityin RNA secondary structures. In Proceedings of ComputationalSystems Bioinformatics (CSB 2003), Vol. 2, pp. 159–168. IEEEComputer Society, Washington, DC.
Hofacker IL, Stadler PF. 2004. The partition function variant ofSankoff’s algorithm. In Computational science–ICCS 2004: 4thinternational conference, Krakow, Poland, June 6–9, 2004, proceedings,part IV (ed. M Bubak et al.), pp. 728–735. Springer Verlag,Heidelberg.
Hofacker IL, Bernhart SH, Stadler PF. 2004. Alignment of RNA basepairing probability matrices. Bioinformatics 20: 2222–2227.
Klein RJ, Eddy SR. 2003. RSEARCH: Finding homologs of singlestructured RNA sequences. BMC Bioinformatics 4: 44. doi: 10.1186/1471-2105-4-44.
Knudsen B, Hein J. 2003. Pfold: RNA secondary structure predictionusing stochastic context-free grammars. Nucleic Acids Res 31:3423–3428.
Lagos-Quintana M, Rauhut R, Lendeckel W, Tuschl T. 2001. Identifi-cation of novel genes coding for small expressed RNAs. Science 294:853–857.
Lau NC, Lim LP, Weinstein EG, Bartel DP. 2001. An abundant class oftiny RNAs with probable regulatory roles in Caenorhabditiselegans. Science 294: 858–862.
Lee R, Ambros V. 2001. An extensive class of small RNAs in Caeno-rhabditis elegans. Science 294: 862–864.
Lee YS, Shibata Y, Malhotra A, Dutta A. 2009. A novel class of smallRNAs: tRNA-derived RNA fragments (tRFs). Genes Dev 23: 2639–2649.
Lofquist A, Sharp S. 1986. The 59-flanking sequences of Drosophilamelanogaster tRNA5
Marz M, Donath A, Verstaete N, Nguyen VT, Stadler PF, Bensaude O.2009. Evolution of 7SK RNA and its protein partners in metazoa.Mol Biol Evol 26: 2821–2830.
Mathews DH, Turner DH. 2002. Dynalign: An algorithm for findingthe secondary structure common to two RNA sequences. J MolBiol 317: 191–203.
Mattick JS, Taft RJ, Faulkner GJ. 2009. A global view of genomicinformation—moving beyond the gene and the master regulator.Trends Genet 26: 21–28.
McCaskill JS. 1990. The equilibrium partition function and base pairbinding probabilities for RNA secondary structure. Biopolymers29: 1105–1119.
Missal K, Rose D, Stadler PF. 2005. Non-coding RNAs in Cionaintestinalis. Bioinformatics (Suppl 2) 21: ii77–ii78.
Missal K, Zhu X, Rose D, Deng W, Skogerbo G, Chen R, Stadler PF.2006. Prediction of structured non-coding RNAs in the genomesof the nematodes Caenorhabditis elegans and Caenorhabditisbriggsae. J Exp Zoolog B Mol Dev Evol 306: 379–392.
Morl M, Marchfelder A. 2001. The final cut. The importance of tRNA39-processing. EMBO Rep 2: 17–20.
Pedersen JS, Bejerano G, Siepel A, Rosenbloom K, Lindblad-Toh K,Lander ES, Kent J, Miller W, Haussler D. 2006. Identification andclassification of conserved RNA secondary structures in thehuman genome. PLoS Comput Biol 2: e33. doi: 10.1371/journal.pcbi.0020033.
Roshan U, Livesay DR. 2006. Probalign: Multiple sequence alignmentusing partition function posterior probabilities. Bioinformatics 22:2715–2721.
Sankoff D. 1985. Simultaneous solution of the RNA folding, alignmentand protosequence problems. SIAM J Appl Math 45: 810–825.
Siebert S, Backofen R. 2005. MARNA: Multiple alignment andconsensus structure prediction of RNAs based on sequencestructure comparisons. Bioinformatics 21: 3352–3359.
Smith CM, Steitz JA. 1998. Classification of gas5 as a multi-small-nucleolar-RNA (snoRNA) host gene and a member of the 59-terminal oligopyrimidine gene family reveals common features ofsnoRNA host genes. Mol Cell Biol 18: 6897–6909.
Torarinsson E, Sawera M, Havgaard JH, Fredholm M, Gorodkin J.2006. Thousands of corresponding human and mouse genomicregions unalignable in primary sequence contain common RNAstructure. Genome Res 16: 885–889.
Torarinsson E, Havgaard JH, Gorodkin J. 2007. Multiple structural align-ment and clustering of RNA sequences. Bioinformatics 23: 926–932.
www.rnajournal.org 913
LocARNA-P: RNA boundary prediction and detection
Cold Spring Harbor Laboratory Press on April 15, 2013 - Published by rnajournal.cshlp.orgDownloaded from
Torarinsson E, Yao Z, Wiklund ED, Bramsen JB, Hansen C, Kjems J,Tommerup N, Ruzzo WL, Gorodkin J. 2008. Comparativegenomics beyond sequence-based alignments: RNA structures inthe ENCODE regions. Genome Res 18: 242–251.
Uzilov AV, Keegan JM, Mathews DH. 2006. Detection of non-codingRNAs on the basis of predicted secondary structure formation freeenergy change. BMC Bioinformatics 7: 173. doi: 10.1186/1471-2105-7-173.
Washietl S, Hofacker IL. 2004. Consensus folding of aligned sequencesas a new measure for the detection of functional RNAs by com-parative genomics. J Mol Biol 342: 19–30.
Washietl S, Hofacker IL, Stadler PF. 2005a. Fast and reliable pre-diction of noncoding RNAs. Proc Natl Acad Sci 102: 2454–2459.
Washietl S, Hofacker IL, Lukasser M, Huttenhofer A, Stadler PF.2005b. Mapping of conserved RNA secondary structures predictsthousands of functional noncoding RNAs in the human genome.Nat Biotechnol 23: 1383–1390.
Will S, Reiche K, Hofacker IL, Stadler PF, Backofen R. 2007. Inferringnoncoding RNA families and classes by means of genome-scalestructure-based clustering. PLoS Comput Biol 3: e65. doi: 10.1371/journal.pcbi.0030065.
Wilm A, Mainz I, Steger G. 2006. An enhanced RNA alignmentbenchmark for sequence alignment programs. Algorithms Mol Biol1: 19. doi: 10.1186/1748-7188-1-19.