247
EPA 454/R-96-008
November 1996
LOCATING AND ESTIMATING AIR EMISSIONSFROM SOURCES OF 1,3-BUTADIENE
Prepared for:
Mr. Dennis BeauregardWork Assignment Manager
Emission Factor and Inventory GroupU. S. Environmental Protection Agency
Research Triangle Park, North Carolina 27711
Prepared by:
Eastern Research GroupPost Office Box 2010
Morrisville, North Carolina 27560-2010
November 1996
This report has been reviewed by the Office of Air Quality Planning and Standards, U.S.Environmental Protection Agency, and has been approved for publication. Mention of trade namesand commercial products does not constitute endorsement or recommendation for use.
EPA-454/R-96-008
iii
EXECUTIVE SUMMARY
The 1990 Clean Air Act Amendments contain a list of 189 hazardous air pollutants
(HAPs) which the U.S. Environmental Protection Agency must study, identify sources of, and
determine if regulations are warranted. One of these HAPs, 1,3-butadiene (butadiene), is the
subject of this document. This document describes the properties of butadiene as an air
pollutant, defines its production and use patterns, identifies source categories of air emissions,
and provides butadiene emissions data in terms of emission factors and national inventory
estimates. The document is a part of an ongoing EPA series designed to assist the general public
at large, but primarily State/local air agencies, in identifying sources of HAPs and determining
emissions estimates.
Butadiene is primarily used in the manufacture of synthetic elastomers (rubbers, latexes)
and for producing raw materials for nylon. Butadiene is emitted into the atmosphere from its
production, its use as a chemical feedstock in the production of other chemicals, the use of these
other chemicals, mobile sources, and from a wide variety of miscellaneous processes involving
fossil fuel and biomass combustion, petroleum refining, secondary lead smelting, and
wastewater treatment.
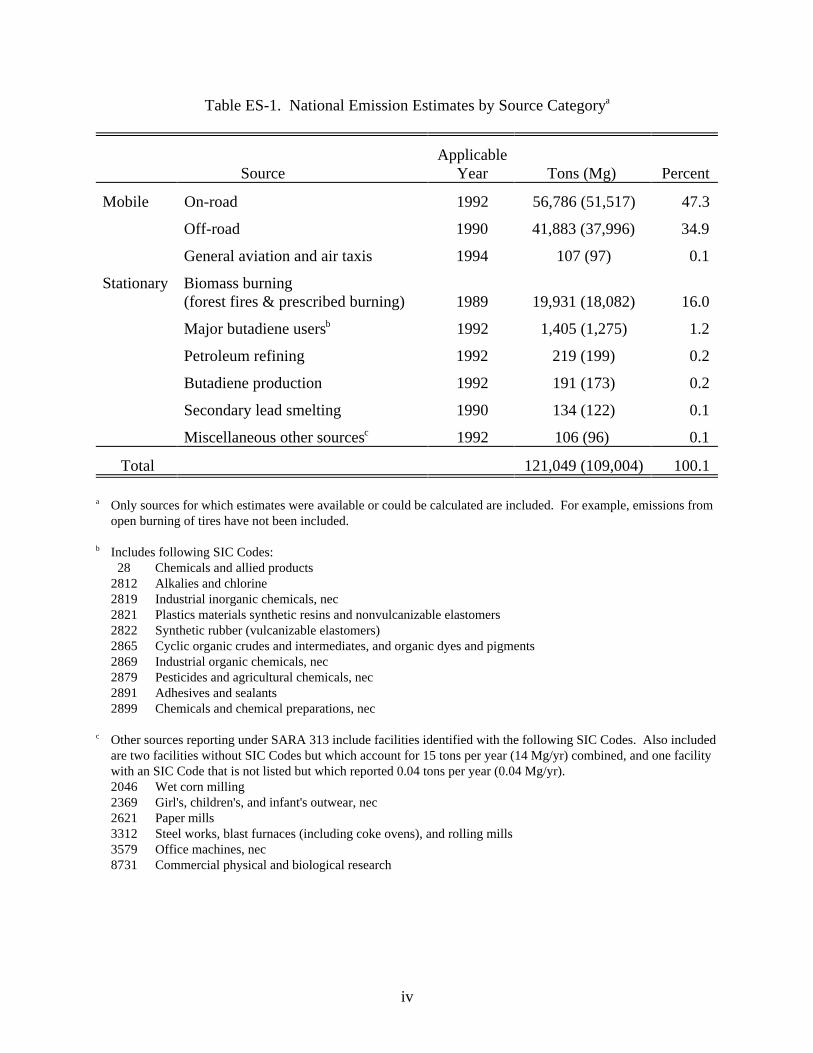
Including only sources for which estimates are available or can be calculated, total
nationwide emissions are estimated at 121,002 tons per year (109,775 Mg/yr). The primary
sources of butadiene emissions on a national level are on-road mobile (47%) and off-road
mobile (35%). Table ES-1 illustrates the national emissions estimates developed for the more
predominant butadiene categories. The main butadiene air emissions sources are on-road
mobile, off-road mobile, biomass burning, butadiene users, and petroleum refining. Some of
these estimates for the non-fuel combustion sources were obtained from the reports required
under the Superfund Amendment and Reauthorization Act (SARA), Title III, Section 313.
Other estimates are a function of national activity data combined with the best available
emission factors.
iv
Table ES-1. National Emission Estimates by Source Categorya
Source Year Tons (Mg) PercentApplicable
Mobile On-road 1992 56,786 (51,517) 47.3
Off-road 1990 41,883 (37,996) 34.9
General aviation and air taxis 1994 107 (97) 0.1
Stationary Biomass burning (forest fires & prescribed burning) 1989 19,931 (18,082) 16.0
Major butadiene users 1992 1,405 (1,275) 1.2b
Petroleum refining 1992 219 (199) 0.2
Butadiene production 1992 191 (173) 0.2
Secondary lead smelting 1990 134 (122) 0.1
Miscellaneous other sources 1992 106 (96) 0.1c
Total 121,049 (109,004) 100.1
Only sources for which estimates were available or could be calculated are included. For example, emissions froma
open burning of tires have not been included.
Includes following SIC Codes:b
28 Chemicals and allied products2812 Alkalies and chlorine2819 Industrial inorganic chemicals, nec2821 Plastics materials synthetic resins and nonvulcanizable elastomers2822 Synthetic rubber (vulcanizable elastomers)2865 Cyclic organic crudes and intermediates, and organic dyes and pigments2869 Industrial organic chemicals, nec2879 Pesticides and agricultural chemicals, nec2891 Adhesives and sealants2899 Chemicals and chemical preparations, nec
Other sources reporting under SARA 313 include facilities identified with the following SIC Codes. Also includedc
are two facilities without SIC Codes but which account for 15 tons per year (14 Mg/yr) combined, and one facilitywith an SIC Code that is not listed but which reported 0.04 tons per year (0.04 Mg/yr).2046 Wet corn milling2369 Girl's, children's, and infant's outwear, nec2621 Paper mills 3312 Steel works, blast furnaces (including coke ovens), and rolling mills3579 Office machines, nec8731 Commercial physical and biological research
v
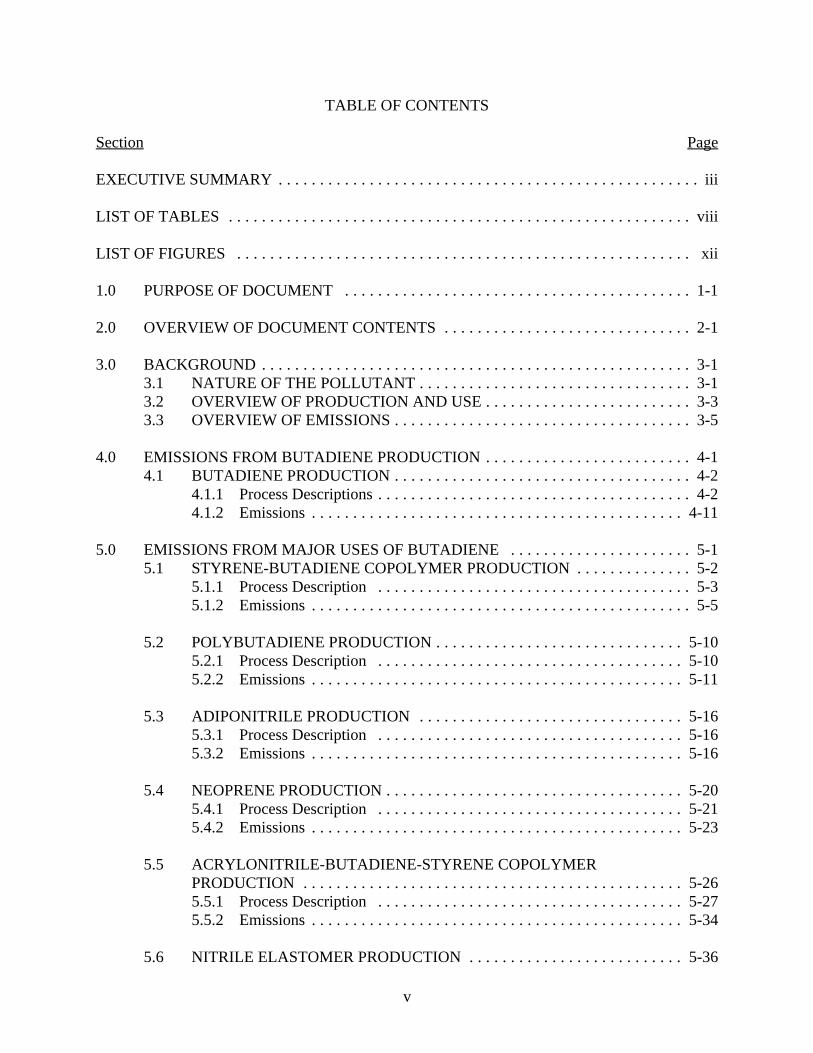
TABLE OF CONTENTS
Section Page
EXECUTIVE SUMMARY . . . . . . . . . . . . . . . . . . . . . . . . . . . . . . . . . . . . . . . . . . . . . . . . . . . iii
LIST OF TABLES . . . . . . . . . . . . . . . . . . . . . . . . . . . . . . . . . . . . . . . . . . . . . . . . . . . . . . . .viii
LIST OF FIGURES . . . . . . . . . . . . . . . . . . . . . . . . . . . . . . . . . . . . . . . . . . . . . . . . . . . . . . . xii
1.0 PURPOSE OF DOCUMENT. . . . . . . . . . . . . . . . . . . . . . . . . . . . . . . . . . . . . . . . . . 1-1
2.0 OVERVIEW OF DOCUMENT CONTENTS. . . . . . . . . . . . . . . . . . . . . . . . . . . . . . 2-1
3.0 BACKGROUND. . . . . . . . . . . . . . . . . . . . . . . . . . . . . . . . . . . . . . . . . . . . . . . . . . . . 3-13.1 NATURE OF THE POLLUTANT. . . . . . . . . . . . . . . . . . . . . . . . . . . . . . . . . 3-13.2 OVERVIEW OF PRODUCTION AND USE. . . . . . . . . . . . . . . . . . . . . . . . . 3-33.3 OVERVIEW OF EMISSIONS. . . . . . . . . . . . . . . . . . . . . . . . . . . . . . . . . . . . 3-5
4.0 EMISSIONS FROM BUTADIENE PRODUCTION. . . . . . . . . . . . . . . . . . . . . . . . . 4-14.1 BUTADIENE PRODUCTION. . . . . . . . . . . . . . . . . . . . . . . . . . . . . . . . . . . . 4-2
4.1.1 Process Descriptions. . . . . . . . . . . . . . . . . . . . . . . . . . . . . . . . . . . . . . 4-24.1.2 Emissions. . . . . . . . . . . . . . . . . . . . . . . . . . . . . . . . . . . . . . . . . . . . .4-11
5.0 EMISSIONS FROM MAJOR USES OF BUTADIENE. . . . . . . . . . . . . . . . . . . . . . 5-15.1 STYRENE-BUTADIENE COPOLYMER PRODUCTION. . . . . . . . . . . . . . 5-2
5.1.1 Process Description. . . . . . . . . . . . . . . . . . . . . . . . . . . . . . . . . . . . . . 5-35.1.2 Emissions. . . . . . . . . . . . . . . . . . . . . . . . . . . . . . . . . . . . . . . . . . . . . . 5-5
5.2 POLYBUTADIENE PRODUCTION. . . . . . . . . . . . . . . . . . . . . . . . . . . . . .5-105.2.1 Process Description. . . . . . . . . . . . . . . . . . . . . . . . . . . . . . . . . . . . .5-105.2.2 Emissions. . . . . . . . . . . . . . . . . . . . . . . . . . . . . . . . . . . . . . . . . . . . .5-11
5.3 ADIPONITRILE PRODUCTION . . . . . . . . . . . . . . . . . . . . . . . . . . . . . . . .5-165.3.1 Process Description. . . . . . . . . . . . . . . . . . . . . . . . . . . . . . . . . . . . .5-165.3.2 Emissions. . . . . . . . . . . . . . . . . . . . . . . . . . . . . . . . . . . . . . . . . . . . .5-16
5.4 NEOPRENE PRODUCTION. . . . . . . . . . . . . . . . . . . . . . . . . . . . . . . . . . . .5-205.4.1 Process Description. . . . . . . . . . . . . . . . . . . . . . . . . . . . . . . . . . . . .5-215.4.2 Emissions. . . . . . . . . . . . . . . . . . . . . . . . . . . . . . . . . . . . . . . . . . . . .5-23
5.5 ACRYLONITRILE-BUTADIENE-STYRENE COPOLYMERPRODUCTION . . . . . . . . . . . . . . . . . . . . . . . . . . . . . . . . . . . . . . . . . . . . . .5-265.5.1 Process Description. . . . . . . . . . . . . . . . . . . . . . . . . . . . . . . . . . . . .5-275.5.2 Emissions. . . . . . . . . . . . . . . . . . . . . . . . . . . . . . . . . . . . . . . . . . . . .5-34
5.6 NITRILE ELASTOMER PRODUCTION. . . . . . . . . . . . . . . . . . . . . . . . . .5-36
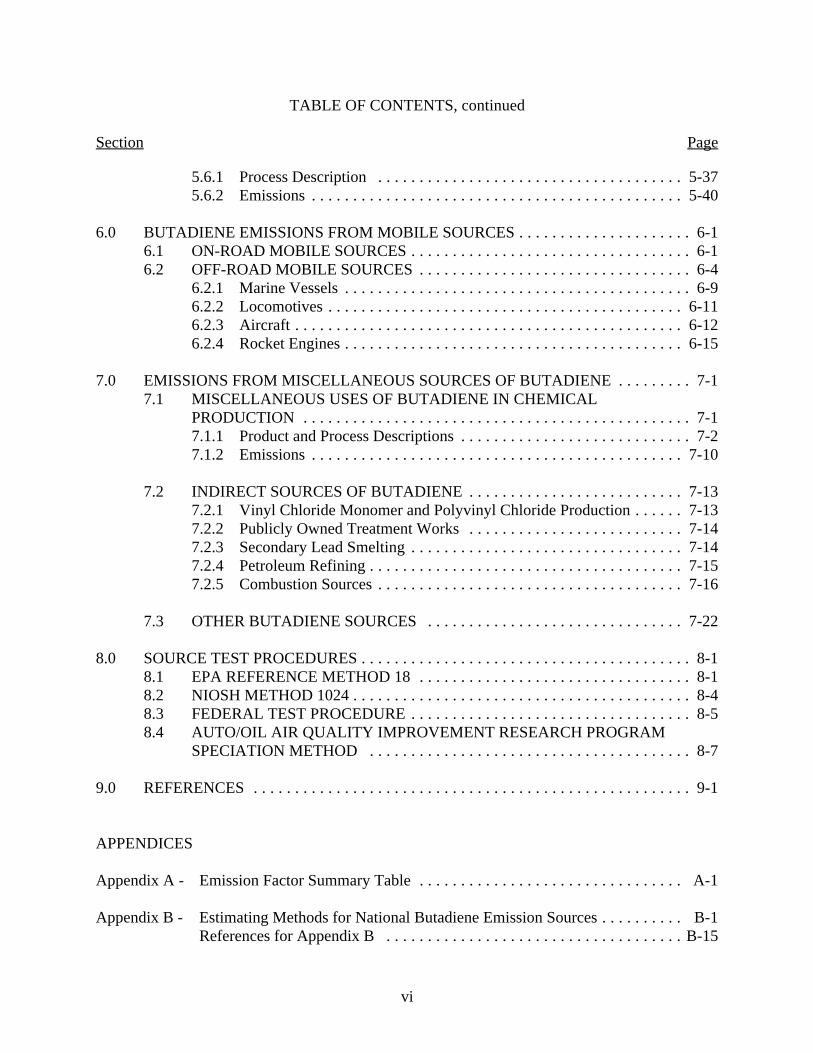
TABLE OF CONTENTS, continued
Section Page
vi
5.6.1 Process Description. . . . . . . . . . . . . . . . . . . . . . . . . . . . . . . . . . . . .5-375.6.2 Emissions. . . . . . . . . . . . . . . . . . . . . . . . . . . . . . . . . . . . . . . . . . . . .5-40
6.0 BUTADIENE EMISSIONS FROM MOBILE SOURCES. . . . . . . . . . . . . . . . . . . . . 6-16.1 ON-ROAD MOBILE SOURCES. . . . . . . . . . . . . . . . . . . . . . . . . . . . . . . . . . 6-16.2 OFF-ROAD MOBILE SOURCES. . . . . . . . . . . . . . . . . . . . . . . . . . . . . . . . . 6-4
6.2.1 Marine Vessels. . . . . . . . . . . . . . . . . . . . . . . . . . . . . . . . . . . . . . . . . . 6-96.2.2 Locomotives. . . . . . . . . . . . . . . . . . . . . . . . . . . . . . . . . . . . . . . . . . .6-116.2.3 Aircraft. . . . . . . . . . . . . . . . . . . . . . . . . . . . . . . . . . . . . . . . . . . . . . .6-126.2.4 Rocket Engines. . . . . . . . . . . . . . . . . . . . . . . . . . . . . . . . . . . . . . . . .6-15
7.0 EMISSIONS FROM MISCELLANEOUS SOURCES OF BUTADIENE. . . . . . . . . 7-17.1 MISCELLANEOUS USES OF BUTADIENE IN CHEMICAL
PRODUCTION . . . . . . . . . . . . . . . . . . . . . . . . . . . . . . . . . . . . . . . . . . . . . . . 7-17.1.1 Product and Process Descriptions. . . . . . . . . . . . . . . . . . . . . . . . . . . . 7-27.1.2 Emissions. . . . . . . . . . . . . . . . . . . . . . . . . . . . . . . . . . . . . . . . . . . . .7-10
7.2 INDIRECT SOURCES OF BUTADIENE. . . . . . . . . . . . . . . . . . . . . . . . . .7-137.2.1 Vinyl Chloride Monomer and Polyvinyl Chloride Production. . . . . . 7-137.2.2 Publicly Owned Treatment Works. . . . . . . . . . . . . . . . . . . . . . . . . .7-147.2.3 Secondary Lead Smelting. . . . . . . . . . . . . . . . . . . . . . . . . . . . . . . . .7-147.2.4 Petroleum Refining. . . . . . . . . . . . . . . . . . . . . . . . . . . . . . . . . . . . . .7-157.2.5 Combustion Sources. . . . . . . . . . . . . . . . . . . . . . . . . . . . . . . . . . . . .7-16
7.3 OTHER BUTADIENE SOURCES. . . . . . . . . . . . . . . . . . . . . . . . . . . . . . .7-22
8.0 SOURCE TEST PROCEDURES. . . . . . . . . . . . . . . . . . . . . . . . . . . . . . . . . . . . . . . . 8-18.1 EPA REFERENCE METHOD 18. . . . . . . . . . . . . . . . . . . . . . . . . . . . . . . . . 8-18.2 NIOSH METHOD 1024. . . . . . . . . . . . . . . . . . . . . . . . . . . . . . . . . . . . . . . . . 8-48.3 FEDERAL TEST PROCEDURE. . . . . . . . . . . . . . . . . . . . . . . . . . . . . . . . . . 8-58.4 AUTO/OIL AIR QUALITY IMPROVEMENT RESEARCH PROGRAM
SPECIATION METHOD . . . . . . . . . . . . . . . . . . . . . . . . . . . . . . . . . . . . . . . 8-7
9.0 REFERENCES. . . . . . . . . . . . . . . . . . . . . . . . . . . . . . . . . . . . . . . . . . . . . . . . . . . . . 9-1
APPENDICES
Appendix A - Emission Factor Summary Table. . . . . . . . . . . . . . . . . . . . . . . . . . . . . . . . A-1
Appendix B - Estimating Methods for National Butadiene Emission Sources. . . . . . . . . . B-1References for Appendix B. . . . . . . . . . . . . . . . . . . . . . . . . . . . . . . . . . . .B-15
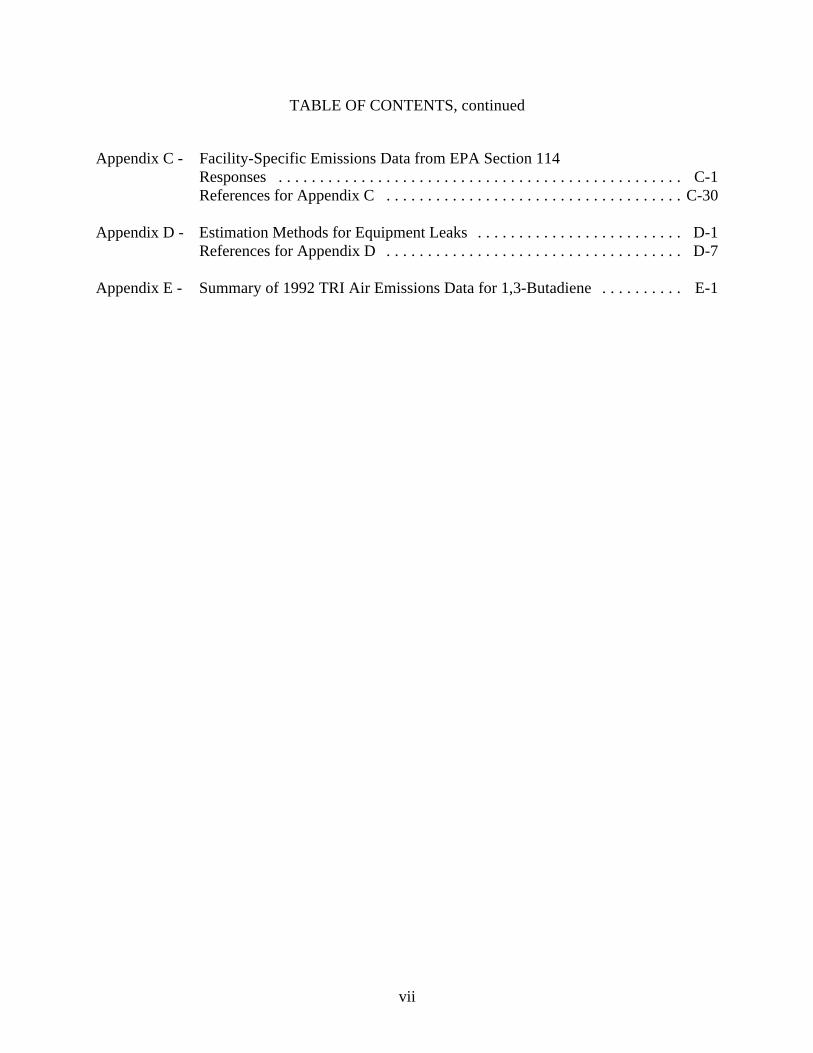
TABLE OF CONTENTS, continued
vii
Appendix C - Facility-Specific Emissions Data from EPA Section 114Responses . . . . . . . . . . . . . . . . . . . . . . . . . . . . . . . . . . . . . . . . . . . . . . . . . C-1References for Appendix C. . . . . . . . . . . . . . . . . . . . . . . . . . . . . . . . . . . .C-30
Appendix D - Estimation Methods for Equipment Leaks . . . . . . . . . . . . . . . . . . . . . . . . . D-1References for Appendix D. . . . . . . . . . . . . . . . . . . . . . . . . . . . . . . . . . . . D-7
Appendix E - Summary of 1992 TRI Air Emissions Data for 1,3-Butadiene. . . . . . . . . . E-1
viii
LIST OF TABLES
Table Page
ES-1 National Emission Estimates by Source Category. . . . . . . . . . . . . . . . . . . . . . . . . . . . iv
3-1 Physical and Chemical Properties of 1,3-Butadiene. . . . . . . . . . . . . . . . . . . . . . . . . . 3-2
4-1 Butadiene Production Facilities. . . . . . . . . . . . . . . . . . . . . . . . . . . . . . . . . . . . . . . . . 4-3
4-2 Butadiene Yields from Recovery Using a Mixed-C Stream Produced from4
Various Feedstocks. . . . . . . . . . . . . . . . . . . . . . . . . . . . . . . . . . . . . . . . . . . . . . . . . . 4-4
4-3 Typical Composition of Mixed-C Stream Formed from Naphtha Feedstock Used4
to Produce Ethylene. . . . . . . . . . . . . . . . . . . . . . . . . . . . . . . . . . . . . . . . . . . . . . . . . . 4-6
4-4 Typical Composition of n-Butenes Oxidative Dehydrogenation Reactor ProductStream. . . . . . . . . . . . . . . . . . . . . . . . . . . . . . . . . . . . . . . . . . . . . . . . . . . . . . . . . . .4-10
4-5 Summary of Emission Factors for Butadiene Production Facilities. . . . . . . . . . . . . 4-14
4-6 VOC Emissions Reduction Efficiencies of Control Devices Used to EstimateCurrent Butadiene Emissions. . . . . . . . . . . . . . . . . . . . . . . . . . . . . . . . . . . . . . . . . .4-15
4-7 Average Butadiene Emission Rates for Process Equipment Component Leaks. . . . 4-17
4-8 Variability in Facility-Specific Emission Rates for Equipment Leaks. . . . . . . . . . . 4-18
4-9 Control Techniques and Efficiencies Applicable to Equipment Leak Emissions . . . 4-19
5-1 Typical Recipe for Emulsion SBR. . . . . . . . . . . . . . . . . . . . . . . . . . . . . . . . . . . . . . . 5-5
5-2 Styrene-Butadiene Elastomer and Latex Production Facilities. . . . . . . . . . . . . . . . . . 5-6
5-3 Summary of Emission Factors for SB Copolymer Production Facilities. . . . . . . . . . . 5-8
5-4 Polybutadiene Production Facilities. . . . . . . . . . . . . . . . . . . . . . . . . . . . . . . . . . . . .5-11
5-5 Summary of Emission Factors for Polybutadiene Production Facilities. . . . . . . . . . 5-14
5-6 Adiponitrile Production Facilities. . . . . . . . . . . . . . . . . . . . . . . . . . . . . . . . . . . . . .5-17
5-7 Summary of Emission Factors for Adiponitrile Production Facilities. . . . . . . . . . . . 5-19
5-8 Chloroprene/Neoprene Production Facilities. . . . . . . . . . . . . . . . . . . . . . . . . . . . . .5-21
5-9 Summary of Emission Factors for Neoprene Production Facilities. . . . . . . . . . . . . .5-25
LIST OF TABLES, continued
Table Page
ix
5-10 Short-Term Emissions from Neoprene Production Facilities. . . . . . . . . . . . . . . . . .5-27
5-11 Acrylonitrile-Butadiene-Styrene Resin Production Facilities. . . . . . . . . . . . . . . . . .5-28
5-12 Summary of Emission Factors for ABS Production Facilities, Emulsion Process . . . 5-35
5-13 Nitrile Elastomer Production Facilities. . . . . . . . . . . . . . . . . . . . . . . . . . . . . . . . . .5-37
5-14 Summary of Emission Factors for Nitrile Elastomer Production Facilities. . . . . . . . 5-41
6-1 Butadiene Emission Factors for 1990 Taking into Consideration Vehicle Aging. . . . 6-3
6-2 Off-Road Equipment Types and Butadiene Emission Factors Included in theNEVES . . . . . . . . . . . . . . . . . . . . . . . . . . . . . . . . . . . . . . . . . . . . . . . . . . . . . . . . . . . 6-5
6-3 Butadiene Emission Factors for Commercial Marine Vessels. . . . . . . . . . . . . . . . . .6-10
6-4 Butadiene Emission Factors for Locomotives. . . . . . . . . . . . . . . . . . . . . . . . . . . . .6-12
6-5 Butadiene Content in Aircraft Landing and Takeoff Emissions. . . . . . . . . . . . . . . .6-13
6-6 Butadiene Emission Factors for General Aviation and Air Taxis. . . . . . . . . . . . . . .6-15
7-1 Miscellaneous Uses of Butadiene in Chemical Production. . . . . . . . . . . . . . . . . . . . . 7-3
7-2 Summary of Emission Factors and Annual Emissions from Equipment Leaks forMiscellaneous Chemicals Production Facilities. . . . . . . . . . . . . . . . . . . . . . . . . . . .7-11
7-3 Emission Factors for 1,3-Butadiene for Burning of Yard Waste, LandClearing/Burning, and Slash Burning. . . . . . . . . . . . . . . . . . . . . . . . . . . . . . . . . . . .7-19
7-4 Emission Factors for 1,3-Butadiene for Forest Fires and Prescribed Burning byFuel Type . . . . . . . . . . . . . . . . . . . . . . . . . . . . . . . . . . . . . . . . . . . . . . . . . . . . . . . .7-20
7-5 Emission Factors for 1,3-Butadiene from Open Burning of Tires. . . . . . . . . . . . . . .7-21
7-6 Potential Source Categories of Butadiene Emissions. . . . . . . . . . . . . . . . . . . . . . . .7-23
LIST OF TABLES, continued
Table Page
x
A-1 Summary of Emission Factors by Source Classification Code. . . . . . . . . . . . . . . . . . A-1
B-1 1992 On-Road Butadiene Emissions. . . . . . . . . . . . . . . . . . . . . . . . . . . . . . . . . . . . . B-2
C-1 Butadiene Production Facilities for which 1984 Emissions Data are Available . . . . . C-2
C-2 Butadiene Emissions (1984) from Process Vents at Olefins and ButadieneProduction Facilities . . . . . . . . . . . . . . . . . . . . . . . . . . . . . . . . . . . . . . . . . . . . . . . . . C-3
C-3 Summary of Butadiene Emissions (1987) from Equipment Leaks at NineProduction Facilities . . . . . . . . . . . . . . . . . . . . . . . . . . . . . . . . . . . . . . . . . . . . . . . . . C-4
C-4 Butadiene Emissions (1984) from Secondary Sources at Butadiene ProductionFacilities Using the Recovery from a Mixed-C Stream Process. . . . . . . . . . . . . . . . . C-54
C-5 Styrene-Butadiene Elastomer and Latex Production Facilities for which 1984Emissions Data are Available . . . . . . . . . . . . . . . . . . . . . . . . . . . . . . . . . . . . . . . . . . C-6
C-6 Butadiene Emissions (1984) from Process Vents at SB Copolymer ProductionFacilities . . . . . . . . . . . . . . . . . . . . . . . . . . . . . . . . . . . . . . . . . . . . . . . . . . . . . . . . . . C-7
C-7 Butadiene Emissions (1984) from Equipment Leaks at SB Copolymer ProductionFacilities . . . . . . . . . . . . . . . . . . . . . . . . . . . . . . . . . . . . . . . . . . . . . . . . . . . . . . . . .C-10
C-8 Butadiene Emissions (1984) from Secondary Sources at SB CopolymerProduction Facilities (Mg/yr) . . . . . . . . . . . . . . . . . . . . . . . . . . . . . . . . . . . . . . . . .C-11
C-9 Polybutadiene Production Facilities for which 1984 Emissions Data are Available. . . . . . . . . . . . . . . . . . . . . . . . . . . . . . . . . . . . . . . . . . . . . . . . . . . . . . . . . . . . . . . .C-13
C-10 Butadiene Emissions (1984) from Process Vents at Polybutadiene ProductionFacilities . . . . . . . . . . . . . . . . . . . . . . . . . . . . . . . . . . . . . . . . . . . . . . . . . . . . . . . . .C-14
C-11 Butadiene Emissions (1984) from Equipment Leaks at Polybutadiene ProductionFacilities . . . . . . . . . . . . . . . . . . . . . . . . . . . . . . . . . . . . . . . . . . . . . . . . . . . . . . . . .C-15
C-12 Butadiene Emissions (1984) from Secondary Sources at PolybutadieneProduction Facility (Mg/yr) . . . . . . . . . . . . . . . . . . . . . . . . . . . . . . . . . . . . . . . . . .C-16
C-13 Adiponitrile Production Facilities for which 1984 Emissions Data are Available . . C-17
C-14 Butadiene Emissions (1984) from Process Vents at Adiponitrile ProductionFacilities . . . . . . . . . . . . . . . . . . . . . . . . . . . . . . . . . . . . . . . . . . . . . . . . . . . . . . . . .C-18
LIST OF TABLES, continued
Table Page
xi
C-15 Butadiene Emissions (1984) from Equipment Leaks at Adiponitrile ProductionFacilities . . . . . . . . . . . . . . . . . . . . . . . . . . . . . . . . . . . . . . . . . . . . . . . . . . . . . . . . .C-19
C-16 Butadiene Emissions (1984) from Secondary Sources at Adiponitrile ProductionFacilities . . . . . . . . . . . . . . . . . . . . . . . . . . . . . . . . . . . . . . . . . . . . . . . . . . . . . . . . .C-20
C-17 Chloroprene/Neoprene Production Facilities for which 1984 Emissions Data areAvailable . . . . . . . . . . . . . . . . . . . . . . . . . . . . . . . . . . . . . . . . . . . . . . . . . . . . . . . .C-21
C-18 Butadiene Emissions (1984) from Neoprene Production Facilities . . . . . . . . . . . . .C-22
C-19 Acrylonitrile-Butadiene-Styrene Resin Production Facilities for which 1984Emissions Data are Available . . . . . . . . . . . . . . . . . . . . . . . . . . . . . . . . . . . . . . . . .C-23
C-20 Butadiene Emissions (1984) from ABS Production Facilities . . . . . . . . . . . . . . . . .C-24
C-21 Nitrile Elastomer Production Facilities for which 1984 Emissions Data areAvailable . . . . . . . . . . . . . . . . . . . . . . . . . . . . . . . . . . . . . . . . . . . . . . . . . . . . . . . .C-26
C-22 Butadiene Emissions (1984) from Nitrile Elastomer Production Facilities. . . . . . . .C-27
C-23 Miscellaneous Uses of Butadiene for which Emissions Data are Available . . . . . . . C-29
C-24 Butadiene Emissions from Process Vents Associated with Miscellaneous Uses ofButadiene . . . . . . . . . . . . . . . . . . . . . . . . . . . . . . . . . . . . . . . . . . . . . . . . . . . . . . . .C-30
C-25 Butadiene Emissions from Equipment Leaks Associated with Miscellaneous Usesof Butadiene . . . . . . . . . . . . . . . . . . . . . . . . . . . . . . . . . . . . . . . . . . . . . . . . . . . . . .C-32
D-1 SOCMI Average Total Organic Compound Emission Factors for EquipmentLeaks. . . . . . . . . . . . . . . . . . . . . . . . . . . . . . . . . . . . . . . . . . . . . . . . . . . . . . . . . . . . . D-3
D-2 Refinery Average Emission Factors. . . . . . . . . . . . . . . . . . . . . . . . . . . . . . . . . . . . . . D-4
D-3 SOCMI Screening Value Range Total Organic Compound Emission Factors forEquipment Leak Emissions. . . . . . . . . . . . . . . . . . . . . . . . . . . . . . . . . . . . . . . . . . . . D-5
D-4 Refinery Screening Ranges Emission Factors. . . . . . . . . . . . . . . . . . . . . . . . . . . . . . D-6
E-1 Summary of 1992 TRI Air Emissions Data for 1,3-Butadiene. . . . . . . . . . . . . . . . . . E-1
xii
LIST OF FIGURES
Figure Page
3-1 Chemical Production and Use Tree for 1,3-Butadiene. . . . . . . . . . . . . . . . . . . . . . . . 3-4
3-2 Relative Contributions to National Butadiene Emissions by Mobile and PointSource Categories. . . . . . . . . . . . . . . . . . . . . . . . . . . . . . . . . . . . . . . . . . . . . . . . . . . 3-7
3-3 Relative Contributions to Stationary Butadiene Emissions by Point SourceCategories. . . . . . . . . . . . . . . . . . . . . . . . . . . . . . . . . . . . . . . . . . . . . . . . . . . . . . . . . 3-8
4-1 Process Diagram for Production of a Mixed-C Stream Containing Butadiene. . . . . . 4-54
4-2 Process Diagram for Butadiene Production by Recovery from a Mixed-C Stream . . 4-74
4-3 Process Diagram for Production of Butadiene by the Oxidative Dehydrogenationof Butene. . . . . . . . . . . . . . . . . . . . . . . . . . . . . . . . . . . . . . . . . . . . . . . . . . . . . . . . . . 4-9
5-1 Process Diagram for Production of SB Copolymer. . . . . . . . . . . . . . . . . . . . . . . . . . 5-4
5-2 Process Diagram for Production of Polybutadiene Rubber. . . . . . . . . . . . . . . . . . . .5-12
5-3 Process Diagram for Production of Adiponitrile. . . . . . . . . . . . . . . . . . . . . . . . . . .5-18
5-4 Process Diagram for Production of Chloroprene Monomer. . . . . . . . . . . . . . . . . . .5-22
5-5 Flow Sheet for the Production of Neoprene. . . . . . . . . . . . . . . . . . . . . . . . . . . . . . .5-24
5-6 Process Diagram for Production of ABS/SAN via the Emulsion Process. . . . . . . . . 5-29
5-7 Process Diagram for Production of ABS via the Suspension Process. . . . . . . . . . . . 5-32
5-8 Process Diagram for Production of Bulk ABS. . . . . . . . . . . . . . . . . . . . . . . . . . . . .5-33
5-9 Process Diagram for Production of Nitrile Elastomer. . . . . . . . . . . . . . . . . . . . . . .5-38
8-1 Integrated Bag Sampling Train. . . . . . . . . . . . . . . . . . . . . . . . . . . . . . . . . . . . . . . . . 8-2
8-2 Vehicle Exhaust Gas Sampling System. . . . . . . . . . . . . . . . . . . . . . . . . . . . . . . . . . . 8-6

1-1
SECTION 1.0
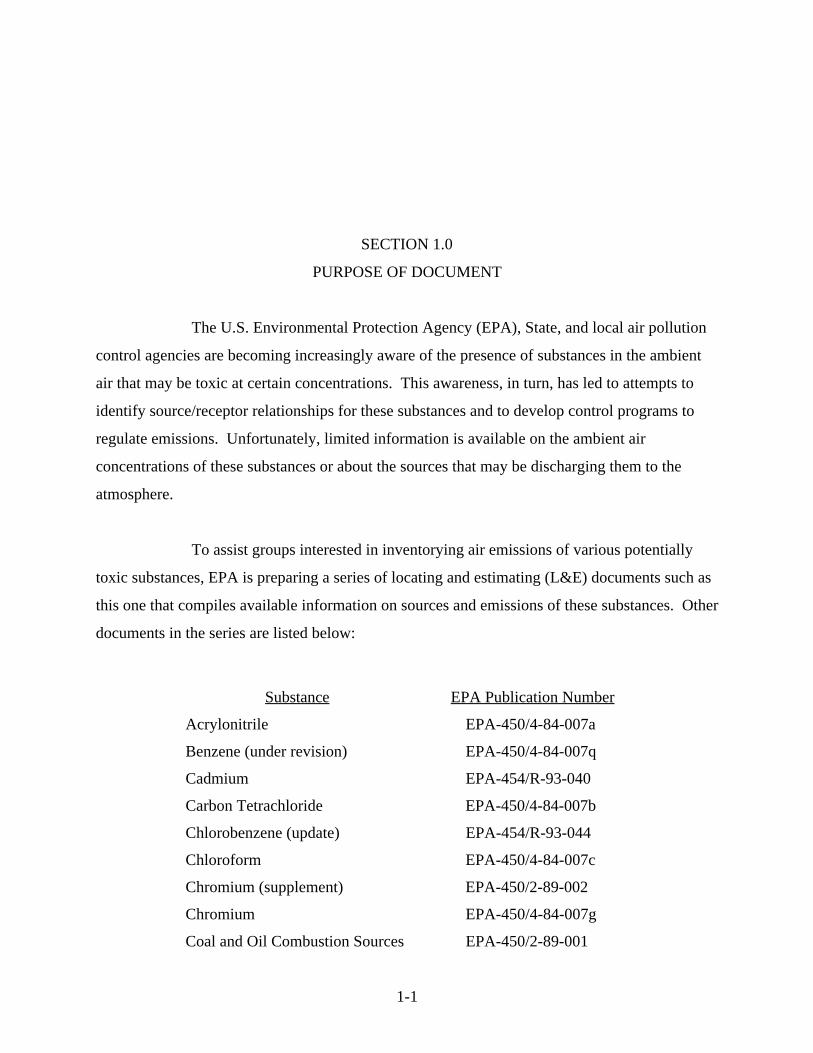
PURPOSE OF DOCUMENT
The U.S. Environmental Protection Agency (EPA), State, and local air pollution
control agencies are becoming increasingly aware of the presence of substances in the ambient
air that may be toxic at certain concentrations. This awareness, in turn, has led to attempts to
identify source/receptor relationships for these substances and to develop control programs to
regulate emissions. Unfortunately, limited information is available on the ambient air
concentrations of these substances or about the sources that may be discharging them to the
atmosphere.
To assist groups interested in inventorying air emissions of various potentially
toxic substances, EPA is preparing a series of locating and estimating (L&E) documents such as
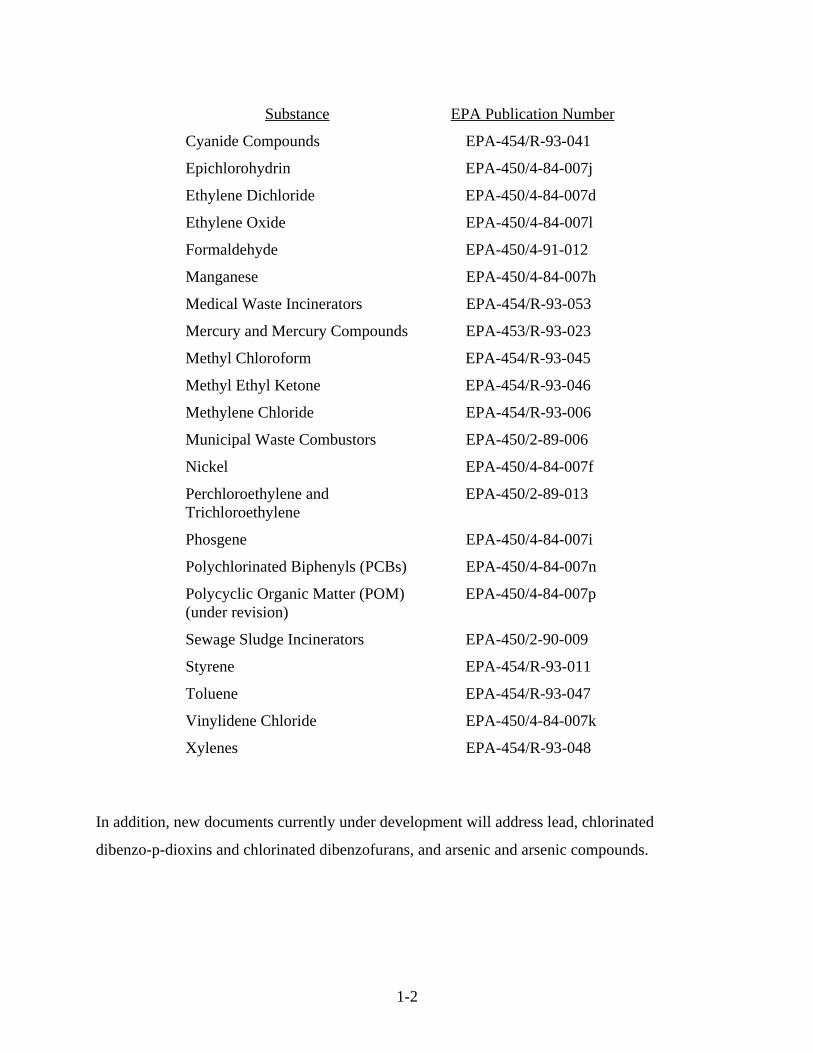
this one that compiles available information on sources and emissions of these substances. Other
documents in the series are listed below:
Substance EPA Publication Number
Acrylonitrile EPA-450/4-84-007a
Benzene (under revision) EPA-450/4-84-007q
Cadmium EPA-454/R-93-040
Carbon Tetrachloride EPA-450/4-84-007b
Chlorobenzene (update) EPA-454/R-93-044
Chloroform EPA-450/4-84-007c
Chromium (supplement) EPA-450/2-89-002
Chromium EPA-450/4-84-007g
Coal and Oil Combustion Sources EPA-450/2-89-001
Substance EPA Publication Number
1-2
Cyanide Compounds EPA-454/R-93-041
Epichlorohydrin EPA-450/4-84-007j
Ethylene Dichloride EPA-450/4-84-007d
Ethylene Oxide EPA-450/4-84-007l
Formaldehyde EPA-450/4-91-012
Manganese EPA-450/4-84-007h
Medical Waste Incinerators EPA-454/R-93-053
Mercury and Mercury Compounds EPA-453/R-93-023
Methyl Chloroform EPA-454/R-93-045
Methyl Ethyl Ketone EPA-454/R-93-046
Methylene Chloride EPA-454/R-93-006
Municipal Waste Combustors EPA-450/2-89-006
Nickel EPA-450/4-84-007f
Perchloroethylene and EPA-450/2-89-013Trichloroethylene
Phosgene EPA-450/4-84-007i
Polychlorinated Biphenyls (PCBs) EPA-450/4-84-007n
Polycyclic Organic Matter (POM) EPA-450/4-84-007p(under revision)
Sewage Sludge Incinerators EPA-450/2-90-009
Styrene EPA-454/R-93-011
Toluene EPA-454/R-93-047
Vinylidene Chloride EPA-450/4-84-007k
Xylenes EPA-454/R-93-048
In addition, new documents currently under development will address lead, chlorinated
dibenzo-p-dioxins and chlorinated dibenzofurans, and arsenic and arsenic compounds.
1-3
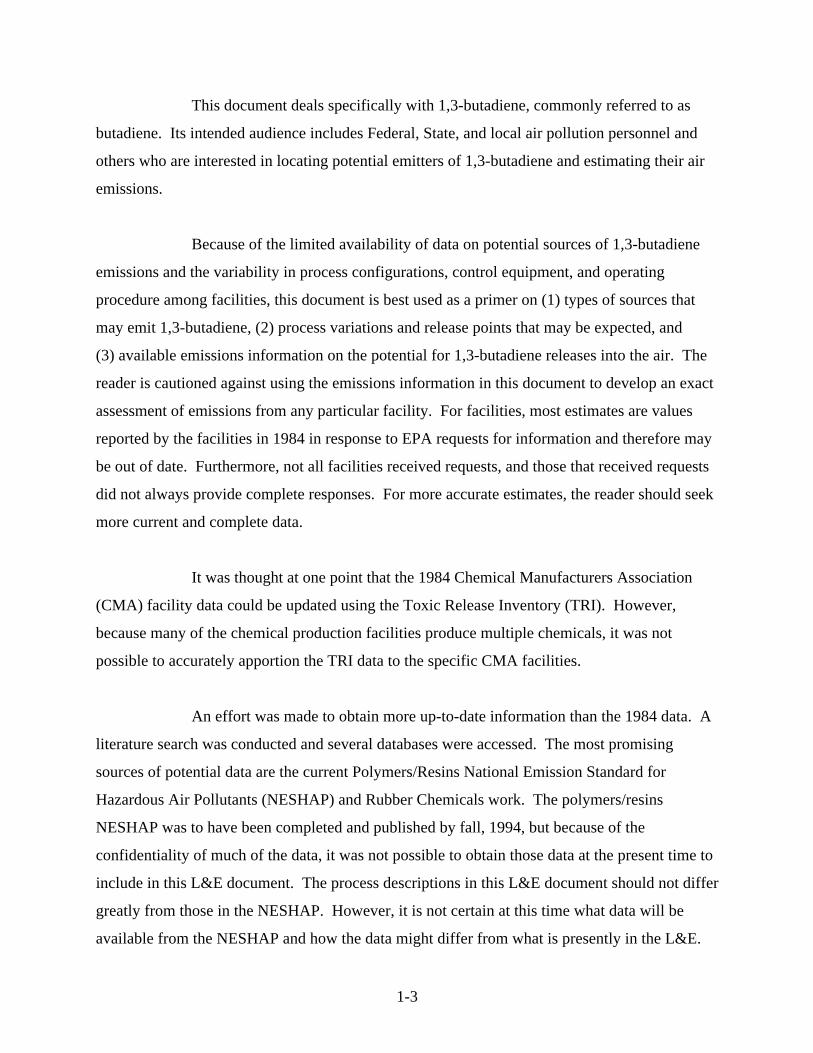
This document deals specifically with 1,3-butadiene, commonly referred to as
butadiene. Its intended audience includes Federal, State, and local air pollution personnel and
others who are interested in locating potential emitters of 1,3-butadiene and estimating their air
emissions.
Because of the limited availability of data on potential sources of 1,3-butadiene
emissions and the variability in process configurations, control equipment, and operating
procedure among facilities, this document is best used as a primer on (1) types of sources that
may emit 1,3-butadiene, (2) process variations and release points that may be expected, and
(3) available emissions information on the potential for 1,3-butadiene releases into the air. The
reader is cautioned against using the emissions information in this document to develop an exact
assessment of emissions from any particular facility. For facilities, most estimates are values
reported by the facilities in 1984 in response to EPA requests for information and therefore may
be out of date. Furthermore, not all facilities received requests, and those that received requests
did not always provide complete responses. For more accurate estimates, the reader should seek
more current and complete data.
It was thought at one point that the 1984 Chemical Manufacturers Association
(CMA) facility data could be updated using the Toxic Release Inventory (TRI). However,
because many of the chemical production facilities produce multiple chemicals, it was not
possible to accurately apportion the TRI data to the specific CMA facilities.
An effort was made to obtain more up-to-date information than the 1984 data. A
literature search was conducted and several databases were accessed. The most promising
sources of potential data are the current Polymers/Resins National Emission Standard for
Hazardous Air Pollutants (NESHAP) and Rubber Chemicals work. The polymers/resins
NESHAP was to have been completed and published by fall, 1994, but because of the
confidentiality of much of the data, it was not possible to obtain those data at the present time to
include in this L&E document. The process descriptions in this L&E document should not differ
greatly from those in the NESHAP. However, it is not certain at this time what data will be
available from the NESHAP and how the data might differ from what is presently in the L&E.
1-4
The rubber chemicals work has been delayed, so that EPA can expand the
definition of "rubber chemicals" to include a broader category of chemicals. It is not expected
that information will be available in time to be included in this version of the Butadiene L&E.
It is possible, in some cases, that orders-of-magnitude differences may result
between actual and estimated emissions, depending on differences in source configurations,
control equipment, and operating practices. Thus, in all situations where an accurate assessment
of 1,3-butadiene emissions is necessary, the source-specific information should be obtained to
confirm the existence of particular emitting operations and the types and effectiveness of control
measures, and to determine the impact of operating practices. A source test and/or material
balance calculations should be considered as the best method of determining air emissions from
an operation.
Most of the emission factors for the basic production and intermediate product
sources presented in the text are based on the 1984 data. The supporting facility-specific data
are provided in Appendix C. The emission rates for equipment leaks were developed by the
CMA and are based on a 1989 study of equipment leak emissions at butadiene production
facilities. These CMA rates are significantly different from the Synthetic Organic Chemical
Manufacturing Industry (SOCMI) average emission rates, and, because they are specific to1
butadiene, are assumed to better represent equipment leak emissions at other butadiene user
facilities; therefore, they were used to estimate annual emissions. Again, the reader should
collect facility-specific data for the most accurate estimates.
The chemical industry as a whole has done a lot to reduce emissions since the
early/mid 1980s as interest in air toxics has grown. A number of National Emission Standards
for Hazardous Air Pollutants (NESHAP) have been promulgated that are expected to reduce
butadiene emissions from facilities that are subject to the regulatory requirements. The recent
NESHAP that will impact butadiene emissions the most include the Hazardous Organic
NESHAP (HON) which has been promulgated April 22, 1994 and NESHAP for several of the
Polymers and Resins categories that are under development. Others include the NESHAP for
Publicly Owned Treatment Works, the Petroleum Refineries NESHAP and the NESHAP for
1-5
secondary lead production. Specific requirements and impacts are not included in this
document. The reader should refer to the regulations to assess the reductions achieved.
The EPA also initiated a voluntary program in 1991 as a part of the Agency's
pollution prevention strategy. Known as the 33/50 Program, companies committed to reducing
facilities emissions for 17 high priority compounds. Although butadiene is not among the listed
compounds, reductions would be achieved where butadiene was co-located with a listed
compound or where shared equipment was modified to reduce emissions of the 17 high priority
compounds.
In addition to the information presented in this document, another potential
source of emissions data for 1,3-butadiene from facilities is the Toxic Chemical Release
Inventory (TRI) form required by Title III, Section 313 of the 1986 Superfund Amendments and
Reauthorization Act (SARA). Section 313 requires owners and operators of facilities in certain2
Standard Industrial Classification Codes that manufacture, import, process, or otherwise use
toxic chemicals (as listed in Section 313) to report annually their releases of these chemicals to
all environmental media. As part of SARA 313, EPA provides public access to the annual
emissions data.
The TRI data include general facility information, chemical information, and
emissions data. Air emissions data are reported as total facility release estimates for fugitive
emissions and point source emissions. No individual process or stack data are provided to EPA
under the program. SARA Section 313 requires sources to use available stack monitoring data
for reporting but does not require facilities to perform stack monitoring or other types of
emissions measurement. If monitoring data are unavailable, emissions are to be quantified based
on best estimates of releases to the environment.
The reader is cautioned that TRI will not likely provide facility, emissions, and
chemical release data sufficient for conducting detailed exposure modeling and risk assessment.
1-6
In many cases, the TRI data are based on annual estimates of emissions (i.e., on emission
factors, material balance calculations, and engineering judgment). We recommend the use of
TRI data in conjunction with the information provided in this document to locate potential
emitters of butadiene and to make preliminary estimates of air emissions from these facilities.
For mobile sources, more data are becoming available for on-road vehicles.
Additionally, the EPA model that generates emission factors undergoes regular update. The on-
road mobile sources section in this document should therefore be viewed as an example of how
emissions can be determined and the reader should look for more detailed data for the most
accurate estimates.
Limited data on off-road vehicles and other stationary sources are available.
However, with EPA's increased emphasis on air toxics, more butadiene data are likely to be
generated in the future.
As standard procedure, L&E documents are sent to government, industry, and
environmental groups wherever EPA is aware of expertise. These groups are given the
opportunity to review a document, comment, and provide additional data where applicable.
Where necessary, the document is then revised to incorporate these comments. Although this
document has undergone extensive review, there may still be shortcomings. Comments
subsequent to publication are welcome and will be addressed based on available time and
resources. In addition, any information on process descriptions, operating parameters, control
measures, and emissions information that would enable EPA to improve on the contents of this
document is welcome. Comments and information may be sent to the following address:
Leader, Emission Factor and Methodologies TeamEmission Factor and Inventory Group (MD-14)U.S. Environmental Protection AgencyResearch Triangle Park, NC 27711

2-1
SECTION 2.0
OVERVIEW OF DOCUMENT CONTENTS
This section briefly outlines the nature, extent, and format of the material
presented in the remaining sections of this report.
Section 3.0 provides a brief summary of the physical and chemical characteristics
of butadiene and an overview of its production, uses, and emissions sources. This background
section may be useful to someone who needs to develop a general perspective on the nature of
butadiene, how it is manufactured and consumed, and potential production, use, and mobile
sources of emissions.
Section 4.0 focuses on the production of butadiene and the associated air
emissions. For each major production source category described in Section 4.0, an example
process description and a flow diagram with potential emission points are given. Available
emissions estimates were used to calculate emission factor ranges that show the potential for
butadiene emissions before and after controls employed by industry. Also provided are
estimates of annual emissions from equipment leaks. Individual companies that are reported in
trade publications to produce butadiene are named.
Section 5.0 describes major source categories that use butadiene, primarily in the
manufacture of synthetic elastomers. For each major production process, a description(s) of the
process is given along with a process flow diagram(s). Potential emission points are identified
on the diagrams and emission ranges are presented as estimates are available. Ranges of annual
emissions due to equipment leaks are also given. Individual companies that use butadiene as a
feedstock are reported.
2-2
Section 6.0 provides a brief summary on butadiene emissions from mobile
sources. The section addresses both on-road and off-road sources.
Section 7.0 summarizes the source categories--termed miscellaneous sources--that
use and potentially emit smaller quantities of butadiene. It also addresses emissions from
indirect sources such as treatment of butadiene-containing wastewater and other potential
sources that are not clearly users or indirect sources ("other" category). Limited information on
these sources is available; therefore, varying levels of detail on the processes, emissions, and
controls are presented. Locations of facilities for each source category as identified in the
literature are provided.
The final section, Section 8.0, summarizes available procedures for source
sampling and analysis of butadiene. This section provides an overview of applicable sampling
procedures and cites references for those interested in conducting source tests.
Appendix A presents a summary table of the emission factors contained in this
document. This table also presents the factor quality rating and the Source Classification Code
(SCC) or Area/Mobile Source (AMS) code associated with each emission factor.
Appendix B provides a brief description of the basis for the national emission
estimates appearing in Section 3.0. For each source, there is a description of the estimation
approach and an example calculation.
Appendix C provides facility-specific data taken from Section 114 responses
upon which the process vent and secondary source emission factors in Sections 4.0, 5.0, and 7.0
are based. Each facility has been assigned a letter code to prevent disclosure of its identity. In
general, the equipment leak emissions shown were calculated by applying average CMA
emission factors to the equipment component counts from the Section 114 responses. The
exceptions are butadiene producers and miscellaneous users. For producers, equipment counts
were summarized by CMA for 9 of the 11 facilities and the resulting emissions are presented as
the most recent data. For the miscellaneous users, estimates based on SOCMI factors were
2-3
shown because equipment count data were not readily available to use with the average CMA
emission factors. These were calculated in earlier work done by EPA.
Appendix D presents the procedure for the derivation of butadiene equipment
leak emissions estimates associated with the production processes presented in Sections 4.0, 5.0,
and 7.0. Calculations for pump seals and pressure relief valves appear as examples of these
derivations.
Each emission factor listed in Sections 4.0 through 7.0 was assigned an emission
factor rating (A, B, C, D, E, or U) based on the criteria for assigning data quality ratings and
emission factor ratings as required in the document Technical Procedures for Developing AP-42
Emission Factors and Preparing AP-42 Sections. The criteria for assigning the data quality3
ratings to source tests are as follows:
A - Test(s) was performed by a sound methodology and reported in enoughdetail for adequate validation. These tests are not necessarily EPAreference test methods, although such reference methods are certainly tobe used as a guide.
B - Test(s) was performed by a generally sound methodology but lackedenough detail for adequate validation.
C - Test(s) was based on a nonvalidated or draft methodology or lacked asignificant amount of background data.
D - Test(s) was based on a generally unacceptable method but may provide anorder-of-magnitude value for the source.
Once the data quality ratings for the source tests had been assigned, these ratings
along with the number of source tests available for a given emission point were evaluated.
Because of the almost impossible task of assigning a meaningful confidence limit to industry-
specific variables (e.g., sample size vs. sample population, industry and facility variability,
method of measurement), the use of a statistical confidence interval for establishing a
representative emission factor for each source category was not practical. Therefore, some
2-4
subjective quality rating was necessary. The following factor quality ratings were used in the
emission factor tables in this document:
A - Excellent. The emission factor was developed only from A-rated test datataken from many randomly chosen facilities in the industry population. Thesource category is specific enough to minimize variability within the sourcecategory population.
B - Above average. The emission factor was developed only from A-rated testdata from a reasonable number of facilities. Although no specific bias is evident,it is not clear if the facilities tested represent a random sample of the industry. Aswith the A rating, the source category is specific enough to minimize variabilitywithin the source category population.
C - Average. The emission factor was developed only from A- and B-rated testdata from a reasonable number of facilities. Although no specific bias is evident,it is not clear if the facilities tested represent a random sample of the industry. Aswith the A rating, the source category is specific enough to minimize variabilitywithin the source category population.
D - Below average. The emission factor was developed only from A- and B-ratedtest data from a small number of facilities, and there may be reason to suspect thatthese facilities do not represent a random sample of the industry. There also maybe evidence of variability within the source category population.
E - Poor. The emission factor was developed from C- and D-rated test data, andthere may be reason to suspect that the facilities tested do not represent a randomsample of the industry. There also may be evidence of variability within thesource category population.
U - Unrated or Unratable. The emission factor was developed from suspect datawith no supporting documentation to accurately apply an A through E rating. A"U" rating may be applied in the following circumstances:4
U1 = Mass Balance (for example, estimating air emissions basedon raw material input, product recovery efficiency, andpercent control).
U2 = Source test deficiencies (such as inadequate qualityassurance/quality control, questionable source test methods,only one source test).
U3 = Technology transfer.U4 = Engineering judgement.U5 = Lack of supporting documentation.

2-5
This document does not contain any discussion of health or other environmental
effects of butadiene, nor does it include any discussion of ambient air levels.

3-1
SECTION 3.0
BACKGROUND
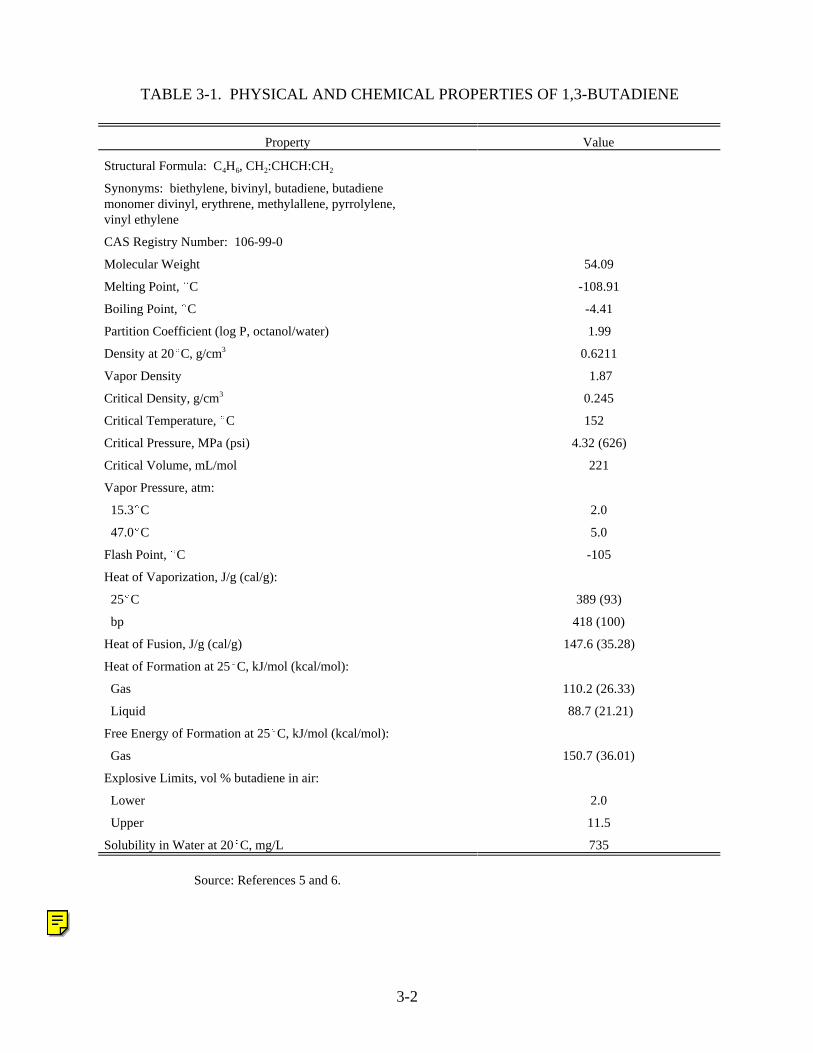
3.1 NATURE OF THE POLLUTANT
Butadiene is a colorless, flammable gas with a pungent, aromatic odor. It has a
boiling point between 24.8 and 23(F (-4 and -5(C). Table 3-1 summarizes butadiene's chemical
and physical properties. Although butadiene is insoluble in water, it is slightly soluble in5,6
methanol and ethanol, and readily soluble at room temperature in common organic solvents such
as benzene and ether. It forms azeotropes with ammonia, methylamine, acetaldehyde, n-butene,7
and 2-butene. 5
Butadiene is a highly versatile raw material that is used commercially in a variety
of reactions. These include:
& Diels-Alder reactions with dienophiles to form a six-membered ring compound with a 2,3 double bond,
& conversion to cyclic or open chain dimers and trimers,
& telomerization with active hydrogen compounds,
& addition reactions with electrophilic and free radical compounds,
& oxidation reactions,
& substitution reactions, and
& polymerization.
3-2
Property Value
Structural Formula: C H , CH :CHCH:CH4 6 2 2
Synonyms: biethylene, bivinyl, butadiene, butadiene monomer divinyl, erythrene, methylallene, pyrrolylene, vinyl ethylene
CAS Registry Number: 106-99-0
Molecular Weight 54.09
Melting Point, (C -108.91
Boiling Point, (C -4.41
Partition Coefficient (log P, octanol/water) 1.99
Density at 20(C, g/cm3 0.6211
Vapor Density 1.87
Critical Density, g/cm3 0.245
Critical Temperature, (C 152
Critical Pressure, MPa (psi) 4.32 (626)
Critical Volume, mL/mol 221
Vapor Pressure, atm:
15.3(C 2.0
47.0(C 5.0
Flash Point, (C -105
Heat of Vaporization, J/g (cal/g):
25(C 389 (93)
bp 418 (100)
Heat of Fusion, J/g (cal/g) 147.6 (35.28)
Heat of Formation at 25(C, kJ/mol (kcal/mol):
Gas 110.2 (26.33)
Liquid 88.7 (21.21)
Free Energy of Formation at 25(C, kJ/mol (kcal/mol):
Gas 150.7 (36.01)
Explosive Limits, vol % butadiene in air:
Lower 2.0
Upper 11.5
Solubility in Water at 20(C, mg/L 735
Source: References 5 and 6.
TABLE 3-1. PHYSICAL AND CHEMICAL PROPERTIES OF 1,3-BUTADIENE
3-3
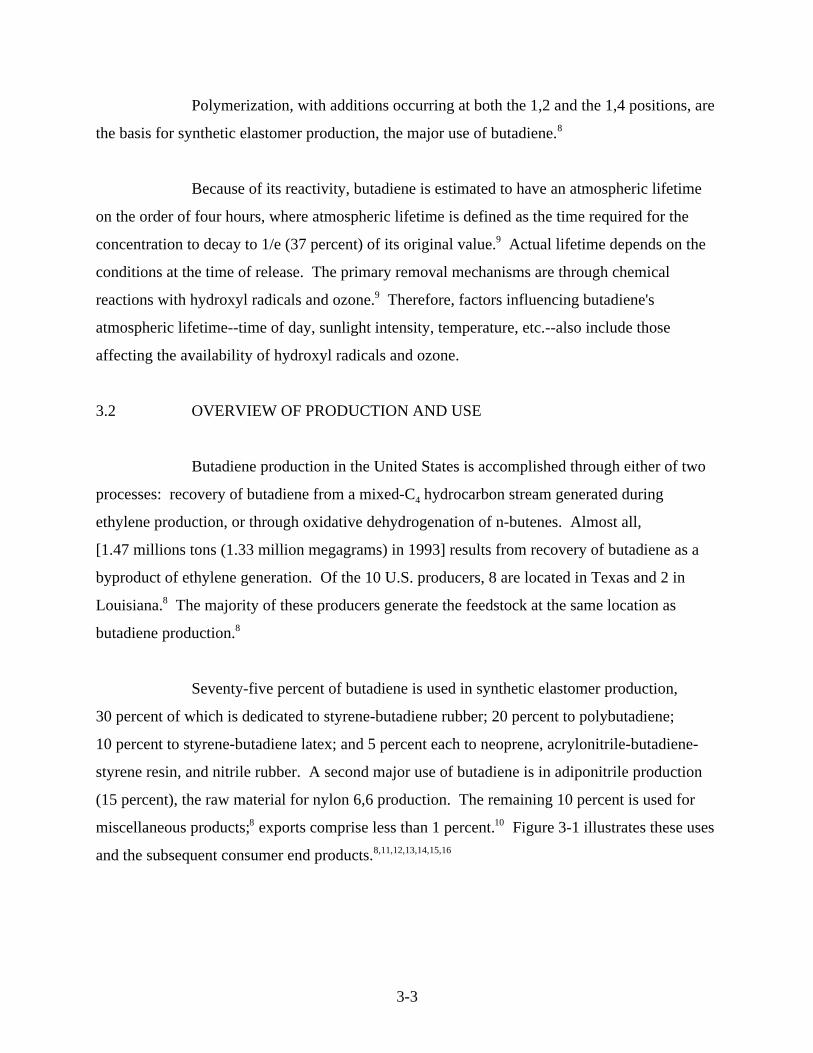
Polymerization, with additions occurring at both the 1,2 and the 1,4 positions, are
the basis for synthetic elastomer production, the major use of butadiene. 8
Because of its reactivity, butadiene is estimated to have an atmospheric lifetime
on the order of four hours, where atmospheric lifetime is defined as the time required for the
concentration to decay to 1/e (37 percent) of its original value. Actual lifetime depends on the9
conditions at the time of release. The primary removal mechanisms are through chemical
reactions with hydroxyl radicals and ozone. Therefore, factors influencing butadiene's9
atmospheric lifetime--time of day, sunlight intensity, temperature, etc.--also include those
affecting the availability of hydroxyl radicals and ozone.
3.2 OVERVIEW OF PRODUCTION AND USE
Butadiene production in the United States is accomplished through either of two
processes: recovery of butadiene from a mixed-C hydrocarbon stream generated during4
ethylene production, or through oxidative dehydrogenation of n-butenes. Almost all,
[1.47 millions tons (1.33 million megagrams) in 1993] results from recovery of butadiene as a
byproduct of ethylene generation. Of the 10 U.S. producers, 8 are located in Texas and 2 in
Louisiana. The majority of these producers generate the feedstock at the same location as8
butadiene production. 8
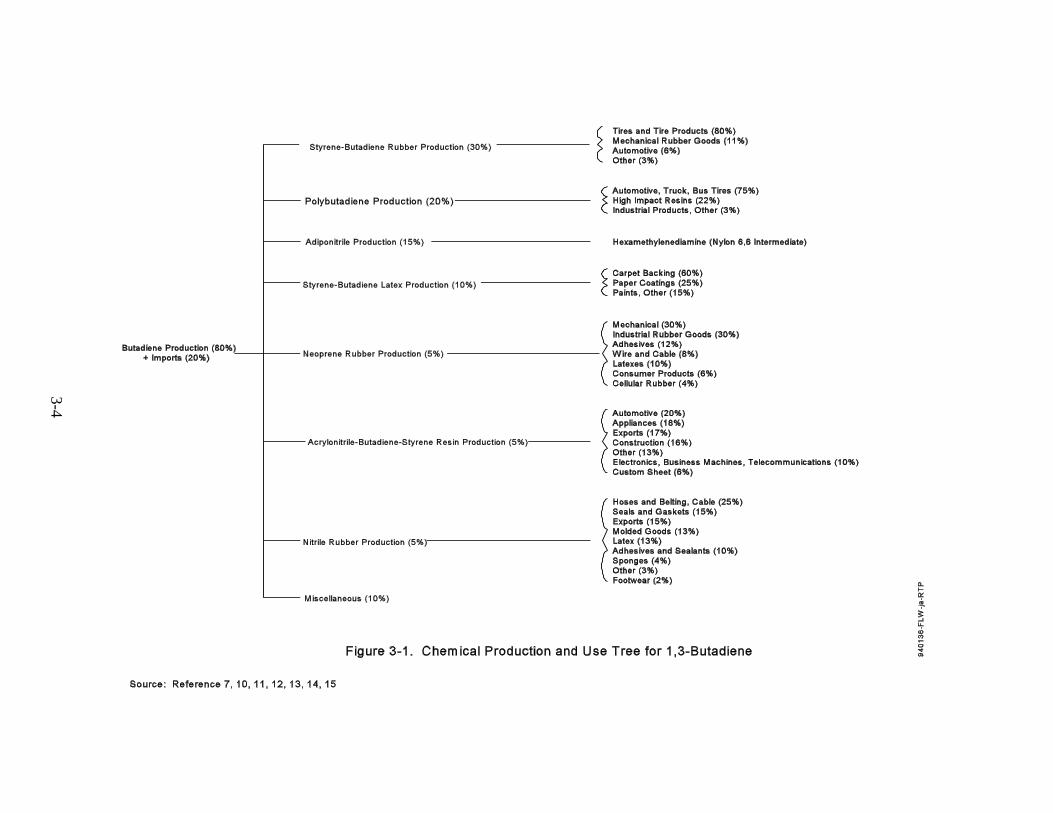
Seventy-five percent of butadiene is used in synthetic elastomer production,
30 percent of which is dedicated to styrene-butadiene rubber; 20 percent to polybutadiene;
10 percent to styrene-butadiene latex; and 5 percent each to neoprene, acrylonitrile-butadiene-
styrene resin, and nitrile rubber. A second major use of butadiene is in adiponitrile production
(15 percent), the raw material for nylon 6,6 production. The remaining 10 percent is used for
miscellaneous products; exports comprise less than 1 percent. Figure 3-1 illustrates these uses8 10
and the subsequent consumer end products. 8,11,12,13,14,15,16
3-4
3-5
Long-term growth in demand for butadiene is expected to be modest, with
reduced requirements for synthetic rubber because of quality and performance improvements in
automobile and other road tires. There will be some newer butadiene applications (sealants,
adhesives, processing aids for plastic industry) that will experience rapid growth in future years.
However, overall U.S. butadiene demand growth is not expected to exceed 2 percent per year,
and may well show a long term slow decline by 1995/1996.10
3.3 OVERVIEW OF EMISSIONS
Sources of butadiene emissions from its production and uses are typical of those
found at any chemical production facility:
& process vents,
& equipment leaks,
& waste streams (secondary sources),
& storage, and
& accidental or emergency releases.
Much of the available emissions data used to prepare this report were collected by EPA from
industry in 1984. Use of these estimates to represent sources at different locations is of limited
accuracy because of the differences in process configurations and plant operations. The
equipment leak emission factors are based on a 1989 CMA study. The CMA Butadiene Panel
collected monitoring data from nine of the facilities manufacturing butadiene to develop average
component-specific emission factors. Although the accuracy of applying these emission factors
to butadiene user facilities is undetermined, they are presented as an alternative to the SOCMI
emission factors previously developed by EPA.
Emissions data from several butadiene sources, including mobile, petroleum
refining, secondary lead smelting, tire burning, and biomass burning, have been added to this
update of the document and are described in Section 7.0.
3-6
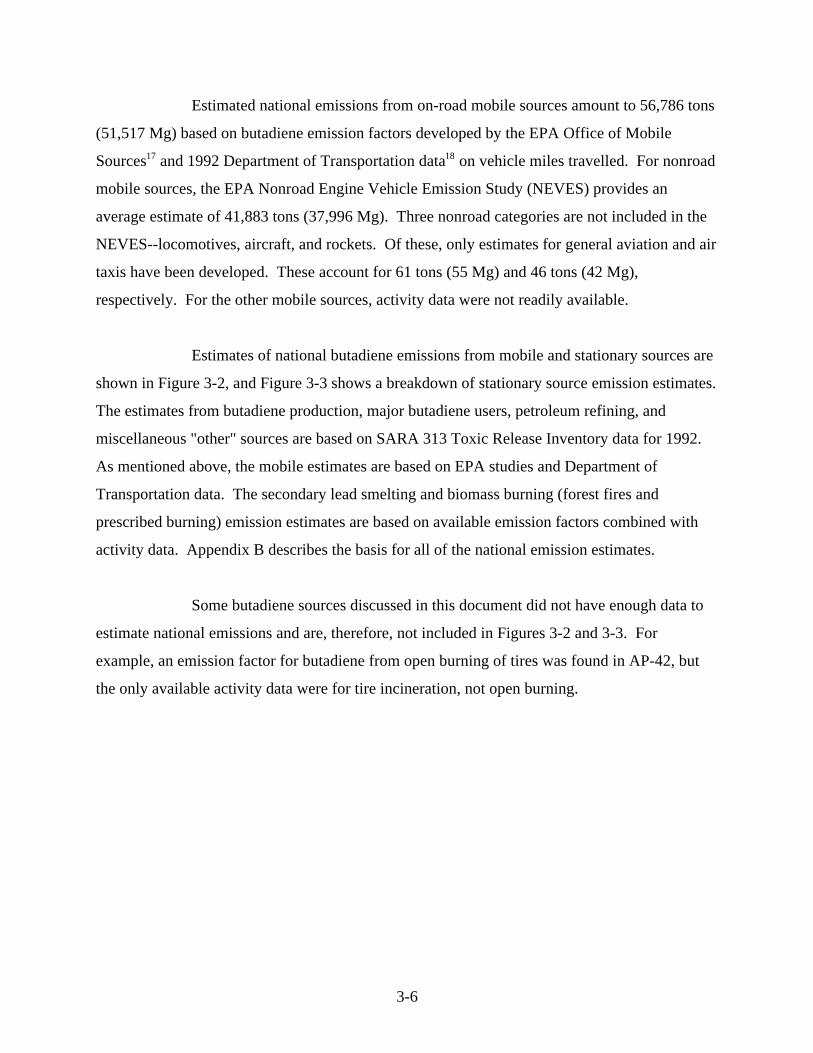
Estimated national emissions from on-road mobile sources amount to 56,786 tons
(51,517 Mg) based on butadiene emission factors developed by the EPA Office of Mobile
Sources and 1992 Department of Transportation data on vehicle miles travelled. For nonroad17 18
mobile sources, the EPA Nonroad Engine Vehicle Emission Study (NEVES) provides an
average estimate of 41,883 tons (37,996 Mg). Three nonroad categories are not included in the
NEVES--locomotives, aircraft, and rockets. Of these, only estimates for general aviation and air
taxis have been developed. These account for 61 tons (55 Mg) and 46 tons (42 Mg),
respectively. For the other mobile sources, activity data were not readily available.
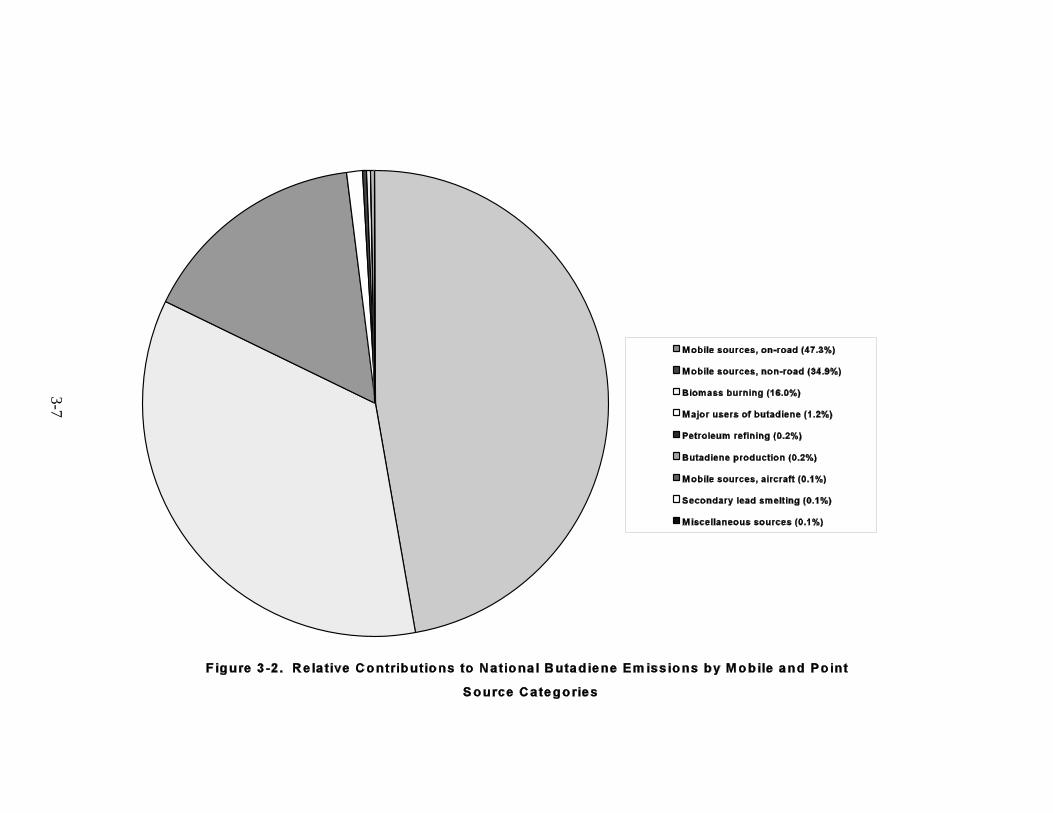
Estimates of national butadiene emissions from mobile and stationary sources are
shown in Figure 3-2, and Figure 3-3 shows a breakdown of stationary source emission estimates.
The estimates from butadiene production, major butadiene users, petroleum refining, and
miscellaneous "other" sources are based on SARA 313 Toxic Release Inventory data for 1992.
As mentioned above, the mobile estimates are based on EPA studies and Department of
Transportation data. The secondary lead smelting and biomass burning (forest fires and
prescribed burning) emission estimates are based on available emission factors combined with
activity data. Appendix B describes the basis for all of the national emission estimates.
Some butadiene sources discussed in this document did not have enough data to
estimate national emissions and are, therefore, not included in Figures 3-2 and 3-3. For
example, an emission factor for butadiene from open burning of tires was found in AP-42, but
the only available activity data were for tire incineration, not open burning.
3-7
3-8
4-1
SECTION 4.0
EMISSIONS FROM BUTADIENE PRODUCTION
This section discusses emissions from sources associated with butadiene
production. The information presented in this section includes identification of producers and
descriptions of typical production processes. Process flow diagrams are given, as appropriate,
with streams and vents labeled to correspond to the discussion in the text. Estimates of the
associated butadiene emissions are provided in the form of emission factors when data were
available to calculate them. Any known emission control practices are also discussed.
Much of the process vent and secondary source emissions data were taken from
facility-reported information based on responses to Section 114 requests in 1984. In many19
cases, these responses were incomplete. Interested readers should therefore contact specific
facilities directly to determine the process in use, production volume, and control techniques in
place before applying any of the emission factors presented in this document. This document
will be reviewed for the need to provide newer data as they become available.
The equipment leak emission factors given in this section were calculated from
producer screening data collected by the Chemical Manufacturers' Association (CMA) in 1988.
This study is briefly described and the results presented both in terms of average component-
specific emissions factors and as annual emissions.
4-2
4.1 BUTADIENE PRODUCTION
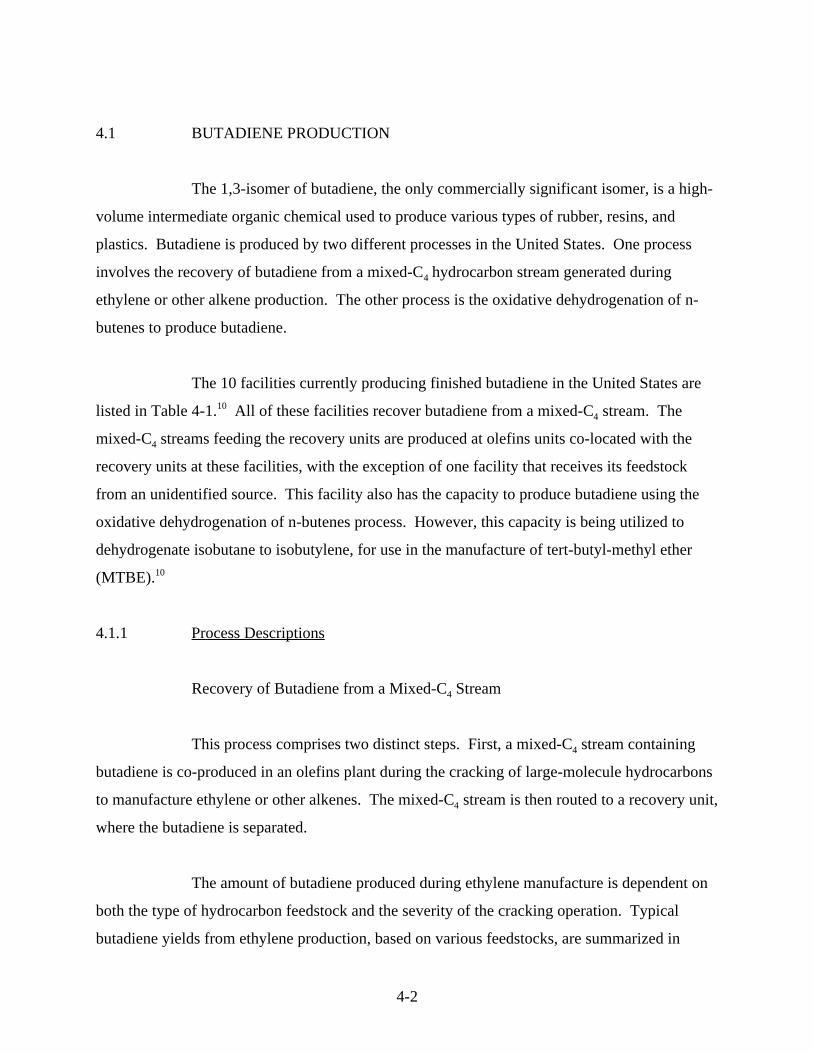
The 1,3-isomer of butadiene, the only commercially significant isomer, is a high-
volume intermediate organic chemical used to produce various types of rubber, resins, and
plastics. Butadiene is produced by two different processes in the United States. One process
involves the recovery of butadiene from a mixed-C hydrocarbon stream generated during4
ethylene or other alkene production. The other process is the oxidative dehydrogenation of n-
butenes to produce butadiene.
The 10 facilities currently producing finished butadiene in the United States are
listed in Table 4-1. All of these facilities recover butadiene from a mixed-C stream. The104
mixed-C streams feeding the recovery units are produced at olefins units co-located with the4
recovery units at these facilities, with the exception of one facility that receives its feedstock
from an unidentified source. This facility also has the capacity to produce butadiene using the
oxidative dehydrogenation of n-butenes process. However, this capacity is being utilized to
dehydrogenate isobutane to isobutylene, for use in the manufacture of tert-butyl-methyl ether
(MTBE).10
4.1.1 Process Descriptions
Recovery of Butadiene from a Mixed-C Stream4
This process comprises two distinct steps. First, a mixed-C stream containing4
butadiene is co-produced in an olefins plant during the cracking of large-molecule hydrocarbons
to manufacture ethylene or other alkenes. The mixed-C stream is then routed to a recovery unit,4
where the butadiene is separated.
The amount of butadiene produced during ethylene manufacture is dependent on
both the type of hydrocarbon feedstock and the severity of the cracking operation. Typical
butadiene yields from ethylene production, based on various feedstocks, are summarized in
4-3
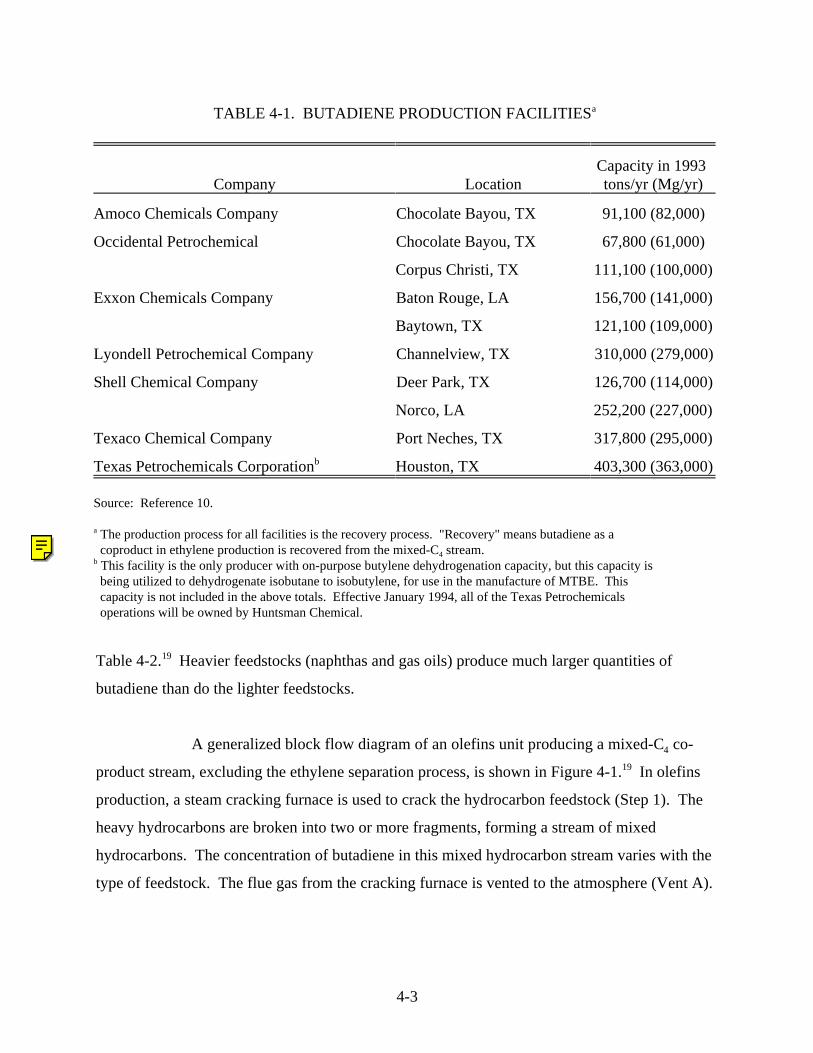
Company LocationCapacity in 1993 tons/yr (Mg/yr)
Amoco Chemicals Company Chocolate Bayou, TX 91,100 (82,000)
Occidental Petrochemical Chocolate Bayou, TX 67,800 (61,000)
Corpus Christi, TX 111,100 (100,000)
Exxon Chemicals Company Baton Rouge, LA 156,700 (141,000)
Baytown, TX 121,100 (109,000)
Lyondell Petrochemical Company Channelview, TX 310,000 (279,000)
Shell Chemical Company Deer Park, TX 126,700 (114,000)
Norco, LA 252,200 (227,000)
Texaco Chemical Company Port Neches, TX 317,800 (295,000)
Texas Petrochemicals Corporationb Houston, TX 403,300 (363,000)
Source: Reference 10.
The production process for all facilities is the recovery process. "Recovery" means butadiene as aa
coproduct in ethylene production is recovered from the mixed-C stream.4
This facility is the only producer with on-purpose butylene dehydrogenation capacity, but this capacity isb
being utilized to dehydrogenate isobutane to isobutylene, for use in the manufacture of MTBE. This capacity is not included in the above totals. Effective January 1994, all of the Texas Petrochemicals operations will be owned by Huntsman Chemical.
TABLE 4-1. BUTADIENE PRODUCTION FACILITIESa
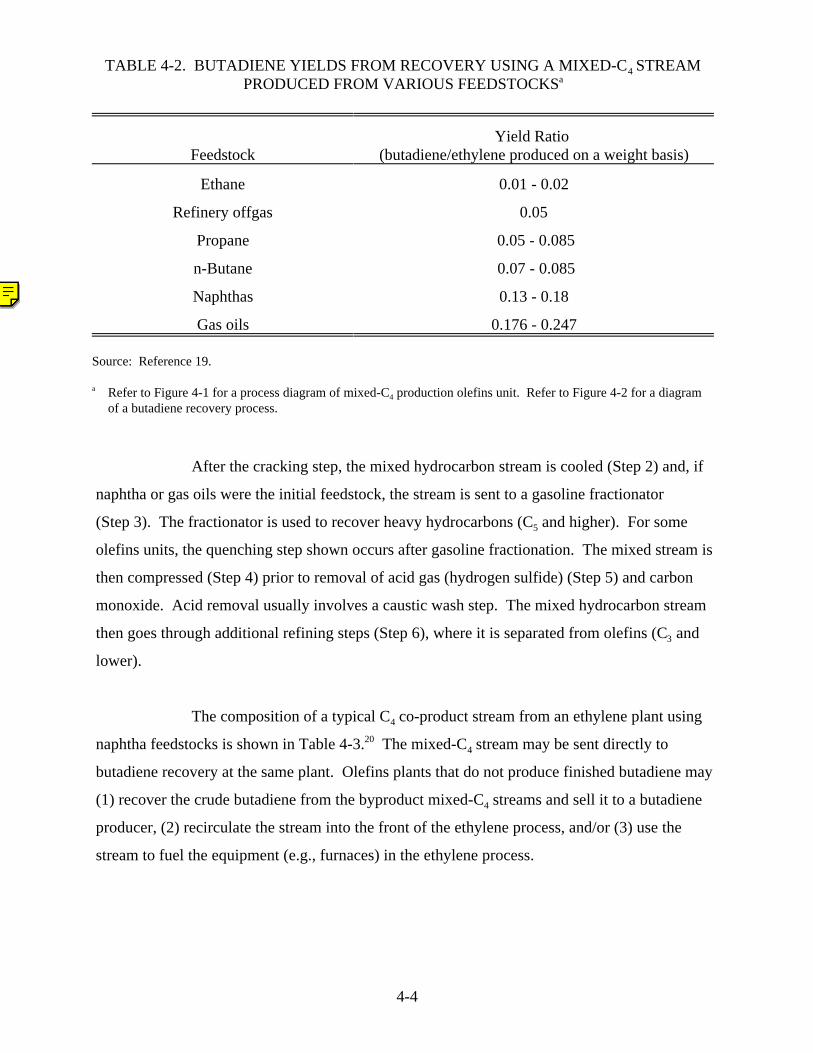
Table 4-2. Heavier feedstocks (naphthas and gas oils) produce much larger quantities of19
butadiene than do the lighter feedstocks.
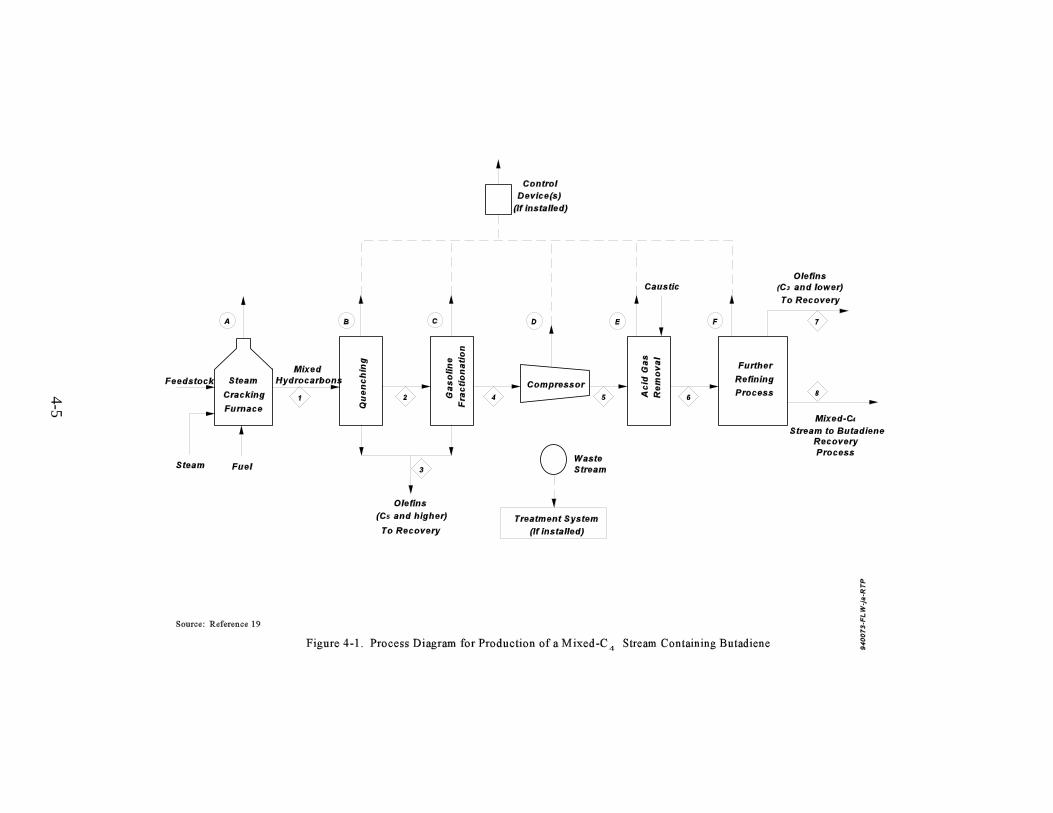
A generalized block flow diagram of an olefins unit producing a mixed-C co-4
product stream, excluding the ethylene separation process, is shown in Figure 4-1. In olefins19
production, a steam cracking furnace is used to crack the hydrocarbon feedstock (Step 1). The
heavy hydrocarbons are broken into two or more fragments, forming a stream of mixed
hydrocarbons. The concentration of butadiene in this mixed hydrocarbon stream varies with the
type of feedstock. The flue gas from the cracking furnace is vented to the atmosphere (Vent A).
4-4
FeedstockYield Ratio
(butadiene/ethylene produced on a weight basis)
Ethane 0.01 - 0.02
Refinery offgas 0.05
Propane 0.05 - 0.085
n-Butane 0.07 - 0.085
Naphthas 0.13 - 0.18
Gas oils 0.176 - 0.247
Source: Reference 19.
Refer to Figure 4-1 for a process diagram of mixed-C production olefins unit. Refer to Figure 4-2 for a diagrama4
of a butadiene recovery process.
TABLE 4-2. BUTADIENE YIELDS FROM RECOVERY USING A MIXED-C STREAM4
PRODUCED FROM VARIOUS FEEDSTOCKSa
After the cracking step, the mixed hydrocarbon stream is cooled (Step 2) and, if
naphtha or gas oils were the initial feedstock, the stream is sent to a gasoline fractionator
(Step 3). The fractionator is used to recover heavy hydrocarbons (C and higher). For some5
olefins units, the quenching step shown occurs after gasoline fractionation. The mixed stream is
then compressed (Step 4) prior to removal of acid gas (hydrogen sulfide) (Step 5) and carbon
monoxide. Acid removal usually involves a caustic wash step. The mixed hydrocarbon stream
then goes through additional refining steps (Step 6), where it is separated from olefins (C and3
lower).
The composition of a typical C co-product stream from an ethylene plant using4
naphtha feedstocks is shown in Table 4-3. The mixed-C stream may be sent directly to204
butadiene recovery at the same plant. Olefins plants that do not produce finished butadiene may
(1) recover the crude butadiene from the byproduct mixed-C streams and sell it to a butadiene4
producer, (2) recirculate the stream into the front of the ethylene process, and/or (3) use the
stream to fuel the equipment (e.g., furnaces) in the ethylene process.
4-5
4-6
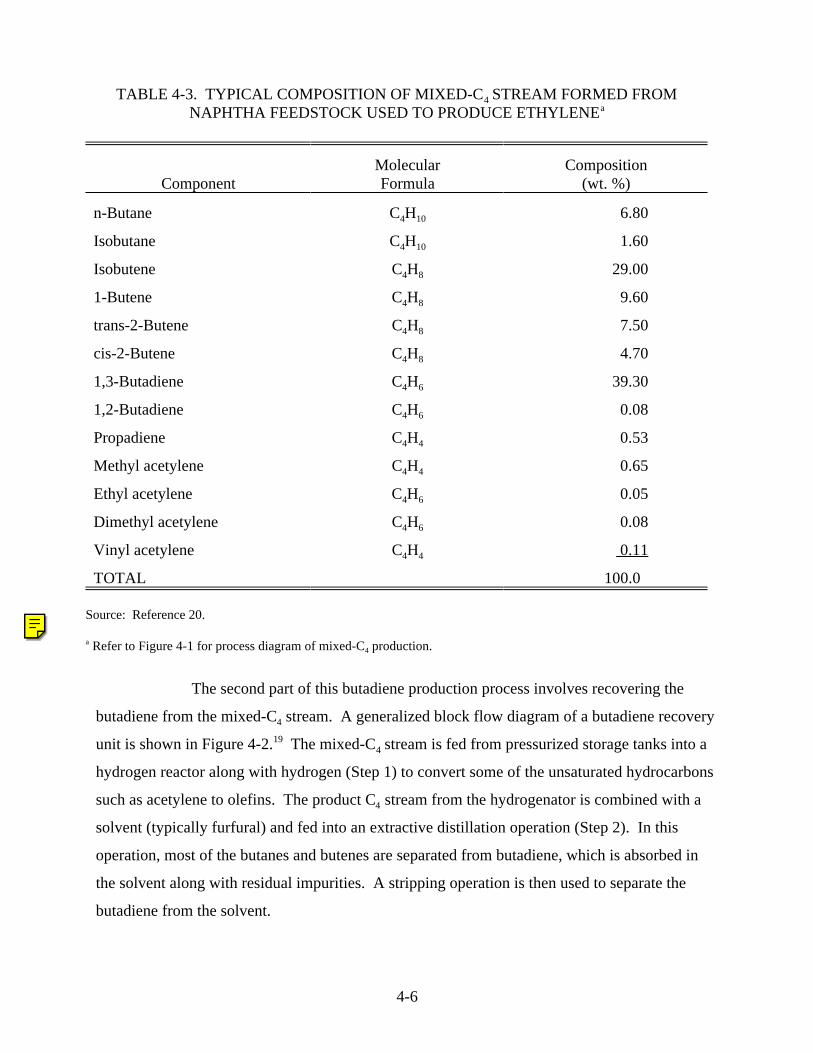
ComponentMolecularFormula
Composition(wt. %)
n-Butane C H4 10 6.80
Isobutane C H4 10 1.60
Isobutene C H4 8 29.00
1-Butene C H4 8 9.60
trans-2-Butene C H4 8 7.50
cis-2-Butene C H4 8 4.70
1,3-Butadiene C H4 6 39.30
1,2-Butadiene C H4 6 0.08
Propadiene C H4 4 0.53
Methyl acetylene C H4 4 0.65
Ethyl acetylene C H4 6 0.05
Dimethyl acetylene C H4 6 0.08
Vinyl acetylene C H4 4 0.11
TOTAL 100.0
Source: Reference 20.
Refer to Figure 4-1 for process diagram of mixed-C production.a4
TABLE 4-3. TYPICAL COMPOSITION OF MIXED-C STREAM FORMED FROM4
NAPHTHA FEEDSTOCK USED TO PRODUCE ETHYLENEa
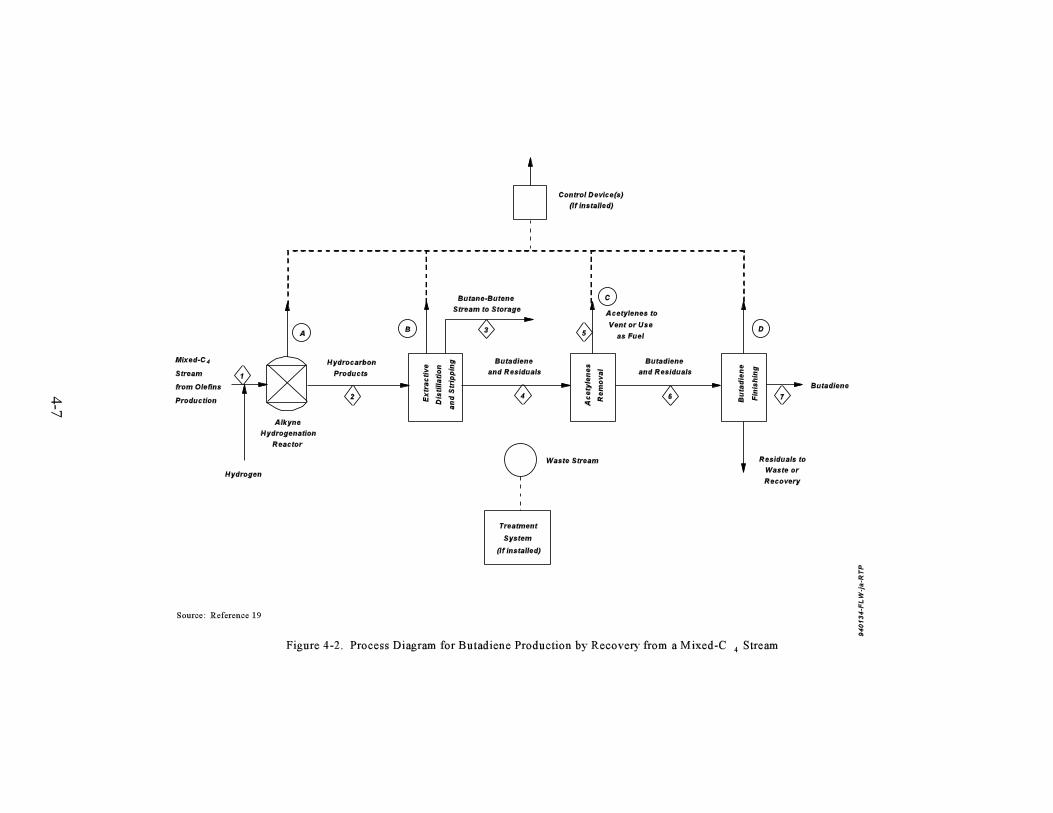
The second part of this butadiene production process involves recovering the
butadiene from the mixed-C stream. A generalized block flow diagram of a butadiene recovery4
unit is shown in Figure 4-2. The mixed-C stream is fed from pressurized storage tanks into a194
hydrogen reactor along with hydrogen (Step 1) to convert some of the unsaturated hydrocarbons
such as acetylene to olefins. The product C stream from the hydrogenator is combined with a4
solvent (typically furfural) and fed into an extractive distillation operation (Step 2). In this
operation, most of the butanes and butenes are separated from butadiene, which is absorbed in
the solvent along with residual impurities. A stripping operation is then used to separate the
butadiene from the solvent.
4-7
4-8
The stream containing butadiene typically has a small amount of residuals. Some
of these residuals are alkynes that were not converted to olefins in the hydrogenation reactor.
These residuals are removed from the butadiene stream by distillation (Step 3) and are usually
vented to an emissions control device (Vent A). The bottom stream exiting the acetylenes
removal operation contains butadiene and residuals such as polymer and 2-butene. The residuals
are removed in the butadiene finishing operation (Step 4) and sent to a waste treatment system or
recovery unit. The finished butadiene is then stored in pressurized tanks.
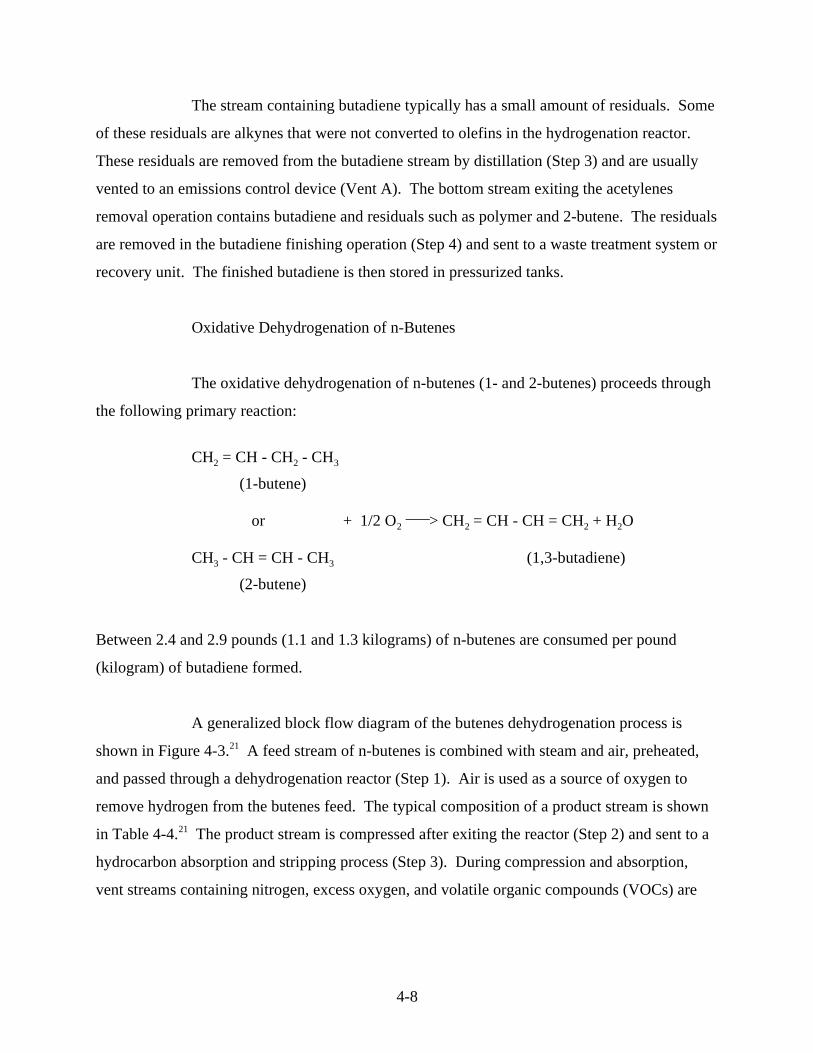
Oxidative Dehydrogenation of n-Butenes
The oxidative dehydrogenation of n-butenes (1- and 2-butenes) proceeds through
the following primary reaction:
CH = CH - CH - CH2 2 3
(1-butene)
or + 1/2 O > CH = CH - CH = CH + H O2 2 2 2___
CH - CH = CH - CH (1,3-butadiene)3 3
(2-butene)
Between 2.4 and 2.9 pounds (1.1 and 1.3 kilograms) of n-butenes are consumed per pound
(kilogram) of butadiene formed.
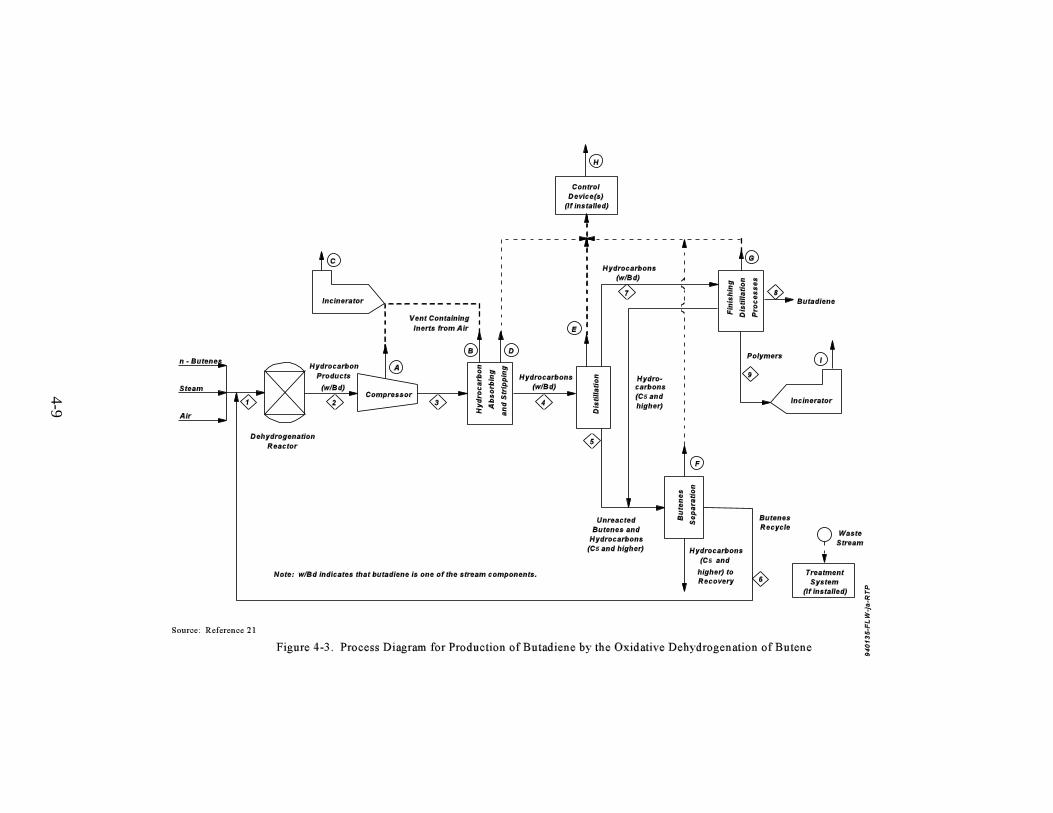
A generalized block flow diagram of the butenes dehydrogenation process is
shown in Figure 4-3. A feed stream of n-butenes is combined with steam and air, preheated,21
and passed through a dehydrogenation reactor (Step 1). Air is used as a source of oxygen to
remove hydrogen from the butenes feed. The typical composition of a product stream is shown
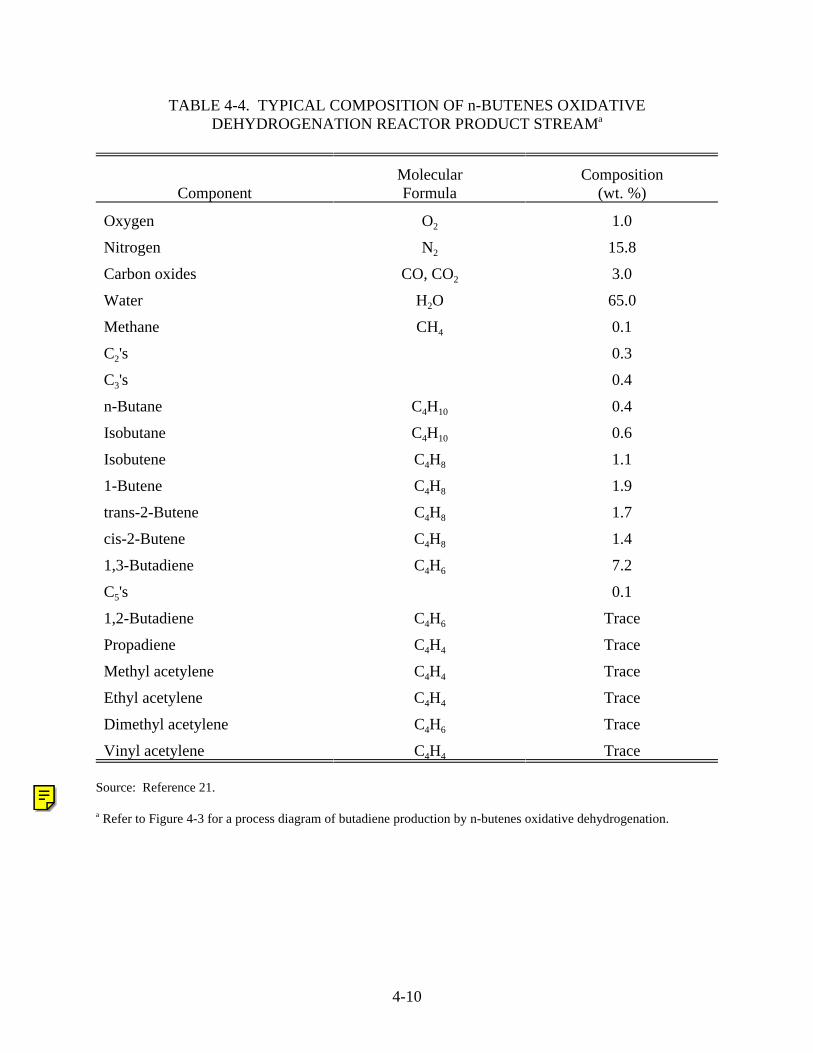
in Table 4-4. The product stream is compressed after exiting the reactor (Step 2) and sent to a21
hydrocarbon absorption and stripping process (Step 3). During compression and absorption,
vent streams containing nitrogen, excess oxygen, and volatile organic compounds (VOCs) are
4-9
4-10
ComponentMolecularFormula
Composition(wt. %)
Oxygen O2 1.0
Nitrogen N2 15.8
Carbon oxides CO, CO2 3.0
Water H O2 65.0
Methane CH4 0.1
C 's2 0.3
C 's3 0.4
n-Butane C H4 10 0.4
Isobutane C H4 10 0.6
Isobutene C H4 8 1.1
1-Butene C H4 8 1.9
trans-2-Butene C H4 8 1.7
cis-2-Butene C H4 8 1.4
1,3-Butadiene C H4 6 7.2
C 's5 0.1
1,2-Butadiene C H4 6 Trace
Propadiene C H4 4 Trace
Methyl acetylene C H4 4 Trace
Ethyl acetylene C H4 4 Trace
Dimethyl acetylene C H4 6 Trace
Vinyl acetylene C H4 4 Trace
Source: Reference 21.
Refer to Figure 4-3 for a process diagram of butadiene production by n-butenes oxidative dehydrogenation.a
TABLE 4-4. TYPICAL COMPOSITION OF n-BUTENES OXIDATIVEDEHYDROGENATION REACTOR PRODUCT STREAMa
4-11
routed to an incinerator. The overhead stream from the hydrocarbon stripping column (not
shown in Figure 4-3) is routed to a light-ends column for further separation.
The C and heavier compounds (labeled hydrocarbons) exiting the4
absorption/stripping process are fed to a distillation operation (Step 4), where butadiene is
separated from the unreacted n-butenes. The n-butenes stream exiting the distillation operation
also contains C and heavier hydrocarbons. This stream is routed to a separation process5
(Step 5), where n-butenes are recovered and recycled to the dehydrogenation reactor.
The stream containing butadiene from the distillation process (Step 4) is routed to
a finishing distillation process (Step 7). At this point, finished butadiene is separated from other
hydrocarbons and sent to pressurized storage. A polymer waste stream generated during the
finishing process is routed to an incinerator. The hydrocarbons are sent to butene separation
process units.
4.1.2 Emissions
Regardless of the process used to produce butadiene, emissions of butadiene at a
production facility may be of five general types: process vent discharges, equipment leaks,
emissions from secondary sources (wastewater, liquid waste, or solid waste discharges), storage-
related releases, and emergency or accidental releases. In Figure 4-1, A through F are process
vents, G represents an emission point after a control device. In Figure 4-2, the process vents are
lettered A through D with E representing an emission point after a control device. In Figure 4-3,
A through F are process vents, G, H, and I are emission points after control devices.
No information about emissions associated with storage or emergency/ accidental
releases is available. Storage vessel discharges may be assumed to be negligible because
butadiene is stored in pressure vessels that have no breathing or working losses. Some losses
during transfer of butadiene are possible if the butadiene is not used on site. However, these
losses should be low because the butadiene has to be transferred under pressure without release
points.
4-12
Emissions are presented in the form of emission factor ranges for process vents
and secondary sources. Individual emission factors having units of pounds (kilograms) of
butadiene emitted per ton (megagram) of butadiene produced were first calculated for each
facility by dividing facility-specific estimates by production, taken as 80 percent of capacity. 19
From these facility-specific emission factors, a range for each source was established. The
values of "n" indicate the number of facilities included. Because facilities reported varying
levels of controls, two sets of emission factor ranges were developed. One range reflects actual
facility emissions in which each facility may control all, some, or none of its sources. The
second range incorporates both emissions from existing uncontrolled sources and potential
emissions from controlled sources if controls had not been in place.
Equipment leak emissions are based on equipment count data collected by CMA
in 1989 and average CMA emission factors for butadiene producers.
Facility-specific emissions estimates and capacity data appear in Appendix C,
Tables C-1 through C-4. These emission factor ranges and annual emissions should be used
only as order-of-magnitude approximations because differences in production processes and
control levels, among other variables, may significantly influence actual emissions.
Process Vent Discharges
Process vent discharges occur from reactor vessels, recovery columns, and other
process vessels. They may occur continuously (from a continuous process) or intermittently
(from a batch process). Some continuous processes also have intermittent VOC emissions
during startup and shutdown, or during control device malfunction or process upsets.
The possible locations of these process vents are shown in Figures 4-1
through 4-3. The actual locations and butadiene content may vary depending on the particular
facility design. In many cases, process vents are directed to other parts of the plant or to a gas
recovery system for use as fuel rather than discharged to the atmosphere.
4-13
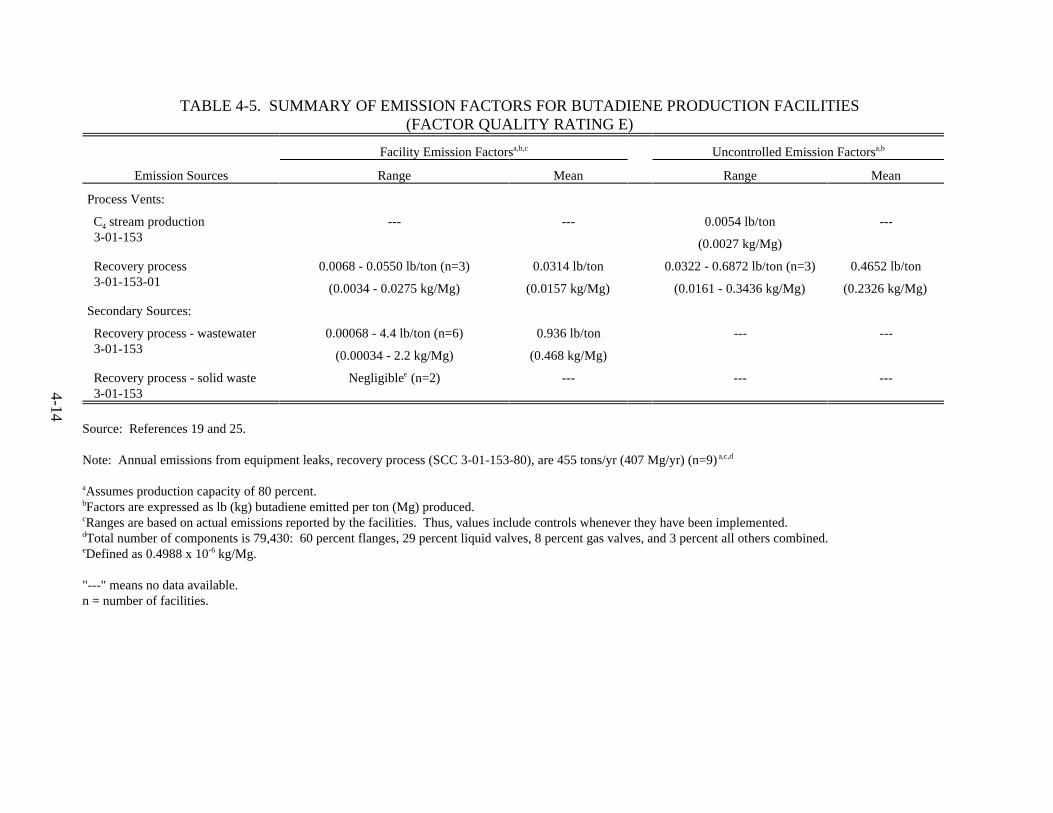
Emissions data, including the use of control devices (six facilities use flares, of which two also
have fuel gas recovery systems), were available for some facilities (see Appendix C). An
emission factor range derived from these data is presented in Table 4-5. Also included in the
table is an uncontrolled emission factor range to provide an indication of the extent to which
controls are used. These were calculated from controlled emission factors using the emissions
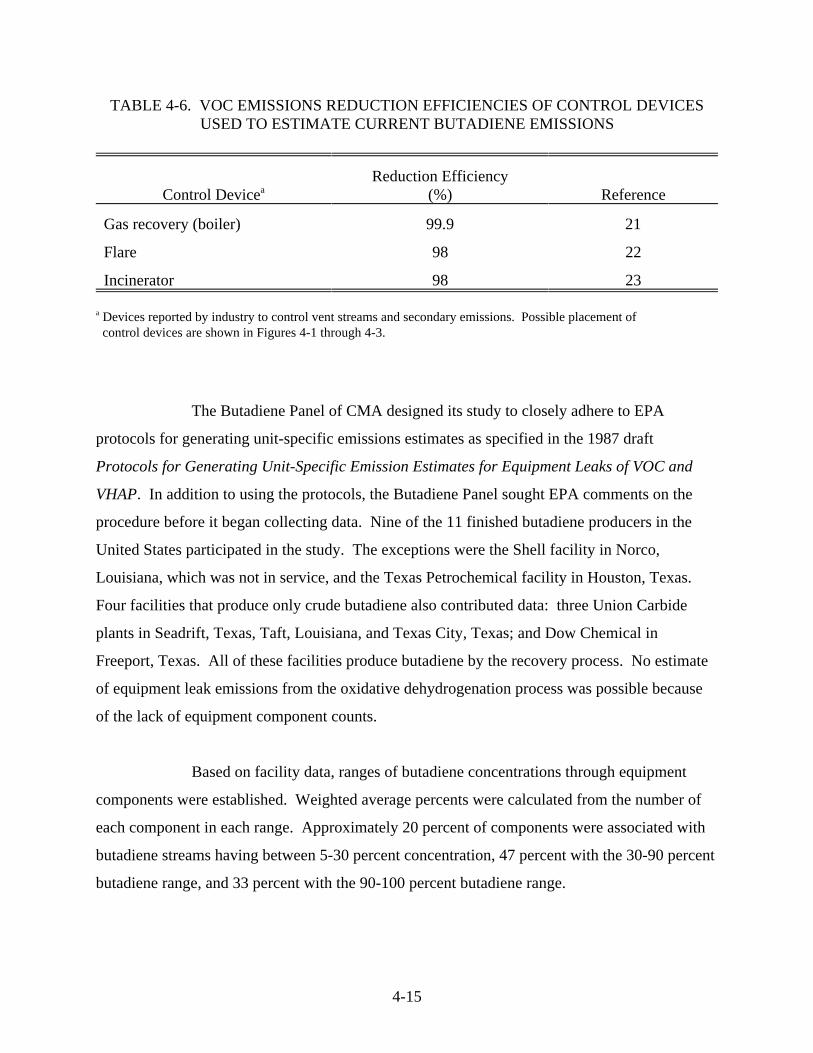
reduction efficiencies listed in Table 4-6. It should be noted that use of these factors22,23,24
introduces uncertainty. Many flares and incinerators achieve greater than 98 percent control. If
99 percent were used as a factor instead of 98, uncontrolled emissions estimates would double.
Processes for both olefins production and butadiene production via oxidative
dehydrogenation are potential sources of emissions. However, the emissions data are limited to
the olefins process at the two facilities. One of the facilities is reportedly controlling process
vents on the oxidative dehydrogenation process at the hydrocarbon absorbing and stripping
column and at the compressors (incinerator and flare) (see Figure 4-3).
Equipment Leak Emissions
Emissions from process equipment components occur when the liquid or gas
process streams leak from the equipment. These components include pump seals, process valves,
compressors, safety relief valves (pressure relief devices), flanges, open-ended lines, and
sampling connections.
The emissions estimates shown in Table 4-5 are the results of a study conducted
by CMA. The study's objective was to develop industry-specific emission factors to replace25
SOCMI emission factors because the SOCMI emission factors were thought to overestimate26
equipment leak emissions for butadiene producers. The study recommends, however, that
screening data and correlation equations (also revised) be used to generate the most accurate
estimates.
4-1
4
TABLE 4-5. SUMMARY OF EMISSION FACTORS FOR BUTADIENE PRODUCTION FACILITIES(FACTOR QUALITY RATING E)
Emission Sources
Facility Emission Factorsa,b,c Uncontrolled Emission Factorsa,b
Range Mean Range Mean
Process Vents:
C stream production4
3-01-153--- --- 0.0054 lb/ton ---
(0.0027 kg/Mg)
Recovery process 3-01-153-01
0.0068 - 0.0550 lb/ton (n=3) 0.0314 lb/ton 0.0322 - 0.6872 lb/ton (n=3) 0.4652 lb/ton
(0.0034 - 0.0275 kg/Mg) (0.0157 kg/Mg) (0.0161 - 0.3436 kg/Mg) (0.2326 kg/Mg)
Secondary Sources:
Recovery process - wastewater 3-01-153
0.00068 - 4.4 lb/ton (n=6) 0.936 lb/ton --- ---
(0.00034 - 2.2 kg/Mg) (0.468 kg/Mg)
Recovery process - solid waste 3-01-153
Negligible (n=2)e --- --- ---
Source: References 19 and 25.
Note: Annual emissions from equipment leaks, recovery process (SCC 3-01-153-80), are 455 tons/yr (407 Mg/yr) (n=9)a,c,d
Assumes production capacity of 80 percent. a
Factors are expressed as lb (kg) butadiene emitted per ton (Mg) produced.b
Ranges are based on actual emissions reported by the facilities. Thus, values include controls whenever they have been implemented.c
Total number of components is 79,430: 60 percent flanges, 29 percent liquid valves, 8 percent gas valves, and 3 percent all others combined.d
Defined as 0.4988 x 10 kg/Mg.e -6
"---" means no data available.n = number of facilities.
4-15
Control DeviceaReduction Efficiency
(%) Reference
Gas recovery (boiler) 99.9 21
Flare 98 22
Incinerator 98 23
Devices reported by industry to control vent streams and secondary emissions. Possible placement ofa
control devices are shown in Figures 4-1 through 4-3.
TABLE 4-6. VOC EMISSIONS REDUCTION EFFICIENCIES OF CONTROL DEVICESUSED TO ESTIMATE CURRENT BUTADIENE EMISSIONS
The Butadiene Panel of CMA designed its study to closely adhere to EPA
protocols for generating unit-specific emissions estimates as specified in the 1987 draft
Protocols for Generating Unit-Specific Emission Estimates for Equipment Leaks of VOC and
VHAP. In addition to using the protocols, the Butadiene Panel sought EPA comments on the
procedure before it began collecting data. Nine of the 11 finished butadiene producers in the
United States participated in the study. The exceptions were the Shell facility in Norco,
Louisiana, which was not in service, and the Texas Petrochemical facility in Houston, Texas.
Four facilities that produce only crude butadiene also contributed data: three Union Carbide
plants in Seadrift, Texas, Taft, Louisiana, and Texas City, Texas; and Dow Chemical in
Freeport, Texas. All of these facilities produce butadiene by the recovery process. No estimate
of equipment leak emissions from the oxidative dehydrogenation process was possible because
of the lack of equipment component counts.
Based on facility data, ranges of butadiene concentrations through equipment
components were established. Weighted average percents were calculated from the number of
each component in each range. Approximately 20 percent of components were associated with
butadiene streams having between 5-30 percent concentration, 47 percent with the 30-90 percent
butadiene range, and 33 percent with the 90-100 percent butadiene range.
4-16
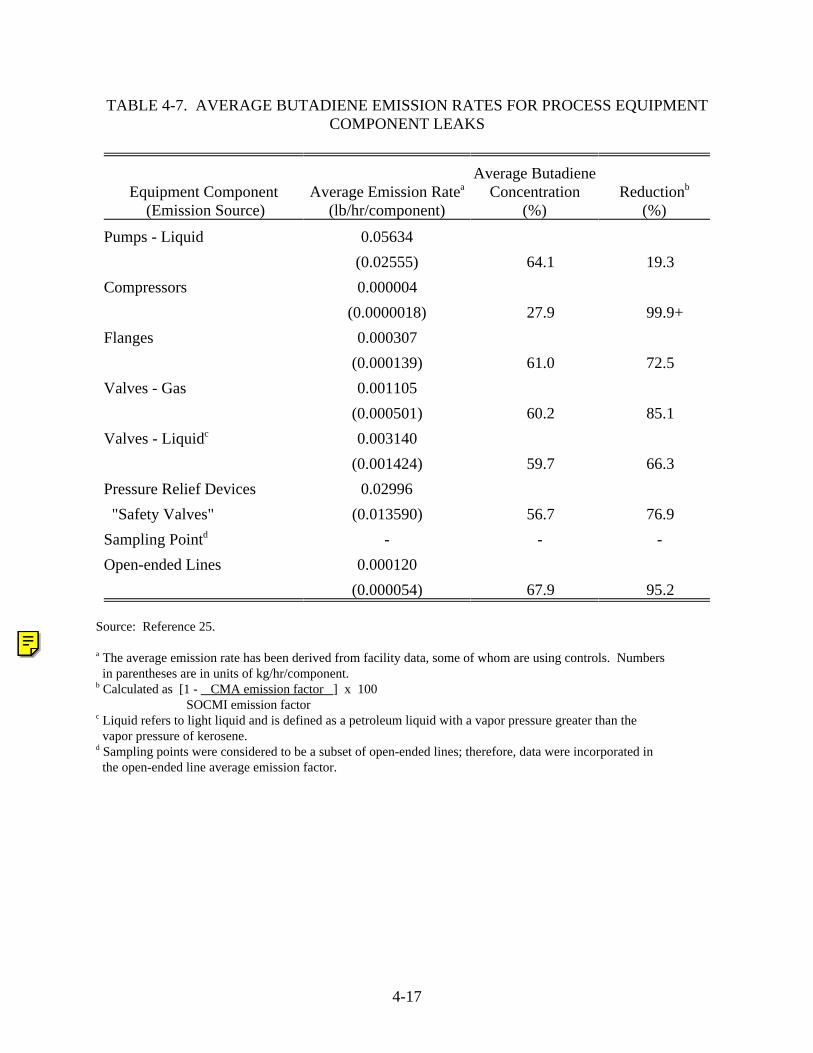
The screening data collected were similarly grouped into ranges of concentration
[parts per million (ppm)] based on the instrument readout and the butadiene concentration in the
stream. Five ranges from 0-9 to >9999 ppm were used. Upon calculating weighted average
percents, about 76 percent of components fell in the 0-9 ppm range and 19 percent in the 10-99
ppm range. Fewer than 6 percent were found to be greater than 100 ppm. Table 4-7
summarizes the study results. 25
In addition to average emission rates, average butadiene concentration in the
stream through each type of component is shown. These average concentrations were used to
convert SOCMI emission factors from units of VOC emissions to butadiene emissions for
purposes of comparison to the new emission rates. The results of this comparison are also given
in Table 4-7.
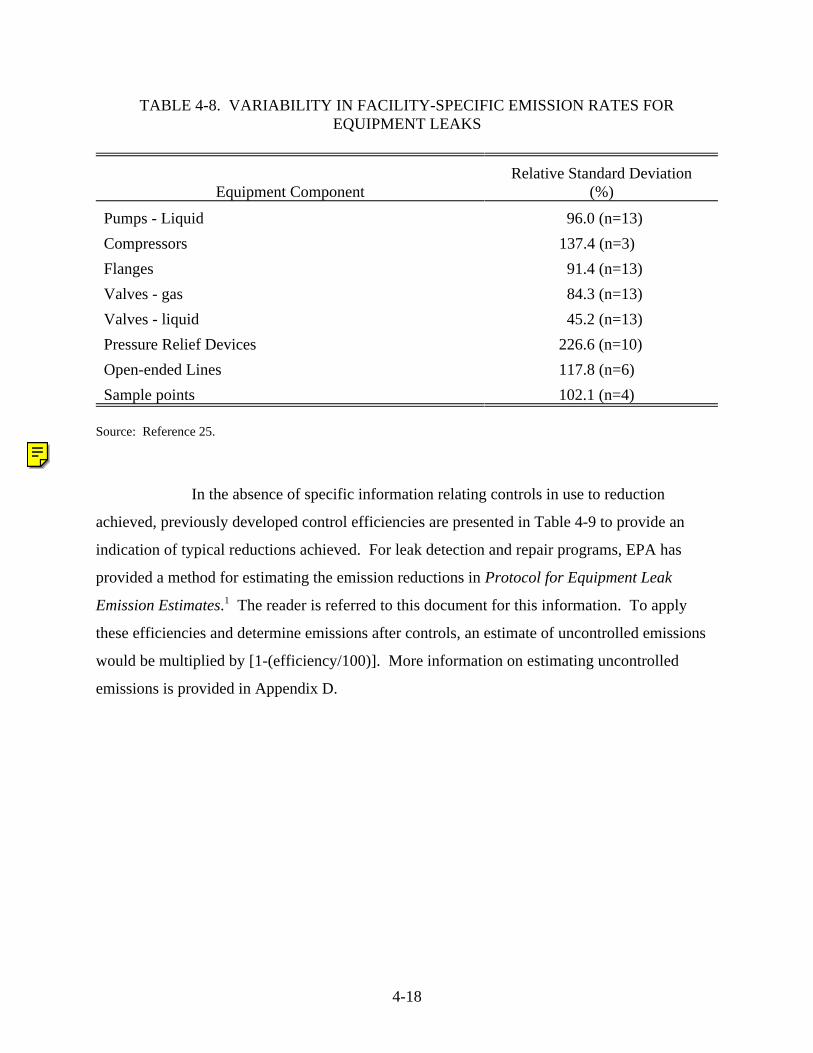
In addition to compiling the data from all facilities, the study analyzed the data on
a plant-specific level. Table 4-8 provides the variability among the plants by component type
determined from this analysis. 25
The emissions shown in Table 4-7 include the reduction achieved by the various
controls in place at the 13 facilities. The Butadiene Panel conducted a survey to identify and
evaluate practices in the plants that would contribute to emissions reductions. Of the six
respondents, all stated that they monitor fugitive emissions using a combination of visual
observation and automatic audible alarm for specific equipment such as pumps and compressors.
Three plants have routine leak inspection and maintenance programs. Two plants informally
require immediate repair of leaks detected by the monitoring system. Five of the six plants
reported combinations of visual inspections, pressure testing, VOC monitoring, use of double-
sealed pumps, seals vented to a flare, bubble-testing flanges, tightness testing of valves, use of
special packing material, closed-loop sampling points, and plugging of all open-ended lines. No
estimate of the emissions reductions achieved by these practices was determined.
4-17
Equipment Component (Emission Source)
Average Emission Ratea
(lb/hr/component)
Average ButadieneConcentration
(%)Reductionb
(%)
Pumps - Liquid 0.05634
(0.02555) 64.1 19.3
Compressors 0.000004
(0.0000018) 27.9 99.9+
Flanges 0.000307
(0.000139) 61.0 72.5
Valves - Gas 0.001105
(0.000501) 60.2 85.1
Valves - Liquidc 0.003140
(0.001424) 59.7 66.3
Pressure Relief Devices 0.02996
"Safety Valves" (0.013590) 56.7 76.9
Sampling Pointd - - -
Open-ended Lines 0.000120
(0.000054) 67.9 95.2
Source: Reference 25.
The average emission rate has been derived from facility data, some of whom are using controls. Numbersa
in parentheses are in units of kg/hr/component. Calculated as [1 - CMA emission factor ] x 100b
SOCMI emission factor Liquid refers to light liquid and is defined as a petroleum liquid with a vapor pressure greater than thec
vapor pressure of kerosene. Sampling points were considered to be a subset of open-ended lines; therefore, data were incorporated ind
the open-ended line average emission factor.
TABLE 4-7. AVERAGE BUTADIENE EMISSION RATES FOR PROCESS EQUIPMENTCOMPONENT LEAKS
4-18
Equipment ComponentRelative Standard Deviation
(%)
Pumps - Liquid 96.0 (n=13)
Compressors 137.4 (n=3)
Flanges 91.4 (n=13)
Valves - gas 84.3 (n=13)
Valves - liquid 45.2 (n=13)
Pressure Relief Devices 226.6 (n=10)
Open-ended Lines 117.8 (n=6)
Sample points 102.1 (n=4)
Source: Reference 25.
TABLE 4-8. VARIABILITY IN FACILITY-SPECIFIC EMISSION RATES FOREQUIPMENT LEAKS
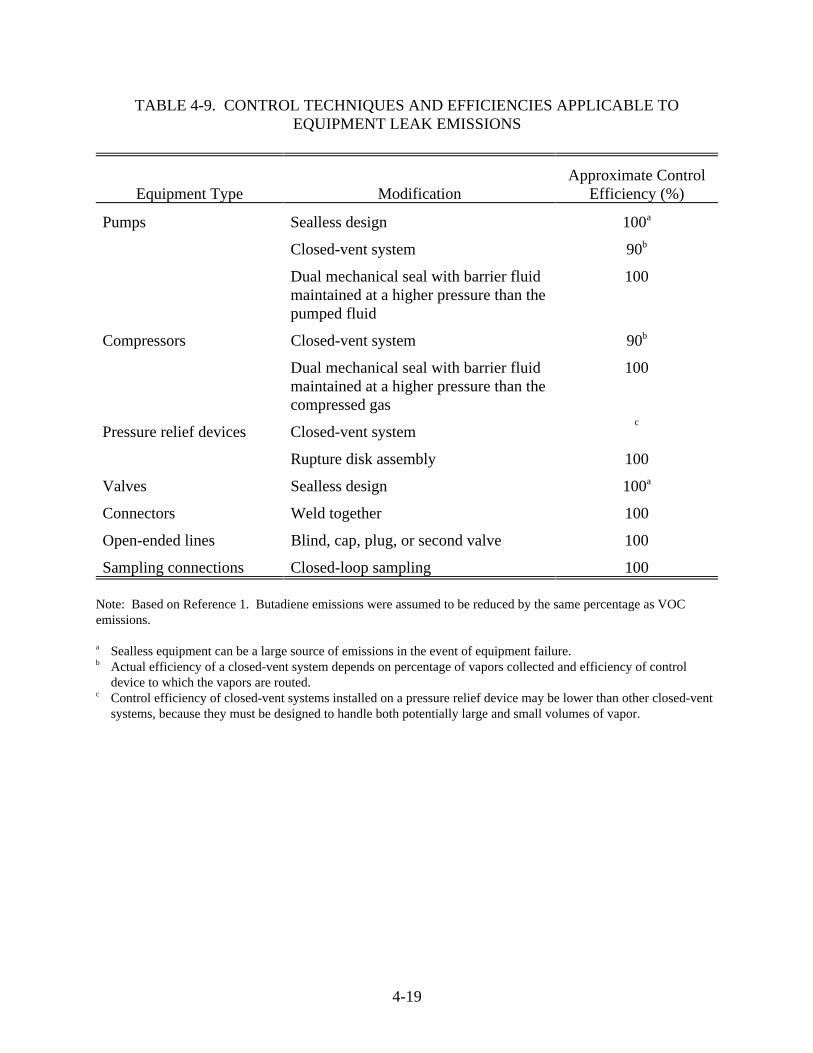
In the absence of specific information relating controls in use to reduction
achieved, previously developed control efficiencies are presented in Table 4-9 to provide an
indication of typical reductions achieved. For leak detection and repair programs, EPA has
provided a method for estimating the emission reductions in Protocol for Equipment Leak
Emission Estimates. The reader is referred to this document for this information. To apply1
these efficiencies and determine emissions after controls, an estimate of uncontrolled emissions
would be multiplied by [1-(efficiency/100)]. More information on estimating uncontrolled
emissions is provided in Appendix D.
4-19
Equipment Type ModificationApproximate Control
Efficiency (%)
Pumps Sealless design 100a
Closed-vent system 90b
Dual mechanical seal with barrier fluidmaintained at a higher pressure than thepumped fluid
100
Compressors Closed-vent system 90b
Dual mechanical seal with barrier fluidmaintained at a higher pressure than thecompressed gas
100
Pressure relief devices Closed-vent systemc
Rupture disk assembly 100
Valves Sealless design 100a
Connectors Weld together 100
Open-ended lines Blind, cap, plug, or second valve 100
Sampling connections Closed-loop sampling 100
Note: Based on Reference 1. Butadiene emissions were assumed to be reduced by the same percentage as VOCemissions.
Sealless equipment can be a large source of emissions in the event of equipment failure.a
Actual efficiency of a closed-vent system depends on percentage of vapors collected and efficiency of controlb
device to which the vapors are routed.Control efficiency of closed-vent systems installed on a pressure relief device may be lower than other closed-ventc
systems, because they must be designed to handle both potentially large and small volumes of vapor.
TABLE 4-9. CONTROL TECHNIQUES AND EFFICIENCIES APPLICABLE TOEQUIPMENT LEAK EMISSIONS
4-20
Secondary Emissions
Secondary emissions occur during the treatment and disposal of wastewater, other
liquid waste, and solid waste. Few emissions estimates are available, and most of these data
pertain to wastewater from the butadiene recovery process. Table 4-5 summarizes emission
factors derived from the estimated wastewater and solid waste emissions in Appendix C. No
factors are available for the olefins process, the oxidative dehydrogenation process, or for any
liquid waste other than wastewater. The types of waste streams generating butadiene emissions
include cooling water, wash water, solvent recovery wastewater, process unit wastewater, and
waste polymer.
Because of its volatility and low solubility in water, butadiene in a waste stream is
assumed to completely volatilize unless the vapor is routed to a control device. Some facilities
use such emission control systems; others do not. Available information on facility control
status and handling of the waste streams in 1984 is summarized in Appendix C.
5-1
SECTION 5.0
EMISSIONS FROM MAJOR USES OF BUTADIENE
Emissions from industrial processes using butadiene as a raw material are
discussed in this section. Butadiene has six primary commercial uses, as illustrated in the
chemical use tree in Figure 3-1. These uses are the production of styrene-butadiene (SB)
copolymer, polybutadiene, adiponitrile, neoprene, acrylonitrile-butadiene-styrene (ABS)
copolymer, and nitrile elastomer.
This section includes a subsection for each major use. Each subsection provides a
general discussion of the production process, estimates of the associated butadiene emissions,
and a description of any existing emissions control practices. These discussions are primarily
based on summary memoranda of industry responses to EPA Section 114 questionnaires,
National Institute for Occupational Safety and Health (NIOSH) survey reports, and various other
reports as referenced, and represent information gathered prior to 1986. The level of detail
varies according to the availability of information. In view of these limitations, the reader is
advised to contact individual facilities or review State permit files for more complete and
accurate information.
As with butadiene production sources, emission factor ranges in units of pounds
(kilograms) butadiene emitted per ton (megagram) produced are provided for process vents and
secondary sources, based on annual emissions estimates of tons/yr (Mg/yr). The same procedure
described in Section 4.0 for calculating facility emission factors was followed to establish these
ranges. Assumptions about production are provided in each subsection.
5-2
Equipment leak emissions are presented as annual emissions and were derived
using the procedure in Appendix D and the CMA emission factors presented in Section 4.0.
Although developed for butadiene producers, these emission factors were assumed to better
represent practices of the user industries because all involve butadiene handling. Three
alternative methods would be to (1) collect screening data and use correlation equations
established in the CMA work, (2) apply SOCMI emission factors, weighted for the percent
butadiene in the stream, or (3) apply other alternatives identified in the EPA document 1995
Protocols for Equipment Leak Emission Estimates. The equipment leak emission estimates1
generally represent some level of control because the average emission rate is based on practices
at butadiene producers.
The emission factors and annual emission values should be used only as estimates
because facilities did not always provide complete information, and source characteristics cannot
be assumed to be the same from location to location. The number of facilities included in
establishing the range is indicated in parentheses; the individual values are reported in
Appendix C.
Company identification and corresponding facility locations for the various
production process are also given in each subsection. The production capacities supplied are, in
most cases, taken from more recent (1992-1993) references.
5.1 STYRENE-BUTADIENE COPOLYMER PRODUCTION
Styrene-butadiene copolymers are composed of the monomer units butadiene and
styrene. Depending upon the feed composition and extent of drying in the process, SB
copolymers can be a solid or an emulsion.
Copolymers of styrene and butadiene that contain over 45 percent butadiene have
rubber-like properties. The copolymers become more plastic-like when the styrene content is
increased to above 45 percent. Copolymers with more than 45 percent butadiene are27
sometimes referred to as styrene-butadiene rubber (SBR); products with more styrene may be
5-3
referred to as SB latex. No distinction is made in the following discussion because emissions
data are not differentiated. The term elastomer will be used in a generic sense, meaning solid
copolymer.
Styrene-butadiene latex is an elastomer emulsion. Styrene-butadiene rubber is
also used as an emulsion. The emulsion process is the same process used for elastomers, except
that it lacks the emulsion breaking (coagulation) and drying steps. The term latex is used here
when referring to both SB and SBR emulsion.
Styrene-butadiene copolymers account for 40 percent of national butadiene
consumption. The majority of SB elastomer produced is used by the tire industry. Latex has a8
wider variety of uses in industries such as textiles, paper, and adhesives manufacturing.
5.1.1 Process Description
Elastomer is manufactured by two processes: (1) the emulsion process, where
monomer is dispersed in water, and (2) the solution process, where monomer is dissolved in a
solvent. The emulsion process is more commonly used. Latex is similarly produced but is
removed prior to the final processing that generates the solid copolymer.
A generalized block flow diagram of an elastomer and latex production process is
shown in Figure 5-1. Stored butadiene and styrene monomers are first washed to remove any27
inhibitors of the polymerization reaction (Step 1). The scrubbed monomers are then fed into
polymerization reactors (Step 2) along with the ingredients listed in Table 5-1. After the28
polymerization reaction has progressed to the desired extent, a polymer emulsion (latex) is
removed from the reactors along with unreacted monomer (Step 3). Both styrene and butadiene
are separated from the latex and recycled to the monomer feed tanks.
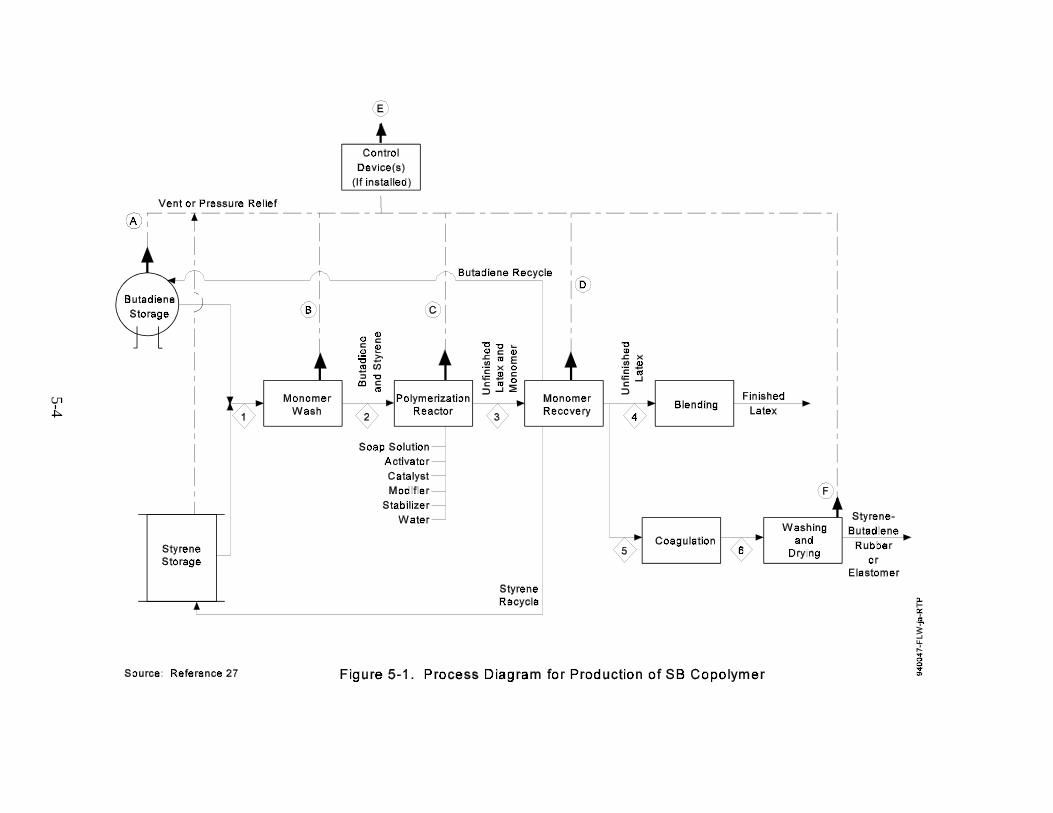
5-4
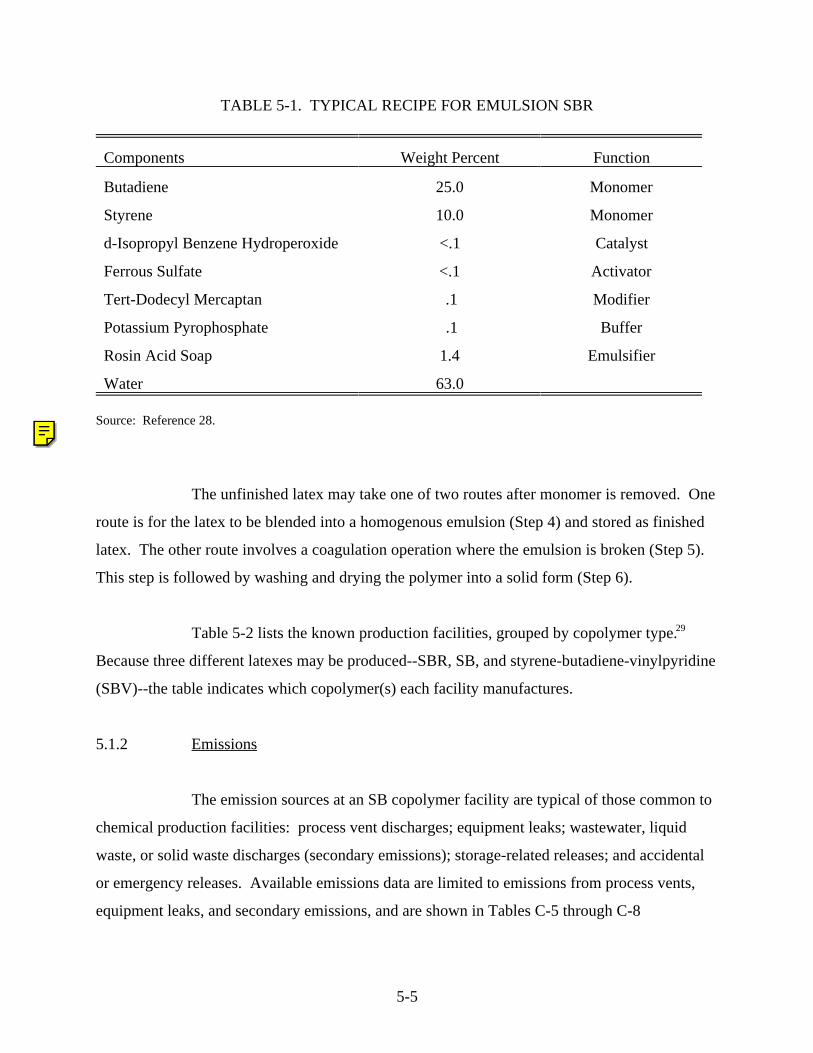
5-5
Components Weight Percent Function
Butadiene 25.0 Monomer
Styrene 10.0 Monomer
d-Isopropyl Benzene Hydroperoxide <.1 Catalyst
Ferrous Sulfate <.1 Activator
Tert-Dodecyl Mercaptan .1 Modifier
Potassium Pyrophosphate .1 Buffer
Rosin Acid Soap 1.4 Emulsifier
Water 63.0
Source: Reference 28.
TABLE 5-1. TYPICAL RECIPE FOR EMULSION SBR
The unfinished latex may take one of two routes after monomer is removed. One
route is for the latex to be blended into a homogenous emulsion (Step 4) and stored as finished
latex. The other route involves a coagulation operation where the emulsion is broken (Step 5).
This step is followed by washing and drying the polymer into a solid form (Step 6).
Table 5-2 lists the known production facilities, grouped by copolymer type. 29
Because three different latexes may be produced--SBR, SB, and styrene-butadiene-vinylpyridine
(SBV)--the table indicates which copolymer(s) each facility manufactures.
5.1.2 Emissions
The emission sources at an SB copolymer facility are typical of those common to
chemical production facilities: process vent discharges; equipment leaks; wastewater, liquid
waste, or solid waste discharges (secondary emissions); storage-related releases; and accidental
or emergency releases. Available emissions data are limited to emissions from process vents,
equipment leaks, and secondary emissions, and are shown in Tables C-5 through C-8
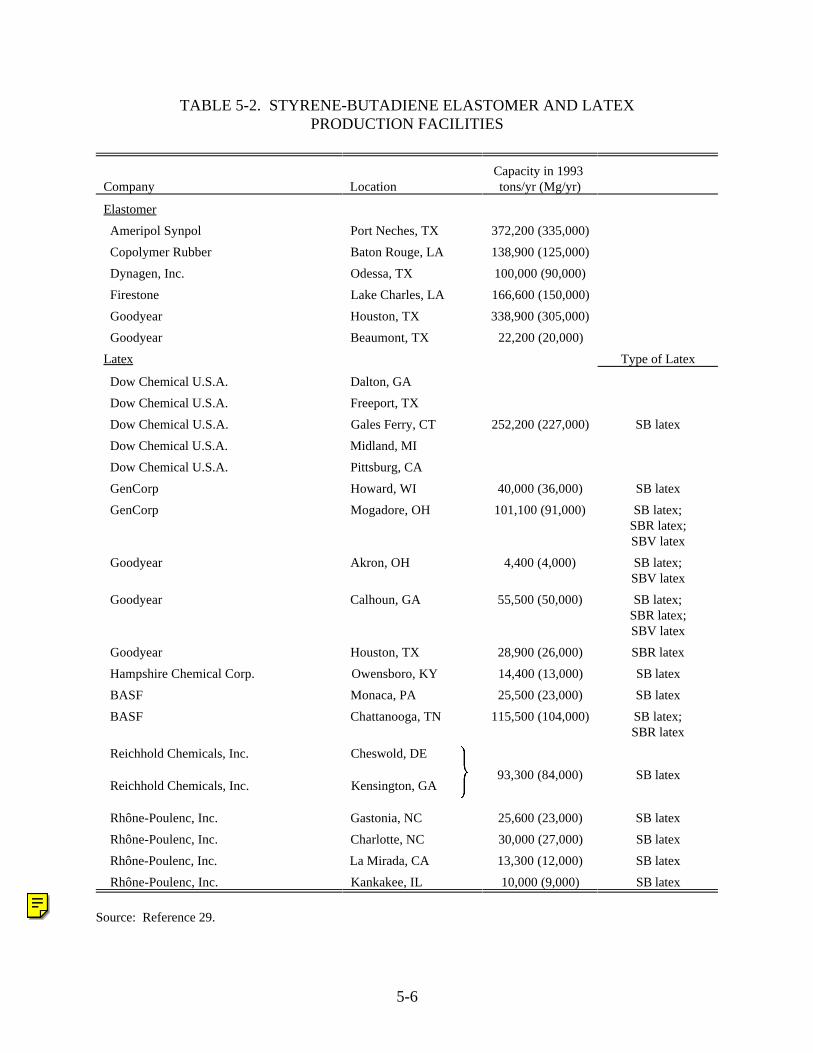
5-6
Company LocationCapacity in 1993 tons/yr (Mg/yr)
Elastomer
Ameripol Synpol Port Neches, TX 372,200 (335,000)
Copolymer Rubber Baton Rouge, LA 138,900 (125,000)
Dynagen, Inc. Odessa, TX 100,000 (90,000)
Firestone Lake Charles, LA 166,600 (150,000)
Goodyear Houston, TX 338,900 (305,000)
Goodyear Beaumont, TX 22,200 (20,000)
Latex Type of Latex
Dow Chemical U.S.A. Dalton, GA
Dow Chemical U.S.A. Freeport, TX
Dow Chemical U.S.A. Gales Ferry, CT 252,200 (227,000) SB latex
Dow Chemical U.S.A. Midland, MI
Dow Chemical U.S.A. Pittsburg, CA
GenCorp Howard, WI 40,000 (36,000) SB latex
GenCorp Mogadore, OH 101,100 (91,000) SB latex;SBR latex;SBV latex
Goodyear Akron, OH 4,400 (4,000) SB latex;SBV latex
Goodyear Calhoun, GA 55,500 (50,000) SB latex;SBR latex;SBV latex
Goodyear Houston, TX 28,900 (26,000) SBR latex
Hampshire Chemical Corp. Owensboro, KY 14,400 (13,000) SB latex
BASF Monaca, PA 25,500 (23,000) SB latex
BASF Chattanooga, TN 115,500 (104,000) SB latex;SBR latex
Reichhold Chemicals, Inc. Cheswold, DE
$ 93,300 (84,000) SB latex Reichhold Chemicals, Inc. Kensington, GA
Rhône-Poulenc, Inc. Gastonia, NC 25,600 (23,000) SB latex
Rhône-Poulenc, Inc. Charlotte, NC 30,000 (27,000) SB latex
Rhône-Poulenc, Inc. La Mirada, CA 13,300 (12,000) SB latex
Rhône-Poulenc, Inc. Kankakee, IL 10,000 (9,000) SB latex
Source: Reference 29.
TABLE 5-2. STYRENE-BUTADIENE ELASTOMER AND LATEXPRODUCTION FACILITIES
5-7
in Appendix C. In developing emission factors, the facilities were assumed to be operating at
80 percent production capacity. 27
Butadiene used in elastomer production is usually stored in pressurized vessels
with some vented to a flare (point A in Figure 5-1). Storage, therefore, results in low emissions.
Two facilities, however, store butadiene-containing material in fixed-roof storage tanks.
Emissions are estimated to be low because of the low concentrations of butadiene (5 percent by
weight or less).
Butadiene users do not transfer butadiene as a product onto tank trucks, so
emissions from transfer operations are not of concern. Unloading emissions would be mostly
emitted as storage tank working losses (already discussed under storage). Moving butadiene
around within the plant is covered by equipment leak emission estimates.
Process Vent Emissions
As seen from the vent locations in Figure 5-1, process vent discharges occur from
reactor vessels, recovery columns, and other process vessels. They may occur continuously
(from a continuous process) or intermittently (from a batch process). Some continuous
processes have emissions during startup and shutdown or during a control device malfunction or
process upset.
The potential locations of these process vents (Vents B, C, D, F) are shown in
Figure 5-1. Although the actual locations and butadiene content may vary depending on the
facility design, process vents are typically located on absorption columns used to recover
butadiene. In some cases, process vents are directed to other parts of the plant, or to a gas
recovery system for use as fuel, rather than discharged to the atmosphere.
The available emissions data are presented in Table 5-3 as emission factor ranges.
The facility emission factor range was calculated as described in Section 4.0 and reflects actual
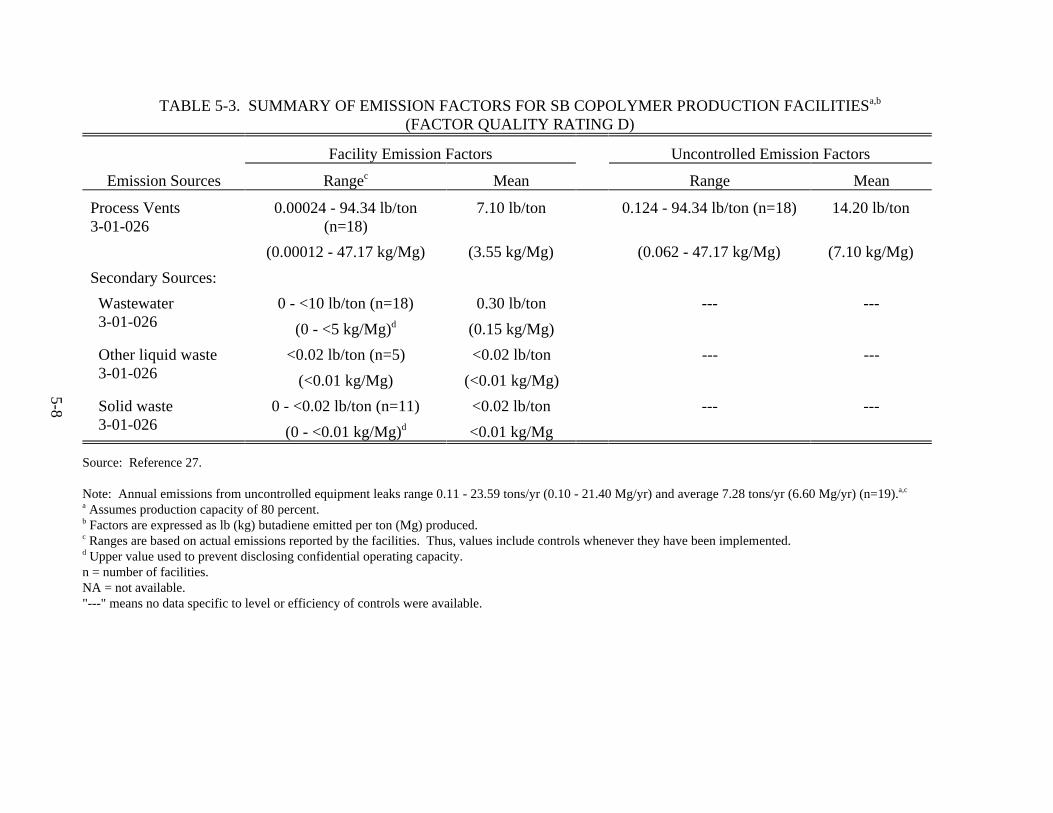
5-8
TABLE 5-3. SUMMARY OF EMISSION FACTORS FOR SB COPOLYMER PRODUCTION FACILITIESa,b
(FACTOR QUALITY RATING D)
Emission Sources
Facility Emission Factors Uncontrolled Emission Factors
Rangec Mean Range Mean
Process Vents3-01-026
0.00024 - 94.34 lb/ton(n=18)
7.10 lb/ton 0.124 - 94.34 lb/ton (n=18) 14.20 lb/ton
(0.00012 - 47.17 kg/Mg) (3.55 kg/Mg) (0.062 - 47.17 kg/Mg) (7.10 kg/Mg)
Secondary Sources:
Wastewater 3-01-026
0 - <10 lb/ton (n=18) 0.30 lb/ton --- ---
(0 - <5 kg/Mg)d (0.15 kg/Mg)
Other liquid waste 3-01-026
<0.02 lb/ton (n=5) <0.02 lb/ton --- ---
(<0.01 kg/Mg) (<0.01 kg/Mg)
Solid waste 3-01-026
0 - <0.02 lb/ton (n=11) <0.02 lb/ton --- ---
(0 - <0.01 kg/Mg)d <0.01 kg/Mg
Source: Reference 27.
Note: Annual emissions from uncontrolled equipment leaks range 0.11 - 23.59 tons/yr (0.10 - 21.40 Mg/yr) and average 7.28 tons/yr (6.60 Mg/yr) (n=19).a,c
Assumes production capacity of 80 percent. a
Factors are expressed as lb (kg) butadiene emitted per ton (Mg) produced.b
Ranges are based on actual emissions reported by the facilities. Thus, values include controls whenever they have been implemented.c
Upper value used to prevent disclosing confidential operating capacity.d
n = number of facilities.NA = not available."---" means no data specific to level or efficiency of controls were available.
5-9
emissions and the various levels of control reported. The second emission factor range
incorporates both emissions from existing uncontrolled sources and potential emissions from
controlled sources with controls removed. 27
Although 20 facilities supplied emissions data (Table C-6), production capacities
for two were not available; therefore, these two were omitted from the emission factor range
development. Control devices in use include absorbers, boilers, flares, scrubbers, and pressure
condensers. Emissions after controls (Vent E) were calculated by applying appropriate
reduction efficiencies. Standard control efficiencies from Table 4-6 were used to calculate
controlled emissions unless alternate values were supplied by the companies and accompanied
by quantitative documentation.
Equipment Leak Emissions
Emissions occur from process equipment components whenever the liquid or gas
process streams leak from the equipment. Butadiene emissions were estimated for the following
equipment components: pump seals, process valves, compressors, safety relief valves (pressure
devices), flanges, open-ended lines, and sampling connections. For each facility where the
number of equipment components was known, emissions were estimated using emission rates
presented in Table 4-7. The method is described further in Appendix D. Although these
emission rates include an unknown level of control at butadiene producer, the only controls
reported in use by the industry are flares and/or rupture discs for pressure relief devices (PRD).
Some facilities perform visual inspections, but with an unknown frequency. These estimates
may not represent emissions at SB copolymer facilities where control practices differ. A
summary of the available data is given in Table 5-3.
Secondary Emissions
Secondary emissions occur at the on-site and off-site facilities that treat and
dispose of wastewater, liquid waste, or solid waste. Waste streams may be generated from any
of the operations shown in Figure 5-1. Emissions data are available for 18 of the 21 facilities,
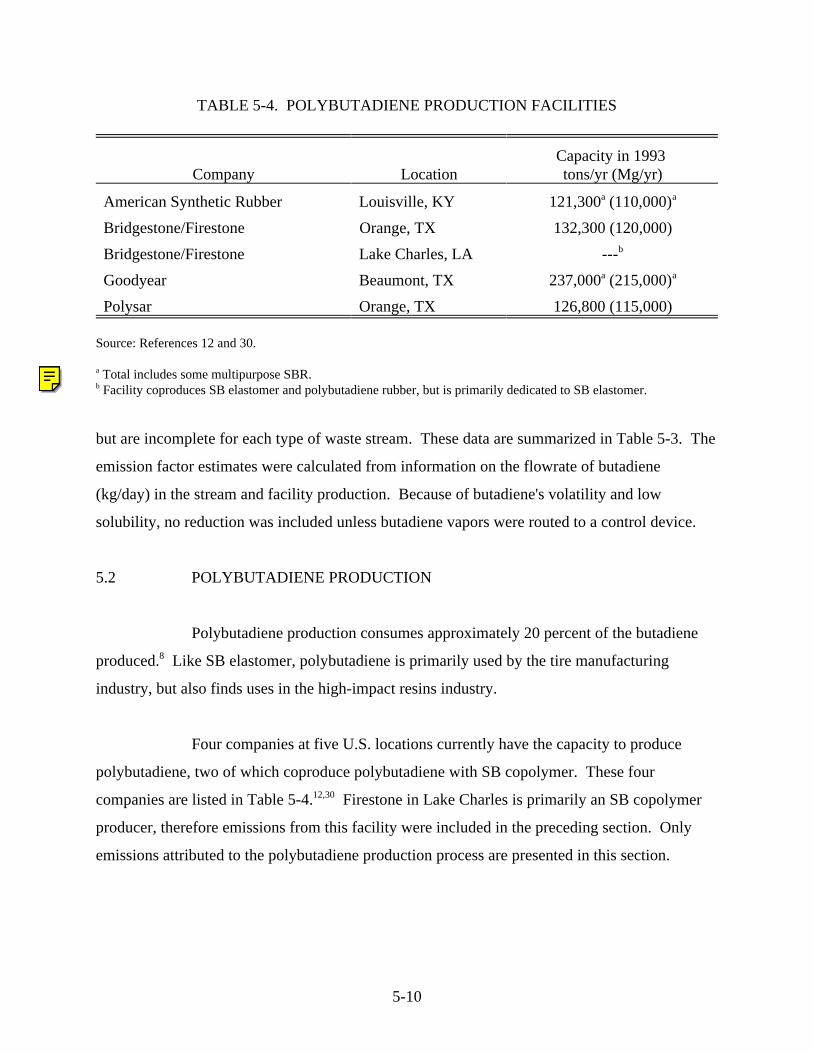
5-10
Company LocationCapacity in 1993 tons/yr (Mg/yr)
American Synthetic Rubber Louisville, KY 121,300 (110,000)a a
Bridgestone/Firestone Orange, TX 132,300 (120,000)
Bridgestone/Firestone Lake Charles, LA ---b
Goodyear Beaumont, TX 237,000 (215,000)a a
Polysar Orange, TX 126,800 (115,000)
Source: References 12 and 30.
Total includes some multipurpose SBR. a
Facility coproduces SB elastomer and polybutadiene rubber, but is primarily dedicated to SB elastomer.b
TABLE 5-4. POLYBUTADIENE PRODUCTION FACILITIES
but are incomplete for each type of waste stream. These data are summarized in Table 5-3. The
emission factor estimates were calculated from information on the flowrate of butadiene
(kg/day) in the stream and facility production. Because of butadiene's volatility and low
solubility, no reduction was included unless butadiene vapors were routed to a control device.
5.2 POLYBUTADIENE PRODUCTION
Polybutadiene production consumes approximately 20 percent of the butadiene
produced. Like SB elastomer, polybutadiene is primarily used by the tire manufacturing8
industry, but also finds uses in the high-impact resins industry.
Four companies at five U.S. locations currently have the capacity to produce
polybutadiene, two of which coproduce polybutadiene with SB copolymer. These four
companies are listed in Table 5-4. Firestone in Lake Charles is primarily an SB copolymer12,30
producer, therefore emissions from this facility were included in the preceding section. Only
emissions attributed to the polybutadiene production process are presented in this section.
5-11
5.2.1 Process Description
The polymerization of butadiene can yield several isomeric polymers. The two of
commercial significance are the cis-1,4 isomer and, to a much lesser extent, the 1,2 isomer. 31
The majority of polybutadiene is produced by a solution polymerization process. Smaller
quantities are produced by an emulsion polymerization process. The relative proportions of the
isomers formed are dependent on the catalyst system used and reaction conditions.
The cis-polybutadiene rubber process consists of five basic steps: (1) butadiene
and solvent purification, (2) reaction, (3) concentrations, (4) solvent removal, and (5) drying and
packaging. Figure 5-2 shows a diagram of this process. In Step 1, feed butadiene is dried and31
combined with a recycled butadiene stream. Solvent, typically hexane or cyclohexane, is also
dried along with a recycled solvent stream. In Step 2, these streams are fed to the reactor, where
polymerization takes place. With solution polymerization, a catalyst, such as lithium, sodium, or
potassium, is used. The overall conversion of the process is greater than 98 percent. 31
Reactor effluent is fed to the concentrator (Step 3), where any unreacted
butadiene is removed for recycling. The product stream leaving the concentrator consists of
polybutadiene dissolved in solvent, and is often referred to as "cement." The cement stream
leaving the concentrator contains negligible butadiene. In Step 4, the cement is stripped of
solvent, which is recycled to solvent purification. Stripping occurs through direct steam contact.
The resulting polybutadiene crumb/water stream is dried, compressed, and packaged in Step 5.
This process is run both continuously and in batch mode, but the majority of facilities operate
continuously.
5.2.2 Emissions
Butadiene emissions from polybutadiene production are primarily of four types:
process vent emissions, equipment leaks, secondary emissions, and accidental or emergency
releases. Storage under pressure significantly reduces any potential for storage emissions
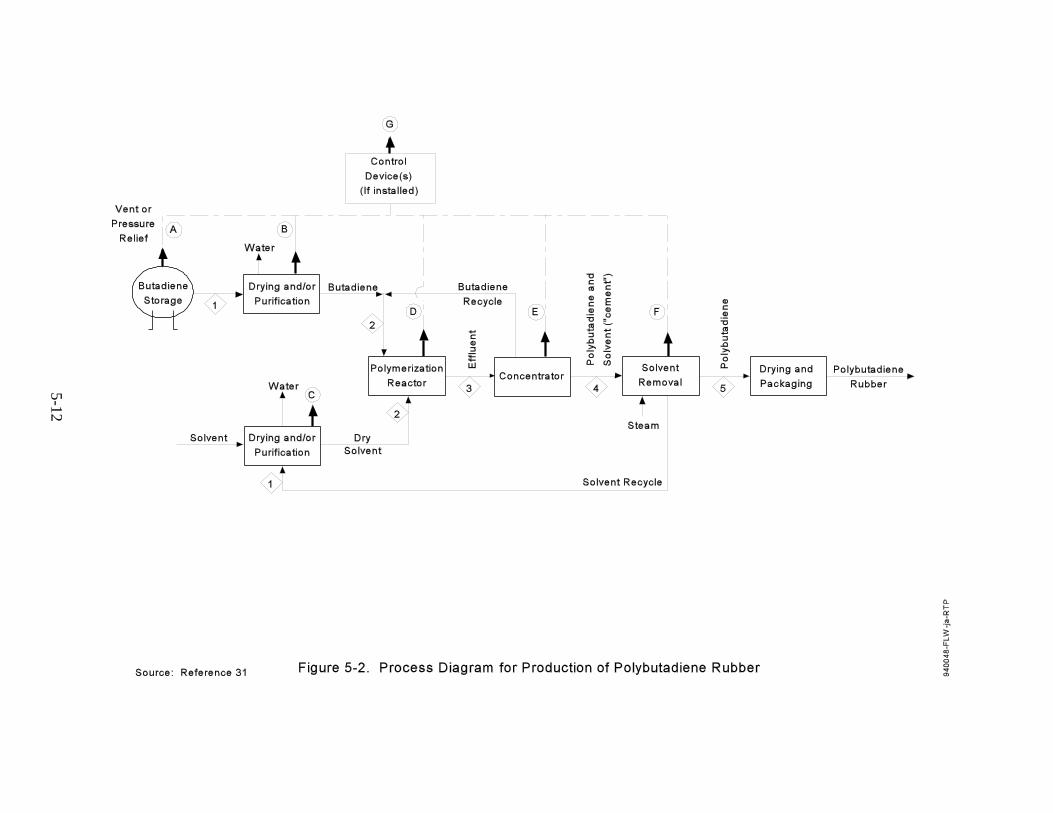
5-1
2
5-13
(point A in Figure 5-2), although source emissions during handling and transport of raw material
are possible. Each emission type is discussed separately below. Typical production for the
industry is estimated at 81 percent of capacity. This is incorporated into the emission factor31
calculations.
Process Vent Emissions
Process vent emissions occur during purging of noncondensible gases from
reactors and other process vessels. The emissions may occur continuously or intermittently.
Emission points indicated in Figure 5-2 as Vents B through F give the possible vent locations for
butadiene releases. Emissions after the control device are denoted as Vent G in the process
diagram.
Data on 1984 emissions, both uncontrolled and controlled, and the control type
and efficiency are available for each facility and are summarized as emission factor ranges in
Table 5-5 (for raw data, see Tables C-9 and C-10 in Appendix C). The two ranges were
developed to represent actual emissions, where existing controls are taken into account, and
potential emissions, where all reported sources are treated as uncontrolled sources.
In 1984, all facilities but one were controlling process vent emissions. Four used
at least a flare, and one also used a butadiene absorber. The fifth used a butadiene recovery
system. Two facilities reported control efficiencies greater than 98 percent; however, 98 percent
was used as an upper limit in the absence of test data to support the higher numbers.
Equipment Leak Emissions
Equipment leak emissions were estimated by using the number of components,
their time in service, and the weight percent butadiene in the stream. Estimated emissions were
derived by applying the CMA method described in Appendix D to the facility-specific data
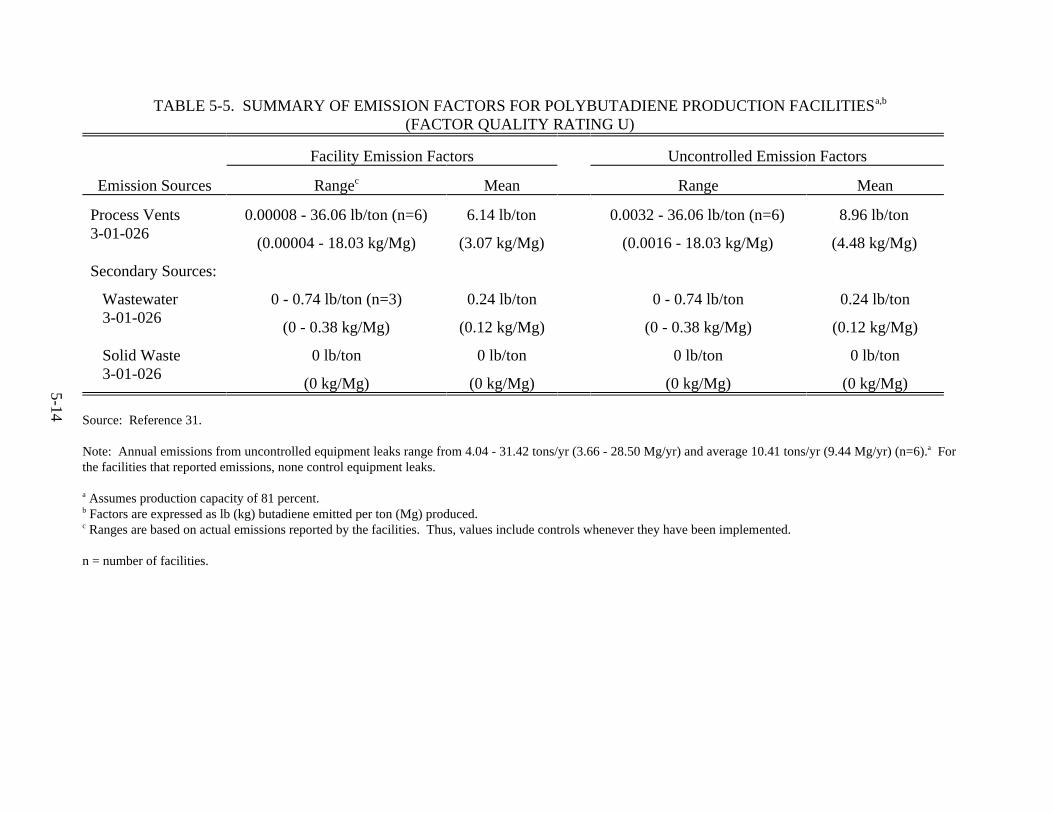
5-1
4
TABLE 5-5. SUMMARY OF EMISSION FACTORS FOR POLYBUTADIENE PRODUCTION FACILITIESa,b
(FACTOR QUALITY RATING U)
Emission Sources
Facility Emission Factors Uncontrolled Emission Factors
Rangec Mean Range Mean
Process Vents3-01-026
0.00008 - 36.06 lb/ton (n=6) 6.14 lb/ton 0.0032 - 36.06 lb/ton (n=6) 8.96 lb/ton
(0.00004 - 18.03 kg/Mg) (3.07 kg/Mg) (0.0016 - 18.03 kg/Mg) (4.48 kg/Mg)
Secondary Sources:
Wastewater 3-01-026
0 - 0.74 lb/ton (n=3) 0.24 lb/ton 0 - 0.74 lb/ton 0.24 lb/ton
(0 - 0.38 kg/Mg) (0.12 kg/Mg) (0 - 0.38 kg/Mg) (0.12 kg/Mg)
Solid Waste 3-01-026
0 lb/ton 0 lb/ton 0 lb/ton 0 lb/ton
(0 kg/Mg) (0 kg/Mg) (0 kg/Mg) (0 kg/Mg)
Source: Reference 31.
Note: Annual emissions from uncontrolled equipment leaks range from 4.04 - 31.42 tons/yr (3.66 - 28.50 Mg/yr) and average 10.41 tons/yr (9.44 Mg/yr) (n=6). Fora
the facilities that reported emissions, none control equipment leaks.
Assumes production capacity of 81 percent. a
Factors are expressed as lb (kg) butadiene emitted per ton (Mg) produced.b
Ranges are based on actual emissions reported by the facilities. Thus, values include controls whenever they have been implemented.c
n = number of facilities.
5-15
given in Appendix C, Table C-11, and component-specific emission factors from Table 4-7.
These results are summarized in Table 5-5. They represent some level of control because the
average emission rate is based on practices at butadiene producers. Although some facilities
perform visual monitoring, none gave a specific frequency or scope of these programs; therefore,
no estimate of reductions could have been made. A comparison to practices at butadiene
producers was also not possible; therefore, users of the estimate should take this uncertainty into
account.
Secondary Emissions
Only one facility reported a wastewater stream containing butadiene. Complete
evaporation of butadiene from this stream, which is sent to a lagoon, was assumed because of
butadiene's volatility and low water solubility. Secondary emissions are summarized in
Table 5-5. One other facility reports that its wastewater contains no butadiene and, therefore,
produces no emissions. One of the three facilities that indicated that they generate solid waste
estimated that no butadiene emissions are released. Table C-12 in Appendix C summarizes the
facility-specific data.
Accidental Release Emissions
Accidental release emissions include pressure relief events and accidental
releases. Two of the four facilities reported no accidental release emissions; each of the other
two facilities reported one accidental release. In the first case, the release was a result of a
cracked valve; in the second, a loose flange. The estimated losses were 2,998 pounds (1,360 kg)
over 30 hours and 11 pounds (5 kg) over 5 minutes, respectively.32
5-16
5.3 ADIPONITRILE PRODUCTION
Adiponitrile (hexanedinitrile) is primarily used as an intermediate in the
manufacture of hexamethylenediamine (HMDA) (1,6-diaminohexane), a principal ingredient in
nylon 6,6 production. Three facilities currently produce adiponitrile; Table 5-6 identifies their33
locations and capacities. Only two facilities use butadiene, accounting for 12 percent of29
butadiene use in the United States. Monsanto uses acrylonitrile as the starting material and is,10
therefore, not a source of butadiene emissions and is omitted from further discussion.
5.3.1 Process Description
Both facilities that use butadiene run the adiponitrile process on a continuous
basis. A generalized process diagram (Figure 5-3) illustrates the steps in adiponitrile
production. Butadiene is first converted to pentenenitriles by the addition of hydrogen cyanide34
in the presence of a catalyst (Step 1). The resulting pentenenitriles stream then continues
through the butadiene column (Step 2) and catalyst removal (Step 3). The intermediary may be
sold commercially or refined further. On-site processing begins with distillation of the
pentenitriles for use in dinitrile synthesis (Step 4). In the dinitrile system unit (Step 5), the
mononitriles are further hydrocyanated for conversion to dinitriles. The resulting mixture of six-
carbon dinitriles is refined by distillation (Step 6). The final product, adiponitrile, is stored in
tanks and then pumped via pipeline to the HMDA unit for hydrogenation. Most of the by-
products of the process are burned in a boiler to recover their heating value. One of the
mononitrile by-products is sold as a commercial product.
5.3.2 Emissions
From facility information, the sources of butadiene emissions are associated with
production up to the point of catalyst removal. Test data of the butadiene column bottoms (at
one location) show less than 0.02 percent by weight of butadiene. The emission source types34
for which there are data include the process vents (denoted Vents B and C in Figure 5-3),
equipment leaks, secondary sources, and one estimate of losses during butadiene storage railcar
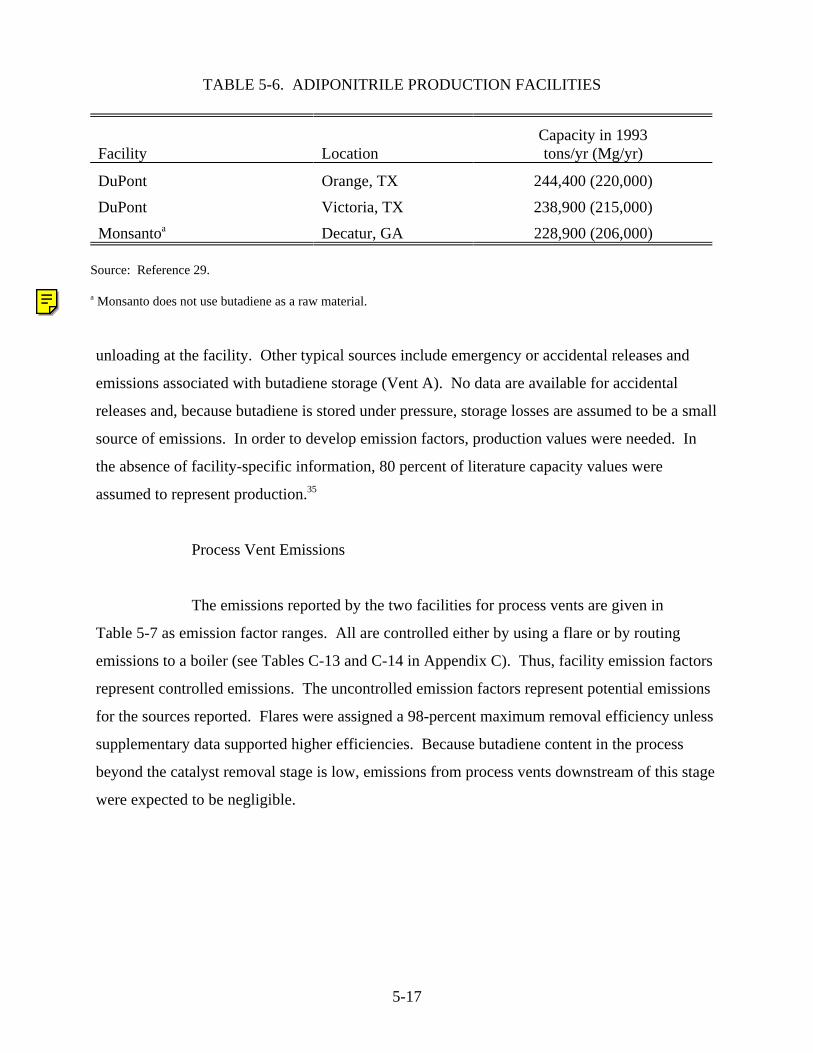
5-17
Facility LocationCapacity in 1993tons/yr (Mg/yr)
DuPont Orange, TX 244,400 (220,000)
DuPont Victoria, TX 238,900 (215,000)
Monsantoa Decatur, GA 228,900 (206,000)
Source: Reference 29.
Monsanto does not use butadiene as a raw material.a
TABLE 5-6. ADIPONITRILE PRODUCTION FACILITIES
unloading at the facility. Other typical sources include emergency or accidental releases and
emissions associated with butadiene storage (Vent A). No data are available for accidental
releases and, because butadiene is stored under pressure, storage losses are assumed to be a small
source of emissions. In order to develop emission factors, production values were needed. In
the absence of facility-specific information, 80 percent of literature capacity values were
assumed to represent production. 35
Process Vent Emissions
The emissions reported by the two facilities for process vents are given in
Table 5-7 as emission factor ranges. All are controlled either by using a flare or by routing
emissions to a boiler (see Tables C-13 and C-14 in Appendix C). Thus, facility emission factors
represent controlled emissions. The uncontrolled emission factors represent potential emissions
for the sources reported. Flares were assigned a 98-percent maximum removal efficiency unless
supplementary data supported higher efficiencies. Because butadiene content in the process
beyond the catalyst removal stage is low, emissions from process vents downstream of this stage
were expected to be negligible.
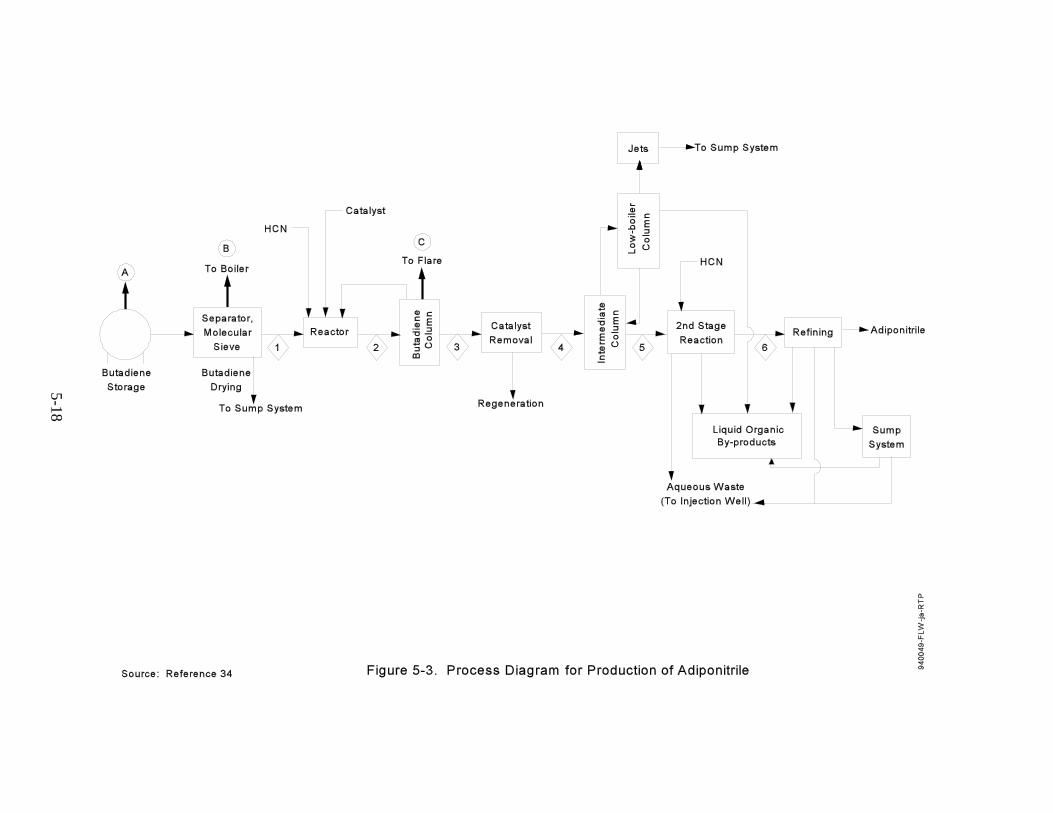
5-1
8
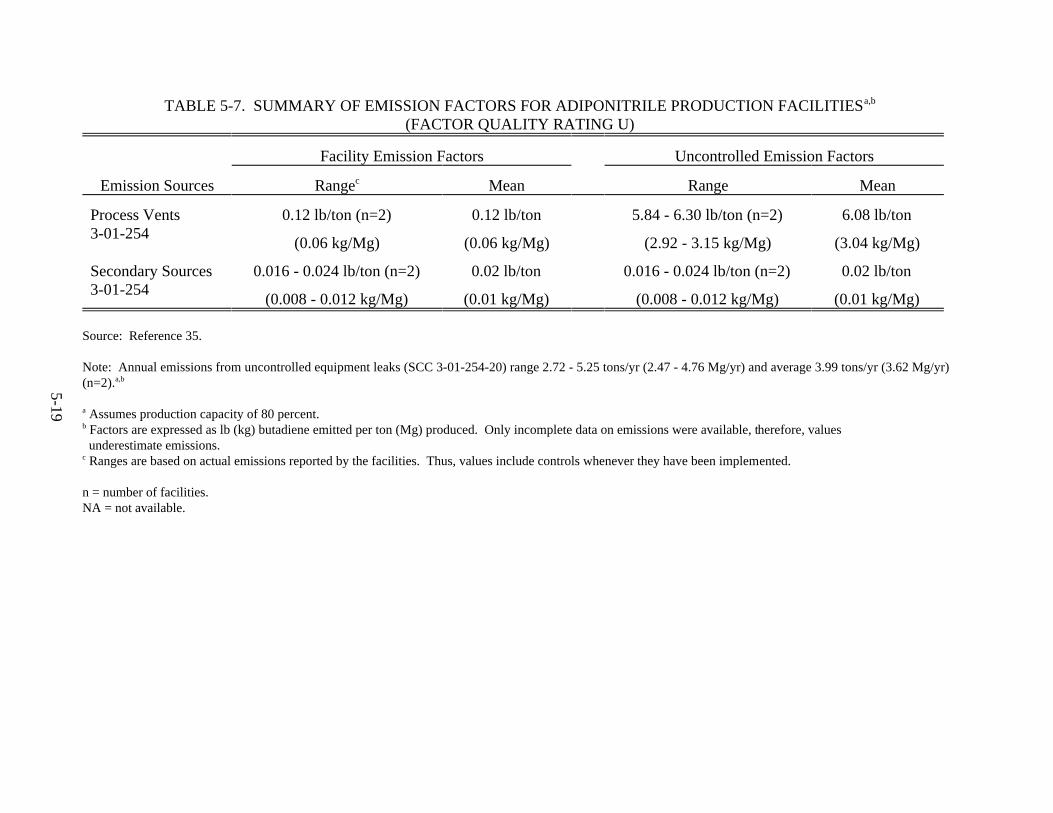
5-1
9
TABLE 5-7. SUMMARY OF EMISSION FACTORS FOR ADIPONITRILE PRODUCTION FACILITIESa,b
(FACTOR QUALITY RATING U)
Emission Sources
Facility Emission Factors Uncontrolled Emission Factors
Rangec Mean Range Mean
Process Vents3-01-254
0.12 lb/ton (n=2) 0.12 lb/ton 5.84 - 6.30 lb/ton (n=2) 6.08 lb/ton
(0.06 kg/Mg) (0.06 kg/Mg) (2.92 - 3.15 kg/Mg) (3.04 kg/Mg)
Secondary Sources3-01-254
0.016 - 0.024 lb/ton (n=2) 0.02 lb/ton 0.016 - 0.024 lb/ton (n=2) 0.02 lb/ton
(0.008 - 0.012 kg/Mg) (0.01 kg/Mg) (0.008 - 0.012 kg/Mg) (0.01 kg/Mg)
Source: Reference 35.
Note: Annual emissions from uncontrolled equipment leaks (SCC 3-01-254-20) range 2.72 - 5.25 tons/yr (2.47 - 4.76 Mg/yr) and average 3.99 tons/yr (3.62 Mg/yr)(n=2).a,b
Assumes production capacity of 80 percent. a
Factors are expressed as lb (kg) butadiene emitted per ton (Mg) produced. Only incomplete data on emissions were available, therefore, valuesb
underestimate emissions. Ranges are based on actual emissions reported by the facilities. Thus, values include controls whenever they have been implemented.c
n = number of facilities.NA = not available.
5-20
Equipment Leak Emissions
Equipment leak emissions were estimated by using the number of components,
their time in service, and the weight percent butadiene in the stream. Estimated emissions were
derived by applying the CMA method described in Appendix D to the facility-specific data
given in Appendix C, Table C-11, and component-specific emission factors from Table 4-7.
These results are summarized in Table 5-7. They represent some level of control because the
average emission rate is based on practices at butadiene producers. Controls in use by the two
facilities include ambient monitoring, quarterly leak detection and repair, double mechanical
seals, and pressure relief devices, some of which are routed to a flare. No comparison to
practices at butadiene producers is possible, however, so the user of the estimate should take this
uncertainty into account.
Other Emissions
Although both facilities list various secondary sources, only two of the emission
values are given, one for wastewater, the second for a waste tank (see Table C-16 in
Appendix C). Emissions from these sources are reported to be uncontrolled. Other secondary
sources reported include butadiene separator blowdown water, waste liquids, and a sump tank.
Emissions from the latter two are routed to a boiler. Another source identified is the unloading
of a storage railcar with a closed vapor balance system, estimated to emit 9.6 tons/yr
(8.7 Mg/yr).
5.4 NEOPRENE PRODUCTION
Neoprene, also called polychloroprene, is a product of chloroprene
(2-chloro-1,3-butadiene) polymerization. Consuming approximately 5 percent of butadiene
produced, neoprene rubber is primarily used in the automotive industry in such applications as8
belts, cables, hoses, and wires. Three facilities currently produce neoprene; these are listed in36
Table 5-8, along with 1993 capacities. Only two facilities use butadiene as a raw material. 29
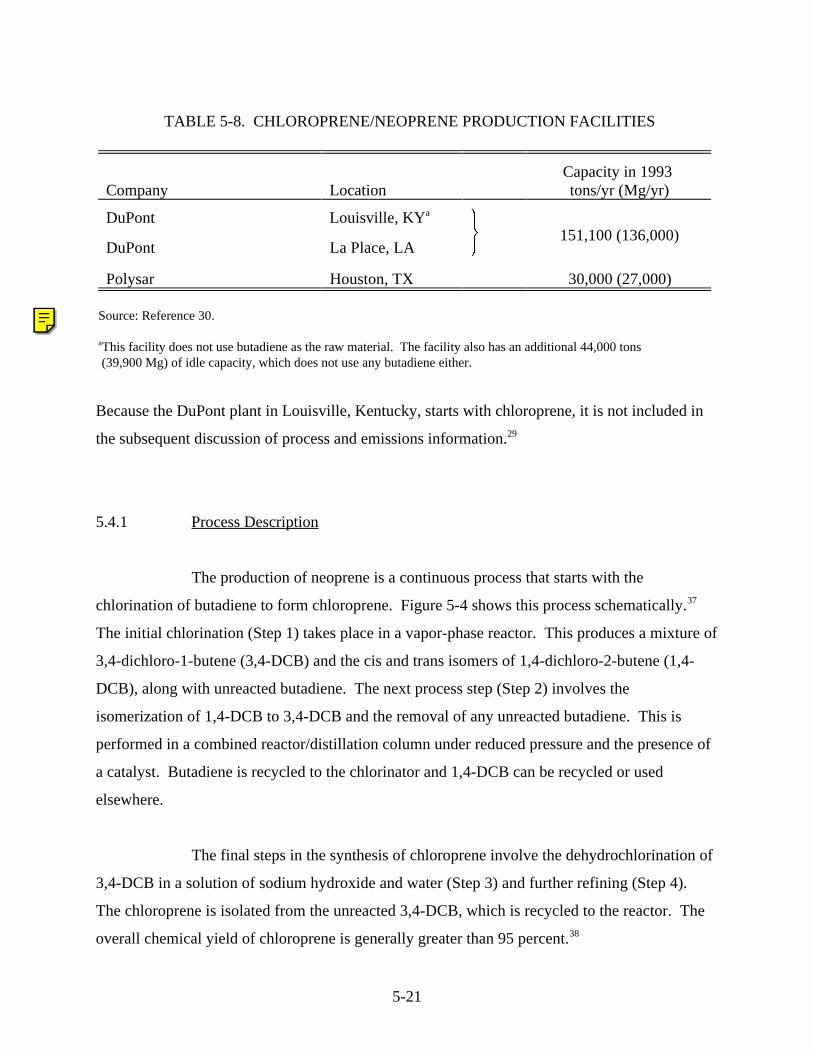
5-21
Company LocationCapacity in 1993 tons/yr (Mg/yr)
DuPont Louisville, KYa
$ 151,100 (136,000)DuPont La Place, LA
Polysar Houston, TX 30,000 (27,000)
Source: Reference 30.
This facility does not use butadiene as the raw material. The facility also has an additional 44,000 tonsa
(39,900 Mg) of idle capacity, which does not use any butadiene either.
TABLE 5-8. CHLOROPRENE/NEOPRENE PRODUCTION FACILITIES
Because the DuPont plant in Louisville, Kentucky, starts with chloroprene, it is not included in
the subsequent discussion of process and emissions information. 29
5.4.1 Process Description
The production of neoprene is a continuous process that starts with the
chlorination of butadiene to form chloroprene. Figure 5-4 shows this process schematically. 37
The initial chlorination (Step 1) takes place in a vapor-phase reactor. This produces a mixture of
3,4-dichloro-1-butene (3,4-DCB) and the cis and trans isomers of 1,4-dichloro-2-butene (1,4-
DCB), along with unreacted butadiene. The next process step (Step 2) involves the
isomerization of 1,4-DCB to 3,4-DCB and the removal of any unreacted butadiene. This is
performed in a combined reactor/distillation column under reduced pressure and the presence of
a catalyst. Butadiene is recycled to the chlorinator and 1,4-DCB can be recycled or used
elsewhere.
The final steps in the synthesis of chloroprene involve the dehydrochlorination of
3,4-DCB in a solution of sodium hydroxide and water (Step 3) and further refining (Step 4).
The chloroprene is isolated from the unreacted 3,4-DCB, which is recycled to the reactor. The
overall chemical yield of chloroprene is generally greater than 95 percent. 38
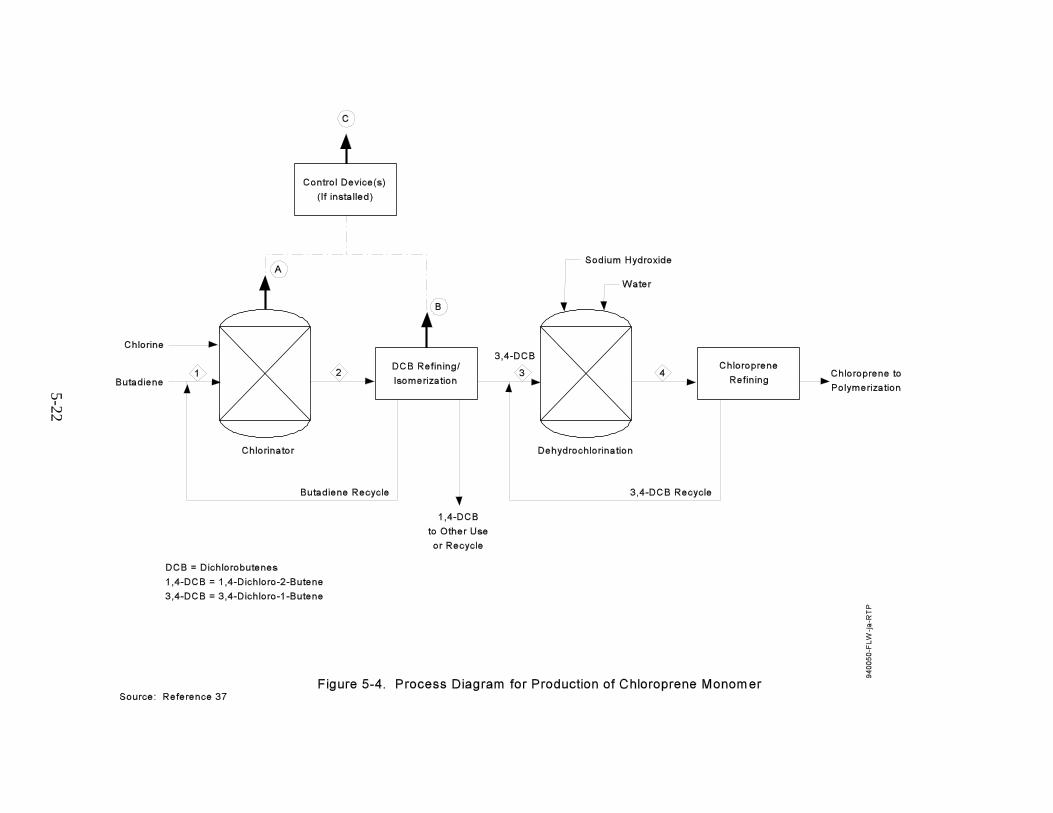
5-2
2
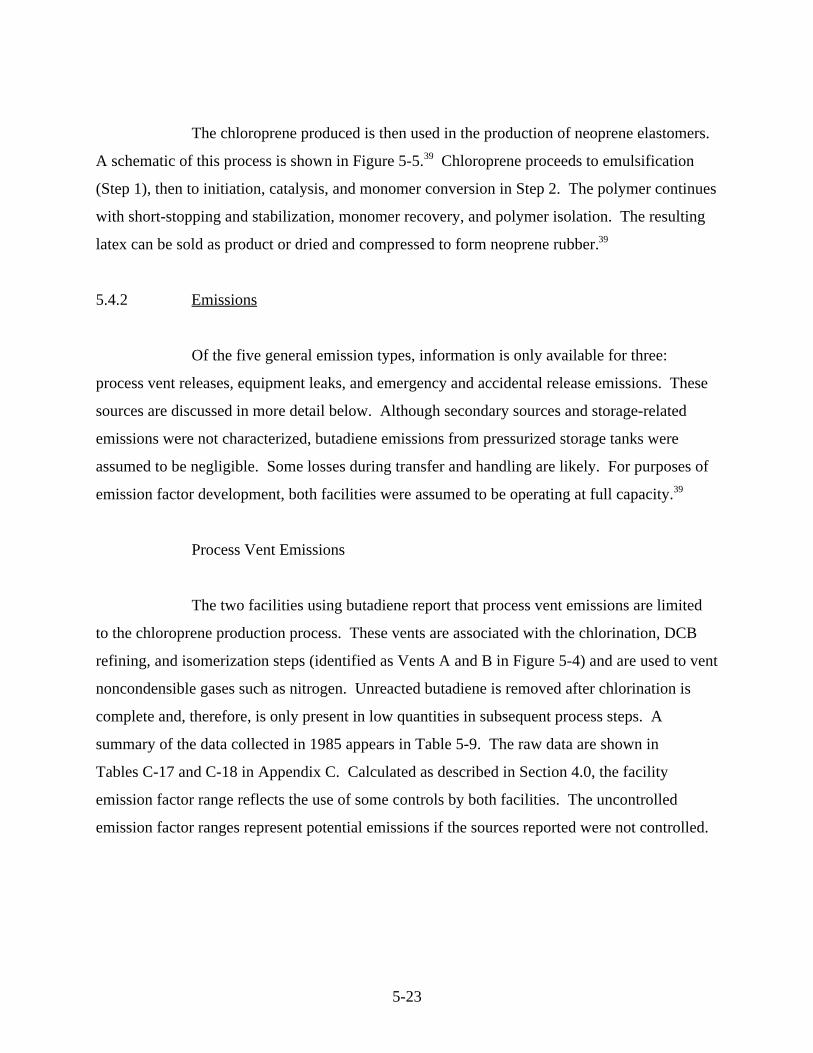
5-23
The chloroprene produced is then used in the production of neoprene elastomers.
A schematic of this process is shown in Figure 5-5. Chloroprene proceeds to emulsification39
(Step 1), then to initiation, catalysis, and monomer conversion in Step 2. The polymer continues
with short-stopping and stabilization, monomer recovery, and polymer isolation. The resulting
latex can be sold as product or dried and compressed to form neoprene rubber. 39
5.4.2 Emissions
Of the five general emission types, information is only available for three:
process vent releases, equipment leaks, and emergency and accidental release emissions. These
sources are discussed in more detail below. Although secondary sources and storage-related
emissions were not characterized, butadiene emissions from pressurized storage tanks were
assumed to be negligible. Some losses during transfer and handling are likely. For purposes of
emission factor development, both facilities were assumed to be operating at full capacity.39
Process Vent Emissions
The two facilities using butadiene report that process vent emissions are limited
to the chloroprene production process. These vents are associated with the chlorination, DCB
refining, and isomerization steps (identified as Vents A and B in Figure 5-4) and are used to vent
noncondensible gases such as nitrogen. Unreacted butadiene is removed after chlorination is
complete and, therefore, is only present in low quantities in subsequent process steps. A
summary of the data collected in 1985 appears in Table 5-9. The raw data are shown in
Tables C-17 and C-18 in Appendix C. Calculated as described in Section 4.0, the facility
emission factor range reflects the use of some controls by both facilities. The uncontrolled
emission factor ranges represent potential emissions if the sources reported were not controlled.
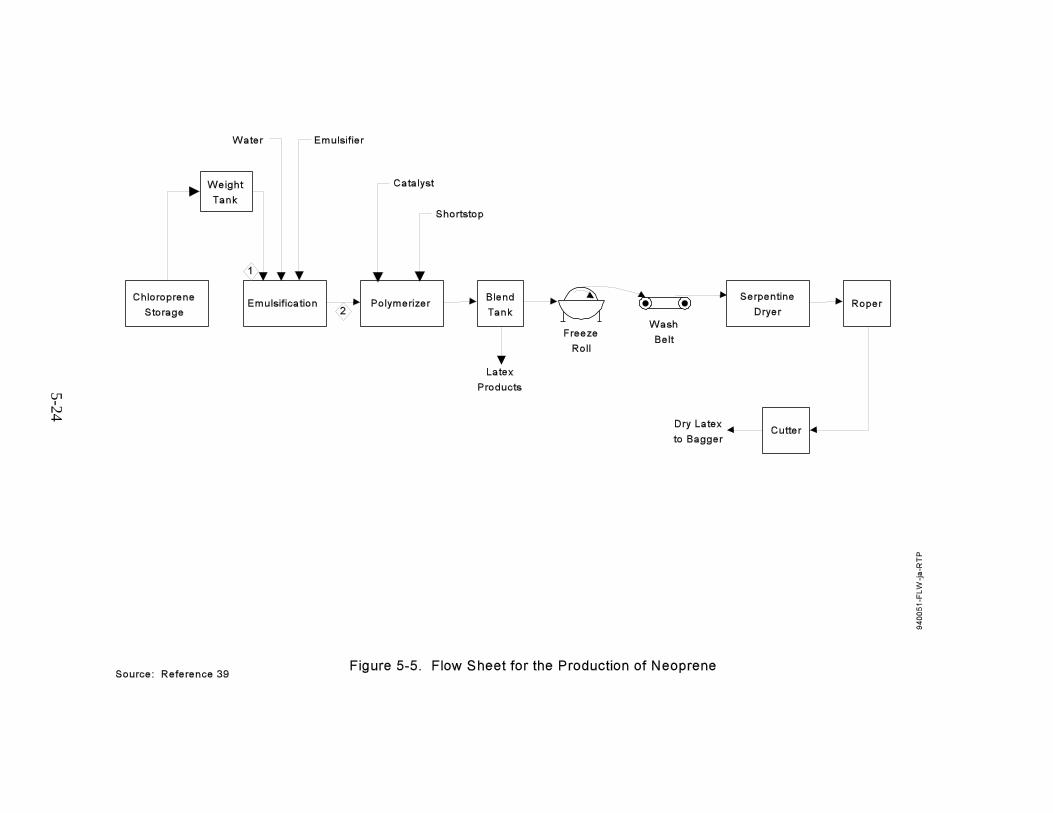
5-2
4
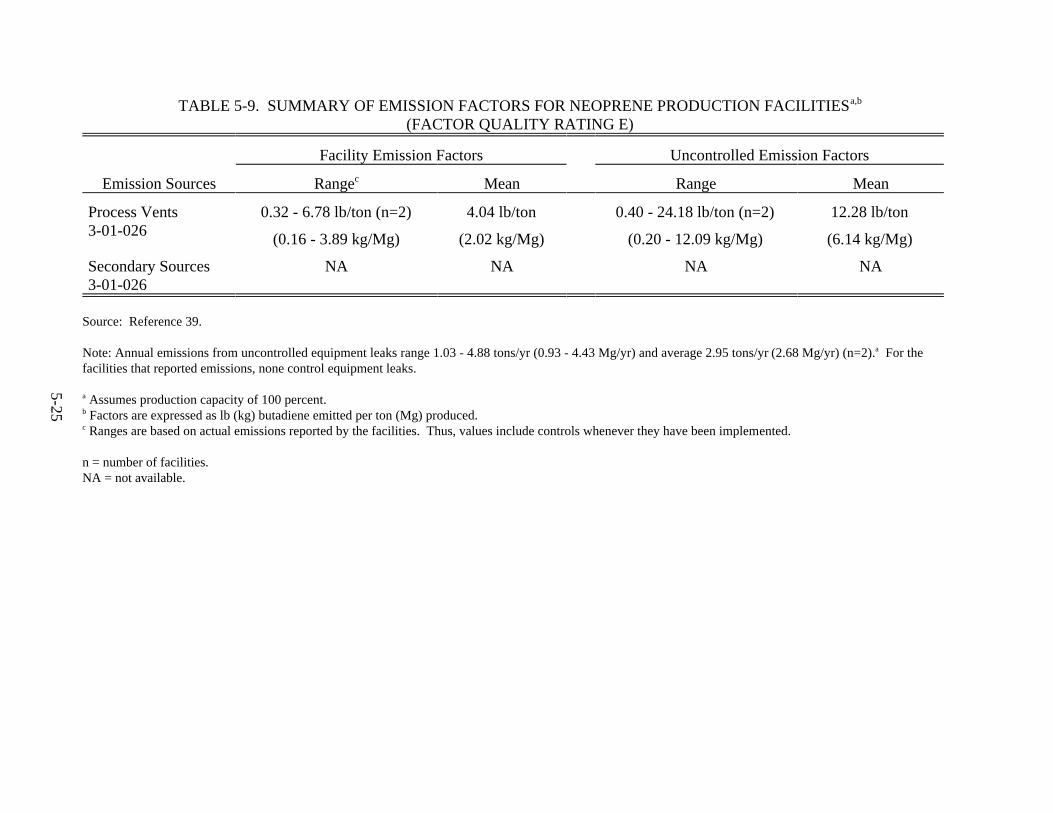
5-2
5
TABLE 5-9. SUMMARY OF EMISSION FACTORS FOR NEOPRENE PRODUCTION FACILITIESa,b
(FACTOR QUALITY RATING E)
Emission Sources
Facility Emission Factors Uncontrolled Emission Factors
Rangec Mean Range Mean
Process Vents3-01-026
0.32 - 6.78 lb/ton (n=2) 4.04 lb/ton 0.40 - 24.18 lb/ton (n=2) 12.28 lb/ton
(0.16 - 3.89 kg/Mg) (2.02 kg/Mg) (0.20 - 12.09 kg/Mg) (6.14 kg/Mg)
Secondary Sources3-01-026
NA NA NA NA
Source: Reference 39.
Note: Annual emissions from uncontrolled equipment leaks range 1.03 - 4.88 tons/yr (0.93 - 4.43 Mg/yr) and average 2.95 tons/yr (2.68 Mg/yr) (n=2). For thea
facilities that reported emissions, none control equipment leaks.
Assumes production capacity of 100 percent. a
Factors are expressed as lb (kg) butadiene emitted per ton (Mg) produced.b
Ranges are based on actual emissions reported by the facilities. Thus, values include controls whenever they have been implemented.c
n = number of facilities.NA = not available.
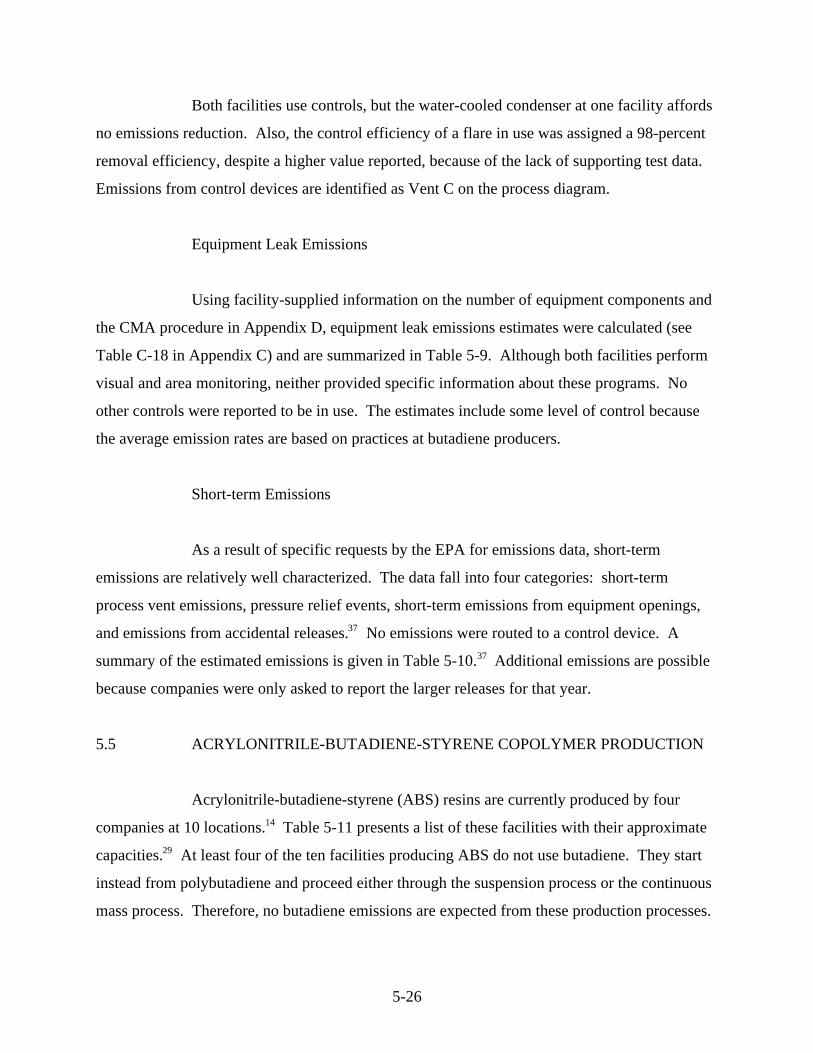
5-26
Both facilities use controls, but the water-cooled condenser at one facility affords
no emissions reduction. Also, the control efficiency of a flare in use was assigned a 98-percent
removal efficiency, despite a higher value reported, because of the lack of supporting test data.
Emissions from control devices are identified as Vent C on the process diagram.
Equipment Leak Emissions
Using facility-supplied information on the number of equipment components and
the CMA procedure in Appendix D, equipment leak emissions estimates were calculated (see
Table C-18 in Appendix C) and are summarized in Table 5-9. Although both facilities perform
visual and area monitoring, neither provided specific information about these programs. No
other controls were reported to be in use. The estimates include some level of control because
the average emission rates are based on practices at butadiene producers.
Short-term Emissions
As a result of specific requests by the EPA for emissions data, short-term
emissions are relatively well characterized. The data fall into four categories: short-term
process vent emissions, pressure relief events, short-term emissions from equipment openings,
and emissions from accidental releases. No emissions were routed to a control device. A37
summary of the estimated emissions is given in Table 5-10. Additional emissions are possible37
because companies were only asked to report the larger releases for that year.
5.5 ACRYLONITRILE-BUTADIENE-STYRENE COPOLYMER PRODUCTION
Acrylonitrile-butadiene-styrene (ABS) resins are currently produced by four
companies at 10 locations. Table 5-11 presents a list of these facilities with their approximate14
capacities. At least four of the ten facilities producing ABS do not use butadiene. They start29
instead from polybutadiene and proceed either through the suspension process or the continuous
mass process. Therefore, no butadiene emissions are expected from these production processes.
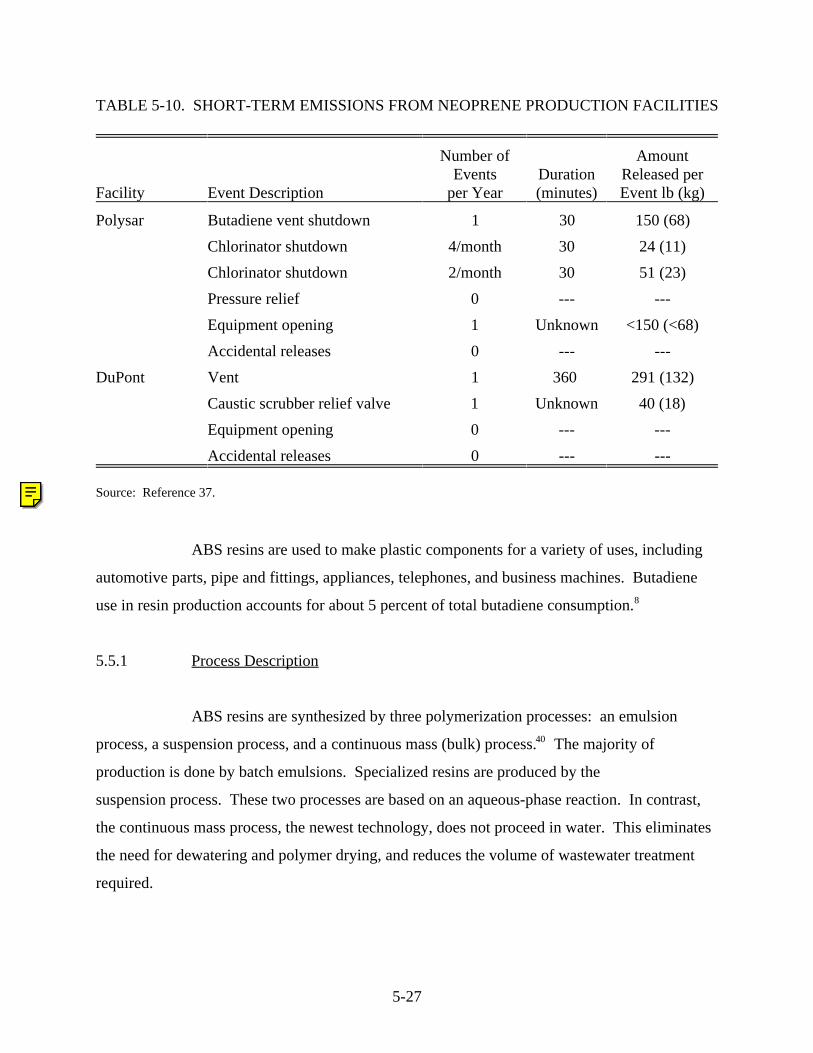
5-27
Facility Event Description
Number ofEvents
per YearDuration(minutes)
AmountReleased perEvent lb (kg)
Polysar Butadiene vent shutdown 1 30 150 (68)
Chlorinator shutdown 4/month 30 24 (11)
Chlorinator shutdown 2/month 30 51 (23)
Pressure relief 0 --- ---
Equipment opening 1 Unknown <150 (<68)
Accidental releases 0 --- ---
DuPont Vent 1 360 291 (132)
Caustic scrubber relief valve 1 Unknown 40 (18)
Equipment opening 0 --- ---
Accidental releases 0 --- ---
Source: Reference 37.
TABLE 5-10. SHORT-TERM EMISSIONS FROM NEOPRENE PRODUCTION FACILITIES
ABS resins are used to make plastic components for a variety of uses, including
automotive parts, pipe and fittings, appliances, telephones, and business machines. Butadiene
use in resin production accounts for about 5 percent of total butadiene consumption. 8
5.5.1 Process Description
ABS resins are synthesized by three polymerization processes: an emulsion
process, a suspension process, and a continuous mass (bulk) process. The majority of40
production is done by batch emulsions. Specialized resins are produced by the
suspension process. These two processes are based on an aqueous-phase reaction. In contrast,
the continuous mass process, the newest technology, does not proceed in water. This eliminates
the need for dewatering and polymer drying, and reduces the volume of wastewater treatment
required.
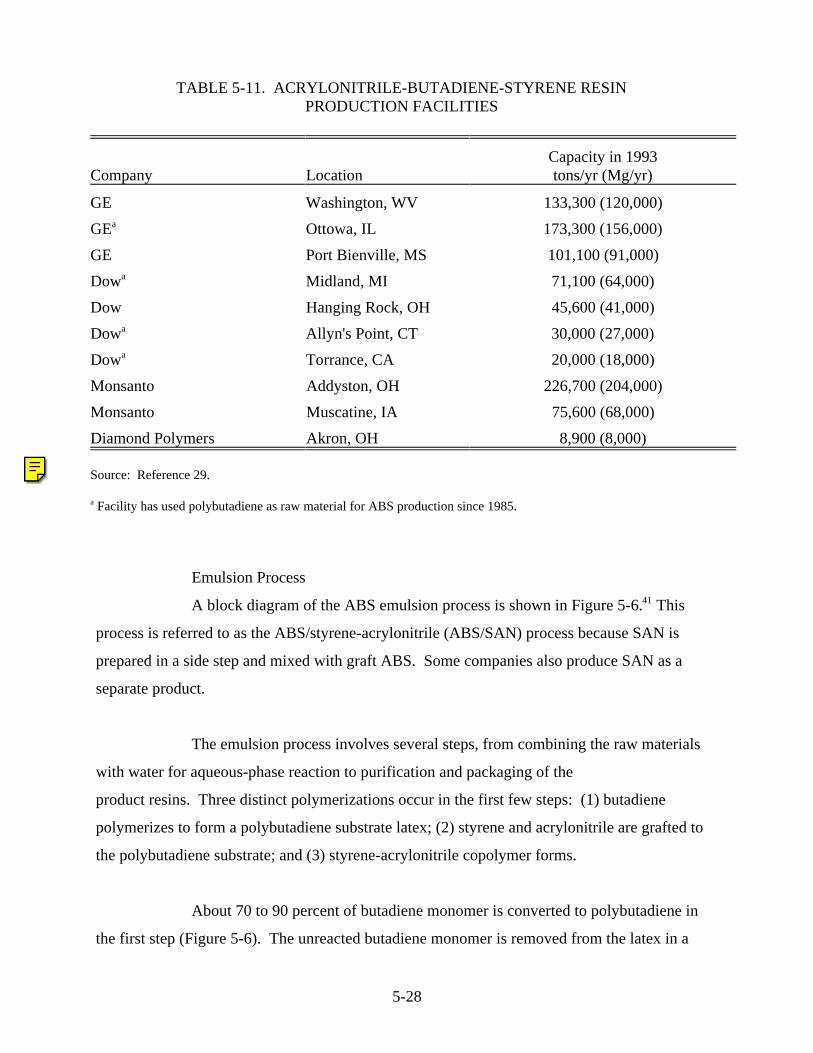
5-28
Company LocationCapacity in 1993tons/yr (Mg/yr)
GE Washington, WV 133,300 (120,000)
GEa Ottowa, IL 173,300 (156,000)
GE Port Bienville, MS 101,100 (91,000)
Dowa Midland, MI 71,100 (64,000)
Dow Hanging Rock, OH 45,600 (41,000)
Dowa Allyn's Point, CT 30,000 (27,000)
Dowa Torrance, CA 20,000 (18,000)
Monsanto Addyston, OH 226,700 (204,000)
Monsanto Muscatine, IA 75,600 (68,000)
Diamond Polymers Akron, OH 8,900 (8,000)
Source: Reference 29.
Facility has used polybutadiene as raw material for ABS production since 1985.a
TABLE 5-11. ACRYLONITRILE-BUTADIENE-STYRENE RESINPRODUCTION FACILITIES
Emulsion Process
A block diagram of the ABS emulsion process is shown in Figure 5-6. This41
process is referred to as the ABS/styrene-acrylonitrile (ABS/SAN) process because SAN is
prepared in a side step and mixed with graft ABS. Some companies also produce SAN as a
separate product.
The emulsion process involves several steps, from combining the raw materials
with water for aqueous-phase reaction to purification and packaging of the
product resins. Three distinct polymerizations occur in the first few steps: (1) butadiene
polymerizes to form a polybutadiene substrate latex; (2) styrene and acrylonitrile are grafted to
the polybutadiene substrate; and (3) styrene-acrylonitrile copolymer forms.
About 70 to 90 percent of butadiene monomer is converted to polybutadiene in
the first step (Figure 5-6). The unreacted butadiene monomer is removed from the latex in a
5-2
9
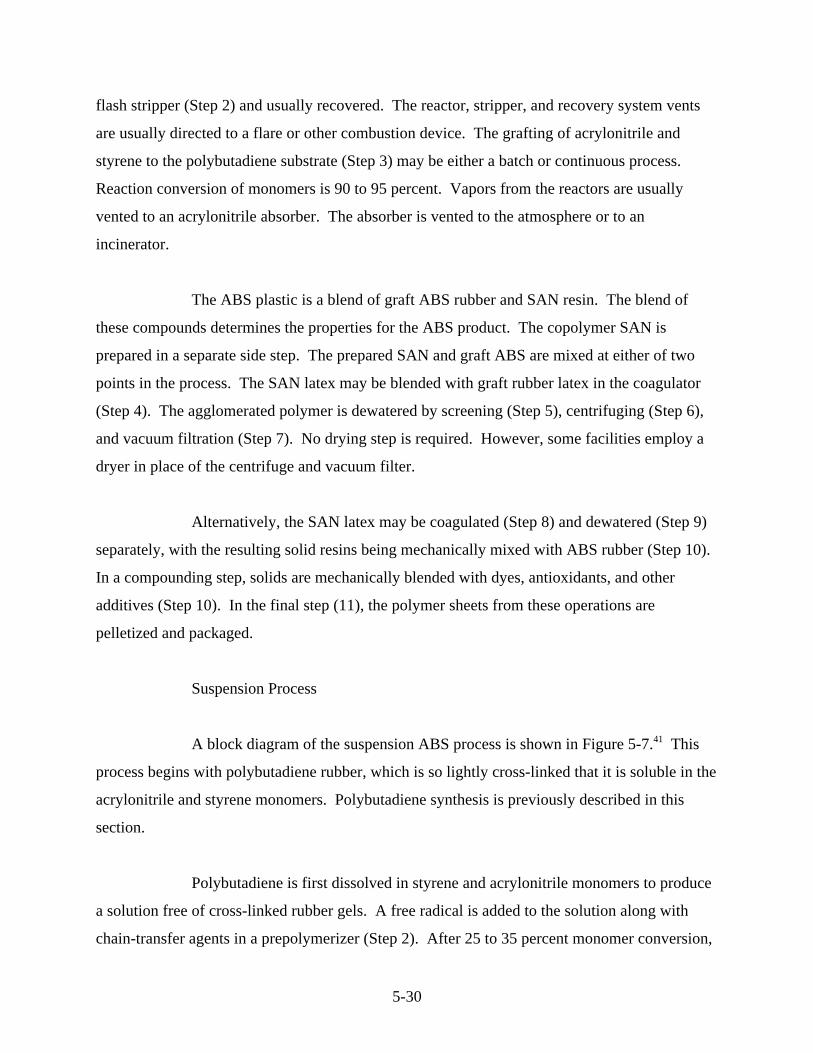
5-30
flash stripper (Step 2) and usually recovered. The reactor, stripper, and recovery system vents
are usually directed to a flare or other combustion device. The grafting of acrylonitrile and
styrene to the polybutadiene substrate (Step 3) may be either a batch or continuous process.
Reaction conversion of monomers is 90 to 95 percent. Vapors from the reactors are usually
vented to an acrylonitrile absorber. The absorber is vented to the atmosphere or to an
incinerator.
The ABS plastic is a blend of graft ABS rubber and SAN resin. The blend of
these compounds determines the properties for the ABS product. The copolymer SAN is
prepared in a separate side step. The prepared SAN and graft ABS are mixed at either of two
points in the process. The SAN latex may be blended with graft rubber latex in the coagulator
(Step 4). The agglomerated polymer is dewatered by screening (Step 5), centrifuging (Step 6),
and vacuum filtration (Step 7). No drying step is required. However, some facilities employ a
dryer in place of the centrifuge and vacuum filter.
Alternatively, the SAN latex may be coagulated (Step 8) and dewatered (Step 9)
separately, with the resulting solid resins being mechanically mixed with ABS rubber (Step 10).
In a compounding step, solids are mechanically blended with dyes, antioxidants, and other
additives (Step 10). In the final step (11), the polymer sheets from these operations are
pelletized and packaged.
Suspension Process
A block diagram of the suspension ABS process is shown in Figure 5-7. This41
process begins with polybutadiene rubber, which is so lightly cross-linked that it is soluble in the
acrylonitrile and styrene monomers. Polybutadiene synthesis is previously described in this
section.
Polybutadiene is first dissolved in styrene and acrylonitrile monomers to produce
a solution free of cross-linked rubber gels. A free radical is added to the solution along with
chain-transfer agents in a prepolymerizer (Step 2). After 25 to 35 percent monomer conversion,
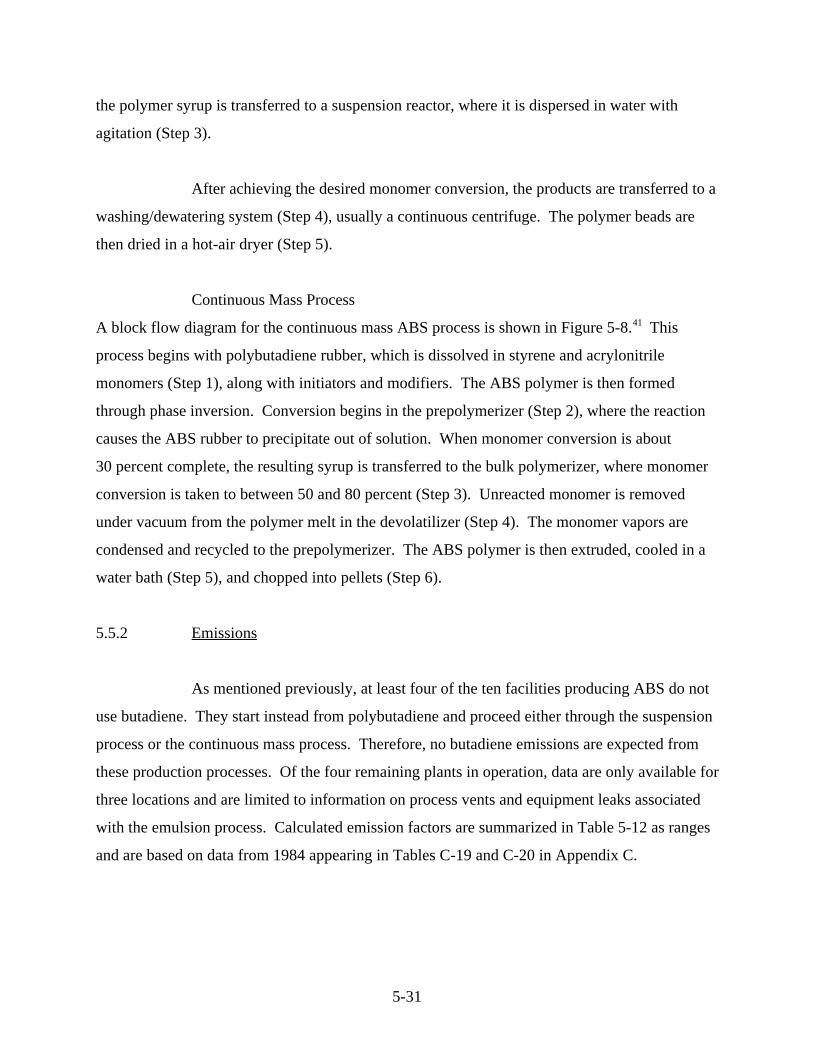
5-31
the polymer syrup is transferred to a suspension reactor, where it is dispersed in water with
agitation (Step 3).
After achieving the desired monomer conversion, the products are transferred to a
washing/dewatering system (Step 4), usually a continuous centrifuge. The polymer beads are
then dried in a hot-air dryer (Step 5).
Continuous Mass Process
A block flow diagram for the continuous mass ABS process is shown in Figure 5-8. This41
process begins with polybutadiene rubber, which is dissolved in styrene and acrylonitrile
monomers (Step 1), along with initiators and modifiers. The ABS polymer is then formed
through phase inversion. Conversion begins in the prepolymerizer (Step 2), where the reaction
causes the ABS rubber to precipitate out of solution. When monomer conversion is about
30 percent complete, the resulting syrup is transferred to the bulk polymerizer, where monomer
conversion is taken to between 50 and 80 percent (Step 3). Unreacted monomer is removed
under vacuum from the polymer melt in the devolatilizer (Step 4). The monomer vapors are
condensed and recycled to the prepolymerizer. The ABS polymer is then extruded, cooled in a
water bath (Step 5), and chopped into pellets (Step 6).
5.5.2 Emissions
As mentioned previously, at least four of the ten facilities producing ABS do not
use butadiene. They start instead from polybutadiene and proceed either through the suspension
process or the continuous mass process. Therefore, no butadiene emissions are expected from
these production processes. Of the four remaining plants in operation, data are only available for
three locations and are limited to information on process vents and equipment leaks associated
with the emulsion process. Calculated emission factors are summarized in Table 5-12 as ranges
and are based on data from 1984 appearing in Tables C-19 and C-20 in Appendix C.
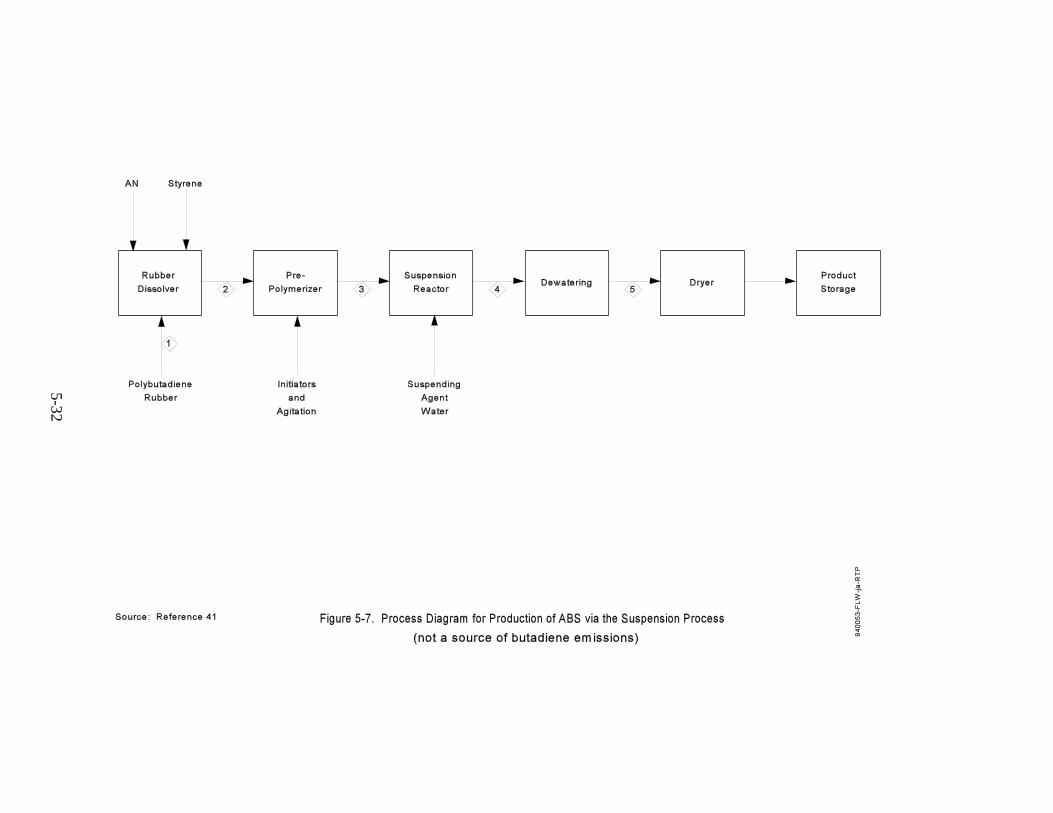
5-3
2
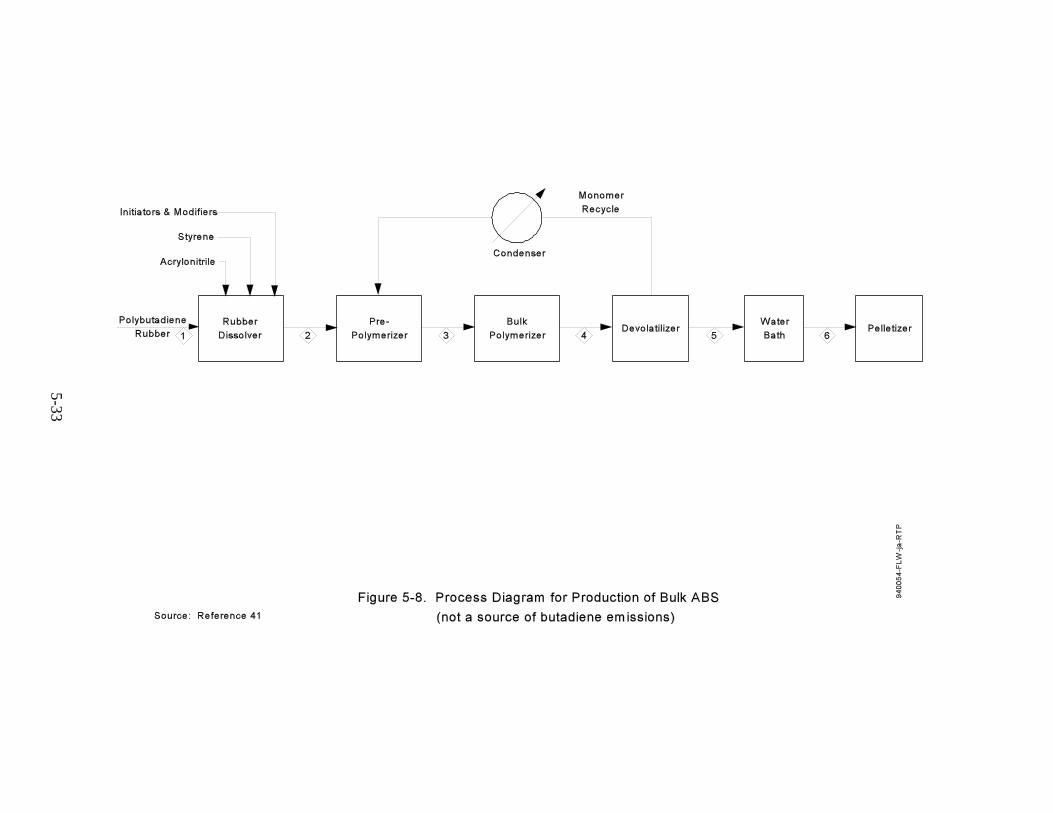
5-3
3
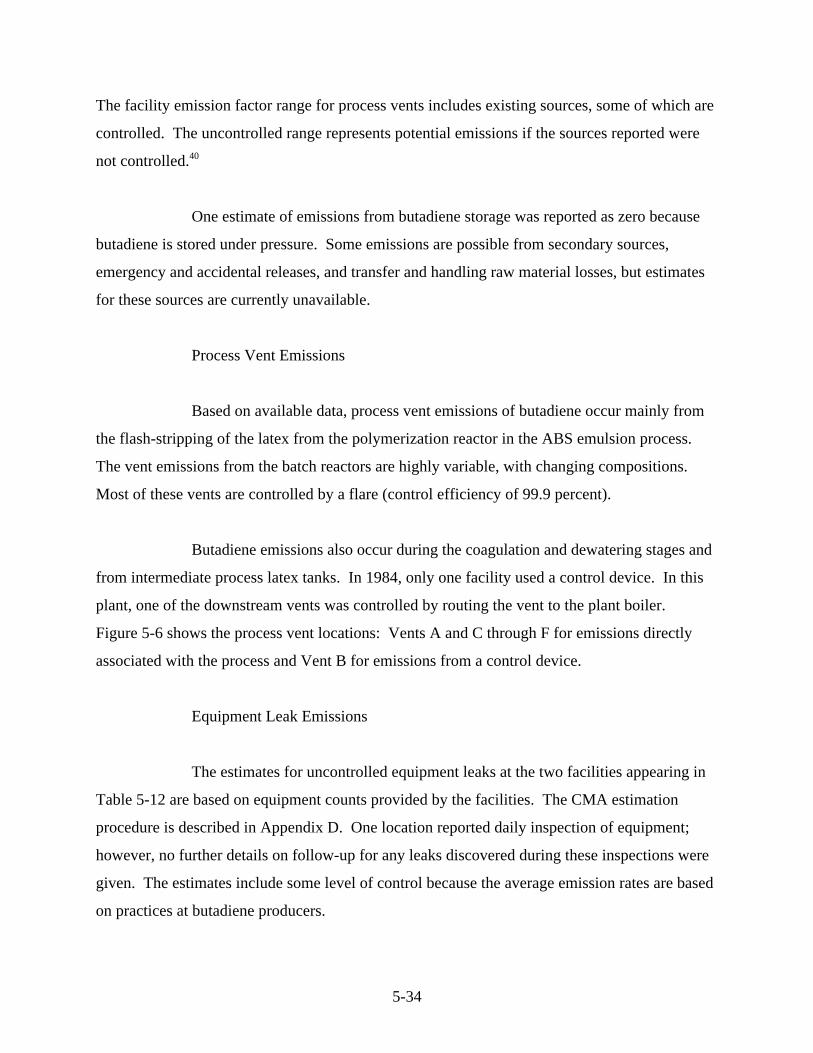
5-34
The facility emission factor range for process vents includes existing sources, some of which are
controlled. The uncontrolled range represents potential emissions if the sources reported were
not controlled.40
One estimate of emissions from butadiene storage was reported as zero because
butadiene is stored under pressure. Some emissions are possible from secondary sources,
emergency and accidental releases, and transfer and handling raw material losses, but estimates
for these sources are currently unavailable.
Process Vent Emissions
Based on available data, process vent emissions of butadiene occur mainly from
the flash-stripping of the latex from the polymerization reactor in the ABS emulsion process.
The vent emissions from the batch reactors are highly variable, with changing compositions.
Most of these vents are controlled by a flare (control efficiency of 99.9 percent).
Butadiene emissions also occur during the coagulation and dewatering stages and
from intermediate process latex tanks. In 1984, only one facility used a control device. In this
plant, one of the downstream vents was controlled by routing the vent to the plant boiler.
Figure 5-6 shows the process vent locations: Vents A and C through F for emissions directly
associated with the process and Vent B for emissions from a control device.
Equipment Leak Emissions
The estimates for uncontrolled equipment leaks at the two facilities appearing in
Table 5-12 are based on equipment counts provided by the facilities. The CMA estimation
procedure is described in Appendix D. One location reported daily inspection of equipment;
however, no further details on follow-up for any leaks discovered during these inspections were
given. The estimates include some level of control because the average emission rates are based
on practices at butadiene producers.
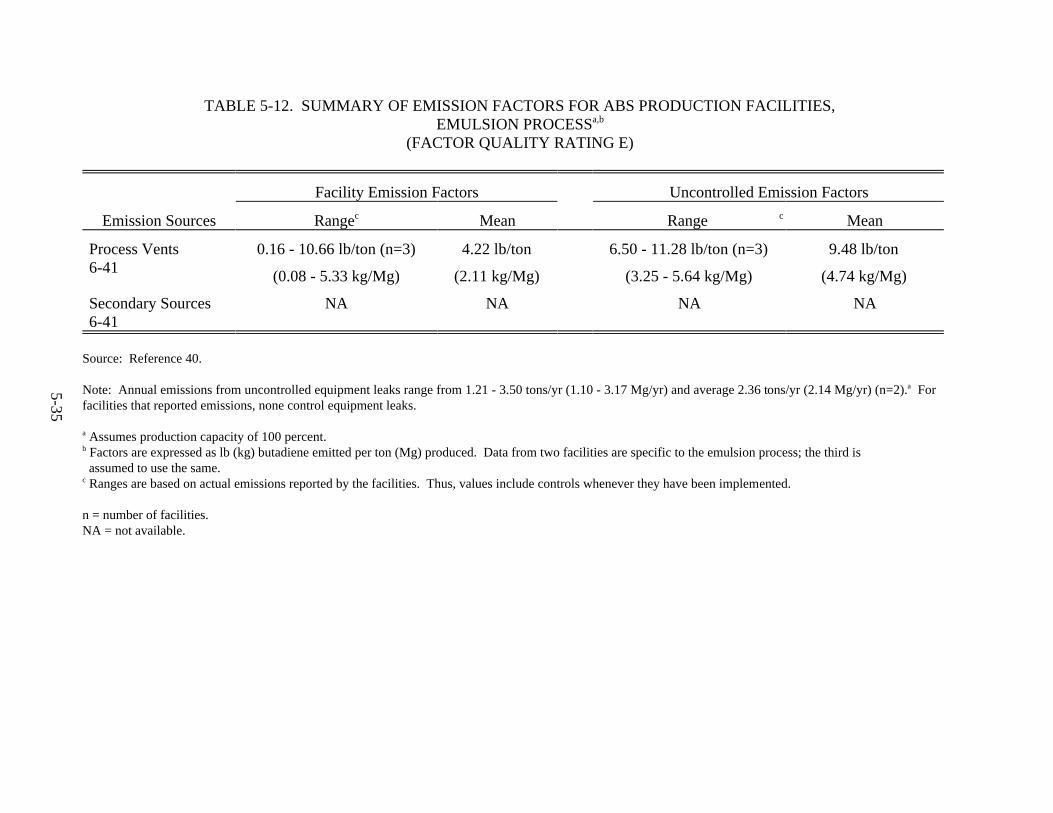
5-3
5
TABLE 5-12. SUMMARY OF EMISSION FACTORS FOR ABS PRODUCTION FACILITIES,EMULSION PROCESSa,b
(FACTOR QUALITY RATING E)
Emission Sources
Facility Emission Factors Uncontrolled Emission Factors
Rangec Mean Range c Mean
Process Vents6-41
0.16 - 10.66 lb/ton (n=3) 4.22 lb/ton 6.50 - 11.28 lb/ton (n=3) 9.48 lb/ton
(0.08 - 5.33 kg/Mg) (2.11 kg/Mg) (3.25 - 5.64 kg/Mg) (4.74 kg/Mg)
Secondary Sources6-41
NA NA NA NA
Source: Reference 40.
Note: Annual emissions from uncontrolled equipment leaks range from 1.21 - 3.50 tons/yr (1.10 - 3.17 Mg/yr) and average 2.36 tons/yr (2.14 Mg/yr) (n=2). Fora
facilities that reported emissions, none control equipment leaks.
Assumes production capacity of 100 percent. a
Factors are expressed as lb (kg) butadiene emitted per ton (Mg) produced. Data from two facilities are specific to the emulsion process; the third isb
assumed to use the same. Ranges are based on actual emissions reported by the facilities. Thus, values include controls whenever they have been implemented.c
n = number of facilities.NA = not available.
5-36
5.6 NITRILE ELASTOMER PRODUCTION
Nitrile elastomer or nitrile-butyl rubber (NBR) is produced by nine facilities. 29
The location of the facilities, the type of elastomer produced, and their approximate capacities
are presented in Table 5-13. 29
Nitrile elastomer is considered a specialty elastomer and is primarily used for its
oil-, solvent-, and chemical-resistant properties by a variety of manufacturers. Some uses42
include hose, belting, and cable manufacturing, and molded goods such as seals and gaskets.
Nitrile elastomer production accounts for about 5 percent of total annual butadiene
consumption. 8
Several of the facilities involved in NBR production also produce other
elastomers. Goodyear in Texas, Polysar in Tennessee and Texas, Copolymer, and Reichhold all
produce SB copolymers. Because of the common use of butadiene in these production
processes, emissions data often represent total rather than individual process emissions.
Whenever possible, the portion of butadiene emissions directly attributable to nitrile rubber is
shown.
5.6.1 Process Description
Nitrile elastomers are copolymers of acrylonitrile and butadiene. They are
produced by emulsion polymerization in batch or continuous processes. The process is
illustrated in the block flow diagram in Figure 5-9. 41
The emulsion polymerization process uses water as a carrier medium. Butadiene
and acrylonitrile monomers are piped to agitated polymerization reactors (Step 1) along with
additives and soap. The water not only serves as a reaction medium, but also effectively
transfers the heat of reaction to the cooled reactor surfaces. The additives include a catalyst
5-37
Company Location Elastomer Type
Capacity in 1993 dryrubber or latextons/yr (Mg/yr)
Copolymer Baton Rouge, LA Solid rubber 11,100 (10,000)
Zeon Chemicals Pasadena, TX Hydrogenated 2,200 (2,000)
Louisville, KY Solid rubber 33,300 (30,000)
Goodyear Houston, TX Solid rubber 34,400 (31,000)
Polysar Ltd. Orange, TX Solid rubber 2,200 (2,000)
BASF Chattanooga, TN Latex --
Reichhold Chemicals Cheswold, DE Latex --
Uniroyal Chemical Co. Painesville, OH Solid rubber 22,200 (20,000)
W. R. Grace Owensboro, KY Latex --
Source: Reference 29.
"--" means capacity not known.
TABLE 5-13. NITRILE ELASTOMER PRODUCTION FACILITIES
(cumene hydroperoxide as an oxidizing component), sodium formaldehyde sulfoxylate with
EDTA (ferrous sulfate complexed with ethylenediamine-tetraacetic acid as the reducing
component), and modifiers (alkyl mercaptans).
The reaction is allowed to proceed for 5 to 12 hours. A shortstop solution
(sodium bisulfate or potassium dimethyl dithiocarbonate) is added to terminate the reaction at a
predetermined point, usually after 75 to 90 percent conversion (depending on the desired
molecular weight of the product). The reaction latex is then sent to a blowdown tank (Step 2),
where antioxidants are normally added.
The latex is subjected to several vacuum flash steps (3), where most of the
unreacted butadiene is released. It is then steam-stripped under vacuum (Step 4) to remove the
remaining butadiene and most of the unreacted acrylonitrile. The unreacted monomers are sent
to recovery and recycling. Stripped latex at about 110 to 130(F (43 to 54(C) is pumped to blend
tanks (Step 5).
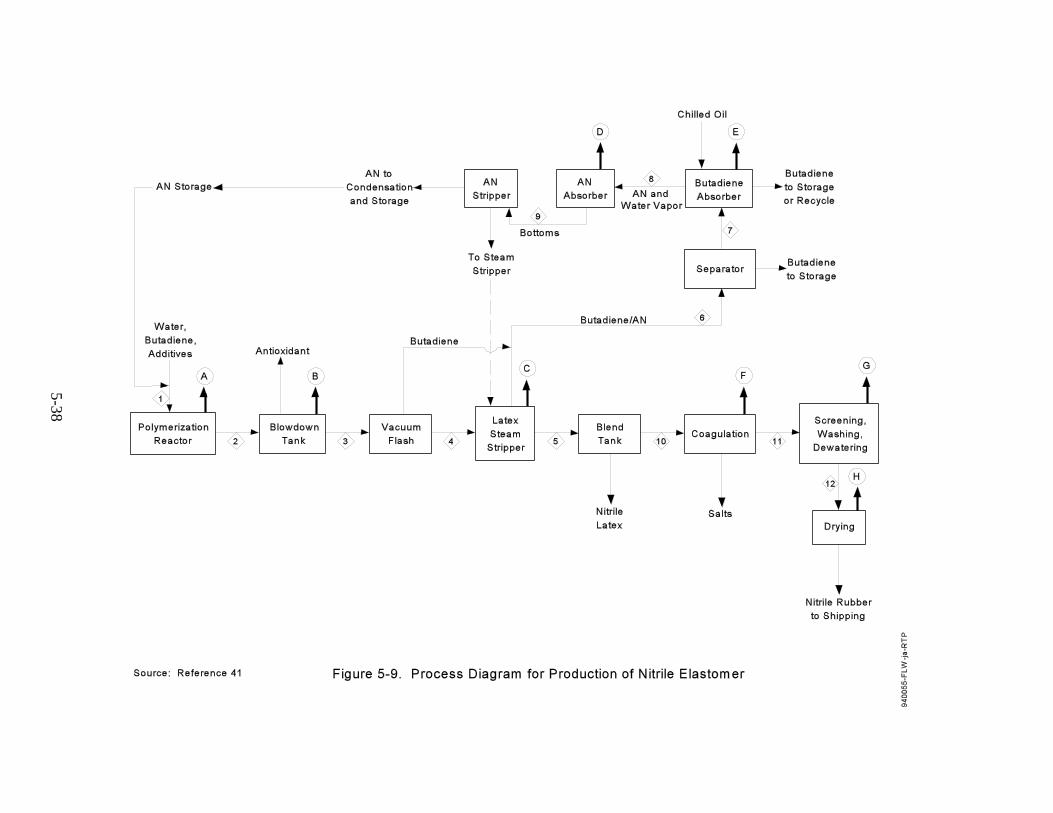
5-3
8
5-39
Gases released in the flash steps and stripped overhead contain butadiene. These
gases are sent to a partial condenser (not shown) and separator (Step 6), where butadiene vapor
is condensed and sent to liquid storage. Uncondensed butadiene vapor from the separator flows
to an absorber (Step 7), where it is absorbed by countercurrent contact with chilled oil. The
absorber bottoms are pumped to a flash tank (not shown), and dissolved butadiene is released
and returned to the compressor. The hot lean oil is then cooled, chilled, and returned to the top
of the absorber.
Unreacted acrylonitrile in flash vapors and latex stripper overhead is recovered by
sending these gases to a water absorber (Step 8). Absorber bottoms and the liquid phase of the
latex stripper overhead are pumped to a steam stripper (Step 9). The overhead vapor stream
from this stripper is condensed in a decanter. Phase separation is allowed to take place and the
acrylonitrile phase is decanted to storage. The water-rich phase with residual acrylonitrile is
returned to the stripper.
Latex is pumped from the blend tanks (Step 5) to a coagulation tank (Step 10),
where the emulsion is broken by the addition of dilute inorganic salt solution (sodium chloride
or aluminum sulfate) or a weak organic acid. The slurry of fine polymer crumb is then filtered
to remove coagulating chemicals (liquor is recycled) and
may be reslurried for further purification. Crumb is dewatered in an extruder (Step 11), then
hot-air dried (Step 12). Dried rubber is weighed, pressed into bales, and prepared for shipment.
If latex is the desired end product, the final processing steps (coagulation,
screening, washing, and drying) are omitted. The initial steps are essentially identical to those
for solid rubber production. 40
5.6.2 Emissions
The availability of emissions data for nitrile elastomer is somewhat limited. At
coproduction facilities, the estimated butadiene emissions include releases from other elastomer
production processes. For the two facilities that are also SB copolymer producers, the percent of
5-40
the total reported emissions assigned to the NBR process was based on the percent of total
production resulting in nitrile elastomer in 1984. Table 5-14 summarizes emissions for process
vents, equipment leaks, and secondary sources. All nitrile elastomer production was assumed to
be operating at full capacity. Emissions from emergency and accidental releases and40
transfer/handling were not known and storage vent emissions from butadiene storage were
expected to be low because of the use of tanks under pressure.
Process Vent Emissions
All six facilities for which emissions data were reported use some level of
emissions control. Many of the controls that are designed to reduce acrylonitrile emissions are
also effective in reducing butadiene emissions (flares, for example). Data from 1984 for four of
these facilities are summarized as emission factor ranges in Table 5-14 (see Tables C-21 and C-
22 in Appendix C for facility-specific data). The fifth is not used because calculation of an
emission factor might reveal confidential business information on production capacity. Potential
vent locations, shown in Figure 5-9 as Vents A through H, are based on information on the vent
locations supplied by five facilities.
The emission factor ranges were developed as described in Section 4.0. The
facility emission factor range includes the various levels of control that each facility has in place.
Control efficiencies varied from 89 percent to 99.9 percent. The uncontrolled emission factor
range represents potential emissions if controls were not in use.
Equipment Leak Emissions
The estimates for equipment leaks provided by three facilities span three orders of
magnitude (Table 5-14). These estimates include the level of control at butadiene producers
because of how the average emission rates were derived. The only known control devices
currently in use are rupture discs and a flare for pressure relief devices by one facility. The other
three facilities indicate daily visual inspection of equipment; however, no repair programs were
described for any of the leaks found. Although some controls are in place, detailed information
that could be used to compare practices with those at butadiene producers was not available.
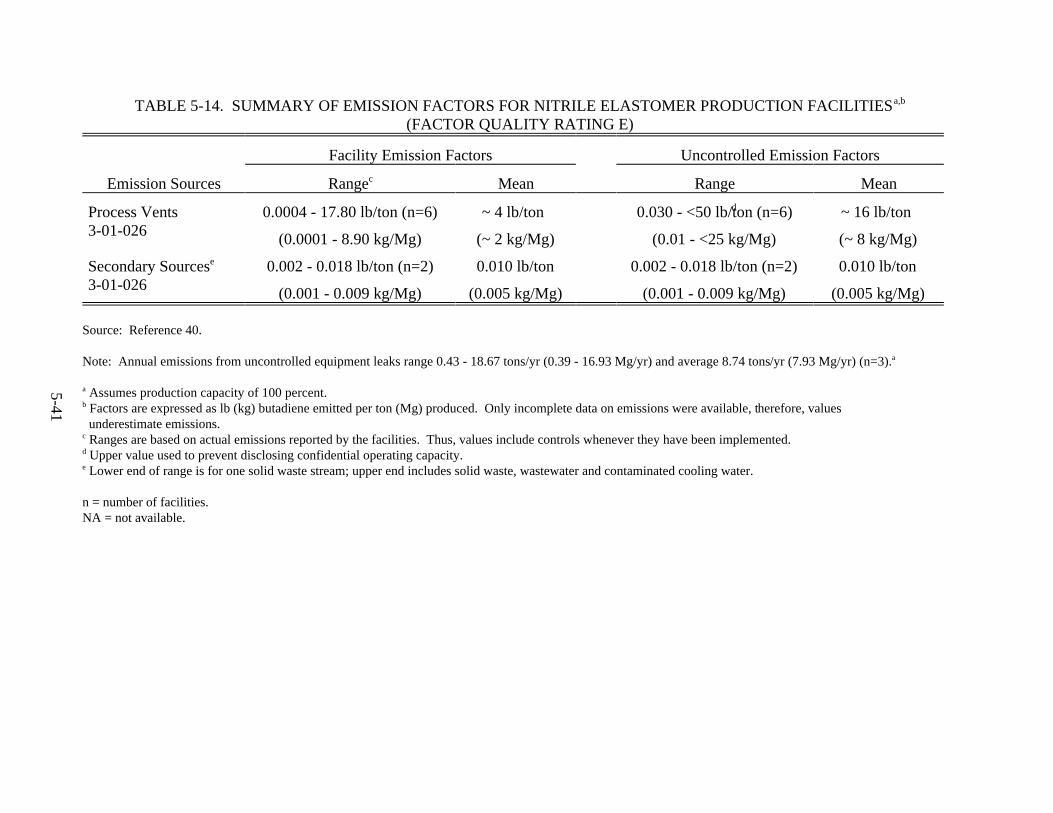
5-4
1
TABLE 5-14. SUMMARY OF EMISSION FACTORS FOR NITRILE ELASTOMER PRODUCTION FACILITIESa,b
(FACTOR QUALITY RATING E)
Emission Sources
Facility Emission Factors Uncontrolled Emission Factors
Rangec Mean Range Mean
Process Vents3-01-026
0.0004 - 17.80 lb/ton (n=6) ~ 4 lb/ton d0.030 - <50 lb/ton (n=6) ~ 16 lb/ton
(0.0001 - 8.90 kg/Mg) (~ 2 kg/Mg) (0.01 - <25 kg/Mg) (~ 8 kg/Mg)
Secondary Sourcese
3-01-0260.002 - 0.018 lb/ton (n=2) 0.010 lb/ton 0.002 - 0.018 lb/ton (n=2) 0.010 lb/ton
(0.001 - 0.009 kg/Mg) (0.005 kg/Mg) (0.001 - 0.009 kg/Mg) (0.005 kg/Mg)
Source: Reference 40.
Note: Annual emissions from uncontrolled equipment leaks range 0.43 - 18.67 tons/yr (0.39 - 16.93 Mg/yr) and average 8.74 tons/yr (7.93 Mg/yr) (n=3).a
Assumes production capacity of 100 percent. a
Factors are expressed as lb (kg) butadiene emitted per ton (Mg) produced. Only incomplete data on emissions were available, therefore, valuesb
underestimate emissions. Ranges are based on actual emissions reported by the facilities. Thus, values include controls whenever they have been implemented.c
Upper value used to prevent disclosing confidential operating capacity.d
Lower end of range is for one solid waste stream; upper end includes solid waste, wastewater and contaminated cooling water.e
n = number of facilities.NA = not available.
5-42
Secondary Emissions
One emissions estimate of 132 lb/yr (60 kg/yr) was provided from secondary
sources. This estimate includes wastewater, solid waste, and contaminated cooling water. A40
second facility also indicated wastewater and solid waste as potential secondary sources. The40
butadiene content in the wastewater was undetermined; therefore, emissions could not be
estimated. However, the solid waste stream contains 4 ppm butadiene. Based on a generation
rate of 1063 lb/day (483 kg/day) and assumptions of continuous operation and total
volatilization, the source's emissions potential is approximately 0.02 tons/yr (20 kg/yr). 43
6-1
SECTION 6.0
BUTADIENE EMISSIONS FROM MOBILE SOURCES
This section describes estimation methods for butadiene as one component of
mobile source hydrocarbon emissions, based on work by EPA's Office of Mobile Sources
(OMS). Butadiene emissions are formed in engine exhaust by the incomplete combustion of the
fuel. Based on the available data, butadiene emissions appear to increase roughly in proportion
to hydrocarbon emissions. Because hydrocarbon emissions are greater from noncatalyst-
controlled engines than from catalyst-equipped engines, butadiene emissions are expected to be
higher from noncatalyst-controlled engines, such as those in lawnmowers and chainsaws. 17
Levels of butadiene in gasoline and diesel fuel are expected to be insignificant
because butadiene tends to readily form a varnish that can be harmful to engines; therefore,
refiners try to minimize the butadiene content. As a result, it was assumed that butadiene is not
present in evaporative, refueling, or resting emissions.17
6.1 ON-ROAD MOBILE SOURCES
Results of work by the OMS on toxic emissions from on-road motor vehicles are
presented in the 1993 report Motor Vehicle-Related Air Toxics Study (MVATS). This report17
was prepared in response to Section 202(l)(1) of the 1990 Clean Air Act Amendments which
directs EPA to complete a study of the need for, and feasibility of, controlling emissions of toxic
air pollutants that are unregulated under the Act and are associated with motor vehicles and
motor vehicle fuels. The report presents composite emission factors for several toxic air
pollutants, including butadiene.
6-2
The emission factors presented in the MVATS were developed using currently
available emissions data in a modified version of the EPA's MOBILE4.1 emission model
(designated MOBTOX) to estimate toxic emissions as a fraction of total organic gas (TOG)
emissions. All exhaust mass fractions were calculated on a vehicle by vehicle basis for six
vehicle types: light-duty gasoline vehicles, light-duty gasoline trucks, heavy-duty gasoline
trucks, light-duty diesel vehicles, light-duty diesel trucks and heavy-duty diesel trucks. It was
assumed that light-duty gas and diesel trucks have the same mass fractions as light-duty gas
vehicles and diesel vehicles, respectively. For light duty gas vehicles and trucks, mass fractions
were disaggregated for four different catalytic types for running emissions and two different fuel
systems. Heavy-duty gas vehicles were assumed to have a carbureted fuel system with either no
catalyst or three-way catalyst. These mass fractions were applied to TOG emission factors
developed to calculate in-use toxics emission factors.
A number of important assumptions were made in the development of these in-
use toxic emission factors. They include:
1. Increase in air toxics due to vehicle deterioration with increased mileage isproportional to increase in TOG.
2. Toxics fractions remain constant with ambient temperature changes.
3. The fractions are adequate to use for the excess hydrocarbons that comefrom malfunction and tampering/misfueling.
It should be noted that in specific situations, the EPA Mobile models may over or underestimate
actual emissions.
The butadiene emission factors by vehicle class in grams of butadiene emitted per
mile driven are shown in Table 6-1. The OMS also performed multiple runs of the MOBTOX44
program to derive a pollutant-specific, composite emission factor that represented all vehicle
classes, based on the percent of total vehicle miles traveled (VMT) attributable to each vehicle
class. Table 6-1 also presents the composite emission factor in pounds (grams) of butadiene
emitted per mile driven. 17
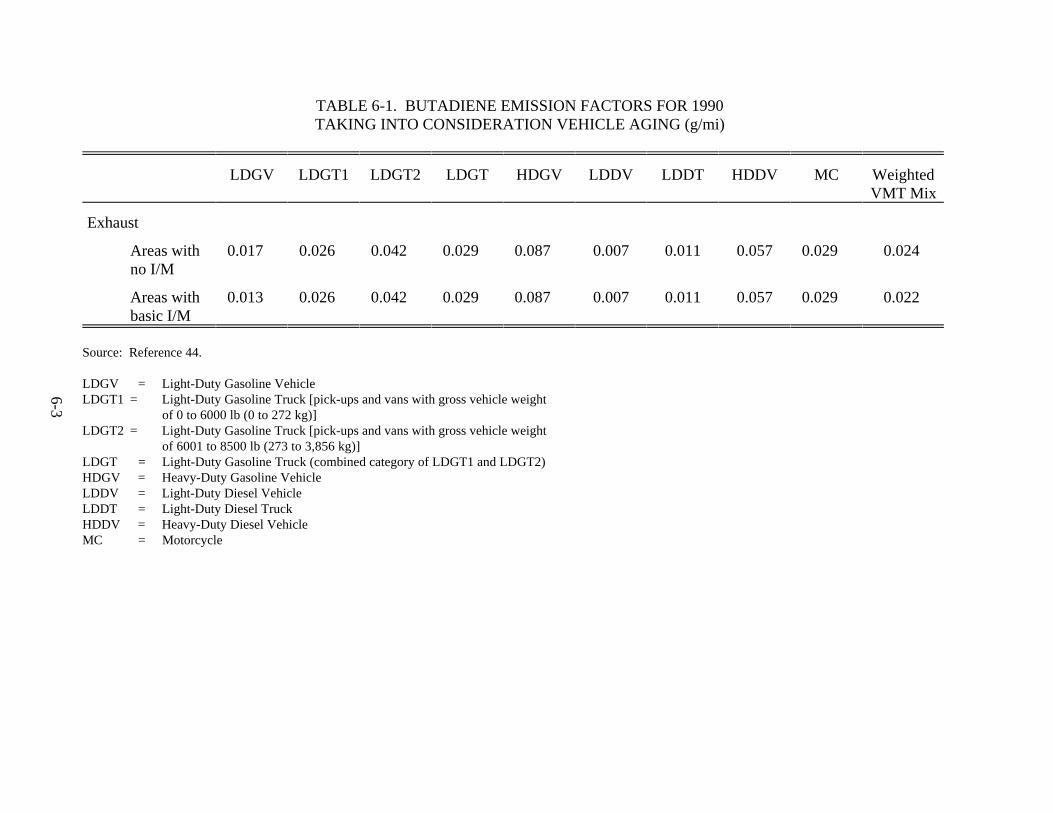
6-3
TABLE 6-1. BUTADIENE EMISSION FACTORS FOR 1990TAKING INTO CONSIDERATION VEHICLE AGING (g/mi)
LDGV LDGT1 LDGT2 LDGT HDGV LDDV LDDT HDDV MC WeightedVMT Mix
Exhaust
Areas withno I/M
0.017 0.026 0.042 0.029 0.087 0.007 0.011 0.057 0.029 0.024
Areas withbasic I/M
0.013 0.026 0.042 0.029 0.087 0.007 0.011 0.057 0.029 0.022
Source: Reference 44.
LDGV = Light-Duty Gasoline VehicleLDGT1 = Light-Duty Gasoline Truck [pick-ups and vans with gross vehicle weight
of 0 to 6000 lb (0 to 272 kg)]LDGT2 = Light-Duty Gasoline Truck [pick-ups and vans with gross vehicle weight
of 6001 to 8500 lb (273 to 3,856 kg)]LDGT = Light-Duty Gasoline Truck (combined category of LDGT1 and LDGT2)HDGV = Heavy-Duty Gasoline VehicleLDDV = Light-Duty Diesel VehicleLDDT = Light-Duty Diesel TruckHDDV = Heavy-Duty Diesel VehicleMC = Motorcycle
6-4
The OMS continues to update the on-road mobile sources model. As of the date
of preparation of this report, MOBILE5a was available, but butadiene-specific emission factors
had not been generated. Emissions based on this newer model, however, are estimated to be
about 20 percent higher on average than those from MOBTOX. Due to the higher VOC
emission rates associated with the newer model, the emission rates for 1,3-butadiene may also be
incrementally higher.
Use of methanol in motor vehicles will result in substantial 1,3-butadiene
emission reductions. Projected reductions in butadiene levels of approximately 93 percent were
given in a recent comparison of gasoline and 85-percent methanol (M85) emissions from
flexible fuel and variable fuel vehicles. Also, butadiene emissions reductions of 99 percent for45
optimized flexible fuel vehicles running on 100-percent methanol (M100) fuel were estimated in
EPA's Methanol Special Report. Substantial reductions in butadiene emissions are also46
expected with use of ethanol as a clean fuel. Finally, butadiene emissions with the use of47
compressed natural gas are extremely low.48,49
6.2 OFF-ROAD MOBILE SOURCES
For off-road mobile sources, EPA prepared the 1991 report Non-road Engine
Vehicle Emission Study (NEVES), which presents emission factors for 79 equipment types,50
ranging from small equipment such as lawnmowers and chain saws, to large agricultural,
industrial, and construction machinery (see Table 6-2). Locomotives, aircraft, and rockets are
not included. The equipment types were evaluated based on three engine designs: 2-stroke
gasoline, 4-stroke gasoline, and diesel. Sources for the data include earlier EPA studies and
testing and new information supplied by the engine manufacturers for tailpipe exhaust and
crankcase emission. For test data on new engines, adjustments were made to better represent
emissions from in-use equipment because EPA believes the new engine data do not take into
consideration increase in emissions due to engine deterioration associated with increased
equipment age; therefore, new engine data underestimate in-use emissions. 50
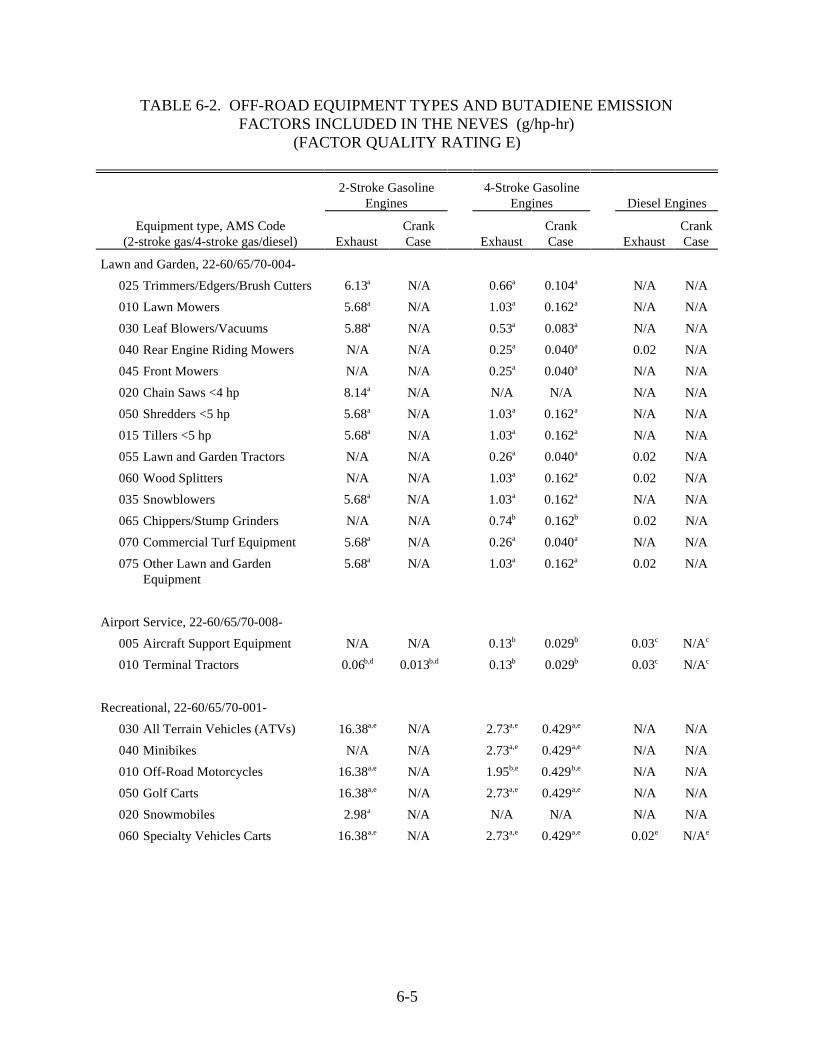
6-5
TABLE 6-2. OFF-ROAD EQUIPMENT TYPES AND BUTADIENE EMISSIONFACTORS INCLUDED IN THE NEVES (g/hp-hr)
(FACTOR QUALITY RATING E)
Equipment type, AMS Code Crank Crank Crank(2-stroke gas/4-stroke gas/diesel) Exhaust Case Exhaust Case Exhaust Case
2-Stroke Gasoline 4-Stroke GasolineEngines Engines Diesel Engines
Lawn and Garden, 22-60/65/70-004-
025 Trimmers/Edgers/Brush Cutters 6.13 N/A 0.66 0.104 N/A N/Aa a a
010 Lawn Mowers 5.68 N/A 1.03 0.162 N/A N/Aa a a
030 Leaf Blowers/Vacuums 5.88 N/A 0.53 0.083 N/A N/Aa a a
040 Rear Engine Riding Mowers N/A N/A 0.25 0.040 0.02 N/Aa a
045 Front Mowers N/A N/A 0.25 0.040 N/A N/Aa a
020 Chain Saws <4 hp 8.14 N/A N/A N/A N/A N/Aa
050 Shredders <5 hp 5.68 N/A 1.03 0.162 N/A N/Aa a a
015 Tillers <5 hp 5.68 N/A 1.03 0.162 N/A N/Aa a a
055 Lawn and Garden Tractors N/A N/A 0.26 0.040 0.02 N/Aa a
060 Wood Splitters N/A N/A 1.03 0.162 0.02 N/Aa a
035 Snowblowers 5.68 N/A 1.03 0.162 N/A N/Aa a a
065 Chippers/Stump Grinders N/A N/A 0.74 0.162 0.02 N/Ab b
070 Commercial Turf Equipment 5.68 N/A 0.26 0.040 N/A N/Aa a a
075 Other Lawn and Garden 5.68 N/A 1.03 0.162 0.02 N/AEquipment
a a a
Airport Service, 22-60/65/70-008-
005 Aircraft Support Equipment N/A N/A 0.13 0.029 0.03 N/Ab b c c
010 Terminal Tractors 0.06 0.013 0.13 0.029 0.03 N/Ab,d b,d b b c c
Recreational, 22-60/65/70-001-
030 All Terrain Vehicles (ATVs) 16.38 N/A 2.73 0.429 N/A N/Aa,e a,e a,e
040 Minibikes N/A N/A 2.73 0.429 N/A N/Aa,e a,e
010 Off-Road Motorcycles 16.38 N/A 1.95 0.429 N/A N/Aa,e b,e b,e
050 Golf Carts 16.38 N/A 2.73 0.429 N/A N/Aa,e a,e a,e
020 Snowmobiles 2.98 N/A N/A N/A N/A N/Aa
060 Specialty Vehicles Carts 16.38 N/A 2.73 0.429 0.02 N/Aa,e a,e a,e e e
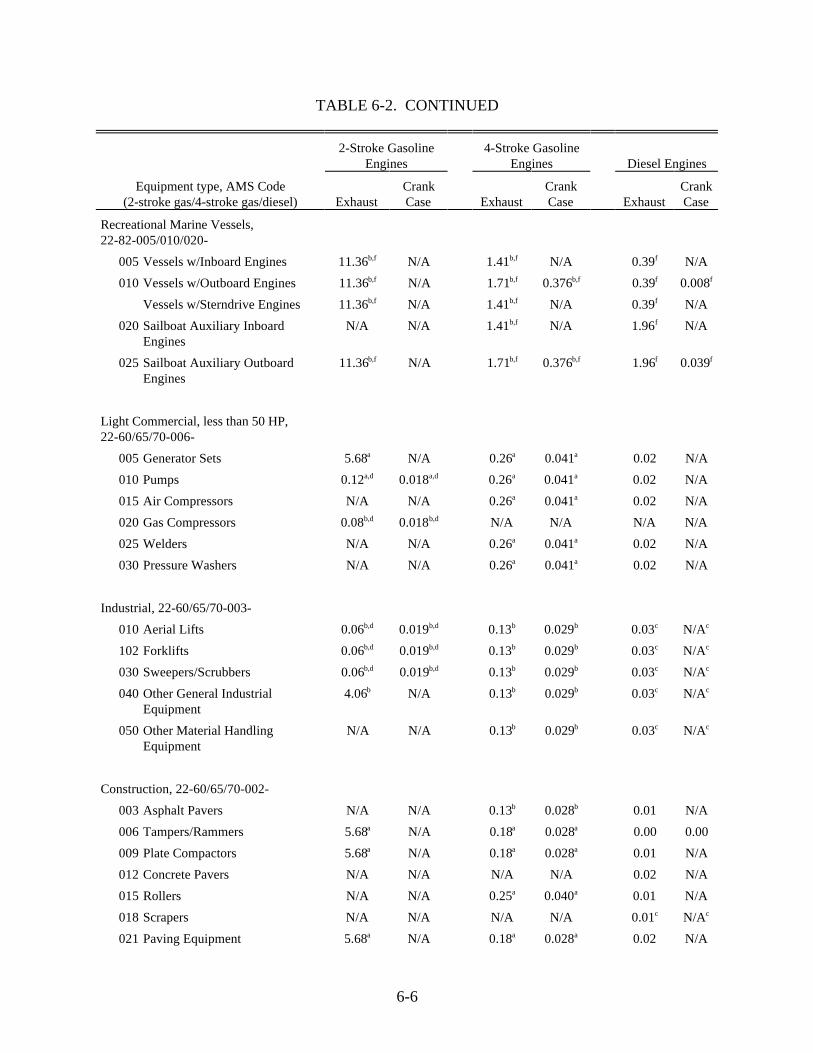
TABLE 6-2. CONTINUED
Equipment type, AMS Code Crank Crank Crank(2-stroke gas/4-stroke gas/diesel) Exhaust Case Exhaust Case Exhaust Case
2-Stroke Gasoline 4-Stroke GasolineEngines Engines Diesel Engines
6-6
Recreational Marine Vessels, 22-82-005/010/020-
005 Vessels w/Inboard Engines 11.36 N/A 1.41 N/A 0.39 N/Ab,f b,f f
010 Vessels w/Outboard Engines 11.36 N/A 1.71 0.376 0.39 0.008b,f b,f b,f f f
Vessels w/Sterndrive Engines 11.36 N/A 1.41 N/A 0.39 N/Ab,f b,f f
020 Sailboat Auxiliary Inboard N/A N/A 1.41 N/A 1.96 N/AEngines
b,f f
025 Sailboat Auxiliary Outboard 11.36 N/A 1.71 0.376 1.96 0.039Engines
b,f b,f b,f f f
Light Commercial, less than 50 HP,22-60/65/70-006-
005 Generator Sets 5.68 N/A 0.26 0.041 0.02 N/Aa a a
010 Pumps 0.12 0.018 0.26 0.041 0.02 N/Aa,d a,d a a
015 Air Compressors N/A N/A 0.26 0.041 0.02 N/Aa a
020 Gas Compressors 0.08 0.018 N/A N/A N/A N/Ab,d b,d
025 Welders N/A N/A 0.26 0.041 0.02 N/Aa a
030 Pressure Washers N/A N/A 0.26 0.041 0.02 N/Aa a
Industrial, 22-60/65/70-003-
010 Aerial Lifts 0.06 0.019 0.13 0.029 0.03 N/Ab,d b,d b b c c
102 Forklifts 0.06 0.019 0.13 0.029 0.03 N/Ab,d b,d b b c c
030 Sweepers/Scrubbers 0.06 0.019 0.13 0.029 0.03 N/Ab,d b,d b b c c
040 Other General Industrial 4.06 N/A 0.13 0.029 0.03 N/AEquipment
b b b c c
050 Other Material Handling N/A N/A 0.13 0.029 0.03 N/AEquipment
b b c c
Construction, 22-60/65/70-002-
003 Asphalt Pavers N/A N/A 0.13 0.028 0.01 N/Ab b
006 Tampers/Rammers 5.68 N/A 0.18 0.028 0.00 0.00a a a
009 Plate Compactors 5.68 N/A 0.18 0.028 0.01 N/Aa a a
012 Concrete Pavers N/A N/A N/A N/A 0.02 N/A
015 Rollers N/A N/A 0.25 0.040 0.01 N/Aa a
018 Scrapers N/A N/A N/A N/A 0.01 N/Ac c
021 Paving Equipment 5.68 N/A 0.18 0.028 0.02 N/Aa a a
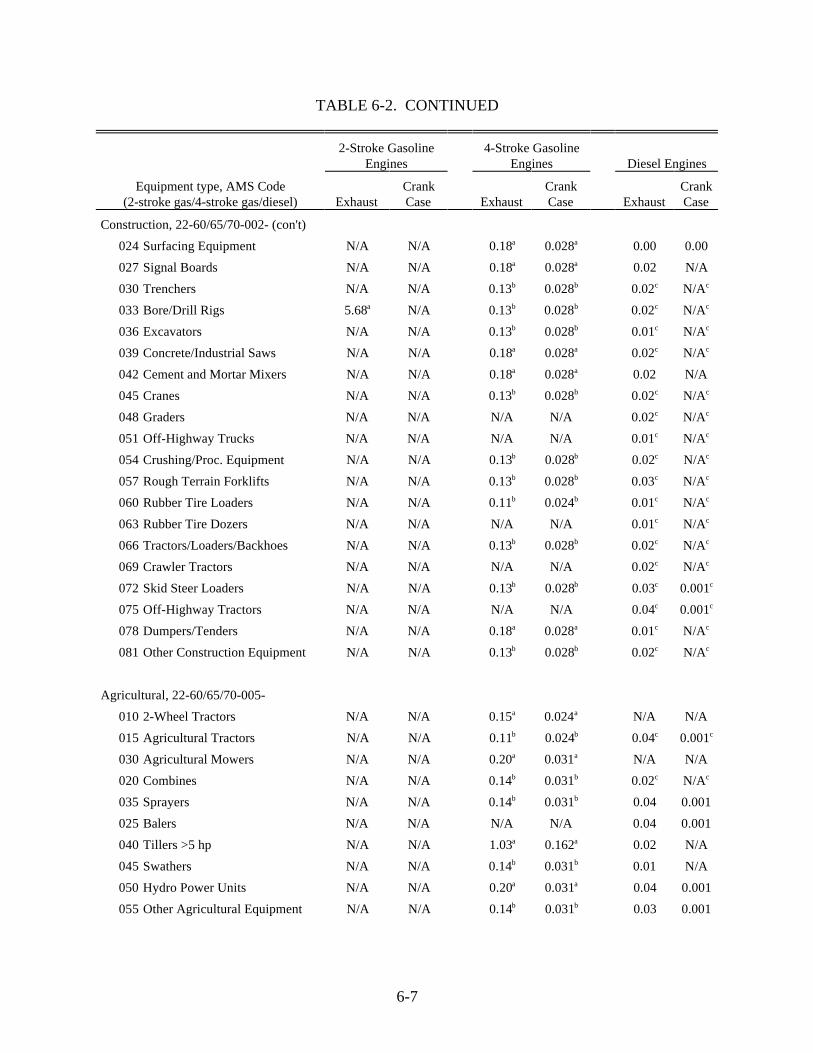
TABLE 6-2. CONTINUED
Equipment type, AMS Code Crank Crank Crank(2-stroke gas/4-stroke gas/diesel) Exhaust Case Exhaust Case Exhaust Case
2-Stroke Gasoline 4-Stroke GasolineEngines Engines Diesel Engines
6-7
Construction, 22-60/65/70-002- (con't)
024 Surfacing Equipment N/A N/A 0.18 0.028 0.00 0.00a a
027 Signal Boards N/A N/A 0.18 0.028 0.02 N/Aa a
030 Trenchers N/A N/A 0.13 0.028 0.02 N/Ab b c c
033 Bore/Drill Rigs 5.68 N/A 0.13 0.028 0.02 N/Aa b b c c
036 Excavators N/A N/A 0.13 0.028 0.01 N/Ab b c c
039 Concrete/Industrial Saws N/A N/A 0.18 0.028 0.02 N/Aa a c c
042 Cement and Mortar Mixers N/A N/A 0.18 0.028 0.02 N/Aa a
045 Cranes N/A N/A 0.13 0.028 0.02 N/Ab b c c
048 Graders N/A N/A N/A N/A 0.02 N/Ac c
051 Off-Highway Trucks N/A N/A N/A N/A 0.01 N/Ac c
054 Crushing/Proc. Equipment N/A N/A 0.13 0.028 0.02 N/Ab b c c
057 Rough Terrain Forklifts N/A N/A 0.13 0.028 0.03 N/Ab b c c
060 Rubber Tire Loaders N/A N/A 0.11 0.024 0.01 N/Ab b c c
063 Rubber Tire Dozers N/A N/A N/A N/A 0.01 N/Ac c
066 Tractors/Loaders/Backhoes N/A N/A 0.13 0.028 0.02 N/Ab b c c
069 Crawler Tractors N/A N/A N/A N/A 0.02 N/Ac c
072 Skid Steer Loaders N/A N/A 0.13 0.028 0.03 0.001b b c c
075 Off-Highway Tractors N/A N/A N/A N/A 0.04 0.001c c
078 Dumpers/Tenders N/A N/A 0.18 0.028 0.01 N/Aa a c c
081 Other Construction Equipment N/A N/A 0.13 0.028 0.02 N/Ab b c c
Agricultural, 22-60/65/70-005-
010 2-Wheel Tractors N/A N/A 0.15 0.024 N/A N/Aa a
015 Agricultural Tractors N/A N/A 0.11 0.024 0.04 0.001b b c c
030 Agricultural Mowers N/A N/A 0.20 0.031 N/A N/Aa a
020 Combines N/A N/A 0.14 0.031 0.02 N/Ab b c c
035 Sprayers N/A N/A 0.14 0.031 0.04 0.001b b
025 Balers N/A N/A N/A N/A 0.04 0.001
040 Tillers >5 hp N/A N/A 1.03 0.162 0.02 N/Aa a
045 Swathers N/A N/A 0.14 0.031 0.01 N/Ab b
050 Hydro Power Units N/A N/A 0.20 0.031 0.04 0.001a a
055 Other Agricultural Equipment N/A N/A 0.14 0.031 0.03 0.001b b
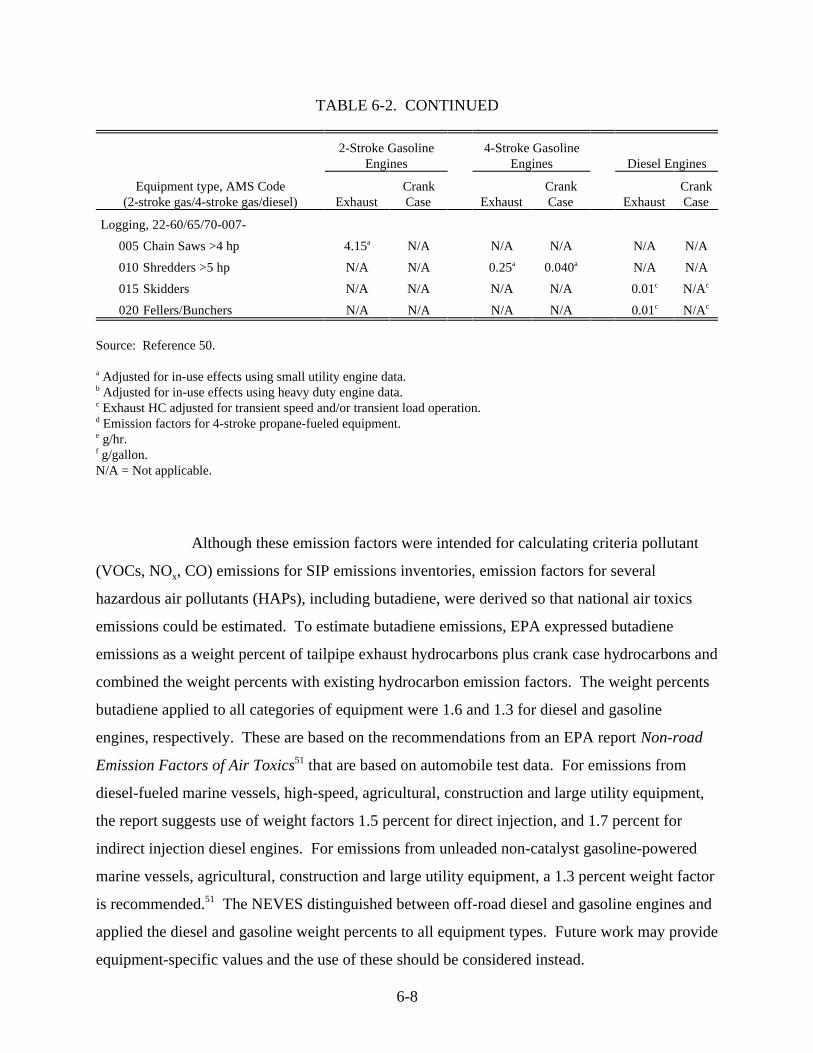
TABLE 6-2. CONTINUED
Equipment type, AMS Code Crank Crank Crank(2-stroke gas/4-stroke gas/diesel) Exhaust Case Exhaust Case Exhaust Case
2-Stroke Gasoline 4-Stroke GasolineEngines Engines Diesel Engines
6-8
Logging, 22-60/65/70-007-
005 Chain Saws >4 hp 4.15 N/A N/A N/A N/A N/Aa
010 Shredders >5 hp N/A N/A 0.25 0.040 N/A N/Aa a
015 Skidders N/A N/A N/A N/A 0.01 N/Ac c
020 Fellers/Bunchers N/A N/A N/A N/A 0.01 N/Ac c
Source: Reference 50.
Adjusted for in-use effects using small utility engine data.a
Adjusted for in-use effects using heavy duty engine data.b
Exhaust HC adjusted for transient speed and/or transient load operation.c
Emission factors for 4-stroke propane-fueled equipment.d
g/hr.e
g/gallon.f
N/A = Not applicable.
Although these emission factors were intended for calculating criteria pollutant
(VOCs, NO , CO) emissions for SIP emissions inventories, emission factors for severalx
hazardous air pollutants (HAPs), including butadiene, were derived so that national air toxics
emissions could be estimated. To estimate butadiene emissions, EPA expressed butadiene
emissions as a weight percent of tailpipe exhaust hydrocarbons plus crank case hydrocarbons and
combined the weight percents with existing hydrocarbon emission factors. The weight percents
butadiene applied to all categories of equipment were 1.6 and 1.3 for diesel and gasoline
engines, respectively. These are based on the recommendations from an EPA report Non-road
Emission Factors of Air Toxics that are based on automobile test data. For emissions from51
diesel-fueled marine vessels, high-speed, agricultural, construction and large utility equipment,
the report suggests use of weight factors 1.5 percent for direct injection, and 1.7 percent for
indirect injection diesel engines. For emissions from unleaded non-catalyst gasoline-powered
marine vessels, agricultural, construction and large utility equipment, a 1.3 percent weight factor
is recommended. The NEVES distinguished between off-road diesel and gasoline engines and51
applied the diesel and gasoline weight percents to all equipment types. Future work may provide
equipment-specific values and the use of these should be considered instead.
6-9
The most accurate emission estimate requires that the emission factors be used
with local activity data. If these data are unavailable, a state may elect to approximate emissions
using estimates from the NEVES for 24 nonattainment areas. Taking this approach, the state
chooses one of the 24 nonattainment areas which best represents the state's offroad activity. The
corresponding emission estimate is then adjusted by applying a ratio of the population for the
two areas to more closely approximate the state's emissions. The NEVES report also provides
estimates for counties in the 24 nonattainment areas; therefore, state and local agencies may
prepare regional or county inventories by applying a population ratio to the NEVES estimates.
For further details on the estimation procedure, the reader should refer to the NEVES report.
6.2.1 Marine Vessels
For commercial marine vessels, the NEVES report includes VOC emissions for
six nonattainment areas taken from a 1991 EPA study Commercial Marine Vessel Contribution
to Emission Inventories. This study provided hydrocarbon emission factors for ocean-going52
commercial vessels and harbor and fishing vessels. The emission factors are shown in
Table 6-3.
Ocean-going marine vessels fall into one of two categories--those with steam
propulsion and those with motor propulsion. Furthermore, they emit pollution under two modes
of operation: underway and at dockside (hotelling). Most steamships use boilers rather than
auxiliary diesel engines while hotelling. Currently, there are no butadiene toxic emission
fractions for steamship boiler burner emissions. The emission factors for motor propulsion
systems are based on emission fractions for heavy-duty diesel vehicle engines. For auxiliary
diesel generators, emission factors are available only for 500 KW engines, since the 1991 Booz-
Allen and Hamilton report indicated that almost all generators were rated at 500 KW or more.52
For harbor and fishing vessels, butadiene emission factors for diesel engines are
provided for the following horsepower categories -- less than 500 hp, 500 to 1,000 hp, 1,000 to
6-10
1,500 hp, 1,500 to 2,000 hp, and greater than 2,000 hp. In each of these categories, emission
factors are developed for full, cruise, and slow operating modes. Butadiene emission factors are
also provided for gasoline engines in this category. These emission factors are not broken down
by horsepower rating, and are expressed in grams per brake horsepower hour rather than pounds
per thousand gallons of fuel consumed.
6.2.2 Locomotives
As noted in the U.S. EPA's Procedures for Emission Inventory Preparation,
Volume IV: Mobile Sources, locomotive activity can be defined as either line haul or yard53
activities. Line haul locomotives, which perform line haul operation, generally travel between
distant locations, such as from one city to another. Yard locomotives, which perform yard
operations, are primarily responsible for moving railcars within a particular railway yard.
The OMS has included locomotive emissions in its Motor Vehicle-Related Air
Toxic Study. The emission factors used for locomotives in this report are derived from the17
heavy-duty diesel on-road vehicles as there are no emission factors specifically for locomotives.
To derive toxic emission factors for heavy duty diesel on-road vehicles, hydrocarbon emission
factors were speciated. The emission factors provided in this study (shown in Table 6-4) are
based on fuel consumption.54
6.2.3 Aircraft
There are two main types of aircraft engines in use: turbojet and piston. A
kerosene-like jet fuel is used in the jet engines, whereas aviation gasoline with a lower vapor
pressure than automotive gasoline is used for piston engines. The aircraft fleet in the United
States numbers about 198,000, including civilian and military aircraft. Most of the fleet is of55
the single- and twin-engine piston type and is used for general aviation. However, most of the
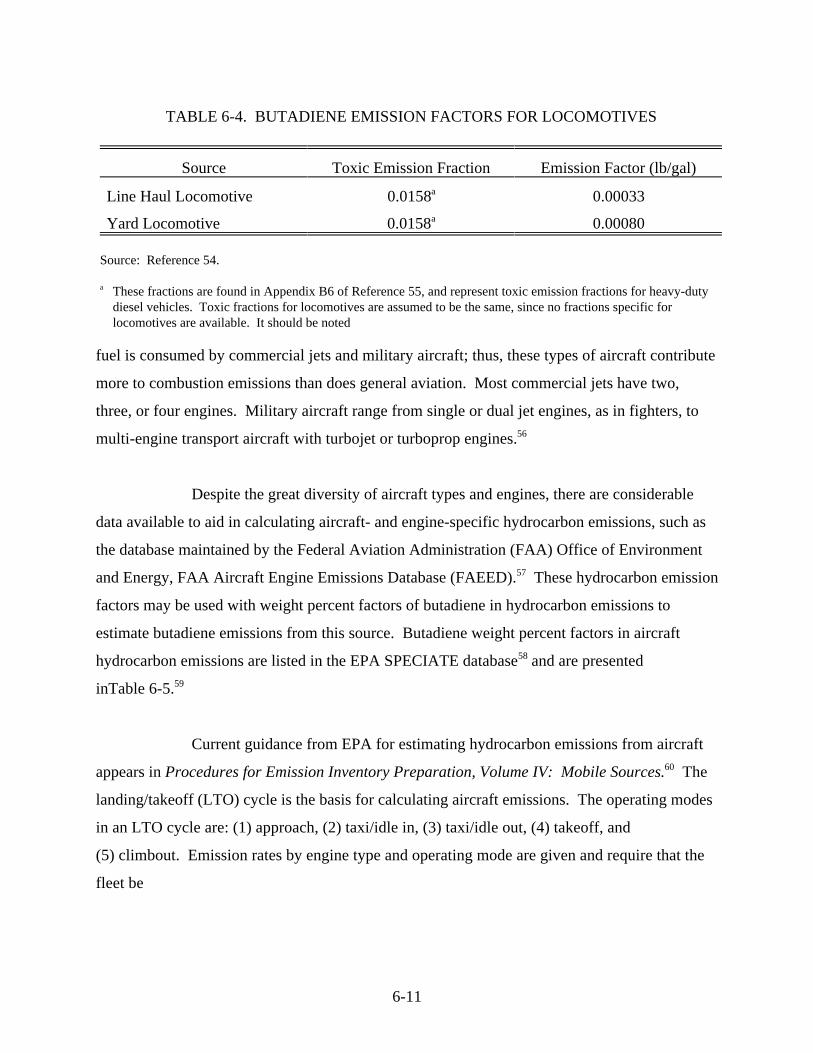
6-11
Source Toxic Emission Fraction Emission Factor (lb/gal)
Line Haul Locomotive 0.0158a 0.00033
Yard Locomotive 0.0158a 0.00080
Source: Reference 54.
These fractions are found in Appendix B6 of Reference 55, and represent toxic emission fractions for heavy-dutya
diesel vehicles. Toxic fractions for locomotives are assumed to be the same, since no fractions specific forlocomotives are available. It should be noted
TABLE 6-4. BUTADIENE EMISSION FACTORS FOR LOCOMOTIVES
fuel is consumed by commercial jets and military aircraft; thus, these types of aircraft contribute
more to combustion emissions than does general aviation. Most commercial jets have two,
three, or four engines. Military aircraft range from single or dual jet engines, as in fighters, to
multi-engine transport aircraft with turbojet or turboprop engines. 56
Despite the great diversity of aircraft types and engines, there are considerable
data available to aid in calculating aircraft- and engine-specific hydrocarbon emissions, such as
the database maintained by the Federal Aviation Administration (FAA) Office of Environment
and Energy, FAA Aircraft Engine Emissions Database (FAEED). These hydrocarbon emission57
factors may be used with weight percent factors of butadiene in hydrocarbon emissions to
estimate butadiene emissions from this source. Butadiene weight percent factors in aircraft
hydrocarbon emissions are listed in the EPA SPECIATE database and are presented58
inTable 6-5.59
Current guidance from EPA for estimating hydrocarbon emissions from aircraft
appears in Procedures for Emission Inventory Preparation, Volume IV: Mobile Sources. The60
landing/takeoff (LTO) cycle is the basis for calculating aircraft emissions. The operating modes
in an LTO cycle are: (1) approach, (2) taxi/idle in, (3) taxi/idle out, (4) takeoff, and
(5) climbout. Emission rates by engine type and operating mode are given and require that the
fleet be
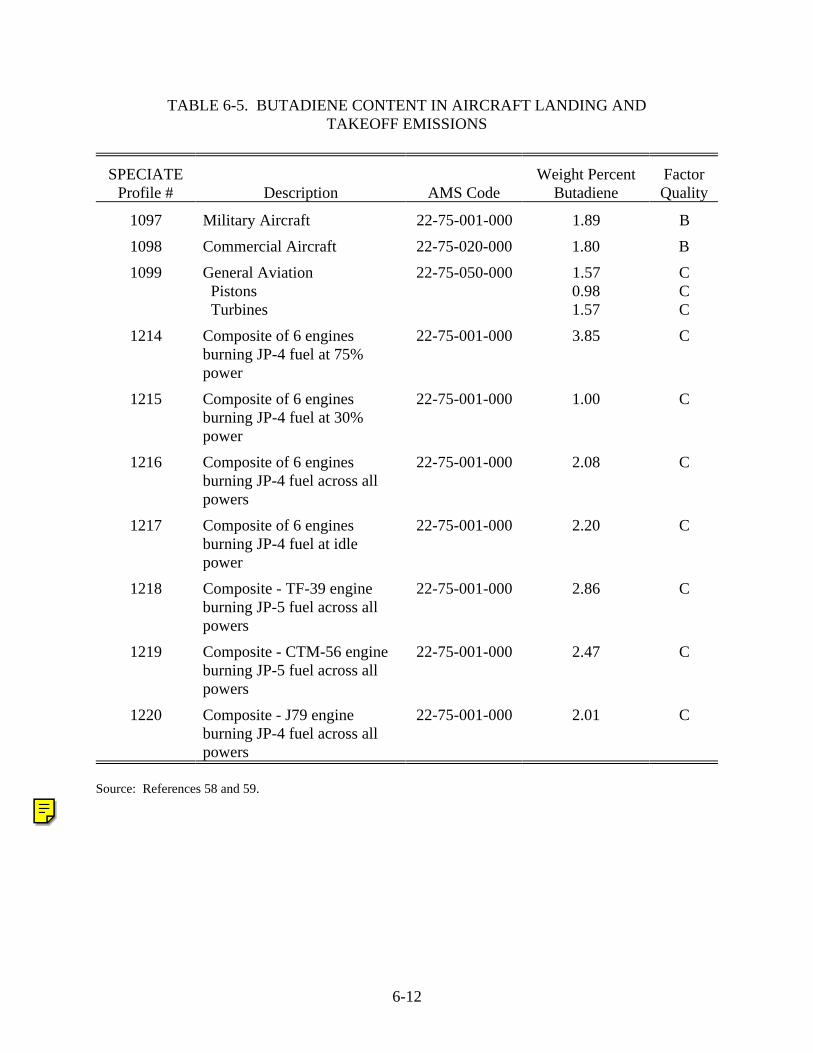
6-12
SPECIATEProfile # Description AMS Code
Weight PercentButadiene
FactorQuality
1097 Military Aircraft 22-75-001-000 1.89 B
1098 Commercial Aircraft 22-75-020-000 1.80 B
1099 General Aviation Pistons Turbines
22-75-050-000 1.570.981.57
CCC
1214 Composite of 6 enginesburning JP-4 fuel at 75%power
22-75-001-000 3.85 C
1215 Composite of 6 enginesburning JP-4 fuel at 30%power
22-75-001-000 1.00 C
1216 Composite of 6 enginesburning JP-4 fuel across allpowers
22-75-001-000 2.08 C
1217 Composite of 6 enginesburning JP-4 fuel at idlepower
22-75-001-000 2.20 C
1218 Composite - TF-39 engineburning JP-5 fuel across allpowers
22-75-001-000 2.86 C
1219 Composite - CTM-56 engineburning JP-5 fuel across allpowers
22-75-001-000 2.47 C
1220 Composite - J79 engineburning JP-4 fuel across allpowers
22-75-001-000 2.01 C
Source: References 58 and 59.
TABLE 6-5. BUTADIENE CONTENT IN AIRCRAFT LANDING ANDTAKEOFF EMISSIONS
6-13
characterized and the time in each of the operating modes determined. From this information,
hydrocarbon emissions can be calculated for one LTO for each aircraft type in the fleet. To
determine total hydrocarbon emissions from the fleet, the emissions from a single LTO for the
aircraft type must be multiplied by the number of LTOs for each aircraft type. The weight
percent factor for butadiene can be applied to the total hydrocarbon emissions to estimate the
butadiene emissions.
The emission estimating method noted above is the preferred approach as it takes
into consideration differences between new and old aircraft. If detailed aircraft information is
unavailable, hydrocarbon emission indices for representative fleet mixes are provided in the
emissions inventory guidance document Procedures for Emissions Inventory Preparation,
Volume IV: Mobile Sources. The hydrocarbon emission indices are 0.394 pounds per LTO60
(0.179 kg per LTO) for general aviation and 1.234 pounds per LTO (0.560 kg per LTO) for air
taxis.
The butadiene fraction of the hydrocarbon total can be estimated by using the
percent weight factors from SPECIATE. Because air taxis have larger engines and more of the
fleet is equipped with turboprop and turbojet engines than is the general aviation fleet, the
percent weight factor is somewhat different from the general aviation emission factor. To
approximate a butadiene percent weight factor for air taxis, the commercial and general aviation
percent weight factors were averaged (see Table 6-6). 6.2.458,60,61
Rocket Engines
Butadiene has also been detected from rocket engines tested or used for space
travel. Source testing of booster rocket engines using RP-1 (kerosene) and liquid oxygen have
been completed at an engine test site. Tests for butadiene were taken for eight test runs sampling
four locations within the plume envelope below the test stand. Results from these tests yielded a
range of butadiene emission factors--0.0368 to 0.47 lbs/ton (0.0151 to 0.193 kg/Mg) of fuel
combusted (factor quality rating C)--providing an average emission factor of 0.14 lb/ton
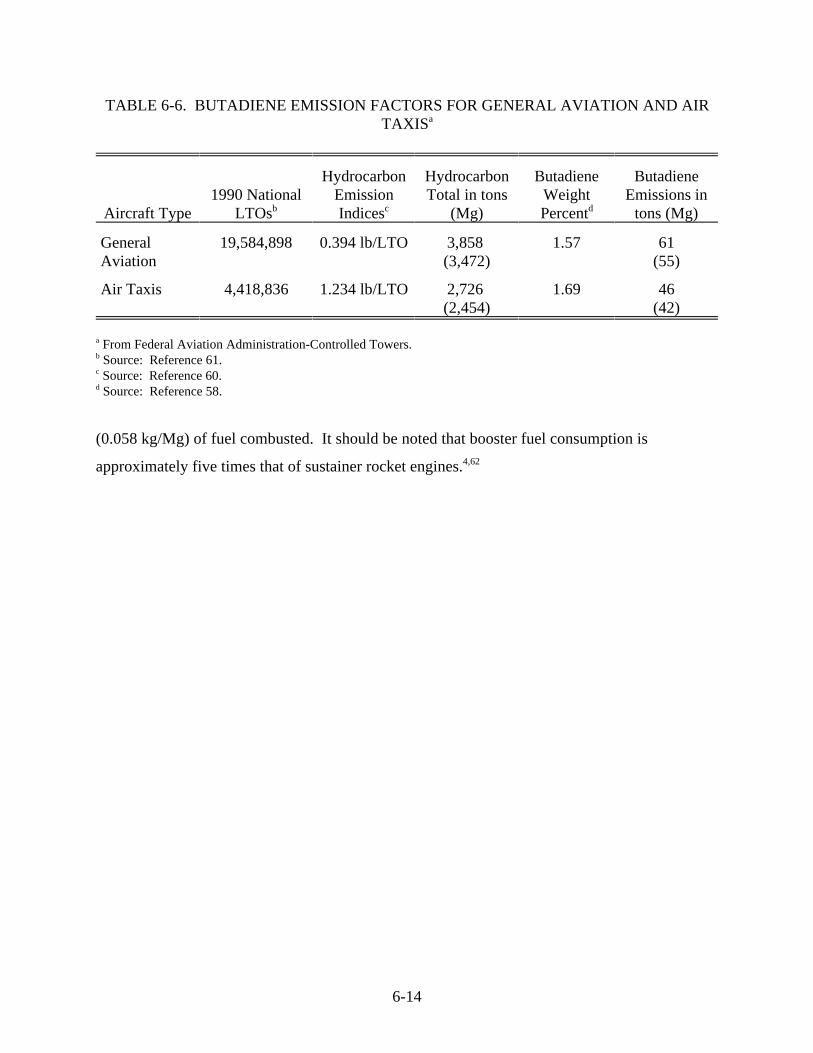
6-14
Aircraft Type1990 National
LTOsb
HydrocarbonEmissionIndicesc
HydrocarbonTotal in tons
(Mg)
ButadieneWeightPercentd
ButadieneEmissions in
tons (Mg)
GeneralAviation
19,584,898 0.394 lb/LTO 3,858 (3,472)
1.57 61(55)
Air Taxis 4,418,836 1.234 lb/LTO 2,726 (2,454)
1.69 46(42)
From Federal Aviation Administration-Controlled Towers.a
Source: Reference 61.b
Source: Reference 60.c
Source: Reference 58.d
TABLE 6-6. BUTADIENE EMISSION FACTORS FOR GENERAL AVIATION AND AIRTAXISa
(0.058 kg/Mg) of fuel combusted. It should be noted that booster fuel consumption is
approximately five times that of sustainer rocket engines. 4,62

7-1
SECTION 7.0
EMISSIONS FROM MISCELLANEOUS SOURCES OF BUTADIENE
This section provides an overview of the miscellaneous sources of butadiene
emissions. These sources can be divided into the following categories: miscellaneous chemical
production; secondary lead smelting; petroleum refining; combustion sources (biomass burning,
scrap tire burning, and stationary internal combustion sources); and "other." With regard to the
chemical production category, the major uses of butadiene were discussed in Section 5.0.
Section 7.0 identifies the smaller consumers, which account for about 8 percent of butadiene use
in the United States. Available details of the production process and associated emissions are
provided, where known. Often these details are incomplete; therefore, readers should contact the
facilities directly for the most accurate information.
The biomass burning and scrap tire burning categories are extremely diverse
sources and are therefore difficult to quantify. This section describes the various types of
burning and any associated emissions. The "other" category contains sources that have been
identified as possible butadiene sources, but for which specific emissions data are lacking.
7.1 MISCELLANEOUS USES OF BUTADIENE IN CHEMICAL PRODUCTION
Eighteen companies at 19 locations are producing 14 different products from
butadiene. Originally identified in a summary report on miscellaneous butadiene uses, this list35
of facilities has been updated using the 1993 Directory of Chemical Producers - U.S.A. These
facilities are summarized in Table 7-1, along with estimated capacities. Because data19,29
corresponding to each location are not readily available, all the production process descriptions,
current as of 1984, appear first, followed by a summary of any emissions estimates.
7-2
7.1.1 Product and Process Descriptions
Styrene-Butadiene-Vinylpyridine (SBV) Latex
No information on the production process or the use of styrene-butadiene-
vinylpyridine latex is available. As a copolymer, its production process is likely to be similar to
that of other copolymers.
Tetrahydrophthalic (THP) Anhydride and Acid
Tetrahydrophthalic anhydride and acid (the acid is the hydrate form of the
chemical) may be used either as a curing agent for epoxy resins or as an intermediate in the
manufacture of Captan®, an agricultural fungicide.
In the manufacture of the anhydride as a curing agent, Mobay Synthetics
(formerly Denka) is reported to use the following process. Liquid butadiene is first pressure-fed
to a vaporizer. The resulting vapor is then pressure-fed to the reactor, where reaction with
molten maleic anhydride occurs. Maleic anhydride is consumed over a period of 6 to 10 hours.
The product, molten THP anhydride, is crystallized onto a chill roller at the bagging operation.
Solidified anhydride is cut from the roller by a doctor blade into a weighed container, either a
bag or drum. Because ArChem also uses THP anhydride in epoxy resins, use of a process63
similar to Mobay Synthetics' was assumed. 35
ICI American Holdings, Inc. (formerly Calhio) was reported to generate the
anhydride for captive use as an intermediate for Captan®. In the generation process, butadiene
is charged to reactors along with maleic anhydride to produce THP anhydride. The reaction is a
Diels-Alder reaction, run under moderate temperature and pressure.64
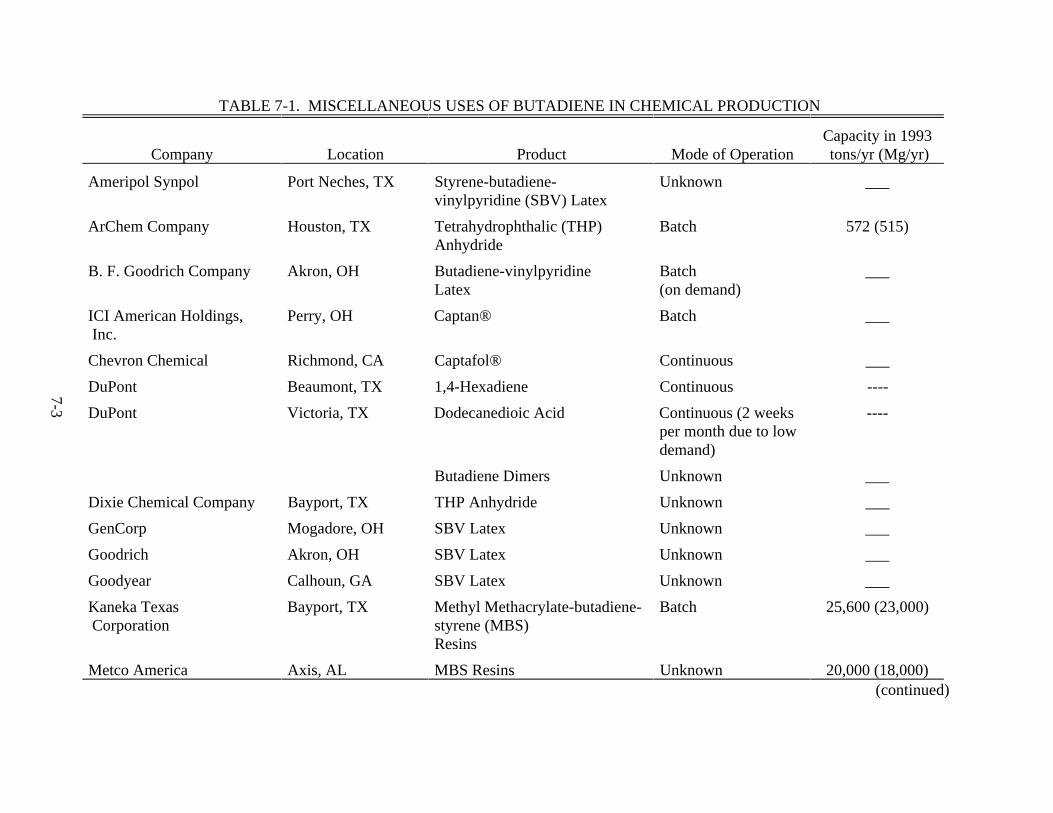
7-3
TABLE 7-1. MISCELLANEOUS USES OF BUTADIENE IN CHEMICAL PRODUCTION
Company Location Product Mode of OperationCapacity in 1993 tons/yr (Mg/yr)
Ameripol Synpol Port Neches, TX Styrene-butadiene-vinylpyridine (SBV) Latex
Unknown ___
ArChem Company Houston, TX Tetrahydrophthalic (THP)Anhydride
Batch 572 (515)
B. F. Goodrich Company Akron, OH Butadiene-vinylpyridine Latex
Batch(on demand)
___
ICI American Holdings, Inc.
Perry, OH Captan® Batch ___
Chevron Chemical Richmond, CA Captafol® Continuous ___
DuPont Beaumont, TX 1,4-Hexadiene Continuous ----
DuPont Victoria, TX Dodecanedioic Acid Continuous (2 weeksper month due to lowdemand)
----
Butadiene Dimers Unknown ___
Dixie Chemical Company Bayport, TX THP Anhydride Unknown ___
GenCorp Mogadore, OH SBV Latex Unknown ___
Goodrich Akron, OH SBV Latex Unknown ___
Goodyear Calhoun, GA SBV Latex Unknown ___
Kaneka Texas Corporation
Bayport, TX Methyl Methacrylate-butadiene-styrene (MBS)Resins
Batch 25,600 (23,000)
Metco America Axis, AL MBS Resins Unknown 20,000 (18,000)(continued)
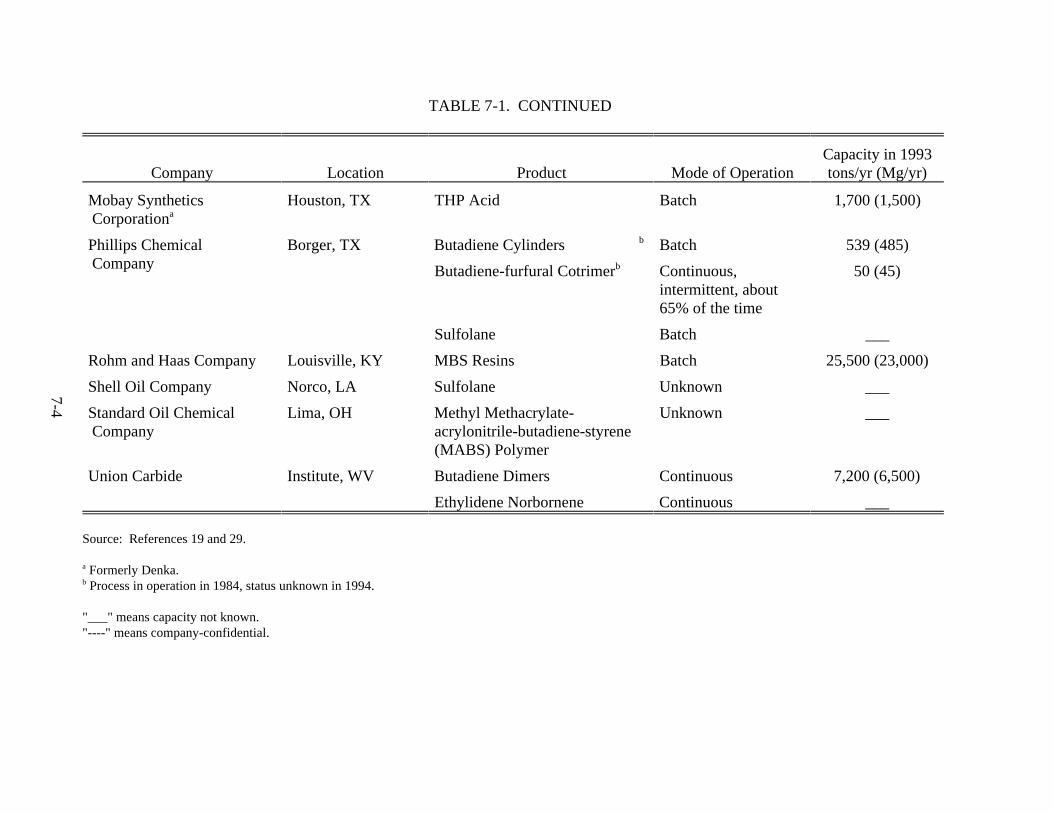
7-4
TABLE 7-1. CONTINUED
Company Location Product Mode of OperationCapacity in 1993tons/yr (Mg/yr)
Mobay Synthetics Corporationa
Houston, TX THP Acid Batch 1,700 (1,500)
Phillips Chemical Company
Borger, TX Butadiene Cylinders b Batch 539 (485)
Butadiene-furfural Cotrimerb Continuous,intermittent, about65% of the time
50 (45)
Sulfolane Batch ___
Rohm and Haas Company Louisville, KY MBS Resins Batch 25,500 (23,000)
Shell Oil Company Norco, LA Sulfolane Unknown ___
Standard Oil Chemical Company
Lima, OH Methyl Methacrylate-acrylonitrile-butadiene-styrene(MABS) Polymer
Unknown ___
Union Carbide Institute, WV Butadiene Dimers Continuous 7,200 (6,500)
Ethylidene Norbornene Continuous ___
Source: References 19 and 29.
Formerly Denka.a
Process in operation in 1984, status unknown in 1994.b
"___" means capacity not known."----" means company-confidential.
7-5
Butadiene-Vinylpyridine Latex
Butadiene-vinylpyridine latex is produced at the B. F. Goodrich, Akron, Ohio,
facility as an ingredient in an adhesive promoter. As a copolymer, the production process is
similar to that of other copolymers, usually involving an emulsion polymerization process. 65
B. F. Goodrich operates the process in a batch mode, on a schedule that depends on demand.
The finished latex is blended with SB latex and a phenol-formaldehyde mixture to
form a "dip" or an adhesive promoter. Dip is used with fabrics in geared rubber goods
manufacturing. This includes fabric used in tires, hoses, and belting production. 66
Methyl Methacrylate-Butadiene-Styrene Terpolymers
Methyl methacrylate-butadiene-styrene (MBS) terpolymers are produced in resin
form by four companies at four locations. This resin is used as an impact modifier in rigid
polyvinyl chloride products for applications in packaging, building, and construction. 35
Production of MBS terpolymers is achieved using an emulsion process in which
methyl methacrylate and styrene are grafted onto an SB rubber. The product is a two-phase
polymer. 66
Captan®
In Captan® production, tetrahydrophthalic anhydride is passed through an
ammonia scrubber to produce tetrahydrophthalimide (THPI). Molten THPI is coated onto a chill
roller, where it solidifies into a quasi-crystalline state. THPI is then conveyed into a reactor
containing perchloromethyl mercaptan (PMM). Caustic is charged to the reactor, initiating the
reaction that produces Captan®. Captan® is brought to a higher temperature in the heat
7-6
treatment tank to remove residual PMM, after which the material passes through a vacuum filter
to remove salt and water. The product cake is dried and collected in a baghouse. 64
Captafol®
Chevron produces Captafol®, a fungicide, under the trade name Difolatan® at its
Richmond, California, facility. The only information on the process is that production occurs on
a continuous basis and is carried out in a pressurized system vented to an incinerator. 35
1,4-Hexadiene
DuPont produces 1,4-hexadiene for use in manufacturing Nordel® synthetic
rubber. Nordel® polymer is used in the manufacture of rubber goods, wire and cable insulation,
automobile bumpers, and as an oil additive. 67
In the reactor, butadiene reacts with ethylene to form 1,4-hexadiene. After
reaction, unreacted 1,3-butadiene and ethylene, along with 1,4-hexadiene and by-products, are
flashed from the catalyst and solvent. The maximum temperature in the process is
approximately 250(F (121(C). The catalyst solution is pumped back to the reactor; vaporized
components are sent to a stripper column. The column separates ethylene and 1,3-butadiene
from the 1,4-hexadiene product and by-products; unreacted components are pumped back to the
reactor. The 1,4-hexadiene and by-products are sent to crude product storage before transfer to
refining. The 1,4-hexadiene is refined in low-boiler and high-boiler removal columns and
transferred to the Nordel® polymerization process. 68
Dodecanedioic Acid
Dodecanedioic acid (DDDA) is produced by DuPont for use as an intermediate in
the production of 1,5,9-cyclodecatriene, a constituent in the manufacture of DuPont's Quiana®
fabric. Butadiene can be converted into several different cyclic or open-chain dimers and68
trimers, depending upon the reaction conditions and catalysts. Although vinylcyclohexene and
7-7
1,5-cyclooctadiene are the predominant products, 1,2-divinylcyclobutane may be formed under
suitable reaction conditions. Nickel catalysts are often used in the cyclodimerization and
cyclotrimerization of butadiene; however, complexes of iron, copper (I), zeolite, and
compositions also promote cyclodimerization, often giving cyclooctadiene as the principal
product. 68
Butadiene Cylinders
Phillips Chemical Company fills cylinders with butadiene monomer at its Borger,
Texas, facility. A NIOSH survey report on this facility indicates that these cylinders may be
samples of butadiene taken for process quality control. The report describes routine quality69
control sampling in the tank farm area in which the samples are collected using pressure
cylinders. Operators connect the sample containers to a process line and open valves to fill the
cylinder. Butadiene fills the container and is purged out of the rear of the cylinder before the
valve is closed, resulting in emissions from the cylinder. The sample container is subjected to
vacuum exhaust under a laboratory hood at the conclusion of sampling. 35
Butadiene Furfural Cotrimer
Butadiene furfural cotrimer or 2,3,4,5-bis(butadiene)tetrahydrofurfural,
commonly known as R-11, is used as an insect repellant and as a delousing agent for cows in the
dairy industry. The concentrations of R-11 in commercial insecticide spray are generally less
than 1 percent. 69
Production of R-11 at Phillips' Borger, Texas, facility, occurs intermittently
throughout the year; however, when operating, the production process is a continuous operation.
In the process, butadiene reacts with an excess of furfural in a liquid-phase reactor. The reaction
proceeds under moderate conditions of temperature and pressure and consumes 1 mole of
furfural for 2 moles of butadiene. After a period of 4 to 5 hours, the reaction mixture is
transferred to the reactor effluent surge tank. The mixture proceeds to a vertical column that
separates butadiene dimer by distillation. Butadiene dimer, or 4-vinyl-1-cyclohexane, is
7-8
recovered from the column and later transported to a refinery for reprocessing in crude catalytic
cracking units. 69
Furfural is removed from the reaction products by distillation in a similar column
and recycled to the reactor. The last column in the R-11 process runs as a batch operation, and
separates R-11 from the polymer kettle product. The kettle product is a crystalline solid that is
disposed of in an on-site landfill. R-11, which is in the form of a yellow liquid, is transferred to
storage tanks and shipped to customers in drums. 69
Sulfolane
Sulfolane is a common trade name for tetrahydrothiophene 1,1-dioxide. It is used
principally as a solvent for extracting aromatic hydrocarbons from mixtures containing straight-
chained hydrocarbons. Sulfolane is produced by first reacting butadiene and sulfur dioxide to
form 3-sulfolene. The 3-sulfolene is then hydrogenated to produce sulfolane. Phillips' Borger,
Texas, facility is assumed to be using a similar process. The Shell facility at Norco, Louisiana,
has a sulfolane production unit downstream of the butadiene recovery process that is included as
part of the butadiene production facility. 19
Methyl Methacrylate-Acrylonitrile-Butadiene-Styrene (MABS) Polymers
MABS polymers are produced by Standard Oil Company under the trade name
Barex®. The MABS copolymers are prepared by dissolving or dispersing polybutadiene rubber
in a mixture of methyl methacrylate-acrylonitrile-styrene and butadiene monomer. The graft
copolymerization is carried out by a bulk or a suspension process. The final polymer is two-
phase, with the continuous phase terpolymer of methyl methacrylate, acrylonitrile, and styrene
grafted onto the dispersed polybutadiene phase.66
These polymers are used in the plastics industry in applications requiring a tough,
transparent, highly impact-resistant, and thermally-formable material. Except for their
transparency, the MABS polymers are similar to the opaque ABS plastics. The primary function
7-9
of methyl methacrylate is to match the refractive indices of the two phases, thereby imparting
transparency. 66
Butadiene Dimers
Tetrahydrobenzaldehyde (THBA), a butadiene dimer, is produced by Union
Carbide and DuPont (Victoria, Texas). At Union Carbide, butadiene is reacted with acrolein and
cyclohexane to produce THB anhydride in +90-percent yields over a short period of time when
the reaction is carried out at temperatures up to 392(F (200(C). The reaction will also take68
place at room temperature in the presence of an aluminum-titanium catalyst. A by-product of
the reaction is 4-vinyl-1-cyclohexane. At the Union Carbide facility, THBA is recovered and68
the unreacted raw materials are recycled to the feed pot. The feed pot, reactor, recovery stills,
and refined product storage tanks are all vented to a flare header. In the absence of process35
information at the DuPont facility, it is assumed to be using a similar production process.
Ethylidene Norbornene (ENB)
ENB, produced by Union Carbide, is a diene that is used as a third monomer in
the production of ethylene-propylene-dimethacrylates. Ethylene-propylene-dimethacrylate
elastomers are unique in that they are always unsaturated in the side chain pendant to the main or
backbone chain. Therefore, any oxidation or chemical reaction with residual unsaturation has
only a limited effect on the properties of the elastomer. 70
7.1.2 Emissions
No emissions data are available for the following products: SBV latex, Captan®,
Captafol®, THP acid, and ethylidene norbornene. For processes where emissions information is
available, it is limited to three sources: process vents, equipment leaks, and secondary
sources. Butadiene emissions from raw material storage are expected to be negligible19,35
because butadiene is usually stored under pressure. Some emissions resulting from accidental
7-10
and emergency releases and transfer and handling of raw materials are likely; however, they
have not generally been quantified.
Data are available for process vent emissions from production processes at eight
facilities. At five of these facilities, flares or boilers are used on some vents to control
emissions. At a sixth facility, emissions reduction is achieved by recovery of the vented stream
off the butadiene-furfural cotrimer process, one of the two process vents identified. Because
every facility did not report an emissions estimate for each process vent listed, emissions data
are incomplete.
The emission factors for process vents and secondary sources are summarized in
Table 7-2, with facility-specific data appearing in Tables C-23 through C-25 in19,35,65
Appendix C. Ranges are provided if more than one data point was available. The facility
emission factors include the control that each facility providing the data has in place. The
uncontrolled emission factors represent potential emissions if controls were not in use.
Because equipment count data were not readily available, no calculations of
equipment leak emissions using average CMA factors were done. Instead, equipment leak
estimates for eight processes at eight facilities were taken from memoranda prepared for EPA in
1986. Because information on emissions control through leak detection and repair programs19,35
was incomplete, adjustments to estimated emissions could not be made. The only other controls
in use were double mechanical pump seals and rupture discs on pressure relief devices.
Based on information on secondary sources from eight facilities, emissions
generally appear to be negligible from these sources, despite different end products. One
exception is the butadiene-vinylpyridine process. The facility estimated butadiene emissions
from wastewater volatilization to be approximately 1.3 tons/yr (1.2 Mg/yr). 65
Two estimates for emergency vent releases during upsets, startups, and shutdowns
of the 1,4-hexadiene process are 0.2 tons/yr (0.2 Mg/yr) (uncontrolled) off the abatement
collection system for waste liquid and vapors and 47.5 tons/yr (43.1 Mg/yr) from the reactor
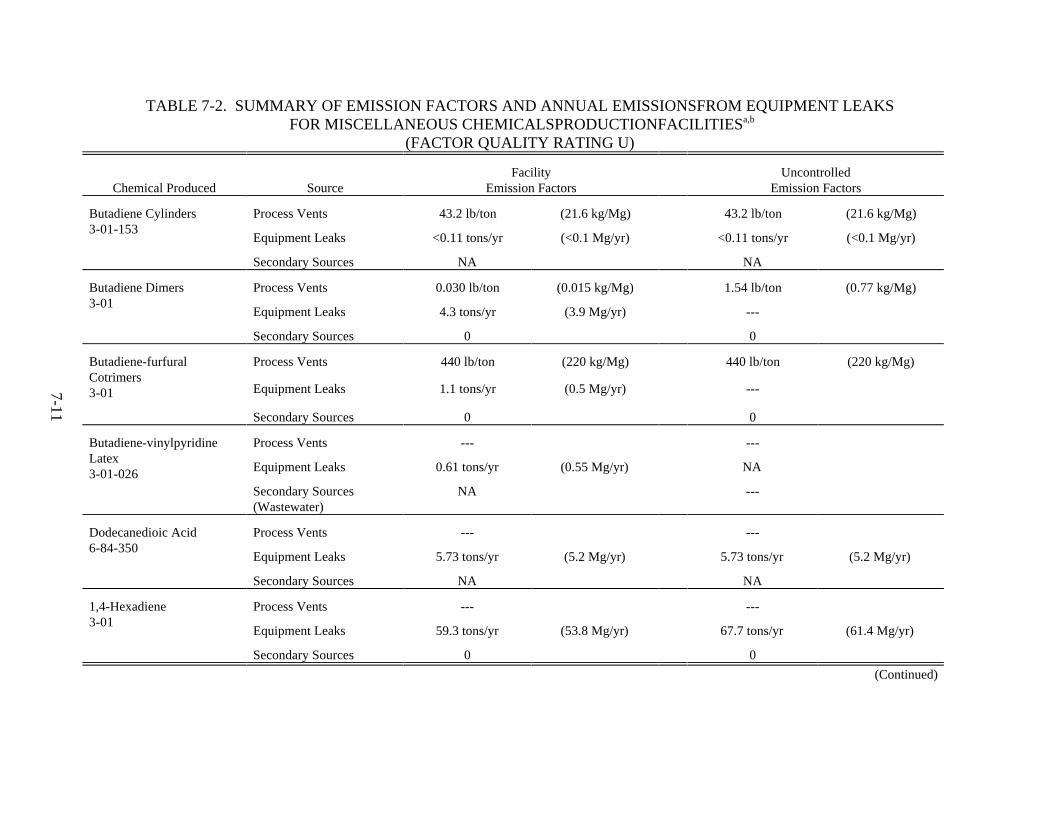
7-1
1
TABLE 7-2. SUMMARY OF EMISSION FACTORS AND ANNUAL EMISSIONSFROM EQUIPMENT LEAKS FOR MISCELLANEOUS CHEMICALSPRODUCTIONFACILITIESa,b
(FACTOR QUALITY RATING U)
Chemical Produced SourceFacility
Emission FactorsUncontrolled
Emission Factors
Butadiene Cylinders3-01-153
Process Vents 43.2 lb/ton (21.6 kg/Mg) 43.2 lb/ton (21.6 kg/Mg)
Equipment Leaks <0.11 tons/yr (<0.1 Mg/yr) <0.11 tons/yr (<0.1 Mg/yr)
Secondary Sources NA NA
Butadiene Dimers3-01
Process Vents 0.030 lb/ton (0.015 kg/Mg) 1.54 lb/ton (0.77 kg/Mg)
Equipment Leaks 4.3 tons/yr (3.9 Mg/yr) ---
Secondary Sources 0 0
Butadiene-furfuralCotrimers3-01
Process Vents 440 lb/ton (220 kg/Mg) 440 lb/ton (220 kg/Mg)
Equipment Leaks 1.1 tons/yr (0.5 Mg/yr) ---
Secondary Sources 0 0
Butadiene-vinylpyridineLatex3-01-026
Process Vents --- ---
Equipment Leaks 0.61 tons/yr (0.55 Mg/yr) NA
Secondary Sources(Wastewater)
NA ---
Dodecanedioic Acid6-84-350
Process Vents --- ---
Equipment Leaks 5.73 tons/yr (5.2 Mg/yr) 5.73 tons/yr (5.2 Mg/yr)
Secondary Sources NA NA
1,4-Hexadiene3-01
Process Vents --- ---
Equipment Leaks 59.3 tons/yr (53.8 Mg/yr) 67.7 tons/yr (61.4 Mg/yr)
Secondary Sources 0 0
(Continued)
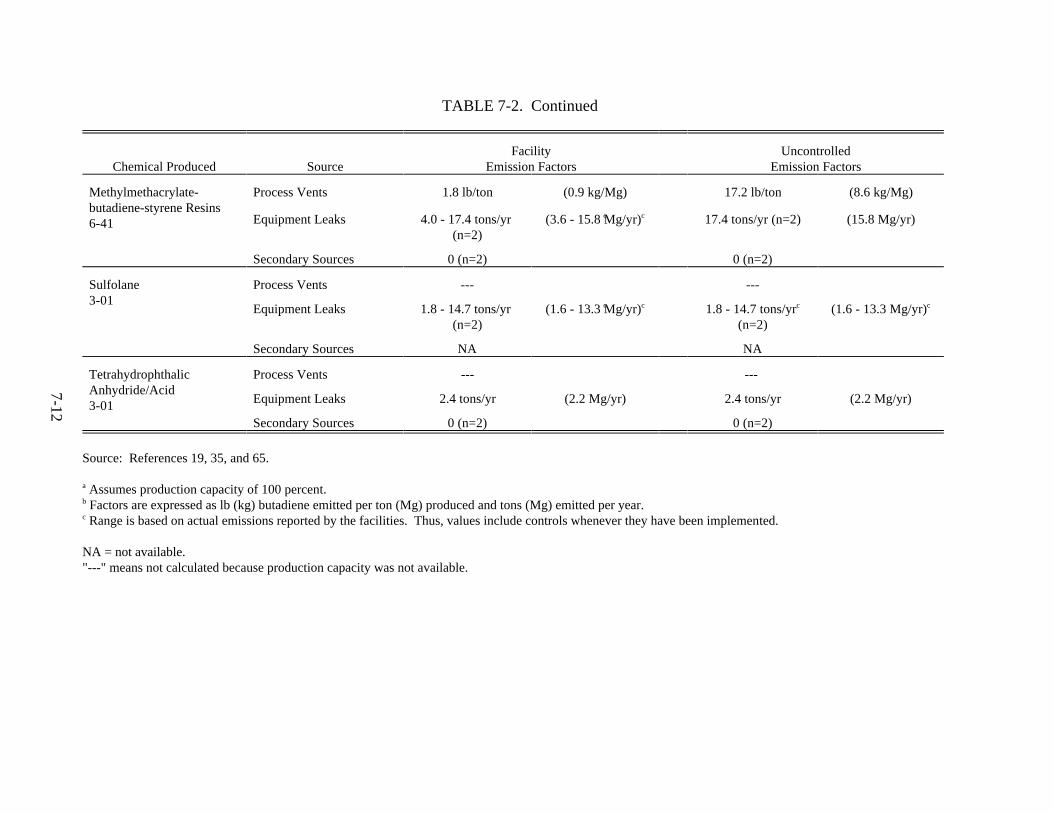
7-1
2
TABLE 7-2. Continued
Chemical Produced SourceFacility
Emission FactorsUncontrolled
Emission Factors
Methylmethacrylate-butadiene-styrene Resins6-41
Process Vents 1.8 lb/ton (0.9 kg/Mg) 17.2 lb/ton (8.6 kg/Mg)
Equipment Leaks 4.0 - 17.4 tons/yr c
(n=2)(3.6 - 15.8 Mg/yr)c 17.4 tons/yr (n=2) (15.8 Mg/yr)
Secondary Sources 0 (n=2) 0 (n=2)
Sulfolane3-01
Process Vents --- ---
Equipment Leaks 1.8 - 14.7 tons/yr c
(n=2)(1.6 - 13.3 Mg/yr)c 1.8 - 14.7 tons/yrc
(n=2)(1.6 - 13.3 Mg/yr)c
Secondary Sources NA NA
TetrahydrophthalicAnhydride/Acid3-01
Process Vents --- ---
Equipment Leaks 2.4 tons/yr (2.2 Mg/yr) 2.4 tons/yr (2.2 Mg/yr)
Secondary Sources 0 (n=2) 0 (n=2)
Source: References 19, 35, and 65.
Assumes production capacity of 100 percent. a
Factors are expressed as lb (kg) butadiene emitted per ton (Mg) produced and tons (Mg) emitted per year.b
Range is based on actual emissions reported by the facilities. Thus, values include controls whenever they have been implemented.c
NA = not available."---" means not calculated because production capacity was not available.
7-13
emergency vent. A brine refrigerated condenser on the reactor emergency vent may afford some
emissions reduction, but an efficiency was not indicated.35
7.2 INDIRECT SOURCES OF BUTADIENE
A number of indirect sources of butadiene emissions have been identified. Each
is described briefly below. Where emissions information was available, this is also provided.
Because of EPA's increasing interest in air toxics, emissions information may be available in the
future; therefore, the reader should consider a literature search to identify new sources of
butadiene and locate emissions data.
7.2.1 Vinyl Chloride Monomer and Polyvinyl Chloride Production
In vinyl chloride monomer (VCM) production, butadiene appears as an impurity
in the final product at a maximum level of 6.0 ppm. An emission factor developed for overall71
production of polyvinyl chloride (PVC) (SCC 6-46-300-01) at a representative PVC plant was
calculated and is given as 4.6 x 10 lb/ton (2.1 x 10 g/kg) PVC produced. -4 -4
7.2.2 Publicly Owned Treatment Works
Some estimates for emissions from wastewater sent to publicly owned treatment
works (POTWs) by SB copolymer producers, considered a secondary source, were made based
on three industry responses to EPA Section 114 requests. Using data on the butadiene content72
of wastewater sent to a POTW for each of these facilities and air emission models developed by
EPA's Office of Air Quality Planning and Standards (OAQPS) for treatment, storage, and
disposal facilities, estimated emissions for all three facilities are 21 tons/yr (19 Mg/yr). This
approach did not account for volatilization from wastewater during transport to the POTW.
An emission factor developed for butadiene in influent in a representative POTW
was calculated and is given as 1.7 x 10 lb/ton (771 g/kg) butadiene in influent. 3 4,72
7-14
7.2.3 Secondary Lead Smelting
Although not a significant source, secondary lead smelters are a source of
1,3-butadiene emissions. The secondary lead smelting industry produces elemental and lead
alloys by reclaiming lead mainly from scrap automobile batteries. There are approximately
23 secondary lead smelters in the United States. 73
Lead-acid batteries represent about 90 percent of the raw materials at a typical
secondary lead smelter. A typical automotive lead-acid battery is made up of lead, sulfuric73
acid electrolyte, plastic separators, and a plastic casing. Older batteries may have a hard rubber
casing instead of plastic. The plastic battery separators and hard rubber casings on older
batteries are the sources of butadiene emissions from secondary lead smelting.
The secondary lead smelting process consists of (1) breaking lead-acid batteries
and separating the lead-bearing materials from the other materials (including plastic and acid
electrolyte); (2) melting lead metal and reducing lead compounds to lead metal in the smelting
furnace (reverberatory, blast, rotary, or electric); and (3) refining and alloying the lead to
customer specifications. 73
The vast majority of butadiene emissions come from the smelting furnace
process. Because of the lower exhaust temperature from the charge column, blast furnaces are
substantially greater sources of organic HAP (including butadiene) and related emissions than
are reverberatory or rotary furnaces. From uncontrolled concentrations of butadiene measured
during testing of a blast furnace outlet, an average emission factor of 1.16 lb/ton, range 0.78 -
1.54 lb/ton (0.48 kg/Mg, range 0.32 - 0.63 kg/Mg) was developed. For the rotary furnace, the73
calculated emission factor was 0.13 lb/ton (0.05 kg/Mg).
On June 23, 1995, EPA promulgated a NESHAP for the secondary lead
production industry. The regulation rquires a reduction of hazardous air pollutant emissions
from blast furnaces which will include butadiene emissions. All the requirements are to be
7-15
implemented by June 1997. Users of this document should review the requirements to
determine what the emission reductions are.
7.2.4 Petroleum Refining
According to 1992 Toxic Release Inventory (TRI) data, petroleum refineries are
the fourth largest emitters of butadiene following the production of organic chemicals, synthetic
rubber, and plastics and resins. However, besides the TRI figure of 437,590 lb/yr74
(397,000 Mg/yr) of butadiene emitted, no other emissions numbers were located. The Petroleum
Refineries NESHAP was promulgated on August 18, 1995. Information Collection Request
(ICR) questionnaires supporting that work reported that butadiene is released from blowdown
vents, catalyst regeneration process vents, and miscellaneous vents at vacuum distillation,
alkylation, and thermal cracking units. However, Clean Air Act Section 114 questionnaires for75
that NESHAP did not require the reporting of butadiene emissions. For equipment leaks, EPA
has prepared average emission rates. These are provided in Appendix D along with a description
of equipment leak estimation methods.
Requirements of this NESHAP and the earlier Benzene NESHAP will reduce
butadiene emissions by an estimated 60 percent, assuming reductions are similar to those for
HAPs and VOCs overall. However, the reader is referred to the regulations to evaluate the exact
impact at a particular facility.
7.2.5 Combustion Sources
Butadiene is produced in the combustion of diverse materials such as gasoline,
diesel oil, wood, and tobacco. Therefore, all combustion processes are potential sources of
butadiene. A brief description of biomass burning, tire burning, and stationary internal
combustion sources and their potential butadiene emissions follow.
7-16
Biomass Burning
Fires are known to produce respirable particulate matter and toxic substances.
Concern has even been voiced regarding the effect of emissions from biomass burning on
climate change. Burning wood, leaves, and vegetation can be a source of butadiene emissions. 76
In this document, the burning of any wood, leaves, and vegetation is categorized as biomass
burning, and includes yard waste burning, land clearing/burning and slash burning, and forest
fires/prescribed burning. 77
Part of the complexity of fires as a source of emissions results from the complex
chemical composition of the fuel source. Different woods and vegetation are composed of
varying amounts of cellulose, lignin, and extractives such as tannins, and other polyphenolics,
oils, fats, resins, waxes, and starches. General fuel type categories in the National Fire-Danger78
Rating (NFDR) System include grasses, brush, timber, and slash (residue that remains on a site
after timber harvesting). The flammability of these fuel types depends upon plant species,78
moisture content, whether the plant is alive at the time of burning, weather, and seasonal
variations.
Pollutants from the combustion of biomass include carbon monoxide (CO),
nitrogen oxides, sulfur oxides, oxidants, polycyclic organic matter, hydrocarbons, and particulate
matter. The large number of combustion products is due, in part, to the diversity of combustion
processes occurring simultaneously within fire--flaming, smoldering, and glowing combustion.
These processes are distinct combustion processes that involve different chemical reactions that
affect when and what pollutants will be emitted during burning. 78
Emission factor models based on field and laboratory data were developed by the
U.S. Forest Service. These models incorporate variables such as fuel type and combustion types
(flaming or smoldering). Because air toxic substances are correlated with the release of other
primary products of incomplete combustion [CO and carbon dioxide (CO )], the models2
correlate butadiene with CO emissions. These emission factor models were used to develop78
emission factors for the biomass burning sub-categories described in the following sections. 77
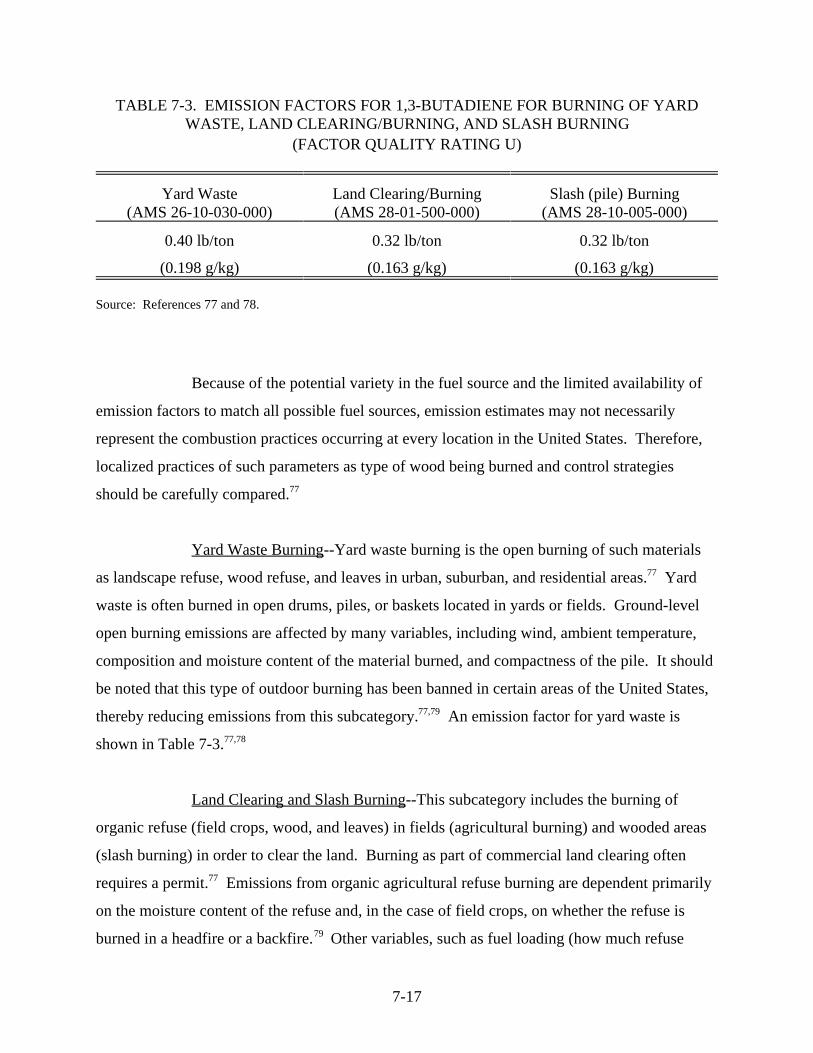
7-17
(FACTOR QUALITY RATING U)
Yard Waste(AMS 26-10-030-000)
Land Clearing/Burning(AMS 28-01-500-000)
Slash (pile) Burning(AMS 28-10-005-000)
0.40 lb/ton 0.32 lb/ton 0.32 lb/ton
(0.198 g/kg) (0.163 g/kg) (0.163 g/kg)
Source: References 77 and 78.
TABLE 7-3. EMISSION FACTORS FOR 1,3-BUTADIENE FOR BURNING OF YARDWASTE, LAND CLEARING/BURNING, AND SLASH BURNING
Because of the potential variety in the fuel source and the limited availability of
emission factors to match all possible fuel sources, emission estimates may not necessarily
represent the combustion practices occurring at every location in the United States. Therefore,
localized practices of such parameters as type of wood being burned and control strategies
should be carefully compared. 77
Yard Waste Burning--Yard waste burning is the open burning of such materials
as landscape refuse, wood refuse, and leaves in urban, suburban, and residential areas. Yard77
waste is often burned in open drums, piles, or baskets located in yards or fields. Ground-level
open burning emissions are affected by many variables, including wind, ambient temperature,
composition and moisture content of the material burned, and compactness of the pile. It should
be noted that this type of outdoor burning has been banned in certain areas of the United States,
thereby reducing emissions from this subcategory. An emission factor for yard waste is77,79
shown in Table 7-3. 77,78
Land Clearing and Slash Burning--This subcategory includes the burning of
organic refuse (field crops, wood, and leaves) in fields (agricultural burning) and wooded areas
(slash burning) in order to clear the land. Burning as part of commercial land clearing often
requires a permit. Emissions from organic agricultural refuse burning are dependent primarily77
on the moisture content of the refuse and, in the case of field crops, on whether the refuse is
burned in a headfire or a backfire. Other variables, such as fuel loading (how much refuse79
7-18
material is burned per unit of land area) and how the refuse is arranged (in piles, rows, or spread
out), are also important in certain instances. Emission factors for land clearing/burning and
slash burning are shown in Table 7-3. 77,78
Forest Fires/Prescribed Burning--A forest fire (or wildfire) is a large-scale natural
combustion process that consumes various ages, sizes, and types of outdoor vegetation. The80
size, intensity, and even occurrence of a forest fire depend on such variables as meteorological
conditions, the species and moisture content of vegetation involved, and the weight of
consumable fuel per acre (fuel loading). 80
Prescribed or broadcast burning is the intentional burning of forest acres as part
of forest management practices to achieve specific wildland management objectives. Controlled
burning can be used to reduce fire hazard, encourage wildlife habitat, control insects, and
enhance the vigor of the ecosystem. Prescribed burning occurs thousands of times annually in78
the United States, and individual fires vary in size from a fraction of an acre to several thousand
acres. Prescribed fire use is often seasonal, which can greatly affect the quantity of emissions
produced. 78
HAP emission factors for forest fires and prescribed burning were developed
using the same basic approach as for yard waste and land clearing burning, with an additional
step to further classify fuel types into woody fuels (branches, logs, stumps, and limbs), live
vegetation, and duff (layers of partially decomposed organic matter). In addition to the fuel77
type, the methodology was altered to account for different phases of burning, namely, flaming
and smoldering. The resulting emission factors are shown in Table 7-4. 77 77,78
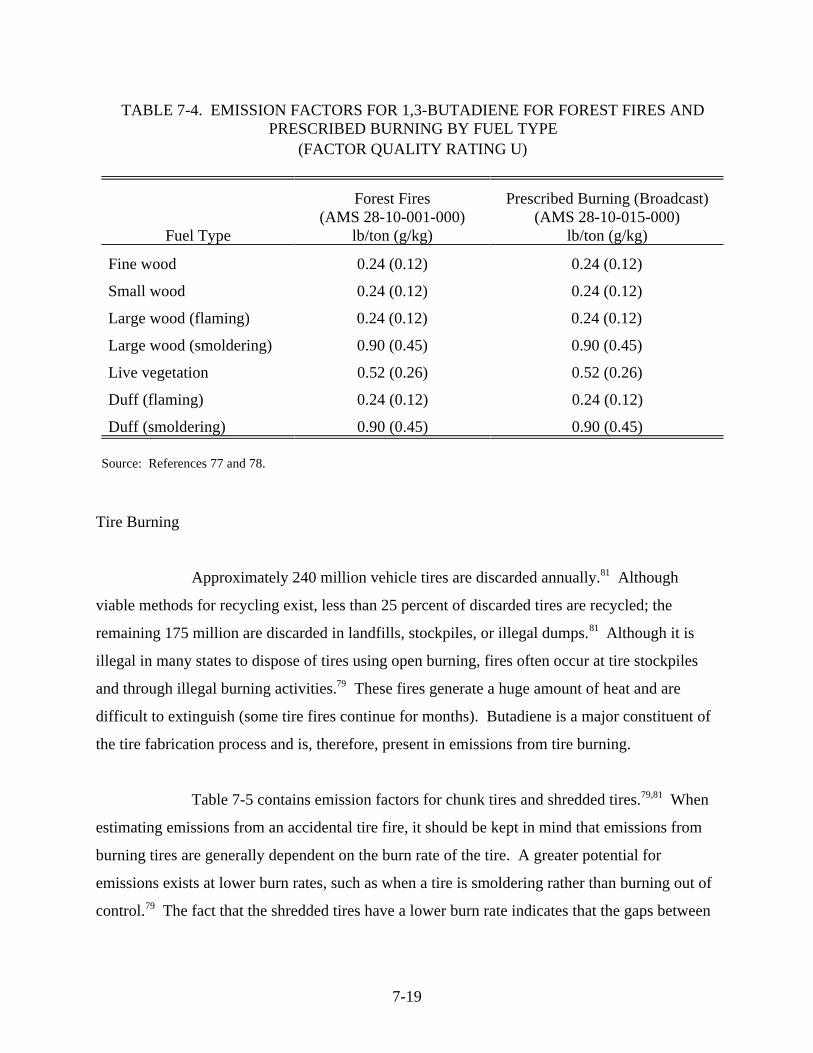
7-19
(FACTOR QUALITY RATING U)
Fuel Type
Forest Fires(AMS 28-10-001-000)
lb/ton (g/kg)
Prescribed Burning (Broadcast)(AMS 28-10-015-000)
lb/ton (g/kg)
Fine wood 0.24 (0.12) 0.24 (0.12)
Small wood 0.24 (0.12) 0.24 (0.12)
Large wood (flaming) 0.24 (0.12) 0.24 (0.12)
Large wood (smoldering) 0.90 (0.45) 0.90 (0.45)
Live vegetation 0.52 (0.26) 0.52 (0.26)
Duff (flaming) 0.24 (0.12) 0.24 (0.12)
Duff (smoldering) 0.90 (0.45) 0.90 (0.45)
Source: References 77 and 78.
TABLE 7-4. EMISSION FACTORS FOR 1,3-BUTADIENE FOR FOREST FIRES ANDPRESCRIBED BURNING BY FUEL TYPE
Tire Burning
Approximately 240 million vehicle tires are discarded annually. Although81
viable methods for recycling exist, less than 25 percent of discarded tires are recycled; the
remaining 175 million are discarded in landfills, stockpiles, or illegal dumps. Although it is81
illegal in many states to dispose of tires using open burning, fires often occur at tire stockpiles
and through illegal burning activities. These fires generate a huge amount of heat and are79
difficult to extinguish (some tire fires continue for months). Butadiene is a major constituent of
the tire fabrication process and is, therefore, present in emissions from tire burning.
Table 7-5 contains emission factors for chunk tires and shredded tires. When79,81
estimating emissions from an accidental tire fire, it should be kept in mind that emissions from
burning tires are generally dependent on the burn rate of the tire. A greater potential for
emissions exists at lower burn rates, such as when a tire is smoldering rather than burning out of
control. The fact that the shredded tires have a lower burn rate indicates that the gaps between79
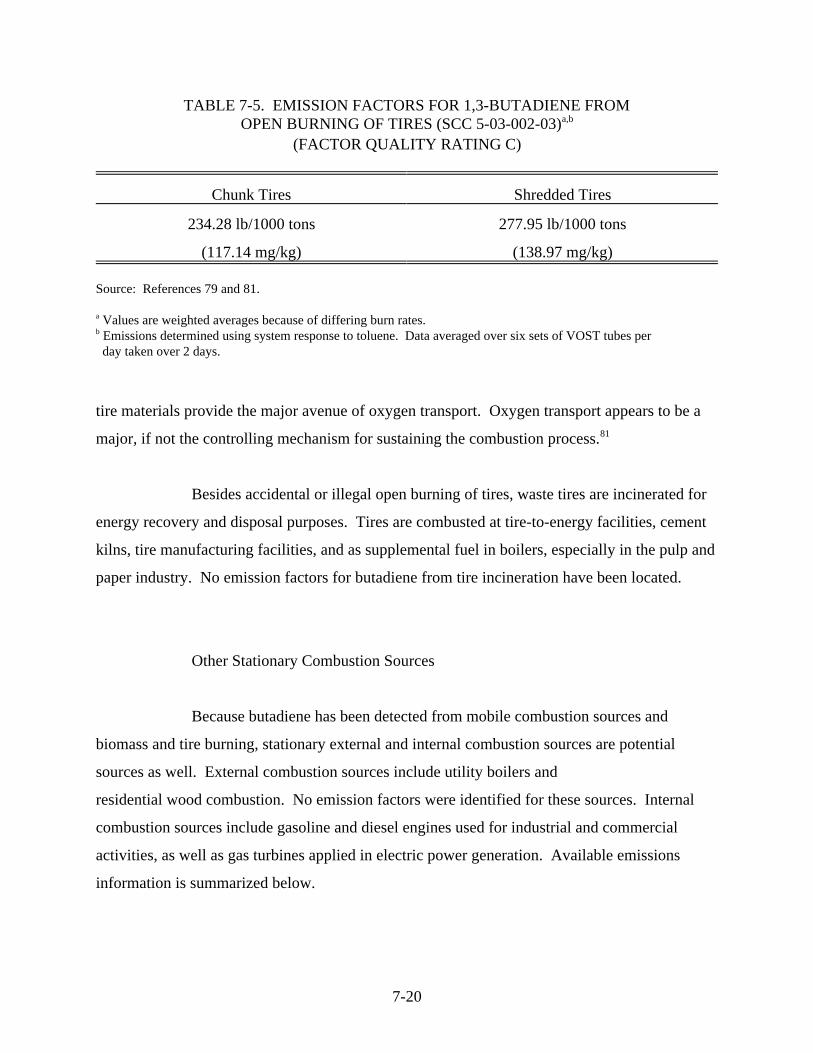
7-20
(FACTOR QUALITY RATING C)
Chunk Tires Shredded Tires
234.28 lb/1000 tons 277.95 lb/1000 tons
(117.14 mg/kg) (138.97 mg/kg)
Source: References 79 and 81.
Values are weighted averages because of differing burn rates.a
Emissions determined using system response to toluene. Data averaged over six sets of VOST tubes perb
day taken over 2 days.
TABLE 7-5. EMISSION FACTORS FOR 1,3-BUTADIENE FROMOPEN BURNING OF TIRES (SCC 5-03-002-03)a,b
tire materials provide the major avenue of oxygen transport. Oxygen transport appears to be a
major, if not the controlling mechanism for sustaining the combustion process. 81
Besides accidental or illegal open burning of tires, waste tires are incinerated for
energy recovery and disposal purposes. Tires are combusted at tire-to-energy facilities, cement
kilns, tire manufacturing facilities, and as supplemental fuel in boilers, especially in the pulp and
paper industry. No emission factors for butadiene from tire incineration have been located.
Other Stationary Combustion Sources
Because butadiene has been detected from mobile combustion sources and
biomass and tire burning, stationary external and internal combustion sources are potential
sources as well. External combustion sources include utility boilers and
residential wood combustion. No emission factors were identified for these sources. Internal
combustion sources include gasoline and diesel engines used for industrial and commercial
activities, as well as gas turbines applied in electric power generation. Available emissions
information is summarized below.
7-21
Gasoline and diesel internal combustion engines are used in aerial lifts, fork lifts,
mobile refrigeration units, generators, pumps, industrial sweepers/scrubbers, and material
handling equipment (such as conveyors). The rated power of these engines covers a substantial
range, up to 250 hp (186 kW) for gasoline engines and up to 600 hp (445 kW) for diesel engines.
These have been included in the off-road sources in Section 6.0. Diesel engines larger than
600 hp (445 kW) are used primarily in oil and gas exploration and production, supplying
mechanical power to operate drilling, mud pumping, and hoisting equipment generators. These
larger diesel engines are frequently used for electrical generation, irrigation, and nuclear power
plant emergency cooling water pump operations. 82
Even though butadiene emissions have been quantified for both gasoline and
diesel mobile combustion engines, butadiene emission factors for stationary internal combustion
engines have only been developed for uncontrolled diesel engines (SCCs 2-02-001-02 and
2-03-001-01, industrial and commercial/institutional reciprocating IC engines, respectively,
fueled with either distillate oil or diesel). The current emission factor provided in the fifth
edition of AP-42 is <0.0000391 lbs/MMBtu of fuel (<0.017 ng/J of fuel). This emission factor
is rated E due to a limited data set (one diesel engine), and/or a lack of documentation of test
results. Such an emission factor may not be suitable for estimating emissions from specific
facilities and should be used with care. 82
Gas turbines greater than 3 MW are primarily used in electrical generation for
continuous, peaking, or standby power. They are also used as gas pipeline pumps, compressor
drivers, and in various process industries. This diversity of uses has lead to the development of a
diversity of engine designs and models using a wide range of fuels, including natural gas,
distillate (No. 2) fuel oil, and in a few cases, residual fuel oil. Although butadiene emissions
from gas turbines are presently being investigated, there are currently no emission factors to
quantify butadiene emissions. 82
7-22
7.3 OTHER BUTADIENE SOURCES
Other potential sources of butadiene emissions have been identified by OAQPS,
which has collected information to assist State and local agencies in their toxic air pollutant
programs. The Crosswalk/Air Toxic Emission Factor (XATEF) database provides a list of83
possible sources for a number of toxic air pollutants. The Standard Industrial Classification
(SIC) Codes identified in the report as possible butadiene sources are shown in Table 7-6.
Data collected by NIOSH during the 1972-1974 National Occupational Health
(NOH) survey identify additional potential emission sources, which are also listed in84,85
Table 7-6. This work was designed specifically to estimate the number of workers (grouped by
SIC Code) potentially exposed to butadiene. In some cases, the "potential exposure"
determination was supported by observing butadiene in use. However, many of these cases were
based on trade name product use; that is, the product used was derived from butadiene or may
otherwise have a potential to contain butadiene. In a 1981-1983 NOH survey, six additional84
industries were identified as posing a potential for worker exposure. These industries are also
included in Table 7-6.
It is important to remember that these data were collected by NIOSH to assess
worker exposure. They do not necessarily translate directly into atmospheric emission sources
because of possible in-plant controls and butadiene removal as a result of its reactivity.
However, the list represents several possible sources that may not otherwise be immediately
identified as having a butadiene emissions potential.
Another reference for butadiene sources was the 1992 Toxic Chemical Release
Inventory Data Base, in which industry reporting of butadiene releases for 1993 were identified74
by SIC Code and are included in Table 7-6.
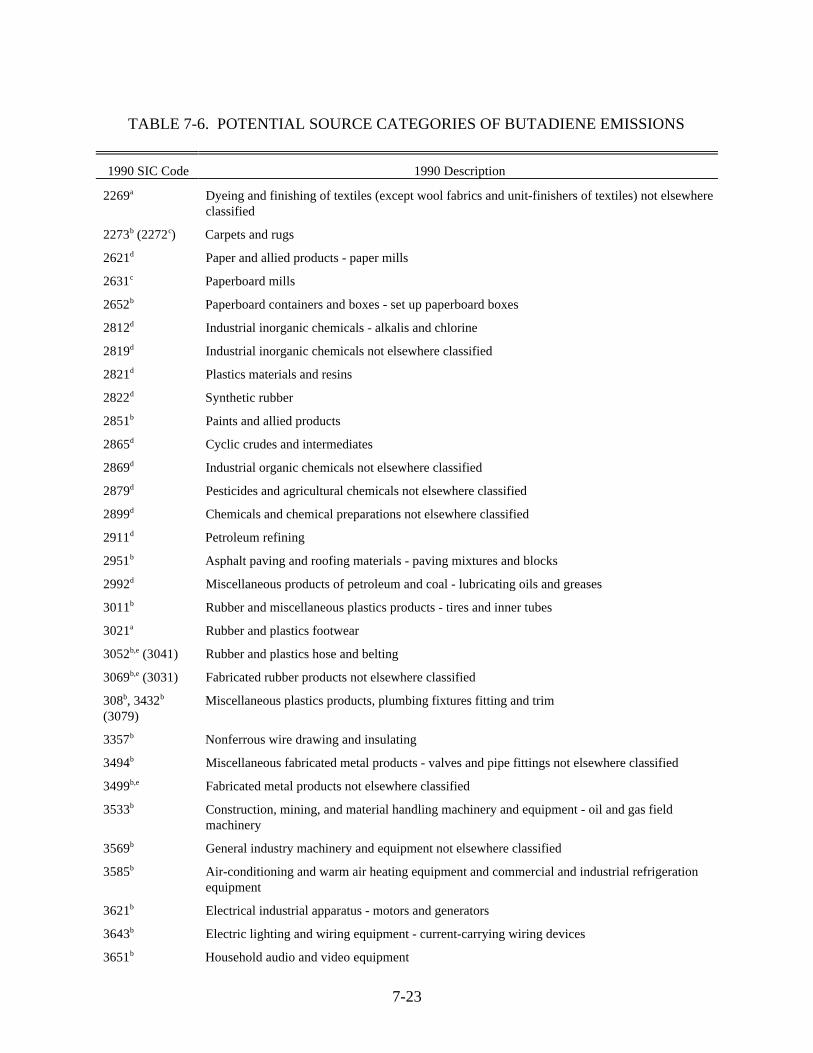
7-23
TABLE 7-6. POTENTIAL SOURCE CATEGORIES OF BUTADIENE EMISSIONS
1990 SIC Code 1990 Description
2269 Dyeing and finishing of textiles (except wool fabrics and unit-finishers of textiles) not elsewherea
classified
2273 (2272 ) Carpets and rugsb c
2621 Paper and allied products - paper millsd
2631 Paperboard millsc
2652 Paperboard containers and boxes - set up paperboard boxesb
2812 Industrial inorganic chemicals - alkalis and chlorined
2819 Industrial inorganic chemicals not elsewhere classifiedd
2821 Plastics materials and resinsd
2822 Synthetic rubberd
2851 Paints and allied productsb
2865 Cyclic crudes and intermediatesd
2869 Industrial organic chemicals not elsewhere classifiedd
2879 Pesticides and agricultural chemicals not elsewhere classifiedd
2899 Chemicals and chemical preparations not elsewhere classifiedd
2911 Petroleum refiningd
2951 Asphalt paving and roofing materials - paving mixtures and blocksb
2992 Miscellaneous products of petroleum and coal - lubricating oils and greasesd
3011 Rubber and miscellaneous plastics products - tires and inner tubesb
3021 Rubber and plastics footweara
3052 (3041) Rubber and plastics hose and beltingb,e
3069 (3031) Fabricated rubber products not elsewhere classifiedb,e
308 , 3432 Miscellaneous plastics products, plumbing fixtures fitting and trimb b
(3079)
3357 Nonferrous wire drawing and insulatingb
3494 Miscellaneous fabricated metal products - valves and pipe fittings not elsewhere classifiedb
3499 Fabricated metal products not elsewhere classifiedb,e
3533 Construction, mining, and material handling machinery and equipment - oil and gas fieldb
machinery
3569 General industry machinery and equipment not elsewhere classifiedb
3585 Air-conditioning and warm air heating equipment and commercial and industrial refrigerationb
equipment
3621 Electrical industrial apparatus - motors and generatorsb
3643 Electric lighting and wiring equipment - current-carrying wiring devicesb
3651 Household audio and video equipmentb
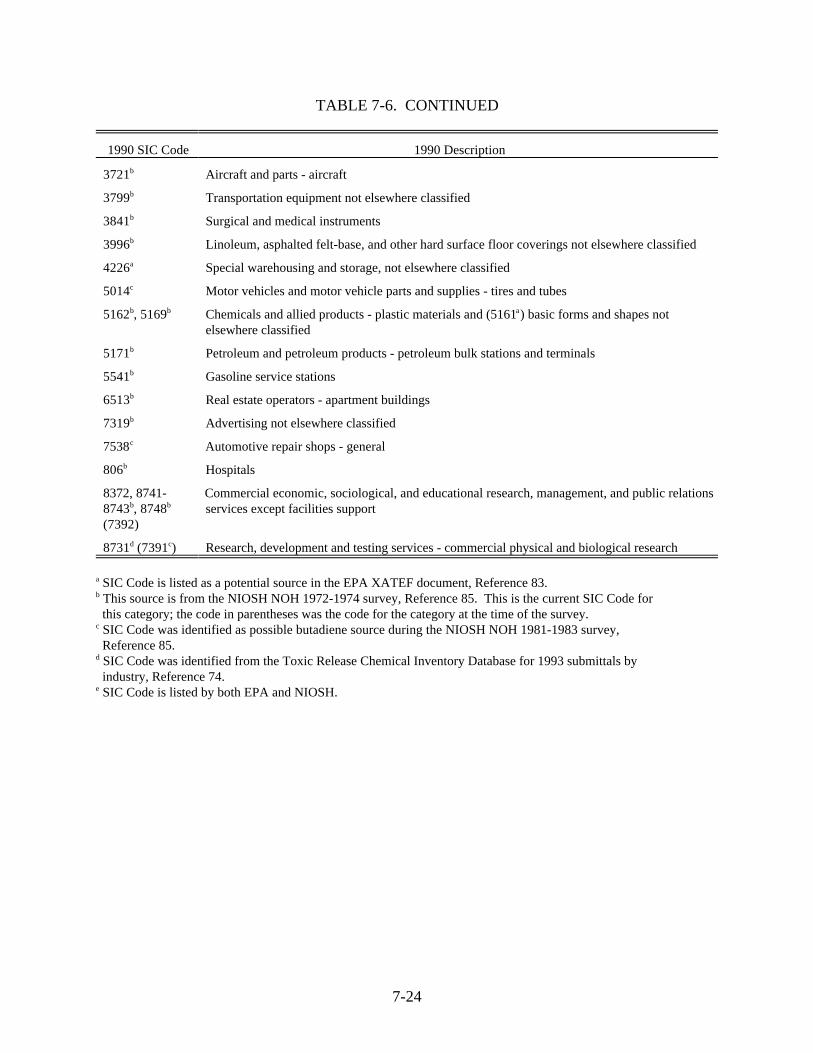
TABLE 7-6. CONTINUED
1990 SIC Code 1990 Description
7-24
3721 Aircraft and parts - aircraftb
3799 Transportation equipment not elsewhere classifiedb
3841 Surgical and medical instruments b
3996 Linoleum, asphalted felt-base, and other hard surface floor coverings not elsewhere classifiedb
4226 Special warehousing and storage, not elsewhere classifieda
5014 Motor vehicles and motor vehicle parts and supplies - tires and tubesc
5162 , 5169 Chemicals and allied products - plastic materials and (5161 ) basic forms and shapes notb b a
elsewhere classified
5171 Petroleum and petroleum products - petroleum bulk stations and terminalsb
5541 Gasoline service stationsb
6513 Real estate operators - apartment buildingsb
7319 Advertising not elsewhere classifiedb
7538 Automotive repair shops - generalc
806 Hospitalsb
8372, 8741- Commercial economic, sociological, and educational research, management, and public relations8743 , 8748 services except facilities supportb b
(7392)
8731 (7391 ) Research, development and testing services - commercial physical and biological researchd c
SIC Code is listed as a potential source in the EPA XATEF document, Reference 83.a
This source is from the NIOSH NOH 1972-1974 survey, Reference 85. This is the current SIC Code forb
this category; the code in parentheses was the code for the category at the time of the survey. SIC Code was identified as possible butadiene source during the NIOSH NOH 1981-1983 survey,c
Reference 85. SIC Code was identified from the Toxic Release Chemical Inventory Database for 1993 submittals byd
industry, Reference 74. SIC Code is listed by both EPA and NIOSH.e
8-1
SECTION 8.0
SOURCE TEST PROCEDURES
1,3-Butadiene emissions can be measured by a number of methods. The
following methods are applicable for measuring emissions from stationary sources, ambient air,
and vehicle exhaust: (1) EPA Reference Method 18; (2) NIOSH Analytical Method 1024;86 87
(3) EPA Exhaust Gas Sampling System, Federal Test Procedure (FTP); and (4) Auto/Oil Air88
Quality Improvement Research Program (AQIRP) speciation methodology. 89
EPA Reference Method 18 applies to the sampling and analysis of approximately
90 percent of the total gaseous organics emitted from an industrial source, whereas NIOSH
Method 1024 applies specifically to the collection and analysis of 1,3-butadiene from ambient
air. The FTP and AQIRP methods measure vehicle exhaust by bag sampling and gas
chromatography/flame ionization detector (GC/FID) analysis. All four methods are described in
the following sections.
8.1 EPA REFERENCE METHOD 18
In Method 18, a sample of the exhaust gas to be analyzed is drawn into a Tedlar®
or aluminized Mylar® bag as shown in Figure 8-1. The Tedlar® bag has been used for some
time in the sampling and analysis of source emissions for pollutants. The cost of the Tedlar®
bag is relatively low, and analysis by GC is easier than with a stainless steel cylinder sampler,
because pressurization is not required to extract the air sample in the gas chromatographic
analysis process. The bag is placed inside a rigid, leakproof container and evacuated. The bag90
is then connected by a Teflon® sampling line to a sampling probe (stainless steel, Pyrex® glass,
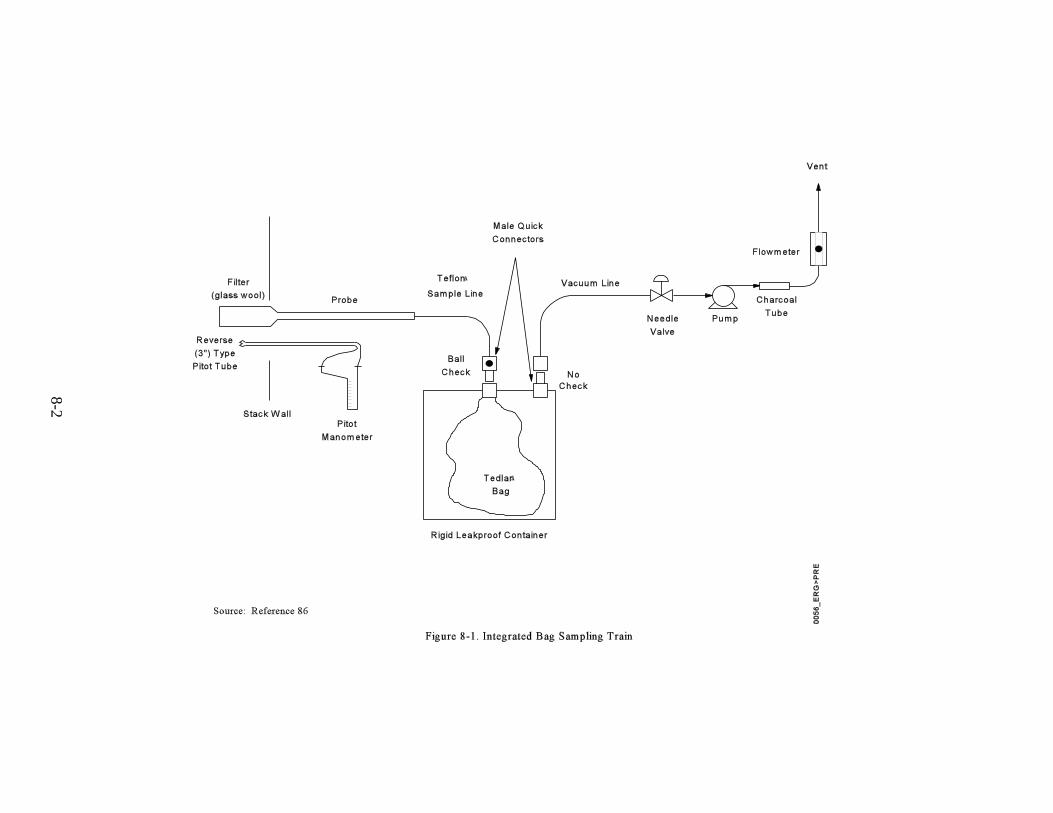
8-2
8-3
or Teflon®) at the center of the stack. The sample is drawn into the bag by pumping air out of
the rigid container.
The sample is then analyzed by GC coupled with FID. Based on field and
laboratory validation studies, the recommended time limit for analysis is within 30 days of
sample collection. One recommended column is the 6-ft (1.82-m) Supelco Porapak QS. 91 92
However, the GC operator should select the column and GC conditions that provide good
resolution and minimum analysis time for 1,3-butadiene. Zero helium or nitrogen should be
used as the carrier gas at a flow rate that optimizes the resolution.
The peak areas corresponding to the retention times of 1,3-butadiene are
measured and compared to peak areas for a set of standard gas mixtures to determine the 1,3-
butadiene concentrations. The detection limit of this method ranges from about 1 ppm to an
upper limit governed by the FID saturation or column overloading. However, the upper limit
can be extended by diluting the stack gases with an inert gas or by using smaller gas sampling
loops.
Recent work by EPA's Atmospheric Research and Exposure Assessment
Laboratory has produced a modified version of Method 18 for stationary source sampling. 90,93
One difference is in the sampling rate, which is reduced to allow collection of more manageable
gas volumes. By reducing the gas volumes, smaller Tedlar® bags (5 to 7L) can be used instead
of the traditional 25-L or larger bags, which are not very practical in the field, especially when a
large number of samples is required. A second difference is the introduction of a filtering90
medium to remove entrained liquids, which improves the butadiene quantitation precision.
Two other changes involve the analytical procedure. The first uses picric acid in
a second column (2 m x 1/8" stainless steel column, 0.19 percent picric acid on 80/100 mesh
Carbopak C) to minimize the interference by butane and butene isomers that are also present in
the stream. The second uses a backflush-to-vent configuration to remove any high-boiling
compounds that have been collected before they reach the picric acid column. These
8-4
modifications allow more accurate quantitation of butadiene to be performed in a shorter time
period than with Method 18.
8.2 NIOSH METHOD 1024
NIOSH Method 1024 is appropriate for measuring ambient emissions of
1,3-butadiene in the workplace. In this NIOSH method, samples are collected with adsorbent
tubes containing charcoal that has been washed and coated with 10 percent by weight 4-tert-
butylcatechol (TBC-charcoal), a chemical known to inhibit the polymerization of 1,3-butadiene.
Three-liter air samples should be collected with the use of a personal sampling pump at a flow
rate of 0.05 L/min. 87,94
Samples are desorbed with carbon disulfide and analyzed by GC equipped with
an FID and a column capable of resolving 1,3-butadiene from the solvent front and other
interferences. The column specified in NIOSH Method 1024 is a 50-m x 32-mm internal
diameter, fused-silica, porous-layer, open-tubular column coated with aluminum oxide and
potassium chloride (Al O /KCl). Degradation of compound separation may be eliminated by2 387
using a back flushable precolumn [e.g., 10-m x 0.5-mm interior diameter fused-silica (CP
Wax 57 CB)]. The precolumn allows light hydrocarbons to pass through, but water, methylene
chloride, and polar or high-boiling components are retained and can be backflushed. 87,93
The amount of 1,3-butadiene in a sample is obtained from the calibration curve in
units of micrograms per sample. Collected samples are sufficiently stable to permit 6 days of
ambient sample storage before analysis. If samples are refrigerated, they are stable for 18 days.
Butadiene can dimerize during handling and storage. The rate of dimerization is a function of
temperature, increasing with increasing temperature. Consequently, samples should be stored at
low temperatures.
This procedure is applicable for monitoring 1,3-butadiene air concentrations
ranging from 0.16 ppm to 36 ppm, and is more sensitive and selective than the previously-used
8-5
NIOSH Method S-91. The GC column and operating conditions should provide good95
resolution and minimum analysis time.
8.3 FEDERAL TEST PROCEDURE
The most widely-used test procedure for sampling emissions from vehicle exhaust
is the FTP, which was initially developed in 1974. The FTP uses the Urban Dynamometer88,96,97
Driving Schedule (UDDS), which is 1,372 seconds in duration. An automobile is placed on a
chassis dynamometer where it is run according to the following schedule: 505 seconds of a
cold-start; 867 seconds of hot transient; and 505 seconds of a hot-start. (The definitions of the
above terms can be found in the FTP description in the 40 CFR, Section 86). The vehicle88
exhaust is collected in Tedlar® bags during the three testing stages. It should be noted that, in
most cases, the majority of 1,3-butadiene is generated in bag one, the first 505-second segment
of the cold-start UDDS cycle. 98
The most widely used method for transporting the vehicle exhaust from the
vehicle to the bags is a dilution tube sampling arrangement identical to the system used for
measuring criteria pollutants from mobile sources. Dilution techniques are used for sampling88,98
auto exhaust because in theory, dilution helps simulate the conditions under which exhaust gases
condense and react in the atmosphere. Figure 8-2 shows a diagram of a vehicle exhaust
sampling system. Vehicle exhausts are introduced at an orifice where the gases are cooled and99
mixed with a supply of filtered dilution air. The diluted exhaust stream flows at a measured
velocity through the dilution tube and is sampled isokinetically.
The major advantage in using a dilution tube approach is that exhaust gases are
allowed to react and condense onto particle surfaces prior to sample collection, providing a truer
composition of exhaust emissions as they occur in the atmosphere. Another advantage is that the
dilution tube configuration allows simultaneous monitoring of hydrocarbons, carbon monoxide,
carbon dioxide, and nitrogen oxides. Back-up sampling techniques, such as filtration/adsorption,
are generally recommended for collection of both particulate- and gas-phase emissions. 97
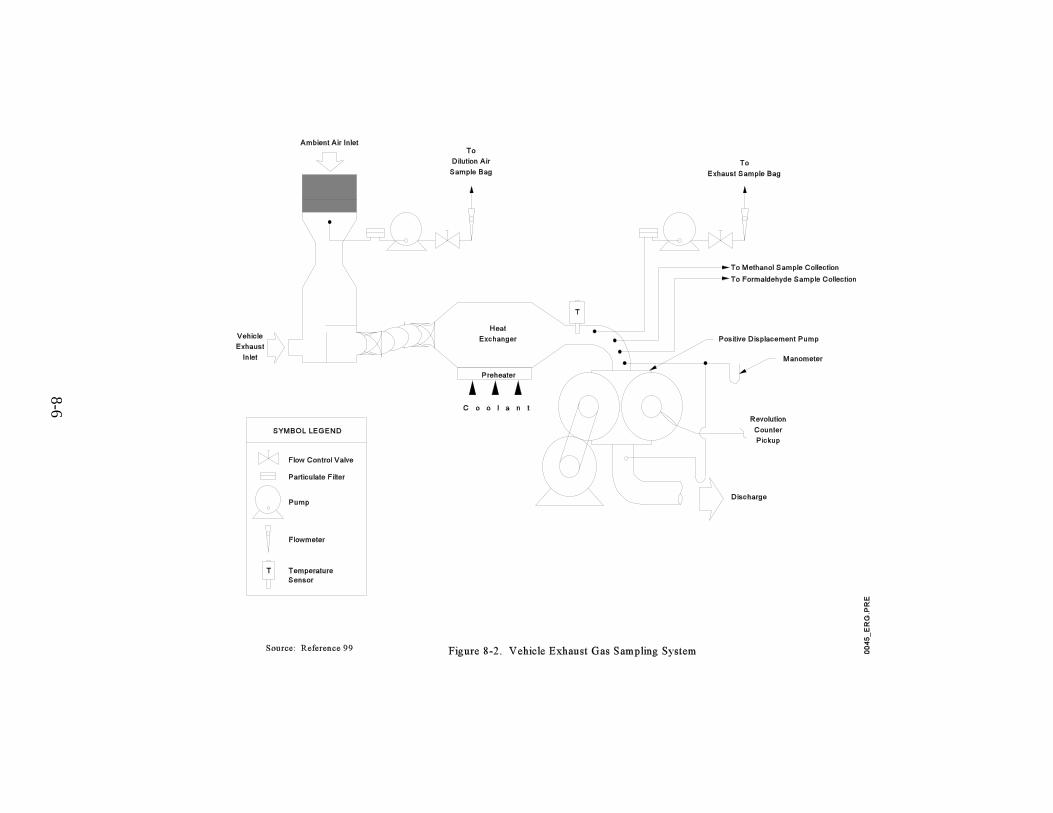
8-6
8-7
8.4AUTO/OIL AIR QUALITY IMPROVEMENT RESEARCH PROGRAM SPECIATIONMETHOD
Although there is no EPA-recommended analytical method for measuring
1,3-butadiene from vehicle exhaust, the AQIRP method for the speciation of hydrocarbons and
oxygenates is widely used. This analytical method calls for a dual column GC with FID. A89,97
pre-column, 15-m x 0.53-mm interior diameter, 1 µm film, such as the DB-WAX (J & W
Scientific Co, Folsom, CA), is recommended to retain water and alcohols while allowing the
lower molecular weight hydrocarbons to pass rapidly through to the analytical column. A89
backflush valve can be activated to prevent the polar species and higher hydrocarbons from
entering the analytical column, and to backflush these species from the pre-column. The
recommended analytical column is a 50-m x 0.53-mm interior diameter, 10 µm film, porous
layer open tubular (PLOT) column of alumina deactivated by potassium chloride. 89
The peak areas corresponding to the retention times of 1,3-butadiene are
measured and compared to peak areas for a set of standard gas mixtures to determine the
1,3-butadiene concentrations. The detection limit for this method is on the order of 0.03 ppmC
in dilute exhaust for 1,3-butadiene (0.5 mg/mile for the FTP). 98
It should be noted that sample instability has been shown to be a problem for
1,3-butadiene in exhaust mixtures. Therefore, to minimize concerns about sample integrity,
exhaust emissions should be analyzed promptly (within 1 hour of collection).98,100

9-1
1. U.S. EPA. Protocol for Equipment Leak Emission Estimates. EPA-453/R-95-017. Research Triangle Park, North Carolina: U.S. Environmental Protection Agency, Office ofAir Quality Planning and Standards, 1995.
2. Federal Register, 52 FR 21152, June 4, 1987.
3. U.S. EPA. Technical Procedures for Developing AP-42 Emission Factors and PreparingAP-42 Sections. EPA-454/B-93-050. Research Triangle Park, North Carolina: U.S. Environmental Protection Agency, Office of Air Quality Planning and Standards,October 1993.
4. Factor Information Retrieval System Version 2.62 (FIRE 2.62). Research Triangle Park,North Carolina: U.S. Environmental Protection Agency, Office of Air Quality Planningand Standards, March 1994.
5. Kirshenbaum, I. Butadiene. In: Kirk-Othmer Encyclopedia of Chemical Technology,3rd ed, Volume 4. New York, New York: John Wiley and Sons, 1978.
6. Hawley, G.G. 1,3-Butadiene. In: The Condensed Chemical Dictionary, 10th ed., NewYork, New York: Van Nostrand Reinhold Company, Inc., 1981. p. 177.
7. Sittig, M. 1,3-Butadiene. In: Handbook of Toxic and Hazardous Chemicals andCarcinogens, 2nd ed., Park Ridge, New Jersey: Noyes Publications, 1985. pp. 153 to 154.
8. Chemical Profile: Butadiene. Chemical Marketing Reporter. 245(15):53, April 1994.
9. U.S. EPA. Atmospheric Persistence of Eight Air Toxics. EPA-600/3-87-004. ResearchTriangle Park, North Carolina: U.S. Environmental Protection Agency, AtmosphericSciences and Research Lab, January 1987. pp. 42 to 44.
10. Butadiene. In: Chemical Products Synopsis. Asbury Park, New Jersey: MannsvilleChemical Products Corp, September 1993.
11. Chemical Profile: SB Rubber. Chemical Marketing Reporter. 245(22):45, May 1994.
12. Chemical Profile: Polybutadiene. Chemical Marketing Reporter. 245(19):45, May 1994.
SECTION 9.0
REFERENCES
9-2
13. Chemical Profile: Neoprene. Chemical Marketing Reporter. 233(19):37, May 1988.
14. Chemical Profile: ABS Resins. Chemical Marketing Reporter. 239(16):41, April 1991.
15. Chemical Profile: Nitrile Rubber. Chemical Marketing Reporter. 239(20):33,50,May 1991.
16. Buchanan, S.K. (Radian Corporation) and B. Theismann (International Institute ofSynthetic Rubber Producers). Telephone conversation. September 19, 1994.
17. U.S. EPA. Motor Vehicle-Related Air Toxics Study. Section 7.0: 1,3-Butadiene. EPA-420/R-93-005. Ann Arbor, Michigan: U.S. Environmental Protection Agency,Office of Mobile Sources, 1993. pp. 7-1 to 7-7.
18. U.S. Department of Transportation. Highway Statistics. Washington, D.C.: U.S. Department of Transportation, Federal Highway Administration, 1993. p. 208.
19. Kuhn, K.Q. and R.A. Wassel (Radian Corporation). Memorandum to the ButadieneSource Category Concurrence File concerning "Estimates of 1,3-Butadiene Emissions fromProduction Facilities and Emissions Reductions Achievable with Additional Controls,"March 25, 1986.
20. Haddeland, G.E. Butadiene. Process Economics Program, Report No. 35. MenloPark, California: Stanford Research Institute, 1968. Cited in reference 19, p. 9.
21. Standifer, R.L. Report 7: Butadiene. In: Organic Chemical Manufacturing: SelectedProcesses, Volume 10. EPA-450/3-80-028. Research Triangle Park, North Carolina: U.S. Environmental Protection Agency, 1980. Cited in reference 19, p. 15.
22. U.S. EPA. Evaluation of PCB Destruction Efficiency in an Industrial Boiler. EPA-600/2-81-055a. Research Triangle Park, North Carolina: U.S. EnvironmentalProtection Agency, Industrial Environmental Research Laboratory, 1981. Cited inreference 19, p. 18.
23. U.S. EPA. Efficiency of Industrial Flares: Test Results. EPA-600/2-84-095. ResearchTriangle Park, North Carolina: U.S. Environmental Protection Agency, Office of Researchand Development, Industrial Research Laboratory, May, 1984. p. 5-7.
24. U.S. EPA. Control Technologies for Hazardous Air Pollutants. EPA/625/6-91/014. Washington, D.C.: U.S. Environmental Protection Agency, Office of Research andDevelopment, 1991. pp. 3-1 to 3-3, 3-23.
25. Randall, J. L., et al. (Radian Corporation, Research Triangle Park, North Carolina). "Fugitive Emissions from the 1,3-Butadiene Production Industry: A Field Study, FinalReport." Prepared for the 1,3-Butadiene Panel of the Chemical Manufacturers Association,1989. pp. 5-30, 35, 41, 47, 53, 58, 63, 68.
26. U.S. EPA. Protocol for Generating Unit-Specific Emission Estimates for Equipment Leaksof VOC and VHAP. EPA-450/3-88-010. Research Triangle Park, North Carolina:
9-3
U.S. Environmental Protection Agency, Office of Air Quality Planning and Standards,October 1988.
27. Wassel R.A. and K.Q. Kuhn (Radian Corporation). Memorandum to the Butadiene SourceCategory Concurrence File concerning "Estimates of 1,3-Butadiene Emissions fromStyrene-Butadiene Copolymer Facilities and Emissions Reductions Achievable withAdditional Controls," April 8, 1986.
28. Shreve's Chemical Process Industries. New York, New York: McGraw-Hill, 1984. p. 701.
29. SRI International. 1993 Directory of Chemical Producers - USA. Menlo Park, California: SRI International, 1993.
30. Chemical Profile: Polybutadiene. Chemical Marketing Reporter. 239(15):42, April 1991.
31. Epner, E.P. (Radian Corporation). Memorandum to the Butadiene Source CategoryConcurrence File concerning "Estimate of 1,3-Butadiene from Polybutadiene Facilities andEmissions Reductions Achievable with Additional Controls," March 27, 1986.
32. Epner, E.P. (Radian Corporation). Memorandum to the Butadiene Source CategoryConcurrence File concerning "Estimates for Short-Term Emissions of 1,3-Butadiene fromPolybutadiene Production Facilities," May 5, 1986.
33. Mark, H.F., et al., eds. Kirk-Othmer Concise Encyclopedia of Chemical Technology. NewYork, New York: John Wiley and Sons, Inc., 1985. p. 789.
34. Stallings, J.M. (E.I. DuPont). Written communication to J.R. Farmer (U.S. EnvironmentalProtection Agency), July 27, 1984.
35. Kuhn, K.Q. and R.C. Burt (Radian Corporation). Memorandum to the Butadiene SourceCategory Concurrence File concerning "Estimates of 1,3-Butadiene Emissions fromMiscellaneous Sources and Emissions Reductions Achievable with Candidate NESHAPControls," December 12, 1986.
36. Johnson, P.R. Neoprene. In: Encyclopedia of Chemical Technology, 3rd ed. Volume 8. R.E. Kirk, et al., eds. New York, New York: John Wiley and Sons, 1979. p. 521.
37. Epner, E.P. (Radian Corporation). Memorandum to the Butadiene Source CategoryConcurrence File concerning "Estimates of Short-Term Emissions of 1,3-Butadiene fromNeoprene/Chloroprene Production Facilities," April 7, 1986.
38. Johnson, P.R. Chloroprene. In: Encyclopedia of Chemical Technology, 3rd ed. Volume 5. R.E. Kirk, et al., eds. New York, New York: John Wiley and Sons, 1979. pp. 773-785.
39. Epner, E.P. (Radian Corporation). Memorandum to L.B. Evans (U.S. EnvironmentalProtection Agency, Chemicals and Petroleum Branch) concerning "Estimates of1,3-Butadiene Emissions from Neoprene Facilities and Emissions Reductions Achievable
9-4
with Additional Controls," December 23, 1985.
40. Burt, R. and R. Howle (Radian Corporation). Memorandum to L.B. Evans(U.S. Environmental Protection Agency, Chemicals and Petroleum Branch) concerning"Estimates of Acrylonitrile, Butadiene, and other VOC Emissions and Controls for ABSand NBR Facilities," January 29, 1986.
41. Energy and Environmental Analysis, Inc. Source Category Survey for the AcrylonitrileIndustry - Draft Report. ABS/SAN Operations: Emissions and Control Data. Prepared forU.S. Environmental Protection Agency, 1981. Cited in reference 40.
42. Robinson, H.W. Nitrile Rubber. In: Encyclopedia of Chemical Technology, 3rd ed. Volume 8. R.E. Kirk, et al., eds. New York, New York: John Wiley and Sons, 1979. p. 534.
43. Niles, R.C. (Uniroyal Chemical Company). Written communication to J.R. Farmer (U.S.Environmental Protection Agency). September 4, 1984.
44. Cook, R. (U.S. Environmental Protection Agency, Ann Arbor, Michigan). Writtencommunication to J. Mangino (Radian Corporation, Research Triangle Park, NorthCarolina). July 22, 1992.
45. Auto/Oil Air Quality Improvement Research Program. Technical Bulletin No. 7: Emissions and Air Quality Modeling Results from Methanol/Gasoline Blends in PrototypeFlexible/Variable Fuel Vehicles. 1992.
46. U.S. EPA. Analysis of Economic and Environmental Effects of Methanol as an AutomotiveFuel. Special Report. Ann Arbor, Michigan: U.S. Environmental Protection Agency,Office of Mobile Sources, September 1989.
47. U.S. EPA. Analysis of Economic and Environmental Effects of Ethanol as an AutomotiveFuel. Special Report. Ann Arbor, Michigan: U.S. Environmental Protection Agency,Office of Mobile Sources, April 1990.
48. California Air Resources Board. Definition of a Low-Emission Motor Vehicle inCompliance with the Mandates of Health and Safety Code Section 39037.05. AssemblyBill 234, Leonard, 1987. El Monte, California: California Air Resources Board, MobileSource Division, 1989.
49. California Air Resources Board. Proposed Reactivity Adjustment Factors for TransitionalLow-Emission Vehicles: Technical Support Document, Updated Version. El Monte,California: California Air Resources Board, Mobile Source Division, November 13, 1991.
50. U.S. EPA. Non-Road Engine and Vehicle Emission Study. 21A-2001. Washington, D.C.: U.S. Environmental Protection Agency, Office of Air and Radiation, 1991. pp. 13, 14, 27,28, 31, 32, 35, 36, 39, 40, I38.
9-5
51. Ingalls, M.N. Non-road Emission Factors of Air Toxics. Interim Report No. 2. SWRI 08-3426-005. Ann Arbor, Michigan: U.S. Environmental Protection Agency, June 1991. p. 23.
52. Booz-Allen and Hamilton. Commercial Marine Vessel Contribution to EmissionInventories. Final Report. Ann Arbor, Michigan: U.S. Environmental Protection Agency,Motor Vehicle Emission Laboratory, October 7, 1991. Sections 1.0 and 2.0.
53. U.S. EPA. Mobile Sources Procedures for Emission Inventory Preparation, Volume IV: Mobile Sources. Section 6.0 - Emissions for Locomotives. EPA-450/4-81-026d(Revised). Ann Arbor, Michigan: U.S. Environmental Protection Agency, Office ofMobile Sources, 1992.
54. U.S. EPA. Motor Vehicle-Related Air Toxic Study. EPA-420/R-93-005. Ann Arbor,Michigan: U.S. Environmental Protection Agency, Office of Mobile Sources, April 1993.
55. U.S. Department of Transportation. Census of U.S. Civil Aircraft. Washington, D.C.: U.S. Department of Transportation, Federal Aviation Administration, Office ofManagement Systems, 1989.
56. U.S. EPA. Toxic Emissions from Aircraft Engines. EPA-453/R-93-028. ResearchTriangle Park, North Carolina: U.S. Environmental Protection Agency, Office of AirQuality Planning and Standards, July 1993. pp. 1-6.
57. U.S. Department of Transportation. Federal Aviation Engine Emission Database. Washington, D.C.: U.S. Department of Transportation, Office of Environment andEnergy, Federal Aviation Administration, 1991.
58. U.S. EPA. Volatile Organic Compound/Particulate Matter Speciation Data System(SPECIATE). Version 1.5. Research Triangle Park, North Carolina: U.S. EnvironmentalProtection Agency, Office of Air Quality Planning and Standards, October 1992.
59. Vigyan Inc. Estimation and Evaluation of Cancer Risks Attributed to Air Pollution inSouthwest Chicago. U.S. Environmental Protection Agency, Air and Radiation Division,April 1993.
60. U.S. EPA. Mobile Sources Procedures for Emission Inventory Preparation, Volume IV: Mobile Sources. Section 5.0 - Emissions from Aircraft. EPA-450/4-81-026d (Revised). Ann Arbor, Michigan: U.S. Environmental Protection Agency, Office of Mobile Sources,1992.
61. U.S. Department of Transportation. Federal Aviation Administration Air Traffic Activity,Fiscal Year 1993. Washington, D.C.: Federal Aviation Administration, Office of AviationPolicy Plans and Management Analysis, 1994.
62. California Air Resources Board. Air Sampling for Chemical Analysis from Rocket EngineTest Firing Plumes. Final Report. Confidential Report No. ERC-57. June 1992.
9-6
63. U.S. Department of Health and Human Services. Industrial Hygiene Walk-through SurveyReport of Denka Chemical Corporation, Houston, Texas. (July 30, 1985, Survey). DHHS(NIOSH) Publication No. 1W/147.27 (PB86-225406). Cincinnati, Ohio: NationalInstitute for Occupational Safety and Health, 1986.
64. U.S. Department of Health and Human Services. Industrial Hygiene Walk-through SurveyReport of Calhio Chemicals, Inc., Perry, Ohio, subsidiary of Stauffer Chemical Company,Perry, Ohio. (August 14, 1985, Survey). DHHS (NIOSH) Publication No. 1W/147.24(PB86-224458). Cincinnati, Ohio: National Institute for Occupational Safety and Health,1986.
65. S.K. Buchanan (Radian Corporation) with E. Urig, (July 25, 1988) and T. Lewis, (July 26,1988), B. F. Goodrich. Telephone communications.
66. Benjamin, B.K. and R.W. Novak. Graft Copolymerization. In: Encyclopedia of ChemicalTechnology, 3rd ed. Volume 15. New York, New York: John Wiley and Sons, 1978. pp. 389-390.
67. U.S. Department of Health and Human Services. Industrial Hygiene Walk-through SurveyReport of E. I. DuPont de Nemours Company, Beaumont Works Facility, Beaumont, Texas. (August 28, 1985, Survey). DHHS (NIOSH) Publication No. 1W/147.33 (PB86-225380). Cincinnati, Ohio: National Institute for Occupational Safety and Health, 1986.
68. Kirschenbaum, I. Diels-Alder Reactions. In: Encyclopedia of Chemical Technology,3rd ed. Volume 4. R.E. Kirk, et al., eds. New York, New York: John Wiley and Sons,1978. pp. 315-316.
69. U.S. Department of Health and Human Services. Industrial Hygiene Survey Report ofPhillips Chemical Company, Philtex Plant, Borger, Texas. (August 7, 1985, Survey). DHHS (NIOSH) Publication No. 1W/147.23 (PB86-222395). Cincinnati, Ohio: NationalInstitute for Occupational Safety and Health, 1986.
70. Bisio, A.L. and B.R. Tegge. Ethanol - Propylene Elastomers In: Encyclopedia ofChemical Processing and Design. Volume 20. J.J. McKetta and W.A. Cunningham, eds. New York, New York: Marcel Dekker, Inc., 1984. pp. 343-345.
71. Khan, Z.S., and T.W. Hughes (Monsanto Research Corporation). Source Assessment: Polyvinyl Chloride. EPA-600/2-78-004i. Cincinnati, Ohio: U.S. EnvironmentalProtection Agency, 1978. p. 14.
72. White, T.S. (Radian Corporation). Volatile Organic Compound Emissions from RubberProcessing Facilities at Downstream POTW, Final Report. EPA Contract No. 68-02-4398. Research Triangle Park, North Carolina: U.S. Environmental Protection Agency, 1987.
73. U.S. EPA. Final Background Information Document for Secondary Lead NESHAP. EPA-450/R-94-024a. Research Triangle Park, North Carolina: U.S. Environmental ProtectionAgency, Office of Air Quality Planning and Standards, June 1994.
9-7
74. U.S. EPA. 1992 Toxic Chemical Release Inventory (SARA 313) Database. Washington,D.C.: U.S. Environmental Protection Agency, Office of Toxic Substances, 1993.
75. Zarate, M. (Radian Corporation). Memorandum to James Durham (U.S. EnvironmentalProtection Agency) concerning "Process Vent Information Collection Request Data QualityAnalysis," August 25, 1993.
76. Ward, D.E., and W.M. Hao. Air Toxic Emissions from Burning of Biomass Globally -Preliminary Estimates. Presented at the 85th Annual Meeting and Exhibition of the Airand Waste Management Association, June 1992. pp. 2-13.
77. Campbell, D.L. and J. Mangino (Radian Corporation). Evaluation and Improvement of thePuget Sound Toxic Air Contaminants Emissions Inventory. Technical Note. EPAContract No. 68-D1-0031. Washington D.C.: U.S. Environmental Protection Agency,Office of Research and Development, May 1994.
78. Peterson, J. and D. Ward. An Inventory of Particulate Matter and Air Toxic Emissionsfrom Prescribed Fires in the United States for 1989. U.S. Department of Agriculture,Forest Service, 1989. pp. 1-16.
79. U.S. EPA. Compilation of Air Pollutant Emission Factors, 5th ed. (AP-42), Vol I:Stationary Point and Area Sources. Section 2.4. Research Triangle Park, North Carolina: U.S. Environmental Protection Agency, Office of Air Quality Planning and Standards,October 1992.
80. AP-42, 5th ed., op. cit., note 79. Section 11.1, 1995.
81. Lemieux, P.M., and D.M. DeMarini. Mutagenicity of Emissions from the Simulated OpenBurning of Scrap Rubber Tires. EPA-600/R-92-127. Washington, D.C.: U.S. Environmental Protection Agency, July 1992.
82. AP-42, 5th ed., op. cit., note 79. Section 3.3, 1995.
83. U.S. EPA. Crosswalk/Air Toxic Emission Factor (XATEF) Database. Research TrianglePark, North Carolina: U.S. Environmental Protection Agency, Office of Air QualityPlanning and Standards, 1987.
84. Buchanan, S.K. (Radian Corporation) and J. Seta (NIOSH Hazard Section, Cincinnati,Ohio). Telephone communication, July 26, 1988.
85. "National Occupational Hazard Surveys, extracted data from 1972-1974 and 1981-1983,"printouts received by S.K. Buchanan, Radian Corporation, from J. Seta, NIOSH HazardSection, Cincinnati, Ohio. July 1987.
86. Federal Register. 48 FR 48344-46361, October 18, 1983.
87. U.S. Department of Health, Education, and Welfare. NIOSH Manual of AnalyticalMethods, 3rd ed. Volume 1. Cincinnati, Ohio: National Institute for Occupational Safetyand Health, 1984. pp. 1024-1 to 1024-9.
9-8
88. U.S. Code of Federal Regulations, Title 40, Protection of the Environment, Part 86,Subpart B, Emission Regulations for 1977 and Later Model Year New Light-DutyVehicles and New Light-Duty Trucks; Test Procedures. Washington, D.C.: U.S. Government Printing Office, 1993.
89. Siegl, W.D., et al. Improved Emissions Speciation Methodology for Phase II of theAuto/Oil Air Quality Improvement Research Program - Hydrocarbons and Oxygenates. Presented at the International Congress and Exposition, Detroit, Michigan. SAE TechnicalPaper Series. Warrendale, Pennsylvania: SAE, March 1993. pp. 63-98.
90. Pau, J.C., J.E. Knoll and M.R. Midgett. A Tedlar® Bag Sampling System for ToxicOrganic Compounds in Source Emission Sampling and Analysis. Journal of Air andWaste Management Association. 41(8):1095-1097, August 1991.
91. Moody, T.K. (Radian Corporation) and J. Pau (U.S. Environmental Protection Agency,Emissions Monitoring Systems Laboratory). Written communication, June 6, 1988.
92. Acurex Corporation. Acurex Interim Report: Development of Methods for Sampling1,3-Butadiene. 1987. pp. 4-1 through 4-18.
93. Entropy Environmentalists, Inc. Sampling and Analysis of Butadiene at a SyntheticRubber Plant. EPA Contract No. 68-02-4442. U.S. Environmental Protection Agency,Atmospheric Research and Exposure Assessment Laboratory, Quality Assurance Division,1988. pp. 3-5.
94. Hendricks, W.D., and G.R. Schultz. A Sampling and Analytical Method for MonitoringLow ppm Air Concentrations of 1,3-Butadiene. Appl. Ind. Hyg., 1(4):186-190, 1986.
95. Fajen, J.M., D.R. Roberts, L.J. Ungers, and E.R. Krishnan. Occupational Exposure ofWorkers to 1,3-Butadiene. Environmental Health Perspectives. 86:11-18, 1990.
96. Blackley, C. (Radian Corporation) and R. Zweidinger (U.S. Environmental ProtectionAgency). Telephone communication, May 10, 1994.
97. Blackley, C. (Radian Corporation) and P. Gabele (U.S. Environmental Protection Agency). Telephone communication, May 10, 1994.
98. U.S. EPA. Butadiene Measurement Technology. EPA 460/3-88-005. Ann Arbor,Michigan: U.S. Environmental Protection Agency, Office of Mobile Source Air PollutionControl, 1988. pp. 1-23, A1-15, B1-5, C1-3.
99. Lee, F.S., and D. Schuetzle. Sampling, Extraction, and Analysis of Polycyclic AromaticHydrocarbons from Internal Combustion Engines. In: Handbook of Polycyclic AromaticHydrocarbons, A. Bjorseth, ed. New York, New York: Marcel Dekker, Inc., 1985. p. 30.
100. Hoekman, S.K. Improved Gas Chromatography Procedure for Speciated HydrocarbonMeasurements of Vehicle Emissions. Journal of Chromatography, 639:239-253, 1993.
APPENDIX A
EMISSION FACTOR SUMMARY TABLE
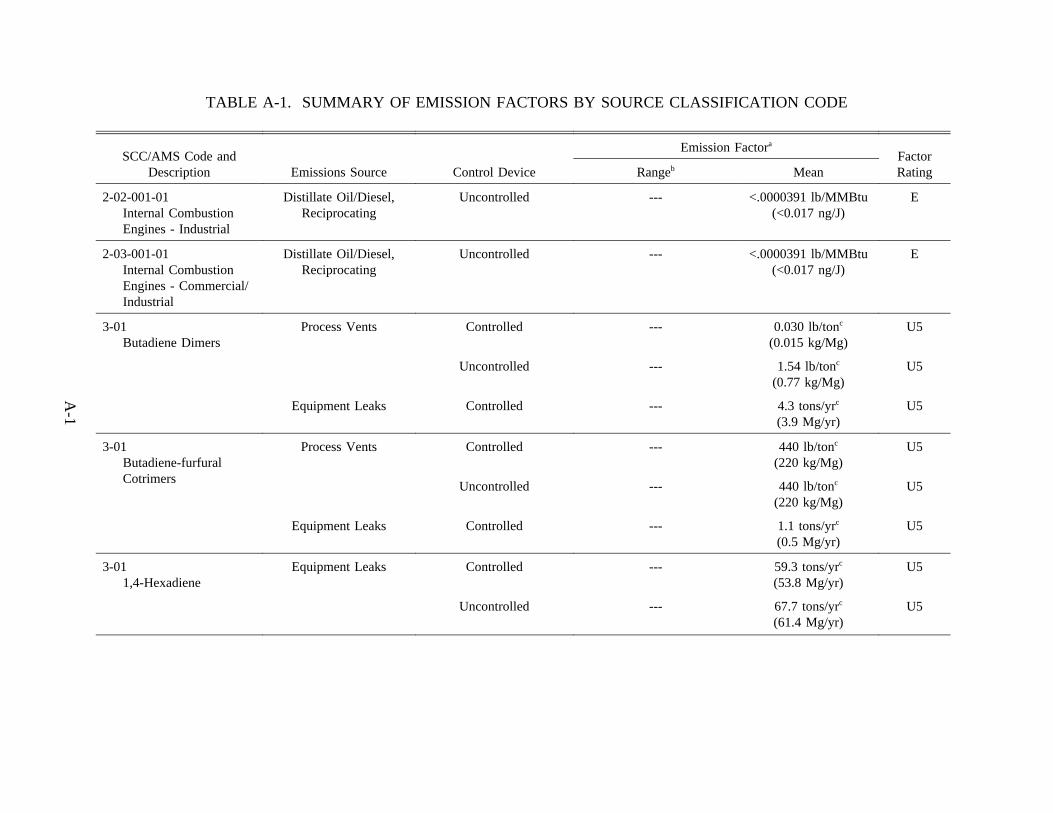
A-1
TABLE A-1. SUMMARY OF EMISSION FACTORS BY SOURCE CLASSIFICATION CODE
SCC/AMS Code andDescription Emissions Source Control Device
Emission Factora
FactorRatingRangeb Mean
2-02-001-01Internal CombustionEngines - Industrial
Distillate Oil/Diesel,Reciprocating
Uncontrolled --- <.0000391 lb/MMBtu(<0.017 ng/J)
E
2-03-001-01Internal CombustionEngines - Commercial/Industrial
Distillate Oil/Diesel,Reciprocating
Uncontrolled --- <.0000391 lb/MMBtu(<0.017 ng/J)
E
3-01Butadiene Dimers
Process Vents Controlled --- 0.030 lb/tonc
(0.015 kg/Mg)U5
Uncontrolled --- 1.54 lb/tonc
(0.77 kg/Mg)U5
Equipment Leaks Controlled --- 4.3 tons/yrc
(3.9 Mg/yr)U5
3-01Butadiene-furfuralCotrimers
Process Vents Controlled --- 440 lb/tonc
(220 kg/Mg)U5
Uncontrolled --- 440 lb/tonc
(220 kg/Mg)U5
Equipment Leaks Controlled --- 1.1 tons/yrc
(0.5 Mg/yr)U5
3-011,4-Hexadiene
Equipment Leaks Controlled --- 59.3 tons/yrc
(53.8 Mg/yr)U5
Uncontrolled --- 67.7 tons/yrc
(61.4 Mg/yr)U5
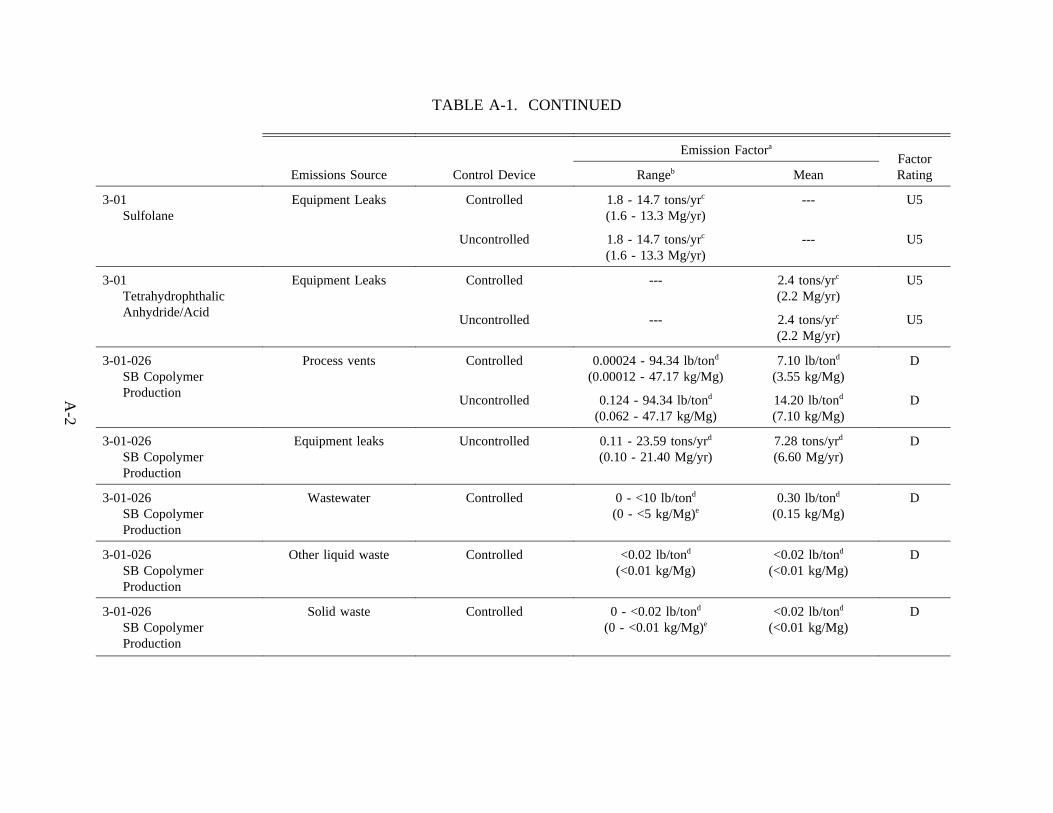
TABLE A-1. CONTINUED
A-2
Emissions Source Control Device
Emission Factora
FactorRatingRangeb Mean
3-01Sulfolane
Equipment Leaks Controlled 1.8 - 14.7 tons/yrc
(1.6 - 13.3 Mg/yr)--- U5
Uncontrolled 1.8 - 14.7 tons/yrc
(1.6 - 13.3 Mg/yr)--- U5
3-01TetrahydrophthalicAnhydride/Acid
Equipment Leaks Controlled --- 2.4 tons/yrc
(2.2 Mg/yr)U5
Uncontrolled --- 2.4 tons/yrc
(2.2 Mg/yr)U5
3-01-026SB CopolymerProduction
Process vents Controlled 0.00024 - 94.34 lb/tond
(0.00012 - 47.17 kg/Mg)7.10 lb/tond
(3.55 kg/Mg)D
Uncontrolled 0.124 - 94.34 lb/tond
(0.062 - 47.17 kg/Mg)14.20 lb/tond
(7.10 kg/Mg)D
3-01-026SB CopolymerProduction
Equipment leaks Uncontrolled 0.11 - 23.59 tons/yrd
(0.10 - 21.40 Mg/yr)7.28 tons/yrd
(6.60 Mg/yr)D
3-01-026SB CopolymerProduction
Wastewater Controlled 0 - <10 lb/tond
(0 - <5 kg/Mg)e0.30 lb/tond
(0.15 kg/Mg)D
3-01-026SB CopolymerProduction
Other liquid waste Controlled <0.02 lb/tond
(<0.01 kg/Mg)<0.02 lb/tond
(<0.01 kg/Mg)D
3-01-026SB CopolymerProduction
Solid waste Controlled 0 - <0.02 lb/tond
(0 - <0.01 kg/Mg)e<0.02 lb/tond
(<0.01 kg/Mg)D
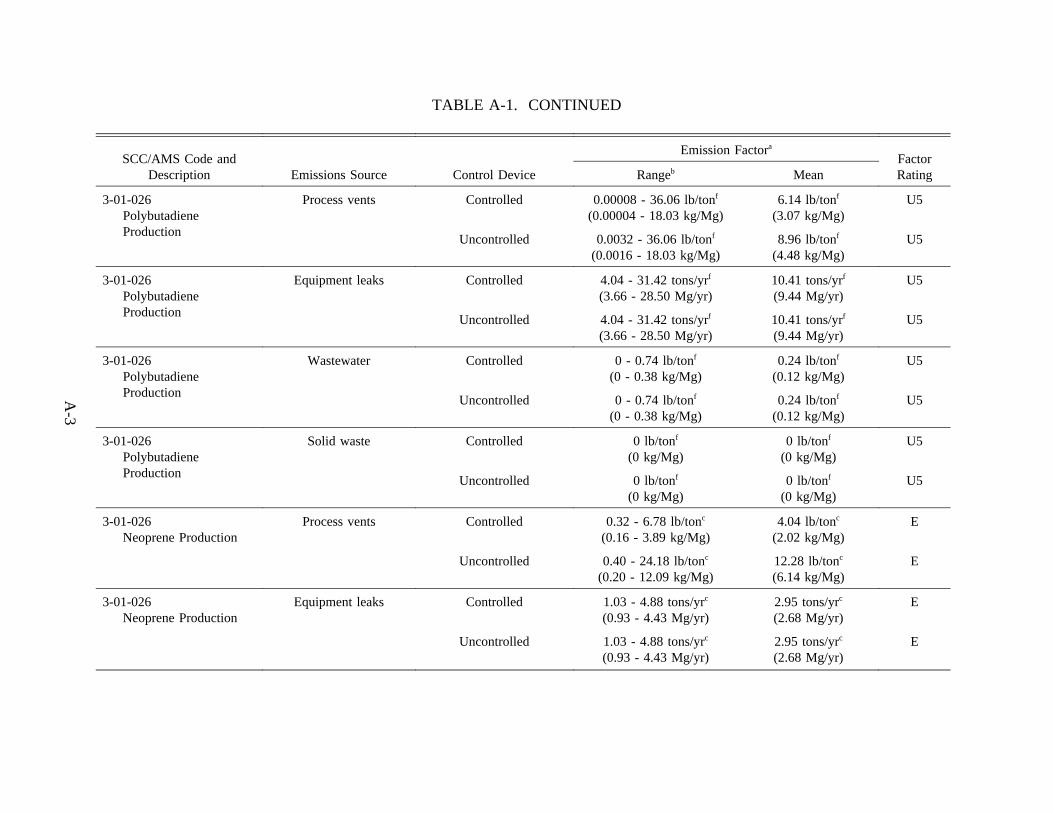
TABLE A-1. CONTINUED
A-3
SCC/AMS Code andDescription Emissions Source Control Device
Emission Factora
FactorRatingRangeb Mean
3-01-026PolybutadieneProduction
Process vents Controlled 0.00008 - 36.06 lb/tonf
(0.00004 - 18.03 kg/Mg)6.14 lb/tonf
(3.07 kg/Mg)U5
Uncontrolled 0.0032 - 36.06 lb/tonf
(0.0016 - 18.03 kg/Mg)8.96 lb/tonf
(4.48 kg/Mg)U5
3-01-026PolybutadieneProduction
Equipment leaks Controlled 4.04 - 31.42 tons/yrf
(3.66 - 28.50 Mg/yr)10.41 tons/yrf
(9.44 Mg/yr)U5
Uncontrolled 4.04 - 31.42 tons/yrf
(3.66 - 28.50 Mg/yr)10.41 tons/yrf
(9.44 Mg/yr)U5
3-01-026PolybutadieneProduction
Wastewater Controlled 0 - 0.74 lb/tonf
(0 - 0.38 kg/Mg)0.24 lb/tonf
(0.12 kg/Mg)U5
Uncontrolled 0 - 0.74 lb/tonf
(0 - 0.38 kg/Mg)0.24 lb/tonf
(0.12 kg/Mg)U5
3-01-026PolybutadieneProduction
Solid waste Controlled 0 lb/tonf
(0 kg/Mg)0 lb/tonf
(0 kg/Mg)U5
Uncontrolled 0 lb/tonf
(0 kg/Mg)0 lb/tonf
(0 kg/Mg)U5
3-01-026Neoprene Production
Process vents Controlled 0.32 - 6.78 lb/tonc
(0.16 - 3.89 kg/Mg)4.04 lb/tonc
(2.02 kg/Mg)E
Uncontrolled 0.40 - 24.18 lb/tonc
(0.20 - 12.09 kg/Mg)12.28 lb/tonc
(6.14 kg/Mg)E
3-01-026Neoprene Production
Equipment leaks Controlled 1.03 - 4.88 tons/yrc
(0.93 - 4.43 Mg/yr)2.95 tons/yrc
(2.68 Mg/yr)E
Uncontrolled 1.03 - 4.88 tons/yrc
(0.93 - 4.43 Mg/yr)2.95 tons/yrc
(2.68 Mg/yr)E
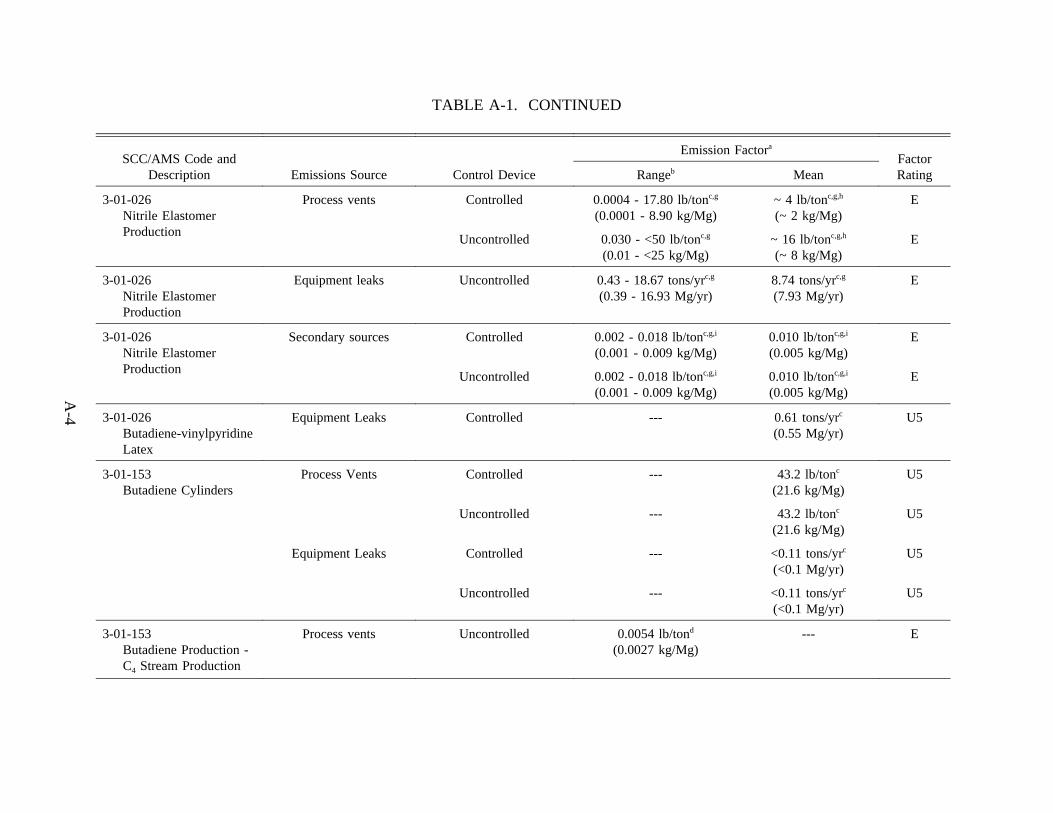
TABLE A-1. CONTINUED
A-4
SCC/AMS Code andDescription Emissions Source Control Device
Emission Factora
FactorRatingRangeb Mean
3-01-026Nitrile ElastomerProduction
Process vents Controlled 0.0004 - 17.80 lb/tonc,g
(0.0001 - 8.90 kg/Mg)~ 4 lb/tonc,g,h
(~ 2 kg/Mg)E
Uncontrolled 0.030 - <50 lb/tonc,g
(0.01 - <25 kg/Mg)~ 16 lb/tonc,g,h
(~ 8 kg/Mg)E
3-01-026Nitrile ElastomerProduction
Equipment leaks Uncontrolled 0.43 - 18.67 tons/yrc,g
(0.39 - 16.93 Mg/yr)8.74 tons/yrc,g
(7.93 Mg/yr)E
3-01-026Nitrile ElastomerProduction
Secondary sources Controlled 0.002 - 0.018 lb/tonc,g,i
(0.001 - 0.009 kg/Mg)0.010 lb/tonc,g,i
(0.005 kg/Mg)E
Uncontrolled 0.002 - 0.018 lb/tonc,g,i
(0.001 - 0.009 kg/Mg)0.010 lb/tonc,g,i
(0.005 kg/Mg)E
3-01-026Butadiene-vinylpyridineLatex
Equipment Leaks Controlled --- 0.61 tons/yrc
(0.55 Mg/yr)U5
3-01-153Butadiene Cylinders
Process Vents Controlled --- 43.2 lb/tonc
(21.6 kg/Mg)U5
Uncontrolled --- 43.2 lb/tonc
(21.6 kg/Mg)U5
Equipment Leaks Controlled --- <0.11 tons/yrc
(<0.1 Mg/yr)U5
Uncontrolled --- <0.11 tons/yrc
(<0.1 Mg/yr)U5
3-01-153Butadiene Production -C4 Stream Production
Process vents Uncontrolled 0.0054 lb/tond
(0.0027 kg/Mg)--- E
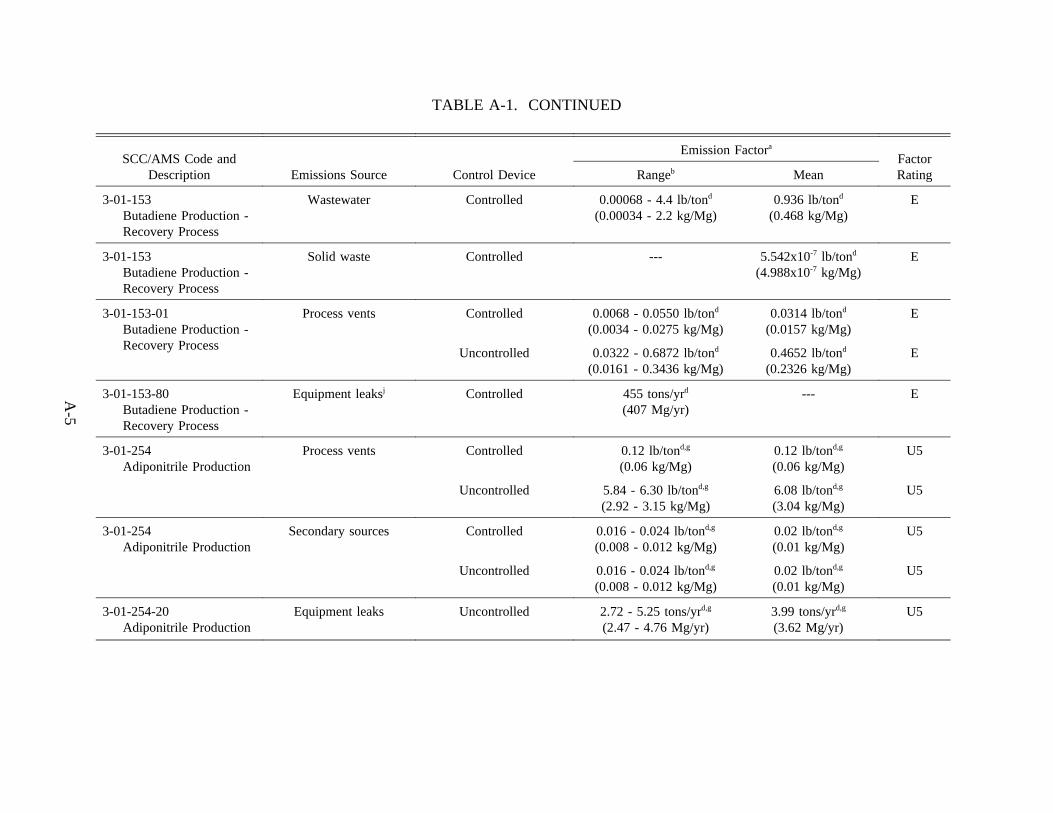
TABLE A-1. CONTINUED
A-5
SCC/AMS Code andDescription Emissions Source Control Device
Emission Factora
FactorRatingRangeb Mean
3-01-153Butadiene Production -Recovery Process
Wastewater Controlled 0.00068 - 4.4 lb/tond
(0.00034 - 2.2 kg/Mg)0.936 lb/tond
(0.468 kg/Mg)E
3-01-153Butadiene Production -Recovery Process
Solid waste Controlled --- 5.542x10⁻⁷ lb/tond
(4.988x10⁻⁷ kg/Mg)E
3-01-153-01Butadiene Production -Recovery Process
Process vents Controlled 0.0068 - 0.0550 lb/tond
(0.0034 - 0.0275 kg/Mg)0.0314 lb/tond
(0.0157 kg/Mg)E
Uncontrolled 0.0322 - 0.6872 lb/tond
(0.0161 - 0.3436 kg/Mg)0.4652 lb/tond
(0.2326 kg/Mg)E
3-01-153-80Butadiene Production -Recovery Process
Equipment leaksj Controlled 455 tons/yrd
(407 Mg/yr)--- E
3-01-254Adiponitrile Production
Process vents Controlled 0.12 lb/tond,g
(0.06 kg/Mg)0.12 lb/tond,g
(0.06 kg/Mg)U5
Uncontrolled 5.84 - 6.30 lb/tond,g
(2.92 - 3.15 kg/Mg)6.08 lb/tond,g
(3.04 kg/Mg)U5
3-01-254Adiponitrile Production
Secondary sources Controlled 0.016 - 0.024 lb/tond,g
(0.008 - 0.012 kg/Mg)0.02 lb/tond,g
(0.01 kg/Mg)U5
Uncontrolled 0.016 - 0.024 lb/tond,g
(0.008 - 0.012 kg/Mg)0.02 lb/tond,g
(0.01 kg/Mg)U5
3-01-254-20Adiponitrile Production
Equipment leaks Uncontrolled 2.72 - 5.25 tons/yrd,g
(2.47 - 4.76 Mg/yr)3.99 tons/yrd,g
(3.62 Mg/yr)U5
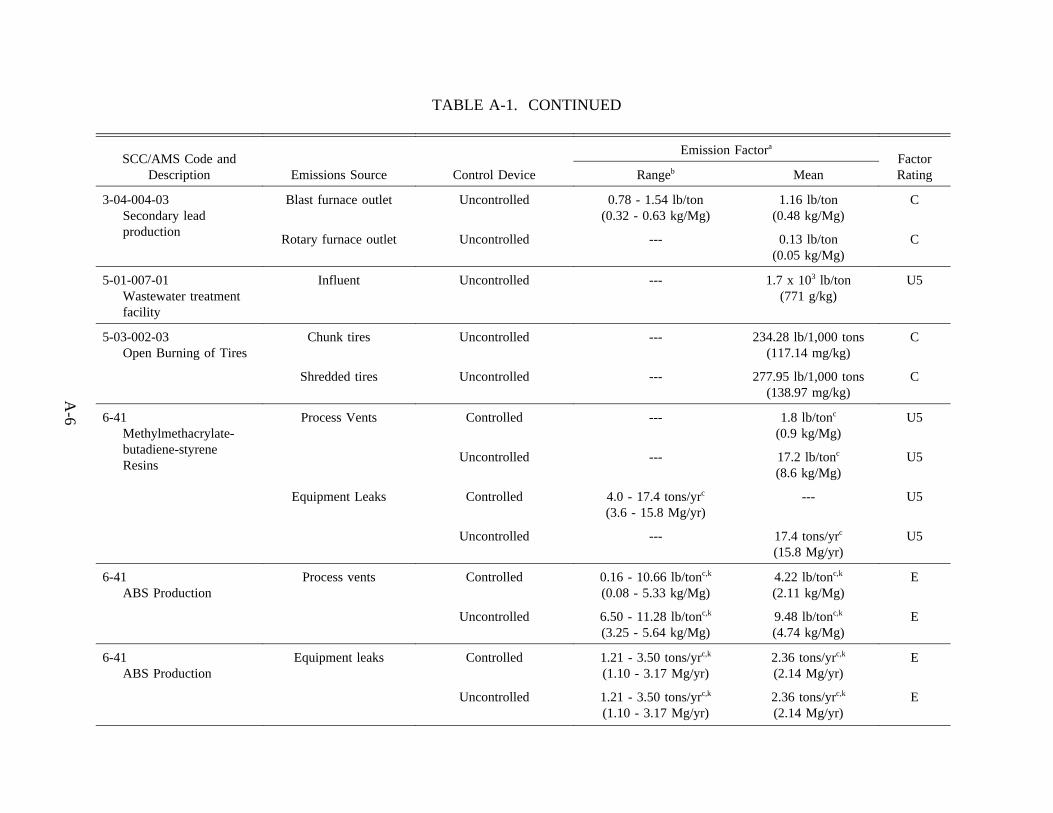
TABLE A-1. CONTINUED
A-6
SCC/AMS Code andDescription Emissions Source Control Device
Emission Factora
FactorRatingRangeb Mean
3-04-004-03Secondary leadproduction
Blast furnace outlet Uncontrolled 0.78 - 1.54 lb/ton(0.32 - 0.63 kg/Mg)
1.16 lb/ton(0.48 kg/Mg)
C
Rotary furnace outlet Uncontrolled --- 0.13 lb/ton(0.05 kg/Mg)
C
5-01-007-01Wastewater treatmentfacility
Influent Uncontrolled --- 1.7 x 10³ lb/ton(771 g/kg)
U5
5-03-002-03Open Burning of Tires
Chunk tires Uncontrolled --- 234.28 lb/1,000 tons(117.14 mg/kg)
C
Shredded tires Uncontrolled --- 277.95 lb/1,000 tons(138.97 mg/kg)
C
6-41Methylmethacrylate-butadiene-styreneResins
Process Vents Controlled --- 1.8 lb/tonc
(0.9 kg/Mg)U5
Uncontrolled --- 17.2 lb/tonc
(8.6 kg/Mg)U5
Equipment Leaks Controlled 4.0 - 17.4 tons/yrc
(3.6 - 15.8 Mg/yr)--- U5
Uncontrolled --- 17.4 tons/yrc
(15.8 Mg/yr)U5
6-41ABS Production
Process vents Controlled 0.16 - 10.66 lb/tonc,k
(0.08 - 5.33 kg/Mg)4.22 lb/tonc,k
(2.11 kg/Mg)E
Uncontrolled 6.50 - 11.28 lb/tonc,k
(3.25 - 5.64 kg/Mg)9.48 lb/tonc,k
(4.74 kg/Mg)E
6-41ABS Production
Equipment leaks Controlled 1.21 - 3.50 tons/yrc,k
(1.10 - 3.17 Mg/yr)2.36 tons/yrc,k
(2.14 Mg/yr)E
Uncontrolled 1.21 - 3.50 tons/yrc,k
(1.10 - 3.17 Mg/yr)2.36 tons/yrc,k
(2.14 Mg/yr)E
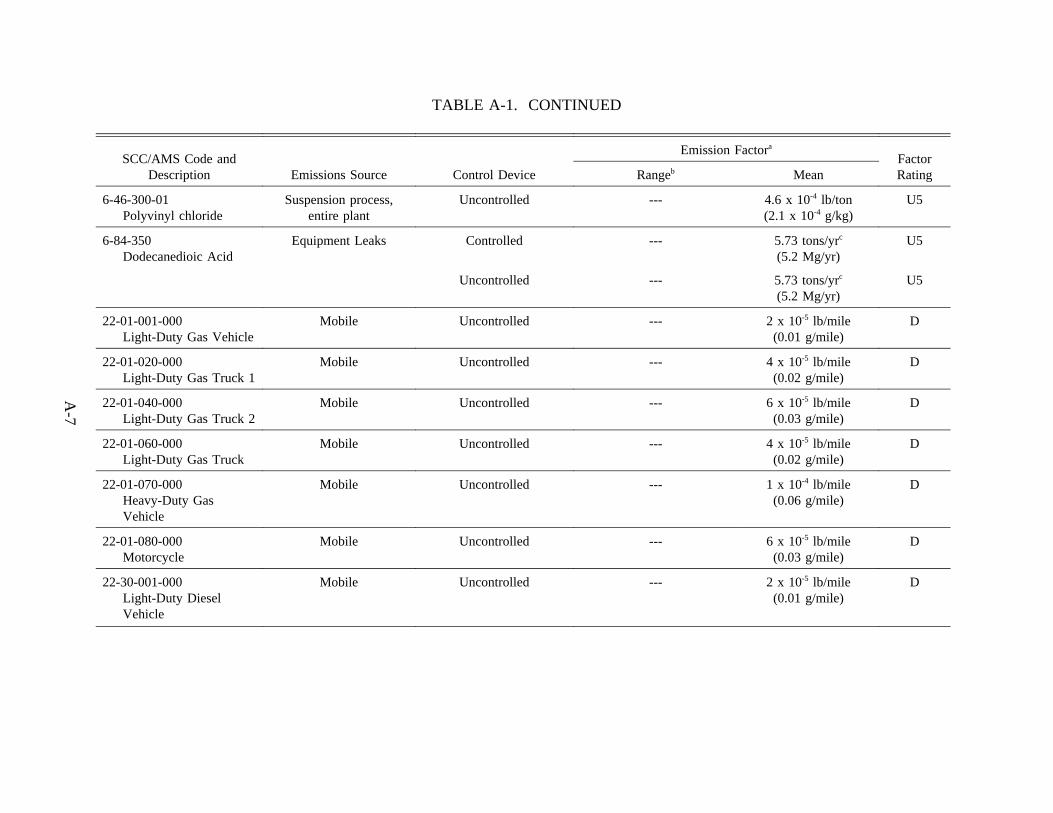
TABLE A-1. CONTINUED
A-7
SCC/AMS Code andDescription Emissions Source Control Device
Emission Factora
FactorRatingRangeb Mean
6-46-300-01Polyvinyl chloride
Suspension process,entire plant
Uncontrolled --- 4.6 x 10⁻⁴ lb/ton(2.1 x 10-4 g/kg)
U5
6-84-350Dodecanedioic Acid
Equipment Leaks Controlled --- 5.73 tons/yrc
(5.2 Mg/yr)U5
Uncontrolled --- 5.73 tons/yrc
(5.2 Mg/yr)U5
22-01-001-000Light-Duty Gas Vehicle
Mobile Uncontrolled --- 2 x 10⁻⁵ lb/mile(0.01 g/mile)
D
22-01-020-000Light-Duty Gas Truck 1
Mobile Uncontrolled --- 4 x 10⁻⁵ lb/mile(0.02 g/mile)
D
22-01-040-000Light-Duty Gas Truck 2
Mobile Uncontrolled --- 6 x 10⁻⁵ lb/mile(0.03 g/mile)
D
22-01-060-000Light-Duty Gas Truck
Mobile Uncontrolled --- 4 x 10⁻⁵ lb/mile(0.02 g/mile)
D
22-01-070-000Heavy-Duty GasVehicle
Mobile Uncontrolled --- 1 x 10⁻⁴ lb/mile(0.06 g/mile)
D
22-01-080-000Motorcycle
Mobile Uncontrolled --- 6 x 10⁻⁵ lb/mile(0.03 g/mile)
D
22-30-001-000Light-Duty DieselVehicle
Mobile Uncontrolled --- 2 x 10⁻⁵ lb/mile(0.01 g/mile)
D
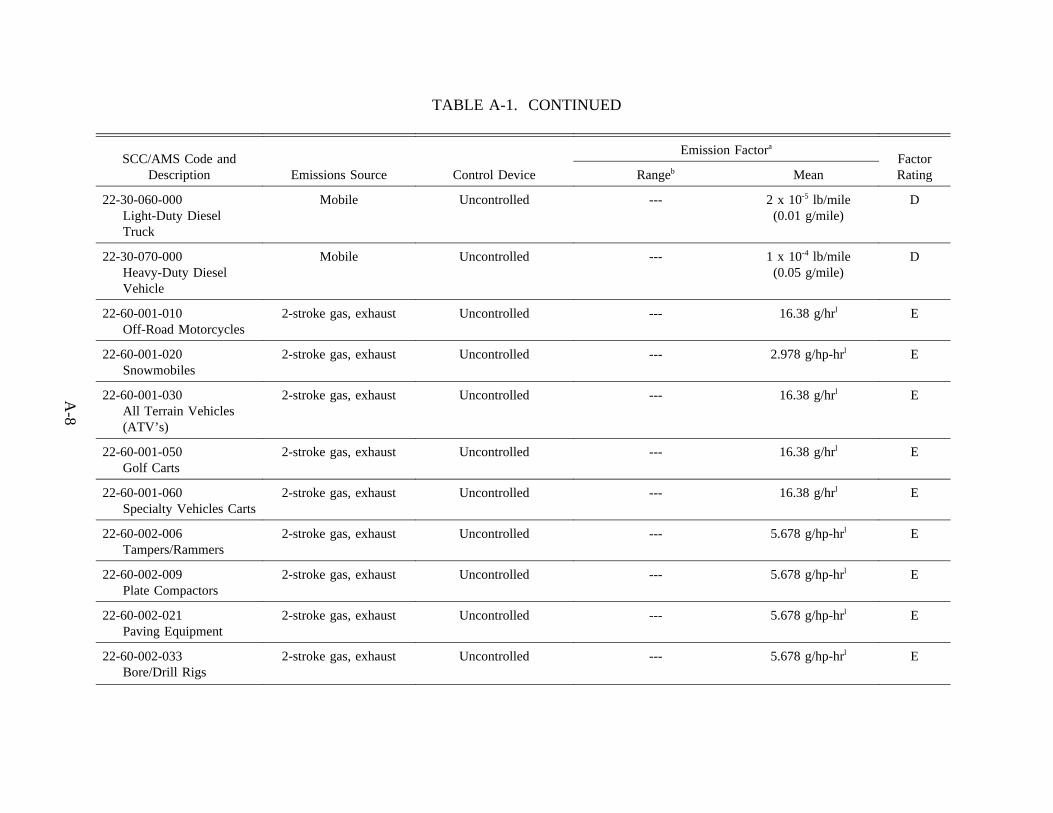
TABLE A-1. CONTINUED
A-8
SCC/AMS Code andDescription Emissions Source Control Device
Emission Factora
FactorRatingRangeb Mean
22-30-060-000Light-Duty DieselTruck
Mobile Uncontrolled --- 2 x 10⁻⁵ lb/mile(0.01 g/mile)
D
22-30-070-000Heavy-Duty DieselVehicle
Mobile Uncontrolled --- 1 x 10⁻⁴ lb/mile(0.05 g/mile)
D
22-60-001-010Off-Road Motorcycles
2-stroke gas, exhaust Uncontrolled --- 16.38 g/hrl E
22-60-001-020Snowmobiles
2-stroke gas, exhaust Uncontrolled --- 2.978 g/hp-hrl E
22-60-001-030All Terrain Vehicles(ATV’s)
2-stroke gas, exhaust Uncontrolled --- 16.38 g/hrl E
22-60-001-050Golf Carts
2-stroke gas, exhaust Uncontrolled --- 16.38 g/hrl E
22-60-001-060Specialty Vehicles Carts
2-stroke gas, exhaust Uncontrolled --- 16.38 g/hrl E
22-60-002-006Tampers/Rammers
2-stroke gas, exhaust Uncontrolled --- 5.678 g/hp-hrl E
22-60-002-009Plate Compactors
2-stroke gas, exhaust Uncontrolled --- 5.678 g/hp-hrl E
22-60-002-021Paving Equipment
2-stroke gas, exhaust Uncontrolled --- 5.678 g/hp-hrl E
22-60-002-033Bore/Drill Rigs
2-stroke gas, exhaust Uncontrolled --- 5.678 g/hp-hrl E
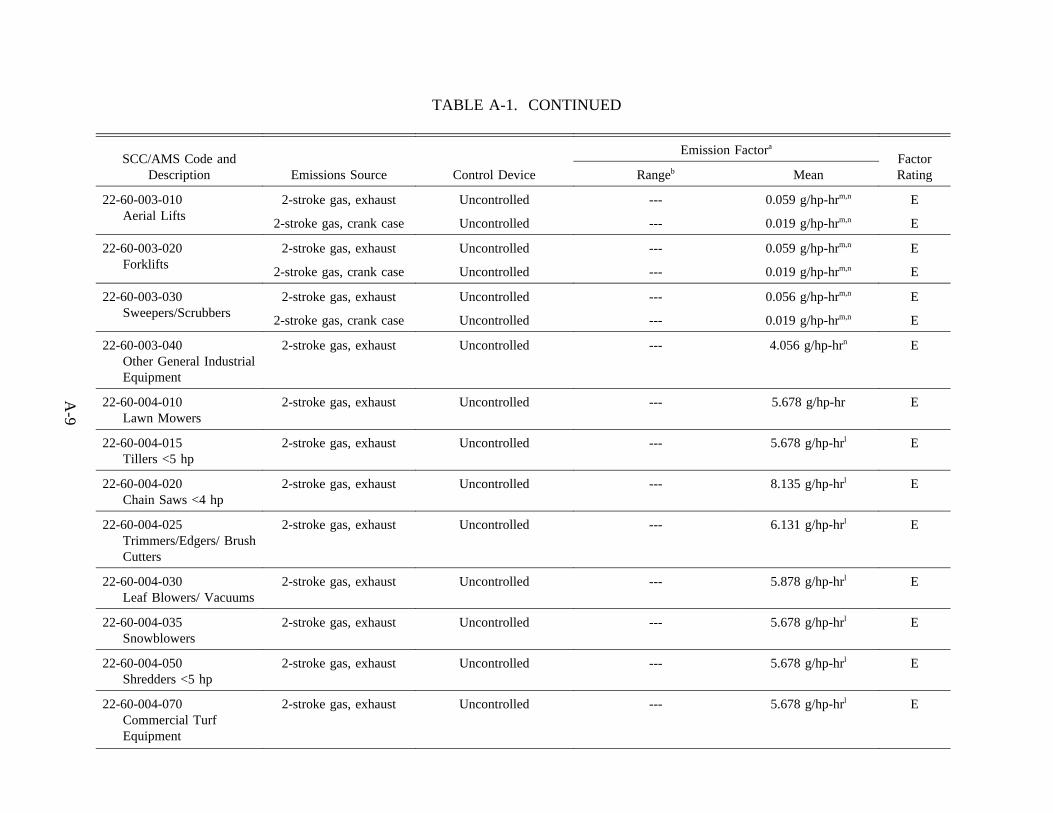
TABLE A-1. CONTINUED
A-9
SCC/AMS Code andDescription Emissions Source Control Device
Emission Factora
FactorRatingRangeb Mean
22-60-003-010Aerial Lifts
2-stroke gas, exhaust Uncontrolled --- 0.059 g/hp-hrm,n E
2-stroke gas, crank case Uncontrolled --- 0.019 g/hp-hrm,n E
22-60-003-020Forklifts
2-stroke gas, exhaust Uncontrolled --- 0.059 g/hp-hrm,n E
2-stroke gas, crank case Uncontrolled --- 0.019 g/hp-hrm,n E
22-60-003-030Sweepers/Scrubbers
2-stroke gas, exhaust Uncontrolled --- 0.056 g/hp-hrm,n E
2-stroke gas, crank case Uncontrolled --- 0.019 g/hp-hrm,n E
22-60-003-040Other General IndustrialEquipment
2-stroke gas, exhaust Uncontrolled --- 4.056 g/hp-hrn E
22-60-004-010Lawn Mowers
2-stroke gas, exhaust Uncontrolled --- 5.678 g/hp-hr E
22-60-004-015Tillers <5 hp
2-stroke gas, exhaust Uncontrolled --- 5.678 g/hp-hrl E
22-60-004-020Chain Saws <4 hp
2-stroke gas, exhaust Uncontrolled --- 8.135 g/hp-hrl E
22-60-004-025Trimmers/Edgers/ BrushCutters
2-stroke gas, exhaust Uncontrolled --- 6.131 g/hp-hrl E
22-60-004-030Leaf Blowers/ Vacuums
2-stroke gas, exhaust Uncontrolled --- 5.878 g/hp-hrl E
22-60-004-035Snowblowers
2-stroke gas, exhaust Uncontrolled --- 5.678 g/hp-hrl E
22-60-004-050Shredders <5 hp
2-stroke gas, exhaust Uncontrolled --- 5.678 g/hp-hrl E
22-60-004-070Commercial TurfEquipment
2-stroke gas, exhaust Uncontrolled --- 5.678 g/hp-hrl E
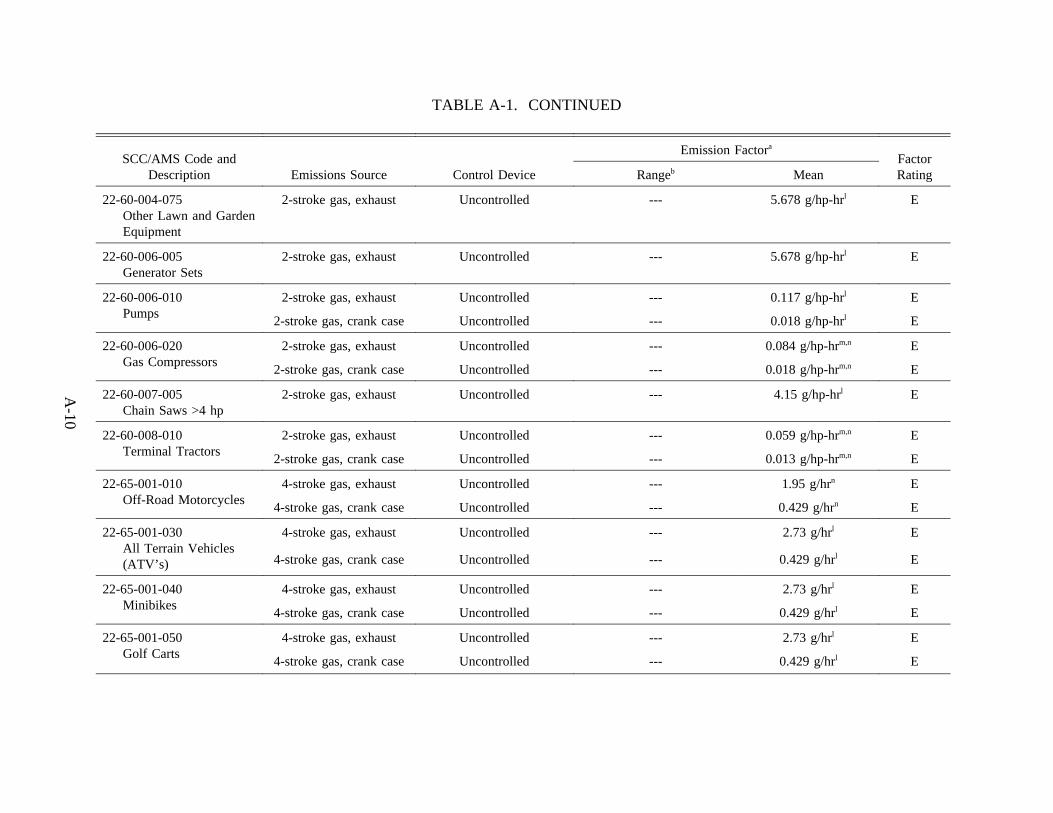
TABLE A-1. CONTINUED
A-10
SCC/AMS Code andDescription Emissions Source Control Device
Emission Factora
FactorRatingRangeb Mean
22-60-004-075Other Lawn and GardenEquipment
2-stroke gas, exhaust Uncontrolled --- 5.678 g/hp-hrl E
22-60-006-005Generator Sets
2-stroke gas, exhaust Uncontrolled --- 5.678 g/hp-hrl E
22-60-006-010Pumps
2-stroke gas, exhaust Uncontrolled --- 0.117 g/hp-hrl E
2-stroke gas, crank case Uncontrolled --- 0.018 g/hp-hrl E
22-60-006-020Gas Compressors
2-stroke gas, exhaust Uncontrolled --- 0.084 g/hp-hrm,n E
2-stroke gas, crank case Uncontrolled --- 0.018 g/hp-hrm,n E
22-60-007-005Chain Saws >4 hp
2-stroke gas, exhaust Uncontrolled --- 4.15 g/hp-hrl E
22-60-008-010Terminal Tractors
2-stroke gas, exhaust Uncontrolled --- 0.059 g/hp-hrm,n E
2-stroke gas, crank case Uncontrolled --- 0.013 g/hp-hrm,n E
22-65-001-010Off-Road Motorcycles
4-stroke gas, exhaust Uncontrolled --- 1.95 g/hrn E
4-stroke gas, crank case Uncontrolled --- 0.429 g/hrn E
22-65-001-030All Terrain Vehicles(ATV’s)
4-stroke gas, exhaust Uncontrolled --- 2.73 g/hrl E
4-stroke gas, crank case Uncontrolled --- 0.429 g/hrl E
22-65-001-040Minibikes
4-stroke gas, exhaust Uncontrolled --- 2.73 g/hrl E
4-stroke gas, crank case Uncontrolled --- 0.429 g/hrl E
22-65-001-050Golf Carts
4-stroke gas, exhaust Uncontrolled --- 2.73 g/hrl E
4-stroke gas, crank case Uncontrolled --- 0.429 g/hrl E
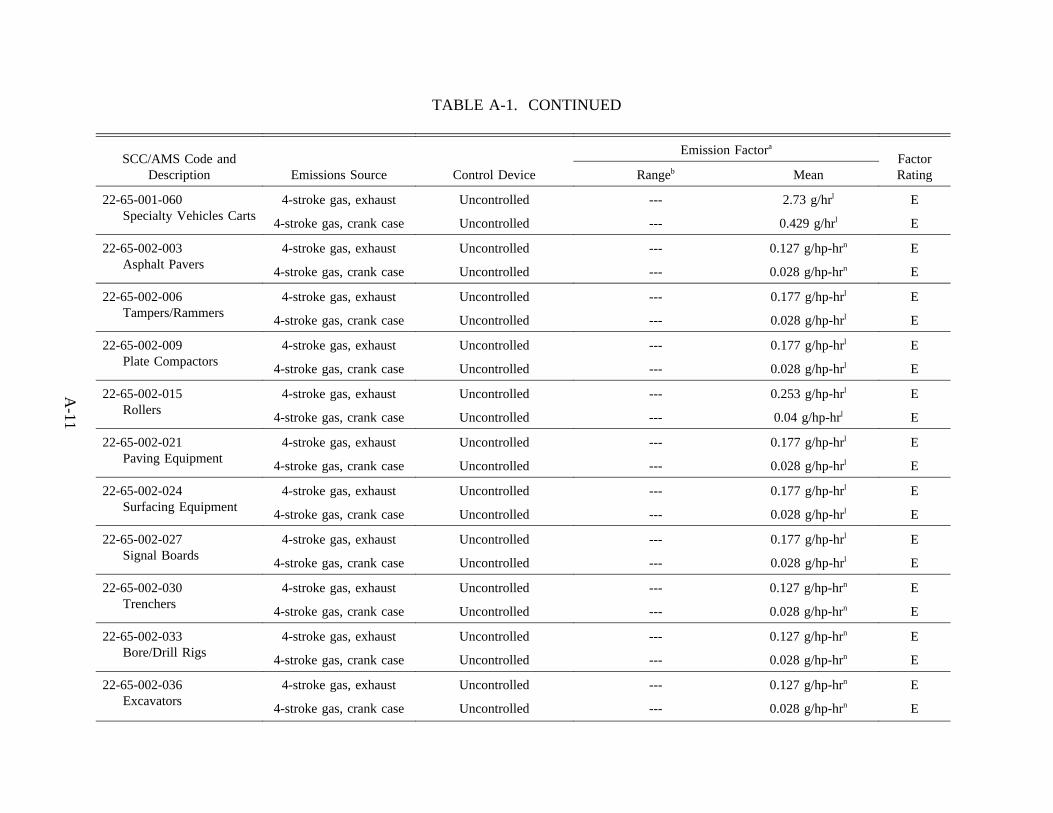
TABLE A-1. CONTINUED
A-11
SCC/AMS Code andDescription Emissions Source Control Device
Emission Factora
FactorRatingRangeb Mean
22-65-001-060Specialty Vehicles Carts
4-stroke gas, exhaust Uncontrolled --- 2.73 g/hrl E
4-stroke gas, crank case Uncontrolled --- 0.429 g/hrl E
22-65-002-003Asphalt Pavers
4-stroke gas, exhaust Uncontrolled --- 0.127 g/hp-hrn E
4-stroke gas, crank case Uncontrolled --- 0.028 g/hp-hrn E
22-65-002-006Tampers/Rammers
4-stroke gas, exhaust Uncontrolled --- 0.177 g/hp-hrl E
4-stroke gas, crank case Uncontrolled --- 0.028 g/hp-hrl E
22-65-002-009Plate Compactors
4-stroke gas, exhaust Uncontrolled --- 0.177 g/hp-hrl E
4-stroke gas, crank case Uncontrolled --- 0.028 g/hp-hrl E
22-65-002-015Rollers
4-stroke gas, exhaust Uncontrolled --- 0.253 g/hp-hrl E
4-stroke gas, crank case Uncontrolled --- 0.04 g/hp-hrl E
22-65-002-021Paving Equipment
4-stroke gas, exhaust Uncontrolled --- 0.177 g/hp-hrl E
4-stroke gas, crank case Uncontrolled --- 0.028 g/hp-hrl E
22-65-002-024Surfacing Equipment
4-stroke gas, exhaust Uncontrolled --- 0.177 g/hp-hrl E
4-stroke gas, crank case Uncontrolled --- 0.028 g/hp-hrl E
22-65-002-027Signal Boards
4-stroke gas, exhaust Uncontrolled --- 0.177 g/hp-hrl E
4-stroke gas, crank case Uncontrolled --- 0.028 g/hp-hrl E
22-65-002-030Trenchers
4-stroke gas, exhaust Uncontrolled --- 0.127 g/hp-hrn E
4-stroke gas, crank case Uncontrolled --- 0.028 g/hp-hrn E
22-65-002-033Bore/Drill Rigs
4-stroke gas, exhaust Uncontrolled --- 0.127 g/hp-hrn E
4-stroke gas, crank case Uncontrolled --- 0.028 g/hp-hrn E
22-65-002-036Excavators
4-stroke gas, exhaust Uncontrolled --- 0.127 g/hp-hrn E
4-stroke gas, crank case Uncontrolled --- 0.028 g/hp-hrn E
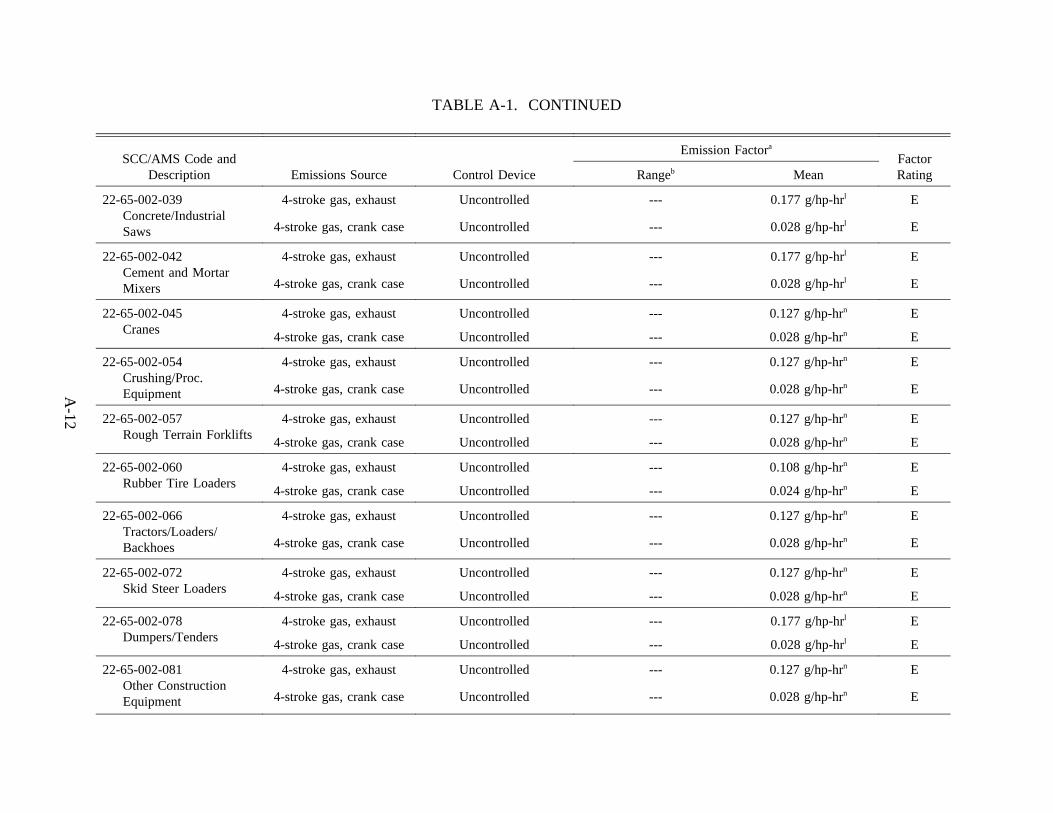
TABLE A-1. CONTINUED
A-12
SCC/AMS Code andDescription Emissions Source Control Device
Emission Factora
FactorRatingRangeb Mean
22-65-002-039Concrete/IndustrialSaws
4-stroke gas, exhaust Uncontrolled --- 0.177 g/hp-hrl E
4-stroke gas, crank case Uncontrolled --- 0.028 g/hp-hrl E
22-65-002-042Cement and MortarMixers
4-stroke gas, exhaust Uncontrolled --- 0.177 g/hp-hrl E
4-stroke gas, crank case Uncontrolled --- 0.028 g/hp-hrl E
22-65-002-045Cranes
4-stroke gas, exhaust Uncontrolled --- 0.127 g/hp-hrn E
4-stroke gas, crank case Uncontrolled --- 0.028 g/hp-hrn E
22-65-002-054Crushing/Proc.Equipment
4-stroke gas, exhaust Uncontrolled --- 0.127 g/hp-hrn E
4-stroke gas, crank case Uncontrolled --- 0.028 g/hp-hrn E
22-65-002-057Rough Terrain Forklifts
4-stroke gas, exhaust Uncontrolled --- 0.127 g/hp-hrn E
4-stroke gas, crank case Uncontrolled --- 0.028 g/hp-hrn E
22-65-002-060Rubber Tire Loaders
4-stroke gas, exhaust Uncontrolled --- 0.108 g/hp-hrn E
4-stroke gas, crank case Uncontrolled --- 0.024 g/hp-hrn E
22-65-002-066Tractors/Loaders/Backhoes
4-stroke gas, exhaust Uncontrolled --- 0.127 g/hp-hrn E
4-stroke gas, crank case Uncontrolled --- 0.028 g/hp-hrn E
22-65-002-072Skid Steer Loaders
4-stroke gas, exhaust Uncontrolled --- 0.127 g/hp-hrn E
4-stroke gas, crank case Uncontrolled --- 0.028 g/hp-hrn E
22-65-002-078Dumpers/Tenders
4-stroke gas, exhaust Uncontrolled --- 0.177 g/hp-hrl E
4-stroke gas, crank case Uncontrolled --- 0.028 g/hp-hrl E
22-65-002-081Other ConstructionEquipment
4-stroke gas, exhaust Uncontrolled --- 0.127 g/hp-hrn E
4-stroke gas, crank case Uncontrolled --- 0.028 g/hp-hrn E
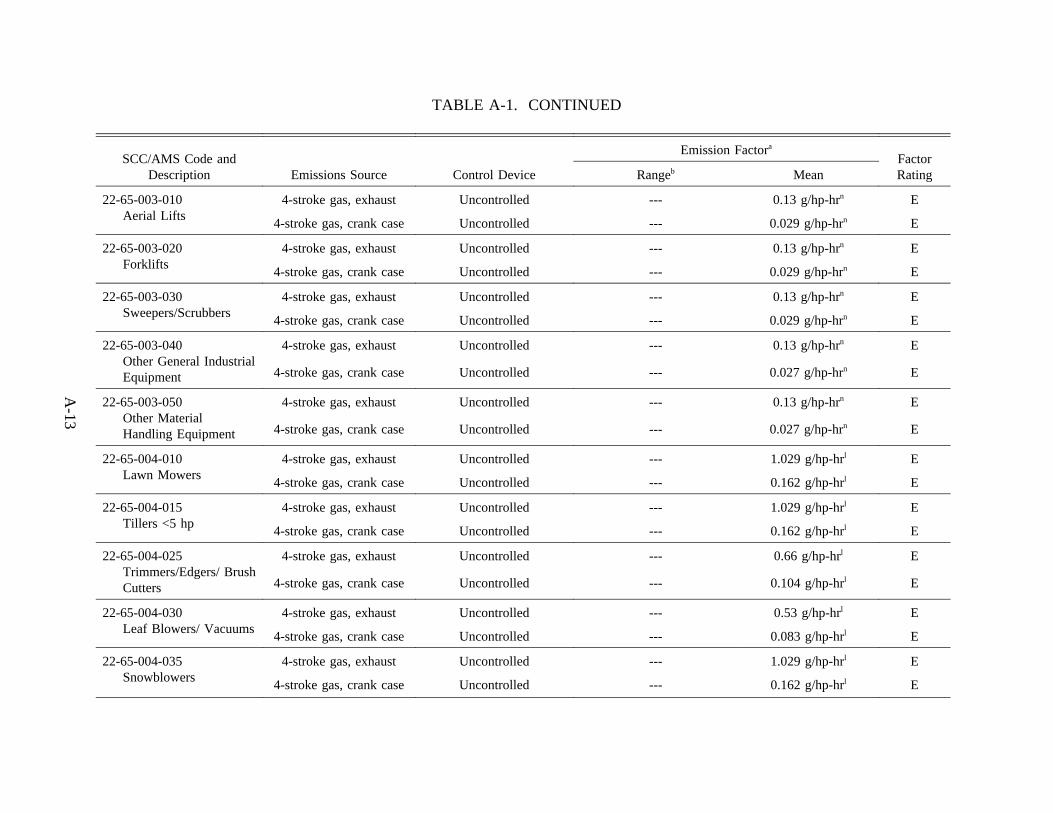
TABLE A-1. CONTINUED
A-13
SCC/AMS Code andDescription Emissions Source Control Device
Emission Factora
FactorRatingRangeb Mean
22-65-003-010Aerial Lifts
4-stroke gas, exhaust Uncontrolled --- 0.13 g/hp-hrn E
4-stroke gas, crank case Uncontrolled --- 0.029 g/hp-hrn E
22-65-003-020Forklifts
4-stroke gas, exhaust Uncontrolled --- 0.13 g/hp-hrn E
4-stroke gas, crank case Uncontrolled --- 0.029 g/hp-hrn E
22-65-003-030Sweepers/Scrubbers
4-stroke gas, exhaust Uncontrolled --- 0.13 g/hp-hrn E
4-stroke gas, crank case Uncontrolled --- 0.029 g/hp-hrn E
22-65-003-040Other General IndustrialEquipment
4-stroke gas, exhaust Uncontrolled --- 0.13 g/hp-hrn E
4-stroke gas, crank case Uncontrolled --- 0.027 g/hp-hrn E
22-65-003-050Other MaterialHandling Equipment
4-stroke gas, exhaust Uncontrolled --- 0.13 g/hp-hrn E
4-stroke gas, crank case Uncontrolled --- 0.027 g/hp-hrn E
22-65-004-010Lawn Mowers
4-stroke gas, exhaust Uncontrolled --- 1.029 g/hp-hrl E
4-stroke gas, crank case Uncontrolled --- 0.162 g/hp-hrl E
22-65-004-015Tillers <5 hp
4-stroke gas, exhaust Uncontrolled --- 1.029 g/hp-hrl E
4-stroke gas, crank case Uncontrolled --- 0.162 g/hp-hrl E
22-65-004-025Trimmers/Edgers/ BrushCutters
4-stroke gas, exhaust Uncontrolled --- 0.66 g/hp-hrl E
4-stroke gas, crank case Uncontrolled --- 0.104 g/hp-hrl E
22-65-004-030Leaf Blowers/ Vacuums
4-stroke gas, exhaust Uncontrolled --- 0.53 g/hp-hrl E
4-stroke gas, crank case Uncontrolled --- 0.083 g/hp-hrl E
22-65-004-035Snowblowers
4-stroke gas, exhaust Uncontrolled --- 1.029 g/hp-hrl E
4-stroke gas, crank case Uncontrolled --- 0.162 g/hp-hrl E
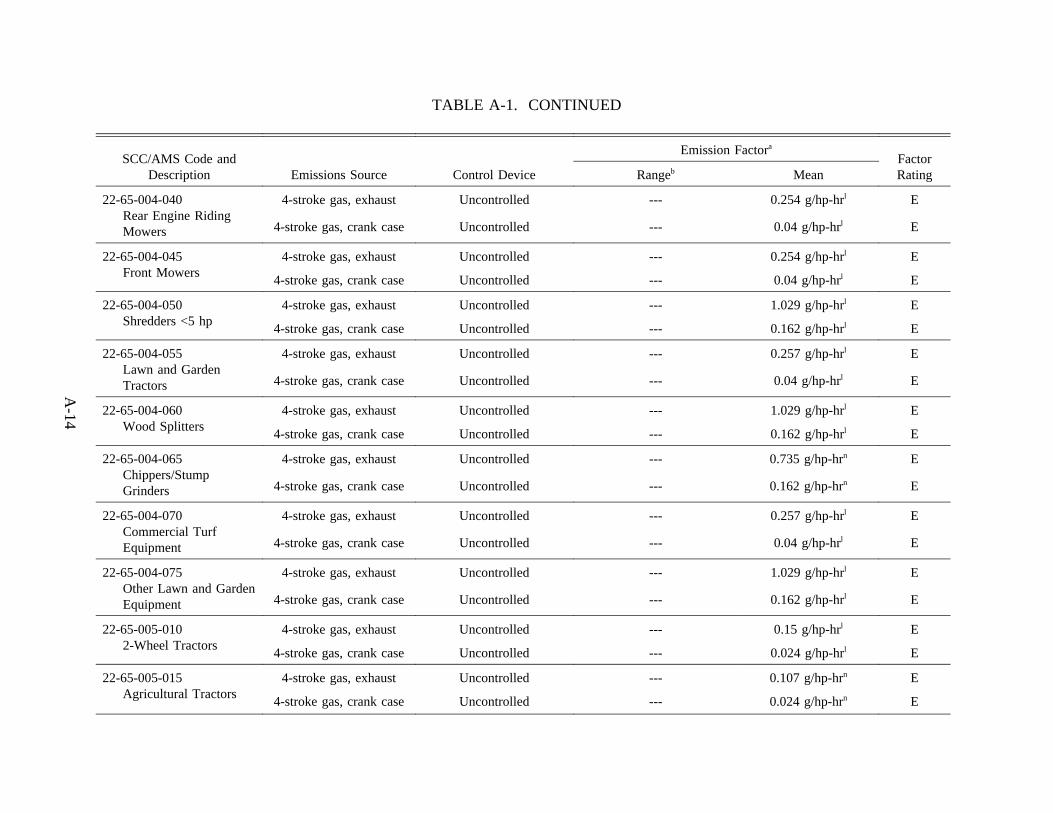
TABLE A-1. CONTINUED
A-14
SCC/AMS Code andDescription Emissions Source Control Device
Emission Factora
FactorRatingRangeb Mean
22-65-004-040Rear Engine RidingMowers
4-stroke gas, exhaust Uncontrolled --- 0.254 g/hp-hrl E
4-stroke gas, crank case Uncontrolled --- 0.04 g/hp-hrl E
22-65-004-045Front Mowers
4-stroke gas, exhaust Uncontrolled --- 0.254 g/hp-hrl E
4-stroke gas, crank case Uncontrolled --- 0.04 g/hp-hrl E
22-65-004-050Shredders <5 hp
4-stroke gas, exhaust Uncontrolled --- 1.029 g/hp-hrl E
4-stroke gas, crank case Uncontrolled --- 0.162 g/hp-hrl E
22-65-004-055Lawn and GardenTractors
4-stroke gas, exhaust Uncontrolled --- 0.257 g/hp-hrl E
4-stroke gas, crank case Uncontrolled --- 0.04 g/hp-hrl E
22-65-004-060Wood Splitters
4-stroke gas, exhaust Uncontrolled --- 1.029 g/hp-hrl E
4-stroke gas, crank case Uncontrolled --- 0.162 g/hp-hrl E
22-65-004-065Chippers/StumpGrinders
4-stroke gas, exhaust Uncontrolled --- 0.735 g/hp-hrn E
4-stroke gas, crank case Uncontrolled --- 0.162 g/hp-hrn E
22-65-004-070Commercial TurfEquipment
4-stroke gas, exhaust Uncontrolled --- 0.257 g/hp-hrl E
4-stroke gas, crank case Uncontrolled --- 0.04 g/hp-hrl E
22-65-004-075Other Lawn and GardenEquipment
4-stroke gas, exhaust Uncontrolled --- 1.029 g/hp-hrl E
4-stroke gas, crank case Uncontrolled --- 0.162 g/hp-hrl E
22-65-005-0102-Wheel Tractors
4-stroke gas, exhaust Uncontrolled --- 0.15 g/hp-hrl E
4-stroke gas, crank case Uncontrolled --- 0.024 g/hp-hrl E
22-65-005-015Agricultural Tractors
4-stroke gas, exhaust Uncontrolled --- 0.107 g/hp-hrn E
4-stroke gas, crank case Uncontrolled --- 0.024 g/hp-hrn E
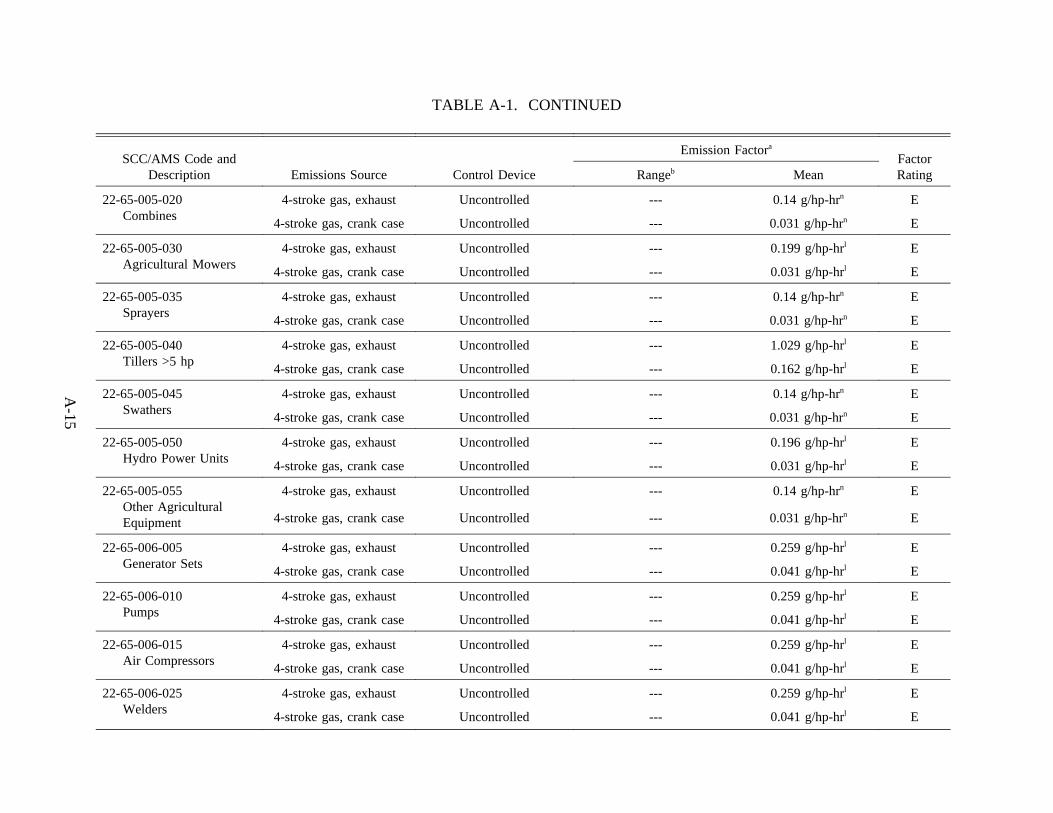
TABLE A-1. CONTINUED
A-15
SCC/AMS Code andDescription Emissions Source Control Device
Emission Factora
FactorRatingRangeb Mean
22-65-005-020Combines
4-stroke gas, exhaust Uncontrolled --- 0.14 g/hp-hrn E
4-stroke gas, crank case Uncontrolled --- 0.031 g/hp-hrn E
22-65-005-030Agricultural Mowers
4-stroke gas, exhaust Uncontrolled --- 0.199 g/hp-hrl E
4-stroke gas, crank case Uncontrolled --- 0.031 g/hp-hrl E
22-65-005-035Sprayers
4-stroke gas, exhaust Uncontrolled --- 0.14 g/hp-hrn E
4-stroke gas, crank case Uncontrolled --- 0.031 g/hp-hrn E
22-65-005-040Tillers >5 hp
4-stroke gas, exhaust Uncontrolled --- 1.029 g/hp-hrl E
4-stroke gas, crank case Uncontrolled --- 0.162 g/hp-hrl E
22-65-005-045Swathers
4-stroke gas, exhaust Uncontrolled --- 0.14 g/hp-hrn E
4-stroke gas, crank case Uncontrolled --- 0.031 g/hp-hrn E
22-65-005-050Hydro Power Units
4-stroke gas, exhaust Uncontrolled --- 0.196 g/hp-hrl E
4-stroke gas, crank case Uncontrolled --- 0.031 g/hp-hrl E
22-65-005-055Other AgriculturalEquipment
4-stroke gas, exhaust Uncontrolled --- 0.14 g/hp-hrn E
4-stroke gas, crank case Uncontrolled --- 0.031 g/hp-hrn E
22-65-006-005Generator Sets
4-stroke gas, exhaust Uncontrolled --- 0.259 g/hp-hrl E
4-stroke gas, crank case Uncontrolled --- 0.041 g/hp-hrl E
22-65-006-010Pumps
4-stroke gas, exhaust Uncontrolled --- 0.259 g/hp-hrl E
4-stroke gas, crank case Uncontrolled --- 0.041 g/hp-hrl E
22-65-006-015Air Compressors
4-stroke gas, exhaust Uncontrolled --- 0.259 g/hp-hrl E
4-stroke gas, crank case Uncontrolled --- 0.041 g/hp-hrl E
22-65-006-025Welders
4-stroke gas, exhaust Uncontrolled --- 0.259 g/hp-hrl E
4-stroke gas, crank case Uncontrolled --- 0.041 g/hp-hrl E
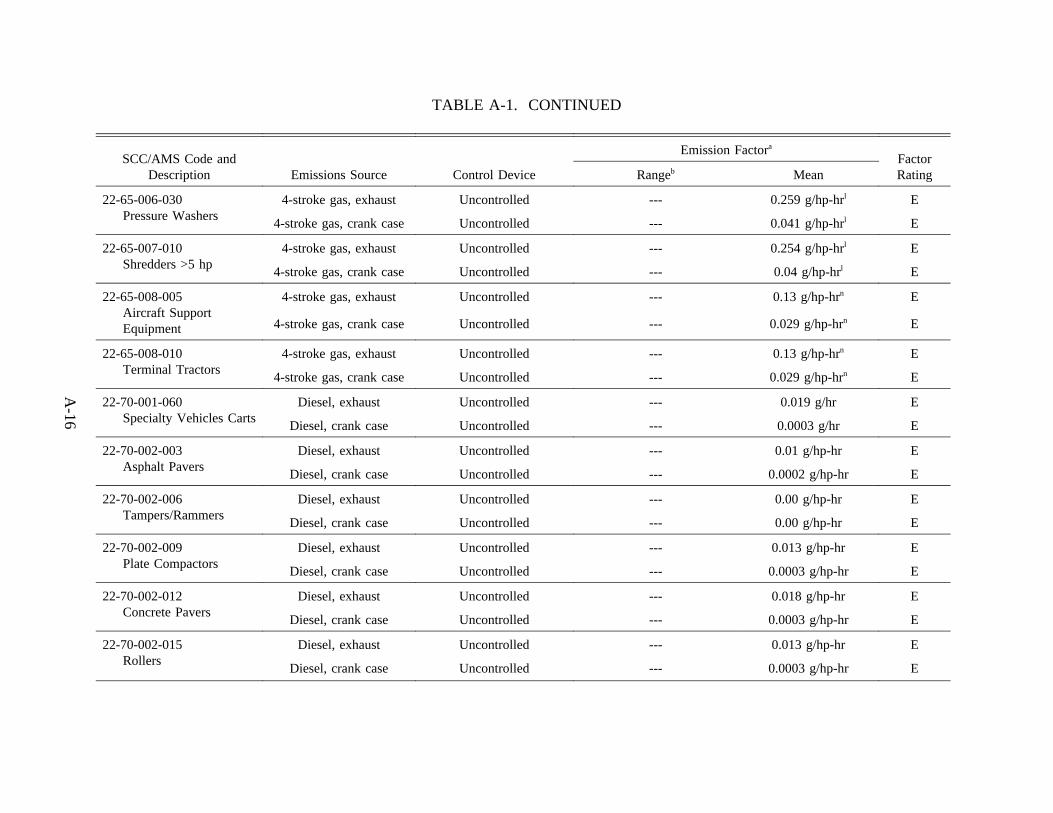
TABLE A-1. CONTINUED
A-16
SCC/AMS Code andDescription Emissions Source Control Device
Emission Factora
FactorRatingRangeb Mean
22-65-006-030Pressure Washers
4-stroke gas, exhaust Uncontrolled --- 0.259 g/hp-hrl E
4-stroke gas, crank case Uncontrolled --- 0.041 g/hp-hrl E
22-65-007-010Shredders >5 hp
4-stroke gas, exhaust Uncontrolled --- 0.254 g/hp-hrl E
4-stroke gas, crank case Uncontrolled --- 0.04 g/hp-hrl E
22-65-008-005Aircraft SupportEquipment
4-stroke gas, exhaust Uncontrolled --- 0.13 g/hp-hrn E
4-stroke gas, crank case Uncontrolled --- 0.029 g/hp-hrn E
22-65-008-010Terminal Tractors
4-stroke gas, exhaust Uncontrolled --- 0.13 g/hp-hrn E
4-stroke gas, crank case Uncontrolled --- 0.029 g/hp-hrn E
22-70-001-060Specialty Vehicles Carts
Diesel, exhaust Uncontrolled --- 0.019 g/hr E
Diesel, crank case Uncontrolled --- 0.0003 g/hr E
22-70-002-003Asphalt Pavers
Diesel, exhaust Uncontrolled --- 0.01 g/hp-hr E
Diesel, crank case Uncontrolled --- 0.0002 g/hp-hr E
22-70-002-006Tampers/Rammers
Diesel, exhaust Uncontrolled --- 0.00 g/hp-hr E
Diesel, crank case Uncontrolled --- 0.00 g/hp-hr E
22-70-002-009Plate Compactors
Diesel, exhaust Uncontrolled --- 0.013 g/hp-hr E
Diesel, crank case Uncontrolled --- 0.0003 g/hp-hr E
22-70-002-012Concrete Pavers
Diesel, exhaust Uncontrolled --- 0.018 g/hp-hr E
Diesel, crank case Uncontrolled --- 0.0003 g/hp-hr E
22-70-002-015Rollers
Diesel, exhaust Uncontrolled --- 0.013 g/hp-hr E
Diesel, crank case Uncontrolled --- 0.0003 g/hp-hr E
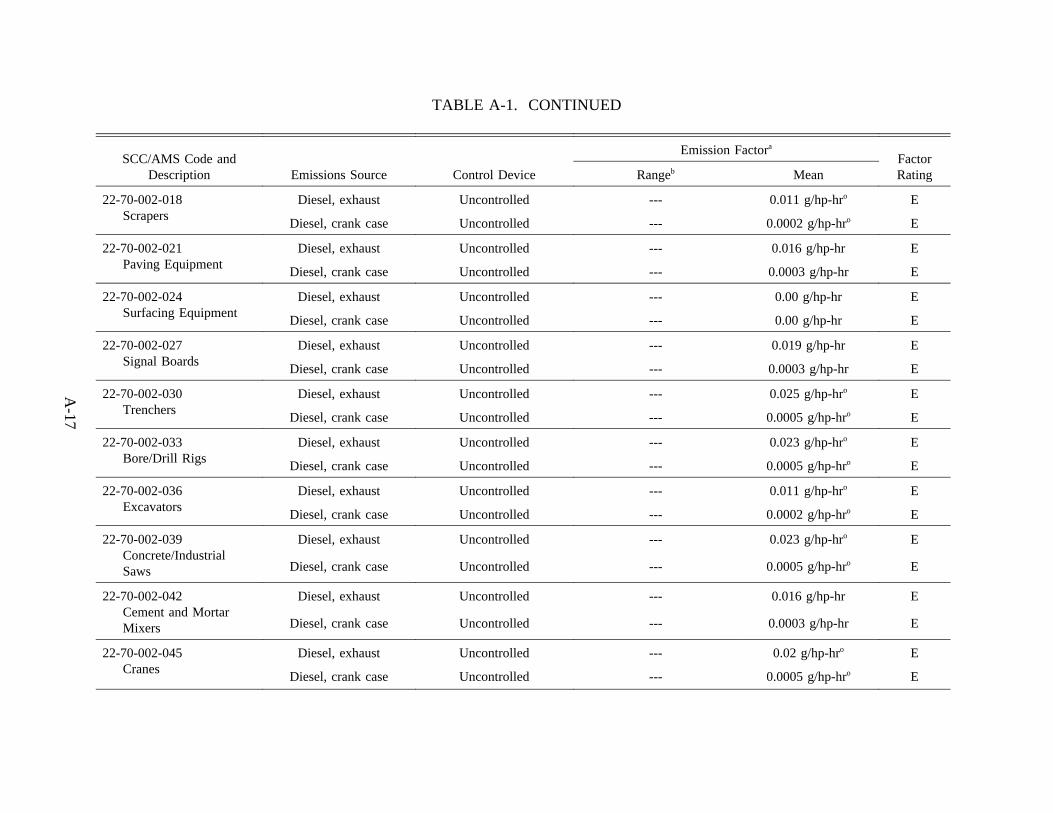
TABLE A-1. CONTINUED
A-17
SCC/AMS Code andDescription Emissions Source Control Device
Emission Factora
FactorRatingRangeb Mean
22-70-002-018Scrapers
Diesel, exhaust Uncontrolled --- 0.011 g/hp-hro E
Diesel, crank case Uncontrolled --- 0.0002 g/hp-hro E
22-70-002-021Paving Equipment
Diesel, exhaust Uncontrolled --- 0.016 g/hp-hr E
Diesel, crank case Uncontrolled --- 0.0003 g/hp-hr E
22-70-002-024Surfacing Equipment
Diesel, exhaust Uncontrolled --- 0.00 g/hp-hr E
Diesel, crank case Uncontrolled --- 0.00 g/hp-hr E
22-70-002-027Signal Boards
Diesel, exhaust Uncontrolled --- 0.019 g/hp-hr E
Diesel, crank case Uncontrolled --- 0.0003 g/hp-hr E
22-70-002-030Trenchers
Diesel, exhaust Uncontrolled --- 0.025 g/hp-hro E
Diesel, crank case Uncontrolled --- 0.0005 g/hp-hro E
22-70-002-033Bore/Drill Rigs
Diesel, exhaust Uncontrolled --- 0.023 g/hp-hro E
Diesel, crank case Uncontrolled --- 0.0005 g/hp-hro E
22-70-002-036Excavators
Diesel, exhaust Uncontrolled --- 0.011 g/hp-hro E
Diesel, crank case Uncontrolled --- 0.0002 g/hp-hro E
22-70-002-039Concrete/IndustrialSaws
Diesel, exhaust Uncontrolled --- 0.023 g/hp-hro E
Diesel, crank case Uncontrolled --- 0.0005 g/hp-hro E
22-70-002-042Cement and MortarMixers
Diesel, exhaust Uncontrolled --- 0.016 g/hp-hr E
Diesel, crank case Uncontrolled --- 0.0003 g/hp-hr E
22-70-002-045Cranes
Diesel, exhaust Uncontrolled --- 0.02 g/hp-hro E
Diesel, crank case Uncontrolled --- 0.0005 g/hp-hro E
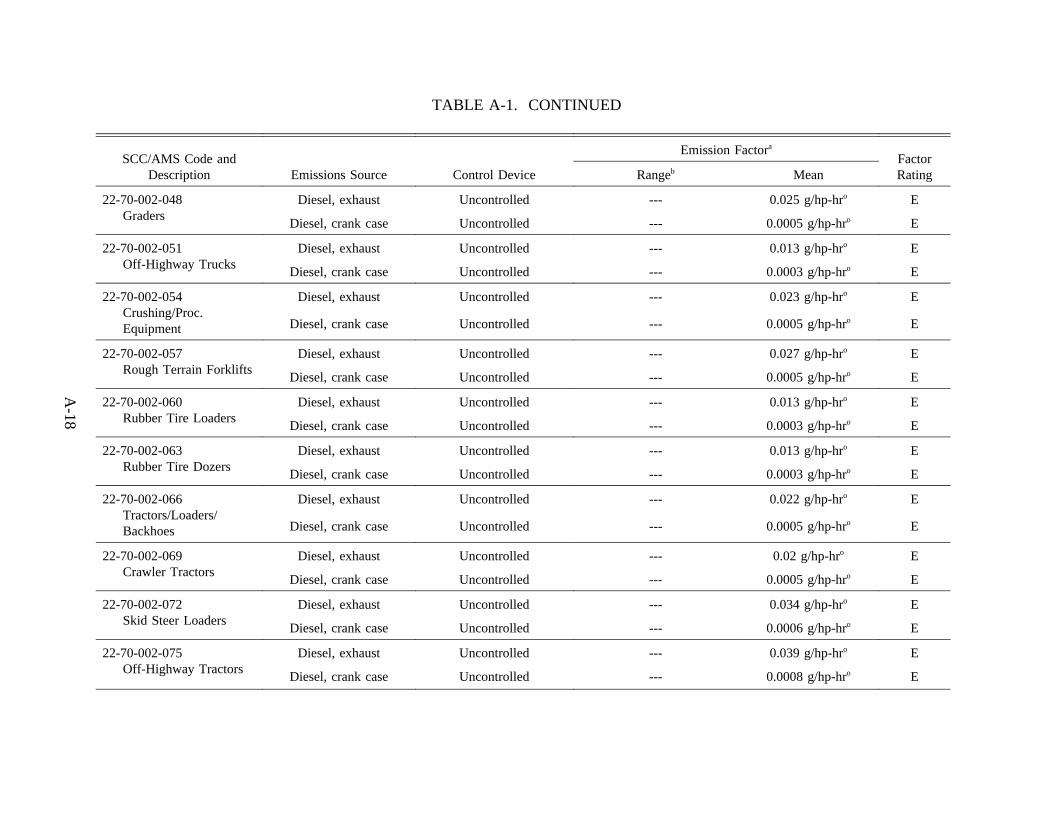
TABLE A-1. CONTINUED
A-18
SCC/AMS Code andDescription Emissions Source Control Device
Emission Factora
FactorRatingRangeb Mean
22-70-002-048Graders
Diesel, exhaust Uncontrolled --- 0.025 g/hp-hro E
Diesel, crank case Uncontrolled --- 0.0005 g/hp-hro E
22-70-002-051Off-Highway Trucks
Diesel, exhaust Uncontrolled --- 0.013 g/hp-hro E
Diesel, crank case Uncontrolled --- 0.0003 g/hp-hro E
22-70-002-054Crushing/Proc.Equipment
Diesel, exhaust Uncontrolled --- 0.023 g/hp-hro E
Diesel, crank case Uncontrolled --- 0.0005 g/hp-hro E
22-70-002-057Rough Terrain Forklifts
Diesel, exhaust Uncontrolled --- 0.027 g/hp-hro E
Diesel, crank case Uncontrolled --- 0.0005 g/hp-hro E
22-70-002-060Rubber Tire Loaders
Diesel, exhaust Uncontrolled --- 0.013 g/hp-hro E
Diesel, crank case Uncontrolled --- 0.0003 g/hp-hro E
22-70-002-063Rubber Tire Dozers
Diesel, exhaust Uncontrolled --- 0.013 g/hp-hro E
Diesel, crank case Uncontrolled --- 0.0003 g/hp-hro E
22-70-002-066Tractors/Loaders/Backhoes
Diesel, exhaust Uncontrolled --- 0.022 g/hp-hro E
Diesel, crank case Uncontrolled --- 0.0005 g/hp-hro E
22-70-002-069Crawler Tractors
Diesel, exhaust Uncontrolled --- 0.02 g/hp-hro E
Diesel, crank case Uncontrolled --- 0.0005 g/hp-hro E
22-70-002-072Skid Steer Loaders
Diesel, exhaust Uncontrolled --- 0.034 g/hp-hro E
Diesel, crank case Uncontrolled --- 0.0006 g/hp-hro E
22-70-002-075Off-Highway Tractors
Diesel, exhaust Uncontrolled --- 0.039 g/hp-hro E
Diesel, crank case Uncontrolled --- 0.0008 g/hp-hro E
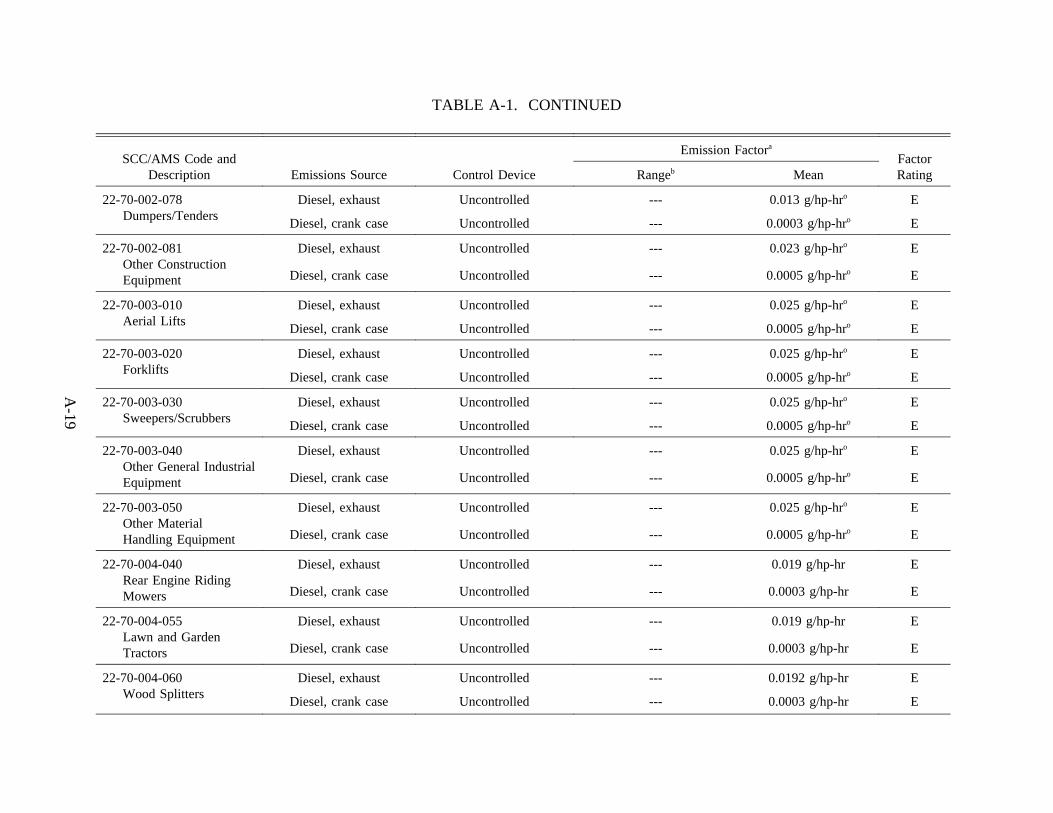
TABLE A-1. CONTINUED
A-19
SCC/AMS Code andDescription Emissions Source Control Device
Emission Factora
FactorRatingRangeb Mean
22-70-002-078Dumpers/Tenders
Diesel, exhaust Uncontrolled --- 0.013 g/hp-hro E
Diesel, crank case Uncontrolled --- 0.0003 g/hp-hro E
22-70-002-081Other ConstructionEquipment
Diesel, exhaust Uncontrolled --- 0.023 g/hp-hro E
Diesel, crank case Uncontrolled --- 0.0005 g/hp-hro E
22-70-003-010Aerial Lifts
Diesel, exhaust Uncontrolled --- 0.025 g/hp-hro E
Diesel, crank case Uncontrolled --- 0.0005 g/hp-hro E
22-70-003-020Forklifts
Diesel, exhaust Uncontrolled --- 0.025 g/hp-hro E
Diesel, crank case Uncontrolled --- 0.0005 g/hp-hro E
22-70-003-030Sweepers/Scrubbers
Diesel, exhaust Uncontrolled --- 0.025 g/hp-hro E
Diesel, crank case Uncontrolled --- 0.0005 g/hp-hro E
22-70-003-040Other General IndustrialEquipment
Diesel, exhaust Uncontrolled --- 0.025 g/hp-hro E
Diesel, crank case Uncontrolled --- 0.0005 g/hp-hro E
22-70-003-050Other MaterialHandling Equipment
Diesel, exhaust Uncontrolled --- 0.025 g/hp-hro E
Diesel, crank case Uncontrolled --- 0.0005 g/hp-hro E
22-70-004-040Rear Engine RidingMowers
Diesel, exhaust Uncontrolled --- 0.019 g/hp-hr E
Diesel, crank case Uncontrolled --- 0.0003 g/hp-hr E
22-70-004-055Lawn and GardenTractors
Diesel, exhaust Uncontrolled --- 0.019 g/hp-hr E
Diesel, crank case Uncontrolled --- 0.0003 g/hp-hr E
22-70-004-060Wood Splitters
Diesel, exhaust Uncontrolled --- 0.0192 g/hp-hr E
Diesel, crank case Uncontrolled --- 0.0003 g/hp-hr E
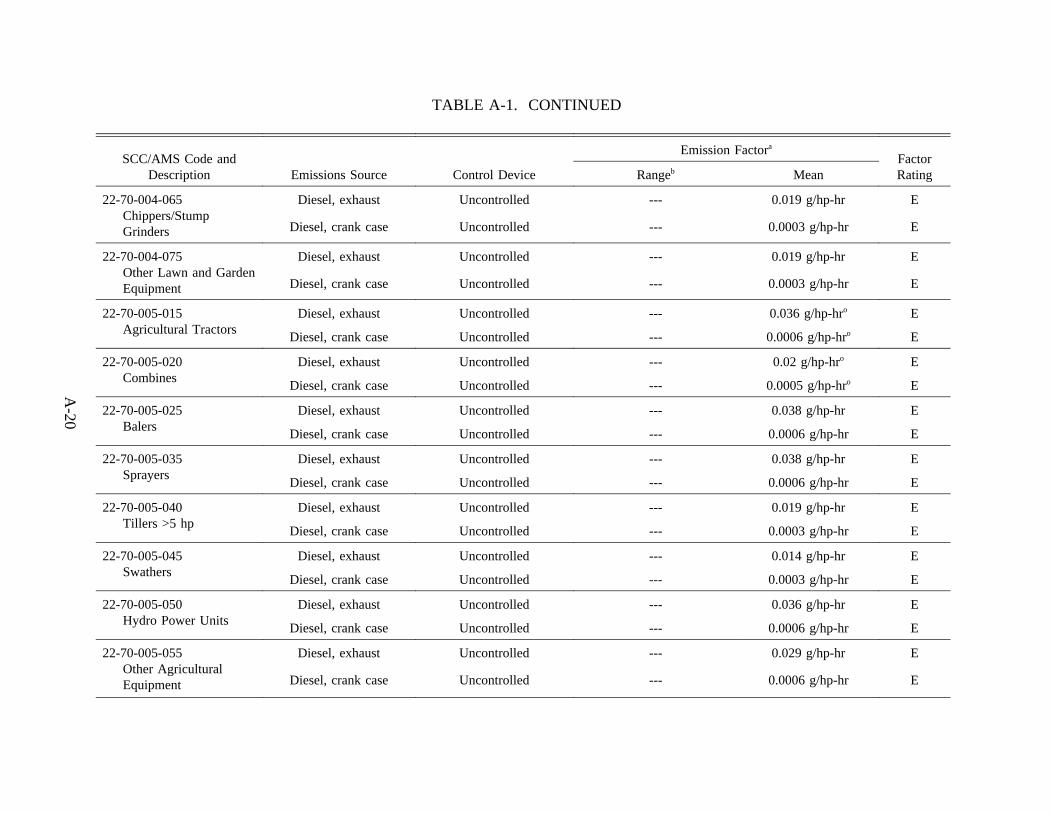
TABLE A-1. CONTINUED
A-20
SCC/AMS Code andDescription Emissions Source Control Device
Emission Factora
FactorRatingRangeb Mean
22-70-004-065Chippers/StumpGrinders
Diesel, exhaust Uncontrolled --- 0.019 g/hp-hr E
Diesel, crank case Uncontrolled --- 0.0003 g/hp-hr E
22-70-004-075Other Lawn and GardenEquipment
Diesel, exhaust Uncontrolled --- 0.019 g/hp-hr E
Diesel, crank case Uncontrolled --- 0.0003 g/hp-hr E
22-70-005-015Agricultural Tractors
Diesel, exhaust Uncontrolled --- 0.036 g/hp-hro E
Diesel, crank case Uncontrolled --- 0.0006 g/hp-hro E
22-70-005-020Combines
Diesel, exhaust Uncontrolled --- 0.02 g/hp-hro E
Diesel, crank case Uncontrolled --- 0.0005 g/hp-hro E
22-70-005-025Balers
Diesel, exhaust Uncontrolled --- 0.038 g/hp-hr E
Diesel, crank case Uncontrolled --- 0.0006 g/hp-hr E
22-70-005-035Sprayers
Diesel, exhaust Uncontrolled --- 0.038 g/hp-hr E
Diesel, crank case Uncontrolled --- 0.0006 g/hp-hr E
22-70-005-040Tillers >5 hp
Diesel, exhaust Uncontrolled --- 0.019 g/hp-hr E
Diesel, crank case Uncontrolled --- 0.0003 g/hp-hr E
22-70-005-045Swathers
Diesel, exhaust Uncontrolled --- 0.014 g/hp-hr E
Diesel, crank case Uncontrolled --- 0.0003 g/hp-hr E
22-70-005-050Hydro Power Units
Diesel, exhaust Uncontrolled --- 0.036 g/hp-hr E
Diesel, crank case Uncontrolled --- 0.0006 g/hp-hr E
22-70-005-055Other AgriculturalEquipment
Diesel, exhaust Uncontrolled --- 0.029 g/hp-hr E
Diesel, crank case Uncontrolled --- 0.0006 g/hp-hr E
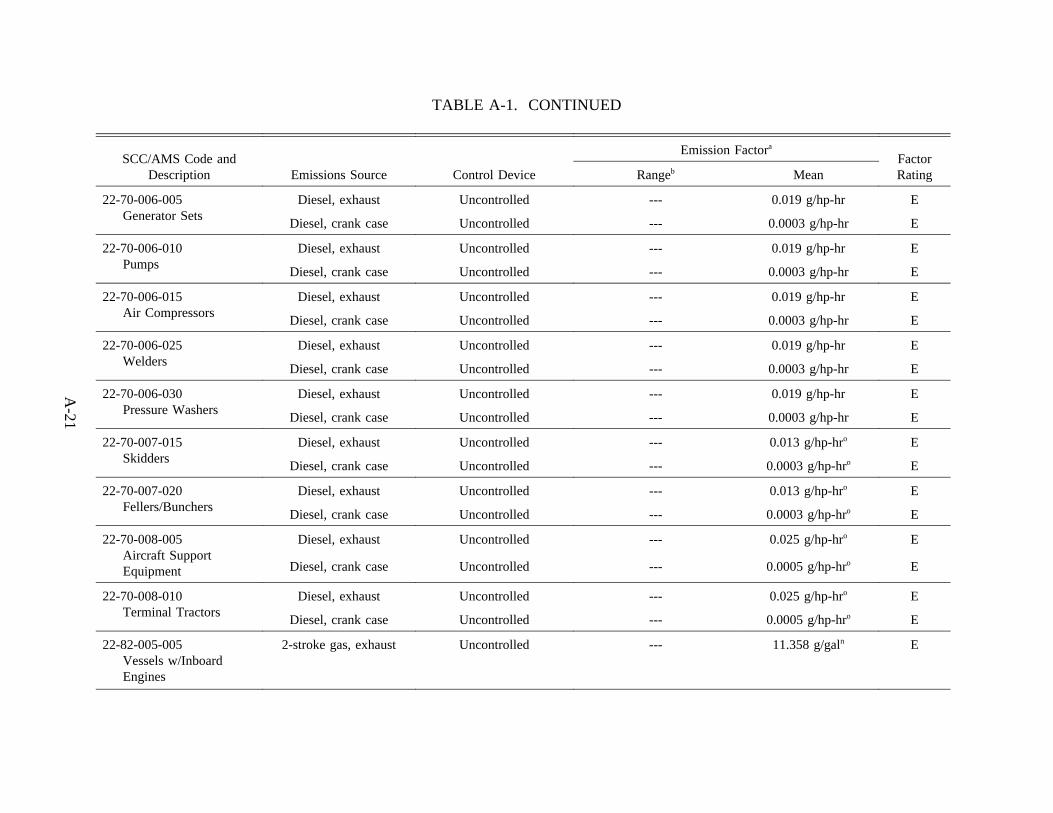
TABLE A-1. CONTINUED
A-21
SCC/AMS Code andDescription Emissions Source Control Device
Emission Factora
FactorRatingRangeb Mean
22-70-006-005Generator Sets
Diesel, exhaust Uncontrolled --- 0.019 g/hp-hr E
Diesel, crank case Uncontrolled --- 0.0003 g/hp-hr E
22-70-006-010Pumps
Diesel, exhaust Uncontrolled --- 0.019 g/hp-hr E
Diesel, crank case Uncontrolled --- 0.0003 g/hp-hr E
22-70-006-015Air Compressors
Diesel, exhaust Uncontrolled --- 0.019 g/hp-hr E
Diesel, crank case Uncontrolled --- 0.0003 g/hp-hr E
22-70-006-025Welders
Diesel, exhaust Uncontrolled --- 0.019 g/hp-hr E
Diesel, crank case Uncontrolled --- 0.0003 g/hp-hr E
22-70-006-030Pressure Washers
Diesel, exhaust Uncontrolled --- 0.019 g/hp-hr E
Diesel, crank case Uncontrolled --- 0.0003 g/hp-hr E
22-70-007-015Skidders
Diesel, exhaust Uncontrolled --- 0.013 g/hp-hro E
Diesel, crank case Uncontrolled --- 0.0003 g/hp-hro E
22-70-007-020Fellers/Bunchers
Diesel, exhaust Uncontrolled --- 0.013 g/hp-hro E
Diesel, crank case Uncontrolled --- 0.0003 g/hp-hro E
22-70-008-005Aircraft SupportEquipment
Diesel, exhaust Uncontrolled --- 0.025 g/hp-hro E
Diesel, crank case Uncontrolled --- 0.0005 g/hp-hro E
22-70-008-010Terminal Tractors
Diesel, exhaust Uncontrolled --- 0.025 g/hp-hro E
Diesel, crank case Uncontrolled --- 0.0005 g/hp-hro E
22-82-005-005Vessels w/InboardEngines
2-stroke gas, exhaust Uncontrolled --- 11.358 g/galn E
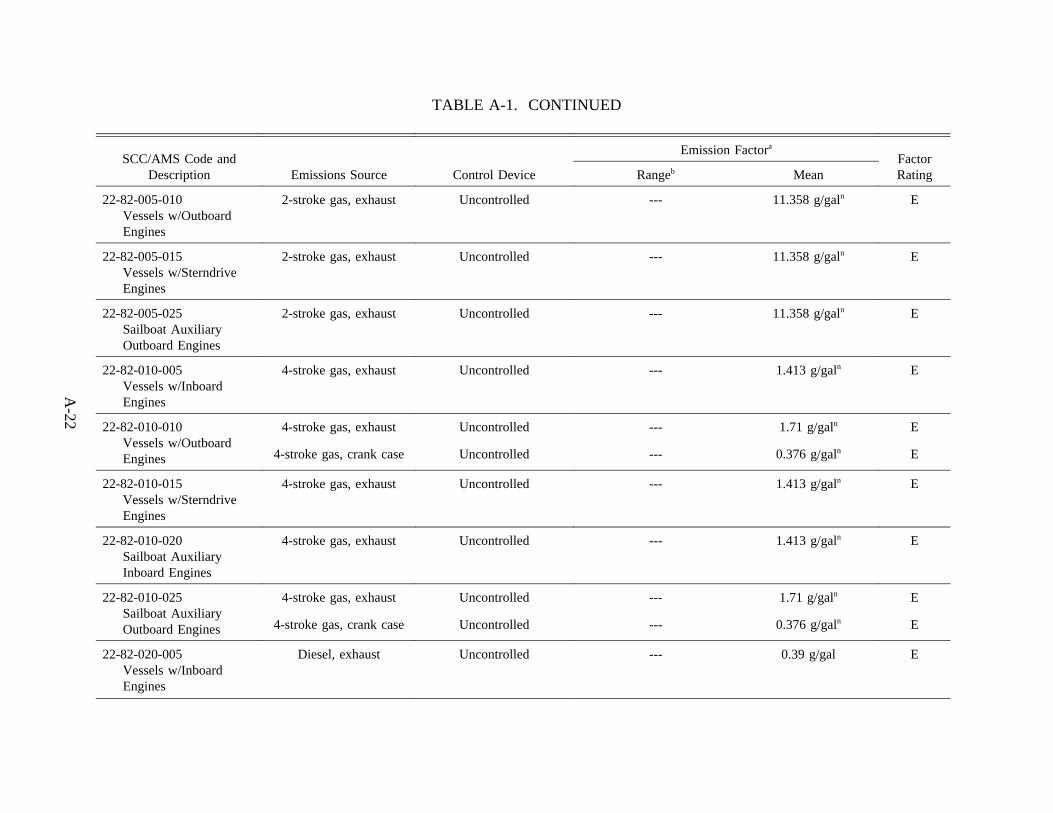
TABLE A-1. CONTINUED
A-22
SCC/AMS Code andDescription Emissions Source Control Device
Emission Factora
FactorRatingRangeb Mean
22-82-005-010Vessels w/OutboardEngines
2-stroke gas, exhaust Uncontrolled --- 11.358 g/galn E
22-82-005-015Vessels w/SterndriveEngines
2-stroke gas, exhaust Uncontrolled --- 11.358 g/galn E
22-82-005-025Sailboat AuxiliaryOutboard Engines
2-stroke gas, exhaust Uncontrolled --- 11.358 g/galn E
22-82-010-005Vessels w/InboardEngines
4-stroke gas, exhaust Uncontrolled --- 1.413 g/galn E
22-82-010-010Vessels w/OutboardEngines
4-stroke gas, exhaust Uncontrolled --- 1.71 g/galn E
4-stroke gas, crank case Uncontrolled --- 0.376 g/galn E
22-82-010-015Vessels w/SterndriveEngines
4-stroke gas, exhaust Uncontrolled --- 1.413 g/galn E
22-82-010-020Sailboat AuxiliaryInboard Engines
4-stroke gas, exhaust Uncontrolled --- 1.413 g/galn E
22-82-010-025Sailboat AuxiliaryOutboard Engines
4-stroke gas, exhaust Uncontrolled --- 1.71 g/galn E
4-stroke gas, crank case Uncontrolled --- 0.376 g/galn E
22-82-020-005Vessels w/InboardEngines
Diesel, exhaust Uncontrolled --- 0.39 g/gal E
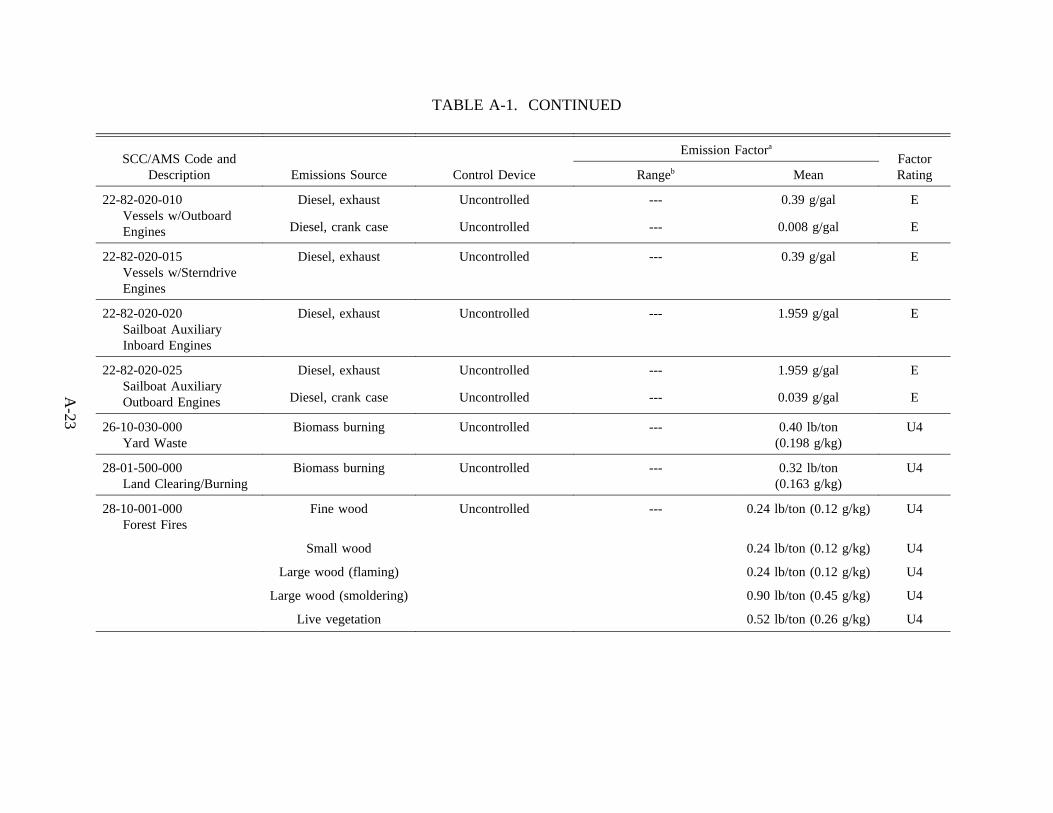
TABLE A-1. CONTINUED
A-23
SCC/AMS Code andDescription Emissions Source Control Device
Emission Factora
FactorRatingRangeb Mean
22-82-020-010Vessels w/OutboardEngines
Diesel, exhaust Uncontrolled --- 0.39 g/gal E
Diesel, crank case Uncontrolled --- 0.008 g/gal E
22-82-020-015Vessels w/SterndriveEngines
Diesel, exhaust Uncontrolled --- 0.39 g/gal E
22-82-020-020Sailboat AuxiliaryInboard Engines
Diesel, exhaust Uncontrolled --- 1.959 g/gal E
22-82-020-025Sailboat AuxiliaryOutboard Engines
Diesel, exhaust Uncontrolled --- 1.959 g/gal E
Diesel, crank case Uncontrolled --- 0.039 g/gal E
26-10-030-000Yard Waste
Biomass burning Uncontrolled --- 0.40 lb/ton(0.198 g/kg)
U4
28-01-500-000Land Clearing/Burning
Biomass burning Uncontrolled --- 0.32 lb/ton(0.163 g/kg)
U4
28-10-001-000Forest Fires
Fine wood Uncontrolled --- 0.24 lb/ton (0.12 g/kg) U4
Small wood 0.24 lb/ton (0.12 g/kg) U4
Large wood (flaming) 0.24 lb/ton (0.12 g/kg) U4
Large wood (smoldering) 0.90 lb/ton (0.45 g/kg) U4
Live vegetation 0.52 lb/ton (0.26 g/kg) U4
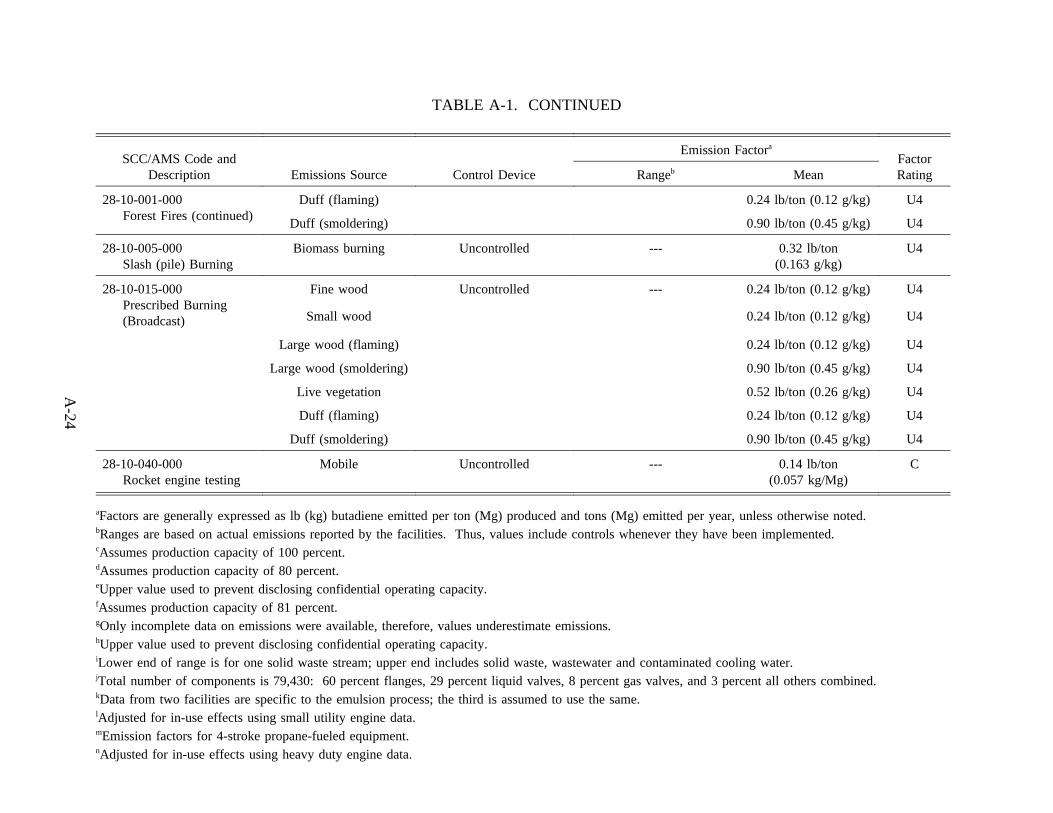
TABLE A-1. CONTINUED
A-24
SCC/AMS Code andDescription Emissions Source Control Device
Emission Factora
FactorRatingRangeb Mean
28-10-001-000Forest Fires (continued)
Duff (flaming) 0.24 lb/ton (0.12 g/kg) U4
Duff (smoldering) 0.90 lb/ton (0.45 g/kg) U4
28-10-005-000Slash (pile) Burning
Biomass burning Uncontrolled --- 0.32 lb/ton(0.163 g/kg)
U4
28-10-015-000Prescribed Burning(Broadcast)
Fine wood Uncontrolled --- 0.24 lb/ton (0.12 g/kg) U4
Small wood 0.24 lb/ton (0.12 g/kg) U4
Large wood (flaming) 0.24 lb/ton (0.12 g/kg) U4
Large wood (smoldering) 0.90 lb/ton (0.45 g/kg) U4
Live vegetation 0.52 lb/ton (0.26 g/kg) U4
Duff (flaming) 0.24 lb/ton (0.12 g/kg) U4
Duff (smoldering) 0.90 lb/ton (0.45 g/kg) U4
28-10-040-000Rocket engine testing
Mobile Uncontrolled --- 0.14 lb/ton(0.057 kg/Mg)
C
aFactors are generally expressed as lb (kg) butadiene emitted per ton (Mg) produced and tons (Mg) emitted per year, unless otherwise noted.bRanges are based on actual emissions reported by the facilities. Thus, values include controls whenever they have been implemented.cAssumes production capacity of 100 percent.dAssumes production capacity of 80 percent.eUpper value used to prevent disclosing confidential operating capacity.fAssumes production capacity of 81 percent.gOnly incomplete data on emissions were available, therefore, values underestimate emissions.hUpper value used to prevent disclosing confidential operating capacity.iLower end of range is for one solid waste stream; upper end includes solid waste, wastewater and contaminated cooling water.jTotal number of components is 79,430: 60 percent flanges, 29 percent liquid valves, 8 percent gas valves, and 3 percent all others combined.kData from two facilities are specific to the emulsion process; the third is assumed to use the same.lAdjusted for in-use effects using small utility engine data.mEmission factors for 4-stroke propane-fueled equipment.nAdjusted for in-use effects using heavy duty engine data.
TABLE A-1. CONTINUED
A-25
oExhaust HC adjusted for transient speed and/or transient load operation.
"---" means no data available.
APPENDIX B
ESTIMATING METHODS FOR NATIONAL BUTADIENE EMISSION SOURCES
EMISSIONS FROM ON-ROAD MOBILE SOURCES
Basis for Calculation
To estimate national butadiene emissions for this report, the butadiene emission factor
presented in the MVATS1 was used with VMT data from the Federal Highway
Administration’sHighway Statistics 1992.2 This approach is similar to the one used to
estimate emissions from on-road mobile sources for State Implementation Plan (SIP)
inventories (Procedures for Emission Inventory Preparation Volume IV: Mobile Sources,
19923). Table B-1 summarizes 1992 VMT data and butadiene emissions estimates for each
State using the OMS’s composite emission factor of 0.023 g of butadiene/mile.
Example Calculation
Annual Emissions = (0.023 g butadiene/VMT) x (4.5762x10¹⁰ VMT) xfor Alabama (1.10231136 ton/Mg)
= 1,161 ton of butadiene
B-1
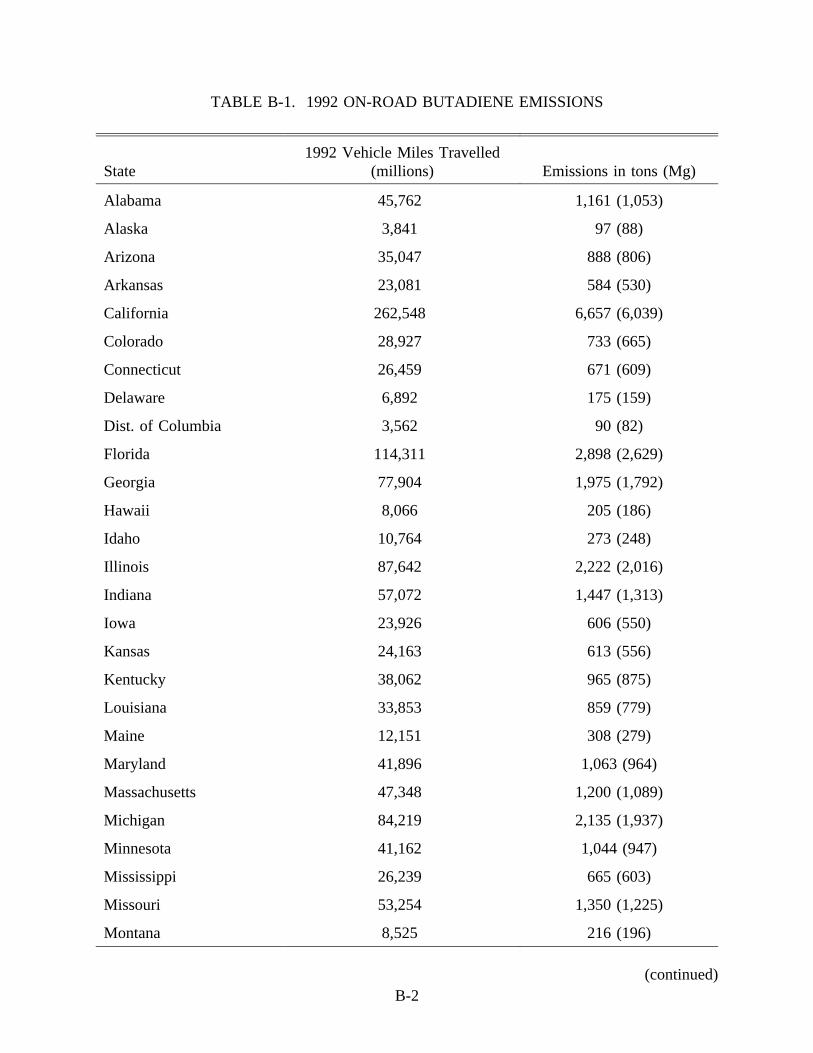
TABLE B-1. 1992 ON-ROAD BUTADIENE EMISSIONS
State1992 Vehicle Miles Travelled
(millions) Emissions in tons (Mg)
Alabama 45,762 1,161 (1,053)
Alaska 3,841 97 (88)
Arizona 35,047 888 (806)
Arkansas 23,081 584 (530)
California 262,548 6,657 (6,039)
Colorado 28,927 733 (665)
Connecticut 26,459 671 (609)
Delaware 6,892 175 (159)
Dist. of Columbia 3,562 90 (82)
Florida 114,311 2,898 (2,629)
Georgia 77,904 1,975 (1,792)
Hawaii 8,066 205 (186)
Idaho 10,764 273 (248)
Illinois 87,642 2,222 (2,016)
Indiana 57,072 1,447 (1,313)
Iowa 23,926 606 (550)
Kansas 24,163 613 (556)
Kentucky 38,062 965 (875)
Louisiana 33,853 859 (779)
Maine 12,151 308 (279)
Maryland 41,896 1,063 (964)
Massachusetts 47,348 1,200 (1,089)
Michigan 84,219 2,135 (1,937)
Minnesota 41,162 1,044 (947)
Mississippi 26,239 665 (603)
Missouri 53,254 1,350 (1,225)
Montana 8,525 216 (196)
(continued)B-2
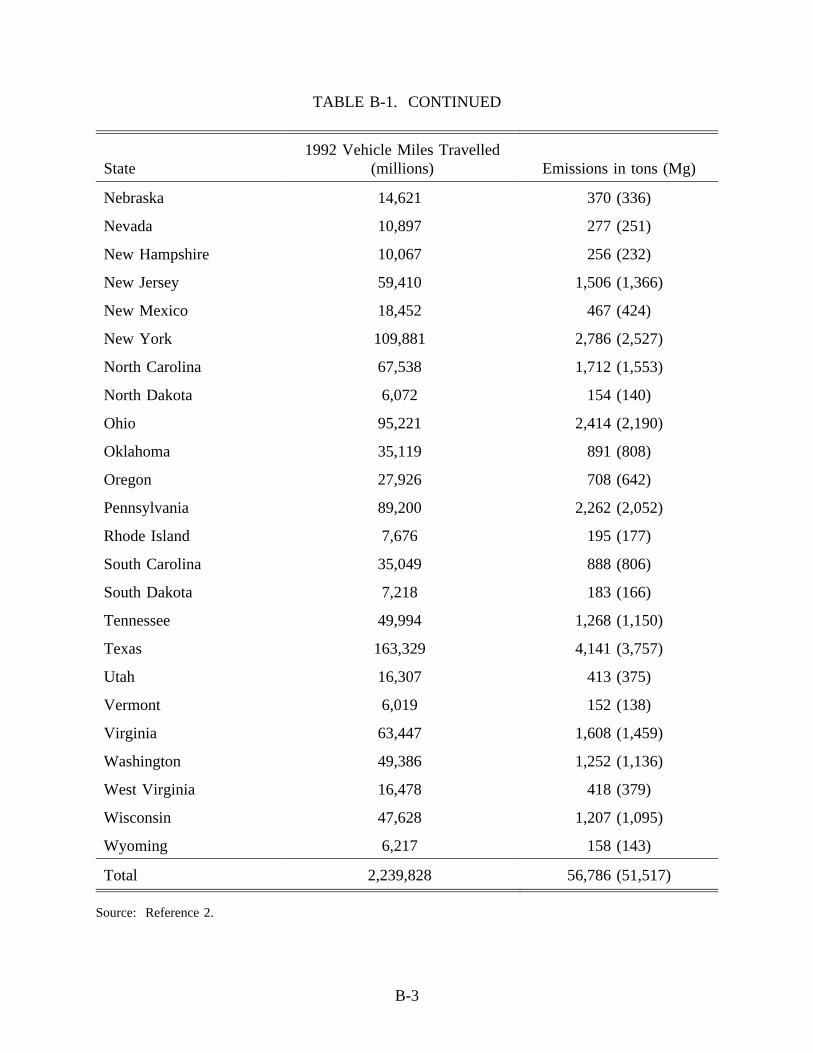
TABLE B-1. CONTINUED
State1992 Vehicle Miles Travelled
(millions) Emissions in tons (Mg)
Nebraska 14,621 370 (336)
Nevada 10,897 277 (251)
New Hampshire 10,067 256 (232)
New Jersey 59,410 1,506 (1,366)
New Mexico 18,452 467 (424)
New York 109,881 2,786 (2,527)
North Carolina 67,538 1,712 (1,553)
North Dakota 6,072 154 (140)
Ohio 95,221 2,414 (2,190)
Oklahoma 35,119 891 (808)
Oregon 27,926 708 (642)
Pennsylvania 89,200 2,262 (2,052)
Rhode Island 7,676 195 (177)
South Carolina 35,049 888 (806)
South Dakota 7,218 183 (166)
Tennessee 49,994 1,268 (1,150)
Texas 163,329 4,141 (3,757)
Utah 16,307 413 (375)
Vermont 6,019 152 (138)
Virginia 63,447 1,608 (1,459)
Washington 49,386 1,252 (1,136)
West Virginia 16,478 418 (379)
Wisconsin 47,628 1,207 (1,095)
Wyoming 6,217 158 (143)
Total 2,239,828 56,786 (51,517)
Source: Reference 2.
B-3
EMISSIONS FROM NON-ROAD MOBILE SOURCES
Basis for Calculation:
National emissions for butadiene were taken directly from the NEVES report.4 "In use"
estimates for butadiene were taken from two inventories: A, which is an EPA-developed
inventory; and B, which is an inventory prepared by trade associations. The values were
averaged to calculate the national emission estimates.
Calculation:
Butadiene estimate for the:
A inventory - 47,816 tons/year
B inventory - 35,949 tons/year
National AnnualEmissions = 47,816 35,949
2= 41,883 tons/year
B-4
EMISSIONS FROM AIRCRAFT
Basis for Calculation
To estimate national emissions from aircraft, hydrocarbon emission indices for representative
fleet mixes are provided in the emissions inventory guidance documentProcedures for
Emissions Inventory Preparation; Volume IV: Mobile Sources.5 The hydrocarbon emission
indices are 0.394 pounds per LTO (0.179 kg per LTO) for general aviation and 1.234 pounds
per LTO (0.560 kg per LTO) for air taxis.
The butadiene fraction of the hydrocarbon total can be estimated by using the percent weight
factors from SPECIATE.6 It is assumed in this report that half of the general aviation fleet
is equipped with piston engines and the other half is equipped with turbine engines, such that
these two emission factors are averaged. Because air taxis have larger engines and more of
the fleet is equipped with turboprop and turbojet engines than is the general aviation fleet, the
percent weight factor is somewhat different from the general aviation emission factor. To
approximate a butadiene percent weight factor for air taxis, the commercial and general
aviation (piston) percent weight factors were averaged.
Because there are no aggregated hydrocarbon emission indices for commercial or military
aircraft, national emissions estimates for butadiene for these aircraft categories cannot be
estimated without considerable detailed activity data (i.e., fleet mix and associated LTOs).
To estimate national butadiene emissions for general aviation and air taxis, FAA air traffic
activity data7 (LTO) were applied to the hydrocarbon emission indices to estimate total
national hydrocarbon emissions. The appropriate weight percent butadiene factor were
applied to the total national hydrocarbon emission values, yielding the national butadiene
emission estimate for general aviation and air taxis. These emission estimates are presented
in Table 6-6. Note that in this approach emissions were estimated for aircraft airport activity
B-5
EMISSIONS FROM AIRCRAFT, CONTINUED
only; in-flight emissions cannot be calculated without considerable detailed data. In addition,
this estimate does not include any aircraft activity occurring at non-FAA control towered
airports.
Calculation - General Aviation
General Aviation = (0.394 lbs hydrocarbon/LTO) x (ton/2,000 lbs) xEmissions (19,584,898 LTOs in 1993) x (1.57 weight % butadiene)
= 61 tons
Calculation - Air Taxis
Air Taxi Emissions = (1.234 lbs hydrocarbon/LTO) x (ton/2000 lbs) x (4,418,836 LTOs in1993) x (1.69 weight % butadiene)
= 46 tons
Calculation - Total
National Butadiene = 61 ton/yr of butadiene + 46 ton/yr of butadieneEmissions Estimate
= 107 ton/yr of butadiene
B-6
EMISSIONS FROM BUTADIENE PRODUCTION
Basis for Calculation
The 1992 TRI data were used as an estimate of national emissions from butadiene production
facilities.8 The TRI butadiene values (in lb/yr) reported by the 11 butadiene production
facilities listed in Table 4-1 of this document were summed to give an estimate of the
butadiene emissions from production facilities nationwide. The estimated national emissions
of butadiene from butadiene production facilities are 191 tons/yr (163 Mg/yr).
B-7
EMISSIONS FROM MAJOR BUTADIENE USERS
Basis for Calculation
The 1992 TRI data were used to estimate national emissions from major butadiene users.8
All facilities with their primary SIC Codes reported as 28XX, industries within the Chemicals
and Allied Products classification, were assumed to represent major users of butadiene. Some
of the miscellaneous butadiene uses described in Section 7.0 may also be included, but
because differentiating would be difficult and the contribution to national emissions from the
miscellaneous uses is considered to be small, extracting these from the TRI data was not
done.
The facility SIC Codes reported included the following:
28 Chemicals and allied products2812 Alkalies and chlorine2819 Industrial inorganic chemicals, nec2821 Plastics materials, synthetic resins, and nonvulcanizable elastomers2822 Synthetic rubber (vulcanizable elastomers)2865 Cyclic organic crudes and intermediates, and organic dyes and pigments2869 Industrial organic chemicals, nec2879 Pesticides and agricultural chemicals, nec2891 Adhesives and sealants2899 Chemicals and chemical preparations, nec
To avoid double-counting butadiene production facility emissions (butadiene production
facilities also fall under the 2869 SIC Code), the total for the 11 facilities (191 tons/yr (163
Mg/yr)) was subtracted from the total for the 28XX SIC Codes (1,596 tons/yr (1,448 Mg/yr)).
The estimated national emissions of butadiene from major butadiene users are 1,405 tons/yr
(1,275 Mg/yr).
B-8
EMISSIONS FROM MISCELLANEOUS OTHER BUTADIENE SOURCES
Basis for Calculation
The 1992 TRI data also included other source categories that were not otherwise identified as
butadiene sources during the revision of this document.8 These facilities fall into one of the
following SIC Codes. There were two facilities for which no SIC Code was reported, and
one facility used an SIC Code, 2641, for which the 1987 Standard Industrial Classification
Manual9 has no description.
2046 Wet corn milling2369 Girl’s, children’s, and infant’s outerwear, nec2621 Paper mills3312 Steel works, blast furnaces (including coke ovens), and rolling mills3579 Office machines, nec8731 Commercial physical and biological research
The butadiene emissions reported by each of these facilities were summed to total national
emissions of butadiene from miscellaneous other butadiene sources of 106 tons/yr (96 Mg/yr).
B-9
EMISSIONS FROM PETROLEUM REFINING
Basis for Calculation
While the Petroleum Refineries NESHAP provides emissions estimates for VOCs and total
HAPs at 190 facilities, emission estimates are not available for specific HAPs, such as
butadiene.10 Therefore, 1992 TRI data were used as estimates of national emissions from
petroleum refining.8 Petroleum refining is represented by SIC Code 2911. Based on the TRI
data, the estimated national emissions of butadiene from petroleum refining are 219 tons/yr
(241 Mg/yr).
B-10
EMISSIONS FROM SECONDARY LEAD SMELTING
Basis for Calculation
As part of the background information for developing the proposed and final NESHAP for the
secondary lead smelting industry, emissions data were collected for 1,3-butadiene and other
species of organic HAP during an EPA-sponsored test program at three representative
smelters.11 These data were used to calculate total controlled organic HAP emissions for
each of the 23 secondary lead smelters known to exist in the United States.
The emission estimates assumed that organic HAP emissions from each smelter were
controlled to the level required by the final NESHAP. Total estimated organic HAP
emissions from this industry under the final NESHAP are 552 ton/yr (508 Mg/yr). The final
NESHAP will reduce organic HAP emissions 71 percent from a 1990 baseline of 1,905 ton/yr
(1,728 Mg/yr).
The emissions test data were also used to estimate a ratio of 1,3-butadiene to total organic
HAP emissions for each of the three smelters for which test data were available:
ton 1,3-butadiene/ton organic HAP
East Penn Manufacturing Company: 0.337
Schuylkill Metals: 0.252
Tejas Resources: 0.131
Average: 0.240
The data from East Penn and Schuylkill are from blast furnaces and the data from Tejas are
from a rotary furnace. The difference in ratios cannot be explained by any of the parameters
that were monitored during the testing program or any of the differences in
B-11
EMISSIONS FROM SECONDARY LEAD SMELTING, CONTINUED
feed stocks used at these smelters; all three smelters used essentially the same feed stocks.
Example Calculation
National Emissions = (0.240 tons of 1,3-butadiene/ton organic HAP) xEstimate (560 tons organic HAP/yr)
= 134.4 ton/yr (121.9 Mg/yr)
B-12
EMISSIONS FROM OPEN BURNING OF BIOMASS
Basis for Calculation
Emission factors for butadiene emissions from forest fires and prescribed burning were
obtained from a 1993 Office of Research and Development project on Puget Sound and an
inventory prepared by Darold Ward and Janice Peterson for the USDA Forest Service.12,13
The emission factors vary according to fuel type (i.e., flaming versus smoldering wood or
duff or live vegetation) and are presented in Section 7.0 of this document.
A national activity level for biomass burning (i.e., prescribed burning and forest fires) was
obtained from a final report for the national emission inventories compiled for
Section 112(c)(6) pollutants, prepared by Radian Corporation for the EPA.14 The total
biomass burning in prescribed burning was documented as 42 million tons, and the total
biomass burned in forest fires was documented as 53 million tons.14 Because no information
was available to characterize, on a national basis, the percentages of the specific types of
fuels burned in forest fires and prescribed burning, certain assumptions were made in
calculating national emissions from the emission factors. The national estimate is calculated
based on flaming wood and duff and smoldering wood and duff. It was assumed that, on a
national basis, during prescribed burns and forest fires 75 percent of the biomass (wood and
duff) is burned under flaming conditions and 25 percent of the biomass (wood and duff) is
burned under smoldering conditions.
The following calculations were carried out to determine national butadiene emissions
from forest fires. However, the national emissions from prescribed burning were obtained
from a prescribed fire emissions inventory developed from Ward and Peterson’s
methodology.13
B-13
EMISSIONS FROM OPEN BURNING OF BIOMASS, CONTINUED
Example Calculation:
Annual = emissions from forest firesNational Emissions = [(1.2 x 10⁻⁴ tons/ton flaming wood and duff burned) x
(39,750,000 tons flaming wood and duff burned in forest fires/yr)] +
[(4.5 x 10⁻⁴ tons/ton smoldering wood and duff burned) x(13,250,000 tons smoldering wood and duff burned in forestfires/yr)]
= 10,733 tons/yr (9,737 Mg/yr)
Annual = emissions from prescribed burningNational Emissions = 9,198 tons/yr (8,345 Mg/yr)
Annual = emissions from biomass burningNational Emissions = 10,733 tons/yr + 9,198 tons/yr
= 19,931 tons/yr (18,082 Mg/yr)
B-14
REFERENCES
1. U.S. EPA. Motor Vehicle-Related Air Toxics Study. Section 7.0 - 1,3-Butadiene.EPA-420-R-93-005. Ann Arbor, Michigan: U.S. Environmental Protection Agency,Office of Mobile Sources, 1993. pp. 7-1 to 7-7.
2. U.S. Department of Transportation.Highway Statistics. Washington, D.C.: FederalHighway Administration, 1993. p. 208
3. U.S. EPA. Mobile Sources Procedures for Emission Inventory Preparation, Volume IV:Mobile Sources. EPA-450/4-81-026d (Revised). Ann Arbor, Michigan:U.S. Environmental Protection Agency, Office of Mobile Sources, 1992. p. 176.
4. U.S. EPA. Non-Road Engine and Vehicle Emission Study. 21A-2001. Washington,D.C.: U.S. Environmental Protection Agency, Office of Air and Radiation, 1991.pp. M-53, O-53.
5. U.S. EPA. Mobile Sources Procedures for Emission Inventory Preparation, Volume IV:Mobile Sources. Section 5.0 - Emissions from Aircraft. EPA-450/4-81-026d (Revised).Ann Arbor, Michigan: U.S. Environmental Protection Agency, Office of MobileSources, 1992. p. 176.
6. U.S. EPA. Volatile Organic Compound/Particulate Matter Speciation Data System(SPECIATE). Version 1.5. Research Triangle Park, North Carolina: U.S. EnvironmentalProtection Agency, Office of Air Quality Planning and Standards, October 1992.
7. Federal Aviation Administration.Air Traffic Activity. Office of Management Systems,1993. Table 1-7.
8. U.S. EPA. 1992 Toxic Chemical Release Inventory (SARA 313) Database. Washington,D.C.: U.S. Environmental Protection Agency, Office of Toxic Substances, 1993.
9. U.S. Executive Office of the President.Standard Industrial Classification Manual.Washington, D.C.: Government Printing Office, Office of Management and Budget,1987.
10. Zarate, M. (Radian Corporation). Memorandum to J. Durham (U.S. EnvironmentalProtection Agency) concerning "Process Vent Information Collection Request DataQuality Analysis," August 25, 1993.
11. U.S. EPA. Final Background Information Document for Secondary Lead NESHAP.EPA-450/R-94-024a. Research Triangle Park, North Carolina: U.S. EnvironmentalProtection Agency, Office of Air Quality Planning and Standards, June 1994.
B-15
12. Campbell, D.L. and J. Mangino (Radian Corporation). "Evaluation and Improvement ofthe Puget Sound Toxic Air Contaminants Emissions Inventory." Technical Note. EPAContract No. 68-D1-0031. Washington, D.C.: U.S. Environmental Protection Agency,Office of Research and Development, May 1994.
13. Peterson, J. and D. Ward.An Inventory of Particulate Matter and Air Toxic Emissionsfrom Prescribed Fires in the United States for 1989. U.S. Department of Agriculture,Forest Service, 1989. pp. 1-16.
14. Radian Corporation. Draft final memorandum to U.S. Environmental Protection Agencyconcerning Inventory Plan for Section 112(c)(6) Pollutants. September 23, 1993.
B-16
APPENDIX C
FACILITY-SPECIFIC EMISSIONS DATA FROM EPA SECTION 114 RESPONSES
C-1
APPENDIX C
FACILITY-SPECIFIC EMISSIONS DATA
FROM EPA SECTION 114 RESPONSES
Tables C-1 through C-25 contain the capacity and emissions data that formed the basis
for the emission factor ranges and ranges of annual emissions presented in the main text.
Capacity data were compiled from responses to Section 114 requests or literature values if
available. Most of the emissions data are from responses to Section 114 requests in 1984.
Inconsistencies with the text are due to facility changes in ownership and/or in the production
process since 1984. The emission values, therefore, may no longer reflect the current status of
the industry. Furthermore, reported emissions were not supplied for every emission point
identified, nor were all emission points identified by each facility.
Emission factors for each emission point were calculated by dividing the reported
emissions by the facility's capacity, modified to reflect actual production. In instances where the
use of facility production capacity in an emission factor might reveal company-confidential
information, the emissions data were not used to calculate the ranges. In the absence of facility-
reported capacity values, literature values may have been used.
Equipment leak emission estimates were derived from 1984 data supplied by facilities in
Section 114 responses. Using the procedure described in Appendix D and average CMA
emission factors, ranges of annual emissions were calculated. Equipment count data for the
miscellaneous category were unavailable, therefore estimates are based on the SOCMI emission
factors as reported in the summary memoranda.
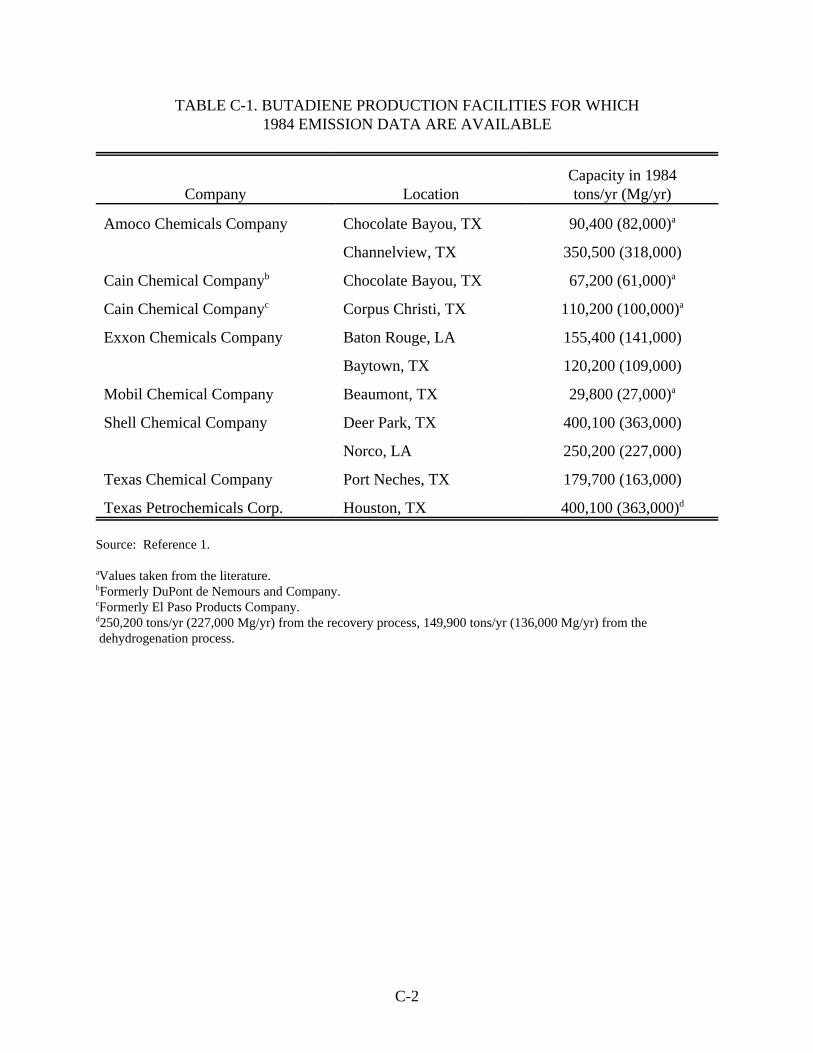
C-2
TABLE C-1. BUTADIENE PRODUCTION FACILITIES FOR WHICH1984 EMISSION DATA ARE AVAILABLE
Company Location tons/yr (Mg/yr)Capacity in 1984
Amoco Chemicals Company Chocolate Bayou, TX 90,400 (82,000)a
Channelview, TX 350,500 (318,000)
Cain Chemical Company Chocolate Bayou, TX 67,200 (61,000)b a
Cain Chemical Company Corpus Christi, TX 110,200 (100,000)c a
Exxon Chemicals Company Baton Rouge, LA 155,400 (141,000)
Baytown, TX 120,200 (109,000)
Mobil Chemical Company Beaumont, TX 29,800 (27,000)a
Shell Chemical Company Deer Park, TX 400,100 (363,000)
Norco, LA 250,200 (227,000)
Texas Chemical Company Port Neches, TX 179,700 (163,000)
Texas Petrochemicals Corp. Houston, TX 400,100 (363,000)d
Source: Reference 1.
Values taken from the literature.a
Formerly DuPont de Nemours and Company.b
Formerly El Paso Products Company.c
250,200 tons/yr (227,000 Mg/yr) from the recovery process, 149,900 tons/yr (136,000 Mg/yr) from thed
dehydrogenation process.
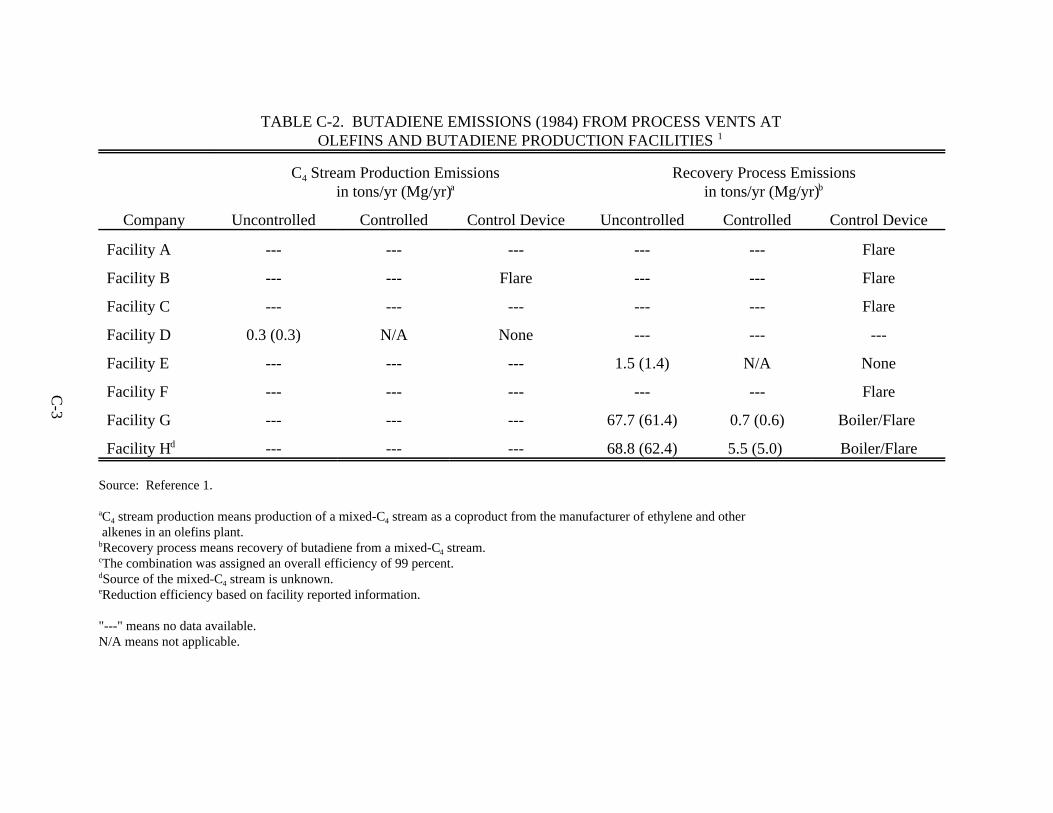
C-3
TABLE C-2. BUTADIENE EMISSIONS (1984) FROM PROCESS VENTS ATOLEFINS AND BUTADIENE PRODUCTION FACILITIES 1
C Stream Production Emissions4
in tons/yr (Mg/yr)aRecovery Process Emissions
in tons/yr (Mg/yr)b
Company Uncontrolled Controlled Control Device Uncontrolled Controlled Control Device
Facility A --- --- --- --- --- Flare
Facility B --- --- Flare --- --- Flare
Facility C --- --- --- --- --- Flare
Facility D 0.3 (0.3) N/A None --- --- ---
Facility E --- --- --- 1.5 (1.4) N/A None
Facility F --- --- --- --- --- Flare
Facility G --- --- --- 67.7 (61.4) 0.7 (0.6) Boiler/Flare
Facility Hd --- --- --- 68.8 (62.4) 5.5 (5.0) Boiler/Flare
Source: Reference 1.
C stream production means production of a mixed-C stream as a coproduct from the manufacturer of ethylene and othera4 4
alkenes in an olefins plant.Recovery process means recovery of butadiene from a mixed-C stream.b
4
The combination was assigned an overall efficiency of 99 percent.c
Source of the mixed-C stream is unknown.d4
Reduction efficiency based on facility reported information.e
"---" means no data available.N/A means not applicable.
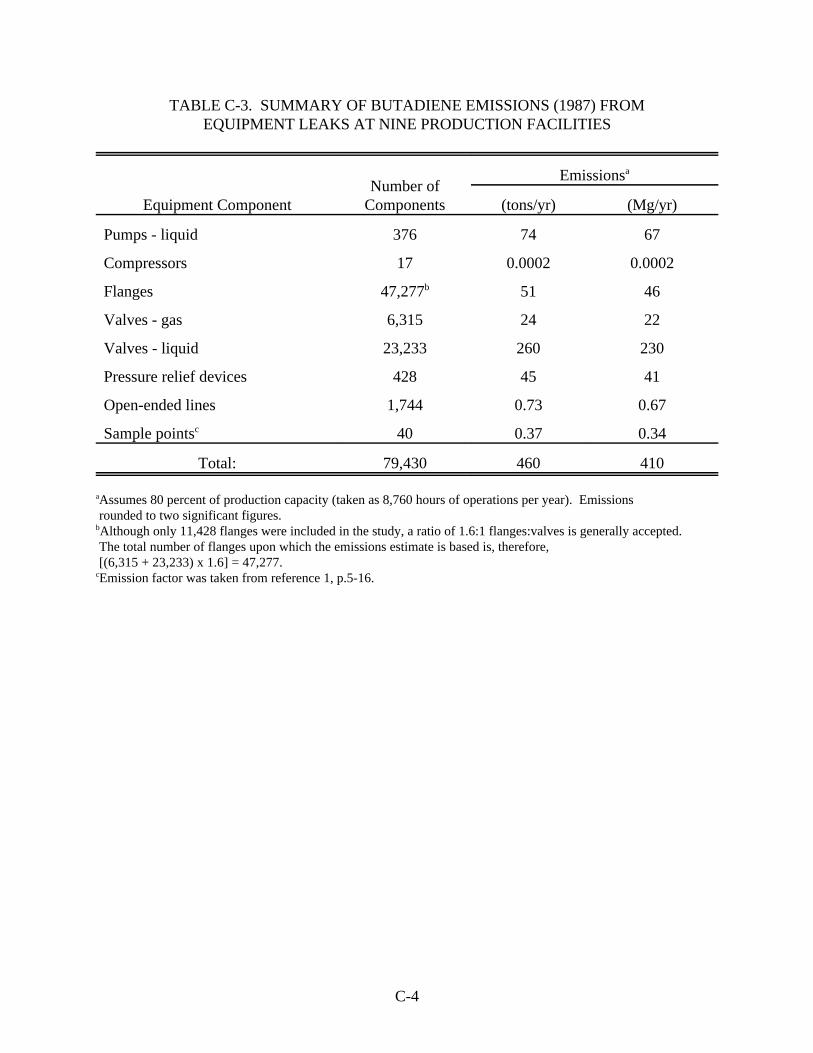
C-4
TABLE C-3. SUMMARY OF BUTADIENE EMISSIONS (1987) FROMEQUIPMENT LEAKS AT NINE PRODUCTION FACILITIES
Equipment Component Components (tons/yr) (Mg/yr)Number of
Emissionsa
Pumps - liquid 376 74 67
Compressors 17 0.0002 0.0002
Flanges 47,277 51 46b
Valves - gas 6,315 24 22
Valves - liquid 23,233 260 230
Pressure relief devices 428 45 41
Open-ended lines 1,744 0.73 0.67
Sample points 40 0.37 0.34c
Total: 79,430 460 410
Assumes 80 percent of production capacity (taken as 8,760 hours of operations per year). Emissionsa
rounded to two significant figures.Although only 11,428 flanges were included in the study, a ratio of 1.6:1 flanges:valves is generally accepted. b
The total number of flanges upon which the emissions estimate is based is, therefore, [(6,315 + 23,233) x 1.6] = 47,277.Emission factor was taken from reference 1, p.5-16.c
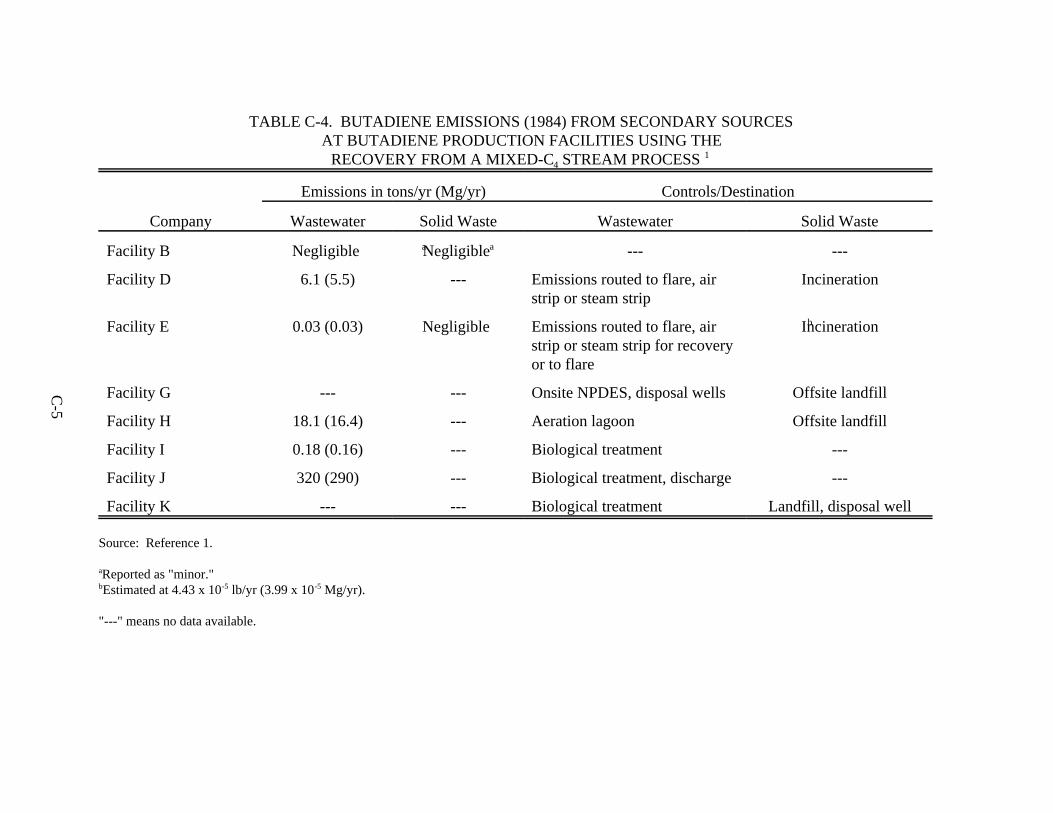
C-5
TABLE C-4. BUTADIENE EMISSIONS (1984) FROM SECONDARY SOURCESAT BUTADIENE PRODUCTION FACILITIES USING THE
RECOVERY FROM A MIXED-C STREAM PROCESS 41
Company
Emissions in tons/yr (Mg/yr) Controls/Destination
Wastewater Solid Waste Wastewater Solid Waste
Facility B Negligible aNegligiblea --- ---
Facility D 6.1 (5.5) --- Emissions routed to flare, airstrip or steam strip
Incineration
Facility E 0.03 (0.03) Negligible bEmissions routed to flare, airstrip or steam strip for recoveryor to flare
Incineration
Facility G --- --- Onsite NPDES, disposal wells Offsite landfill
Facility H 18.1 (16.4) --- Aeration lagoon Offsite landfill
Facility I 0.18 (0.16) --- Biological treatment ---
Facility J 320 (290) --- Biological treatment, discharge ---
Facility K --- --- Biological treatment Landfill, disposal well
Source: Reference 1.
Reported as "minor."a
Estimated at 4.43 x 10 lb/yr (3.99 x 10 Mg/yr).b -5 -5
"---" means no data available.
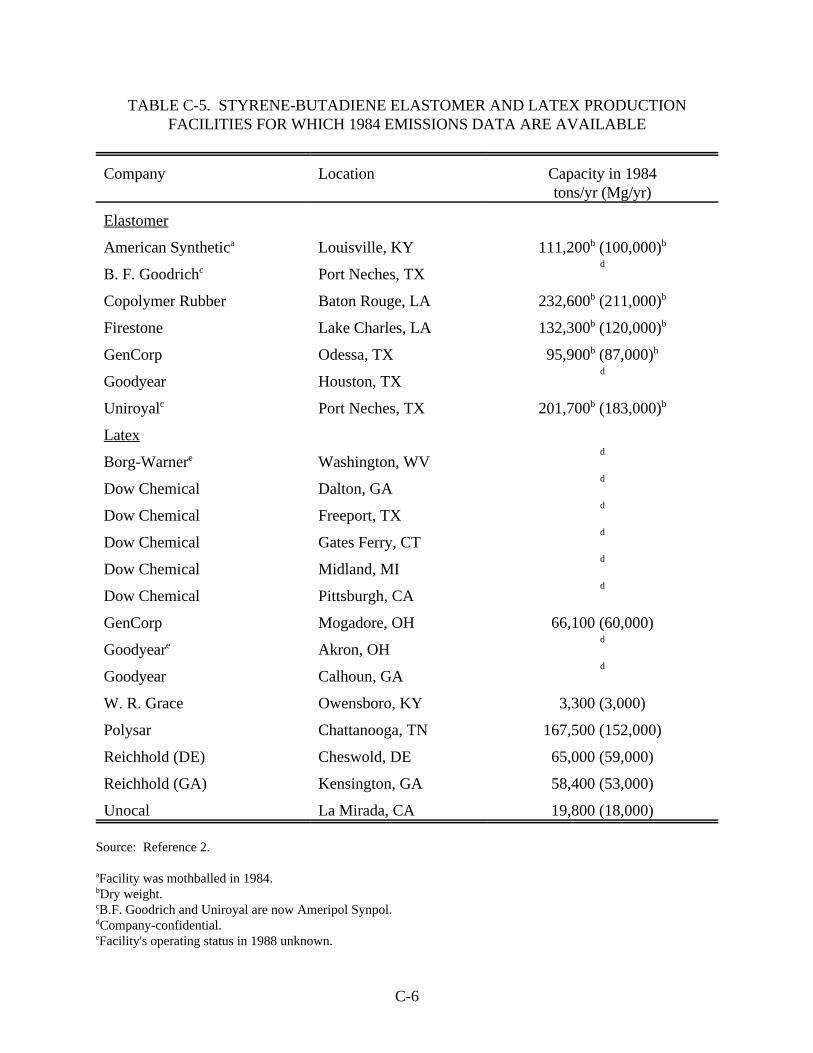
C-6
TABLE C-5. STYRENE-BUTADIENE ELASTOMER AND LATEX PRODUCTIONFACILITIES FOR WHICH 1984 EMISSIONS DATA ARE AVAILABLE
Company Location Capacity in 1984tons/yr (Mg/yr)
Elastomer
American Synthetic Louisville, KY 111,200 (100,000)a b b
B. F. Goodrich Port Neches, TXcd
Copolymer Rubber Baton Rouge, LA 232,600 (211,000)b b
Firestone Lake Charles, LA 132,300 (120,000)b b
GenCorp Odessa, TX 95,900 (87,000)b b
Goodyear Houston, TXd
Uniroyal Port Neches, TX 201,700 (183,000)c b b
Latex
Borg-Warner Washington, WVed
Dow Chemical Dalton, GAd
Dow Chemical Freeport, TXd
Dow Chemical Gates Ferry, CTd
Dow Chemical Midland, MId
Dow Chemical Pittsburgh, CAd
GenCorp Mogadore, OH 66,100 (60,000)
Goodyear Akron, OHed
Goodyear Calhoun, GAd
W. R. Grace Owensboro, KY 3,300 (3,000)
Polysar Chattanooga, TN 167,500 (152,000)
Reichhold (DE) Cheswold, DE 65,000 (59,000)
Reichhold (GA) Kensington, GA 58,400 (53,000)
Unocal La Mirada, CA 19,800 (18,000)
Source: Reference 2.
Facility was mothballed in 1984.a
Dry weight.b
B.F. Goodrich and Uniroyal are now Ameripol Synpol.c
Company-confidential.d
Facility's operating status in 1988 unknown.e
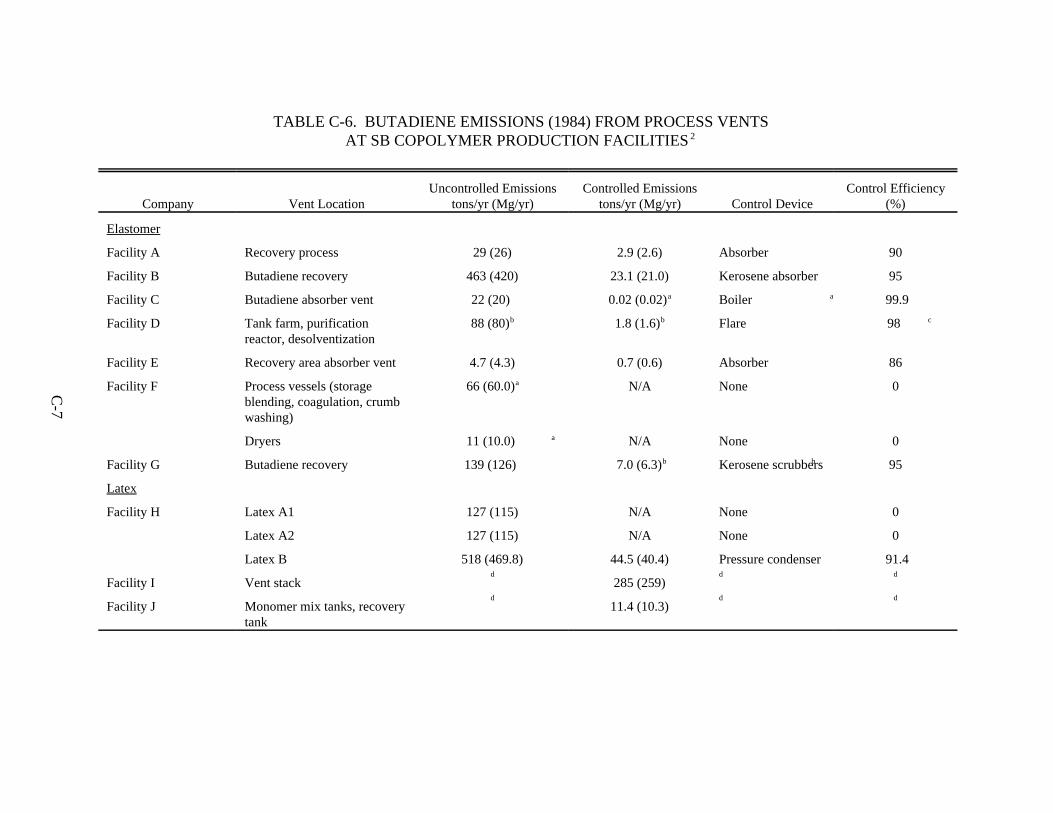
C-7
TABLE C-6. BUTADIENE EMISSIONS (1984) FROM PROCESS VENTSAT SB COPOLYMER PRODUCTION FACILITIES 2
Company Vent LocationUncontrolled Emissions
tons/yr (Mg/yr)Controlled Emissions
tons/yr (Mg/yr) Control DeviceControl Efficiency
(%)
Elastomer
Facility A Recovery process 29 (26) 2.9 (2.6) Absorber 90
Facility B Butadiene recovery 463 (420) 23.1 (21.0) Kerosene absorber 95
Facility C Butadiene absorber vent 22 (20) a0.02 (0.02)a Boiler 99.9
Facility D Tank farm, purificationreactor, desolventization
88 (80)b 1.8 (1.6)b Flare 98 c
Facility E Recovery area absorber vent 4.7 (4.3) 0.7 (0.6) Absorber 86
Facility F Process vessels (storageblending, coagulation, crumbwashing)
66 (60.0)a N/A None 0
Dryers 11 (10.0) a N/A None 0
Facility G Butadiene recovery 139 (126) b 7.0 (6.3)b Kerosene scrubbers 95
Latex
Facility H Latex A1 127 (115) N/A None 0
Latex A2 127 (115) N/A None 0
Latex B 518 (469.8) 44.5 (40.4) Pressure condenser 91.4
Facility I Vent stackd
285 (259)d d
Facility J Monomer mix tanks, recoverytank
d11.4 (10.3)
d d
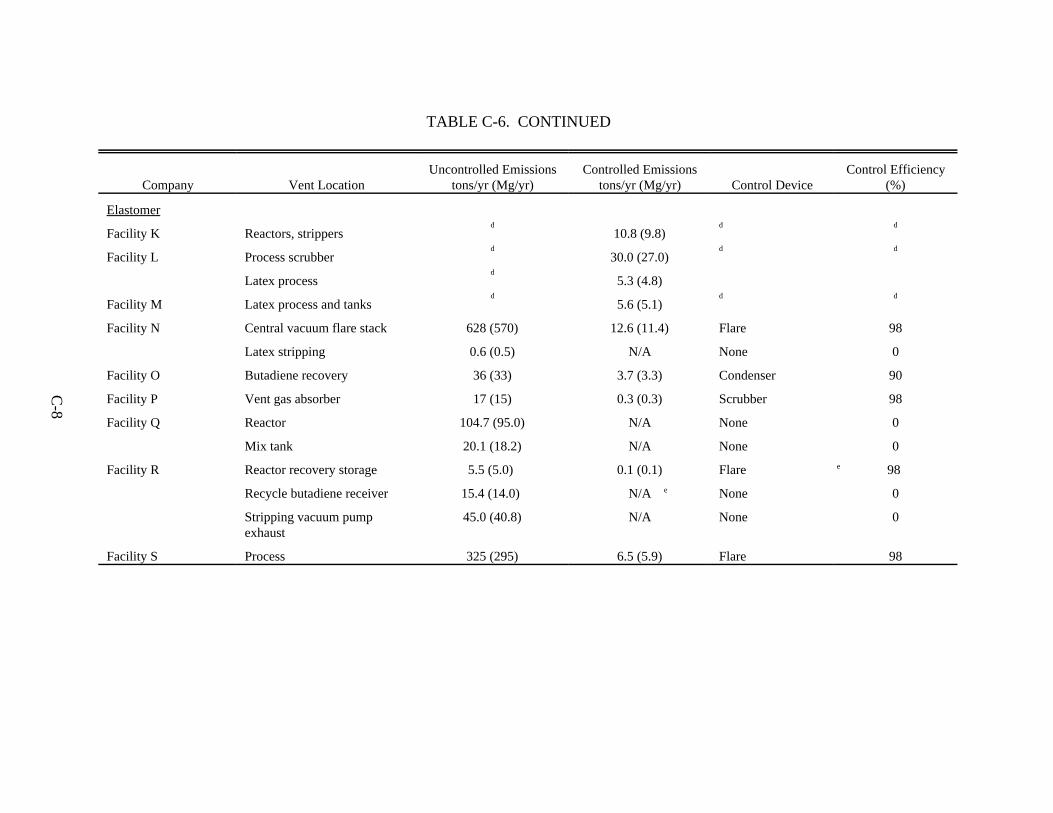
C-8
TABLE C-6. CONTINUED
Company Vent LocationUncontrolled Emissions
tons/yr (Mg/yr)Controlled Emissions
tons/yr (Mg/yr) Control DeviceControl Efficiency
(%)
Elastomer
Facility K Reactors, strippersd
10.8 (9.8)d d
Facility L Process scrubberd
30.0 (27.0)d d
Latex processd
5.3 (4.8)
Facility M Latex process and tanksd
5.6 (5.1)d d
Facility N Central vacuum flare stack 628 (570) 12.6 (11.4) Flare 98
Latex stripping 0.6 (0.5) N/A None 0
Facility O Butadiene recovery 36 (33) 3.7 (3.3) Condenser 90
Facility P Vent gas absorber 17 (15) 0.3 (0.3) Scrubber 98
Facility Q Reactor 104.7 (95.0) N/A None 0
Mix tank 20.1 (18.2) N/A None 0
Facility R Reactor recovery storage 5.5 (5.0) e0.1 (0.1) Flare 98
Recycle butadiene receiver 15.4 (14.0) eN/A None 0
Stripping vacuum pumpexhaust
45.0 (40.8) N/A None 0
Facility S Process 325 (295) 6.5 (5.9) Flare 98
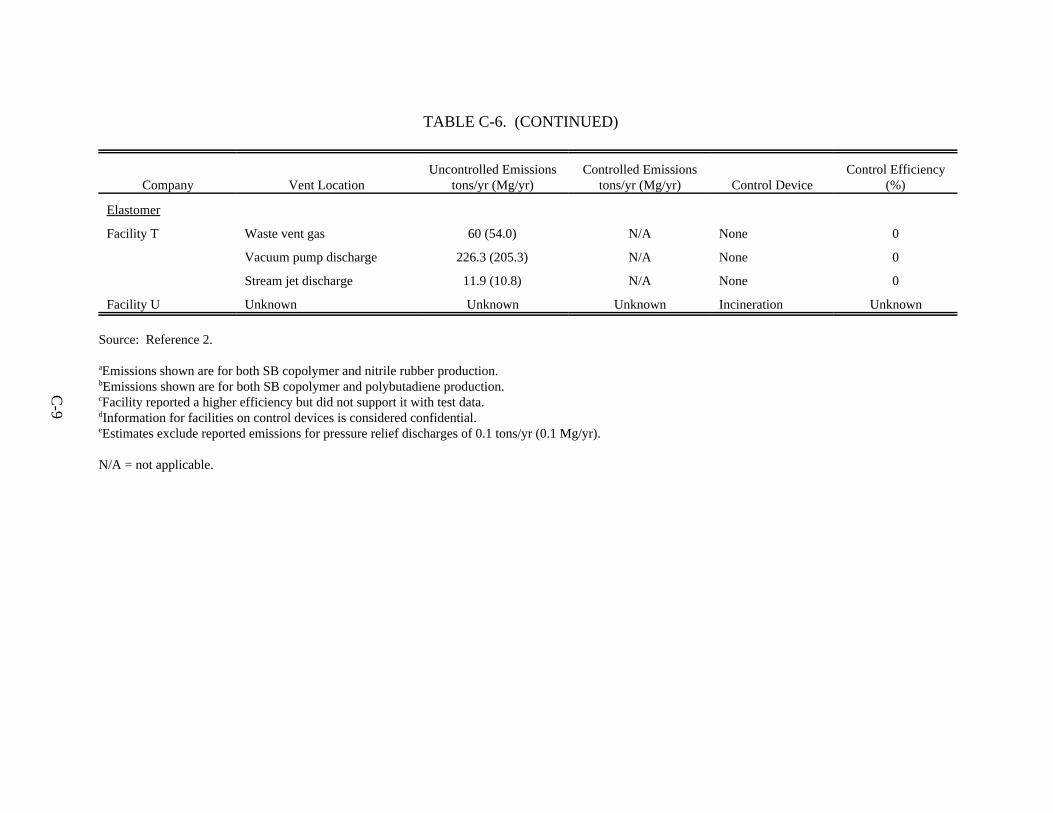
C-9
TABLE C-6. (CONTINUED)
Company Vent LocationUncontrolled Emissions
tons/yr (Mg/yr)Controlled Emissions
tons/yr (Mg/yr) Control DeviceControl Efficiency
(%)
Elastomer
Facility T Waste vent gas 60 (54.0) N/A None 0
Vacuum pump discharge 226.3 (205.3) N/A None 0
Stream jet discharge 11.9 (10.8) N/A None 0
Facility U Unknown Unknown Unknown Incineration Unknown
Source: Reference 2.
Emissions shown are for both SB copolymer and nitrile rubber production.a
Emissions shown are for both SB copolymer and polybutadiene production.b
Facility reported a higher efficiency but did not support it with test data.c
Information for facilities on control devices is considered confidential.d
Estimates exclude reported emissions for pressure relief discharges of 0.1 tons/yr (0.1 Mg/yr).e
N/A = not applicable.
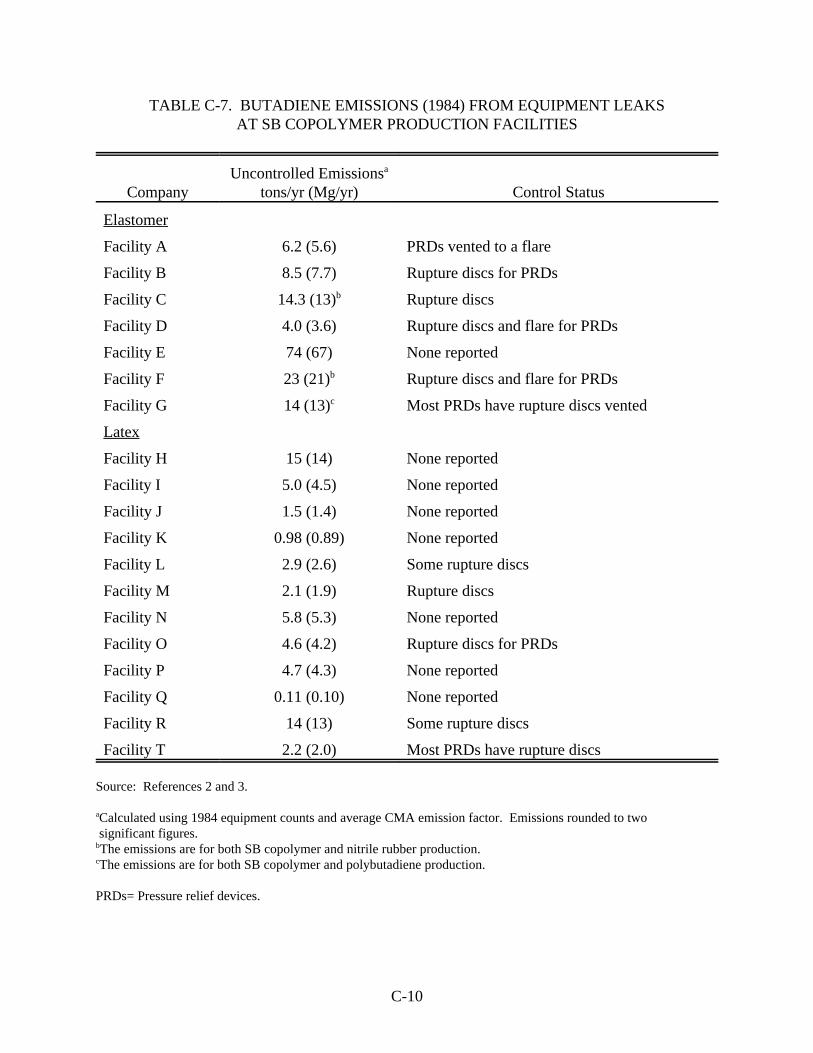
C-10
TABLE C-7. BUTADIENE EMISSIONS (1984) FROM EQUIPMENT LEAKSAT SB COPOLYMER PRODUCTION FACILITIES
Company tons/yr (Mg/yr) Control StatusUncontrolled Emissionsa
Elastomer
Facility A 6.2 (5.6) PRDs vented to a flare
Facility B 8.5 (7.7) Rupture discs for PRDs
Facility C 14.3 (13) Rupture discsb
Facility D 4.0 (3.6) Rupture discs and flare for PRDs
Facility E 74 (67) None reported
Facility F 23 (21) Rupture discs and flare for PRDsb
Facility G 14 (13) Most PRDs have rupture discs ventedc
Latex
Facility H 15 (14) None reported
Facility I 5.0 (4.5) None reported
Facility J 1.5 (1.4) None reported
Facility K 0.98 (0.89) None reported
Facility L 2.9 (2.6) Some rupture discs
Facility M 2.1 (1.9) Rupture discs
Facility N 5.8 (5.3) None reported
Facility O 4.6 (4.2) Rupture discs for PRDs
Facility P 4.7 (4.3) None reported
Facility Q 0.11 (0.10) None reported
Facility R 14 (13) Some rupture discs
Facility T 2.2 (2.0) Most PRDs have rupture discs
Source: References 2 and 3.
Calculated using 1984 equipment counts and average CMA emission factor. Emissions rounded to twoa
significant figures.The emissions are for both SB copolymer and nitrile rubber production.b
The emissions are for both SB copolymer and polybutadiene production.c
PRDs= Pressure relief devices.
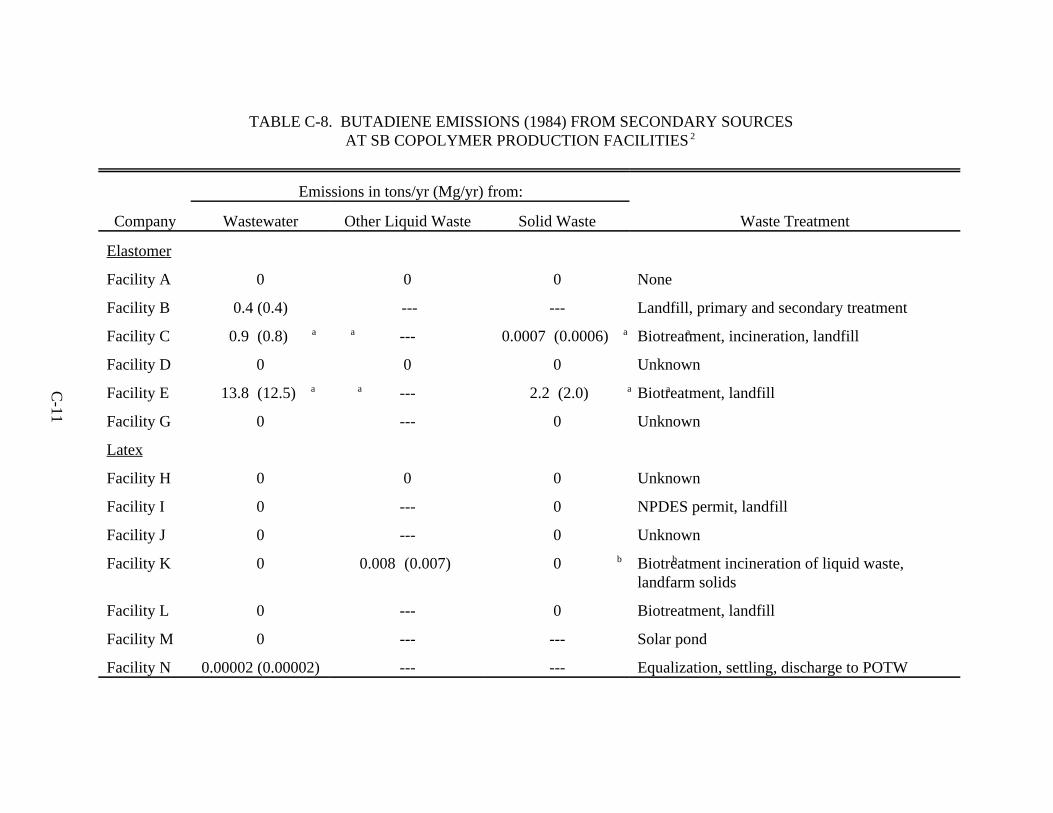
C-11
TABLE C-8. BUTADIENE EMISSIONS (1984) FROM SECONDARY SOURCESAT SB COPOLYMER PRODUCTION FACILITIES 2
Company
Emissions in tons/yr (Mg/yr) from:
Waste TreatmentWastewater Other Liquid Waste Solid Waste
Elastomer
Facility A 0 0 0 None
Facility B 0.4 (0.4) --- --- Landfill, primary and secondary treatment
Facility C 0.9 (0.8) a a --- 0.0007 (0.0006) a aBiotreatment, incineration, landfill
Facility D 0 0 0 Unknown
Facility E 13.8 (12.5) a a --- 2.2 (2.0) a aBiotreatment, landfill
Facility G 0 --- 0 Unknown
Latex
Facility H 0 0 0 Unknown
Facility I 0 --- 0 NPDES permit, landfill
Facility J 0 --- 0 Unknown
Facility K 0 0.008 (0.007) b b0 Biotreatment incineration of liquid waste,landfarm solids
Facility L 0 --- 0 Biotreatment, landfill
Facility M 0 --- --- Solar pond
Facility N 0.00002 (0.00002) --- --- Equalization, settling, discharge to POTW
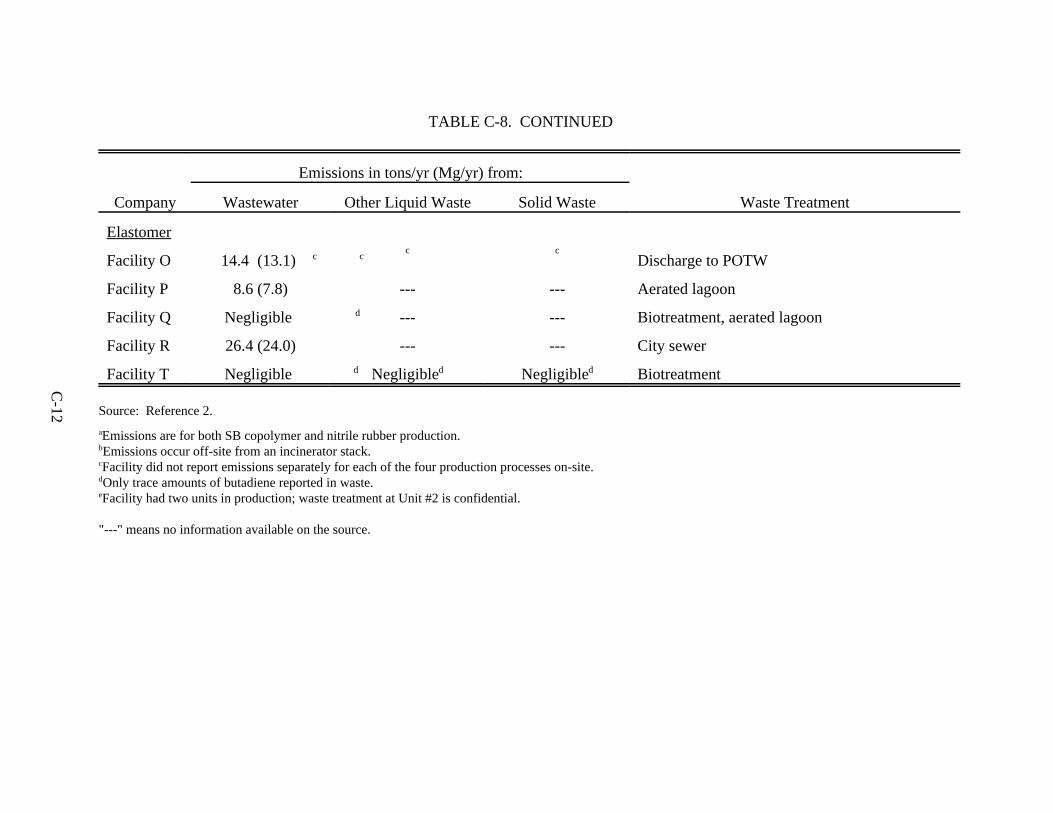
C-12
TABLE C-8. CONTINUED
Company
Emissions in tons/yr (Mg/yr) from:
Waste TreatmentWastewater Other Liquid Waste Solid Waste
Elastomer
Facility O 14.4 (13.1) c cc c
Discharge to POTW
Facility P 8.6 (7.8) --- --- Aerated lagoon
Facility Q Negligible d --- --- Biotreatment, aerated lagoon
Facility R 26.4 (24.0) --- --- City sewer
Facility T Negligible d Negligibled Negligibled Biotreatment
Source: Reference 2.
Emissions are for both SB copolymer and nitrile rubber production.a
Emissions occur off-site from an incinerator stack.b
Facility did not report emissions separately for each of the four production processes on-site.c
Only trace amounts of butadiene reported in waste.d
Facility had two units in production; waste treatment at Unit #2 is confidential.e
"---" means no information available on the source.
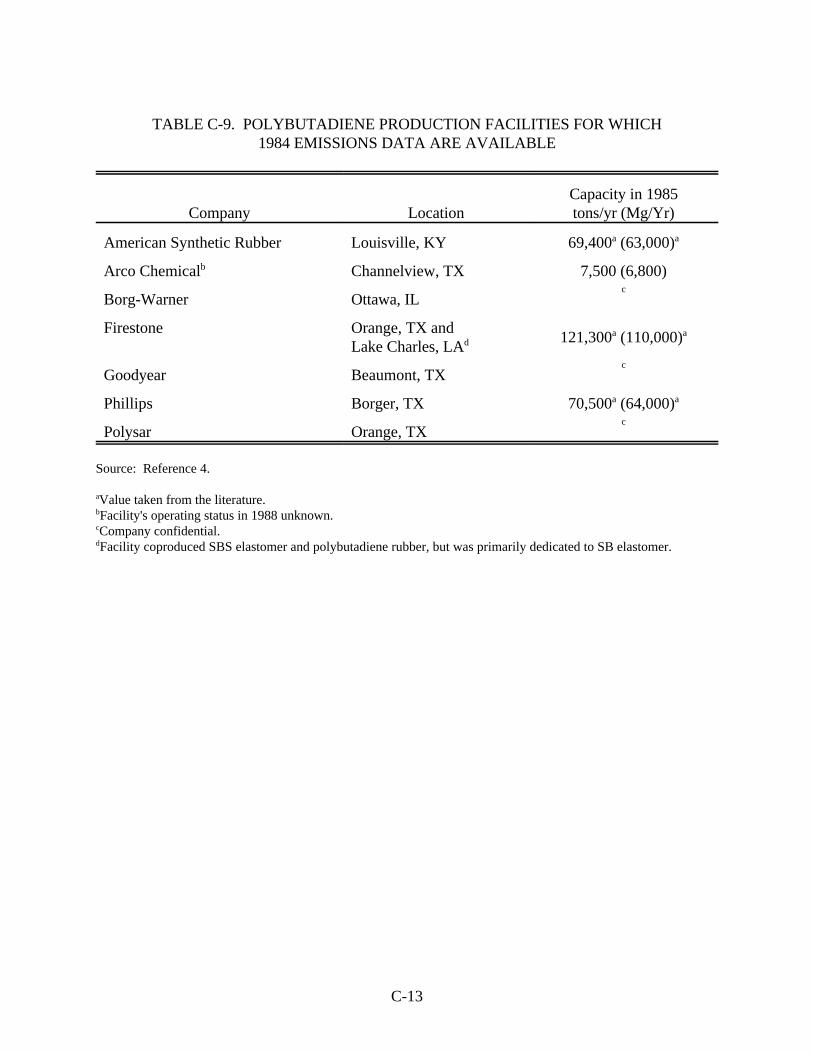
C-13
TABLE C-9. POLYBUTADIENE PRODUCTION FACILITIES FOR WHICH1984 EMISSIONS DATA ARE AVAILABLE
Company Location tons/yr (Mg/Yr)Capacity in 1985
American Synthetic Rubber Louisville, KY 69,400 (63,000)a a
Arco Chemical Channelview, TX 7,500 (6,800)b
Borg-Warner Ottawa, ILc
Firestone Orange, TX and Lake Charles, LAd 121,300 (110,000)a a
Goodyear Beaumont, TXc
Phillips Borger, TX 70,500 (64,000)a a
Polysar Orange, TXc
Source: Reference 4.
Value taken from the literature.a
Facility's operating status in 1988 unknown.b
Company confidential.c
Facility coproduced SBS elastomer and polybutadiene rubber, but was primarily dedicated to SB elastomer.d
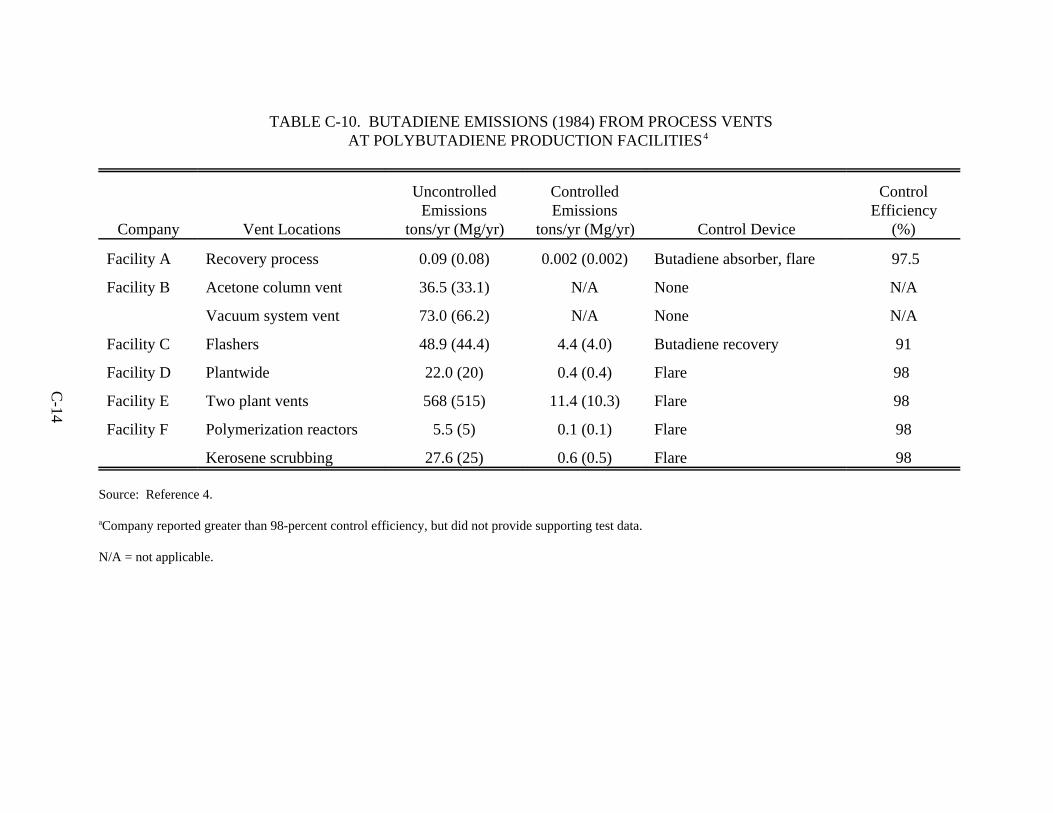
C-14
TABLE C-10. BUTADIENE EMISSIONS (1984) FROM PROCESS VENTS AT POLYBUTADIENE PRODUCTION FACILITIES 4
Company Vent Locations
UncontrolledEmissions
tons/yr (Mg/yr)
ControlledEmissions
tons/yr (Mg/yr) Control Device
ControlEfficiency
(%)
Facility A Recovery process 0.09 (0.08) 0.002 (0.002) Butadiene absorber, flare 97.5
Facility B Acetone column vent 36.5 (33.1) N/A None N/A
Vacuum system vent 73.0 (66.2) N/A None N/A
Facility C Flashers 48.9 (44.4) 4.4 (4.0) Butadiene recovery 91
Facility D Plantwide 22.0 (20) 0.4 (0.4) Flare 98
Facility E Two plant vents 568 (515) 11.4 (10.3) Flare 98
Facility F Polymerization reactors 5.5 (5) 0.1 (0.1) Flare 98
Kerosene scrubbing 27.6 (25) 0.6 (0.5) Flare 98
Source: Reference 4.
Company reported greater than 98-percent control efficiency, but did not provide supporting test data.a
N/A = not applicable.
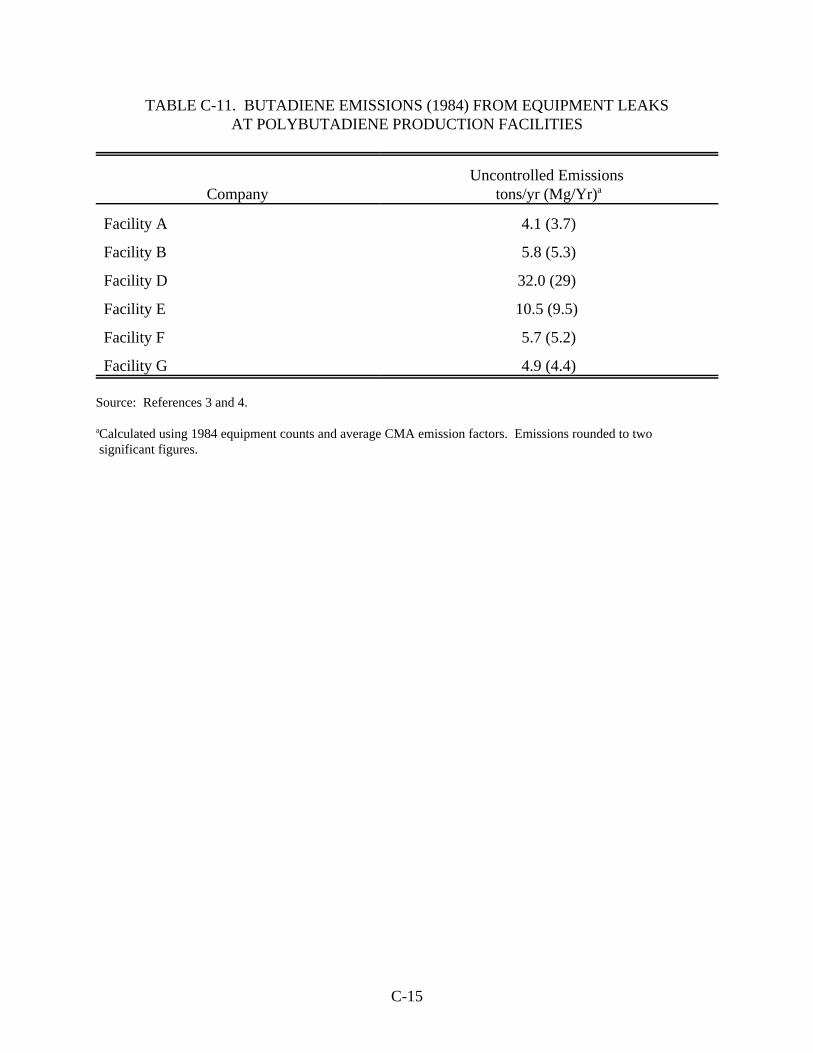
C-15
TABLE C-11. BUTADIENE EMISSIONS (1984) FROM EQUIPMENT LEAKSAT POLYBUTADIENE PRODUCTION FACILITIES
Company tons/yr (Mg/Yr)Uncontrolled Emissions
a
Facility A 4.1 (3.7)
Facility B 5.8 (5.3)
Facility D 32.0 (29)
Facility E 10.5 (9.5)
Facility F 5.7 (5.2)
Facility G 4.9 (4.4)
Source: References 3 and 4.
Calculated using 1984 equipment counts and average CMA emission factors. Emissions rounded to twoa
significant figures.
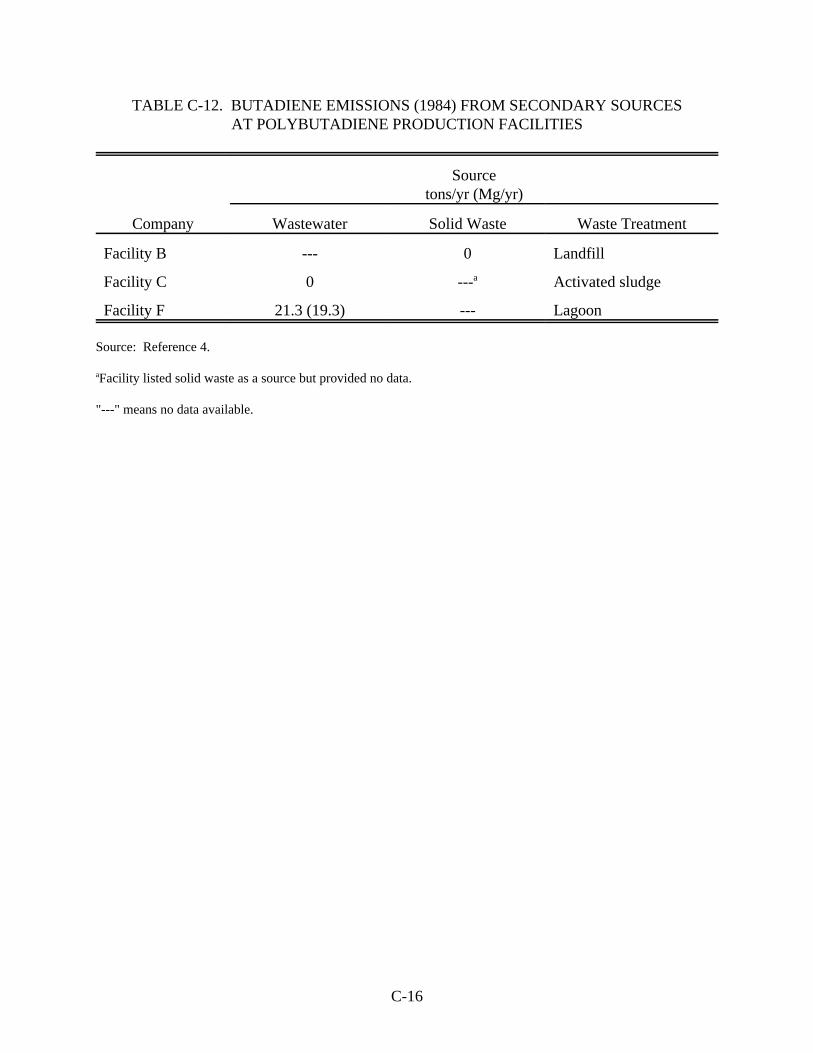
C-16
TABLE C-12. BUTADIENE EMISSIONS (1984) FROM SECONDARY SOURCESAT POLYBUTADIENE PRODUCTION FACILITIES
Company Wastewater Solid Waste Waste Treatment
Sourcetons/yr (Mg/yr)
Facility B --- 0 Landfill
Facility C 0 --- Activated sludgea
Facility F 21.3 (19.3) --- Lagoon
Source: Reference 4.
Facility listed solid waste as a source but provided no data.a
"---" means no data available.
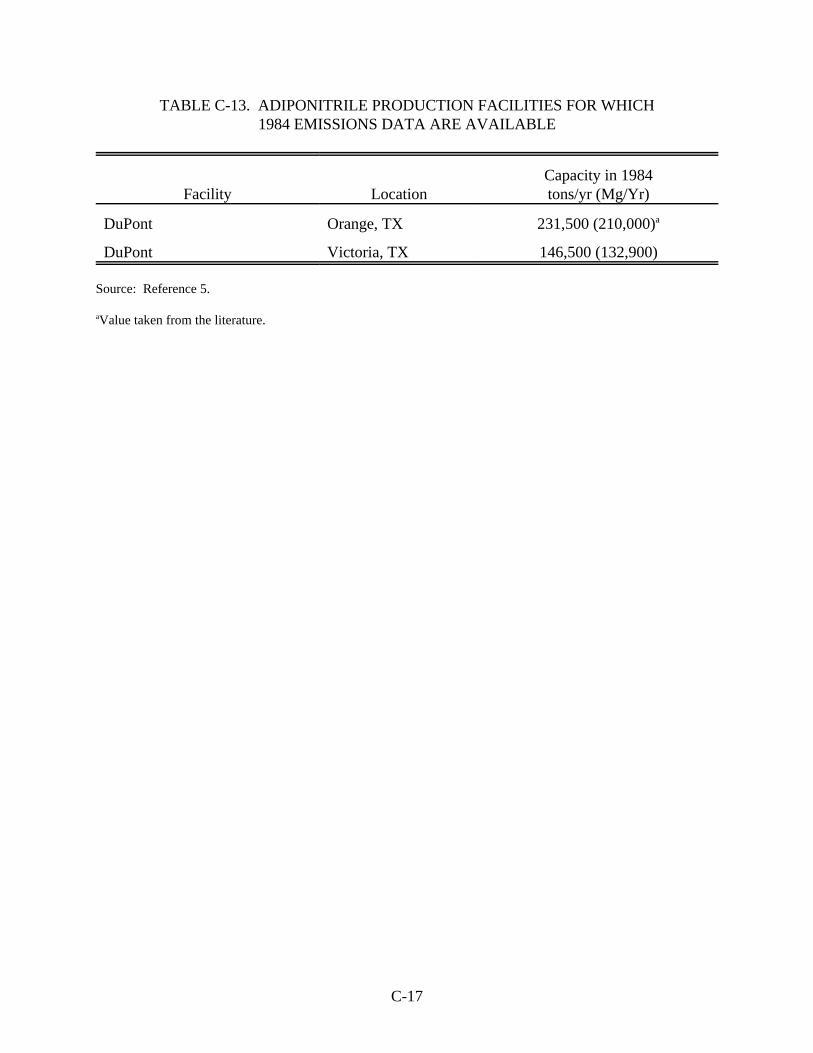
C-17
TABLE C-13. ADIPONITRILE PRODUCTION FACILITIES FOR WHICH1984 EMISSIONS DATA ARE AVAILABLE
Facility Location tons/yr (Mg/Yr)Capacity in 1984
DuPont Orange, TX 231,500 (210,000)a
DuPont Victoria, TX 146,500 (132,900)
Source: Reference 5.
Value taken from the literature.a
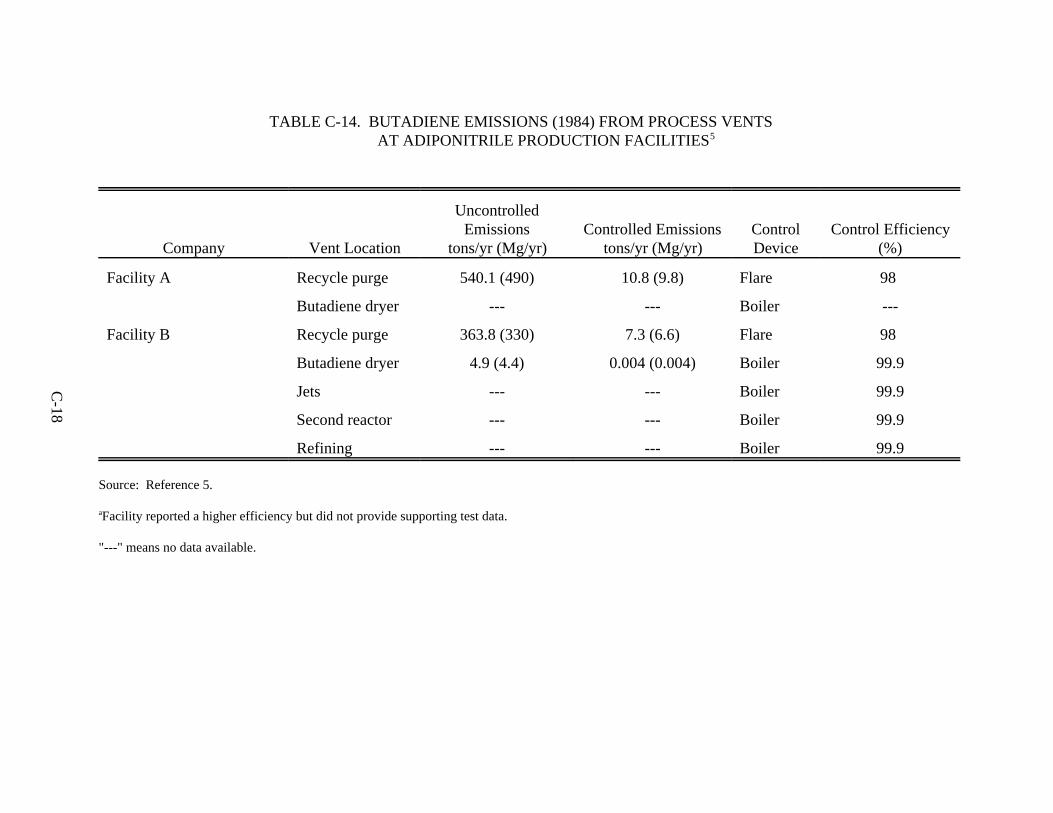
C-18
TABLE C-14. BUTADIENE EMISSIONS (1984) FROM PROCESS VENTS AT ADIPONITRILE PRODUCTION FACILITIES 5
Company Vent Location
UncontrolledEmissions
tons/yr (Mg/yr)Controlled Emissions
tons/yr (Mg/yr)ControlDevice
Control Efficiency(%)
Facility A Recycle purge 540.1 (490) 10.8 (9.8) Flare 98
Butadiene dryer --- --- Boiler ---
Facility B Recycle purge 363.8 (330) 7.3 (6.6) Flare 98
Butadiene dryer 4.9 (4.4) 0.004 (0.004) Boiler 99.9
Jets --- --- Boiler 99.9
Second reactor --- --- Boiler 99.9
Refining --- --- Boiler 99.9
Source: Reference 5.
Facility reported a higher efficiency but did not provide supporting test data.a
"---" means no data available.
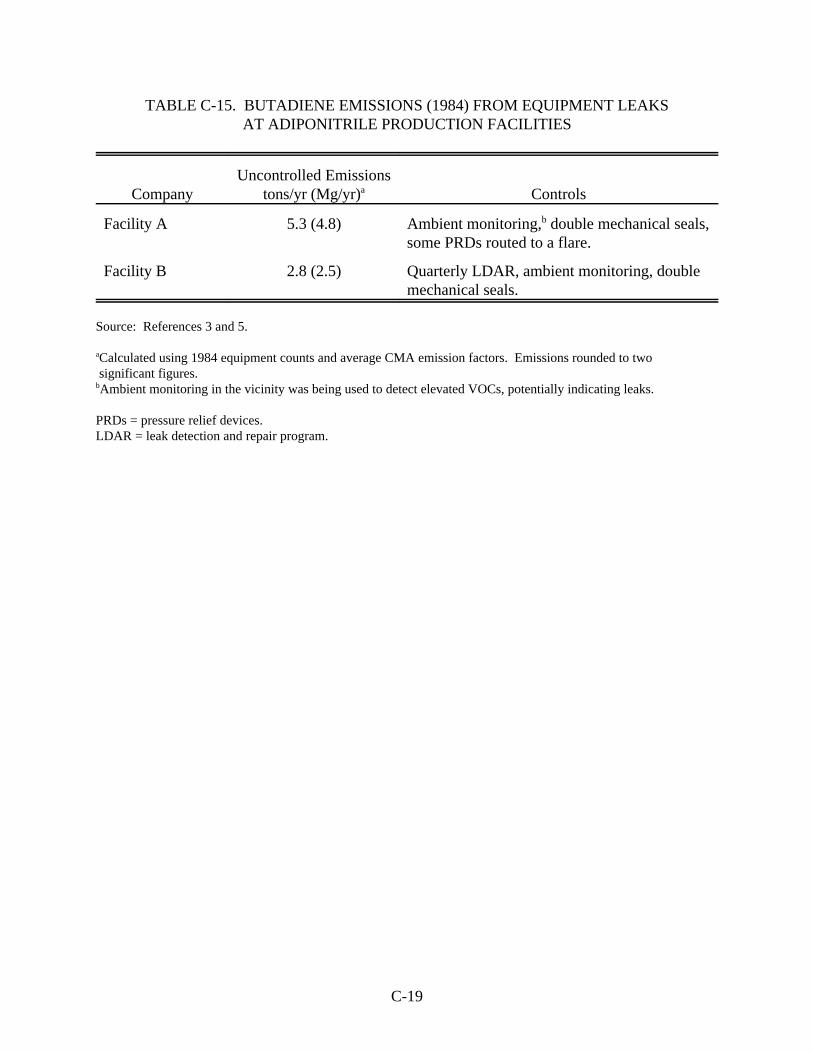
C-19
TABLE C-15. BUTADIENE EMISSIONS (1984) FROM EQUIPMENT LEAKSAT ADIPONITRILE PRODUCTION FACILITIES
Company tons/yr (Mg/yr) ControlsUncontrolled Emissions
a
Facility A 5.3 (4.8) Ambient monitoring, double mechanical seals,b
some PRDs routed to a flare.
Facility B 2.8 (2.5) Quarterly LDAR, ambient monitoring, doublemechanical seals.
Source: References 3 and 5.
Calculated using 1984 equipment counts and average CMA emission factors. Emissions rounded to twoa
significant figures.Ambient monitoring in the vicinity was being used to detect elevated VOCs, potentially indicating leaks.b
PRDs = pressure relief devices.LDAR = leak detection and repair program.
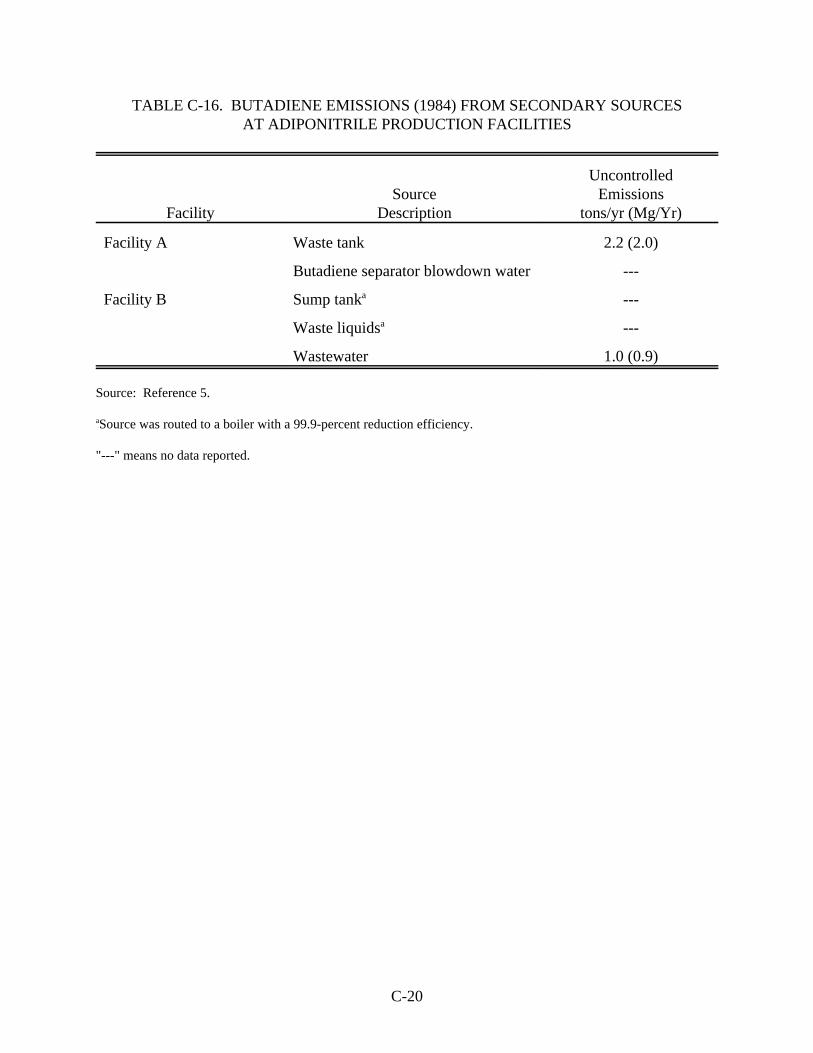
C-20
TABLE C-16. BUTADIENE EMISSIONS (1984) FROM SECONDARY SOURCESAT ADIPONITRILE PRODUCTION FACILITIES
Facility Description tons/yr (Mg/Yr)Source Emissions
Uncontrolled
Facility A Waste tank 2.2 (2.0)
Butadiene separator blowdown water ---
Facility B Sump tank ---a
Waste liquids ---a
Wastewater 1.0 (0.9)
Source: Reference 5.
Source was routed to a boiler with a 99.9-percent reduction efficiency.a
"---" means no data reported.
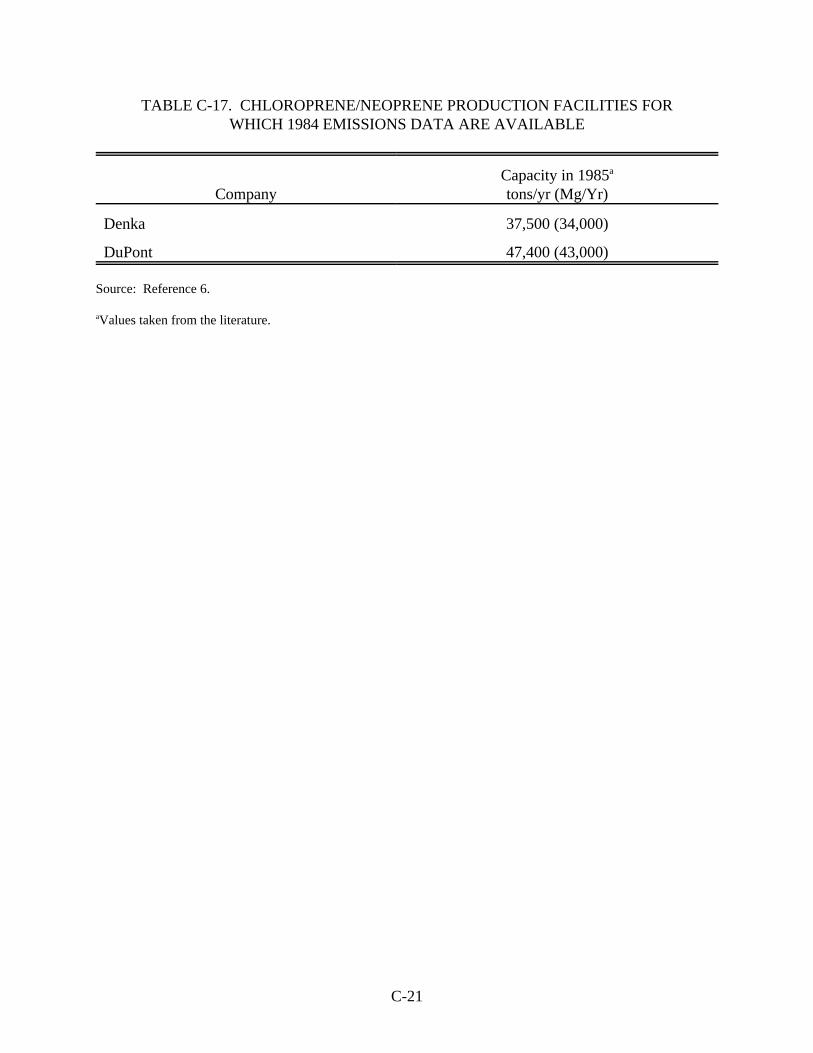
C-21
TABLE C-17. CHLOROPRENE/NEOPRENE PRODUCTION FACILITIES FORWHICH 1984 EMISSIONS DATA ARE AVAILABLE
Company tons/yr (Mg/Yr)Capacity in 1985a
Denka 37,500 (34,000)
DuPont 47,400 (43,000)
Source: Reference 6.
Values taken from the literature.a
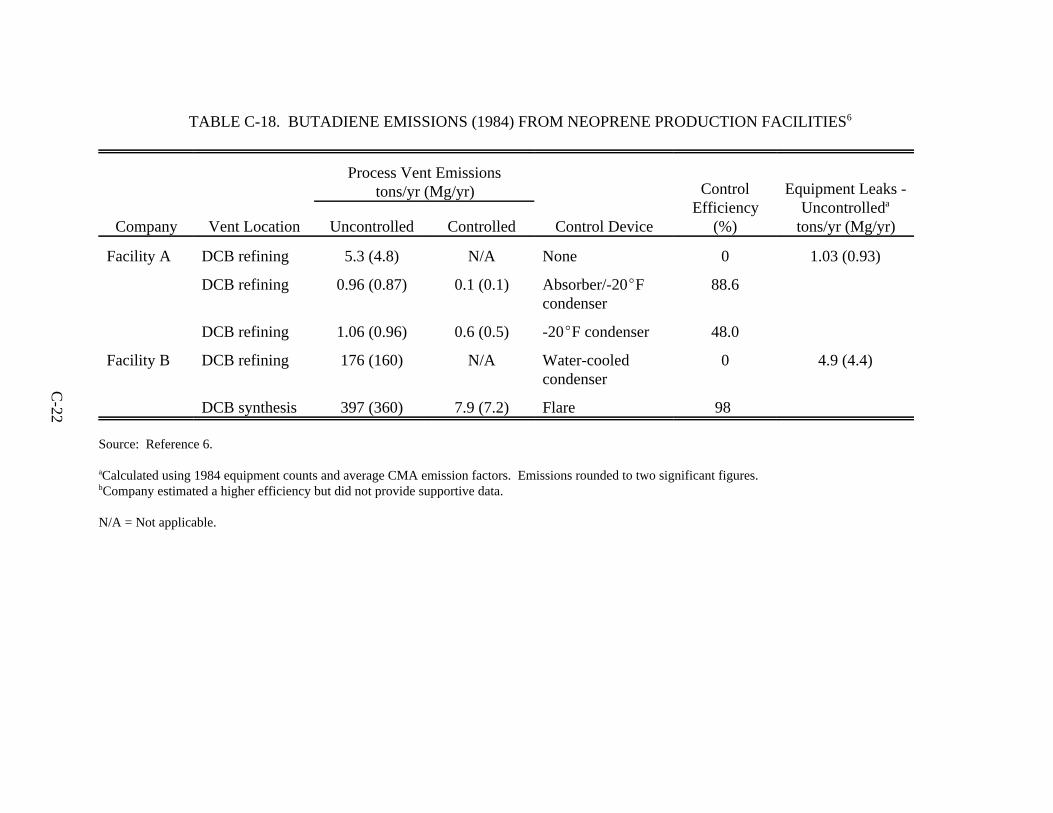
C-22
TABLE C-18. BUTADIENE EMISSIONS (1984) FROM NEOPRENE PRODUCTION FACILITIES 6
Company Vent Location
Process Vent Emissionstons/yr (Mg/yr)
Control Device
ControlEfficiency
(%)
Equipment Leaks -Uncontrolleda
tons/yr (Mg/yr)Uncontrolled Controlled
Facility A DCB refining 5.3 (4.8) N/A None 0 1.03 (0.93)
DCB refining 0.96 (0.87) 0.1 (0.1) Absorber/-20EFcondenser
88.6
DCB refining 1.06 (0.96) 0.6 (0.5) -20EF condenser 48.0
Facility B DCB refining 176 (160) N/A Water-cooledcondenser
0 4.9 (4.4)
DCB synthesis 397 (360) 7.9 (7.2) Flare 98
Source: Reference 6.
Calculated using 1984 equipment counts and average CMA emission factors. Emissions rounded to two significant figures. a
Company estimated a higher efficiency but did not provide supportive data.b
N/A = Not applicable.
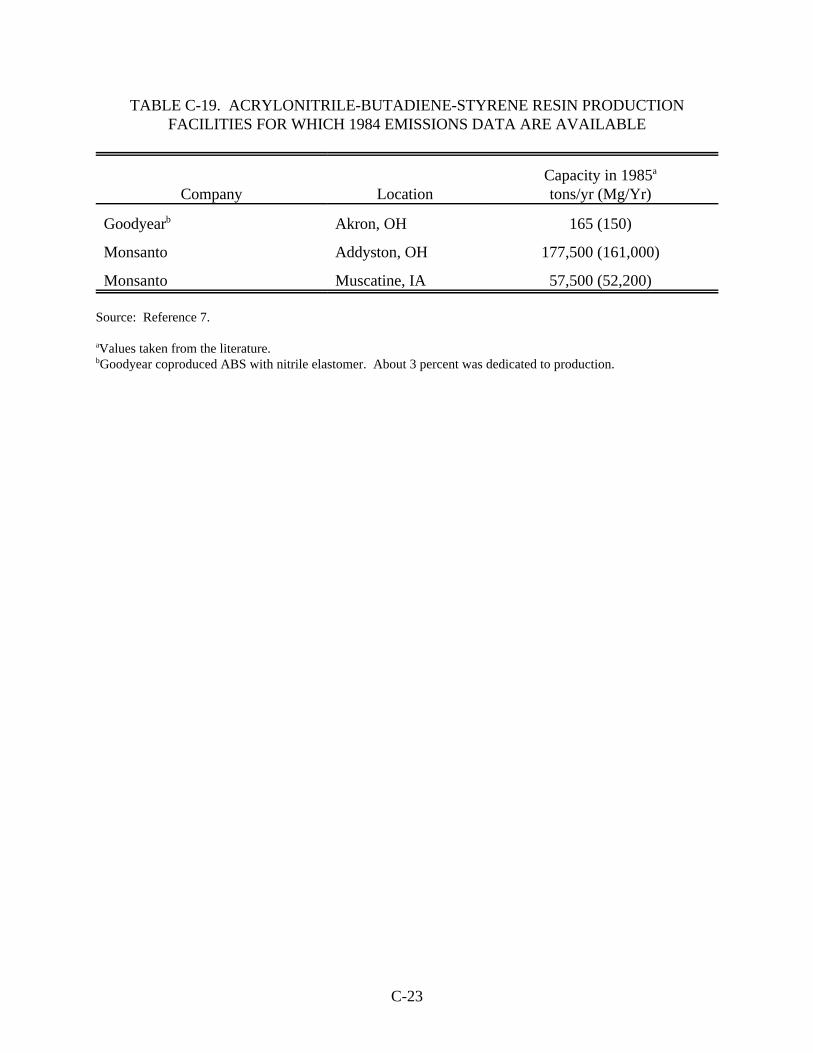
C-23
TABLE C-19. ACRYLONITRILE-BUTADIENE-STYRENE RESIN PRODUCTIONFACILITIES FOR WHICH 1984 EMISSIONS DATA ARE AVAILABLE
Company Location tons/yr (Mg/Yr)Capacity in 1985a
Goodyear Akron, OH 165 (150)b
Monsanto Addyston, OH 177,500 (161,000)
Monsanto Muscatine, IA 57,500 (52,200)
Source: Reference 7.
Values taken from the literature.a
Goodyear coproduced ABS with nitrile elastomer. About 3 percent was dedicated to production.b
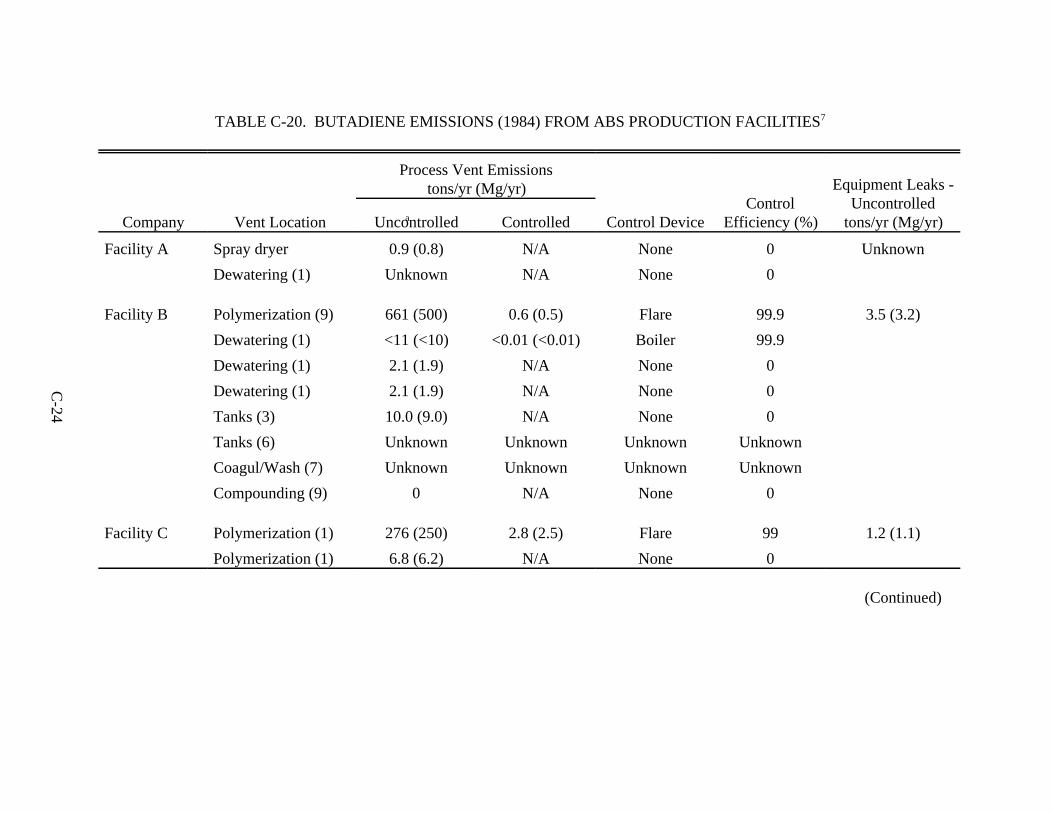
C-24
TABLE C-20. BUTADIENE EMISSIONS (1984) FROM ABS PRODUCTION FACILITIES 7
Company Vent Location a
Process Vent Emissionstons/yr (Mg/yr)
Control DeviceControl
Efficiency (%)
Equipment Leaks -Uncontrolled
tons/yr (Mg/yr)Uncontrolled Controlled
Facility A Spray dryer 0.9 (0.8) N/A None 0 Unknown
Dewatering (1) Unknown N/A None 0
Facility B Polymerization (9) 661 (500) 0.6 (0.5) Flare 99.9 3.5 (3.2)
Dewatering (1) <11 (<10) <0.01 (<0.01) Boiler 99.9
Dewatering (1) 2.1 (1.9) N/A None 0
Dewatering (1) 2.1 (1.9) N/A None 0
Tanks (3) 10.0 (9.0) N/A None 0
Tanks (6) Unknown Unknown Unknown Unknown
Coagul/Wash (7) Unknown Unknown Unknown Unknown
Compounding (9) 0 N/A None 0
Facility C Polymerization (1) 276 (250) 2.8 (2.5) Flare 99 1.2 (1.1)
Polymerization (1) 6.8 (6.2) N/A None 0
(Continued)
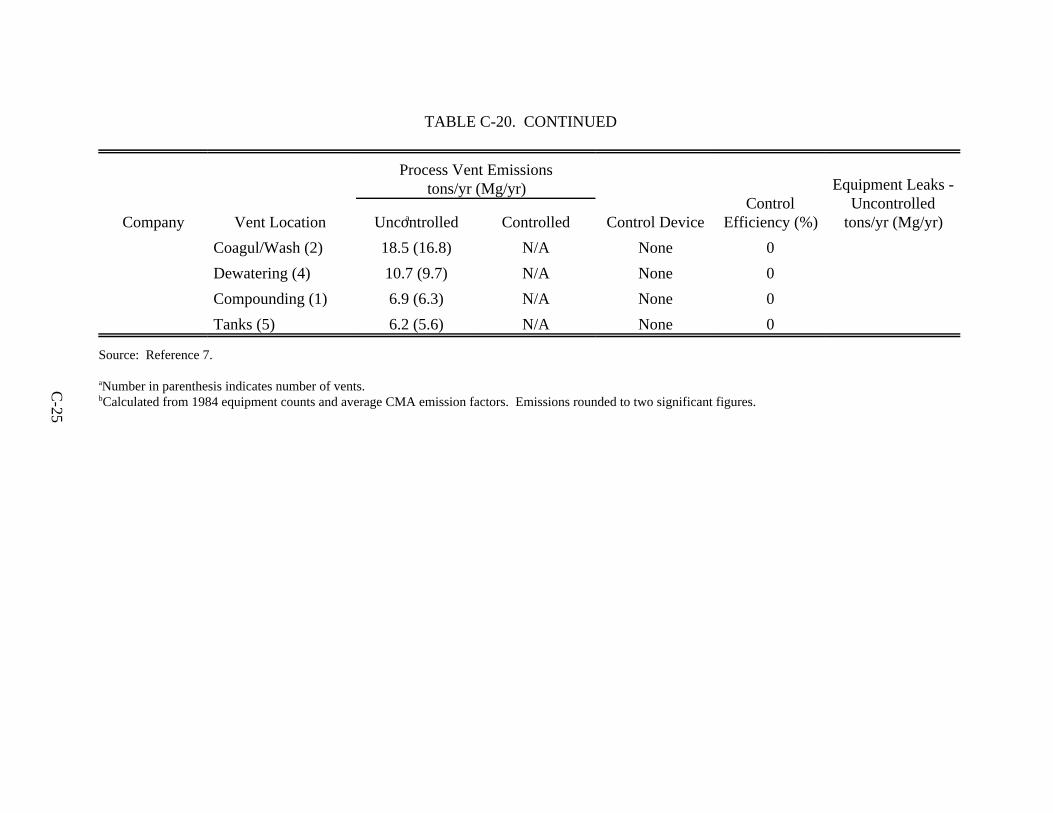
C-25
TABLE C-20. CONTINUED
Company Vent Location a
Process Vent Emissionstons/yr (Mg/yr)
Control DeviceControl
Efficiency (%)
Equipment Leaks -Uncontrolled
tons/yr (Mg/yr)Uncontrolled Controlled
Coagul/Wash (2) 18.5 (16.8) N/A None 0
Dewatering (4) 10.7 (9.7) N/A None 0
Compounding (1) 6.9 (6.3) N/A None 0
Tanks (5) 6.2 (5.6) N/A None 0
Source: Reference 7.
Number in parenthesis indicates number of vents.a
Calculated from 1984 equipment counts and average CMA emission factors. Emissions rounded to two significant figures.b
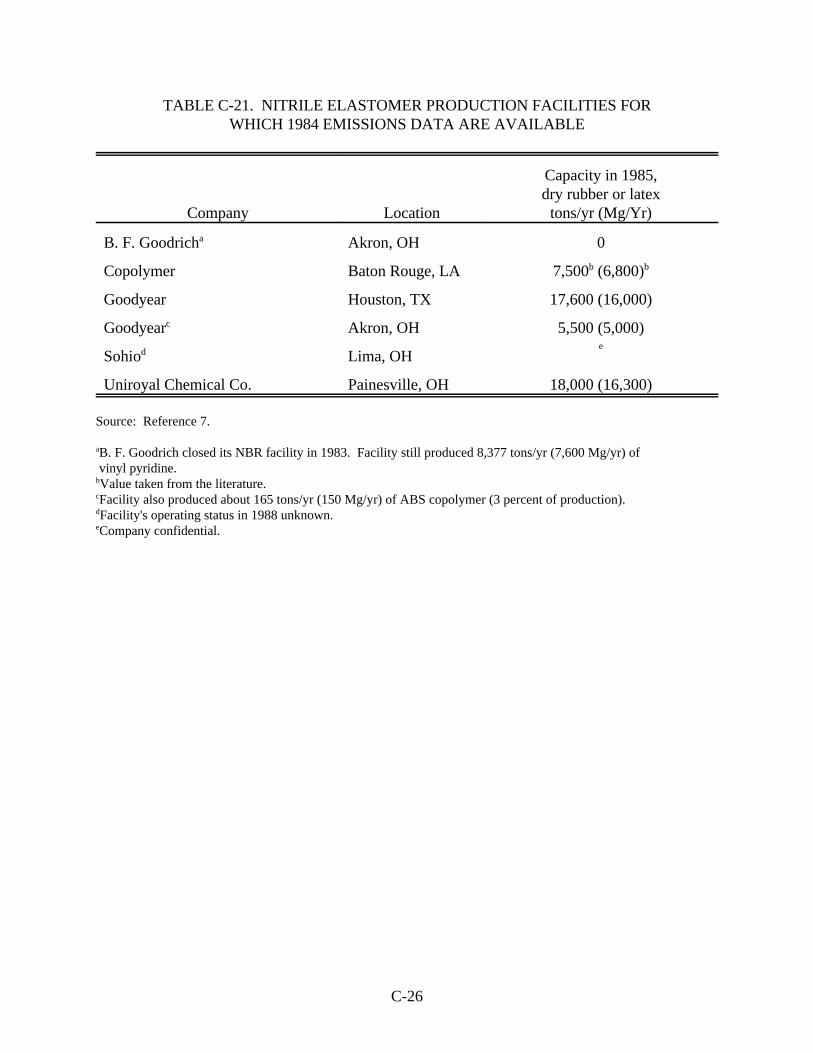
C-26
TABLE C-21. NITRILE ELASTOMER PRODUCTION FACILITIES FORWHICH 1984 EMISSIONS DATA ARE AVAILABLE
Company Location tons/yr (Mg/Yr)
Capacity in 1985,dry rubber or latex
B. F. Goodrich Akron, OH 0a
Copolymer Baton Rouge, LA 7,500 (6,800)b b
Goodyear Houston, TX 17,600 (16,000)
Goodyear Akron, OH 5,500 (5,000)c
Sohio Lima, OHde
Uniroyal Chemical Co. Painesville, OH 18,000 (16,300)
Source: Reference 7.
B. F. Goodrich closed its NBR facility in 1983. Facility still produced 8,377 tons/yr (7,600 Mg/yr) ofa
vinyl pyridine.Value taken from the literature.b
Facility also produced about 165 tons/yr (150 Mg/yr) of ABS copolymer (3 percent of production).c
Facility's operating status in 1988 unknown.d
Company confidential.e
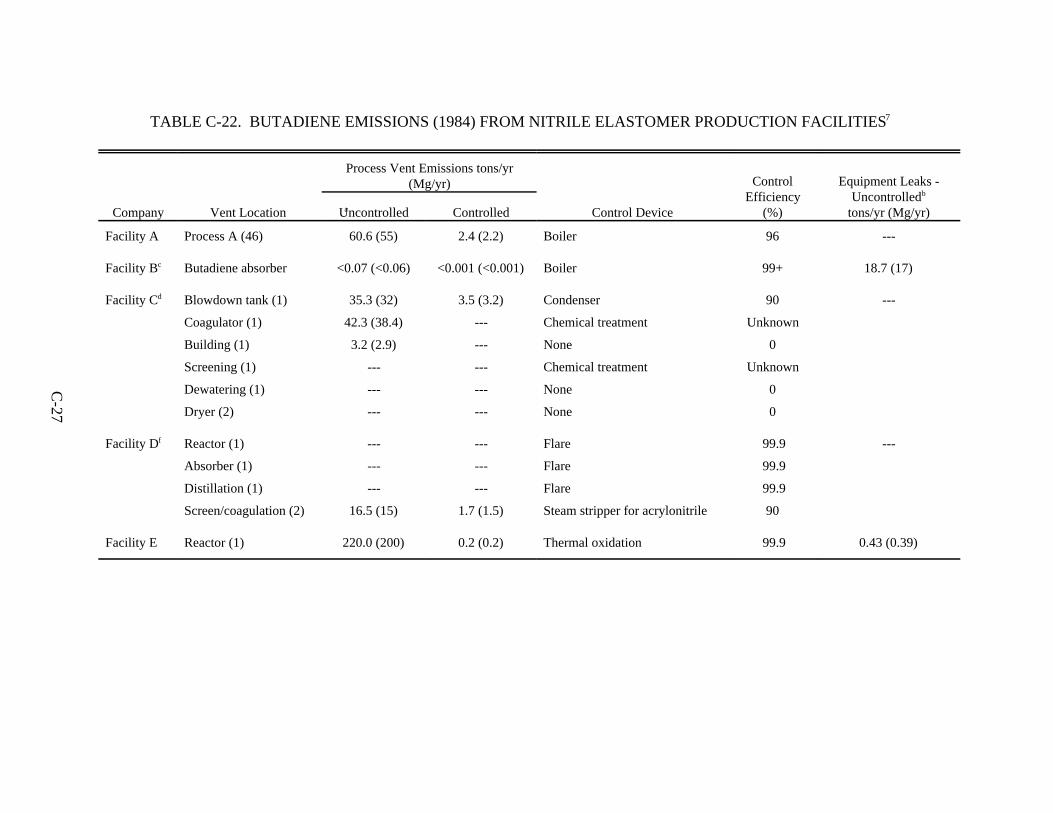
C-27
TABLE C-22. BUTADIENE EMISSIONS (1984) FROM NITRILE ELASTOMER PRODUCTION FACILITIES 7
Company Vent Location a
Process Vent Emissions tons/yr(Mg/yr)
Control Device
ControlEfficiency
(%)
Equipment Leaks -Uncontrolledb
tons/yr (Mg/yr)Uncontrolled Controlled
Facility A Process A (46) 60.6 (55) 2.4 (2.2) Boiler 96 ---
Facility Bc Butadiene absorber <0.07 (<0.06) <0.001 (<0.001) Boiler 99+ 18.7 (17)
Facility Cd Blowdown tank (1) 35.3 (32) 3.5 (3.2) Condenser 90 ---
Coagulator (1) 42.3 (38.4) --- Chemical treatment Unknown
Building (1) 3.2 (2.9) --- None 0
Screening (1) --- --- Chemical treatment Unknown
Dewatering (1) --- --- None 0
Dryer (2) --- --- None 0
Facility Df Reactor (1) --- --- Flare 99.9 ---
Absorber (1) --- --- Flare 99.9
Distillation (1) --- --- Flare 99.9
Screen/coagulation (2) 16.5 (15) 1.7 (1.5) Steam stripper for acrylonitrile 90
Facility E Reactor (1) 220.0 (200) 0.2 (0.2) Thermal oxidation 99.9 0.43 (0.39)
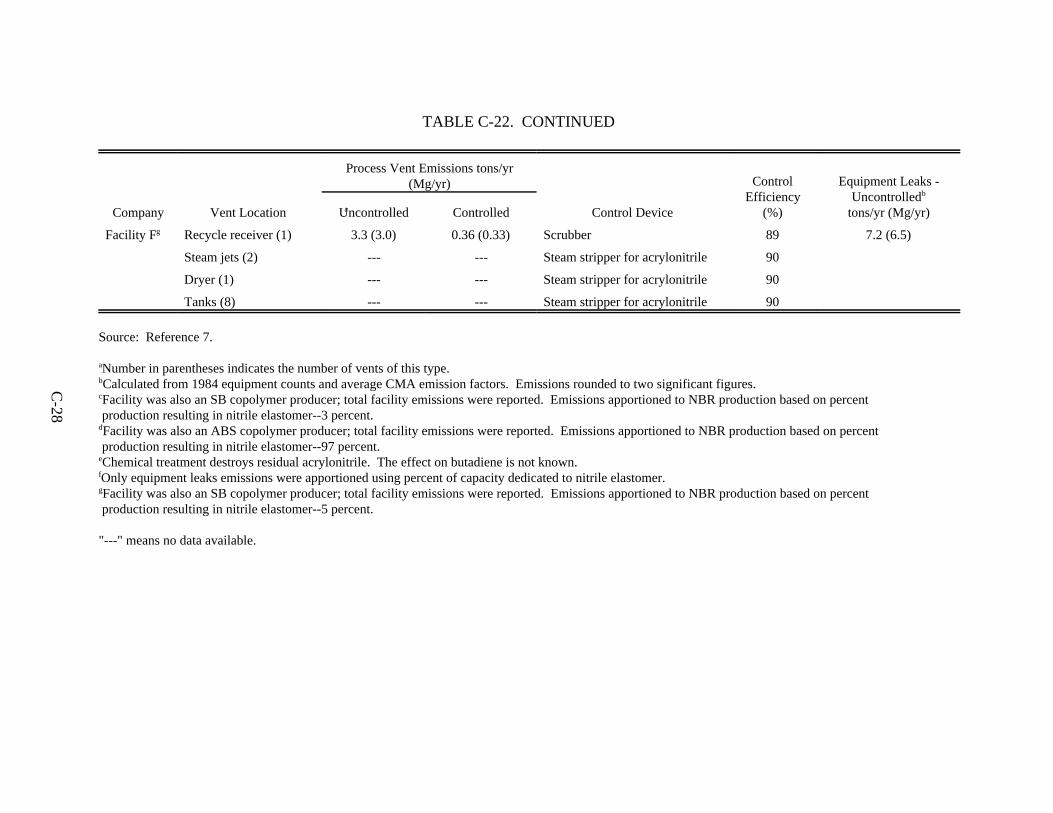
C-28
TABLE C-22. CONTINUED
Company Vent Location a
Process Vent Emissions tons/yr(Mg/yr)
Control Device
ControlEfficiency
(%)
Equipment Leaks -Uncontrolledb
tons/yr (Mg/yr)Uncontrolled Controlled
Facility Fg Recycle receiver (1) 3.3 (3.0) 0.36 (0.33) Scrubber 89 7.2 (6.5)
Steam jets (2) --- --- Steam stripper for acrylonitrile 90
Dryer (1) --- --- Steam stripper for acrylonitrile 90
Tanks (8) --- --- Steam stripper for acrylonitrile 90
Source: Reference 7.
Number in parentheses indicates the number of vents of this type.a
Calculated from 1984 equipment counts and average CMA emission factors. Emissions rounded to two significant figures.b
Facility was also an SB copolymer producer; total facility emissions were reported. Emissions apportioned to NBR production based on percentc
production resulting in nitrile elastomer--3 percent.Facility was also an ABS copolymer producer; total facility emissions were reported. Emissions apportioned to NBR production based on percentd
production resulting in nitrile elastomer--97 percent.Chemical treatment destroys residual acrylonitrile. The effect on butadiene is not known.e
Only equipment leaks emissions were apportioned using percent of capacity dedicated to nitrile elastomer.f
Facility was also an SB copolymer producer; total facility emissions were reported. Emissions apportioned to NBR production based on percentg
production resulting in nitrile elastomer--5 percent.
"---" means no data available.
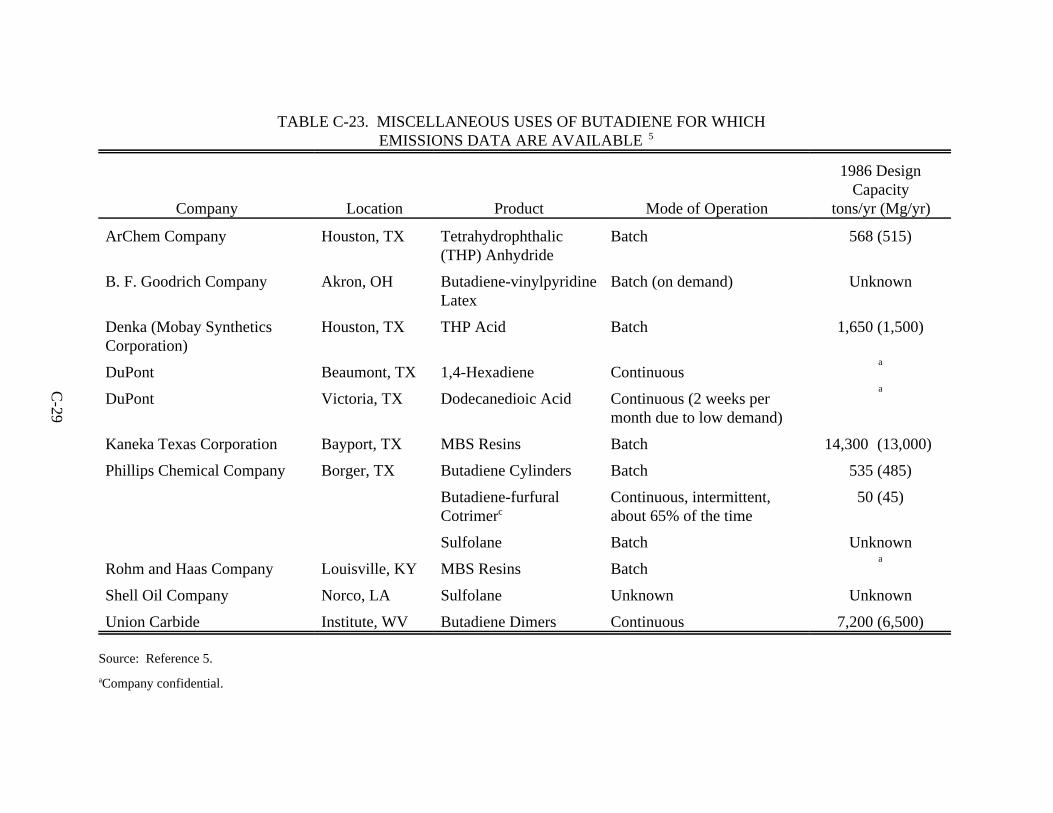
C-29
TABLE C-23. MISCELLANEOUS USES OF BUTADIENE FOR WHICHEMISSIONS DATA ARE AVAILABLE 5
Company Location Product Mode of Operation
1986 DesignCapacity
tons/yr (Mg/yr)
ArChem Company Houston, TX Tetrahydrophthalic(THP) Anhydride
Batch 568 (515)
B. F. Goodrich Company Akron, OH Butadiene-vinylpyridineLatex
Batch (on demand) Unknown
Denka (Mobay SyntheticsCorporation)
Houston, TX THP Acid Batch 1,650 (1,500)
DuPont Beaumont, TX 1,4-Hexadiene Continuousa
DuPont Victoria, TX Dodecanedioic Acid Continuous (2 weeks permonth due to low demand)
a
Kaneka Texas Corporation Bayport, TX MBS Resins Batch 14,300 (13,000)
Phillips Chemical Company Borger, TX Butadiene Cylinders cBatch 535 (485)
Butadiene-furfuralCotrimerc
Continuous, intermittent,about 65% of the time
50 (45)
Sulfolane Batch Unknown
Rohm and Haas Company Louisville, KY MBS Resins Batcha
Shell Oil Company Norco, LA Sulfolane Unknown Unknown
Union Carbide Institute, WV Butadiene Dimers Continuous 7,200 (6,500)
Source: Reference 5.
Company confidential.a
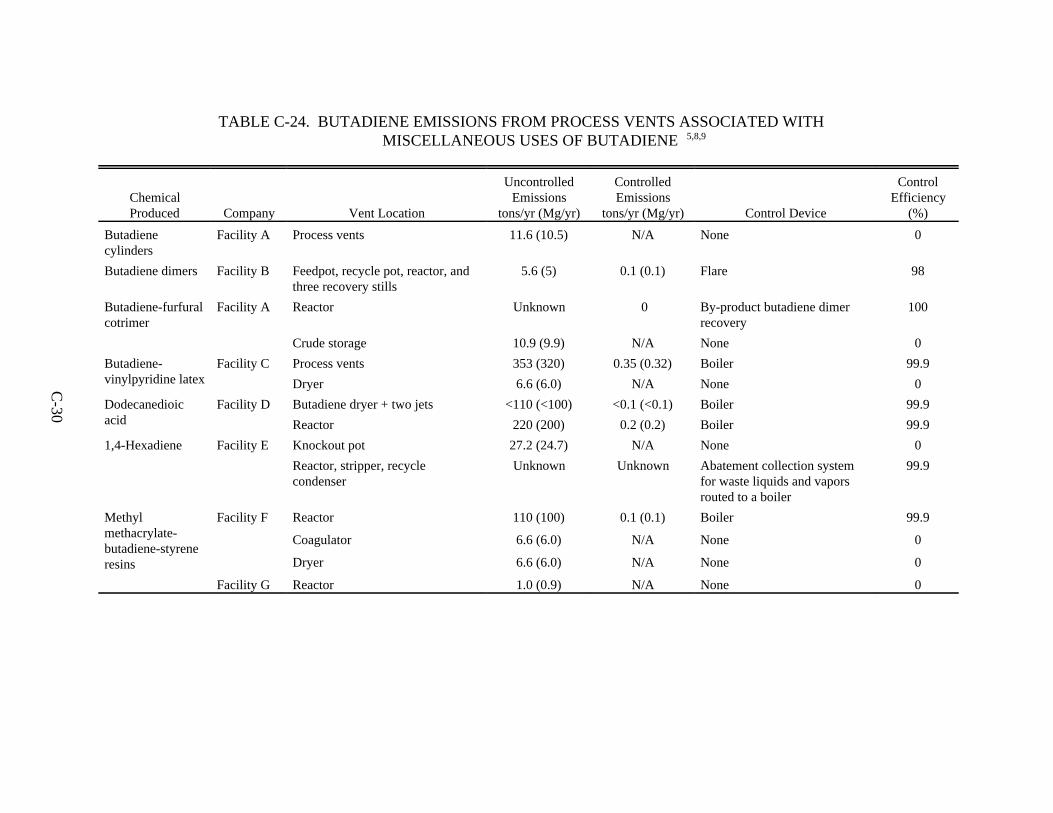
C-30
TABLE C-24. BUTADIENE EMISSIONS FROM PROCESS VENTS ASSOCIATED WITH MISCELLANEOUS USES OF BUTADIENE 5,8,9
ChemicalProduced Company Vent Location
UncontrolledEmissions
tons/yr (Mg/yr)
ControlledEmissions
tons/yr (Mg/yr) Control Device
ControlEfficiency
(%)
Butadienecylinders
Facility A Process vents 11.6 (10.5) N/A None 0
Butadiene dimers Facility B Feedpot, recycle pot, reactor, andthree recovery stills
5.6 (5) 0.1 (0.1) Flare 98
Butadiene-furfuralcotrimer
Facility A Reactor Unknown 0 By-product butadiene dimerrecovery
100
Crude storage 10.9 (9.9) N/A None 0
Butadiene-vinylpyridine latex
Facility C Process vents 353 (320) 0.35 (0.32) Boiler 99.9
Dryer 6.6 (6.0) N/A None 0
Dodecanedioicacid
Facility D Butadiene dryer + two jets <110 (<100) <0.1 (<0.1) Boiler 99.9
Reactor 220 (200) 0.2 (0.2) Boiler 99.9
1,4-Hexadiene Facility E Knockout pot 27.2 (24.7) N/A None 0
Reactor, stripper, recyclecondenser
Unknown Unknown Abatement collection systemfor waste liquids and vaporsrouted to a boiler
99.9
Methylmethacrylate-butadiene-styreneresins
Facility F Reactor 110 (100) 0.1 (0.1) Boiler 99.9
Coagulator 6.6 (6.0) N/A None 0
Dryer 6.6 (6.0) N/A None 0
Facility G Reactor 1.0 (0.9) N/A None 0
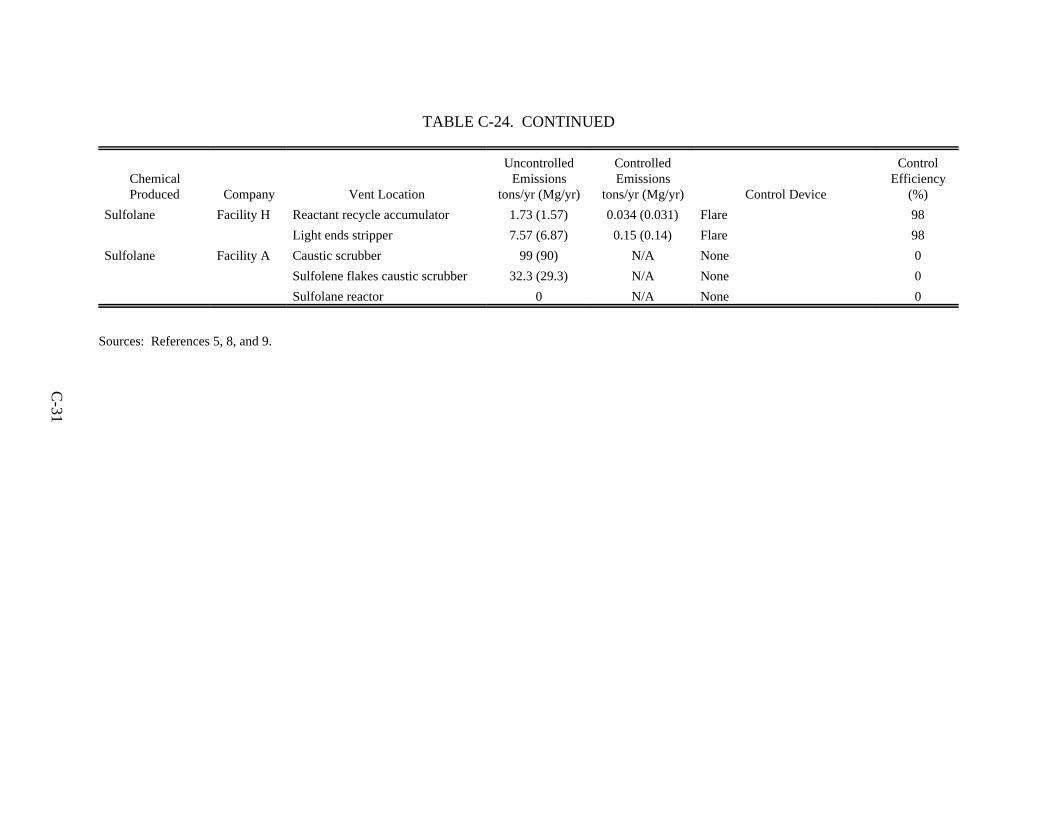
C-31
TABLE C-24. CONTINUED
ChemicalProduced Company Vent Location
UncontrolledEmissions
tons/yr (Mg/yr)
ControlledEmissions
tons/yr (Mg/yr) Control Device
ControlEfficiency
(%)
Sulfolane Facility H Reactant recycle accumulator 1.73 (1.57) 0.034 (0.031) Flare 98
Light ends stripper 7.57 (6.87) 0.15 (0.14) Flare 98
Sulfolane Facility A Caustic scrubber 99 (90) N/A None 0
Sulfolene flakes caustic scrubber 32.3 (29.3) N/A None 0
Sulfolane reactor 0 N/A None 0
Sources: References 5, 8, and 9.
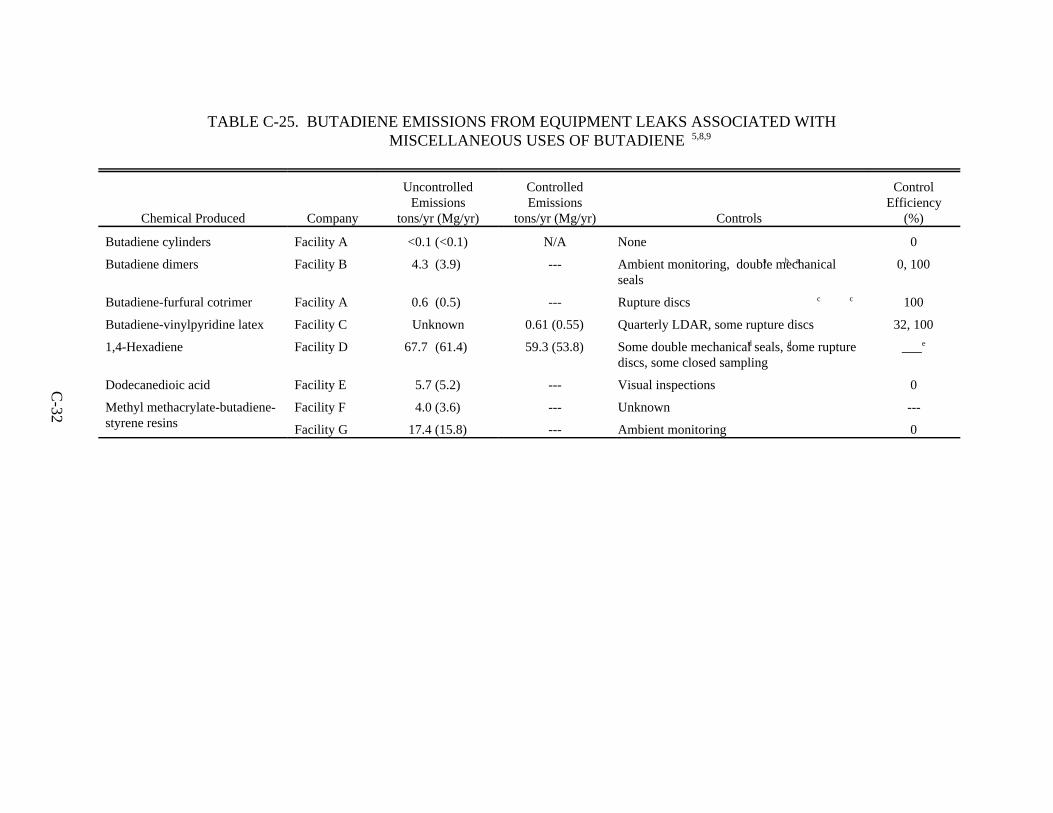
C-32
TABLE C-25. BUTADIENE EMISSIONS FROM EQUIPMENT LEAKS ASSOCIATED WITH MISCELLANEOUS USES OF BUTADIENE 5,8,9
Chemical Produced Company
UncontrolledEmissions
tons/yr (Mg/yr)
ControlledEmissions
tons/yr (Mg/yr) Controls
ControlEfficiency
(%)
Butadiene cylinders Facility A <0.1 (<0.1) N/A None 0
Butadiene dimers Facility B 4.3 (3.9) a a--- Ambient monitoring, double mechanicalb
seals0, 100
Butadiene-furfural cotrimer Facility A 0.6 (0.5) c c--- Rupture discs 100
Butadiene-vinylpyridine latex Facility C Unknown 0.61 (0.55) Quarterly LDAR, some rupture discs 32, 100
1,4-Hexadiene Facility D 67.7 (61.4) d d59.3 (53.8) Some double mechanical seals, some rupturediscs, some closed sampling
___e
Dodecanedioic acid Facility E 5.7 (5.2) --- Visual inspections 0
Methyl methacrylate-butadiene-styrene resins
Facility F 4.0 (3.6) --- Unknown ---
Facility G 17.4 (15.8) --- Ambient monitoring 0
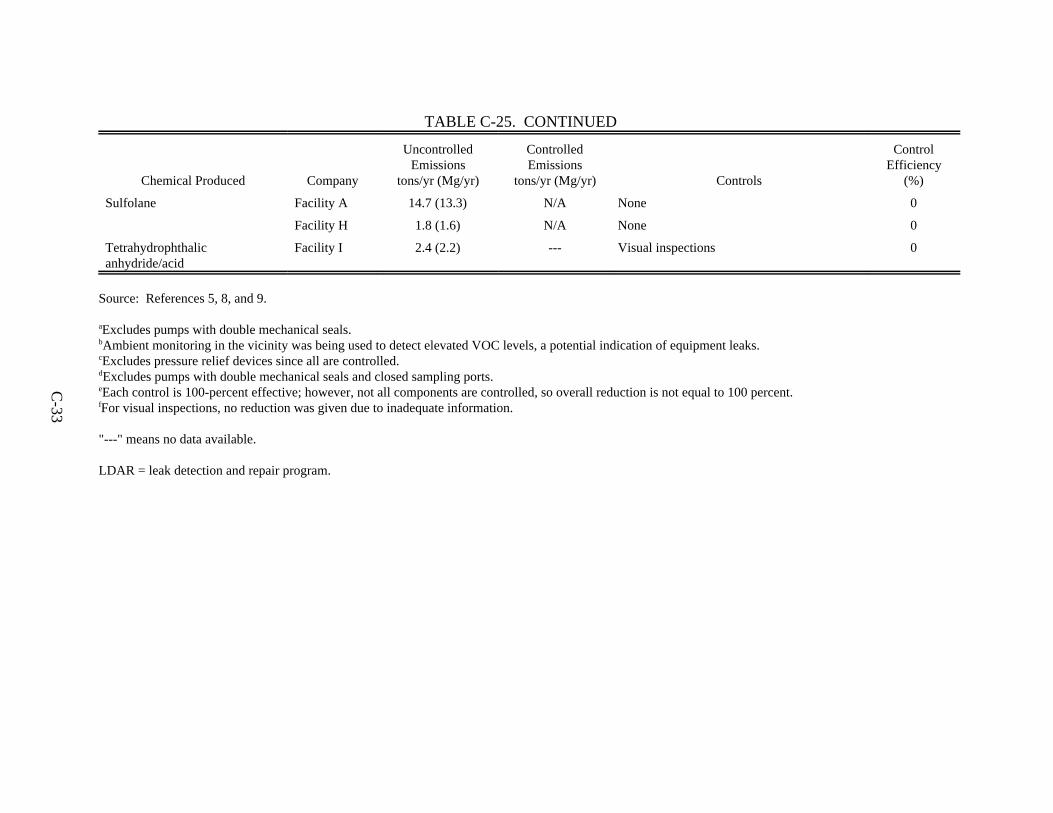
C-33
TABLE C-25. CONTINUED
Chemical Produced Company
UncontrolledEmissions
tons/yr (Mg/yr)
ControlledEmissions
tons/yr (Mg/yr) Controls
ControlEfficiency
(%)
Sulfolane Facility A 14.7 (13.3) N/A None 0
Facility H 1.8 (1.6) N/A None 0
Tetrahydrophthalicanhydride/acid
Facility I 2.4 (2.2) --- Visual inspections 0
Source: References 5, 8, and 9.
Excludes pumps with double mechanical seals.a
Ambient monitoring in the vicinity was being used to detect elevated VOC levels, a potential indication of equipment leaks.b
Excludes pressure relief devices since all are controlled.c
Excludes pumps with double mechanical seals and closed sampling ports.d
Each control is 100-percent effective; however, not all components are controlled, so overall reduction is not equal to 100 percent.e
For visual inspections, no reduction was given due to inadequate information.f
"---" means no data available.
LDAR = leak detection and repair program.
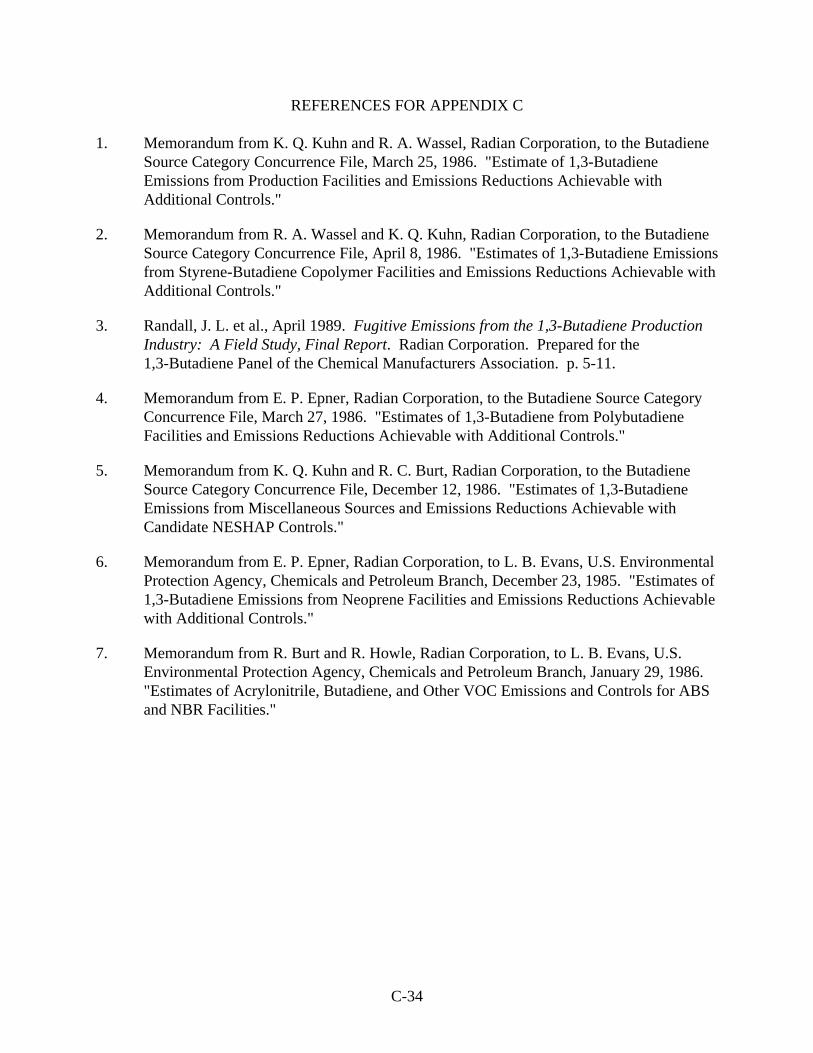
C-34
1. Memorandum from K. Q. Kuhn and R. A. Wassel, Radian Corporation, to the ButadieneSource Category Concurrence File, March 25, 1986. "Estimate of 1,3-ButadieneEmissions from Production Facilities and Emissions Reductions Achievable withAdditional Controls."
2. Memorandum from R. A. Wassel and K. Q. Kuhn, Radian Corporation, to the ButadieneSource Category Concurrence File, April 8, 1986. "Estimates of 1,3-Butadiene Emissionsfrom Styrene-Butadiene Copolymer Facilities and Emissions Reductions Achievable withAdditional Controls."
3. Randall, J. L. et al., April 1989. Fugitive Emissions from the 1,3-Butadiene ProductionIndustry: A Field Study, Final Report. Radian Corporation. Prepared for the1,3-Butadiene Panel of the Chemical Manufacturers Association. p. 5-11.
4. Memorandum from E. P. Epner, Radian Corporation, to the Butadiene Source CategoryConcurrence File, March 27, 1986. "Estimates of 1,3-Butadiene from PolybutadieneFacilities and Emissions Reductions Achievable with Additional Controls."
5. Memorandum from K. Q. Kuhn and R. C. Burt, Radian Corporation, to the ButadieneSource Category Concurrence File, December 12, 1986. "Estimates of 1,3-ButadieneEmissions from Miscellaneous Sources and Emissions Reductions Achievable withCandidate NESHAP Controls."
6. Memorandum from E. P. Epner, Radian Corporation, to L. B. Evans, U.S. EnvironmentalProtection Agency, Chemicals and Petroleum Branch, December 23, 1985. "Estimates of1,3-Butadiene Emissions from Neoprene Facilities and Emissions Reductions Achievablewith Additional Controls."
7. Memorandum from R. Burt and R. Howle, Radian Corporation, to L. B. Evans, U.S.Environmental Protection Agency, Chemicals and Petroleum Branch, January 29, 1986. "Estimates of Acrylonitrile, Butadiene, and Other VOC Emissions and Controls for ABSand NBR Facilities."
REFERENCES FOR APPENDIX C
APPENDIX D
ESTIMATION METHODS FOR EQUIPMENT LEAKS
APPENDIX D
ESTIMATION METHODS FOR EQUIPMENT LEAKS
An estimate of equipment leak emissions of butadiene depends on the
equipment type (e.g., pump seals, flanges, valves, etc.), the associated emission factor, and the
number of process components. For batch processes, the hours per year that butadiene
actually flows through the component is estimated from the reported percent of the year the
equipment operates. For continuous processes, butadiene is assumed to flow through the
equipment 8,760 hours per year.
In 1988 and 1989, the Chemical Manufacturer’s Association established a panel
to study butadiene emissions from equipment leaks. Out of this study, the panel produced
average butadiene emission rates (see Table 4-7). These emission rates represent a range of
controls at the facility in the study, thus they cannot be used to calculate uncontrolled
emissions. For butadiene producers and major users of butadiene, these emission rates can be
used to calculate emissions where the number of equipment components and time in service is
known. The estimate for each component type is the product of the emission rate, the
number of components, and the time in service.
componentspecificemission rate,
lb/hr/componentx
no. of equipmentcomponents in
butadiene servicex
no. of hrs/yrin butadiene
service
The estimate for all equipment leaks is the sum of the total for each component type.
D-1
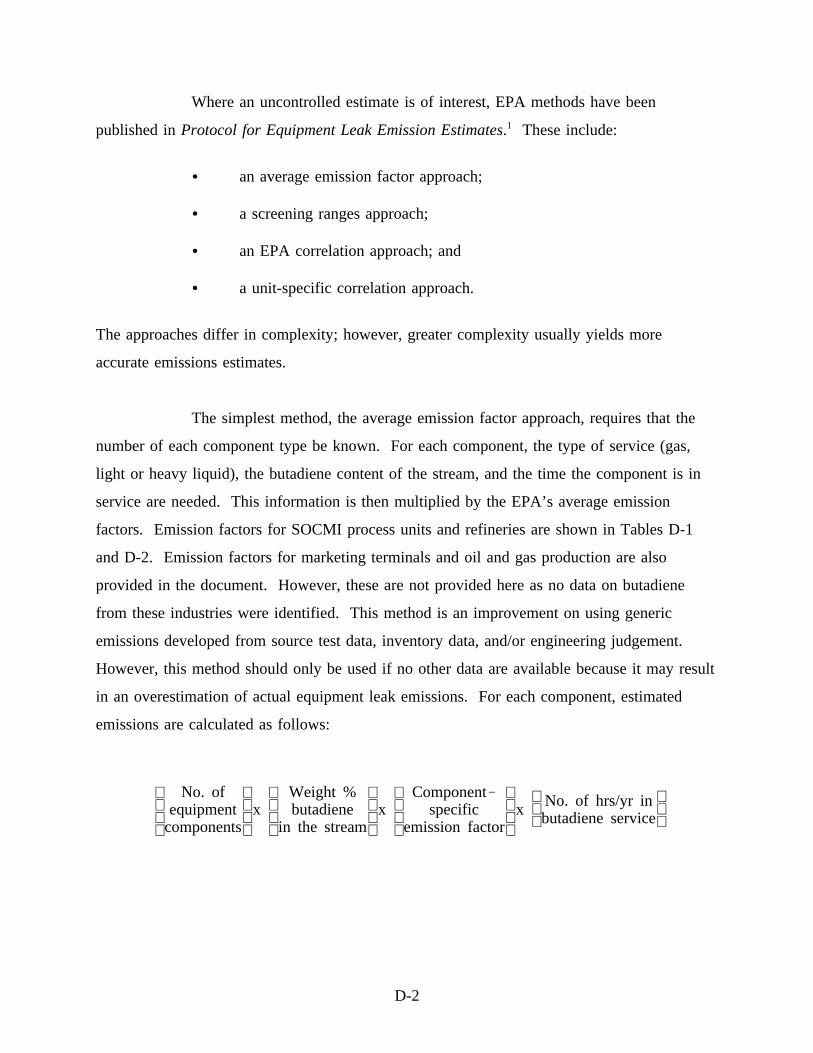
Where an uncontrolled estimate is of interest, EPA methods have been
published inProtocol for Equipment Leak Emission Estimates.1 These include:
an average emission factor approach;
a screening ranges approach;
an EPA correlation approach; and
a unit-specific correlation approach.
The approaches differ in complexity; however, greater complexity usually yields more
accurate emissions estimates.
The simplest method, the average emission factor approach, requires that the
number of each component type be known. For each component, the type of service (gas,
light or heavy liquid), the butadiene content of the stream, and the time the component is in
service are needed. This information is then multiplied by the EPA’s average emission
factors. Emission factors for SOCMI process units and refineries are shown in Tables D-1
and D-2. Emission factors for marketing terminals and oil and gas production are also
provided in the document. However, these are not provided here as no data on butadiene
from these industries were identified. This method is an improvement on using generic
emissions developed from source test data, inventory data, and/or engineering judgement.
However, this method should only be used if no other data are available because it may result
in an overestimation of actual equipment leak emissions. For each component, estimated
emissions are calculated as follows:
No. ofequipment
componentsx
Weight %butadiene
in the streamx
Componentspecific
emission factorx
No. of hrs/yr inbutadiene service
D-2
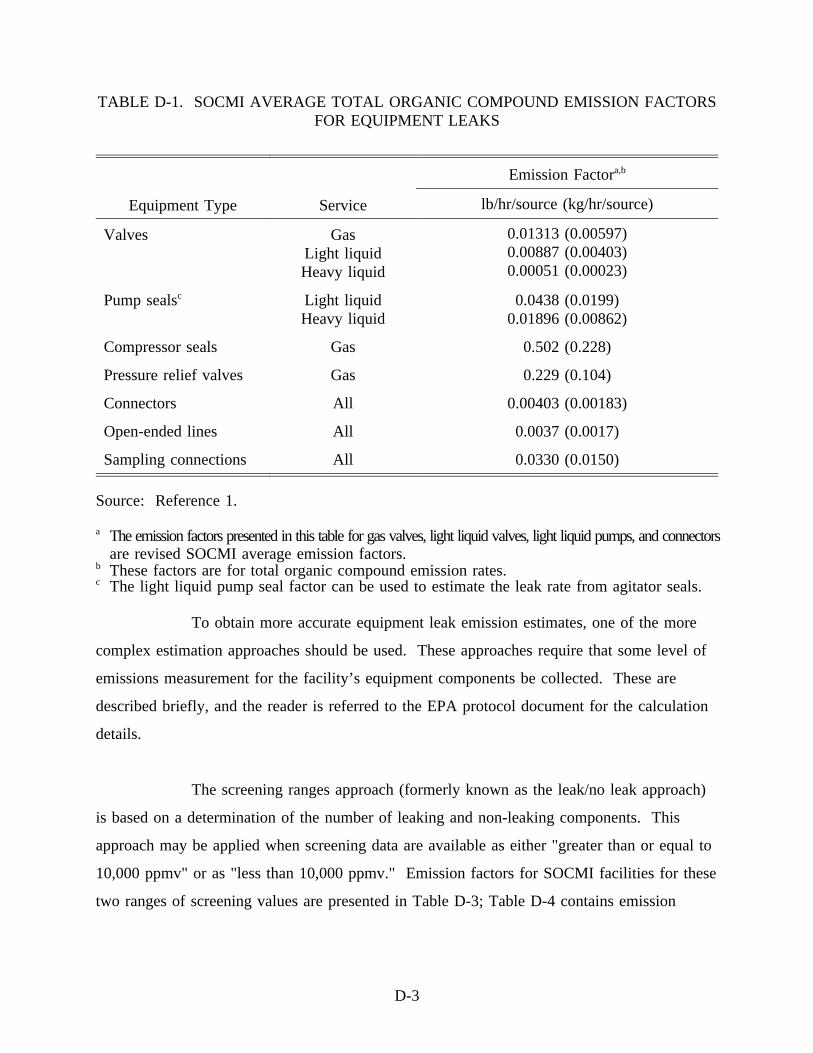
To obtain more accurate equipment leak emission estimates, one of the more
TABLE D-1. SOCMI AVERAGE TOTAL ORGANIC COMPOUND EMISSION FACTORSFOR EQUIPMENT LEAKS
Equipment Type Service
Emission Factora,b
lb/hr/source (kg/hr/source)
Valves GasLight liquidHeavy liquid
0.01313 (0.00597)0.00887 (0.00403)0.00051 (0.00023)
Pump sealsc Light liquidHeavy liquid
0.0438 (0.0199)0.01896 (0.00862)
Compressor seals Gas 0.502 (0.228)
Pressure relief valves Gas 0.229 (0.104)
Connectors All 0.00403 (0.00183)
Open-ended lines All 0.0037 (0.0017)
Sampling connections All 0.0330 (0.0150)
Source: Reference 1.
a The emission factors presented in this table for gas valves, light liquid valves, light liquid pumps, and connectorsare revised SOCMI average emission factors.
b These factors are for total organic compound emission rates.c The light liquid pump seal factor can be used to estimate the leak rate from agitator seals.
complex estimation approaches should be used. These approaches require that some level of
emissions measurement for the facility’s equipment components be collected. These are
described briefly, and the reader is referred to the EPA protocol document for the calculation
details.
The screening ranges approach (formerly known as the leak/no leak approach)
is based on a determination of the number of leaking and non-leaking components. This
approach may be applied when screening data are available as either "greater than or equal to
10,000 ppmv" or as "less than 10,000 ppmv." Emission factors for SOCMI facilities for these
two ranges of screening values are presented in Table D-3; Table D-4 contains emission
D-3
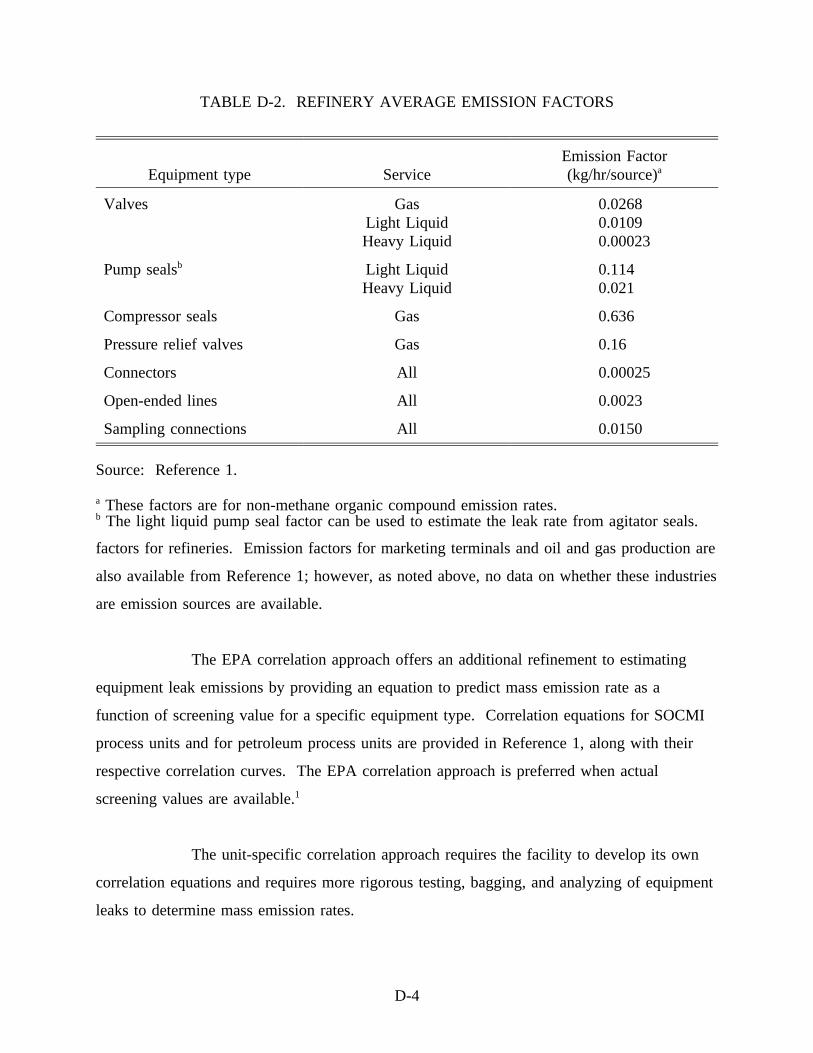
factors for refineries. Emission factors for marketing terminals and oil and gas production are
TABLE D-2. REFINERY AVERAGE EMISSION FACTORS
Equipment type ServiceEmission Factor(kg/hr/source)a
Valves GasLight LiquidHeavy Liquid
0.02680.01090.00023
Pump sealsb Light LiquidHeavy Liquid
0.1140.021
Compressor seals Gas 0.636
Pressure relief valves Gas 0.16
Connectors All 0.00025
Open-ended lines All 0.0023
Sampling connections All 0.0150
Source: Reference 1.
a These factors are for non-methane organic compound emission rates.b The light liquid pump seal factor can be used to estimate the leak rate from agitator seals.
also available from Reference 1; however, as noted above, no data on whether these industries
are emission sources are available.
The EPA correlation approach offers an additional refinement to estimating
equipment leak emissions by providing an equation to predict mass emission rate as a
function of screening value for a specific equipment type. Correlation equations for SOCMI
process units and for petroleum process units are provided in Reference 1, along with their
respective correlation curves. The EPA correlation approach is preferred when actual
screening values are available.1
The unit-specific correlation approach requires the facility to develop its own
correlation equations and requires more rigorous testing, bagging, and analyzing of equipment
leaks to determine mass emission rates.
D-4
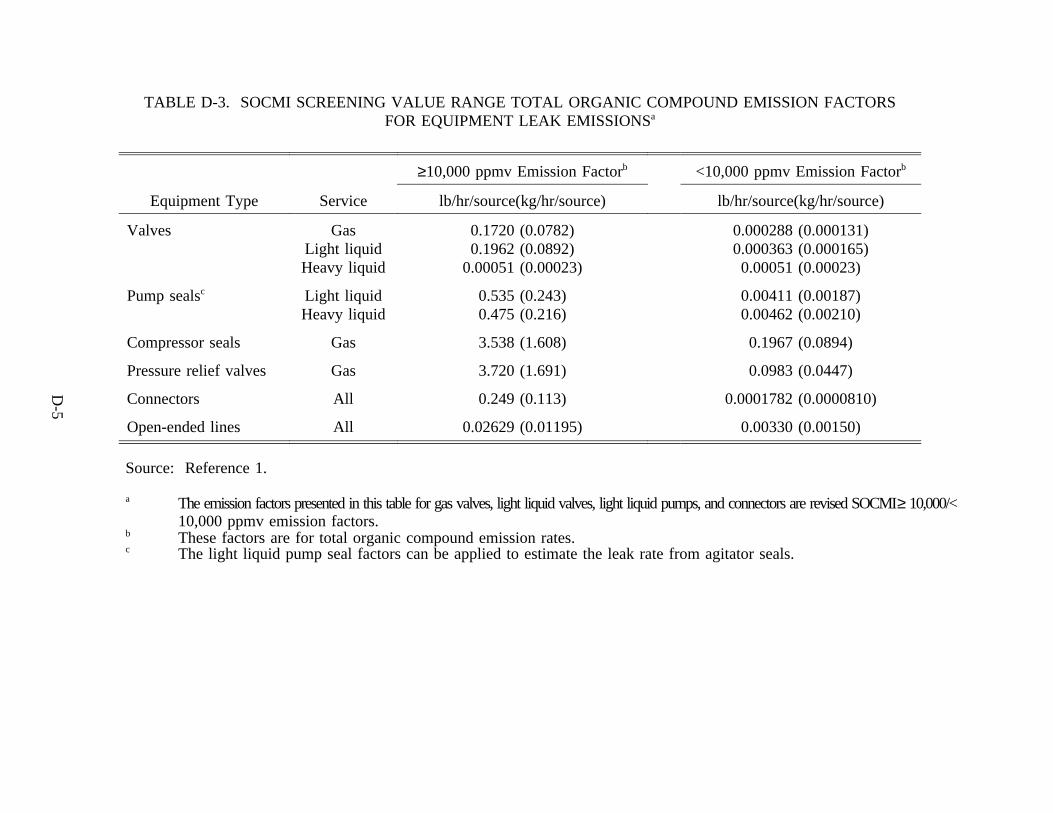
TABLE D-3. SOCMI SCREENING VALUE RANGE TOTAL ORGANIC COMPOUND EMISSION FACTORSFOR EQUIPMENT LEAK EMISSIONSa
Equipment Type Service
≥10,000 ppmv Emission Factorb <10,000 ppmv Emission Factorb
lb/hr/source(kg/hr/source) lb/hr/source(kg/hr/source)
Valves GasLight liquidHeavy liquid
0.1720 (0.0782)0.1962 (0.0892)
0.00051 (0.00023)
0.000288 (0.000131)0.000363 (0.000165)0.00051 (0.00023)
Pump sealsc Light liquidHeavy liquid
0.535 (0.243)0.475 (0.216)
0.00411 (0.00187)0.00462 (0.00210)
Compressor seals Gas 3.538 (1.608) 0.1967 (0.0894)
Pressure relief valves Gas 3.720 (1.691) 0.0983 (0.0447)
Connectors All 0.249 (0.113) 0.0001782 (0.0000810)
Open-ended lines All 0.02629 (0.01195) 0.00330 (0.00150)
Source: Reference 1.
a The emission factors presented in this table for gas valves, light liquid valves, light liquid pumps, and connectors are revised SOCMI≥ 10,000/<10,000 ppmv emission factors.
b These factors are for total organic compound emission rates.c The light liquid pump seal factors can be applied to estimate the leak rate from agitator seals.
D-5
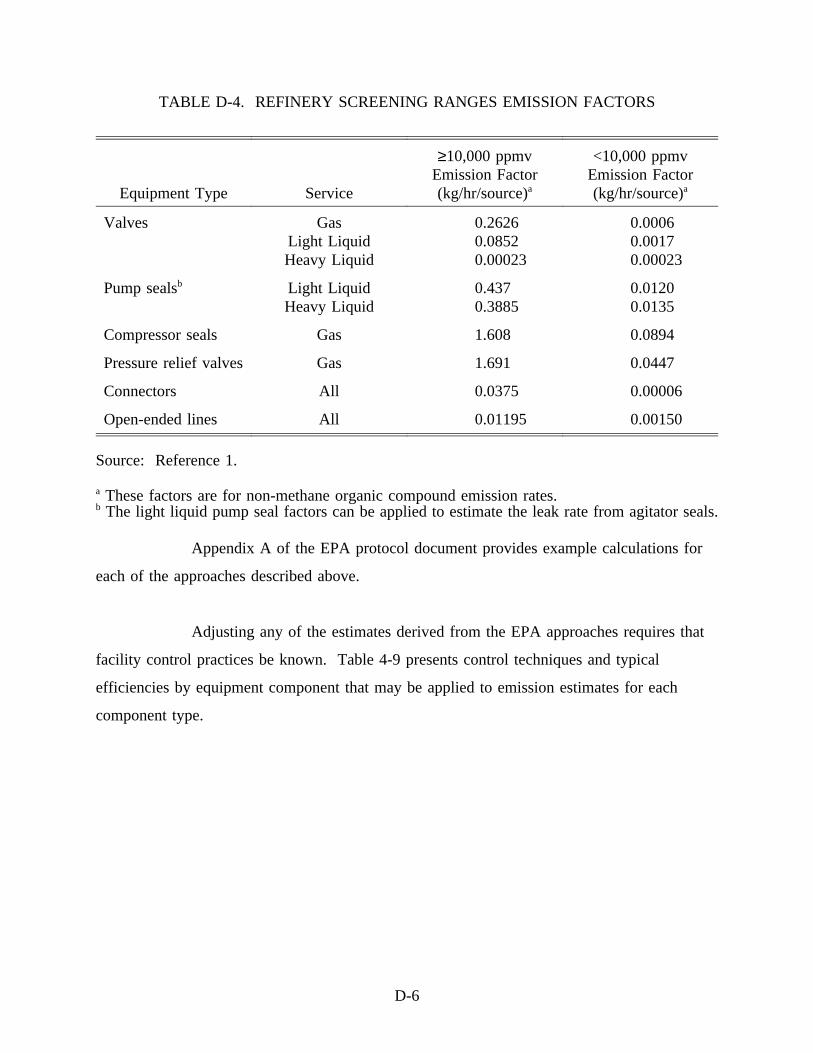
Appendix A of the EPA protocol document provides example calculations for
TABLE D-4. REFINERY SCREENING RANGES EMISSION FACTORS
Equipment Type Service
≥10,000 ppmvEmission Factor(kg/hr/source)a
<10,000 ppmvEmission Factor(kg/hr/source)a
Valves GasLight LiquidHeavy Liquid
0.26260.08520.00023
0.00060.00170.00023
Pump sealsb Light LiquidHeavy Liquid
0.4370.3885
0.01200.0135
Compressor seals Gas 1.608 0.0894
Pressure relief valves Gas 1.691 0.0447
Connectors All 0.0375 0.00006
Open-ended lines All 0.01195 0.00150
Source: Reference 1.
a These factors are for non-methane organic compound emission rates.b The light liquid pump seal factors can be applied to estimate the leak rate from agitator seals.
each of the approaches described above.
Adjusting any of the estimates derived from the EPA approaches requires that
facility control practices be known. Table 4-9 presents control techniques and typical
efficiencies by equipment component that may be applied to emission estimates for each
component type.
D-6
REFERENCES FOR APPENDIX D
1. U.S. EPA.Protocol for Equipment Leak Emission Estimates. EPA-453/R-95-017. ResearchTriangle Park, North Carolina: U.S. Environmental Protection Agency, Office of Air QualityPlanning and Standards, 1995. p. 2-10.
D-7
APPENDIX E
SUMMARY OF 1992 TRI AIR EMISSIONS DATA FOR 1,3-BUTADIENE
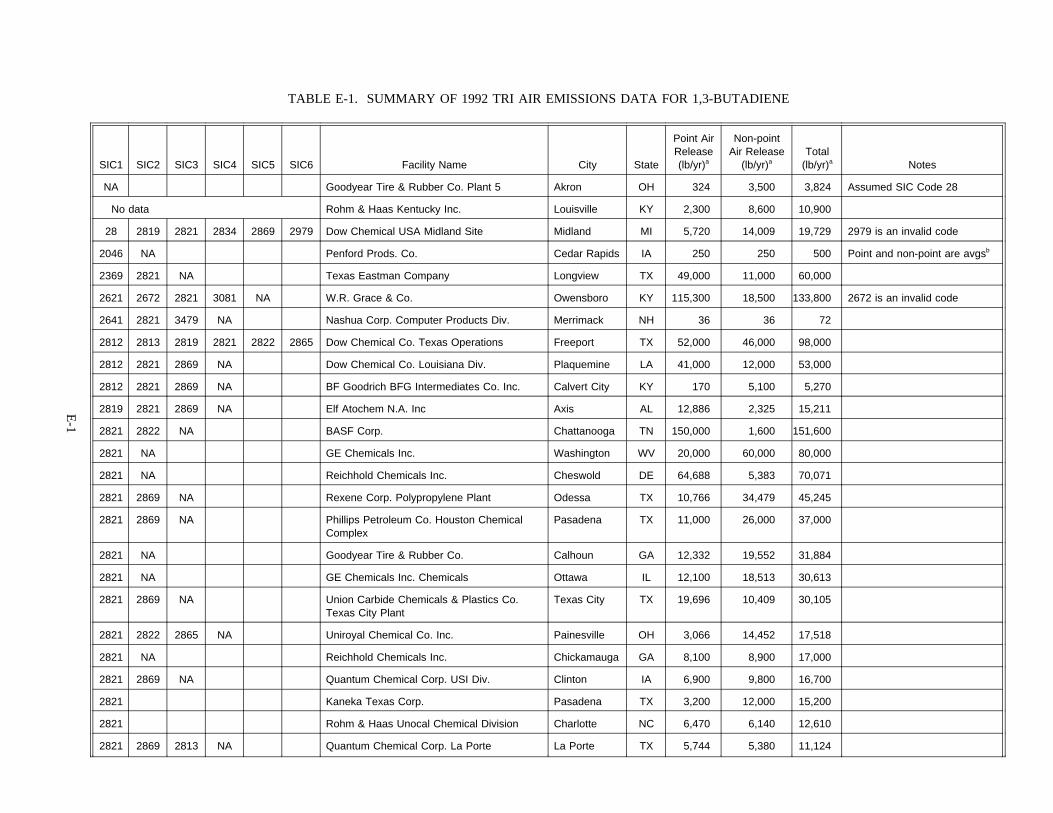
E-1
TABLE E-1. SUMMARY OF 1992 TRI AIR EMISSIONS DATA FOR 1,3-BUTADIENE
SIC1 SIC2 SIC3 SIC4 SIC5 SIC6 Facility Name City State
Point AirRelease(lb/yr)a
Non-pointAir Release
(lb/yr)aTotal
(lb/yr)a Notes
NA Goodyear Tire & Rubber Co. Plant 5 Akron OH 324 3,500 3,824 Assumed SIC Code 28
No data Rohm & Haas Kentucky Inc. Louisville KY 2,300 8,600 10,900
28 2819 2821 2834 2869 2979 Dow Chemical USA Midland Site Midland MI 5,720 14,009 19,729 2979 is an invalid code
2046 NA Penford Prods. Co. Cedar Rapids IA 250 250 500 Point and non-point are avgsb
2369 2821 NA Texas Eastman Company Longview TX 49,000 11,000 60,000
2621 2672 2821 3081 NA W.R. Grace & Co. Owensboro KY 115,300 18,500 133,800 2672 is an invalid code
2641 2821 3479 NA Nashua Corp. Computer Products Div. Merrimack NH 36 36 72
2812 2813 2819 2821 2822 2865 Dow Chemical Co. Texas Operations Freeport TX 52,000 46,000 98,000
2812 2821 2869 NA Dow Chemical Co. Louisiana Div. Plaquemine LA 41,000 12,000 53,000
2812 2821 2869 NA BF Goodrich BFG Intermediates Co. Inc. Calvert City KY 170 5,100 5,270
2819 2821 2869 NA Elf Atochem N.A. Inc Axis AL 12,886 2,325 15,211
2821 2822 NA BASF Corp. Chattanooga TN 150,000 1,600 151,600
2821 NA GE Chemicals Inc. Washington WV 20,000 60,000 80,000
2821 NA Reichhold Chemicals Inc. Cheswold DE 64,688 5,383 70,071
2821 2869 NA Rexene Corp. Polypropylene Plant Odessa TX 10,766 34,479 45,245
2821 2869 NA Phillips Petroleum Co. Houston ChemicalComplex
Pasadena TX 11,000 26,000 37,000
2821 NA Goodyear Tire & Rubber Co. Calhoun GA 12,332 19,552 31,884
2821 NA GE Chemicals Inc. Chemicals Ottawa IL 12,100 18,513 30,613
2821 2869 NA Union Carbide Chemicals & Plastics Co.Texas City Plant
Texas City TX 19,696 10,409 30,105
2821 2822 2865 NA Uniroyal Chemical Co. Inc. Painesville OH 3,066 14,452 17,518
2821 NA Reichhold Chemicals Inc. Chickamauga GA 8,100 8,900 17,000
2821 2869 NA Quantum Chemical Corp. USI Div. Clinton IA 6,900 9,800 16,700
2821 Kaneka Texas Corp. Pasadena TX 3,200 12,000 15,200
2821 Rohm & Haas Unocal Chemical Division Charlotte NC 6,470 6,140 12,610
2821 2869 2813 NA Quantum Chemical Corp. La Porte La Porte TX 5,744 5,380 11,124
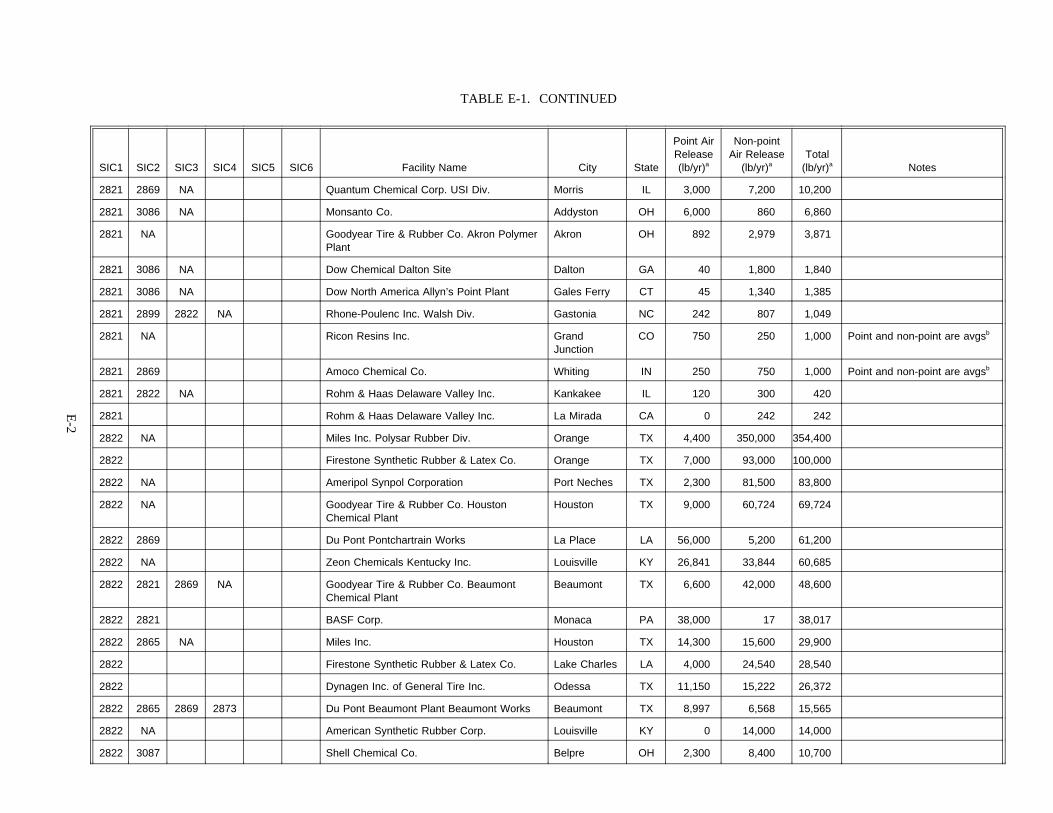
TABLE E-1. CONTINUED
E-2
SIC1 SIC2 SIC3 SIC4 SIC5 SIC6 Facility Name City State
Point AirRelease(lb/yr)a
Non-pointAir Release
(lb/yr)aTotal
(lb/yr)a Notes
2821 2869 NA Quantum Chemical Corp. USI Div. Morris IL 3,000 7,200 10,200
2821 3086 NA Monsanto Co. Addyston OH 6,000 860 6,860
2821 NA Goodyear Tire & Rubber Co. Akron PolymerPlant
Akron OH 892 2,979 3,871
2821 3086 NA Dow Chemical Dalton Site Dalton GA 40 1,800 1,840
2821 3086 NA Dow North America Allyn’s Point Plant Gales Ferry CT 45 1,340 1,385
2821 2899 2822 NA Rhone-Poulenc Inc. Walsh Div. Gastonia NC 242 807 1,049
2821 NA Ricon Resins Inc. GrandJunction
CO 750 250 1,000 Point and non-point are avgsb
2821 2869 Amoco Chemical Co. Whiting IN 250 750 1,000 Point and non-point are avgsb
2821 2822 NA Rohm & Haas Delaware Valley Inc. Kankakee IL 120 300 420
2821 Rohm & Haas Delaware Valley Inc. La Mirada CA 0 242 242
2822 NA Miles Inc. Polysar Rubber Div. Orange TX 4,400 350,000 354,400
2822 Firestone Synthetic Rubber & Latex Co. Orange TX 7,000 93,000 100,000
2822 NA Ameripol Synpol Corporation Port Neches TX 2,300 81,500 83,800
2822 NA Goodyear Tire & Rubber Co. HoustonChemical Plant
Houston TX 9,000 60,724 69,724
2822 2869 Du Pont Pontchartrain Works La Place LA 56,000 5,200 61,200
2822 NA Zeon Chemicals Kentucky Inc. Louisville KY 26,841 33,844 60,685
2822 2821 2869 NA Goodyear Tire & Rubber Co. BeaumontChemical Plant
Beaumont TX 6,600 42,000 48,600
2822 2821 BASF Corp. Monaca PA 38,000 17 38,017
2822 2865 NA Miles Inc. Houston TX 14,300 15,600 29,900
2822 Firestone Synthetic Rubber & Latex Co. Lake Charles LA 4,000 24,540 28,540
2822 Dynagen Inc. of General Tire Inc. Odessa TX 11,150 15,222 26,372
2822 2865 2869 2873 Du Pont Beaumont Plant Beaumont Works Beaumont TX 8,997 6,568 15,565
2822 NA American Synthetic Rubber Corp. Louisville KY 0 14,000 14,000
2822 3087 Shell Chemical Co. Belpre OH 2,300 8,400 10,700
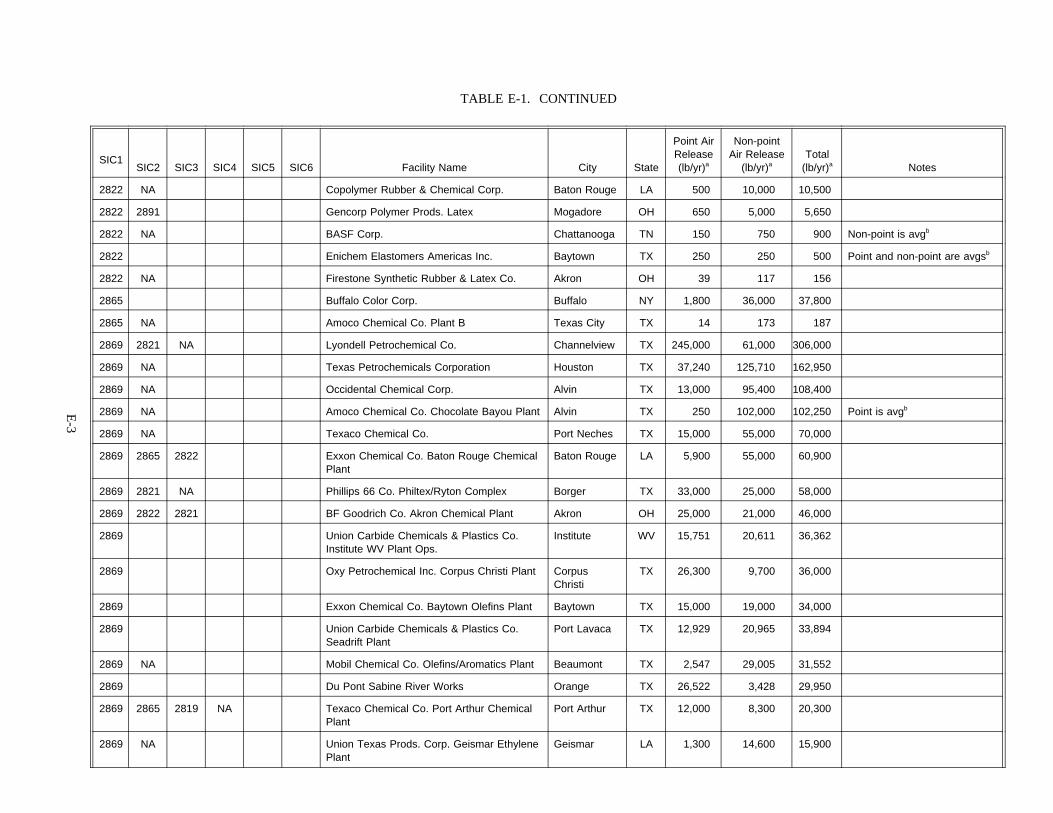
TABLE E-1. CONTINUED
E-3
SIC1SIC2 SIC3 SIC4 SIC5 SIC6 Facility Name City State
Point AirRelease(lb/yr)a
Non-pointAir Release
(lb/yr)aTotal
(lb/yr)a Notes
2822 NA Copolymer Rubber & Chemical Corp. Baton Rouge LA 500 10,000 10,500
2822 2891 Gencorp Polymer Prods. Latex Mogadore OH 650 5,000 5,650
2822 NA BASF Corp. Chattanooga TN 150 750 900 Non-point is avgb
2822 Enichem Elastomers Americas Inc. Baytown TX 250 250 500 Point and non-point are avgsb
2822 NA Firestone Synthetic Rubber & Latex Co. Akron OH 39 117 156
2865 Buffalo Color Corp. Buffalo NY 1,800 36,000 37,800
2865 NA Amoco Chemical Co. Plant B Texas City TX 14 173 187
2869 2821 NA Lyondell Petrochemical Co. Channelview TX 245,000 61,000 306,000
2869 NA Texas Petrochemicals Corporation Houston TX 37,240 125,710 162,950
2869 NA Occidental Chemical Corp. Alvin TX 13,000 95,400 108,400
2869 NA Amoco Chemical Co. Chocolate Bayou Plant Alvin TX 250 102,000 102,250 Point is avgb
2869 NA Texaco Chemical Co. Port Neches TX 15,000 55,000 70,000
2869 2865 2822 Exxon Chemical Co. Baton Rouge ChemicalPlant
Baton Rouge LA 5,900 55,000 60,900
2869 2821 NA Phillips 66 Co. Philtex/Ryton Complex Borger TX 33,000 25,000 58,000
2869 2822 2821 BF Goodrich Co. Akron Chemical Plant Akron OH 25,000 21,000 46,000
2869 Union Carbide Chemicals & Plastics Co.Institute WV Plant Ops.
Institute WV 15,751 20,611 36,362
2869 Oxy Petrochemical Inc. Corpus Christi Plant CorpusChristi
TX 26,300 9,700 36,000
2869 Exxon Chemical Co. Baytown Olefins Plant Baytown TX 15,000 19,000 34,000
2869 Union Carbide Chemicals & Plastics Co.Seadrift Plant
Port Lavaca TX 12,929 20,965 33,894
2869 NA Mobil Chemical Co. Olefins/Aromatics Plant Beaumont TX 2,547 29,005 31,552
2869 Du Pont Sabine River Works Orange TX 26,522 3,428 29,950
2869 2865 2819 NA Texaco Chemical Co. Port Arthur ChemicalPlant
Port Arthur TX 12,000 8,300 20,300
2869 NA Union Texas Prods. Corp. Geismar EthylenePlant
Geismar LA 1,300 14,600 15,900
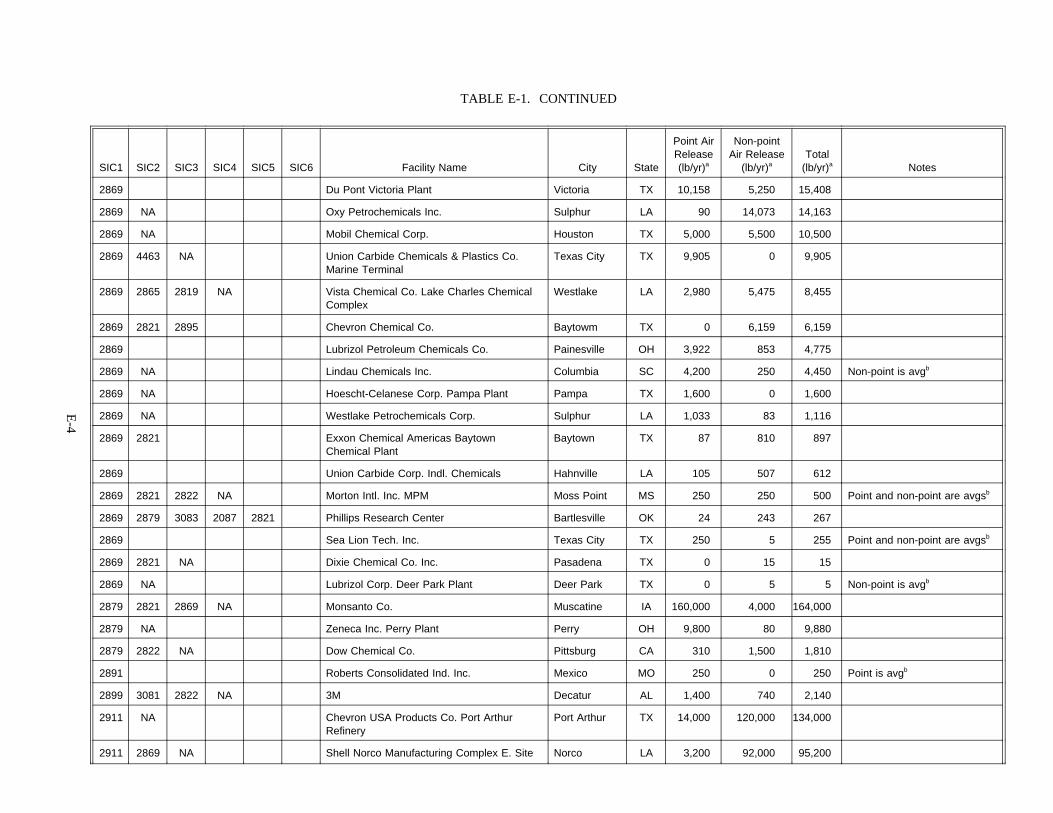
TABLE E-1. CONTINUED
E-4
SIC1 SIC2 SIC3 SIC4 SIC5 SIC6 Facility Name City State
Point AirRelease(lb/yr)a
Non-pointAir Release
(lb/yr)aTotal
(lb/yr)a Notes
2869 Du Pont Victoria Plant Victoria TX 10,158 5,250 15,408
2869 NA Oxy Petrochemicals Inc. Sulphur LA 90 14,073 14,163
2869 NA Mobil Chemical Corp. Houston TX 5,000 5,500 10,500
2869 4463 NA Union Carbide Chemicals & Plastics Co.Marine Terminal
Texas City TX 9,905 0 9,905
2869 2865 2819 NA Vista Chemical Co. Lake Charles ChemicalComplex
Westlake LA 2,980 5,475 8,455
2869 2821 2895 Chevron Chemical Co. Baytowm TX 0 6,159 6,159
2869 Lubrizol Petroleum Chemicals Co. Painesville OH 3,922 853 4,775
2869 NA Lindau Chemicals Inc. Columbia SC 4,200 250 4,450 Non-point is avgb
2869 NA Hoescht-Celanese Corp. Pampa Plant Pampa TX 1,600 0 1,600
2869 NA Westlake Petrochemicals Corp. Sulphur LA 1,033 83 1,116
2869 2821 Exxon Chemical Americas BaytownChemical Plant
Baytown TX 87 810 897
2869 Union Carbide Corp. Indl. Chemicals Hahnville LA 105 507 612
2869 2821 2822 NA Morton Intl. Inc. MPM Moss Point MS 250 250 500 Point and non-point are avgsb
2869 2879 3083 2087 2821 Phillips Research Center Bartlesville OK 24 243 267
2869 Sea Lion Tech. Inc. Texas City TX 250 5 255 Point and non-point are avgsb
2869 2821 NA Dixie Chemical Co. Inc. Pasadena TX 0 15 15
2869 NA Lubrizol Corp. Deer Park Plant Deer Park TX 0 5 5 Non-point is avgb
2879 2821 2869 NA Monsanto Co. Muscatine IA 160,000 4,000 164,000
2879 NA Zeneca Inc. Perry Plant Perry OH 9,800 80 9,880
2879 2822 NA Dow Chemical Co. Pittsburg CA 310 1,500 1,810
2891 Roberts Consolidated Ind. Inc. Mexico MO 250 0 250 Point is avgb
2899 3081 2822 NA 3M Decatur AL 1,400 740 2,140
2911 NA Chevron USA Products Co. Port ArthurRefinery
Port Arthur TX 14,000 120,000 134,000
2911 2869 NA Shell Norco Manufacturing Complex E. Site Norco LA 3,200 92,000 95,200
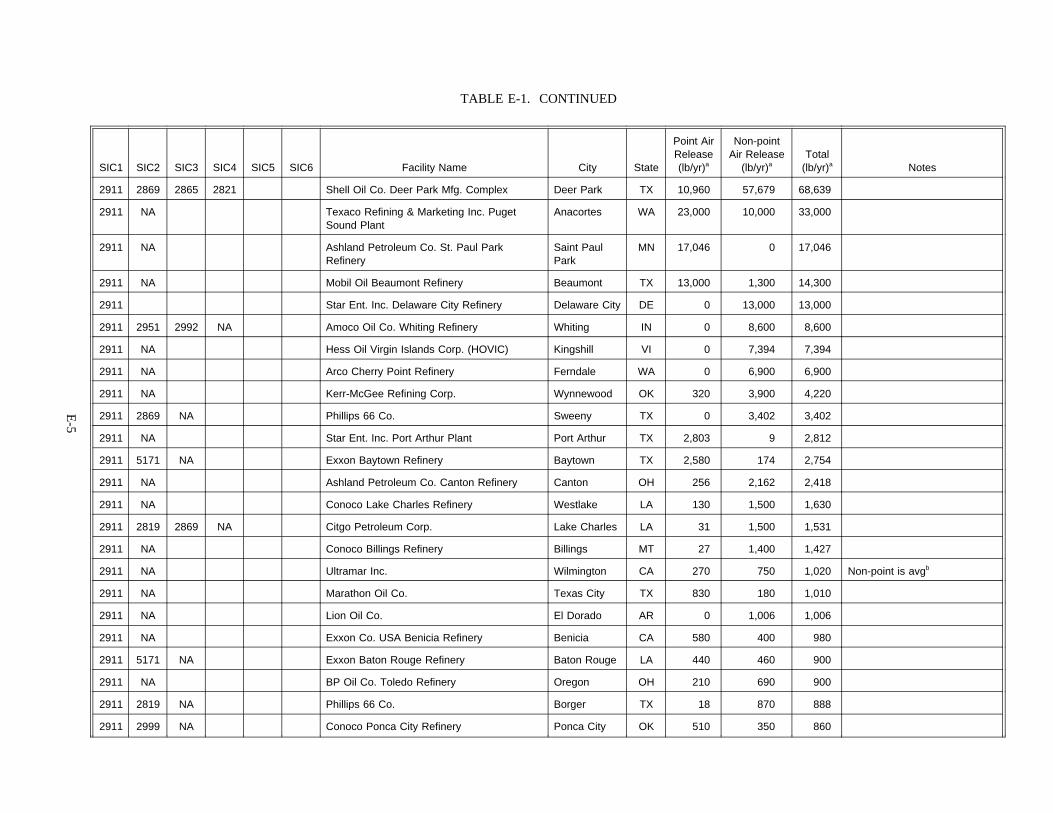
TABLE E-1. CONTINUED
E-5
SIC1 SIC2 SIC3 SIC4 SIC5 SIC6 Facility Name City State
Point AirRelease(lb/yr)a
Non-pointAir Release
(lb/yr)aTotal
(lb/yr)a Notes
2911 2869 2865 2821 Shell Oil Co. Deer Park Mfg. Complex Deer Park TX 10,960 57,679 68,639
2911 NA Texaco Refining & Marketing Inc. PugetSound Plant
Anacortes WA 23,000 10,000 33,000
2911 NA Ashland Petroleum Co. St. Paul ParkRefinery
Saint PaulPark
MN 17,046 0 17,046
2911 NA Mobil Oil Beaumont Refinery Beaumont TX 13,000 1,300 14,300
2911 Star Ent. Inc. Delaware City Refinery Delaware City DE 0 13,000 13,000
2911 2951 2992 NA Amoco Oil Co. Whiting Refinery Whiting IN 0 8,600 8,600
2911 NA Hess Oil Virgin Islands Corp. (HOVIC) Kingshill VI 0 7,394 7,394
2911 NA Arco Cherry Point Refinery Ferndale WA 0 6,900 6,900
2911 NA Kerr-McGee Refining Corp. Wynnewood OK 320 3,900 4,220
2911 2869 NA Phillips 66 Co. Sweeny TX 0 3,402 3,402
2911 NA Star Ent. Inc. Port Arthur Plant Port Arthur TX 2,803 9 2,812
2911 5171 NA Exxon Baytown Refinery Baytown TX 2,580 174 2,754
2911 NA Ashland Petroleum Co. Canton Refinery Canton OH 256 2,162 2,418
2911 NA Conoco Lake Charles Refinery Westlake LA 130 1,500 1,630
2911 2819 2869 NA Citgo Petroleum Corp. Lake Charles LA 31 1,500 1,531
2911 NA Conoco Billings Refinery Billings MT 27 1,400 1,427
2911 NA Ultramar Inc. Wilmington CA 270 750 1,020 Non-point is avgb
2911 NA Marathon Oil Co. Texas City TX 830 180 1,010
2911 NA Lion Oil Co. El Dorado AR 0 1,006 1,006
2911 NA Exxon Co. USA Benicia Refinery Benicia CA 580 400 980
2911 5171 NA Exxon Baton Rouge Refinery Baton Rouge LA 440 460 900
2911 NA BP Oil Co. Toledo Refinery Oregon OH 210 690 900
2911 2819 NA Phillips 66 Co. Borger TX 18 870 888
2911 2999 NA Conoco Ponca City Refinery Ponca City OK 510 350 860
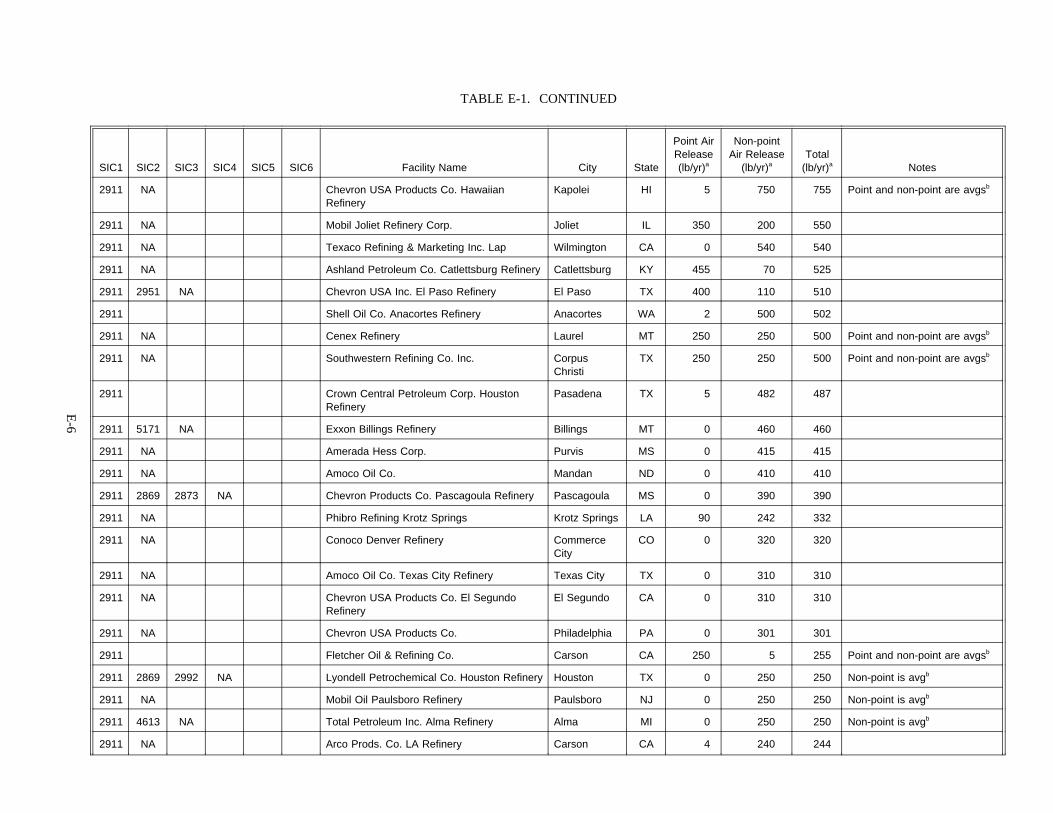
TABLE E-1. CONTINUED
E-6
SIC1 SIC2 SIC3 SIC4 SIC5 SIC6 Facility Name City State
Point AirRelease(lb/yr)a
Non-pointAir Release
(lb/yr)aTotal
(lb/yr)a Notes
2911 NA Chevron USA Products Co. HawaiianRefinery
Kapolei HI 5 750 755 Point and non-point are avgsb
2911 NA Mobil Joliet Refinery Corp. Joliet IL 350 200 550
2911 NA Texaco Refining & Marketing Inc. Lap Wilmington CA 0 540 540
2911 NA Ashland Petroleum Co. Catlettsburg Refinery Catlettsburg KY 455 70 525
2911 2951 NA Chevron USA Inc. El Paso Refinery El Paso TX 400 110 510
2911 Shell Oil Co. Anacortes Refinery Anacortes WA 2 500 502
2911 NA Cenex Refinery Laurel MT 250 250 500 Point and non-point are avgsb
2911 NA Southwestern Refining Co. Inc. CorpusChristi
TX 250 250 500 Point and non-point are avgsb
2911 Crown Central Petroleum Corp. HoustonRefinery
Pasadena TX 5 482 487
2911 5171 NA Exxon Billings Refinery Billings MT 0 460 460
2911 NA Amerada Hess Corp. Purvis MS 0 415 415
2911 NA Amoco Oil Co. Mandan ND 0 410 410
2911 2869 2873 NA Chevron Products Co. Pascagoula Refinery Pascagoula MS 0 390 390
2911 NA Phibro Refining Krotz Springs Krotz Springs LA 90 242 332
2911 NA Conoco Denver Refinery CommerceCity
CO 0 320 320
2911 NA Amoco Oil Co. Texas City Refinery Texas City TX 0 310 310
2911 NA Chevron USA Products Co. El SegundoRefinery
El Segundo CA 0 310 310
2911 NA Chevron USA Products Co. Philadelphia PA 0 301 301
2911 Fletcher Oil & Refining Co. Carson CA 250 5 255 Point and non-point are avgsb
2911 2869 2992 NA Lyondell Petrochemical Co. Houston Refinery Houston TX 0 250 250 Non-point is avgb
2911 NA Mobil Oil Paulsboro Refinery Paulsboro NJ 0 250 250 Non-point is avgb
2911 4613 NA Total Petroleum Inc. Alma Refinery Alma MI 0 250 250 Non-point is avgb
2911 NA Arco Prods. Co. LA Refinery Carson CA 4 240 244
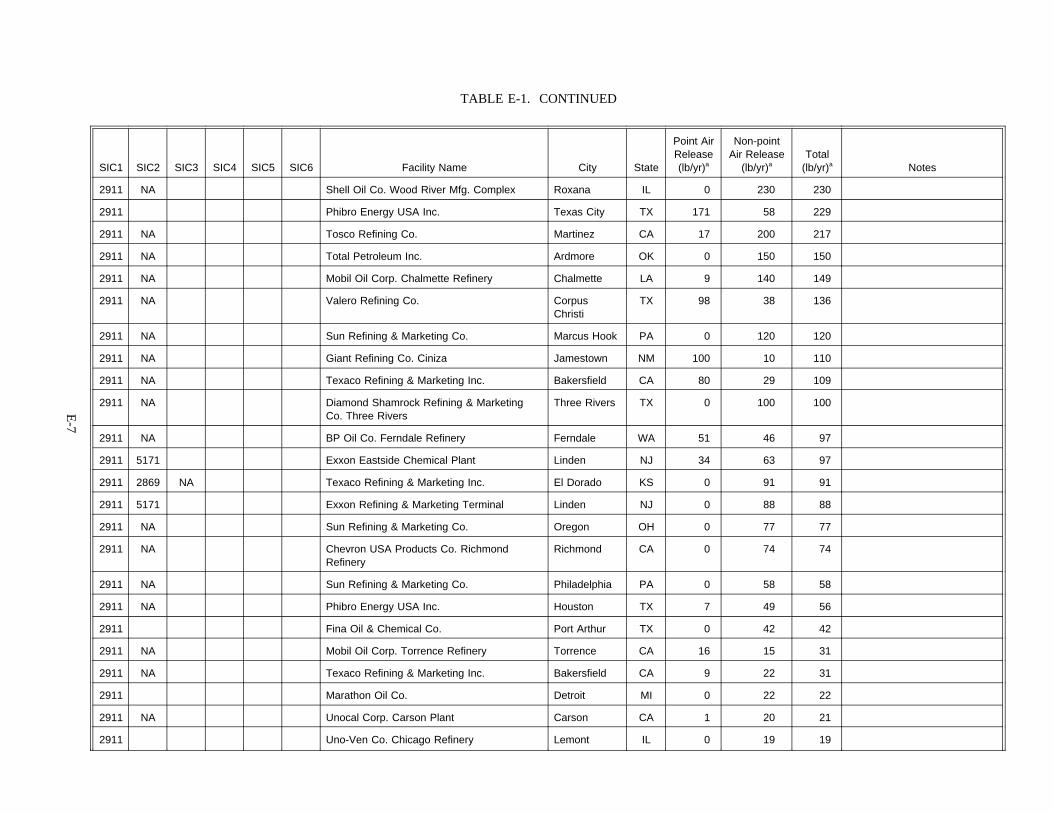
TABLE E-1. CONTINUED
E-7
SIC1 SIC2 SIC3 SIC4 SIC5 SIC6 Facility Name City State
Point AirRelease(lb/yr)a
Non-pointAir Release
(lb/yr)aTotal
(lb/yr)a Notes
2911 NA Shell Oil Co. Wood River Mfg. Complex Roxana IL 0 230 230
2911 Phibro Energy USA Inc. Texas City TX 171 58 229
2911 NA Tosco Refining Co. Martinez CA 17 200 217
2911 NA Total Petroleum Inc. Ardmore OK 0 150 150
2911 NA Mobil Oil Corp. Chalmette Refinery Chalmette LA 9 140 149
2911 NA Valero Refining Co. CorpusChristi
TX 98 38 136
2911 NA Sun Refining & Marketing Co. Marcus Hook PA 0 120 120
2911 NA Giant Refining Co. Ciniza Jamestown NM 100 10 110
2911 NA Texaco Refining & Marketing Inc. Bakersfield CA 80 29 109
2911 NA Diamond Shamrock Refining & MarketingCo. Three Rivers
Three Rivers TX 0 100 100
2911 NA BP Oil Co. Ferndale Refinery Ferndale WA 51 46 97
2911 5171 Exxon Eastside Chemical Plant Linden NJ 34 63 97
2911 2869 NA Texaco Refining & Marketing Inc. El Dorado KS 0 91 91
2911 5171 Exxon Refining & Marketing Terminal Linden NJ 0 88 88
2911 NA Sun Refining & Marketing Co. Oregon OH 0 77 77
2911 NA Chevron USA Products Co. RichmondRefinery
Richmond CA 0 74 74
2911 NA Sun Refining & Marketing Co. Philadelphia PA 0 58 58
2911 NA Phibro Energy USA Inc. Houston TX 7 49 56
2911 Fina Oil & Chemical Co. Port Arthur TX 0 42 42
2911 NA Mobil Oil Corp. Torrence Refinery Torrence CA 16 15 31
2911 NA Texaco Refining & Marketing Inc. Bakersfield CA 9 22 31
2911 Marathon Oil Co. Detroit MI 0 22 22
2911 NA Unocal Corp. Carson Plant Carson CA 1 20 21
2911 Uno-Ven Co. Chicago Refinery Lemont IL 0 19 19
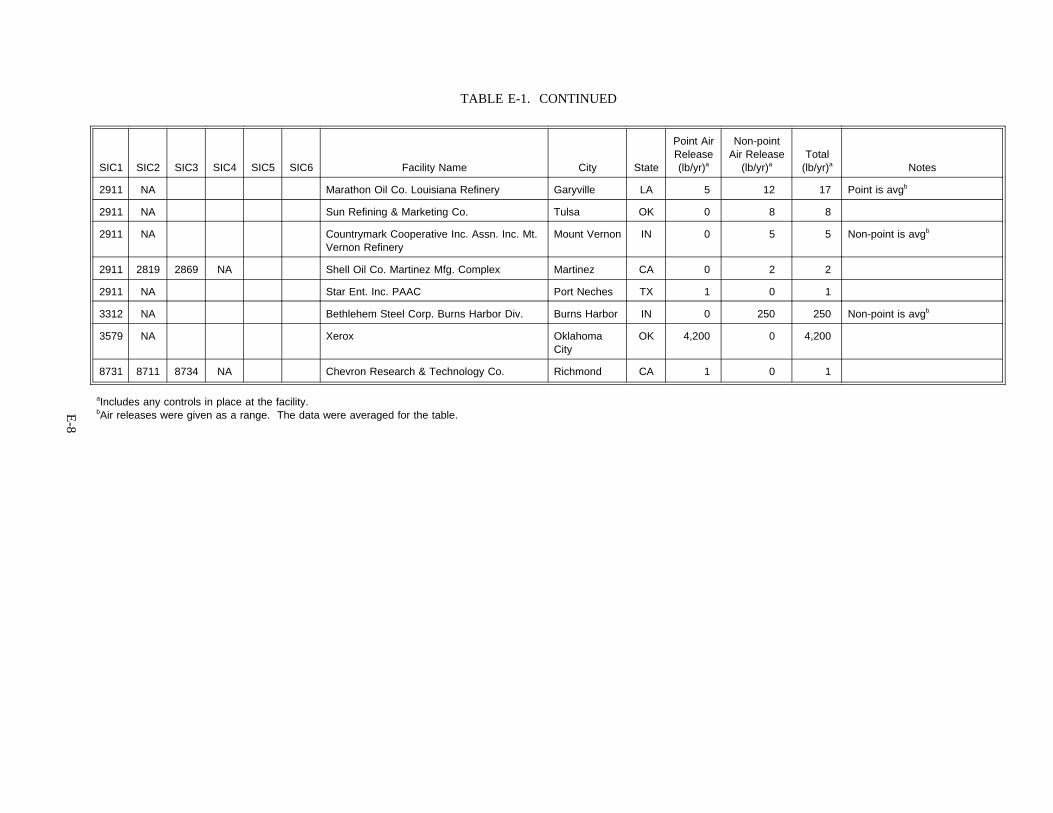
TABLE E-1. CONTINUED
E-8
SIC1 SIC2 SIC3 SIC4 SIC5 SIC6 Facility Name City State
Point AirRelease(lb/yr)a
Non-pointAir Release
(lb/yr)aTotal
(lb/yr)a Notes
2911 NA Marathon Oil Co. Louisiana Refinery Garyville LA 5 12 17 Point is avgb
2911 NA Sun Refining & Marketing Co. Tulsa OK 0 8 8
2911 NA Countrymark Cooperative Inc. Assn. Inc. Mt.Vernon Refinery
Mount Vernon IN 0 5 5 Non-point is avgb
2911 2819 2869 NA Shell Oil Co. Martinez Mfg. Complex Martinez CA 0 2 2
2911 NA Star Ent. Inc. PAAC Port Neches TX 1 0 1
3312 NA Bethlehem Steel Corp. Burns Harbor Div. Burns Harbor IN 0 250 250 Non-point is avgb
3579 NA Xerox OklahomaCity
OK 4,200 0 4,200
8731 8711 8734 NA Chevron Research & Technology Co. Richmond CA 1 0 1
aIncludes any controls in place at the facility.bAir releases were given as a range. The data were averaged for the table.


