196
| Date post: | 23-Mar-2018 |
| Category: |
Documents |
| Upload: | duongnguyet |
| View: | 220 times |
| Download: | 2 times |


EPA-454/R-93-048
LOCATING AND ESTIMATING AIR EMISSIONSFROM SOURCES OF XYLENE
Emission Inventory BranchTechnical Support Division
Office of Air Quality Planning and StandardsU.S. Environmental Protection Agency
Research Triangle Park, North Carolina 27711
March 1994

This report has been reviewed by the Office of Air Quality Planning and Standards, U.S.
Environmental Protection Agency, and has been approved for publication. Any mention of trade
names or commercial products is not intented to constitute endorsement or recommendation for
use.
ii

CONTENTS
Section Page
Disclaimer . . . . . . . . . . . . . . . . . . . . . . . . . . . . . . . . . . . . . . . . . . . . . . . . . . . . . . . . iiList of Figures. . . . . . . . . . . . . . . . . . . . . . . . . . . . . . . . . . . . . . . . . . . . . . . . . . . . . . viList of Tables . . . . . . . . . . . . . . . . . . . . . . . . . . . . . . . . . . . . . . . . . . . . . . . . . . . . . vii
1.0 PURPOSE OF DOCUMENT. . . . . . . . . . . . . . . . . . . . . . . . . . . . . . . . . . . . . 1-11.1 REFERENCES FOR SECTION 1.0. . . . . . . . . . . . . . . . . . . . . . . . . . . . . 1-5
2.0 OVERVIEW OF DOCUMENT CONTENTS. . . . . . . . . . . . . . . . . . . . . . . . . . 2-12.1 REFERENCES FOR SECTION 2.0. . . . . . . . . . . . . . . . . . . . . . . . . . . . . 2-5
3.0 BACKGROUND . . . . . . . . . . . . . . . . . . . . . . . . . . . . . . . . . . . . . . . . . . . . . . 3-13.1 NATURE OF POLLUTANT . . . . . . . . . . . . . . . . . . . . . . . . . . . . . . . . . 3-13.2 OVERVIEW OF PRODUCTION AND USE. . . . . . . . . . . . . . . . . . . . . . 3-43.3 REFERENCES FOR SECTION 3.0. . . . . . . . . . . . . . . . . . . . . . . . . . . . . 3-7
4.0 EMISSIONS FROM XYLENE PRODUCTION. . . . . . . . . . . . . . . . . . . . . . . . 4-14.1 MIXED XYLENES PRODUCTION . . . . . . . . . . . . . . . . . . . . . . . . . . . . 4-5
4.1.1 Hydrotreating. . . . . . . . . . . . . . . . . . . . . . . . . . . . . . . . . . . . . . . . 4-54.1.2 Catalytic Reforming . . . . . . . . . . . . . . . . . . . . . . . . . . . . . . . . . . . 4-74.1.3 Secondary Hydrogenation (for Pyrolysis Gasoline). . . . . . . . . . . . . 4-104.1.4 Xylene Production from Toluene Disproportionation or
Transalkylation. . . . . . . . . . . . . . . . . . . . . . . . . . . . . . . . . . . . . .4-124.1.5 Coal-Derived Mixed Xylenes. . . . . . . . . . . . . . . . . . . . . . . . . . . .4-13
4.2 ISOMERIZATION AND SEPARATION OF XYLENE ISOMERS. . . . . . 4-134.2.1 Para-xylene Production. . . . . . . . . . . . . . . . . . . . . . . . . . . . . . . .4-194.2.2 Ortho-xylene Production. . . . . . . . . . . . . . . . . . . . . . . . . . . . . . .4-224.2.3 Meta-xylene Production. . . . . . . . . . . . . . . . . . . . . . . . . . . . . . . .4-254.2.4 Ethylbenzene Production. . . . . . . . . . . . . . . . . . . . . . . . . . . . . . .4-26
4.3 EMISSIONS. . . . . . . . . . . . . . . . . . . . . . . . . . . . . . . . . . . . . . . . . . . .4-264.3.1 Process Emissions. . . . . . . . . . . . . . . . . . . . . . . . . . . . . . . . . . . .4-274.3.2 Storage Emissions. . . . . . . . . . . . . . . . . . . . . . . . . . . . . . . . . . . .4-284.3.3 Equipment Leak Emissions (Fugitive Emissions). . . . . . . . . . . . . . 4-284.3.4 Emission Controls. . . . . . . . . . . . . . . . . . . . . . . . . . . . . . . . . . . .4-32
4.4 REFERENCES FOR SECTION 4.0. . . . . . . . . . . . . . . . . . . . . . . . . . . .4-34
5.0 EMISSIONS FROM MAJOR USES OF XYLENE. . . . . . . . . . . . . . . . . . . . . . 5-15.1 PHTHALIC ANHYDRIDE PRODUCTION . . . . . . . . . . . . . . . . . . . . . . . 5-1
5.1.1 Process Description. . . . . . . . . . . . . . . . . . . . . . . . . . . . . . . . . . . . 5-35.1.2 Emissions. . . . . . . . . . . . . . . . . . . . . . . . . . . . . . . . . . . . . . . . . . . 5-5
5.2 TEREPHTHALIC ACID PRODUCTION. . . . . . . . . . . . . . . . . . . . . . . . . 5-75.2.1 Process Description. . . . . . . . . . . . . . . . . . . . . . . . . . . . . . . . . . . . 5-95.2.2 Emissions. . . . . . . . . . . . . . . . . . . . . . . . . . . . . . . . . . . . . . . . . .5-11
iii

TABLE OF CONTENTS (Continued)
Section Page
5.3 MALEIC ANHYDRIDE PRODUCTION . . . . . . . . . . . . . . . . . . . . . . . .5-135.3.1 Process Description. . . . . . . . . . . . . . . . . . . . . . . . . . . . . . . . . . .5-155.3.2 Emissions. . . . . . . . . . . . . . . . . . . . . . . . . . . . . . . . . . . . . . . . . .5-17
5.4 PAINT AND INK MANUFACTURING . . . . . . . . . . . . . . . . . . . . . . . .5-185.4.1 Process Description. . . . . . . . . . . . . . . . . . . . . . . . . . . . . . . . . . .5-185.4.2 Emissions. . . . . . . . . . . . . . . . . . . . . . . . . . . . . . . . . . . . . . . . . .5-23
5.5 REFERENCES FOR SECTION 5.0. . . . . . . . . . . . . . . . . . . . . . . . . . . .5-25
6.0 EMISSIONS FROM THE USE OF XYLENE-CONTAINING MATERIALS. . . . 6-16.1 SURFACE COATING OPERATIONS. . . . . . . . . . . . . . . . . . . . . . . . . . . 6-1
6.1.1 Process Description. . . . . . . . . . . . . . . . . . . . . . . . . . . . . . . . . . . . 6-26.1.2 Emissions. . . . . . . . . . . . . . . . . . . . . . . . . . . . . . . . . . . . . . . . . . . 6-2
6.2 PRINTING AND PUBLISHING. . . . . . . . . . . . . . . . . . . . . . . . . . . . . . . . 6-56.2.1 Process Description. . . . . . . . . . . . . . . . . . . . . . . . . . . . . . . . . . . 6-66.2.2 Emissions. . . . . . . . . . . . . . . . . . . . . . . . . . . . . . . . . . . . . . . . . . 6-8
6.3 GASOLINE AND AUTOMOTIVE EMISSIONS . . . . . . . . . . . . . . . . . . .6-116.4 GASOLINE MARKETING . . . . . . . . . . . . . . . . . . . . . . . . . . . . . . . . . .6-12
6.4.1 Xylene Emissions from Loading Marine Vessels. . . . . . . . . . . . . . . 6-156.4.2 Xylene Emissions from Bulk Gasoline Plants, Bulk Gasoline Terminals6-156.4.3 Xylene Emissions from Service Stations. . . . . . . . . . . . . . . . . . . .6-226.4.4 Control Technology for Gasoline Transfer. . . . . . . . . . . . . . . . . . .6-236.4.5 Control Technology for Gasoline Storage. . . . . . . . . . . . . . . . . . . .6-236.4.6 Control Technology for Vehicle Refueling Emissions. . . . . . . . . . . 6-27
6.5 REFERENCES FOR SECTION 6.0. . . . . . . . . . . . . . . . . . . . . . . . . . . .6-29
7.0 BY-PRODUCT EMISSIONS: PROCESSES UNRELATED TO PRODUCTIONOR USE OF XYLENE . . . . . . . . . . . . . . . . . . . . . . . . . . . . . . . . . . . . . . . . . 7-17.1 COAL COMBUSTION . . . . . . . . . . . . . . . . . . . . . . . . . . . . . . . . . . . . . 7-17.2 HAZARDOUS AND SOLID WASTE INCINERATION . . . . . . . . . . . . . 7-37.3 WASTEWATER TREATMENT PROCESSES. . . . . . . . . . . . . . . . . . . . . 7-47.4 REFERENCES FOR SECTION 7.0. . . . . . . . . . . . . . . . . . . . . . . . . . . . . 7-8
8.0 AMBIENT AIR AND STATIONARY SOURCE TEST PROCEDURES. . . . . . . 8-18.1 EPA METHOD TO-1 . . . . . . . . . . . . . . . . . . . . . . . . . . . . . . . . . . . . . . 8-28.2 EPA METHOD TO-3 . . . . . . . . . . . . . . . . . . . . . . . . . . . . . . . . . . . . . . 8-28.3 EPA METHOD TO-14 . . . . . . . . . . . . . . . . . . . . . . . . . . . . . . . . . . . . . 8-58.4 EPA METHOD 0030. . . . . . . . . . . . . . . . . . . . . . . . . . . . . . . . . . . . . . . 8-88.5 EPA METHOD 5040. . . . . . . . . . . . . . . . . . . . . . . . . . . . . . . . . . . . . . . 8-88.6 EPA REFERENCE METHOD 18. . . . . . . . . . . . . . . . . . . . . . . . . . . . .8-108.7 NIOSH METHOD 1501. . . . . . . . . . . . . . . . . . . . . . . . . . . . . . . . . . . .8-148.8 REFERENCES FOR SECTION 8.0. . . . . . . . . . . . . . . . . . . . . . . . . . . 8-16
iv
TABLE OF CONTENTS (Continued)
Section Page
APPENDIX A POTENTIAL SOURCE CATEGORIES OF MIXED XYLENEEMISSIONS. . . . . . . . . . . . . . . . . . . . . . . . . . . . . . . . . . . . . . . . . A-1
APPENDIX B LIST OF PAINT, INK, AND PRINTING FACILITIES WITHANNUAL SALES GREATER THAN $1 MILLION . . . . . . . . . . . . . B-1
APPENDIX C XYLENE SOURCE CATEGORIES IN SURFACE COATINGOPERATIONS . . . . . . . . . . . . . . . . . . . . . . . . . . . . . . . . . . . . . . . C-1
APPENDIX D SUMMARY OF XYLENE EMISSION FACTORS LISTED INTHIS DOCUMENT . . . . . . . . . . . . . . . . . . . . . . . . . . . . . . . . . . . . D-1
v

FIGURES
Number Page
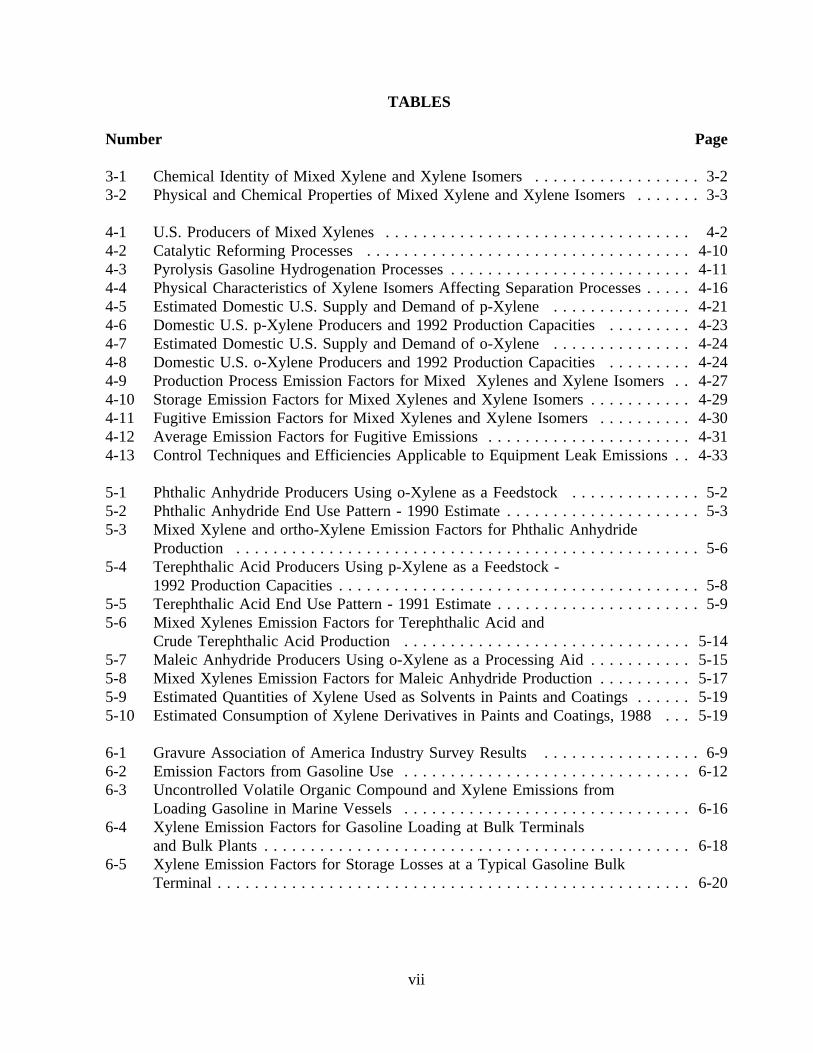
3-1 Chemical use tree for xylenes. . . . . . . . . . . . . . . . . . . . . . . . . . . . . . . . . . . . 3-6
4-1 Process flow diagram for hydrotreating. . . . . . . . . . . . . . . . . . . . . . . . . . . . . 4-64-2 Typical reforming unit. . . . . . . . . . . . . . . . . . . . . . . . . . . . . . . . . . . . . . . . . 4-84-3 Toray/UOP Tatoray (disproportionation/transalkylation) process. . . . . . . . . . . . 4-144-4 Mixed xylene production from coal-derived light oil. . . . . . . . . . . . . . . . . . . .4-154-5 Mixed xylenes separation by the crystallization process. . . . . . . . . . . . . . . . . . 4-174-6 Moving bed adsorption system for separation of xylene isomers. . . . . . . . . . . . 4-184-7 Simple separation - isomerization loop. . . . . . . . . . . . . . . . . . . . . . . . . . . . . .4-19
5-1 Flow diagram for phthalic anhydride using o-xylene as basic feedstock. . . . . . . . 5-45-2 Production of polymer grade dimethyl terephthalate by the
Dynamit Noble process. . . . . . . . . . . . . . . . . . . . . . . . . . . . . . . . . . . . . . . .5-105-3 Production of polymer grade dimethyl terephthalic acid by catalytic
liquid-phase air oxidation of p-xylene. . . . . . . . . . . . . . . . . . . . . . . . . . . . . .5-125-4 Maleic anhydride process. . . . . . . . . . . . . . . . . . . . . . . . . . . . . . . . . . . . . . .5-165-5 Use of xylene isomers and derivatives in the paints and coatings industry. . . . . 5-205-6 Paint manufacturing process. . . . . . . . . . . . . . . . . . . . . . . . . . . . . . . . . . . . .5-22
6-1 Flow diagram of a surface coating operation. . . . . . . . . . . . . . . . . . . . . . . . . . . 6-36-2 The gasoline marketing distribution system in the United States. . . . . . . . . . . . 6-146-3 Bulk plant vapor balance system. . . . . . . . . . . . . . . . . . . . . . . . . . . . . . . . . .6-256-4 Service station vapor balance system. . . . . . . . . . . . . . . . . . . . . . . . . . . . . . .6-26
7-1 Emissions from open burning of scrap tires. . . . . . . . . . . . . . . . . . . . . . . . . . . 7-5
8-1 Typical sampling system configuration. . . . . . . . . . . . . . . . . . . . . . . . . . . . . . . 8-38-2 Tenax cartridge designs. . . . . . . . . . . . . . . . . . . . . . . . . . . . . . . . . . . . . . . . 8-48-3 Automated sampling and analysis system for cryogenic trapping. . . . . . . . . . . . . 8-68-4 Sampler for subatmospheric pressure canister sampling. . . . . . . . . . . . . . . . . . . 8-78-5 Schematic of volatile organic sampling train (VOST). . . . . . . . . . . . . . . . . . . . . 8-98-6 Schematic diagram of trap desorption/analysis system. . . . . . . . . . . . . . . . . . .8-118-7 Direct interface sampling system. . . . . . . . . . . . . . . . . . . . . . . . . . . . . . . . . .8-128-8 Integrated bag sampling train. . . . . . . . . . . . . . . . . . . . . . . . . . . . . . . . . . . .8-138-9 Method 1501 sampling system. . . . . . . . . . . . . . . . . . . . . . . . . . . . . . . . . . .8-15
vi
TABLES
Number Page
3-1 Chemical Identity of Mixed Xylene and Xylene Isomers. . . . . . . . . . . . . . . . . . 3-23-2 Physical and Chemical Properties of Mixed Xylene and Xylene Isomers. . . . . . . 3-3
4-1 U.S. Producers of Mixed Xylenes. . . . . . . . . . . . . . . . . . . . . . . . . . . . . . . . . 4-24-2 Catalytic Reforming Processes. . . . . . . . . . . . . . . . . . . . . . . . . . . . . . . . . . .4-104-3 Pyrolysis Gasoline Hydrogenation Processes. . . . . . . . . . . . . . . . . . . . . . . . . .4-114-4 Physical Characteristics of Xylene Isomers Affecting Separation Processes. . . . . 4-164-5 Estimated Domestic U.S. Supply and Demand of p-Xylene. . . . . . . . . . . . . . . 4-214-6 Domestic U.S. p-Xylene Producers and 1992 Production Capacities. . . . . . . . . 4-234-7 Estimated Domestic U.S. Supply and Demand of o-Xylene. . . . . . . . . . . . . . . 4-244-8 Domestic U.S. o-Xylene Producers and 1992 Production Capacities. . . . . . . . . 4-244-9 Production Process Emission Factors for Mixed Xylenes and Xylene Isomers . . 4-274-10 Storage Emission Factors for Mixed Xylenes and Xylene Isomers. . . . . . . . . . . 4-294-11 Fugitive Emission Factors for Mixed Xylenes and Xylene Isomers. . . . . . . . . . 4-304-12 Average Emission Factors for Fugitive Emissions. . . . . . . . . . . . . . . . . . . . . .4-314-13 Control Techniques and Efficiencies Applicable to Equipment Leak Emissions . . 4-33
5-1 Phthalic Anhydride Producers Using o-Xylene as a Feedstock. . . . . . . . . . . . . . 5-25-2 Phthalic Anhydride End Use Pattern - 1990 Estimate. . . . . . . . . . . . . . . . . . . . . 5-35-3 Mixed Xylene and ortho-Xylene Emission Factors for Phthalic Anhydride
Production . . . . . . . . . . . . . . . . . . . . . . . . . . . . . . . . . . . . . . . . . . . . . . . . . . 5-65-4 Terephthalic Acid Producers Using p-Xylene as a Feedstock -
1992 Production Capacities. . . . . . . . . . . . . . . . . . . . . . . . . . . . . . . . . . . . . . . 5-85-5 Terephthalic Acid End Use Pattern - 1991 Estimate. . . . . . . . . . . . . . . . . . . . . . 5-95-6 Mixed Xylenes Emission Factors for Terephthalic Acid and
Crude Terephthalic Acid Production. . . . . . . . . . . . . . . . . . . . . . . . . . . . . . .5-145-7 Maleic Anhydride Producers Using o-Xylene as a Processing Aid. . . . . . . . . . . 5-155-8 Mixed Xylenes Emission Factors for Maleic Anhydride Production. . . . . . . . . . 5-175-9 Estimated Quantities of Xylene Used as Solvents in Paints and Coatings. . . . . . 5-195-10 Estimated Consumption of Xylene Derivatives in Paints and Coatings, 1988 . . . 5-19
6-1 Gravure Association of America Industry Survey Results. . . . . . . . . . . . . . . . . 6-96-2 Emission Factors from Gasoline Use. . . . . . . . . . . . . . . . . . . . . . . . . . . . . . .6-126-3 Uncontrolled Volatile Organic Compound and Xylene Emissions from
Loading Gasoline in Marine Vessels. . . . . . . . . . . . . . . . . . . . . . . . . . . . . . .6-166-4 Xylene Emission Factors for Gasoline Loading at Bulk Terminals
and Bulk Plants. . . . . . . . . . . . . . . . . . . . . . . . . . . . . . . . . . . . . . . . . . . . . .6-186-5 Xylene Emission Factors for Storage Losses at a Typical Gasoline Bulk
Terminal . . . . . . . . . . . . . . . . . . . . . . . . . . . . . . . . . . . . . . . . . . . . . . . . . . .6-20
vii

LIST OF TABLES (Continued)
Number Page
6-6 Uncontrolled Gasoline Vapor and Xylene Emissions from a TypicalBulk Plant . . . . . . . . . . . . . . . . . . . . . . . . . . . . . . . . . . . . . . . . . . . . . . . . .6-21
6-7 Uncontrolled Gasoline Vapor and Xylene Emissions from a Typical ServiceStation . . . . . . . . . . . . . . . . . . . . . . . . . . . . . . . . . . . . . . . . . . . . . . . . . . . .6-24
7-1 Xylene Emissions from Combustible Coal Refuse Material. . . . . . . . . . . . . . . . 7-37-2 Xylene Emission Rates from the Open Burning of Scrap Tires. . . . . . . . . . . . . . 7-5
viii

EXECUTIVE SUMMARY
Emissions of xylene and its isomers into the atmosphere are of special significance
because of the Clean Air Act Amendments of 1990. These amendments mandate that emissions
of xylene be subject to standards that allow for the maximum degree of reduction of emissions
and that, by 1995, a list of source categories be established that accounts for no less than 90
percent of xylene emissions. This document is designed to assist groups interested in
inventorying air emissions of xylene by providing a compilation of available information on
sources and emissions of these substances.
Xylene is an aromatic hydrocarbon that occurs naturally in petroleum and coal tar and is
a constituent of smoke from most combustion sources. In the U.S., xylene is produced primarily
using catalytic reforming of petroleum (approximately 95%). There were 20 production facilities
for mixed xylenes in the U.S. in 1989. During the same year, the total annual capacity for
xylene manufacturing in the U.S., the Virgin Islands, and Puerto Rico was 5,648 million
kilograms (12,452 million pounds).
Xylenes is used as a solvent in the manufacturing of chemicals, agricultural sprays,
adhesives and coatings, as an ingredient in aviation fuel and gasoline, and as a feedstock in
manufacturing various polymers, phthalic anhydride, isophathalic acid, terephthalic acid and
dimethyl terephthalate.
At the time of publication of this document, estimates of nationwide emissions of xylene
were not available. Updates to this document will attempt to incorporate any nationwide
emission estimates subsequently developed.
ix

SECTION 1.0
PURPOSE OF DOCUMENT
The Environmental Protection Agency (EPA) and State and local air pollution control
agencies are becoming increasingly aware of the presence of substances in the ambient air that
may be toxic at certain concentrations. This awareness, in turn, has led to attempts to identify
source/receptor relationships for these substances and to develop control programs to regulate
emissions. Unfortunately, very little information is available on the ambient air concentrations
of these substances or on the sources that may be discharging them to the atmosphere.
To assist groups interested in inventorying air emissions of various potentially toxic
substances, EPA is preparing a series of documents such as this that compiles available
information on sources and emissions of these substances. Prior documents in the series are
listed below:
Substance EPA Publication Number
Acrylonitrile EPA-450/4-84-007aCarbon Tetrachloride EPA-450/4-84-007bChloroform EPA-450/4-84-007cEthylene Dichloride EPA-450/4-84-007dFormaldehyde (Revised) EPA-450/2-91-012Nickel EPA-450/4-84-007fChromium EPA-450/4-84-007gManganese EPA-450/4-84-007hPhosgene EPA-450/4-84-007iEpichlorohydrin EPA-450/4-84-007jVinylidene Chloride EPA-450/4-84-007kEthylene Oxide EPA-450/4-84-007lChlorobenzenes EPA-450/4-84-007mPolychlorinated Biphenyls (PCBs) EPA-450/4-84-007nPolycyclic Organic Matter (POM) EPA-450/4-84-007pBenzene EPA-450/4-84-007qOrganic Liquid Storage Tanks EPA-450/4-88-004Coal and Oil Combustion Sources EPA-450/2-89-001Municipal Waste Combustors EPA-450/2-89-006
1-1
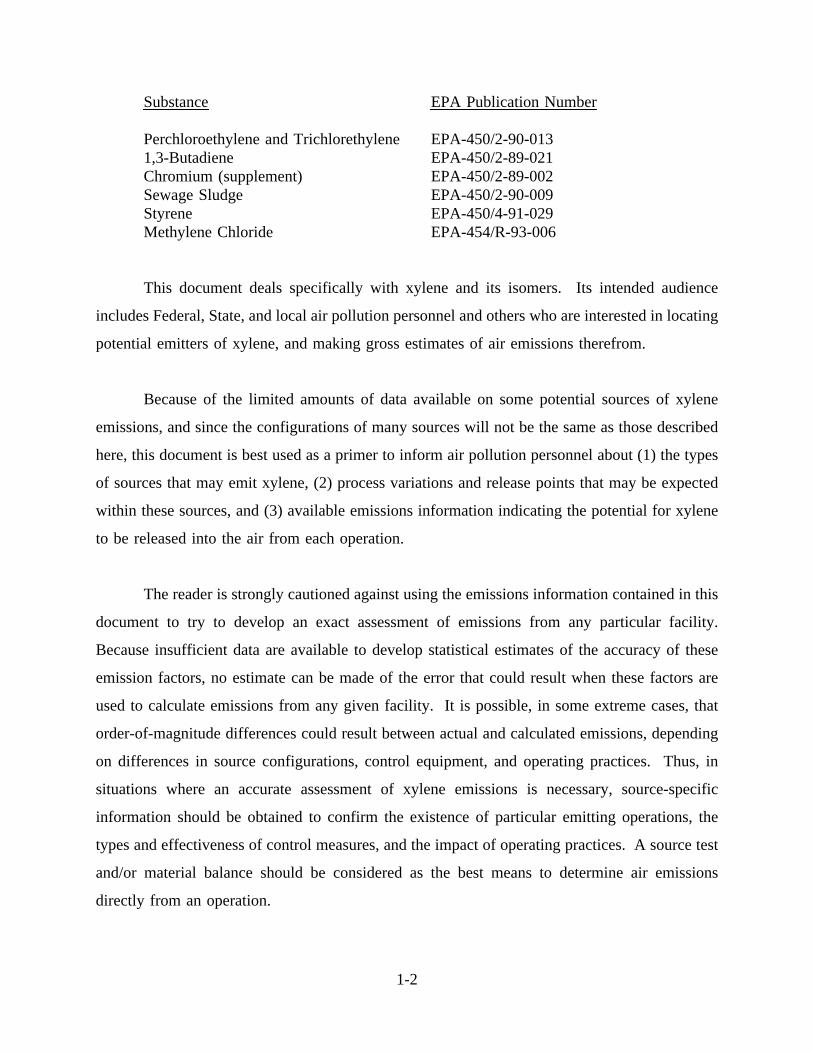
Substance EPA Publication Number
Perchloroethylene and Trichlorethylene EPA-450/2-90-0131,3-Butadiene EPA-450/2-89-021Chromium (supplement) EPA-450/2-89-002Sewage Sludge EPA-450/2-90-009Styrene EPA-450/4-91-029Methylene Chloride EPA-454/R-93-006
This document deals specifically with xylene and its isomers. Its intended audience
includes Federal, State, and local air pollution personnel and others who are interested in locating
potential emitters of xylene, and making gross estimates of air emissions therefrom.
Because of the limited amounts of data available on some potential sources of xylene
emissions, and since the configurations of many sources will not be the same as those described
here, this document is best used as a primer to inform air pollution personnel about (1) the types
of sources that may emit xylene, (2) process variations and release points that may be expected
within these sources, and (3) available emissions information indicating the potential for xylene
to be released into the air from each operation.
The reader is strongly cautioned against using the emissions information contained in this
document to try to develop an exact assessment of emissions from any particular facility.
Because insufficient data are available to develop statistical estimates of the accuracy of these
emission factors, no estimate can be made of the error that could result when these factors are
used to calculate emissions from any given facility. It is possible, in some extreme cases, that
order-of-magnitude differences could result between actual and calculated emissions, depending
on differences in source configurations, control equipment, and operating practices. Thus, in
situations where an accurate assessment of xylene emissions is necessary, source-specific
information should be obtained to confirm the existence of particular emitting operations, the
types and effectiveness of control measures, and the impact of operating practices. A source test
and/or material balance should be considered as the best means to determine air emissions
directly from an operation.
1-2

In addition to the information presented in this document, another potential source of
emissions data for xylene is the Toxic Chemical Release Inventory (TRI) database required by
Section 313 of Title III of the Superfund Amendments and Reauthorization Act of 1986 (SARA
313).1 SARA 313 requires owners and operators of certain facilities that manufacture, import,
process or otherwise use certain toxic chemicals to report annually their releases of these
chemicals to any environmental media. As part of SARA 313, EPA provides public access to
the annual emissions data. The TRI data include general facility information, chemical
information, and emissions data. Air emissions data are reported as total facility release
estimates, broken out into fugitive and point components. No individual process or stack data
are provided to EPA. The TRI requires the use of available stack monitoring or measurement
of emissions to comply with SARA 313. If monitoring data are unavailable, emissions are to be
quantified based on best estimates of releases to the environment.
The reader is cautioned that the TRI will not likely provide facility, emissions, and
chemical release data sufficient for conducting detailed exposure modeling and risk assessment.
In many cases, the TRI data are based on annual estimates of emissions (i.e., on emission factors,
material balances, engineering judgement). Although the TRI database was consulted during the
development of this report, it should be referred to as an additional information source to locate
potential emitters of xylene, and to make preliminary estimates of air emissions from these
facilities. To obtain an exact assessment of air emissions from processes at a specific facility,
source tests or detailed material balance calculations should be conducted, and detailed plant site
information should be compiled.
Each L&E document, as standard procedure, is sent to government, industry, and
environmental groups wherever EPA is aware of expertise. These groups are given the
opportunity to review the document, comment, and provide additional data where applicable.
Where necessary, the documents are then revised to incorporate these comments. Although these
documents have undergone extensive review, there may still be shortcomings. Comments
subsequent to publication are welcome and will be addressed based on available time and
resources. In addition, any information is welcome on process descriptions, operating parameters,
1-3
control measures, and emissions information that would enable EPA to improve the contents of
this document. Comments and information may be sent to the following address:
Chief, Emission Factor and Methodologies SectionEmission Inventory Branch (MD-14)U.S. Environmental Protection AgencyResearch Triangle Park, NC 27711
1-4

1.1 REFERENCE FOR SECTION 1.0
1. Toxic Chemical Release Reporting: Community Right-To-Know. Federal Register52(107): 21152-21208. June 4, 1987.
1-5

SECTION 2.0
OVERVIEW OF DOCUMENT CONTENTS
The purpose of this document is to assist Federal, State and local air pollution agencies
and others who are interested in locating potential air emitters of xylene and its isomers and
making gross estimates of air emissions therefrom. Because of the limited background data
available, the information summarized in this document does not and should not be assumed to
represent the source configuration or emissions associated with any particular facility.
This section provides an overview of the contents of this document. It briefly outlines
the nature, extent, and format of the material presented in the remaining sections of this report.
Section 3.0 of this document briefly summarizes the physical and chemical characteristics
of xylene and provides an overview of its production and use. This background section may be
useful to someone who needs to develop a general perspective on the nature of this substance and
how it is manufactured and consumed.
Section 4.0 of this document focuses on major production source categories that may
discharge air emissions containing xylene and its isomers. Individual companies and locations
are included that produce or use xylene. Section 5.0 discusses the uses of xylene as feedstocks
and major solvent uses, particularly paint manufacturing and surface coating operations. Section
6.0 addresses emissions as a result of releases from gasoline use. Section 7.0 describes emissions
sources from the manufacture of products other than xylene, or as a by-product of another
process (e.g., coal combustion). Example process descriptions and flow diagrams are provided
in addition to available emission factor estimates for each major industrial source category
described in Sections 4.0, 5.0, 6.0 and 7.0.
Section 8.0 of this document summarizes available procedures for source sampling and
analysis of xylene. The summaries provide an overview of applicable sampling and analytical
2-1
procedures, citing references for those interested in conducting source tests. Although a NIOSH
procedure is provided, no EPA endorsement of this method is given or implied.
Appendix A identifies potential source categories of xylene emissions by Standard
Industrial Classification (SIC) codes and associated descriptions. The readers interested in cross
referencing SICs with Source Classification Codes (SCCs) and associated descriptions, should
consult theCrosswalk/Air Toxic Emission Factor Database Management System, Version 1.2
(October 1991) and/or theVOC/PM Speciation Database Management System, Version 1.4
(October 1991).1,2 Appendix B presents paint and ink manufacturing facilities and printing
facilities with sales greater than $1,000,000. Appendix C contains a listing of some of the
surface coating source categories in which xylene is used. Appendix D summarizes, in table
format, all the emission factors listed in this document.
Each emission factor listed in this document includes an emission factor grade based on
the criteria for data quality and emission factor ratings required in the compendium forAP-42.3
These criteria for rating test data are presented below. The data used to develop emission factors
are rated as follows:
A - Tests performed by a sound methodology and reported in enough detail foradequate validation. These tests are not necessarily EPA reference test methods,although such reference methods are certainly to be used as a guide.
B - Tests that are performed by a generally sound methodology but lack enough detailfor adequate validation.
C - Tests that are based on a nonvalidated or draft methodology or that lack asignificant amount of background data.
D - Tests that are based on a generally unacceptable method but may provide anorder-of-magnitude value for the source.
Because of the almost impossible task of assigning a meaningful confidence limit to
industry-specific variables (i.e., sample size vs. sample population, industry and facility
2-2

variability, method of measurement), the use of a statistical confidence interval for an emission
factor is not practical. Therefore, some subjective quality rating is necessary. The following
emission factor quality ratings are applied to the emission factor tables.
A - Excellent. The emission factor was developed only from A-rated test data taken frommany randomly chosen facilities in the industry population. The source category* isspecific enough to minimize variability within the source category population.
B - Above average. The emission factor was developed only from A-rated test data froma reasonable number of facilities. Although no specific bias is evident, it is not clear ifthe facilities tested represent a random sample of the industries. As in the A rating, thesource category is specific enough to minimize variability within the source categorypopulation.
C - Average. The emission factor was developed only from A- and B-rated test data froma reasonable number of facilities. Although no specific bias is evident, it is not clear ifthe facilities tested represent a random sample of the industry. As in the A rating, thesource category is specific enough to minimize variability within the source categorypopulation.
D - Below average. The emission factor was developed only from A- and B-rated testdata from a small number of facilities and there may be reason to suspect that thesefacilities do not represent a random sample of the industry. There may also be evidenceof variability within the source category population. Limitations on the use of theemission factors are footnoted for each emission factor table.
E - Poor. The emission factor was developed from C- and D-rated test data, and theremay be reason to suspect that the facilities tested do not represent a random sample ofthe industry. There also may be evidence of variability within the source categorypopulation. Limitations on the use of these factors are always footnoted.
U - Unrated or Unratable.4 The emission factor was developed from suspect data withno supporting documentation to accurately apply an A through E rating. A "U" ratingmay be applied in the following circumstances:
- a gross mass balance estimation- QA/QC deficiencies found with C- and D-rated test data- gross engineering judgement- technology transfer
*Source category: A category in the emission factor table for which an emission factor has been calculated; generally a single process.
2-3

This document does not contain any discussion of health or other environmental effects
of xylene. It does include a discussion of ambient air monitoring techniques; however, these
ambient air monitoring methods may require modifications for stack sampling and may affect
data quality.
2-4

2.1 REFERENCES FOR SECTION 2.0
1. U.S. Environmental Protection Agency.Crosswalk/Air Toxic Emission Factor DatabaseManagement System, Version 1.2. Office of Air Quality Planning and Standards.Research Triangle Park, NC. October 1991.
2. U.S. Environmental Protection Agency.Volatile Organic Compound (VOC)/ParticulateMatter (PM) Speciation Database Management System, Version 1.4. Office of AirQuality Planning and Standards, Research Triangle Park, NC. October 1991.
3. U.S. Environmental Protection Agency.Technical Procedures for Developing AP-42Emission Factors and Preparing AP-42 Sections. Emission Inventory Branch, Office ofAir and Radiation, Office of Air Quality Planning and Standards. Research Triangle Park,NC. March 1992.
4. Group discussion meeting on applying "U" rating to emission factors. Anne Pope, EIB;Robin Baker Jones, Midwest Research Institute; Garry Brooks, Radian Corporation; andTheresa Moody, TRC Environmental Corporation.
2-5

SECTION 3.0
BACKGROUND
3.1 NATURE OF POLLUTANT
Xylene is an aromatic hydrocarbon that occurs naturally in petroleum and coal tar and is
a constituent of smoke from most combustion sources. Most xylene that is commercially
available is synthetically derived from petroleum and to a lesser extent from coal. Three xylene
isomers exist: ortho-xylene, meta-xylene, and para-xylene, abbreviated o-, m-, and p-xylene,
respectively. Mixed xylenes are a mixture of the three isomers and a small amount of
ethylbenzene.1
Xylene’s molecular formula is C8H10, also known as C6H4(CH3)2. Molecular structures
of the three xylene isomers are represented as follows:1
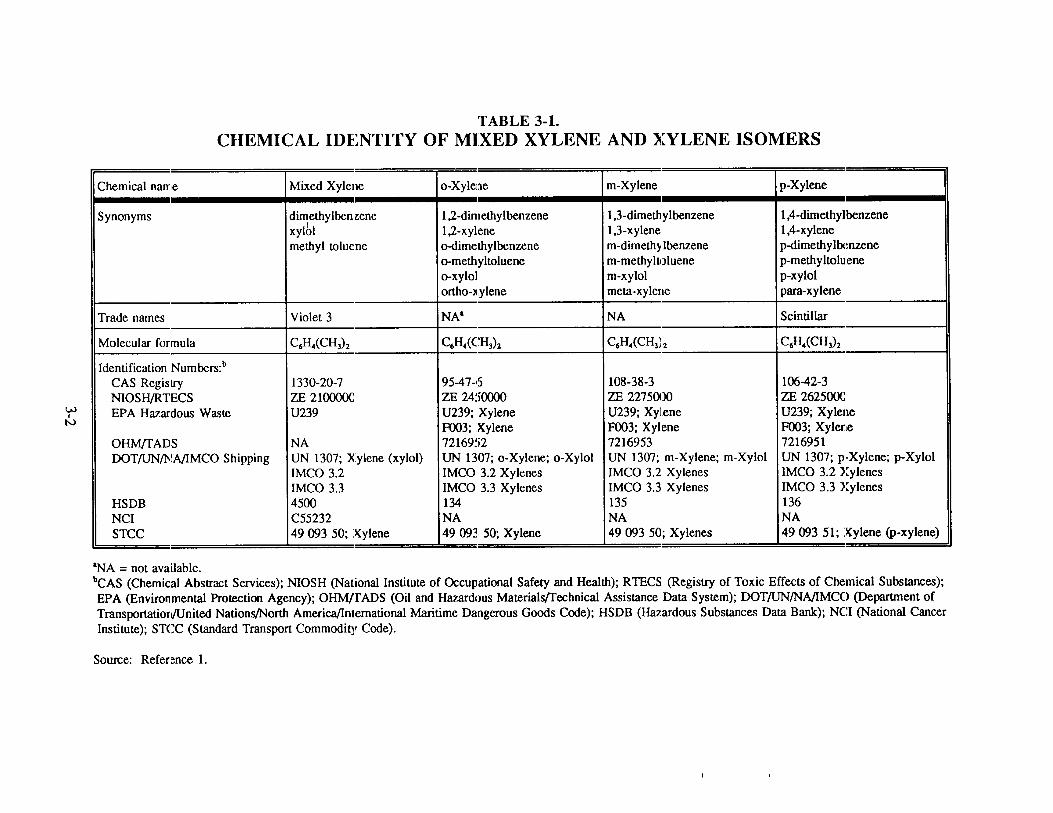
Table 3-1 summarizes the chemical identification information, and Table 3-2 presents
some chemical and physical properties for mixed xylenes and each isomer. This colorless liquid
has a sweet odor and is volatile, flammable, and explosive in air. Xylene is not soluble in water,
but is soluble in alcohol and many organic liquids.
3-1


Atmospheric releases of xylenes are primarily as fugitive emissions from industrial
sources (e.g., petroleum refineries, chemical plants); as emissions in automotive exhausts; and
as a result of volatilization from their use as a solvent. Due to the high volatility of xylenes,
most environmental releases partition to the atmosphere.3 Xylenes are moderately mobile in soil,
where they may be adsorbed. Xylenes may leach into groundwater, where they can persist for
several years. Xylenes are rapidly transformed by photooxidation in the troposphere, and can
participate in the formation of ground-level ozone. Xylenes are stable to hydrolysis and oxidation
in the aquatic environment.1
3.2 OVERVIEW OF PRODUCTION AND USE
The total annual capacity for xylene manufacturing in the United States, the Virgin
Islands, and Puerto Rico was 5,648 million kilograms (12,452 million pounds) in 1989.4
Processes/feedstocks used to manufacture xylenes include petroleum reformate (95.4 percent),
toluene disproportionation (0.4 percent), pyrolysis gasoline (four percent), and coke oven light
oil (0.2 percent). Reformate is the favored feedstock for xylene recovery because it contains
larger quantities of o-xylene and p-xylene than are found in pyrolysis gasoline.5,6 Mixed xylenes
produced from petroleum reformate contain approximately 20 percent o-xylene, 44 percent m-
xylene, 20 percent p-xylene, 15 percent ethylbenzene, and 1 percent other hydrocarbons. By
comparison, mixed xylenes produced from coal tar generally consist of 10 to 15 percent o-xylene,
45 to 70 percent m-xylene, 23 percent p-xylene, and 6 to 10 percent ethylbenzene.1 There were
20 production facilities for mixed xylenes in the United States in 1989.4
High purity mixed xylenes are used as a solvent in chemical manufacture, agricultural
sprays, adhesives, paints, and coatings (5.2 percent). Xylene is also an ingredient in aviation fuel
and gasoline (39.3 percent), and is used as a feedstock material in the chemical, plastic, and
synthetic fiber industries (55.5 percent). Isomers of xylene are used in manufacturing various
polymers. As feedstocks, o-xylene is used in making phthalic anhydride (PA); m-xylene for
isophthalic acid; and p-xylene for terephthalic acid (TPA) and dimethyl terephthalate (DMT).5,6
3-4

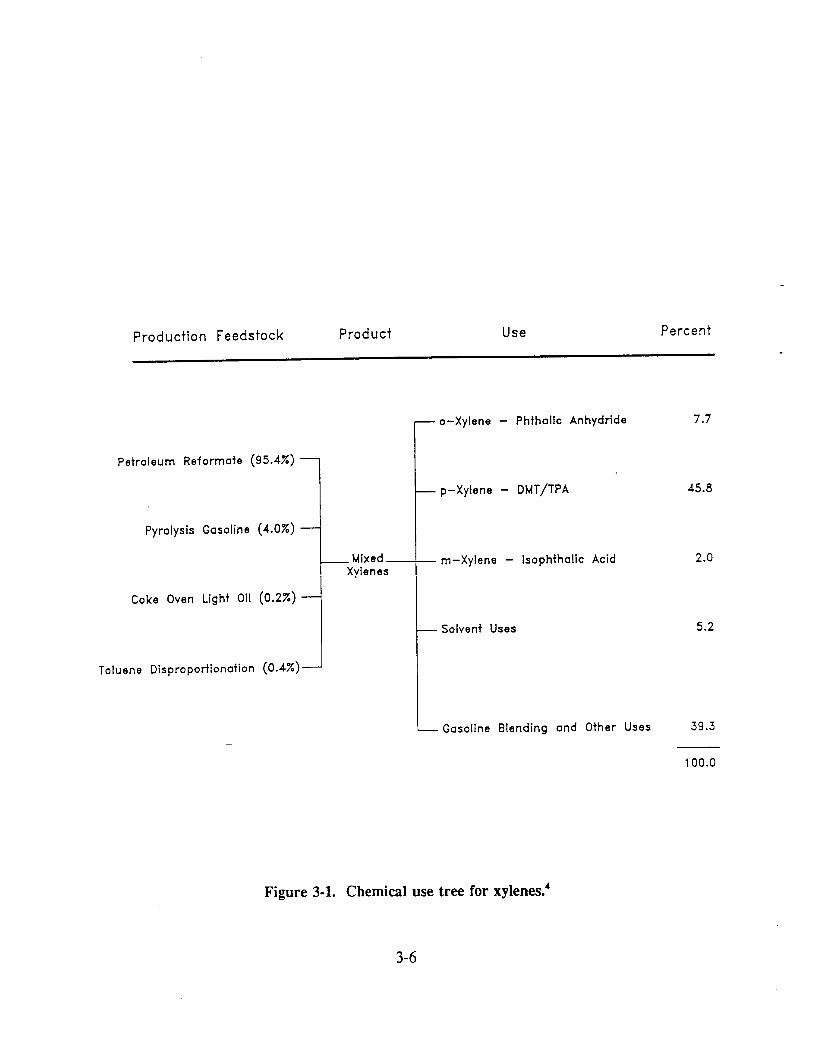
Figure 3-1 is a chemical use tree for xylene showing the production sources and
distribution of mixed xylenes into products and/or separation of isomers. Ortho-xylene is used
almost exclusively in making phthalic anhydride, which is an aromatic acid anhydride
commercially available as white, free-flowing flakes or colorless molten material having an acrid
odor. Phthalic anhydride is used mainly in the manufacture of plasticizers, unsaturated polyester
resins, and alkyd resins. In addition, m-xylene is used in the manufacture of isophthalic acid,
which is used to make specialized resins. Finally, p-xylene is used exclusively for making
dimethyl terephthalate and terephthalic acid (DMT/TPA) which are raw materials used in the
manufacture of polyethylene terephthalate (PET) used in polyester fibers, molded plastics, films,
and blown beverage bottles.5,6
3-5

3.3 REFERENCES FOR SECTION 3.0
1. Toxicological Profile for Total Xylenes. Prepared by Clement Associates, Inc. underContract No. 205-88-0608, Prepared for Agency for Toxic Substances and DiseaseRegistry, U.S. Public Health Services. Atlanta, GA. December 1990.
2. Sax, N. Irving and Richard J. Lewis, Sr.Dangerous Properties of Industrial Materials.Van Nostrand Reinhold, New York, NY. 1989.
3. Howard, Philip H., Ed.Handbook of Environmental Fate and Exposure Data for OrganicChemicals. Lewis Publishers, Inc. Chelsea, MI. 1990.
4. SRI International.Chemical Economic Handbook Petrochemicals/Primary, 450.0000 to499.9999. Menlo Park, CA. April 1990.
5. Chemical Products Synopsis for o-Xylene. Mannsville Chemical Products Corporation.Asbury Park, NJ. June 1992.
6. Chemical Products Synopsis for p-Xylene. Mannsville Chemical Products Corporation.Asbury Park, NJ. May 1992.
3-7
SECTION 4.0
EMISSIONS FROM XYLENE PRODUCTION
This section on xylene production provides separate discussions on the production of
mixed xylenes and the three isomers (m-, o-, and p-xylene). The discussion of the mixed xylenes
is presented first because each isomer is isolated from a mixed xylene feed, and an understanding
of mixed xylene production is basic to describing the production of the isomers. Process flow
diagrams are provided as appropriate, with specific streams or vents shown in the figures labeled
to correspond with the discussion in the text. Emission factors for the production processes are
presented where available and associated control technologies are described. If a particular
facility is being referenced, the reader should contact the specific facility to verify the nature of
the processes used, production volume, and controls that are in place before applying any of the
emission factors presented in this document.
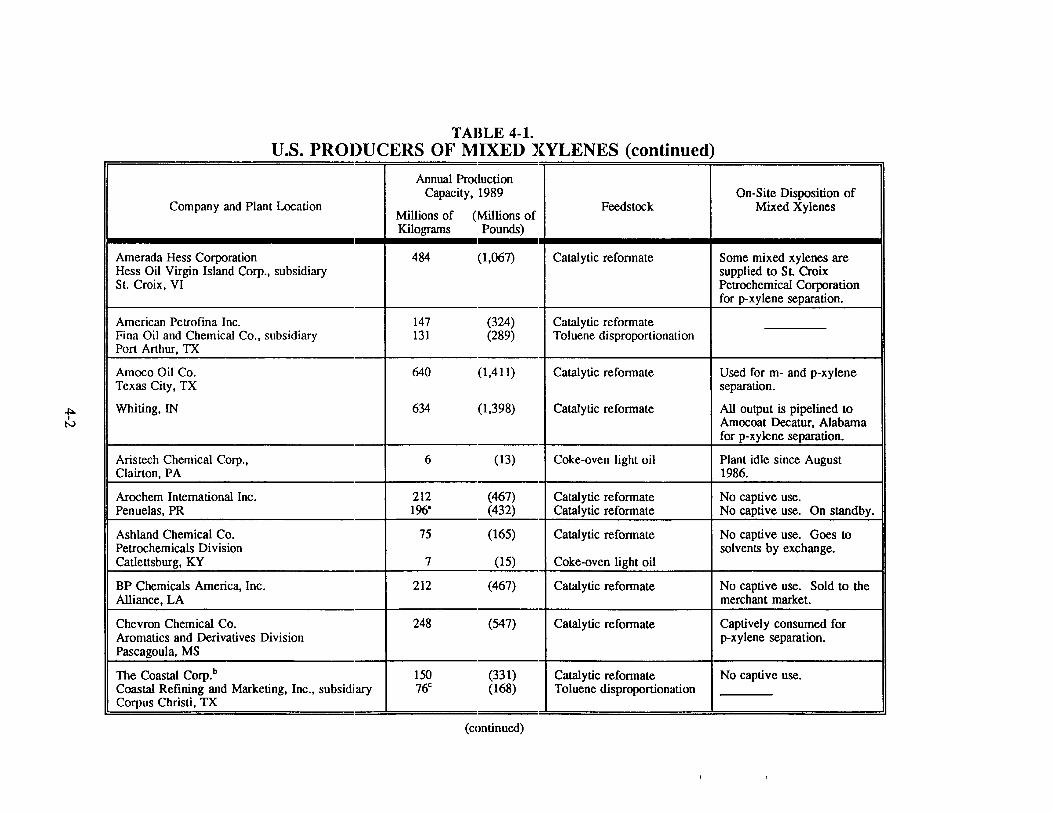
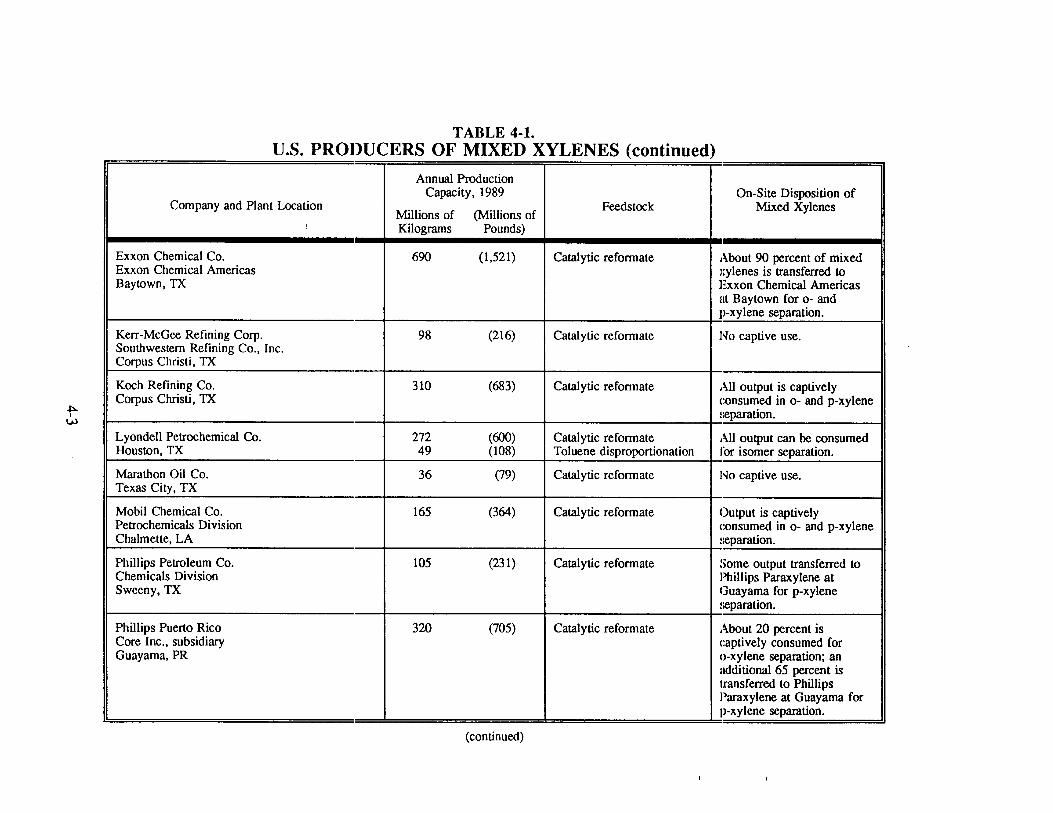
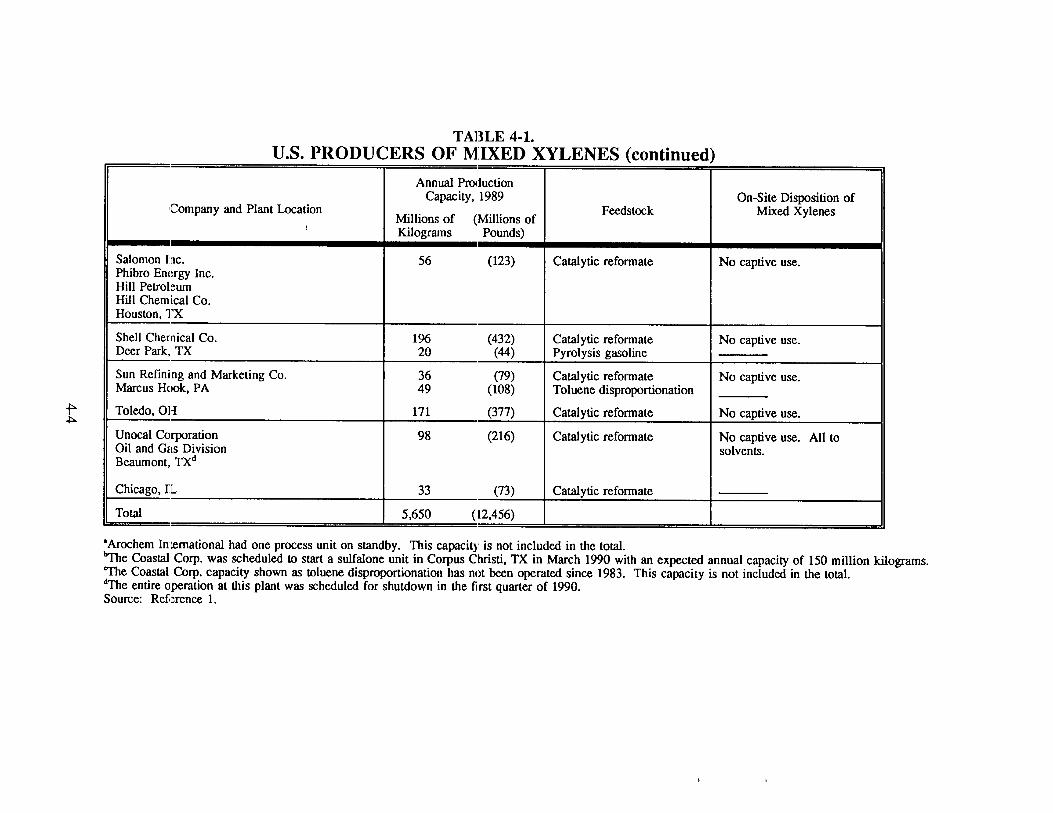
Twenty companies are known to produce xylenes in the United States, with a total
production capacity of greater than 5.6 billion kilograms (12.4 billion pounds) of mixed xylenes
for use by the chemical industry. The largest known producers are Amoco (Texas City, TX and
Whiting, IN), Exxon (Baytown, TX), Amerada Hess (St. Croix, VI), and Phillips (Guayama, PR).
It is estimated that their combined production capacities account for about 51 percent of the total
production for the United States. About 95 percent of mixed xylenes is produced through
catalytic reforming, and about 75 percent of mixed xylenes production is consumed by the
producers for isolation of isomers. Table 4-1 presents production facilities in the United States,
plant locations, and production capacities for mixed xylenes. A number of facilities listed in
Table 4-1 have suspended operations or have changed processes as noted by footnotes and/or
comments in the table. Such facilities are included here to provide historical information, and
because some facilities may become operational again in the future.1
4-1

4.1 MIXED XYLENES PRODUCTION
Most of the xylene produced annually is derived from petroleum fractions. However, the
concentration of light aromatics [e.g., benzene, toluene, and xylene (BTX)] in petroleum rarely
exceeds one percent. Through processing, petroleum, specifically crude oil, can be converted to
BTX streams. Several petroleum fractions are used in aromatic conversion processing. The
fraction most important to the xylene production process is "straight-run light naphtha" which
includes all of the crude oil components heavier than pentanes and up to a final boiling point
between 105°C and 170°C (221° to 338°F).2 It is from this stream that the majority of xylene
is produced by catalytic reforming via hydrotreating. A second refinery stream, also used as a
feedstock in xylene production, is the naphtha that results from the pyrolysis or "steam cracking"
(e.g., hydrocracking) of heavier distillate fractions. Although the primary goal of cracking
naphtha is to manufacture ethylene and propylene, secondary reactions also produce considerable
amounts of "pyrolysis gasoline" rich in aromatics. Additional xylene production methods include
separation from coal tars and disproportionation or transalkylation of toluene.2,3
4.1.1 Hydrotreating
Hydrotreating, schematically illustrated in Figure 4-1, is the process by which the quality
of liquid hydrocarbon streams is improved by subjecting them to mild or severe conditions of
hydrogen pressure in the presence of a catalyst. Both pyrolysis gasolines and straight-run light
naphthas (e.g., catalytic reformer feeds) undergo hydrotreating prior to subsequent processing and
xylene recovery. The liquid petroleum feed is preheated (Step 1), heated in a furnace (Step 2),
and combined with recycled hydrogen gas. The combined feed is passed through a reactor
containing a catalyst bed where the hydrogenation reaction takes place (Step 3).4 Upon leaving
the reactor, the stream is cooled and moved to a separator vessel where recycle or net hydrogen
is removed (Step 4). The liquid then moves to a stabilizer or stripper which removes hydrogen,
hydrogen sulfide, ammonia, water, organic compounds of arsenic and palladium, and light
hydrocarbons dissolved in the separator liquid (Step 5). The stripped, hydrotreated fraction is
4-5


then routed to the next processing step, either catalytic reforming (for naphthas) or secondary
hydrogenation (for pyrolysis gasoline).5
4.1.2 Catalytic Reforming
Catalytic reformate is the major source of xylene, accounting for approximately 95 percent
of the xylene production capacity feedstocks.1,3 Catalytic reforming involves the catalytic
dehydrogenation of straight-run light naphtha in the presence of hydrogen (which reduces coke
formation) to yield a mixture of aromatic hydrocarbons (e.g., benzene, toluene, and the
xylenes).2,3 The catalytic reforming process is illustrated in Figure 4-2, and the reactions
involved in this process are presented below.2
4-7
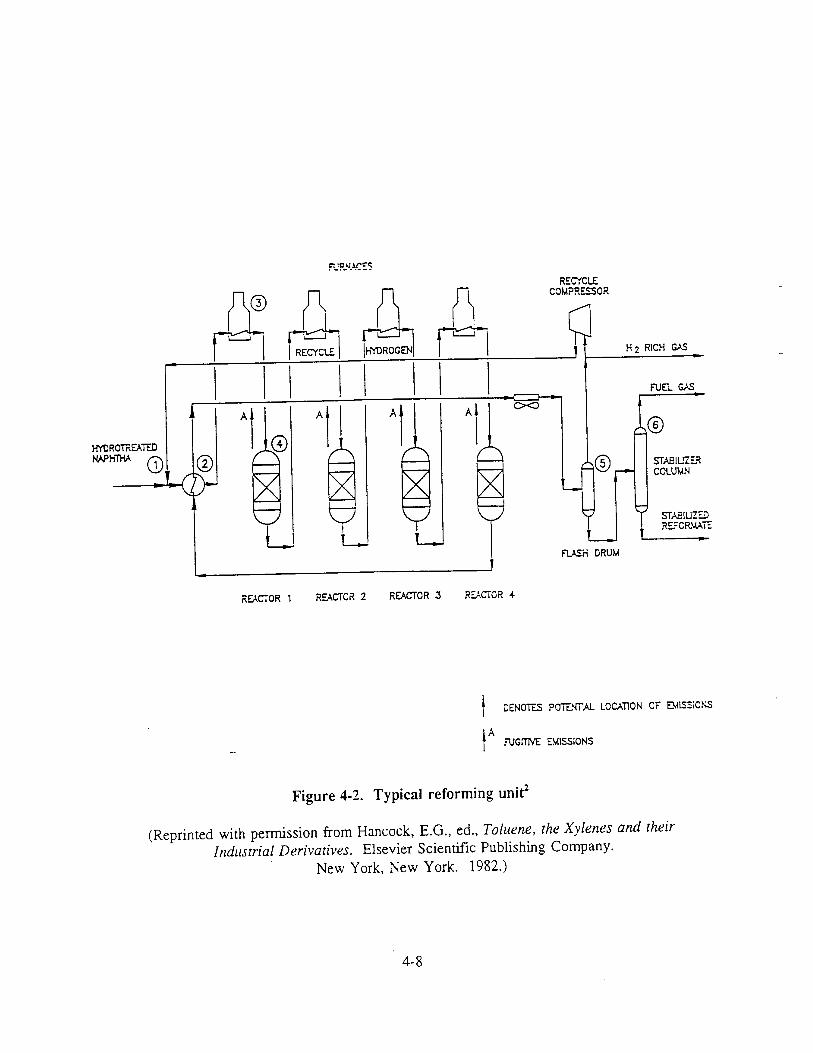
Prior to reforming, the light naphtha is hydrotreated to remove compounds that would
act as catalyst poisons in the reforming step.2,4 The hydrotreated naphtha is fed to the reformer
unit containing the following components:2,5
• Reactors which contain fixed bed catalysts
• Heaters to bring the naphtha and recycle gas to reaction temperature and to supply heatsof reaction
• A product cooling system and a gas-liquid separator
• A hydrogen-gas recycle system
• A stabilizer to separate light hydrocarbons dissolved in the receiver liquid
The naphtha is combined with recycled hydrogen (Step 1), preheated (Step 2), heated to the
reaction temperature in a fired heater (Step 3), and then transferred to a series of catalyst-
containing reactors (Step 4).2 Because the reaction is endothermic, a series of three or four
reactors with inter-stage reheat furnaces may be necessary to achieve the required conversion.
The reactors normally contain increasing amounts of catalyst in each stage.2,4
The effluent from the last reactor is cooled and transferred to a receiving unit (e.g., the
flash drum) where the hydrogen is separated from the liquid reformate (Step 5). The hydrogen
gases are compressed and recycled to the reactors while the reformate is moved to a stabilizer
fractionator (Step 6). The fractionator removes C4 and lighter hydrocarbons to produce a
stabilized reformate. The stabilized reformate is used as a feedstock in the xylene recovery
process (described in Section 4.2).2,5
Most of the facilities that produce xylene by catalytic reforming have proprietary
processes. Table 4-2 lists the process licensor and the process name. The primary differences
between these processes involve solving reforming process problems such as catalyst
regeneration. The processes also differ in the methods used to extract aromatics depending on
the type and purity of the product desired.2
4-9

4.1.3 Secondary Hydrogenation (for Pyrolysis Gasoline)
TABLE 4-2.CATALYTIC REFORMING PROCESSES
Licensor Name of Process
Chevron Research Co. Rheniforming
Engelhard Industries Magnaforming
Exxon Research Engineering Powerforming
Houdry Division, Air Products Houdriforming
Institut Francais duPetrole
AromizingCatalytic Reforming
Standard Oil Co. (Indiana) Ultraforming
UOP Process Division Platforming
Source: Reference 2.
Pyrolysis gasoline, a by-product of ethylene and propylene manufacture, accounts for four
percent of domestic xylene production capacity feedstock materials.1,3 Because pyrolysis gasoline
contains reactive compounds (e.g., diolefins and styrenes) which will polymerize if subjected to
reactor conditions severe enough to saturate olefins and remove sulfur compounds, it must
undergo an initial hydrogenation step described in Section 4.1.1 to reduce the reactives to olefins
prior to storage or further processing. The resulting product can be used as a high octane
gasoline blending component or treated further for aromatic (e.g., benzene, toluene, and xylenes)
extraction.2
Following initial hydrogenation, the pyrolysis gasoline normally undergoes second stage
hydrogenation in which olefins are saturated, organic sulfur forms hydrogen sulfide, combined
nitrogen is converted to ammonia, and oxygenated compounds are reduced to hydrocarbons and
4-10
water. After these parallel reactions have been completed, the gases and liquid are separated.
The liquid is then stripped of gaseous impurities, such as hydrogen sulfide, and remaining light
hydrocarbons before being transferred to xylene recovery units.2,5
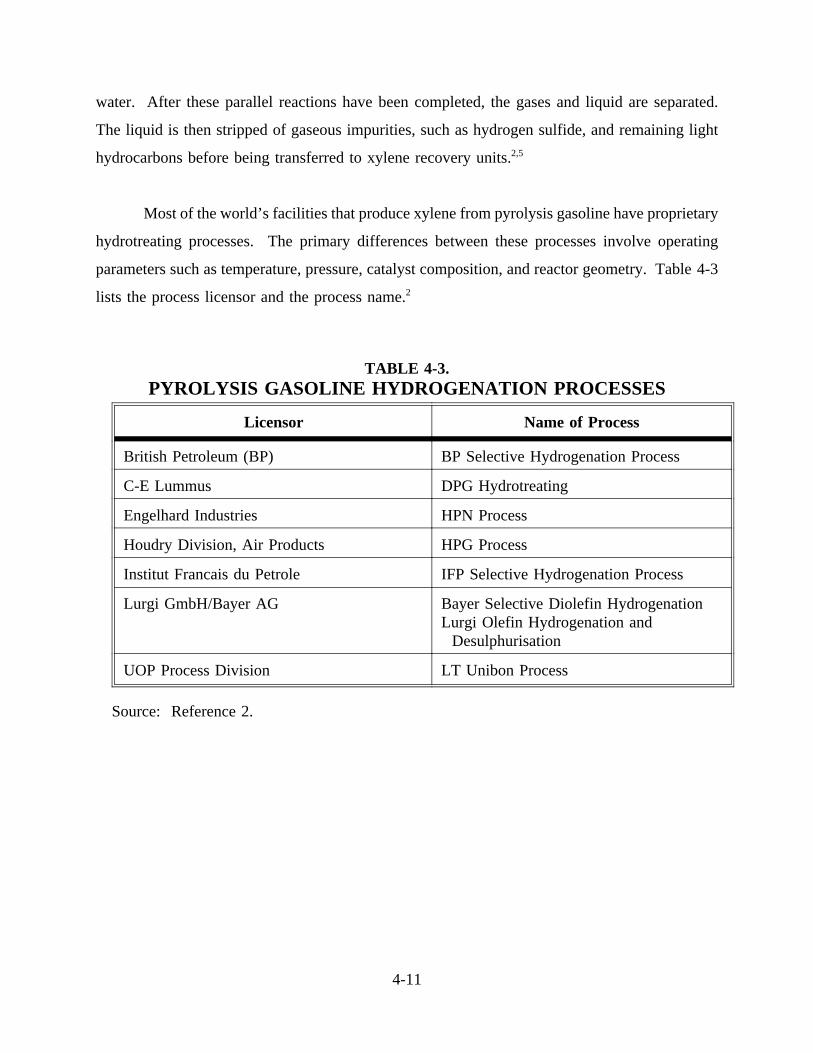
Most of the world’s facilities that produce xylene from pyrolysis gasoline have proprietary
hydrotreating processes. The primary differences between these processes involve operating
parameters such as temperature, pressure, catalyst composition, and reactor geometry. Table 4-3
lists the process licensor and the process name.2
TABLE 4-3.PYROLYSIS GASOLINE HYDROGENATION PROCESSES
Licensor Name of Process
British Petroleum (BP) BP Selective Hydrogenation Process
C-E Lummus DPG Hydrotreating
Engelhard Industries HPN Process
Houdry Division, Air Products HPG Process
Institut Francais du Petrole IFP Selective Hydrogenation Process
Lurgi GmbH/Bayer AG Bayer Selective Diolefin HydrogenationLurgi Olefin Hydrogenation and
Desulphurisation
UOP Process Division LT Unibon Process
Source: Reference 2.
4-11
4.1.4 Xylene Production from Toluene Disproportionation or Transalkylation
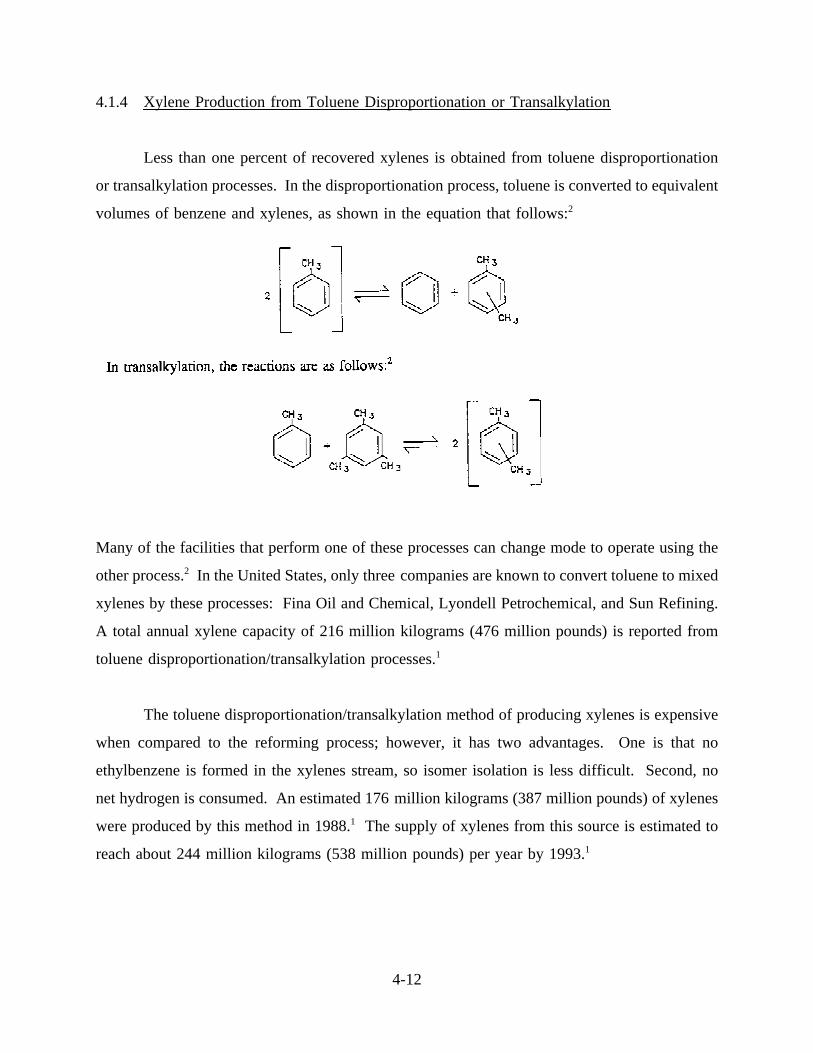
Less than one percent of recovered xylenes is obtained from toluene disproportionation
or transalkylation processes. In the disproportionation process, toluene is converted to equivalent
volumes of benzene and xylenes, as shown in the equation that follows:2
Many of the facilities that perform one of these processes can change mode to operate using the
other process.2 In the United States, only three companies are known to convert toluene to mixed
xylenes by these processes: Fina Oil and Chemical, Lyondell Petrochemical, and Sun Refining.
A total annual xylene capacity of 216 million kilograms (476 million pounds) is reported from
toluene disproportionation/transalkylation processes.1
The toluene disproportionation/transalkylation method of producing xylenes is expensive
when compared to the reforming process; however, it has two advantages. One is that no
ethylbenzene is formed in the xylenes stream, so isomer isolation is less difficult. Second, no
net hydrogen is consumed. An estimated 176 million kilograms (387 million pounds) of xylenes
were produced by this method in 1988.1 The supply of xylenes from this source is estimated to
reach about 244 million kilograms (538 million pounds) per year by 1993.1
4-12

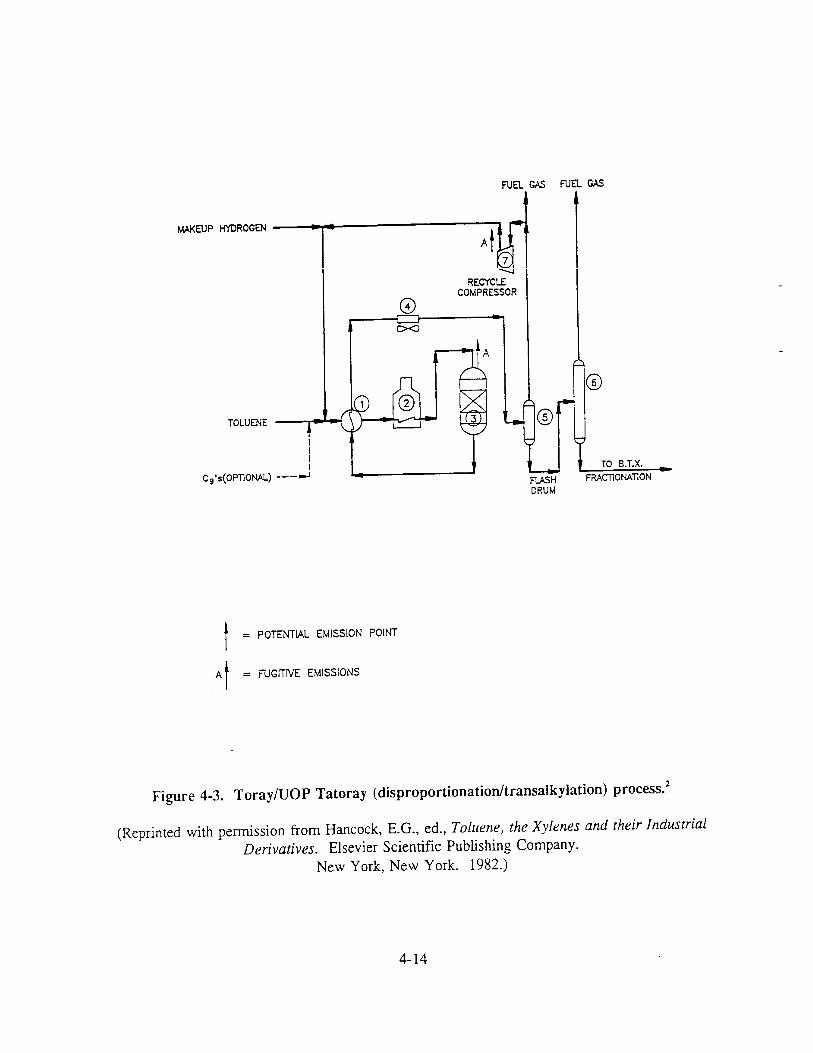
An example of a disproportionation/transalkylation process is illustrated in Figure 4-3 (the
Toray/UOP Tatoray Process). The use of a hydrogen atmosphere in this process, in addition to
the type of catalyst employed, allows several months of operation before catalyst regeneration
is required. A hydrogen recycle compressor (Step 7) is required and can be a potential location
of fugitive emissions. The gas from this compressor is combined with make-up hydrogen,
toluene feed, and, optionally, C9 feed. The mixture is vaporized and superheated by heat
exchange counter current to the reactor effluent (Step 1) and then by a fired heater (Step 2). The
aromatics react to yield a near-equilibrium mixture when passing through the catalyst bed
(Step 3). The mixture then passes back through the feed-effluent exchanger (Step 1) and through
supplementary cooling and condensing (Step 4) to a flash drum (Step 5). Here, the vapor phase
is split into a fuel gas purge and recycle hydrogen (Step 7), and the liquid phase is transferred
to a stabilizer column (Step 6) for the removal of residual light ends (low molecular weight
organics). The stabilized liquid is then returned to BTX fractionation for further processing.2
4.1.5 Coal-Derived Mixed Xylenes
Less than one percent of the production of mixed xylenes is coal derived. When coal is
carbonized in coke ovens, for every ton of coal, about 2 to 3 gallons of a crude light oil is
produced that contains 3 to 6 percent mixed xylenes by volume. The light oil may be captured
and sold to petroleum refiners that use it as a supplementary source of aromatics, or processed
by the coke-oven operators/tar distillers, or burned as fuel. The mixed xylenes present in light
oil from coke ovens are not usually reclaimed, and the amount of mixed xylenes that can be
obtained from the light oil is minimal. Light oil is expected to continue to be a minor source
of xylenes.1 Figure 4-4 illustrates the typical process for mixed xylene production from coal-
derived light oil.
4.2 ISOMERIZATION AND SEPARATION OF XYLENE ISOMERS
The demand for mixed xylenes is low in comparison to the demand for pure isomers,
especially p-xylene. Separation of organic compounds from refinery processes typically utilizes
4-13

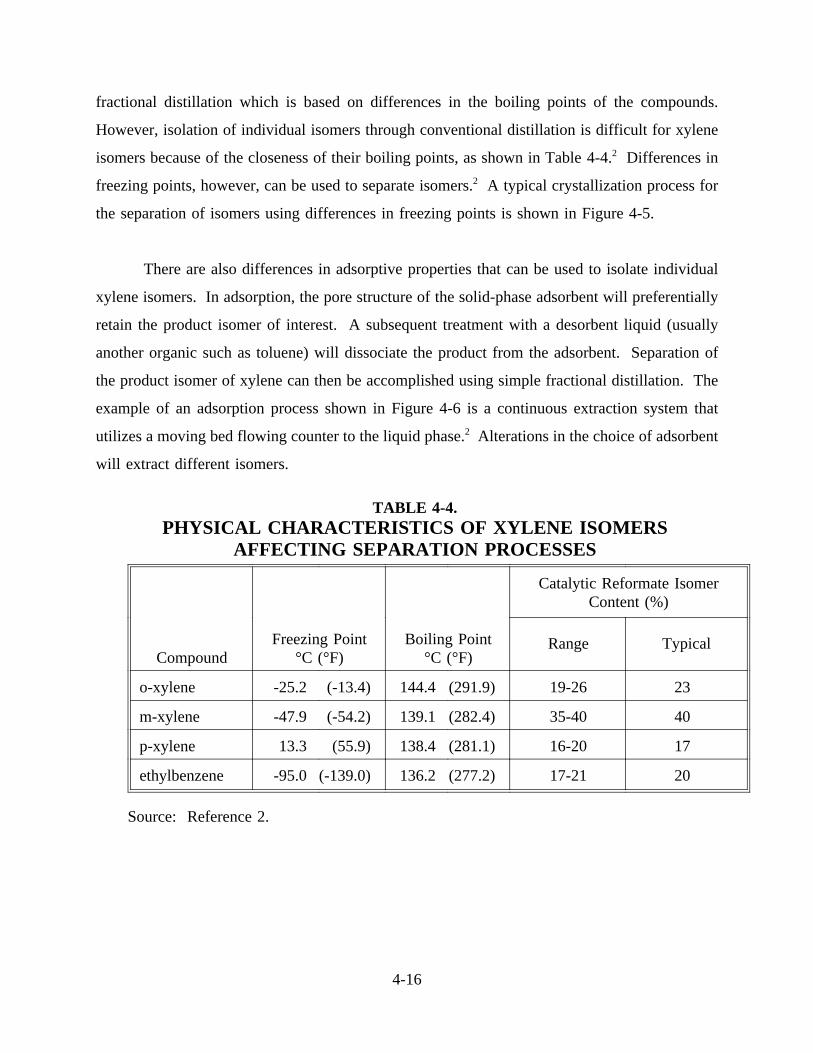
fractional distillation which is based on differences in the boiling points of the compounds.
However, isolation of individual isomers through conventional distillation is difficult for xylene
isomers because of the closeness of their boiling points, as shown in Table 4-4.2 Differences in
freezing points, however, can be used to separate isomers.2 A typical crystallization process for
the separation of isomers using differences in freezing points is shown in Figure 4-5.
There are also differences in adsorptive properties that can be used to isolate individual
xylene isomers. In adsorption, the pore structure of the solid-phase adsorbent will preferentially
retain the product isomer of interest. A subsequent treatment with a desorbent liquid (usually
another organic such as toluene) will dissociate the product from the adsorbent. Separation of
the product isomer of xylene can then be accomplished using simple fractional distillation. The
example of an adsorption process shown in Figure 4-6 is a continuous extraction system that
utilizes a moving bed flowing counter to the liquid phase.2 Alterations in the choice of adsorbent
will extract different isomers.
TABLE 4-4.PHYSICAL CHARACTERISTICS OF XYLENE ISOMERS
AFFECTING SEPARATION PROCESSES
CompoundFreezing Point
°C (°F)Boiling Point
°C (°F)
Catalytic Reformate IsomerContent (%)
Range Typical
o-xylene -25.2 (-13.4) 144.4 (291.9) 19-26 23
m-xylene -47.9 (-54.2) 139.1 (282.4) 35-40 40
p-xylene 13.3 (55.9) 138.4 (281.1) 16-20 17
ethylbenzene -95.0 (-139.0) 136.2 (277.2) 17-21 20
Source: Reference 2.
4-16

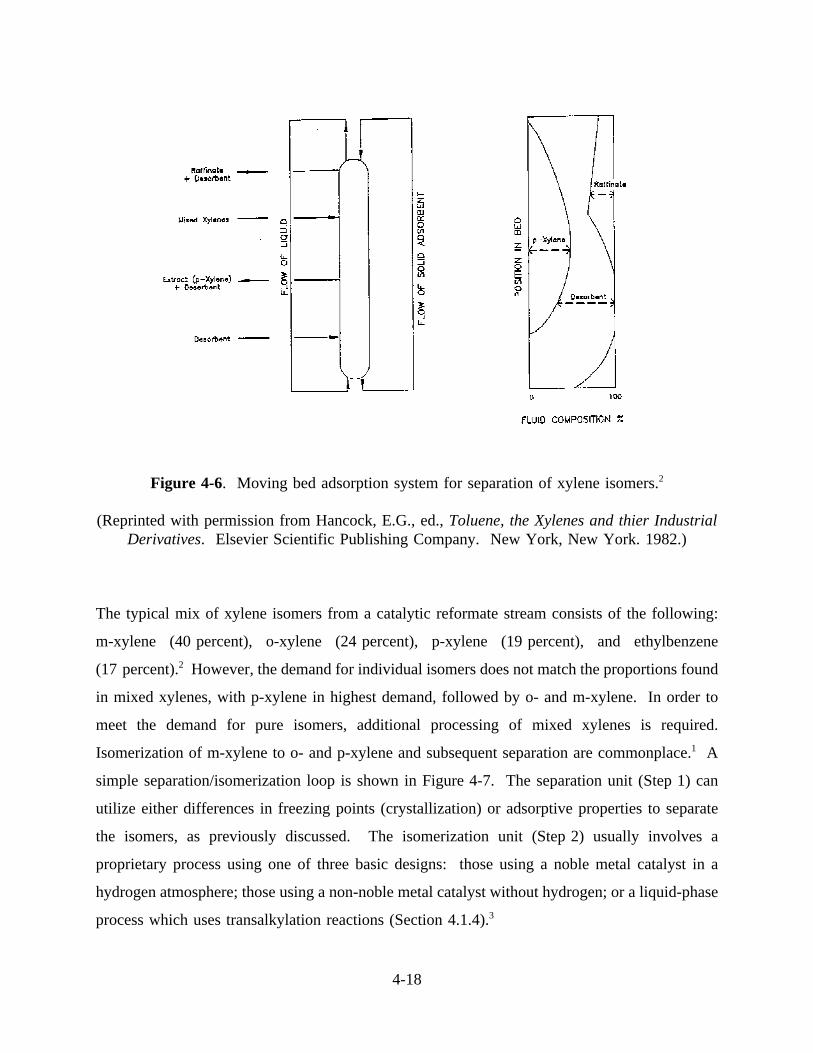
Figure 4-6. Moving bed adsorption system for separation of xylene isomers.2
(Reprinted with permission from Hancock, E.G., ed.,Toluene, the Xylenes and thier IndustrialDerivatives. Elsevier Scientific Publishing Company. New York, New York. 1982.)
The typical mix of xylene isomers from a catalytic reformate stream consists of the following:
m-xylene (40 percent), o-xylene (24 percent), p-xylene (19 percent), and ethylbenzene
(17 percent).2 However, the demand for individual isomers does not match the proportions found
in mixed xylenes, with p-xylene in highest demand, followed by o- and m-xylene. In order to
meet the demand for pure isomers, additional processing of mixed xylenes is required.
Isomerization of m-xylene to o- and p-xylene and subsequent separation are commonplace.1 A
simple separation/isomerization loop is shown in Figure 4-7. The separation unit (Step 1) can
utilize either differences in freezing points (crystallization) or adsorptive properties to separate
the isomers, as previously discussed. The isomerization unit (Step 2) usually involves a
proprietary process using one of three basic designs: those using a noble metal catalyst in a
hydrogen atmosphere; those using a non-noble metal catalyst without hydrogen; or a liquid-phase
process which uses transalkylation reactions (Section 4.1.4).3
4-18
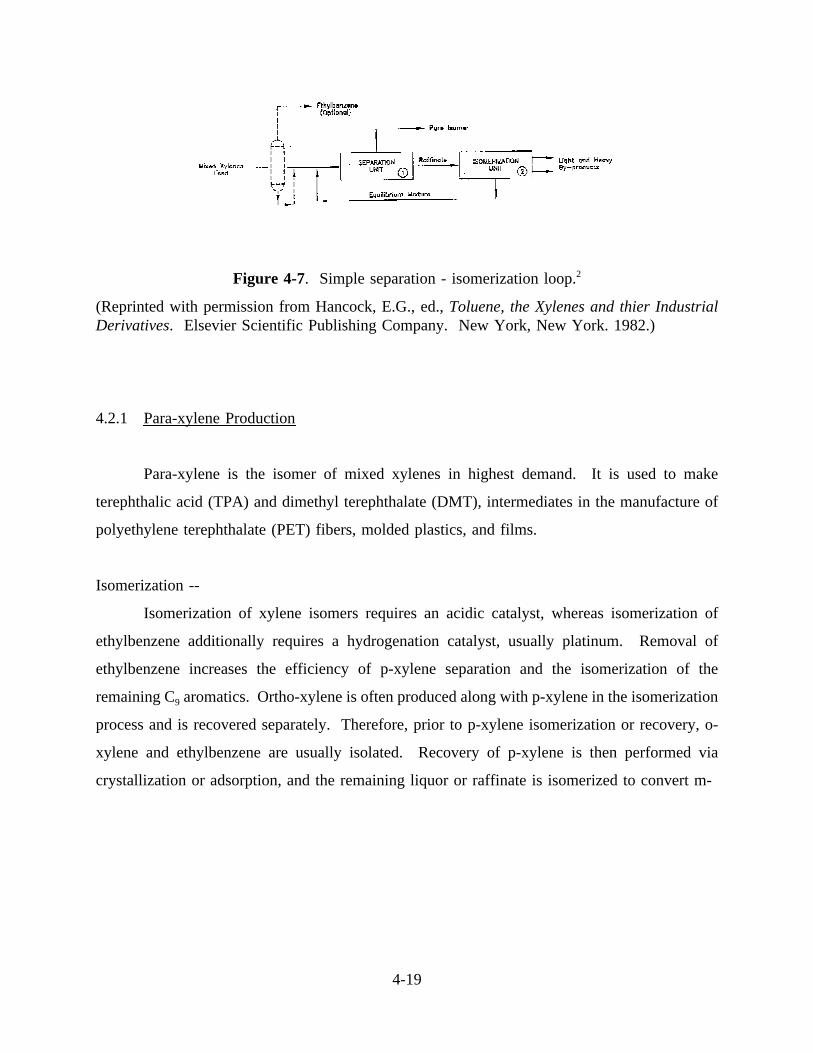
Figure 4-7. Simple separation - isomerization loop.2
(Reprinted with permission from Hancock, E.G., ed.,Toluene, the Xylenes and thier IndustrialDerivatives. Elsevier Scientific Publishing Company. New York, New York. 1982.)
4.2.1 Para-xylene Production
Para-xylene is the isomer of mixed xylenes in highest demand. It is used to make
terephthalic acid (TPA) and dimethyl terephthalate (DMT), intermediates in the manufacture of
polyethylene terephthalate (PET) fibers, molded plastics, and films.
Isomerization --
Isomerization of xylene isomers requires an acidic catalyst, whereas isomerization of
ethylbenzene additionally requires a hydrogenation catalyst, usually platinum. Removal of
ethylbenzene increases the efficiency of p-xylene separation and the isomerization of the
remaining C9 aromatics. Ortho-xylene is often produced along with p-xylene in the isomerization
process and is recovered separately. Therefore, prior to p-xylene isomerization or recovery, o-
xylene and ethylbenzene are usually isolated. Recovery of p-xylene is then performed via
crystallization or adsorption, and the remaining liquor or raffinate is isomerized to convert m-
4-19

xylene to o- and p-xylene. The isomerization unit feed is sometimes mixed with hydrogen
(depending on the process), heated to the reaction temperature, and passed over the catalyst.
Vapor-phase and high-temperature isomerization processes are commonly used in the United
States.1 The octafining process uses a combination of silica-alumina and platinized alumina
catalysts to isomerize xylenes, however, most U.S. companies use the zeolite-based isomerization
processes introduced in the 1970s. It is claimed that these processes can isomerize xylenes,
selectively disproportionate the remaining ethylbenzene, and improve the overall p-xylene yield.1
Separation --
A high-purity p-xylene stream (99 - 99.5 percent by weight) can be isolated by using a
two-stage, low-temperature crystallization process. The first crystallization, the coldest stage,
yields a slurry of crude p-xylene and a filtrate containing other isomers. Melting of the resulting
slurry with a subsequent higher temperature recrystallization yields high-purity p-xylene.
Common crystallization processes have been developed by Chevron, Amoco, ARCO, Phillips,
Shell, Esso, Krupp, and Maruzen.1
Isolation of p-xylene by adsorption results in higher yields (90 - 95 percent per pass
through the process) than can be obtained by a single step crystallization process
(60 - 70 percent). In the Parex process (licensed by UOP, Inc.) and the Aromax process
(licensed by Toray Industries, Inc.), p-xylene is continuously and selectively retained on a zeolite
adsorbent in the liquid phase. Zeolite permits entry of the main feed components into the pore
structure and selectively adsorbs p-xylene. These continuous processes operate with a fixed bed,
which appears to move in the direction opposite to the liquid streams. The process shown in
Figure 4-6 is representative of a moving bed adsorption system. The p-xylene retained on the
adsorbent is removed by a desorbent such as toluene or p-diethylbenzene; with p-xylene separated
from the desorbent hydrocarbon by distillation. The typical p-xylene product from this process
is around 99.5 percent pure and contains about 0.3 percent ethylbenzene, 0.17 percent m-xylene,
and 0.1 percent o-xylene.1
4-20

Production Capacity and Demand --
The U.S. p-xylene annual consumption grew an average of about 4 percent per year from
1986 to 1991. However, average growth in production was only 1.5 percent per year reflecting
decreases in exports. Table 4-5 shows both the historical and projected production capacity,
actual production, imports, exports, and demand for p-xylene. Demand grew an average of about
10 percent per year from 1985 to 1988. The increased use of PET soft drink bottles and other
containers, polyester apparel (PET fiber production), and the popularity of video tapes (PET
films) have all contributed to an increase in PET demand and thereby demand for p-xylene.
Overall, the United States p-xylene demand is expected to increase in the range of 2 to 4 percent
per year in the near future.5
TABLE 4-5.ESTIMATED DOMESTIC U.S. SUPPLY AND
DEMAND OF P-XYLENE
Millions of Kilograms (Millions of Pounds)
1980 1985 1987 1988 1989 1990 1991 1992
ProductionCapacity
2,495(5,500)
2,495(5,500)
2,515(5,545)
2,717(5,990)
2,801(6,175)
2,835(6,250)
2,971(6,550)
2,815(6,205)
Production 1,922(4,237)
2,167(4,778)
2,338(5,155)
2,541(5,601)
2,424(5,344)
2,359(5,200)
2,864(5,432) NA
Imports 23(50)
67(147)
115(253)
101(222)
120(265)
86(189)
87(191) NA
Exports 379(835)
510(1,125)
368(811)
393(866)
311(686)
299(659)
289(637) NA
Demand 1,566(3,452)
1,724(3,800)
2,985(4,597)
2,248(4,957)
2,233(4,923)
2,145(4,730)
2,464(5,432)
2,524(5,565)
NA = No data available.
Source: Reference 4.
4-21

Currently, U.S. p-xylene production capacity greatly exceeds demand. Some older, less
efficient plants may be closed as the gap between U.S. production and demand increases, export
markets decline, and prices weaken. St. Croix Petrochemicals ceased operation in 1991 with
295 million kilograms (650 million pounds) of capacity. St. Croix Petrochemical is jointly
owned by Amerada Hess and Cape Industries and obtained feedstock from the adjacent Amerada
Hess refinery. Kemtec Petrochemical, which started up in 1989, closed a 181 million kilograms
(400 million pounds) unit in Canada in 1991 due to financial difficulties. However, newer
efficient facilities are adding capacity. Exxon added 68 million kilograms (150 million pounds)
of capacity at Baytown, TX in 1991. Koch added 68 million kilograms (150 million pounds) of
capacity at Corpus Christi in 1991 and will expand to 385 million kilograms (850 million
pounds) per year in 1992, and ultimately to 454 million kilograms (1,000 million pounds).
Lyondell Petrochemicals expanded to 197 million kilograms (435 million pounds) in 1990.
Although total world demand for p-xylene is expected to steadily increase, near term global
production capacity additions are expected to substantially exceed the growth rate of
consumption, resulting in a continually oversupplied market. Table 4-6 lists U.S. p-xylene
producers and 1992 capacities.7,8
4.2.2 Ortho-xylene Production
Ortho-xylene is used predominately in the manufacture of phthalic anhydride. Additional
minor uses of o-xylene are in the manufacture of bactericides, soybean herbicides, and lube oil
additives. Ortho-xylene is commercially available as a mixture of at least 95 percent o-xylene,
and 5 percent m-xylene and p-xylene. All o-xylene producers also recover p-xylene; however,
not all p-xylene producers recover o-xylene.9
Separation --
Ortho-xylene is first separated from other C8 compounds in a distillation column (xylene
splitter using the distillation stages). The first distillation recovers m- and p-xylene and
ethylbenzene leaving a mixture of o-xylene, C9, and higher aromatics. The mixture remaining
is redistilled to recover separate components. The higher aromatics are used as solvents or as
4-22

blending components for gasoline. The purity of the o-xylene production is 97.5 percent,
TABLE 4-6.DOMESTIC U.S. P-XYLENE PRODUCERS AND 1992
PRODUCTION CAPACITIES
Producer Location
1992 Production CapacityMillions of Kilograms(Millions of Pounds)
Amoco Chemicals Decatur, AL 506 (1,115)
Amoco Chemicals Texas City, TX 685 (1,510)
Chevron Chemical Pascagoula, MS 238 (525)
DuPont Chocolate Bayou, TX 27a (60)
Exxon Baytown, TX 454 (1,000)
Koch Refining Co. Corpus Christi, TX 397 (875)
Lyondell Houston, TX 197 (435)
Mobil Chemical Chalmatte, LA 77 (170)
Phillips 66 Las Mareas, PR 261 (600)aListed in Reference 7 (1991) but not in Reference 8 (1992).
Source: References 7 and 8.
containing about 1 percent C9 and heavier products and 1.5 percent other xylenes.1
Production Capacity and Demand --
Table 4-7 presents historical and projected figures for o-xylene capacity, production,
imports, exports, and demand.1,6,9 Worldwide overcapacity still exists. In 1988, imports met
almost 25 percent of U.S. demand. Ortho-xylene is shipped to the United States from Eastern
and Western Europe, as well as South America. Table 4-8 lists domestic U.S. o-xylene producers
and their corresponding 1992 capacities. An additional 91 million kilograms (200 million
pounds) of production capacity is available through the AroChem International facility at
4-23

TABLE 4-7.ESTIMATED DOMESTIC U.S. SUPPLY AND DEMAND OF
O-XYLENE
Millions of Kilograms (Millions of Pounds)
1980 1985 1986 1987 1988 1989 1990 1991 1992
ProductionCapacity
619(1365)
438(965)
438(965)
438(965)
438(965)
438(965)
438(965) NA
445(980)
ActualProduction
451(995)
306(675)
357(788)
430(947)
440(971)
436(963)
428(943)
424(935) NA
Imports NA 49(109)
88(195)
57(126)
124(273)
24(53)
5(12)
8(18) NA
Exports 217(478)
34(75)
49(107)
58(127)
55(121)
24(54)
33(73)
38(84) NA
Demand 235(517)
322(709)
397(876)
429(946)
509(1,123)
445(982)
400(882)
394(869)
433(955)
NA No data available.
Source: References 1, 6 and 9.
TABLE 4-8.DOMESTIC U.S. O-XYLENE PRODUCERS AND 1992
PRODUCTION CAPACITIES
Producer Location
1992 CapacityMillions of Kilograms(Millions of Pounds)
AroChem International Penuelas, PR 91 (200)
Exxon Chemical Baytown, TX 127 (280)
Koch Corpus Christi, TX 79 (174)
Lyondell Petrochemicals Houston, TX 109 (240)
Mobil Chemical Chalmette, LAa 70 (155)
Phillips 66 Guayama, PR 59 (130)aFormerly owned by Tenneco, Inc. until 1988.
Source: References 6 and 9.
4-24

Penuelas, PR. The Shell facility at Deer Park, TX, with a 54 million kilogram (120 million
pound) production capacity is closed indefinitely.6
The growth of the o-xylene market between 1982 and 1991 averaged 1.7 percent per year
and is expected to be at two percent through 1992. Ortho-xylene facilities are expected to
continue operating at 90 percent of capacity. However, additional foreign production capacity
may reduce short-term o-xylene demand by five percent. Long-term, the market for o-xylene will
be limited by demand from producers of phthalic anhydride, whose facilities are operating at
close to capacity.6
4.2.3 Meta-xylene Production
The production of m-xylene relies on separation of the isomer from a mixed xylenes feed.
First, a mixture of m- and p-xylene is obtained after removal of o-xylene and ethylbenzene via
fractionation. Para-xylene is then partially removed via crystallization or adsorption. High purity
m-xylene is then obtained by one of the following methods: crystallization using carbon
tetrachloride; through a process in which a nickel thiocyanate/gamma-picoline Werner complex
encapsulates p-xylene; or by formation of a complex of m-xylene with hydrofluoric acid (HF),
and boron trifluoride (BF3). The HF/BF3/m-xylene complex process, developed by Mitsubishi
Gas Chemical, is currently the most common commercial process.3
Amoco Chemical Company is the only known U.S. company isolating m-xylene and using
it for the manufacture of isophthalic acid at their Texas City, TX facility. As of January 1989,
Amoco had a production capacity of 110 million kilograms (243 million pounds).2 Historical
production, export, import, and demand information for m-xylene was not available at the time
of report preparation.
4-25

4.2.4 Ethylbenzene Production
Although ethylbenzene is not a xylene isomer, it is discussed here because it is a major
component of mixed xylenes and its separation is integral to production of the individual isomers
of xylene. Ethylbenzene recovery by super fractionation of C8 aromatics (requiring three
200 foot distillation columns in series) is more difficult than o-xylene fractionation because of
the closeness of its boiling point to that of p-xylene. Removal of ethylbenzene increases the
efficiency of the p-xylene separation processes and the isomerization of the remaining C8
aromatics. Product purity of ethylbenzene is 99.6 percent; the remainder is toluene, paraffins,
and some m- and p-xylene. This method of producing ethylbenzene is energy intensive compared
with the production of ethylbenzene via alkylation of benzene and ethylene. While about
99 percent of ethylbenzene is consumed in styrene production, a small amount is used in solvent
applications, sometimes replacing xylene.1
4.3 EMISSIONS
Most air emissions associated with xylene production from petroleum fractions arise from
loading operations, storage, and equipment leaks. Process vents also contribute to air emissions.
Xylene emissions from other sources, such as waste treatment and disposal facilities are discussed
in Section 7.0. Emissions from the production of mixed xylenes and individual isomers are
discussed separately in this subsection.
Emissions from the production of mixed xylenes are dependent on the refinery
configuration, the mix of products being manufactured, and the nature of the crude oil feedstock.3
Verifying the production process and other operational parameters at a particular facility is highly
recommended before determining emissions.
4-26
4.3.1 Process Emissions
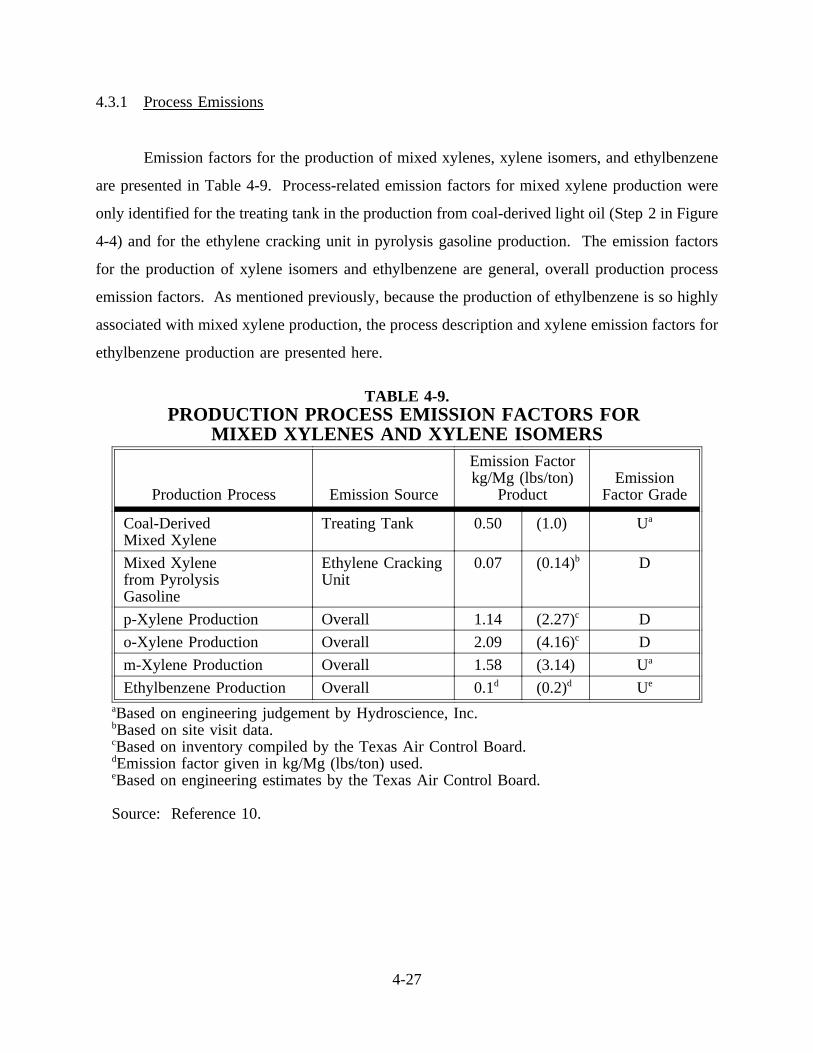
Emission factors for the production of mixed xylenes, xylene isomers, and ethylbenzene
are presented in Table 4-9. Process-related emission factors for mixed xylene production were
only identified for the treating tank in the production from coal-derived light oil (Step 2 in Figure
4-4) and for the ethylene cracking unit in pyrolysis gasoline production. The emission factors
for the production of xylene isomers and ethylbenzene are general, overall production process
emission factors. As mentioned previously, because the production of ethylbenzene is so highly
associated with mixed xylene production, the process description and xylene emission factors for
ethylbenzene production are presented here.
TABLE 4-9.PRODUCTION PROCESS EMISSION FACTORS FOR
MIXED XYLENES AND XYLENE ISOMERS
Production Process Emission Source
Emission Factorkg/Mg (lbs/ton)
ProductEmission
Factor Grade
Coal-DerivedMixed Xylene
Treating Tank 0.50 (1.0) Ua
Mixed Xylenefrom PyrolysisGasoline
Ethylene CrackingUnit
0.07 (0.14)b D
p-Xylene Production Overall 1.14 (2.27)c D
o-Xylene Production Overall 2.09 (4.16)c D
m-Xylene Production Overall 1.58 (3.14) Ua
Ethylbenzene Production Overall 0.1d (0.2)d Ue
aBased on engineering judgement by Hydroscience, Inc.bBased on site visit data.cBased on inventory compiled by the Texas Air Control Board.dEmission factor given in kg/Mg (lbs/ton) used.eBased on engineering estimates by the Texas Air Control Board.
Source: Reference 10.
4-27

4.3.2 Storage Emissions
Possible sources of xylene emissions include storage tank losses and handling losses that
occur during product loading into drums, tank trucks, tank cars, barges, or ships. Storage tank
losses include working losses that occur while filling the tank, and breathing losses due to
expansion from temperature changes. The calculations to determine emissions from storage tanks
are complex and require a knowledge of a number of factors which are plant specific. Equations
for storage tank emissions are given in the U.S. Environmental Protection Agency’s report titled
Estimating Air Toxics Emissions from Organic Liquid Storage Tanks(EPA-450/4-88-004).11 In
the absence of specific data on the storage tank, generic emission factors were identified in the
literature and are shown in Table 4-10 for mixed xylene, xylene isomer, and ethylbenzene
production. The emission factors shown were based on various source test data, inventory data,
and/or engineering judgement. Thus, there are some differences in emission factors for storage
emissions when such differences would normally not be expected.
4.3.3 Equipment Leak Emissions (Fugitive Emissions)
Emission factors for fugitive emissions are presented in Table 4-11. However, these
emission factors should be used cautiously and are only recommended for obtaining gross
emission estimates. They do not take into account the actual number of various leaking and
nonleaking components within a facility, but are only a general estimate based on a hypothetical
plant. The discussion below presents a more credible approach to determining fugitive emissions.
Emissions occur from process equipment components whenever the liquid or gas streams
leak from the equipment. Equipment leaks can occur from the following components: pump
seals, process valves, compressor seals and safety relief valves, flanges, open-ended lines, and
sampling connections. Emission estimates can be calculated in the five ways described in the
EPA publicationProtocols for Generating Unit-Specific Emission Estimates for VOC and VHAP
(EPA-450/3-88-010).12 The methods differ in complexity; however, greater complexity usually
yields more accurate emission estimates.
4-28
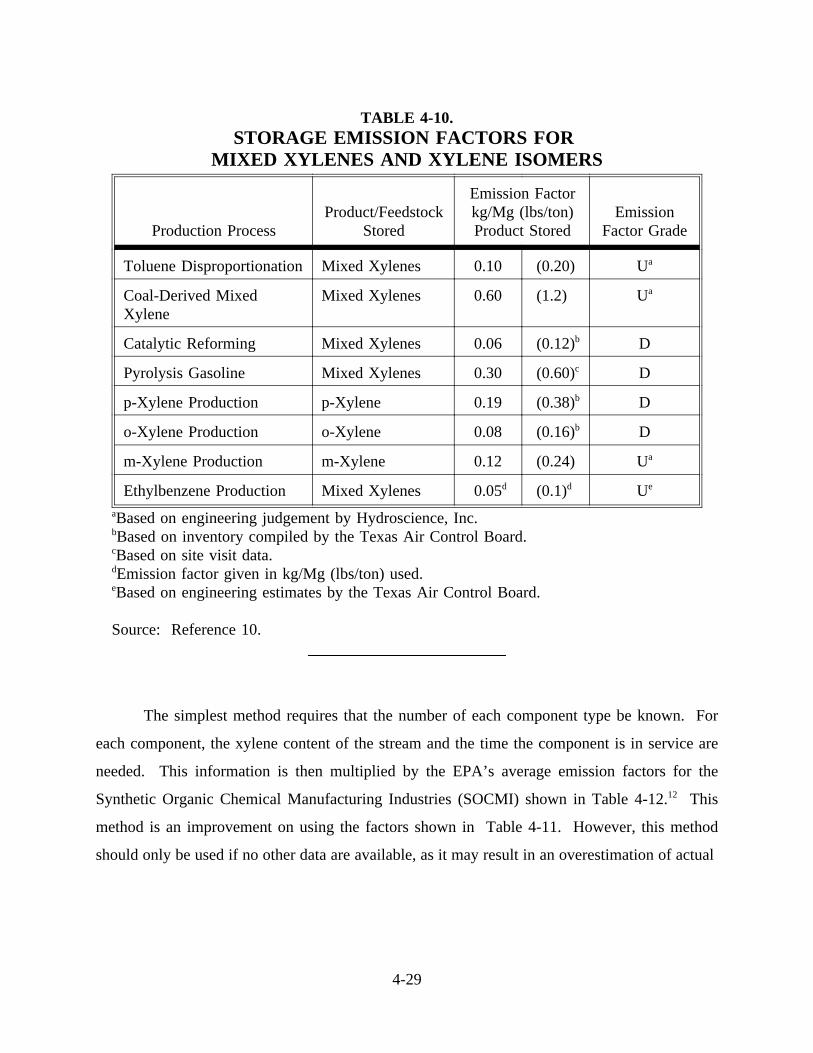
The simplest method requires that the number of each component type be known. For
TABLE 4-10.STORAGE EMISSION FACTORS FOR
MIXED XYLENES AND XYLENE ISOMERS
Production ProcessProduct/Feedstock
Stored
Emission Factorkg/Mg (lbs/ton)Product Stored
EmissionFactor Grade
Toluene Disproportionation Mixed Xylenes 0.10 (0.20) Ua
Coal-Derived MixedXylene
Mixed Xylenes 0.60 (1.2) Ua
Catalytic Reforming Mixed Xylenes 0.06 (0.12)b D
Pyrolysis Gasoline Mixed Xylenes 0.30 (0.60)c D
p-Xylene Production p-Xylene 0.19 (0.38)b D
o-Xylene Production o-Xylene 0.08 (0.16)b D
m-Xylene Production m-Xylene 0.12 (0.24) Ua
Ethylbenzene Production Mixed Xylenes 0.05d (0.1)d Ue
aBased on engineering judgement by Hydroscience, Inc.bBased on inventory compiled by the Texas Air Control Board.cBased on site visit data.dEmission factor given in kg/Mg (lbs/ton) used.eBased on engineering estimates by the Texas Air Control Board.
Source: Reference 10.
each component, the xylene content of the stream and the time the component is in service are
needed. This information is then multiplied by the EPA’s average emission factors for the
Synthetic Organic Chemical Manufacturing Industries (SOCMI) shown in Table 4-12.12 This
method is an improvement on using the factors shown in Table 4-11. However, this method
should only be used if no other data are available, as it may result in an overestimation of actual
4-29

equipment leak emissions. For each component, estimated emissions are calculated in the
following way:12
No. ofequipment
components×
Weight %xylene
in the stream×
Componentspecific
emission factor×
No. hrs/yr inxylene service
TABLE 4-11.FUGITIVE EMISSION FACTORS FOR
MIXED XYLENES AND XYLENE ISOMERS
Production Process
Emission Factorkg/Mg (lbs/ton)
ProductEmission Factor
Grade
Mixed Xylenes from TolueneDisproportionation
0.05 (0.10)a E
Coal-Derived Mixed Xylene 0.15 (0.30)a E
Mixed Xylenes from CatalyticReforming
0.03 (0.06)b D
Mixed Xylene from PyrolysisGasoline
0.03 (0.06)c D
p-Xylene Production 0.24 (0.48)b D
o-Xylene Production 0.38 (0.76)b D
m-Xylene Production 0.30 (0.6)a E
Ethylbenzene Production 0.05d (0.1)d,e EaBased on engineering judgement by Hydroscience, Inc.bBased on inventory compiled by the Texas Air Control Board.cBased on site visit data.dEmission factor given in kg/Mg (lbs/ton) used.eBased on estimates by the Texas Air Control Board.
Source: Reference 10.
4-30

To obtain more accurate equipment leak emission estimates, one of the more complex
TABLE 4-12.AVERAGE EMISSION FACTORS FOR FUGITIVE
EQUIPMENT LEAK EMISSIONS
Equipment ServiceEmission Factor(kg/hr/source)
EmissionFactor
(lb/hr/source)
DataQualityRatinga
Valves GasLight LiquidHeavy Liquid
0.00560.00710.00023
0.01230.01560.00051
U
Pump Seals Light LiquidHeavy Liquid
0.04940.0214
0.1090.0471
U
Compressor Seals Gas/Vapor 0.228 0.502 U
Pressure Relief Seals Gas/Vapor 0.104 0.229 U
Flanges All 0.00083 0.0018 U
Open-Ended Lines All 0.0017 0.0037 U
Sampling Connections All 0.0150 0.0033 U
aBased on engineering judgement.Source: Reference 12.
estimation methods should be used. These methods require that some level of emission
measurement for the facility’s equipment components be collected. These are described briefly,
and the reader is referred to theProtocolsdocument for the calculation details.12
The first method, the leak/no leak approach, is based on a determination of the number
of leaking and non-leaking components. These values are then multiplied by two different sets
of EPA-derived emission factors as presented in theProtocolsdocument.12 The second method
groups screening results into three ranges: 0-1,000 ppmv; 1,001-10,000 ppmv; and greater than
10,000 ppmv. The number of each component falling in a particular range is multiplied by the
component-specific emission factor for that range. These emission factors have also been
4-31

developed by EPA. Another procedure uses screening data in correlation equations derived from
earlier work by EPA. An additional method calls for the facility to develop its own correlation
equations, but this method requires more rigorous testing, bagging and analyzing of equipment
leaks to determine mass emission rates.
4.3.4 Emission Controls
Controls on process emissions are usually vented to fuel gases or recycled into other
processes. Storage emissions are usually controlled by using floating roof tanks to reduce
emissions from standing and working losses. Submerged filling reduces emissions during loading
of the product into drums, tanks, and barges.
Although no specific information on controls of fugitive emissions used by the industry
was identified, equipment components in xylene service will have some controls in place.
Generally, control of fugitive emissions will require the use of sealless or double mechanical seal
pumps, an inspection and maintenance program, as well as replacement of leaking valves and
fittings. Typical controls for equipment leaks are listed in Table 4-13. Some leakless equipment
is available such as leakless valves and sealless pumps.13
4-32

TABLE 4-13.CONTROL TECHNIQUES AND EFFICIENCIES APPLICABLE TO
EQUIPMENT LEAK EMISSIONS
Equipment component(Emission source) Control technique
Percentreductiona
Pump Seals:
Packed andMechanical
Seal area enclosure vented to acombustion device
Monthly LDARb
Quarterly LDARSemiannual LDARAnnual LDAR
100613200
Double Mechanicalc N/Ad -------
Compressors Vent degassing reservoir tocombustion device
100
Flanges None available 0
Valves:Gas Monthly LDAR
Quarterly LDARSemiannual LDARAnnual LDAR
73645024
Liquid Monthly LDARQuarterly LDARSemiannual LDARAnnual LDAR
5944220
Pressure Relief DevicesGas Monthly LDAR
Quarterly LDARRupture Disk
5044
100
Sample Connections Closed-purge sampling 100
Open-ended Lines Caps on open ends 100aIf a negative reduction for a control technique was indicated, zero was used.bLDAR = Leak detection and repair.cAssumes the seal barrier fluid is maintained at a pressure above the pump stuffing boxpressure and the system is equipped with a sensor that detects failure of the seal and/orbarrier fluid system.
dN/A - Not applicable. There are no VOC emissions from this component.
Source: Reference 11.
4-33
4.4 REFERENCES FOR SECTION 4.0
1. SRI International.Chemical Economics Handbook, Petrochemical/Primary 450.0000 to499.9999. April 1990.
2. Hancock, E.G., ed.,Toluene, the Xylenes and Their Industrial Derivatives. ElsevierScientific Publishing Company. New York, NY. 1982.
3. Kirk-Othmer Encyclopedia of Chemical Technology, Third Edition Volume 4. John Wileyand Sons. New York, NY. 1978.
4. Lowenheim, Fredrick A. and Moran, Marguerite, K.Faith, Keyes, and Clark’s IndustrialChemicals. Fourth Edition, 1975.
5. Considine, Douglas M, ed.,Chemical and Process Technology Encyclopedia. McGraw-Hill, Inc. pp. 603-606, 975-979, 1104-1106. 1974.
6. Chemical Marketing Reporter.Chemical Profile: Orthoxylene. August 3, 1992.
7. Mannsville Chemical Products Corp.Chemical Products Synopsis, P-Xylene. AshburyPark, NJ. May 1992.
8. Chemical Marketing Reporter.Chemical Profile: Paraxylene. July 20, 1992.
9. Mannsville Chemical Products Corp.Chemical Products Synopsis, O-Xylene. AshburyPark, NJ. February 1990.
10. U.S. Environmental Protection Agency.Toxic Air Pollution Emission Factors - ACompilation for Selected Air Toxic Compounds and Sources. EPA-450/2-88-006a.Research Triangle Park, NC. October 1988.
11. U.S. Environmental Protection Agency.Estimating Air Toxics Emissions from OrganicLiquid Storage Tanks. EPA-450/4-88-004. Office of Air Quality Planning and Standards,Research Triangle Park, NC. October 1988.
12. U.S. Environmental Protection Agency,Protocols for Generating Unit-Specific EmissionEstimates for Equipment Leaks of VOC and VHAP, EPA-450/3-88-010. Office of AirQuality Planning and Standards. Research Triangle Park, NC. 1988.
13. U.S. Environmental Protection Agency,Fugitive Emission Sources of OrganicCompounds--Additional Information on Emissions, Emission Reductions, and Costs.EPA-450/3-82-010. Research Triangle Park, NC. April 1982.
4-34
SECTION 5.0
EMISSIONS FROM MAJOR USES OF XYLENE
Xylene is used as a solvent and/or feedstock in the manufacture of many products. This
section discusses the emissions of xylene from processes that use xylene as a feedstock in the
manufacture of another product or as a solvent. Emissions of xylene as a residual component
of a product containing xylene are discussed separately in Section 6.0. Emissions of xylene from
coal combustion, hazardous and solid waste incineration, and wastewater treatment processes are
discussed in Section 7.0.
5.1 PHTHALIC ANHYDRIDE PRODUCTION
Phthalic anhydride (PA), C8H4O3, is produced by the oxidation of o-xylene, naphthalene,
or mixtures of both feedstocks, in the presence of catalysts. Ortho-xylene is the dominant
feedstock used in PA production. In 1990, there were four known active producers of phthalic
anhydride in the United States using o-xylene as a feedstock.1 Table 5-1 lists U.S. phthalic
anhydride producers and 1990 capacities.
Phthalic anhydride is commercially available as white, free-flowing flakes or colorless
molten material, the latter of which comprises 90 percent of the PA shipped. PA is used in the
manufacture of a variety of products including plasticizers, unsaturated polyester resins, alkyd
resins, polyols, phthalocyanine pigments, dyes, perfumes, pharmaceuticals and chemical
intermediates. The largest end use of phthalate plasticizers is in compounding flexible polyvinyl
chloride.1 Other end uses for phthalate plasticizers include some nitrocellulose lacquers and some
adhesives.2 The unsaturated polyester resins are used to produce a number of fabricated
fiberglass-reinforced plastics including construction materials, boats and molded automobile body
panels.1
5-1

PA is also used extensively in the manufacture of paint resins. Alkyd resins use for
TABLE 5-1.PHTHALIC ANHYDRIDE PRODUCERS USING
O-XYLENE AS A FEEDSTOCK
1990 Capacitya
Millions of Kilograms(Millions of Pounds)Producer Location
Aristech (Mitsubishi) Pasadena, TX 95.3 (210)
Exxon Chemical Baton Rouge, LA 113.4 (250)
Stepan Chemical Millsdale, IL 77.1 (170)
Sterling Chemical Company Texas City, TX 79.4 (175)
Total Capacity 365.2 (805)aExcludes the 79.4 million kilograms per year produced at the BASF plant in SouthKearney, NJ, which closed in October of 1990.
Source: Reference 1.
protective coatings has decreased in the paint vehicle market. However, alkyd resins still
comprise a significant portion of the resin used in the United States. Small miscellaneous
applications for PA include halogenated anhydrides used as fire retardants, polyester polyols for
urethanes, dialkyl phthalate, and phenolphthalein.1 Table 5-2 presents the 1990 estimate of the
end use pattern of PA.
In 1988, the total phthalic anhydride production in the United States was approximately
476 million kilograms (1,049 million pounds) per year. At a conversion rate of 0.93 kg of
o-xylene per kilogram of phthalic anhydride produced, approximately 443 million kilograms
(977 million pounds) of o-xylene were used in 1988 for production of phthalic anhydride.
Table 5-2 estimates are based on the unit capacities in Table 5-1. The 1988 use of o-xylene for
production of phthalic anhydride is higher than the capacity listed in Table 5-1 because the 1988
5-2

production figures include BASF’s South Kearney, NJ, phthalic anhydride plant, which closed
TABLE 5-2.PHTHALIC ANHYDRIDE END USE PATTERN - 1990
ESTIMATE
Approximate o-Xylene use
Derivative PercentMillions ofKilograms
(Millions ofPounds)
Phthalate Plasticizers 53 180 (397)
Unsaturated Polyesters 24 82 (180)
Alkyd Resins 16 54 (120)
Miscellaneous 7 24 (52)
Source: Reference 1.
in October 1990 and had a capacity of 79.4 million kilograms per year. The 1990 projected use
of o-xylene for phthalic anhydride production is estimated to be 340 million kilograms
(749 million pounds). In addition to the closing of the BASF plant, U.S. demand for PA has
leveled off in 1988-1989. Demand and production are not expected to increase until the economy
improves.1
5.1.1 Process Description
Figure 5-1 shows the process flow diagram for phthalic anhydride production using o-
xylene as the basic feedstock. Filtered air is preheated, compressed, mixed with vaporized o-
xylene and fed into the fixed-bed tubular reactors (Step 1). The reactors contain vanadium
pentoxide as the catalyst and are operated at 340°C to 385°C (644° to 725°F). In order to
maintain catalyst activity, small amounts of sulfur dioxide are added to the reactor feed.
Exothermic heat is removed by a molten salt bath circulated around the reactor tubes and
5-3


produce PA (Step 4). The liquid then flows to the vacuum distillation column where the
remaining water and impurities are removed (Step 5). In the final step, the pure product is
pumped to molten storage (Step 6). The chemical reaction for air oxidation of o-xylene is as
follows:3
5.1.2 Emissions3
The major source of xylene emissions from the PA production process is the reactor and
condenser effluent labeled as A in Figure 5-1. This combined effluent is vented from the
condenser unit.
Pretreatment and distillation emissions (particulates and hydrocarbons including xylene)
are usually processed through the water scrubber and/or incinerator used for the main process
stream (reactor and condenser), or through the scrubbers alone. Small amounts of gaseous
emissions occur from product storage in the liquid phase. These gas streams can either be sent
to the main process vent gas control devices or first processed through sublimation boxes or
devices used to recover escaped PA.
5-5

The most efficient system of control (96 percent) is the combined usage of a water
scrubber and thermal incinerator. A thermal incinerator alone is approximately 95 percent
efficient in the combustion of organic pollutants for o-xylene-based production. Table 5-3 gives
xylene emission factors for process, fugitive, and storage tank emissions from the production of
phthalic anhydride. Several emission factors are available for estimation of storage emissions
of xylene. Two of the factors listed in Table 5-3 were based on test data for controlled and
uncontrolled storage tank emissions. The third emission factor for storage emissions was based
on engineering estimates and is therefore less reliable. The discussion in Section 4.3.3 on
fugitive emissions should be referred to for more detail.
TABLE 5-3.MIXED XYLENE AND ORTHO-XYLENE EMISSION FACTORS
FOR PHTHALIC ANHYDRIDE PRODUCTION
Emission SourceEmission Factor g/kg PA produced
(lb/lb PA produced) Emission Factor Gradea
Storage tanks 0.002 (2.0 x E-6)b D
Storage tanks 0.20 (2.0 x E-4)c D
Storage tanks 0.02 (2.0 x E-5) Ud
Fugitive 0.04 (4.0 x E-5) Ud
Process 0.14 (1.4 x E-4) Ud
aBased onAP-42criteria selection described in Section 2.0 of this document.bBased on test data, controlled.cBased on test data, uncontrolled.dBased on engineering estimates for o-xylene emissions.
Source: Reference 4.
5-6
5.2 TEREPHTHALIC ACID PRODUCTION
Terephthalic acid (TPA) is an aromatic acid produced from p-xylene. TPA is a reactive
compound and undergoes reactions characteristic of aromatic dicarboxylic acids. TPA production
is the major end-use of p-xylene. Approximately 0.71 pounds of p-xylene are required to
produce 1 pound of TPA. TPA is produced as either the free acid or further processed to form
the intermediate dimethyl terephthalate (DMT). Approximately 0.61 pounds of p-xylene are
required to produce 1 pound of DMT. For the purpose of simplifying this discussion, all capacity
and production will be expressed in terms of TPA. Any production or capacity discussed here
in terms of DMT can be converted to TPA by dividing the figure for DMT by 1.16.5
In 1988, the United States’ production of TPA/DMT reached a high of 3,606 millions of
kilograms per year (7,950 millions of pounds per year). The corresponding p-xylene consumed
as a feedstock for TPA/DMT production was 2,249 millions of kilograms (4,959 millions of
pounds). Terephthalic acid production has declined since 1988 (thus reducing p-xylene demand)
due to a decline in the export demand for TPA/DMT and the slower domestic economy. The
export demand for TPA/DMT is expected to continue to decline for the next several years
because new plants are being built outside the United States. If the U.S. demand for TPA/DMT
does not increase to offset the reduced export demand, the use of p-xylene in producing
TPA/DMT will decline further. Despite the decreasing demand for TPA, Amoco expanded
domestic production in 1990, as reflected in Table 5-4. Any further expansions are expected to
be modest due to the anticipated decline in export demand.5 Table 5-4 lists known U.S.
terephthalic acid producers and 1992 capacities.
TPA/DMT is used primarily in the polyester fibers industry. The consumption of
TPA/DMT in polyester fiber production is approximately 60-65 percent of the total TPA/DMT
production. TPA/DMT is also used in the production of polyethylene terephthate resins, which
are a raw material for polyethylene terephthalate (PET) plastic bottle molding, and plastic tape
and film production. An 8 to 10 percent annual increase is expected in the demand for PA in
PET bottle resins, but the demand for domestic polyester fiber is expected to decline due to the
5-7
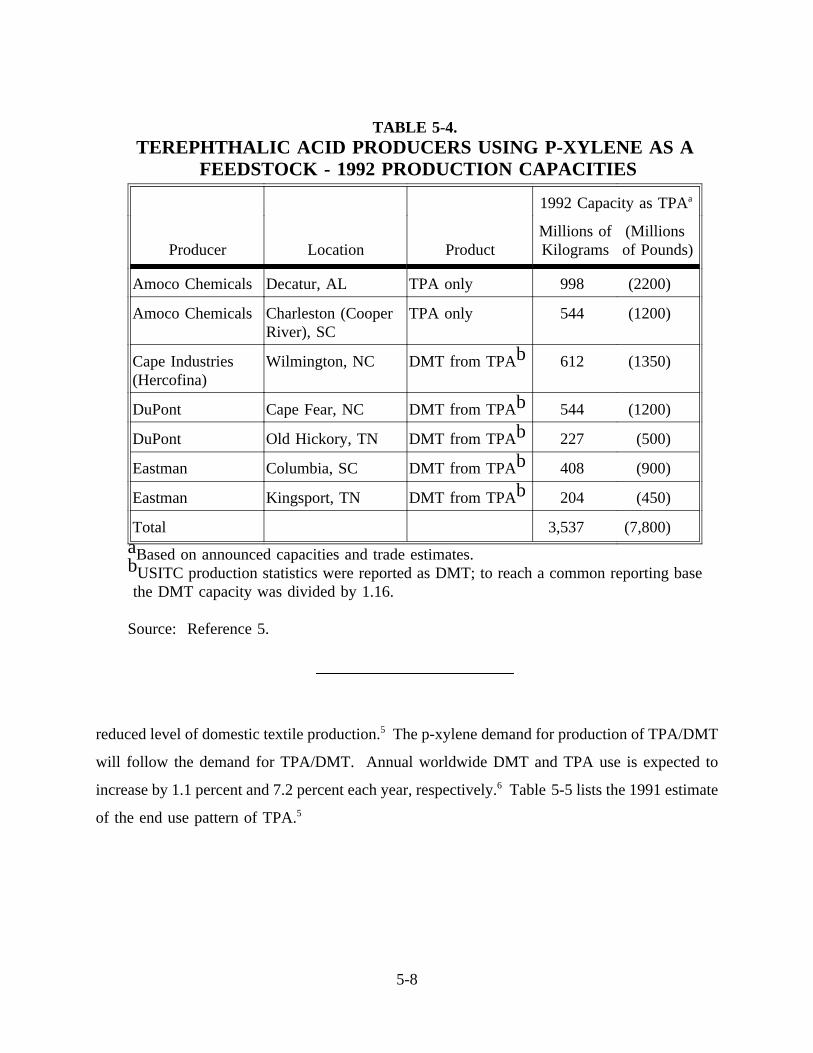
reduced level of domestic textile production.5 The p-xylene demand for production of TPA/DMT
TABLE 5-4.TEREPHTHALIC ACID PRODUCERS USING P-XYLENE AS A
FEEDSTOCK - 1992 PRODUCTION CAPACITIES
1992 Capacity as TPAa
Producer Location ProductMillions ofKilograms
(Millionsof Pounds)
Amoco Chemicals Decatur, AL TPA only 998 (2200)
Amoco Chemicals Charleston (CooperRiver), SC
TPA only 544 (1200)
Cape Industries(Hercofina)
Wilmington, NC DMT from TPAb 612 (1350)
DuPont Cape Fear, NC DMT from TPAb 544 (1200)
DuPont Old Hickory, TN DMT from TPAb 227 (500)
Eastman Columbia, SC DMT from TPAb 408 (900)
Eastman Kingsport, TN DMT from TPAb 204 (450)
Total 3,537 (7,800)aBased on announced capacities and trade estimates.bUSITC production statistics were reported as DMT; to reach a common reporting basethe DMT capacity was divided by 1.16.
Source: Reference 5.
will follow the demand for TPA/DMT. Annual worldwide DMT and TPA use is expected to
increase by 1.1 percent and 7.2 percent each year, respectively.6 Table 5-5 lists the 1991 estimate
of the end use pattern of TPA.5
5-8

5.2.1 Process Description
TABLE 5-5.TEREPHTHALIC ACID END USE PATTERN -
1991 ESTIMATE
Approximate p-Xylene use
Derivative Percent Millions ofKilograms
(Millions ofPounds)
Polyester Fibers 61 1,532 (3,378)
PET Bottles and Plastics 22 552 (1,218)
PET Tape and Films 13 327 (720)
Miscellaneous (includesengineering resins)
4 101 (222)
Source: Reference 5.
There are a variety of processes for producing both TPA and DMT. Different processes
are used to produce technical and polymer grades of TPA and DMT. This discussion will
concentrate on the polymer grade production methods used in the United States. Polymer grade
TPA/DMT is required for a majority of the derivatives manufactured from TPA/DMT.
The Hercules/Dynamit Nobel Process, shown in Figure 5-2, is the most common method
for producing DMT. The p-xylene is oxidized by air to p-toluic acid, which is subsequently
esterified to methyl p-toluate. A second oxidation and subsequent esterification yields DMT.
The p-xylene, air and catalyst are fed continuously to the reactor, which is maintained at
140°C - 170°C (284°F - 338°F) and 400 kPa - 700 kPa (58 psi - 102 psi) (Step 1). Condensed
p-xylene is recycled back to the oxidation reactor. The exhaust from the oxidation reactor is fed
to the esterification reactor which operates at 200°C - 250°C (392°F - 482°F) and sufficient
5-9


pressure to maintain a liquid phase (Step 2). Methanol is added in the esterification reactor. The
products from the esterification reactor are separated by distillation and the methyl p-toluate is
recycled to the oxidation reactor (Step 3). The crude dimethyl terephthalate is purified through
crystallization (Step 4) and distillation (Step 5). The product may be used as polymer grade
DMT or can be hydrolyzed to produce polymer grade TPA. Hercofina produces TPA by
hydrolyzing DMT at 180°C - 250°C (356°F - 482°F) in an aqueous solution with a neutral salt
such as potassium chloride (Step 6). The hydrolyzation may also be accomplished without the
neutral salt at 260°C (500°F).4,7
Amoco produces polymer grade TPA based on the liquid phase oxidation of p-xylene in
the presence of a catalyst to produce crude terephthalic acid (C-TPA). A process diagram is
shown in Figure 5-3. Acetic acid and p-xylene are fed to a reactor with a cobalt acetate catalyst
(Step 1). The reactor is fed with compressed air to supply oxygen for the reaction. Reactor
pressure and temperature are maintained at 1,500 kPa - 3,000 kPa (220 psi - 435 psi) and
175°C - 230°C (347°F - 446°F) respectively. Products from the reactor are pumped to a
centrifuge to separate the C-TPA (Step 2). The C-TPA produced is purified using the Amoco
purification process. This process consists of processing an aqueous slurry of the C-TPA through
a dissolver which operates at greater than or equal to 250°C (482°F) (Step 3). The solution from
the dissolver is pumped to a hydrogenation reactor which contains a noble metal catalyst (Step 4).
Hydrogen is fed to the reactor and impurities, such as 4-formylbenzoic acid, are converted to
soluble compounds which remain in the mother liquor during the recrystallization process for the
polymer grade TPA (Step 5).4,7
5.2.2 Emissions3
The atmospheric emissions from the production of C-TPA are difficult to characterize due
to the variety of processes involved. Emissions vary extensively, both qualitatively and
quantitatively.
5-11
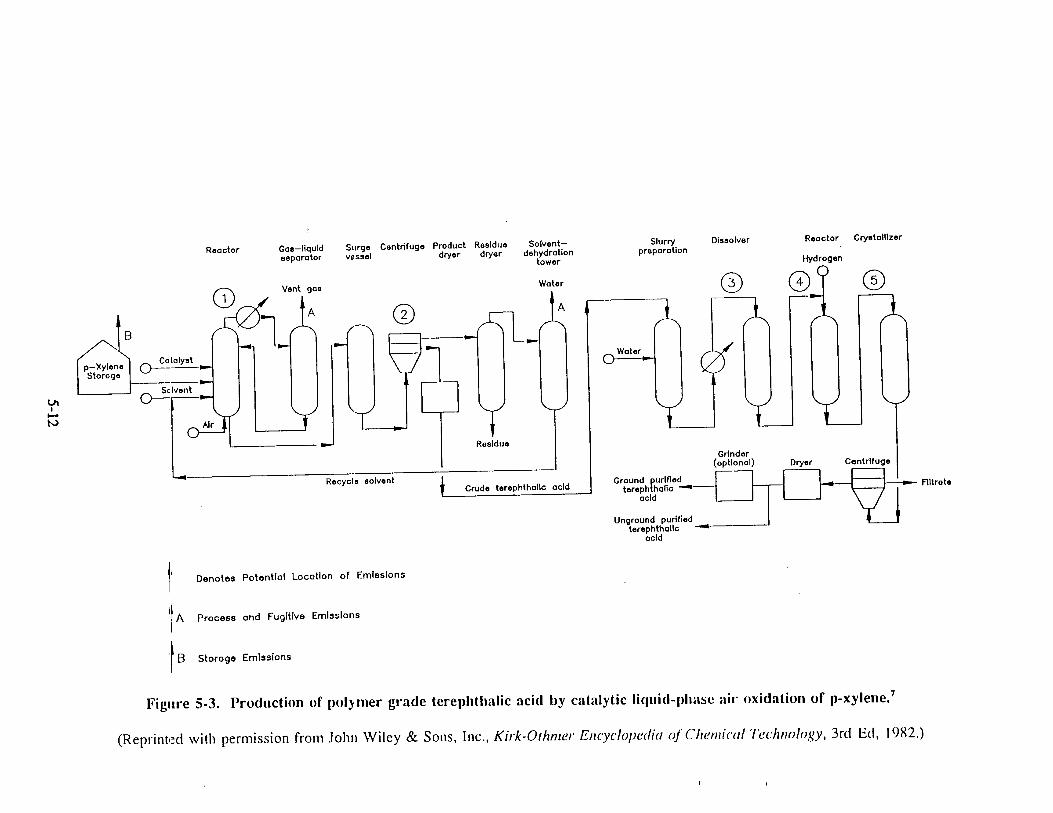
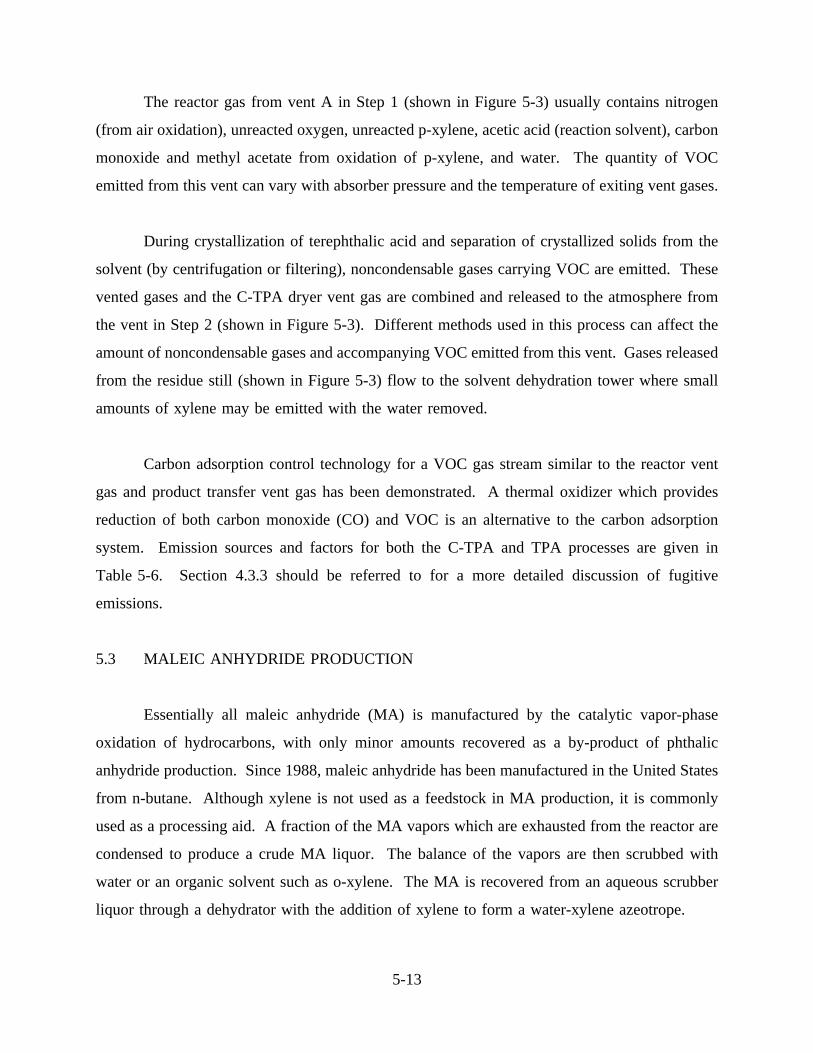
The reactor gas from vent A in Step 1 (shown in Figure 5-3) usually contains nitrogen
(from air oxidation), unreacted oxygen, unreacted p-xylene, acetic acid (reaction solvent), carbon
monoxide and methyl acetate from oxidation of p-xylene, and water. The quantity of VOC
emitted from this vent can vary with absorber pressure and the temperature of exiting vent gases.
During crystallization of terephthalic acid and separation of crystallized solids from the
solvent (by centrifugation or filtering), noncondensable gases carrying VOC are emitted. These
vented gases and the C-TPA dryer vent gas are combined and released to the atmosphere from
the vent in Step 2 (shown in Figure 5-3). Different methods used in this process can affect the
amount of noncondensable gases and accompanying VOC emitted from this vent. Gases released
from the residue still (shown in Figure 5-3) flow to the solvent dehydration tower where small
amounts of xylene may be emitted with the water removed.
Carbon adsorption control technology for a VOC gas stream similar to the reactor vent
gas and product transfer vent gas has been demonstrated. A thermal oxidizer which provides
reduction of both carbon monoxide (CO) and VOC is an alternative to the carbon adsorption
system. Emission sources and factors for both the C-TPA and TPA processes are given in
Table 5-6. Section 4.3.3 should be referred to for a more detailed discussion of fugitive
emissions.
5.3 MALEIC ANHYDRIDE PRODUCTION
Essentially all maleic anhydride (MA) is manufactured by the catalytic vapor-phase
oxidation of hydrocarbons, with only minor amounts recovered as a by-product of phthalic
anhydride production. Since 1988, maleic anhydride has been manufactured in the United States
from n-butane. Although xylene is not used as a feedstock in MA production, it is commonly
used as a processing aid. A fraction of the MA vapors which are exhausted from the reactor are
condensed to produce a crude MA liquor. The balance of the vapors are then scrubbed with
water or an organic solvent such as o-xylene. The MA is recovered from an aqueous scrubber
liquor through a dehydrator with the addition of xylene to form a water-xylene azeotrope.
5-13

TABLE 5-6.MIXED XYLENES EMISSION FACTORS FOR TEREPHTHALIC
ACID AND CRUDE TEREPHTHALIC ACID PRODUCTION
Industrial Process Emission Source Emission Factor
EmissionFactorGradea
Terephthalic acidproduction
Storage 0.11 g xylene/kg(0.00011 lb xylene/lb) xylene usedb
D
Terephthalic acidproduction
Fugitive 0.07 g xylene/kg(0.00007 lb xylene/lb) xylene usedb
D
Terephthalic acidproduction
Process - general 2.54 g xylene/kg(0.00254 lb xylene/lb) xylene usedb
D
Crude terephthalicacid production byair oxidationprocess
p-Xylene storagetank vents
0.11 g xylene/kg(0.00011 lb xylene/lb) crudeterephthalic acid producedc
D
Crude terephthalicacid production byair oxidationprocess
Reactor vent(uncontrolled)d
6 g xylene/kg(0.006 lb xylene/lb) crude terephthalicacid produced
D
Crude terephthalicacid production byair oxidationprocess
Reactor vent(controlled)e
0.18 g xylene/kg(0.00018 lb xylene/lb) crudeterephthalic acid produced
D
aBased on AP-42 criteria selection described in Section 2.0 of this document.bBased on site visit data.cUncontrolled, filling emissions only, hypothetical plant operating 8760 h/yr with 230 Gg/yr capacity.dUncontrolled, based on hypothetical plant operating 8760 h/yr with 230 Gg/yr capacity.eCarbon adsorption control (97 percent emission reduction), hypothetical plant operating 8760 hr/yr with230 Gg/yr capacity.
Source: Reference 4.
Distillation is used to recover MA from an organic solvent scrubber liquor.8 Table 5-7 lists the
major U.S. maleic anhydride producers and their locations.
5-14
Based on available information, the consumption of o-xylene as a processing aid for MA
TABLE 5-7.MALEIC ANHYDRIDE PRODUCERS USING O-XYLENE
AS A PROCESSING AID
Producer Location
Amoco Joliet, IL
Aristech Neville Island, PA
Ashland Chemical Neal, WV
Mobay Synthetics Corporation Houston, TX
Monsanto Pensacola, FL
Source: Reference 9.
is a maximum of 3 million kilograms (6.6 million pounds) assuming that all o-xylene not used
in phthalic anhydride production is used for the production of MA. Because much of the o-
xylene used is recycled in the process, the quantity of o-xylene used in the production of MA is
not drastically affected by production increases.
5.3.1 Process Description3,7
Maleic anhydride is produced from n-butane in a reactor by oxidation. Figure 5-4
illustrates the process. The n-butane and compressed air are fed to the reactor, which is
commonly filled with a phosphorus-vanadium-oxygen catalyst (Step 1). Products from this vapor
phase reaction are exhausted to a condenser where a fraction of the MA is recovered as a molten
liquid (Step 2). Liquid MA is pumped to further processing and storage. The MA and water
vapors not condensed are scrubbed in the product recovery absorber (Step 3). The liquid used
to absorb the product may be o-xylene or water. MA product recovered through absorption with
o-xylene is separated by distillation. MA product recovered using water is sent to a dehydrator
5-15


where o-xylene is added and the water and o-xylene are removed through an azeotropic
distillation process (Step 4). The o-xylene is subsequently purified and reused in the process
(Step 5). The product MA is then sent to storage.
5.3.2 Emissions
Fugitive emissions of xylene, n-butane, MA, and maleic acid arise from the storage and
handling of n-butane, xylene, and MA. Xylene emissions from processes used to manufacture
maleic anhydride may occur from the scrubber, the dehydrator, o-xylene distillation or o-xylene
storage tanks.3 Figure 5-4 indicates these potential emission points as letters "A" through "D".
Xylene emission sources and factors are shown in Table 5-8. Section 4.3.3 should be referred
to for a more detailed discussion of fugitive emissions.
TABLE 5-8.MIXED XYLENES EMISSION FACTORS FOR MALEIC
ANHYDRIDE PRODUCTION
Emission Source Emission FactorEmission Factor
Gradea
Process Emissions 11.6 g xylene/kg product)(0.0116 lb xylene/lb product)
E
Storage Emissions 0.075 g xylene/kg product(0.000075 lb xylene/lb product)
E
Fugitive Emissions 0.4 g xylene/kg product(0.0004 lb xylene/lb product)
E
aBased onAP-42criteria selection described in Section 2.0 of this document.
Source: Reference 4.
5-17

5.4 PAINT AND INK MANUFACTURING
Paints are made by blending pigments, solvents, resins (or binders), oils (for some inks),
and other additives. The fluid component of the paint or ink, made of binders (oils and/or resins)
and solvents, is called the vehicle. Vehicles transfer the pigment/binder mixture to the substrate
surface in a thin, uniform film and play no role in film formation. When a paint is deposited on
a substrate, the vehicle solvent(s) should evaporate completely. Xylene is only one of the vehicle
solvents used by paint manufacturers.10 Paints and coatings account for about 65-70 percent of
mixed xylenes consumption as solvents. Like toluene, the use of xylene in paints and coatings
has been increasing since 1987, largely due to increasing consumption in short-oil and medium-
oil-length alkyds. The manufacturing processes for both paints and inks are very similar,
therefore this section will concentrate on paint production.
The long-term use of xylene in the coating industry is expected to gradually decrease.
Table 5-9 lists estimates of the quantity of xylene used as solvents. Table 5-10 shows estimated
consumption of xylene derivatives in paints and coatings in 1988.11 Figure 5-5 illustrates xylene
use in the paint and coatings industry. Total use of xylene and xylene derivatives (e.g., DMT,
PA, Isophthalic Acid) in paint production accounts for 10 percent of the total annual xylene
consumption in the United States.
5.4.1 Process Description
Paint and ink facilities use similar manufacturing processes to produce their respective
products in batch scale production fashion. Most plants purchase raw materials (e.g., pigments,
solvents, resins, and other additives) and then formulate, or blend, a finished product. Normally,
no chemical reactions take place during the process. Batch process production of paint and ink
involves four major steps:10
• Preassembly and premix
• Pigment grinding/milling
5-18
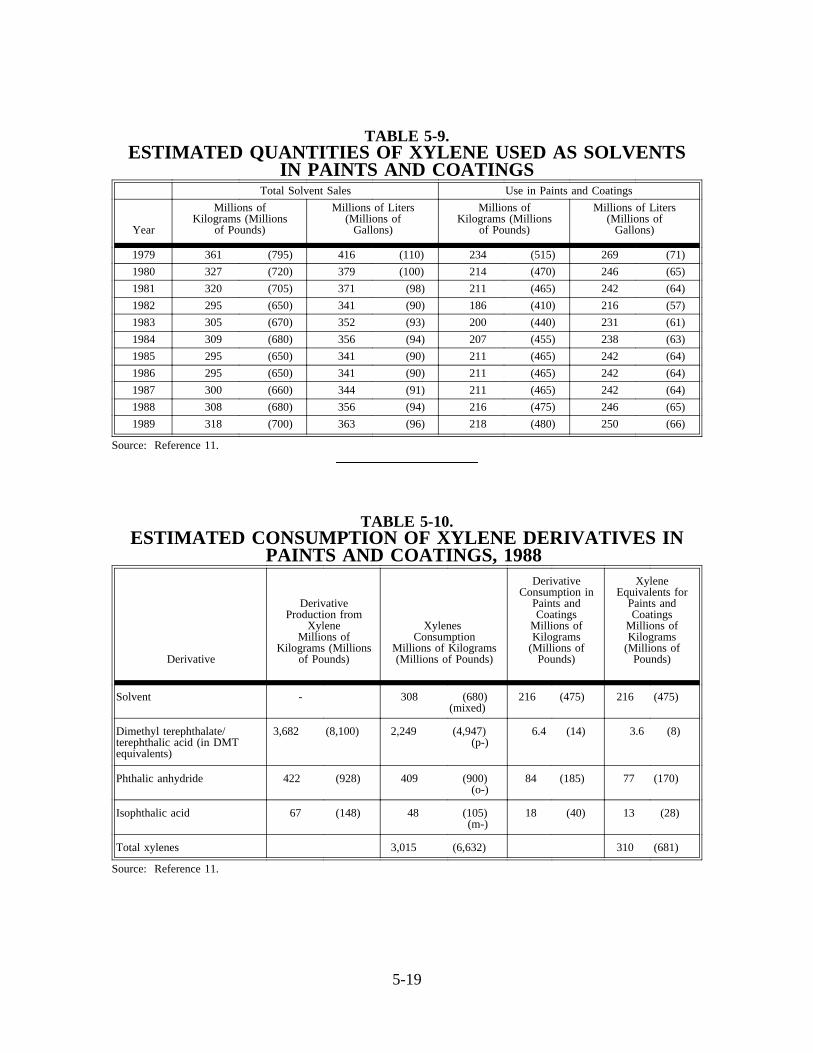
TABLE 5-9.ESTIMATED QUANTITIES OF XYLENE USED AS SOLVENTS
IN PAINTS AND COATINGSTotal Solvent Sales Use in Paints and Coatings
Year
Millions ofKilograms (Millions
of Pounds)
Millions of Liters(Millions of
Gallons)
Millions ofKilograms (Millions
of Pounds)
Millions of Liters(Millions of
Gallons)
1979 361 (795) 416 (110) 234 (515) 269 (71)
1980 327 (720) 379 (100) 214 (470) 246 (65)
1981 320 (705) 371 (98) 211 (465) 242 (64)
1982 295 (650) 341 (90) 186 (410) 216 (57)
1983 305 (670) 352 (93) 200 (440) 231 (61)
1984 309 (680) 356 (94) 207 (455) 238 (63)
1985 295 (650) 341 (90) 211 (465) 242 (64)
1986 295 (650) 341 (90) 211 (465) 242 (64)
1987 300 (660) 344 (91) 211 (465) 242 (64)
1988 308 (680) 356 (94) 216 (475) 246 (65)
1989 318 (700) 363 (96) 218 (480) 250 (66)
Source: Reference 11.
TABLE 5-10.ESTIMATED CONSUMPTION OF XYLENE DERIVATIVES IN
PAINTS AND COATINGS, 1988
Derivative
DerivativeProduction from
XyleneMillions of
Kilograms (Millionsof Pounds)
XylenesConsumption
Millions of Kilograms(Millions of Pounds)
DerivativeConsumption in
Paints andCoatings
Millions ofKilograms
(Millions ofPounds)
XyleneEquivalents for
Paints andCoatings
Millions ofKilograms
(Millions ofPounds)
Solvent - 308 (680)(mixed)
216 (475) 216 (475)
Dimethyl terephthalate/terephthalic acid (in DMTequivalents)
3,682 (8,100) 2,249 (4,947)(p-)
6.4 (14) 3.6 (8)
Phthalic anhydride 422 (928) 409 (900)(o-)
84 (185) 77 (170)
Isophthalic acid 67 (148) 48 (105)(m-)
18 (40) 13 (28)
Total xylenes 3,015 (6,632) 310 (681)
Source: Reference 11.
5-19


• Product finishing/blending
• Product filling/packaging
Some large scale paint manufacturing facilities produce resins on-site as part of their paint
manufacturing processes. The resins are often produced in reactors at atmospheric pressure with
process temperatures between 70°C to 120°C (158°F to 248°F). Xylene, or solvents containing
xylene, are used to dissolve the reactants and promote heat transfer for the reaction. The resin
products are then tinted and thinned to finished product specifications.10
The manufacturing process is summarized in Figure 5-6.10 The first step in the
manufacturing process is preassembly and premix. In this step, the liquid raw materials (e.g.,
resins, solvents, oils, alcohols, and/or water) are "assembled" and mixed in containers to form
a viscous material to which pigments are added. The premix stage results in the formation of
an intermediate product which is referred to as the base or mill base. With further processing,
this base with high pigment concentration may become any one of a variety of specific end
products.10
The incorporation of the pigment into the paint or ink vehicle to yield a fine particle
dispersion is referred to as pigment grinding or milling. The goal of pigment grinding is to
achieve fine, uniformly-ground, smooth, round pigment particles which are permanently separated
from other pigment particles. The degree to which this is realized determines the coating
effectiveness and permanency of the paint or ink. Some of the more commonly used types of
dispersion (milling) equipment are roller mills, ball and pebble mills, attritors, sand mills, bead
and shot mills, high-speed stone and colloid mills, high-speed disk dispersers, impingement mills,
and horizontal media mills.10
Final product specifications are achieved in the product finishing step, which consists of
three intermediate stages: thinning, tinting and blending. Material letdown, or thinning, is the
process by which a completed mill base dispersion is let down or reduced with solvent and/or
binder to give a coating which is designed to provide a durable, serviceable film that is easily
5-21


applied to the substrate. Tinting is the process of adjusting the color of completed mill base
dispersions. Various combinations of pigments, solvents, resins, and pastes are added to the
material to meet the color requirements. Blending is the process of incorporating the additions
into the material in order to meet the desired product specifications.10
5.4.2 Emissions
The primary factors affecting the emission of xylene during paint manufacture are the
types of solvents and resins used in the manufacturing process, the temperature at which these
compounds are mixed, the degree of coverage (if any) on the manufacturing equipment, and the
methods and materials used during cleanup operations.10
Xylene is released from several types of equipment and handling operations throughout
the paint and ink manufacturing processes and during cleanup operations. During the
preassembly and premix stage, emissions may come from equipment such as mix tanks or drums
while resins are being thinned and materials are being added. Xylene emissions also occur
during the pigment grinding step when materials are added to the dispersion equipment. The
emissions that occur during the product finishing step are mainly a result of material additions
during the thinning and tinting stages. Xylene emissions from product filling operations occur
during material transfer and free-fall into the receiving container. Another emission source is
product filtering. As product flows through a filtering device, it is often exposed to the air,
resulting in releases of the incorporated xylene. Fugitive emissions also result from flanges,
valves, and pumps used to transfer material from equipment for one manufacturing stage to
equipment for the next stage.10
Emissions occurring during the manufacturing stages may be reduced by using equipment
and process modifications such as tank lids or closed-system milling equipment. In addition to
emissions from process operations, xylene is also released from a variety of cleaning operations
following the manufacture of solvent based products. In many facilities, manufacturing
equipment is cleaned manually (with solvents, brushes, and /or rags) on the production floor on
5-23

an as-needed basis. The standard method of cleaning grinding equipment involves emptying the
mill of product and then adding solvent to the vessel to capture remaining product residue.
Emissions occur during cleaning solvent addition and removal as well as during the cleaning
process. Emissions from cleaning equipment may be reduced by using rubber wipers, high-
pressure spray heads, or automatic tub washers.10
There is little emission factor information available for the manufacture of paints. Figures
range from process solvent losses of one to two percent under well controlled conditions to much
higher percentages. The process solvent losses vary significantly from facility to facility and
therefore those emissions should be evaluated on a case-by-case basis. Many paint manufacturing
facilities calculate total plant VOC emissions based on raw material consumption and \final
products produced rather than calculating emissions from processes or equipment by an
alternative method. Total emissions, therefore, reflect solvent losses during manufacturing,
cleaning operations, storage and packaging.10
5-24

5.5 REFERENCES FOR SECTION 5.0
1. Mannsville Chemical Products Corp.,Chemical Products Synopsis, Phthalic Anhydride,Asbury Park, NJ. October 1990.
2. Hancock, E.G., ed.,Toluene, the Xylenes and their Industrial Derivatives. ElsevierScientific Publishing Company. New York, NY. 1982.
3. U.S. Environmental Protection Agency,Compilation of Air Pollution Emission Factors,AP-42, Fourth Edition with Supplements, Office of Air Quality Planning and Standards.Research Triangle Park, NC. September 1985.
4. U.S. Environmental Protection Agency,Toxic Air Pollution Emission Factors, ACompilation for Selected Air Toxic Compounds and Sources, EPA-450/2-88-006a, Officeof Air Quality Planning and Standards, Research Triangle Park, NC. October 1988.
5. Mannsville Chemical Products Corp.,Chemical Products Synopsis, Terephthalic Acid,Asbury Park, NJ. June 1992.
6. Richards, D., Chemical Profile, in the Chemical Marketing Reporter. "Xylenes,Terephthalates Outlook," July 20, 1992.
7. John Wiley & Sons, Inc.,Kirk-Othmer Encyclopedia of Chemical Technology, 3rd Ed,1982.
8. SRI International,Maleic Anhydride, Supplement C. A Private Report by the ProcessEconomics Program. Menlo Park, CA. October 1989.
9. Mannsville Chemical Products Corp.,Chemical Products Synopsis, Maleic Anhydride,Asbury Park, NJ. September 1990.
10. U.S. Environmental Protection Agency,Control of VOC Emissions from Ink and PaintManufacturing Processes, EPA-450/3-92-013, Office of Air Quality Planning andStandards. Research Triangle Park, NC. 1991.
11. SRI International,U.S. Paint Industry Database. Prepared for the National Paint andCoatings Association, Inc., Washington, DC. September 1990.
5-25

SECTION 6.0
EMISSIONS FROM THE USE OF XYLENE-CONTAINING MATERIALS
As discussed in Section 3.0, xylene is present in many materials, including paints and
coatings, inks, adhesives, resins, pharmaceuticals, gasoline and other formulated products. This
section examines residual emissions from the use of xylene-containing materials. Xylene may
be emitted when xylene-containing products such as paint, ink and gasoline release small amounts
over time. Such releases are described in this section as residual emissions.
The production descriptions and emissions data presented in this section represent the
most common and relevant processes and products. Because of xylene’s widespread use, all
processes cannot be included in this document.
6.1 SURFACE COATING OPERATIONS
Surface coating operations involve the application of paint, varnish, lacquer or primer for
decorative, functional, or protective purposes. In 1989, 318 million kilograms (700 million
pounds) of xylene were consumed in paints and coatings.1 Appendix C contains a listing of some
of the surface coating source categories in which xylene is used. Appendix C also indicates
associated SICs, potential xylene emission points, and emissions reduction opportunities.
References are provided for additional information.
The general application methods for surface coating operations are discussed in this
section. Because surface coating is a very broad category, detailed process descriptions and
process flow diagrams for each category are not included in this document; however, the reader
is encouraged to review the references mentioned at the end of this section and in Appendix C.
6-1

6.1.1 Process Description
Industrial surface coating operations use several different methods to apply coatings to
substrates. Some of the more commonly used techniques include spraying, dipping, rolling, flow
coating, knife coating, and brushing. In addition to the application of coatings to substrates,
many surface coating operations also include surface preparation steps (e.g., cleaning and
degreasing), and drying and curing stages. Spraying operations are normally performed in a
spray booth using one of the following spray application methods: air atomization; airless
atomization; air-assisted airless; high-volume, low-pressure (HVLP); and electrostatic methods.
Dip coating involves briefly immersing the substrate in a tank containing a bath of paint. The
object is slowly removed from the tank allowing excess paint to drain back into the tank. Roller
coating is used to apply coatings and inks to flat surfaces. A typical roller coating machine
contains three or more power driven rollers, one of which is partially immersed in the coating
material. The paint is transferred to a second, parallel roller by direct contact. The sheet to be
coated is run between the second and third rollers, and is coated by transfer of paint from the
second roller. Flow coating is used on articles which cannot be dipped due to their buoyancy,
such as fuel oil tanks, gas cylinders, or pressure bottles. In this operation, the coating material
is fed through overhead nozzles, distributing the paint in a steady stream over the article to be
coated. Excess paint is allowed to drain from the coated object and is then recycled. Knife
coating is used primarily to coat paper or fabric webs. The adjustable blade or "knife" distributes
a liquid coating evenly over a moving surface.
6.1.2 Emissions
Figure 6-1 is a generic schematic flow diagram of a surface coating operation. Process
operations, auxiliary facilities, and emission points are illustrated. Note that this is a generic
figure and may differ significantly from any specific surface coating operation. The operations
shown include degreasing, surface coating, and drying and curing.2,3 Auxiliary facilities include
degreasing solvent storage, and surface coating storage and blending. Industrial categories,
specific operations and emission points resulting in expected xylene emissions from surface
coating operations are presented in Appendices A and C.
6-2
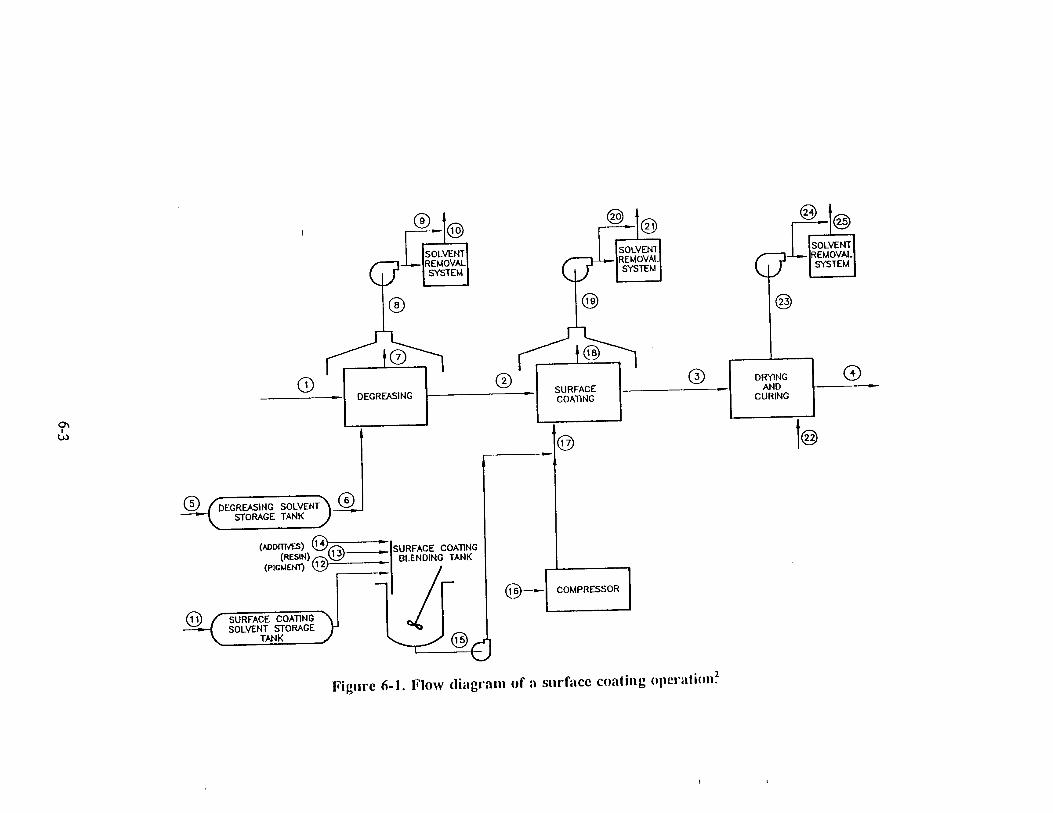

Streams 1, 2, 3, and 4 depict the flow of products through the plant. Stream 1 represents
the input of uncoated products to the surface coating system. Stream 2 represents the flow of
degreased or scoured products to the surface coating operation. The type of surface coating
operation used will depend upon the product-type coated, coating requirements, and the method
of application. Stream 3 represents the product flow to the drying and curing operation. Stream
4 represents the flow of coated finished products from the surface coating section of a
manufacturing plant.
Streams 5 through 10 represent the flow of degreasing solvent through the surface coating
section of a manufacturing plant. Streams 5 and 6 depict the flow of solvent into the plant and
to the degreasing unit. Streams 7 and 8 represent the flow of solvent vapors from the degreasing
unit through the fume handling system. Uncontrolled and controlled emissions are represented
by streams 9 and 10, respectively.
Streams 11 through 21 represent the flow of surface coating raw materials through the
plant. Streams 11, 12, 13, and 14 represent the flow of solvent, pigment, resin, and additives to
the surface coating blending tank. Stream 15 is the flow of coating to the surface coating unit.
For those operations that use spray painting, stream 16 is the flow of compressed air. Streams
18 and 19 represent the flow of solvent and resin from the surface coating unit through the fume
handling equipment. Uncontrolled and controlled emissions are depicted by streams 20 and 21.
Potential release sources are identified in Appendix C.
In Figure 6-1, streams 22 through 25 represent the flow of gases (e.g., fuel, steam or
electrically heated air) to the drying and curing operation. Drying and curing operations occur
in flash-off areas and curing ovens. Flash-off areas are the places between application areas, or
between an application area and an oven, in which solvent is allowed to volatilize from the
coated piece. Ovens are used between some coating steps to cure the coating prior to the next
step in the finishing sequence. Streams 24 and 25 represent uncontrolled and controlled
emissions. No emission factor data were found in the literature.
6-4
Facilities with surface coating operations may purchase and apply ready-to-use coatings,
or they may dilute their purchased coatings to decrease the coating viscosity and improve
performance and ease of application. Xylene is used in solvent-based coating formulations either
as part of the coating vehicle or as a thinner. If a coating formulation is to be diluted in-house,
several factors (e.g., temperature, humidity, and type of coating) can determine the required
dilution ratio. Consequently, the amount of xylene used may vary.2,4-6 Emissions from the
mixing and blending of surface coatings are discussed in Section 5.4.2.
Xylene may also be used in clean-up operations. Clean-up solvent is used to clean
application equipment, piping, spray booths, coating storage and distribution equipment, and to
strip cured coatings from wood parts or machinery.1
One method of reducing xylene emissions from surface coating operations is to modify
the surface coating formulation. Conventional coatings normally contain at least 70 percent by
volume solvent (either one solvent or a mixture of solvents) to permit easy handling and
application. Minimizing or eliminating the use of these solvents in surface coating formulations
is the most effective way to reduce VOC emissions. Alternatives to these conventional coatings
include water-based coatings, high-solids coatings, powder coatings, and radiation curable
coatings.2
Large surface coating facilities may use add-on control devices to capture and control
solvent emissions. Some commonly used capture devices include covers, vents, hoods, and
partial or total enclosures. Adsorbers, condensers and incinerators, which can achieve control
efficiencies of 95 to 98 percent, are the most common control devices used in surface coating
operations.2,4,5
6.2 PRINTING AND PUBLISHING
The printing and publishing industry encompasses publishing, commercial printing, and
trade services.7 The trade services group includes typesetting, photoengraving, electrotyping and
stereotyping, and platemaking services. The trade services group is not examined in this
6-5

document because data on solvent use and emissions from these services are not available. Ink
consumption in these groups has been apportioned to the four printing processes according to the
type of ink consumed (e.g., gravure ink consumption assigned to gravure printing). Process
descriptions, however, will only be provided for the commercial printing processes. Attention
is given to the gravure and flexographic processes as end uses of xylene. Xylene emissions from
off-set lithography processes have not been measured and are thought to be minimal. The reader
is encouraged to explore xylene consumption and emissions in all facilities reporting under the
SIC code 27 as solvent use is an inherent aspect of the operations in printing and publishing
facilities.
The publishing and printing groups are concentrated in four states: California, New York,
Pennsylvania, and Illinois. The majority of establishments are small facilities that employ
between 1 and 20 people.7,8 Appendix B, Table B-3 lists the companies in the printing and
publishing SIC codes grossing $1,000,000 or greater in annual sales.9
6.2.1 Process Description
The production of a printed product consists of five steps. First, the artwork and/or copy
(text) is developed. Next, a printing plate is made. The plate is then tested in the press
adjustment step. The actual printing of the product is the fourth step in the printing process, and
the main source of xylene emissions. The final step is cutting and finishing10
Printing ink composition will vary among printing methods and among jobs using the
same printing press and method. Printing inks can generally be described as heat-set or non-
heatset. Heatset inks require the application of heat to drive off the ink solvent and set the ink
to the substrate. Non-heatset inks dry by oxidation or adsorption to the substrate and do not
require heat. Other, less common, ink types include radiation and thermally cured inks. All
evaporative inks consist of three basic components: pigments, binders, and solvents.2 Printing
processes using heatset inks that dry through evaporation of the solvent are the major concern
for VOC (including xylene) emissions. Only the gravure and flexography printing processes are
6-6

described here due to the fact that specific emissions of xylene were not identified from the other
printing methods.
Gravure Printing Process Description--
The configuration of the image surface makes the gravure process unique. The printing
cylinder is etched or engraved, creating tiny cells which comprise the image surface. The depth
of each cell may vary and regulates the quantity of ink received by the substrate. The average
rotogravure press has eight printing units, each printing one color. The paper position, speed,
and tension through the printing unit is regulated by a series of rollers. A substrate dryer,
equipped with heated air jets to evaporate the solvent from the substrate and set the ink, is
located at the top of each printing unit. The dryer air is exhausted from the unit by a
recirculation fan. The fan directs a portion of the solvent laden air to a control device, such as
a carbon adsorption system. The remaining portion of the air flow is recirculated over a steam
heating coil and back through the dryer.11
Each printing unit has a self-contained inking system. The ink system consists of an ink
fountain, a circulation pump, and a mix tank. Solvent, and occasionally extenders or varnishes,
are added to the ink concentrate in the mix tank. Additional ink, solvent, varnishes, and
extenders are automatically added to the mix tank. The additions are monitored by level and
viscosity control devices.11
A low viscosity ink is required for the gravure printing process. Raw ink concentrate
generally contains 50 percent solvent by volume. A xylene-toluene-lactol spirit mixture (naphtha)
is commonly used as a solvent in printing inks. Lactol Spirit is a petroleum solvent component
of naphtha used in the mixture to hasten evaporation. Xylene is known to produce a higher
quality product than naphtha and dissolves the ink resins well, however, xylene is more expensive
than naphtha. The ink concentrate is diluted at press side with additional solvent at a volume
ratio of approximately 1:1. Since solvent is also added automatically to the inking system to
replace evaporative losses, the resultant ink mixture may contain as much as 80 percent solvent
by volume and 20 percent by volume ink and varnish solids.11
6-7
Flexographic Printing Process Description--
Flexographic printing is used to print flexible packaging, milk cartons, gift wraps, folding
cartons, paperboard, paper cups and plates, labels, tapes, and envelopes. The majority of
flexographic printing is done with a web-fed substrate.2
Solvent-based flexographic inks typically consist of alcohols, glycols, esters,
hydrocarbons, and ethers. These inks may contain as much as 75 percent solvent by volume.
Water-based and steam-set inks are also used in flexographic printing. Water-based inks contain
approximately 25 percent by volume solvents.12 About 15 percent of all flexographic inks used
are water-based.13 Steam-set inks use glycol solvents but do not contribute significantly to air
emissions because the glycols are essentially water-soluble, have low volatilities, and are stable
on the presses.14,15
6.2.2 Emissions
Gravure Printing Emission Points--
Emissions from the rotogravure press occur from the ink fountain, the press, the dryer,
and the chill rolls.2 The dryer vent is the most typical point of control. The other emission
sources are considered fugitive. Emissions are influenced by press and job variables, solvent
concentration in the ink, and solvent added as make-up during printing. Approximately 2.5 to
7 percent of the solvents used are retained in the printed product. The remaining solvents are
reclaimed for reuse, recycled, and sold back to suppliers, or lost as fugitive emissions.11,16,17
Typical ink formulations contain approximately 50 to 85 percent solvents by volume. Water
based inks, used in packaging and product printing, contain approximately 5 to 30 percent
solvents by volume and account for 30 to 40 percent of all inks used. Water-based inks account
for approximately 15 percent of all inks used in all gravure printing processes.13,18
Although specific emission estimates of xylene are not available, ink and solvent
consumption numbers have been published and are reported below. Additionally, VOC emission
factors and rates are available. A local survey may provide the needed information on the
percentage of xylene used relative to total solvent consumption. Xylene emissions may then be
6-8

estimated by multiplying the percentage of xylene by the ink consumption rate and solvent
content of the ink.
The Gravure Association of America (GAA) conducted a survey of their membership
which reported solvent purchased, reused, and recovered in the various segments of the industry
during 1987.19 Table 6-1 presents a summary of these statistics for publication, folding cartons,
flexible packaging, and product gravure printing. The GAA membership reported a total of
18,630 thousand metric tons (41.4 million pounds) of virgin solvent purchased; 110,800 thousand
metric tons (246.2 million pounds) of solvent recovered; and 80,685 thousand metric tons (179.3
million pounds) of solvent reused. More solvent is recovered than bought due to solvent
recovery from ink formulations. The portion of solvent that is recovered but not reused is sold
back to the manufacturers, lost as fugitive emissions, or destroyed by incineration.19
Carbon adsorption and incineration systems have traditionally been employed to control
TABLE 6-1.GRAVURE ASSOCIATION OF AMERICA INDUSTRY
SURVEY RESULTS
Millions of Kilograms (Millions of Pounds)
Reported ResultsProjected Gravure Industry
Estimates
Printing Process Solvents PurchasedSolvents
Recovered Solvents Reused
SolventsPurchased or
ReusedSolvents
Recovered
Publication Plants 1 (2.2) 101.3 (222.9) 73.8 (162.3) 182.3 (401) 247.1 (543.6)
Folding Cartons 2.9 (6.4) 0.7 (1.6) 0.7 (1.6) 22.2 (48.8) 4.4 (9.7)
Flexible Packaging 7.2 (15.9) 2.8 (6.2) 1.9 (4.1) 78.4 (172.5) 24.3 (53.4)
Product Gravure 7.7 (16.9) 7.0 (15.5) 5.1 (11.3) -- -- -- --
Source: Reference 19.
_______________
VOC emissions from the gravure printing process. The package printing sector has also achieved
significant VOC reduction through the use of water-based printing inks.
6-9

Rotogravure package printing plants may use water-based inks. The use of water-based
inks may contribute to an overall VOC reduction of 65 to 75 percent, if the solvent content of
the inks is maintained below 25 percent by volume.12
One recent study has demonstrated that capture and control systems have been
successfully applied to gravure printing presses that achieve greater than 90 percent overall VOC
control.20 The average VOC control efficiency at these facilities ranged from 94 to 99.5 percent.
The facilities included in the study used total enclosure capture systems and one of the following
add-on destruction devices:
• Catalytic Incineration
• Regenerative Incineration
• Thermal Incineration
• Carbon Adsorption
The EPA has developed and published standard criteria for the design and operation of permanent
total enclosure (PTE) systems. The PTE criteria have been published in the following sources:
• Guidelines for Developing a State Protocol for the Measurement of Capture Efficiency.
Environmental Protection Agency. Policy Statement. April 16, 1990.
• Polymeric Coating of Supporting Substrates - Background Information for Promulgated
Standards(EPA-450/3-85-022b)21
• Magnetic Tape Manufacturing Industry - Background Information for Promulgated
Standards(EPA-450/3-85-029b)22
Capture efficiency may be estimated at 100 percent if all the EPA PTE criteria are met.20
Flexographic Printing Emission Points--
Sources of emissions from flexographic printing operations are similar to the sources
encountered from gravure operations. Emission control strategies are also similar. Incineration
and carbon adsorption emission control techniques are available for use in the flexographic
printing process. However, it is often difficult to install effective hooding and ducting devices
on the presses. Therefore, overall control efficiencies are approximately only 60 percent.12
Alternative emission control techniques include the use of water-based inks and microwave
driers.14
6-10
Recent studies have indicated that flexographic printing presses controlled by catalytic and
regenerative incineration may achieve a 95 percent overall VOC reduction efficiency.13,23 A metal
oxide catalyst is used in catalytic incinerators used on flexographic printing presses to avoid
poisoning by chlorinated solvents.23
6.3 GASOLINE AND AUTOMOTIVE EMISSIONS
Aromatic hydrocarbons including xylene are added to gasoline to raise the octane rating,
thereby suppressing engine knock, increasing power, and providing smoother running engines.
Xylene and other hazardous components may then be emitted in automotive exhaust. One study
estimates the global release rate of xylene from automobile exhaust to be in the range of 3 to 8
metric tons (6,600 to 17,600 pounds) per year.24 Automotive emissions have been related to
photochemical smog and ozone formation for many years. Atmospheric models recently became
sophisticated enough to accommodate compositional variations.25
Two studies involving automotive emissions are briefly described below. One study used
46 vehicles to provide detailed composition of organic emissions under various driving
conditions.25 The other study used a mobile TAGA 6000 EM tandem mass spectrometer system
to obtain time resolved data for selected aromatic compounds.26 Both of these studies present
possible protocols to perform tests that would better characterize emissions and eventually
estimate emissions of various VOC species, including xylene. However, the information
presented in these studies was not sufficiently comprehensive for emission factor development.
Table 6-2 lists the existing factors for xylene as a result of gasoline use, both from
evaporative and tailpipe emissions. These emission factors were taken from a previously
published EPA document.27 These factors are based on an activity measure of vehicle miles
traveled, which were derived based on engineering estimates and are therefore given a quality
rating of "U."
6-11

6.4 GASOLINE MARKETING
TABLE 6-2.EMISSION FACTORS FROM GASOLINE USE
Emission Source
Emission FactorGrams/VMT a
(pounds/VMT)QualityRating
Evaporation from automobilefuel tank
2.57 x 10⁻³ (5.66 x 10⁻⁶) Ub
Automobile exhaust 1.1 x 10⁻⁶ (2.39 x 10⁻⁹) Ub
aVMT = Vehicle Mile TraveledbBased on engineering judgement.Source: Reference 27.
Gasoline storage and distribution activities represent potential sources of xylene emissions.
The xylene content of gasoline ranges from less than 1 to almost 10 percent by weight, but
typical concentrations are around 5.6 percent by weight. Therefore, total hydrocarbon emissions
resulting from storage tanks, material transfer, and vehicle fueling include emissions of xylene.
This section describes sources of xylene emissions from gasoline marketing operations. Because
the sources of these emissions are so widespread, individual locations are not identified in this
section. Instead, emission factors are presented, along with a general discussion of the sources
of these emissions.28
The transportation and marketing of petroleum liquids involve many distinct operations,
each of which represents a potential source of xylene evaporative losses. Crude petroleum
products are transported from production operations to a refinery by pipelines, water carriers
(e.g., barges and tankers), tank trucks, and rail tank cars. The refined products are conveyed to
fuel marketing terminals and petrochemical industries by these same modes. From fuel marketing
terminals, the fuels are delivered by tank trucks to service stations, commercial accounts and
local bulk storage plants.29,30
6-12
As shown in Figure 6-2, typical components of gasoline marketing include refinery
storage, gasoline terminals, gasoline bulk plants, service stations, and ground transportation. The
gasoline terminals and gasoline bulk plants are large facilities for the wholesale marketing of
gasoline, kerosene, and fuel oil. They receive these petroleum products from refineries or other
terminals, mostly by pipeline, tanker, or barge, and store the products in large tanks. The
primary function of marine and pipeline terminals is to distribute products to other terminals.
Tank truck loading terminals distribute products by tank trucks to bulk plants, retail outlets or
final consumers. Most of these petroleum terminals have daily throughputs of more than 76,000
liters (20,000 gallons) of gasoline.
Service stations receive gasoline by tank truck from terminals or bulk plants or directly
from refineries, and usually store the gasoline in underground tanks. Gasoline service stations
are establishments primarily selling gasoline and automotive lubricants.
Gasoline is by far the largest volume petroleum product marketed in the United States,
with a nationwide consumption of 419 billion liters (111 billion gallons) in 1991.31 There are
presently an estimated 1,700 bulk terminals storing gasoline in the United States.32 About half
of these terminals receive products from refineries by pipeline, and half receive products by ship
or barge delivery. Most of the terminals (66 percent) are located along the east coast and in the
Midwest. The remainder are dispersed throughout the country, with locations largely determined
by population patterns.
The emission factors presented in the following discussions were derived using the
following method. Standard published emission factors for transportation and marketing for total
VOC emissions were modified to account for the fraction of xylene in the vapors emitted. The
fraction of xylene in the vapors was taken from theAir Emissions Species Manual Volume I:
Volatile Organic Compound (VOC) Species Profiles.33 A distinction was made between winter
and summer blends of gasoline because the xylene fraction varies significantly with the different
blends. The winter blend gasoline vapors were reported to be 1.07 percent xylene; summer blend
gasoline vapors were reported to be 0.2 percent xylene.
6-13
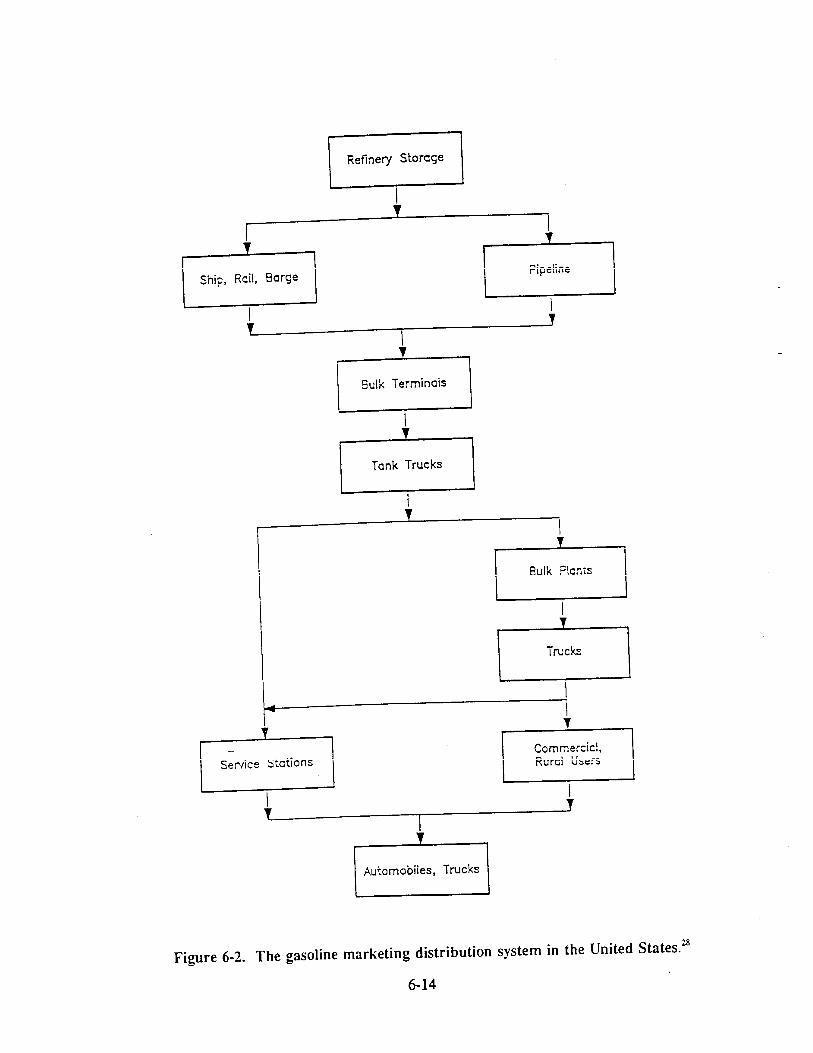
6.4.1 Xylene Emissions From Loading Marine Vessels
Volatile organic compounds (VOC) can be emitted from crude oil and refinery products
(gasoline, distillate oil, etc.) when loaded and transported by marine tankers and barges. Loading
losses are the primary source of evaporative emissions from marine vessel operations.32 These
emissions occur as vapors in "empty" cargo tanks are expelled into the atmosphere as liquid is
added to the cargo tank. The vapors may be composed of residual material left in the "empty"
cargo tank and/or the material being added to the tank. Therefore, the exact composition of the
vapors emitted during the loading process may be difficult to determine if the residual material
and the material being loaded are not of similar composition.
Emission factors for volatile organic compounds from marine vessel loading were found
in EPA documents.28 Average xylene/VOC ratios of 0.0107 for winter blend gasolines and 0.002
for summer blend gasolines were also identified in theAir Emissions Species Manual. Emission
factors for xylene from marine vessel loading were derived from these sources and are given in
Table 6-3. Factors are available for crude oil, distillate oil, and other fuels.32 However, reliable
estimates of the xylene content of these fuels were not found. Therefore, it was not possible to
provide xylene emission factors for marine vessel loading of fuels other than gasoline. However,
based on field experience it was assumed that xylene content of distillate oil and other fuels is
very small (<0.1 percent).
6.4.2 Xylene Emissions from Bulk Gasoline Plants, Bulk Gasoline Terminals
Each operation in which gasoline is transferred or stored is a potential source of xylene
emissions. At bulk terminals and bulk plants, loading, unloading, and storing gasoline are
sources of xylene emissions. The gasoline that is stored in above ground tanks is pumped
through loading racks that measure the amount of product. The loading racks consist of pumps,
meters, and piping to transfer the gasoline or other liquid petroleum products. Loading of
gasoline into tank trucks can be accomplished by one of three methods: splash, top submerged,
or bottom loading. In splash loading, gasoline is introduced into the tank truck directly through
a compartment located on the top of the truck.28 Top submerged loading involves inserting a
6-15

TABLE 6-3.UNCONTROLLED VOLATILE ORGANIC COMPOUND AND XYLENE EMISSIONS FROM
LOADING GASOLINE IN MARINE VESSELS
Emission Source
Volatile Organic CompoundEmission Factor
(mg/liter Transferred) a
Winter Blend MixedXylenes Emission Factor(mg/liter Transferred) b
Summer Blend MixedXylenes Emission Factor(mg/liter Transferred) b
EmissionFactorGrade
Tanker Ballasting 100 1.07 0.2 ETransit 320c 3.42 0.64 EShip/Ocean Barge:d
Uncleaned; volatileprevious cargo
315 3.37 0.63 E
Ballasted; volatileprevious cargo
205 2.19 0.41 E
Cleaned; volatileprevious cargo
180 1.93 0.36 E
Gas-freed; volatileprevious cargo
85 0.91 0.17 E
Any condition;nonvolatile previouscargo
85 0.91 0.17 E
Typical situation; anycargo
215 2.30 0.43 E
Barge:Uncleaned; volatileprevious cargo
465 4.98 0.93 E
Gas-freed; any cargo 245 2.62 0.49 ETypical situation; anycargo
410 4.39 0.82 E
aFactors are for nonmethane-nonethane VOC emissions.bBased on an average xylene/VOC ratio of 0.0107 and 0.002 for winter and summer blends of gasoline.33
cUnits for this factor are mg/week-liter transported.dOcean barge is a vessel with compartment depth of 40 feet; barge is a vessel with compartment depth of 10-12 feet.
Source: References 28 and 33.
6-16

downspout into the fill pipe so that gasoline is added to the tank truck near the bottom of the
tank. Bottom loading is the loading of product into the truck tank from the bottom. Because
emissions occur when the product being loaded displaces vapors in the tank being filled, the
reduced turbulence of top submerged loading and bottom loading reduce the amount of material
(including xylene) that is emitted.28 A majority of facilities which load gasoline use bottom
loading.
Emissions from Gasoline Loading and Unloading --
Bulk plants receiving gasoline from transfer trucks use vapor balancing systems,
consisting of a pipeline between the vapor spaces in the truck tank and the storage tanks. These
systems allow vapor displaced by liquid being introduced in the storage tank to transfer into the
truck as gasoline fills the storage tank.28 Table 6-4 lists emission factors for gasoline vapor and
xylene from gasoline loading racks at bulk terminals and bulk plants. The gasoline vapor
emission factors were taken from Reference 28. The xylene factors were obtained by multiplying
the gasoline vapor factor by the mixed xylene content of the vapor (Winter Blend 0.0107;
Summer Blend 0.002).33
Emissions from Gasoline Storage --
Storage emissions of xylene at bulk terminals and bulk plants depend on the type of
storage tank used. A typical bulk terminal may have four or five above ground storage tanks
with capacities ranging from 1,500 to 15,000 cubic meters (396,258 to 3,962,581 gallons).28
Most tanks in gasoline service have an external or internal floating roof to prevent the loss of
product through evaporation and working losses. Fixed-roof tanks, still used in some areas to
store gasoline, use pressure-vacuum vents to control breathing losses. A breather valve
(pressure-vacuum valve), which is commonly installed on many fixed-roof tanks, allows the tank
to operate at a slight internal pressure or vacuum. Any fixed roof tanks which are used to store
gasoline have some type of vapor recovery/control system to control VOC emissions. When the
pressure-vacuum valve is opened, (as during tank filling) the vapors exhausted will be sent to the
vapor recovery/control system. Commonly, the vapor control device is a condenser or an
adsorber through which the collected vapors can be returned to the storage tanks. Some facilities
use an incineration device such as a flare to control these VOC emissions from fixed roof tanks.
6-17

TABLE 6-4.XYLENE EMISSION FACTORS FOR GASOLINE LOADING AT BULK
TERMINALS AND BULK PLANTS
LoadingMethod
Gasoline VaporEmission Factor,a
mg/liter
Winter Blend XyleneEmission Factor,b
mg/liter
Summer BlendXylene Emission
Factor,b
mg/literEmission Factor
Grade
Splash 1430 15.3 2.9 E
Submergede 590 6.3 1.2 E
Balance Service 980 10.5 2.0 EaGasoline factors represent emissions of nonmethane-nonethane VOC. Factors are expressed as mg gasoline vapor per litergasoline transferred.28
bBased on an average xylene/VOC ratio of 0.0107 and 0.002 for winter and summer blends of gasoline, respectively.33
cSubmerged loading is either top or bottom submerged.
Source: References 28 and 33.
6-18

Fixed roof tanks consist of a cylindrical steel shell with a permanently affixed conical or
dome-shaped roof. Fixed roof tanks emit vapors to the atmosphere through working and
breathing losses. Working losses are primarily caused by displacement of vapor laden air during
filling. Breathing losses are caused by expansion and contraction of vapors and evaporation
caused by atmospheric temperature and pressure changes.
External floating roof tanks, in contrast, consist of a cylindrical steel shell and a roof
which floats on the surface of the stored liquid. Internal floating roof tanks have an additional
fixed roof over the floating roof of the tank. Floating roof tanks exhibit smaller vapor losses than
fixed roof tanks. The four classes of losses that floating roof tanks experience include
withdrawal loss, rim seal loss, deck fitting loss, and deck seam loss. Withdrawal losses are
caused by the stored liquid clinging to the side of the tank following the lowering of the roof as
liquid is withdrawn. Rim seal loss is caused by leaks at the seal between the roof and the sides
of the tank. Deck fitting loss is caused by leaks around support columns and deck fittings within
internal floating roof tanks. Deck seam loss is caused by leaks at the seams where panels of a
bolted internal floating roof are joined.
Table 6-5 shows emission factors for storage tanks at a typical bulk terminal. Table 6-6
shows the uncontrolled emission factors for xylene from a typical bulk plant. The emission
factors were based on EPA factors and the weight fraction of mixed xylenes in the vapor of
0.0107 in winter blend gasoline and 0.002 in summer blend gasoline.28,33 Bulk plants and
terminals use the same two basic methods for loading gasoline into tank trucks.
Emissions from Gasoline Tank Trucks --
Gasoline tank trucks have been demonstrated to be major sources of vapor leakage. Some
vapors may leak uncontrolled to the atmosphere from dome cover assemblies, pressure-vacuum
(P-V) vents, and vapor collection piping and vents. Other sources of vapor leakage on tank
trucks that occurs less frequently can be caused by tank shell flaws, liquid and vapor transfer
hoses, improperly installed or loosened overfill protection sensors, and vapor couplers. This
leakage has been estimated to be as high as 100 percent of the vapors which should have been
6-19
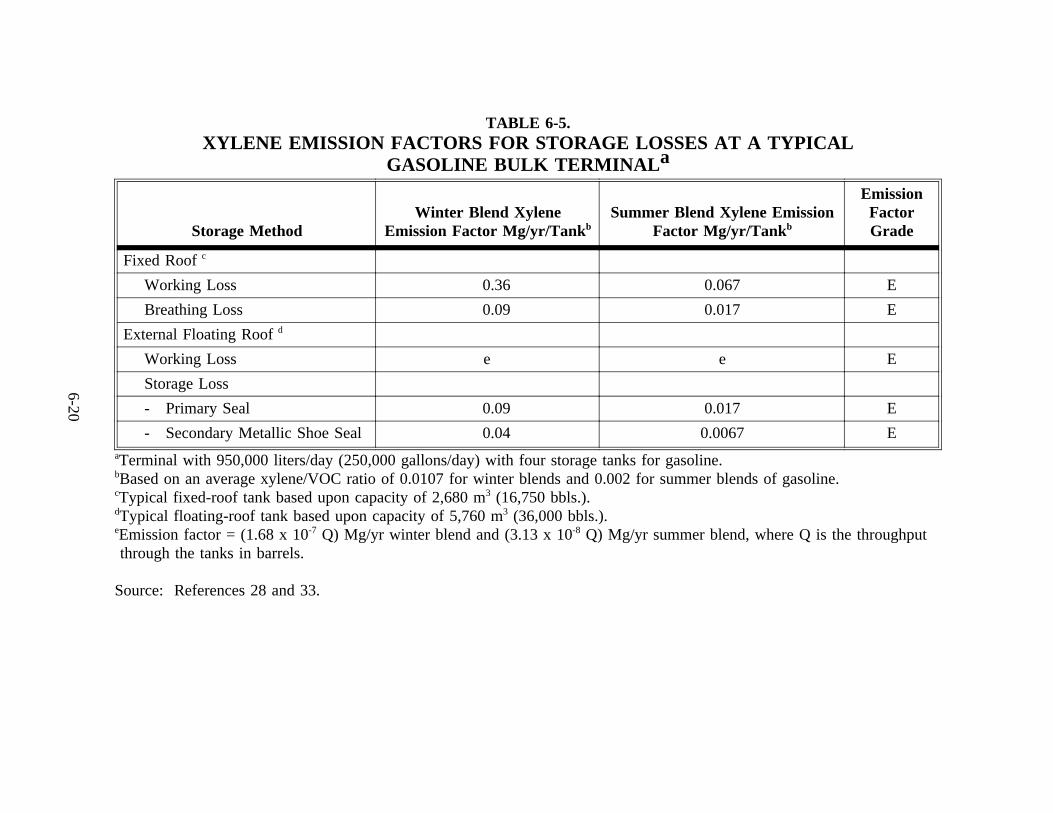
TABLE 6-5.XYLENE EMISSION FACTORS FOR STORAGE LOSSES AT A TYPICAL
GASOLINE BULK TERMINAL a
Storage MethodWinter Blend Xylene
Emission Factor Mg/yr/TankbSummer Blend Xylene Emission
Factor Mg/yr/Tank b
EmissionFactorGrade
Fixed Roofc
Working Loss 0.36 0.067 E
Breathing Loss 0.09 0.017 E
External Floating Roofd
Working Loss e e E
Storage Loss
- Primary Seal 0.09 0.017 E
- Secondary Metallic Shoe Seal 0.04 0.0067 EaTerminal with 950,000 liters/day (250,000 gallons/day) with four storage tanks for gasoline.bBased on an average xylene/VOC ratio of 0.0107 for winter blends and 0.002 for summer blends of gasoline.cTypical fixed-roof tank based upon capacity of 2,680 m3 (16,750 bbls.).dTypical floating-roof tank based upon capacity of 5,760 m3 (36,000 bbls.).eEmission factor = (1.68 x 10⁻⁷ Q) Mg/yr winter blend and (3.13 x 10⁻⁸ Q) Mg/yr summer blend, where Q is the throughputthrough the tanks in barrels.
Source: References 28 and 33.
6-20

TABLE 6-6.UNCONTROLLED GASOLINE VAPOR AND XYLENE EMISSIONS FROM
A TYPICAL BULK PLANT a
Emission Source
Gasoline VaporEmission
Factor, mg/liter
Winter BlendXylene EmissionFactor,b mg/liter
Summer BlendXylene EmissionFactor,b mg/liter
Emission FactorGradec
Storage Tanks - Fixed Roof:
Breathing Loss 600 6.4 1.2 E
Filling Loss 1150 12.3 2.3 E
Draining Loss 460 4.9 0.9 E
Gasoline Loading Racks:
Splash Loading 1430 15.3 2.9 E
Submerged Loading 590 6.3 1.2 E
Submerged Loading (BalanceService)
980 10.5 2.0 E
aTypical bulk plant with a gasoline throughput of 19,000 liters/day (5,000 gallons/day).bBased on an average xylene/VOC ratio of 0.0107 and 0.002 for winter and summer blends of gasoline respectively.33
cBased onAP-42criteria selection discussed in Section 2.0 of this document.
Source: References 28 and 33.
6-21

captured and to average 30 percent. Since terminal controls are usually found in areas where
trucks are required to collect vapors after delivery of product to bulk plants or service stations
(balance service), the gasoline vapor emission factor associated with uncontrolled truck leakage
was assumed to be 30 percent of the balance service truck loading factor (980 mg/liter x
0.30 = 294 mg/liter).28 Thus, the emission factors for xylene emissions from uncontrolled truck
leakage are 3.08 mg/liter for winter blend gasoline and 0.06 mg/liter for summer blend gasoline,
based on a mixed xylene/vapor ratio of 0.0107 for winter blend gasoline and 0.002 for summer
blend gasoline.33
6.4.3 Xylene Emissions from Service Stations
The following discussion on service station operations is divided into two areas: the
filling of the underground storage tank (Stage I) and automobile refueling (Stage II). Although
terminals and bulk plants also have two distinct operations (tank filling and truck loading), the
filling of the underground tank at the service station ends the wholesale gasoline marketing chain.
The automobile refueling operations interact directly with the public and control of these
operations can be performed by putting control equipment on either the service station or the
automobile.
Stage I Emissions at Service Stations --
Normally, gasoline is delivered to service stations in large tank trucks from bulk terminals
or smaller account trucks from bulk plants. Emissions are generated when hydrocarbon vapors
in the underground storage tank are displaced to the atmosphere by the gasoline being loaded into
the tank. As with other loading losses, the quantity of the service station tank loading loss
depends on several variables, including the quantity of liquid transferred, size and length of the
fill pipe, the method of filling, the tank configuration and gasoline temperature, vapor pressure,
and composition. A second source of emissions from service station tankage is underground tank
breathing. Breathing losses occur daily and are attributed to temperature changes, barometric
pressure changes, and gasoline evaporation.
6-22
Stage II Emissions at Service Stations --
In addition to service station tank loading losses, vehicle refueling operations are
considered to be a major source of emissions. Vehicle refueling emissions are attributable to
vapor displaced from the automobile tank by dispensed gasoline and to gasoline spillage. The
major factors affecting the quantity of emissions are gasoline temperature, auto tank temperature,
gasoline Reid vapor pressure (RVP), dispensing rates, and level of emission controls employed
(e.g., Stage II vapor recovery). Table 6-7 lists the uncontrolled emissions from a typical gasoline
service station.28,33
6.4.4 Control Technology for Gasoline Transfer
At bulk terminals and bulk plants, xylene emissions from gasoline transfer may be
controlled by a vapor processing system in conjunction with a vapor collection system.28
Figure 6-3 shows a vapor balance system at a bulk plant. These systems collect and recover
gasoline vapors from empty, returning tank trucks as they are filled with gasoline from storage
tanks.
At service stations, vapor balance systems contain the gasoline vapors within the station’s
underground storage tanks for transfer to empty gasoline tank trucks returning to the bulk
terminal or bulk plant. Figure 6-4 shows a diagram of a service station vapor balance system.
6.4.5 Control Technology For Gasoline Storage
The control technologies for controlling xylene emissions from gasoline storage involve
upgrading the type of storage tank used or adding a vapor control system. For fixed-roof tanks,
emissions are most readily controlled by installation of internal floating roofs.32 An internal
floating roof reduces the area of exposed liquid surface on the tank and, therefore, decreases
evaporative loss. Installing an internal floating roof in a fixed-roof tank can reduce total
emissions by 68.5 to 97.8 percent.28
6-23

TABLE 6-7.UNCONTROLLED GASOLINE VAPOR AND XYLENE EMISSIONS FROM A
TYPICAL SERVICE STATION a
Emission Source
Gasoline VaporEmission Factors
mg/liter
Winter BlendXylene EmissionFactorsb mg/liter
Summer BlendXylene EmissionFactorsb mg/liter
EmissionFactor Grade
Underground Storage Tanks
Tank Filling Losses
- Submerged Fill 880 9.4 1.8 E
- Splash Fill 1380 14.8 2.8 E
- Balanced SubmergedFilling
40 1.3 0.2 E
Breathing Losses 120 7.6 E
Automobile Refueling
Displacement Losses
- Uncontrolled 1320 5.5c 2.6 E
- Controlled 132 0.6c 0.3 E
Spillage 84 0.4c 0.2 EaTypical service station has a gasoline throughput of 190,000 liters/month (50,000 gallons/month).bBased on an average xylene VOC ratio of 0.0107 and 0.002 for winter and summer blends of gasoline.33
cBased on composite profile developed for the refueling of 4 cars with winter blend gasoline. o-Xylene = 0.15 percent,m-xylene = 0 percent, p-xylene = 0.27 percent.
Source: References 28 and 33.
6-24

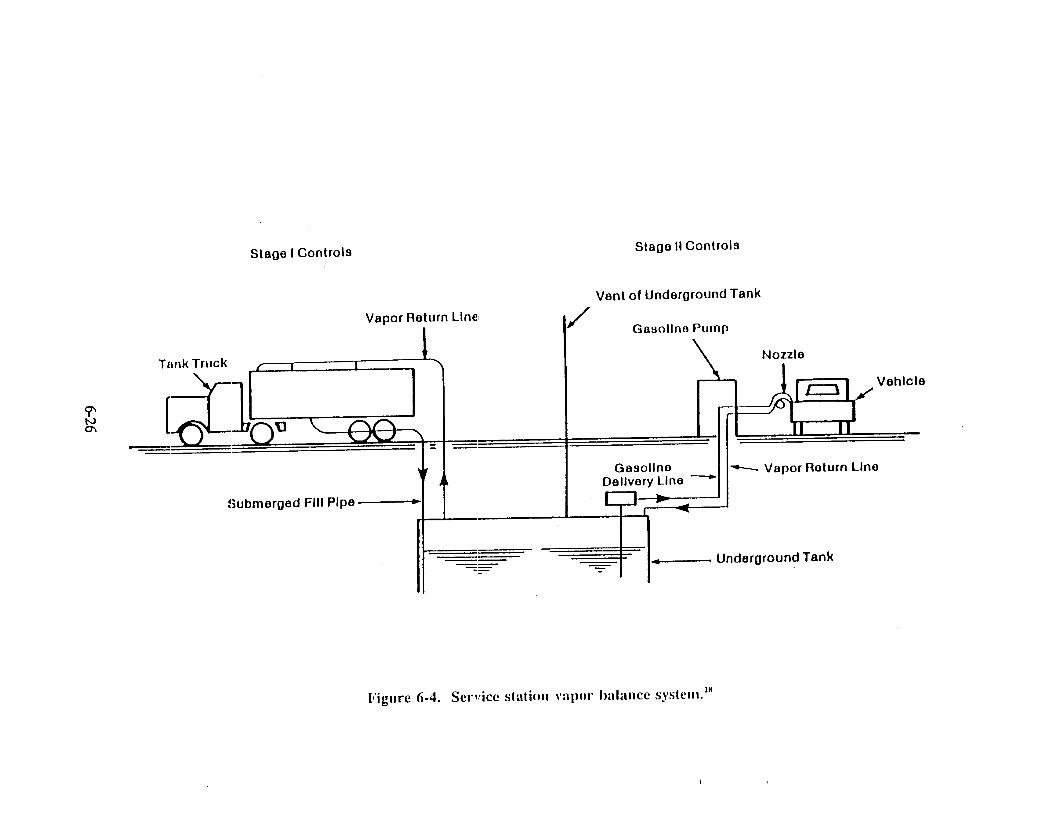
For external floating-roof tanks, no control measures have been identified for controlling
withdrawal losses and emissions.28 These emissions are functions of the turnover rate of the tank
and the characteristics of the tank shell. Rim seal losses in external floating roof tanks depend
on the type of seal. Liquid-mounted seals are more effective than vapor-mounted seals in
reducing rim seal losses. Metallic shoe seals are more effective than vapor-mounted seals but
less effective than liquid mounted seals.28
6.4.6 Control Technology For Vehicle Refueling Emissions
Vehicle refueling emissions are attributable to vapor displaced from the automobile tank
by dispensed gasoline and to gasoline spillage. The quantity of displaced vapors is dependent on
gasoline temperature, vehicle tank size and temperature, fuel level, gasoline RVP, and dispensing
rates.28
The two basic refueling vapor control alternatives are control systems on service station
equipment (Stage II controls), and control systems on vehicles (onboard controls). Onboard
controls are basically limited to the carbon canister.
There are currently three types of Stage II systems in limited use in the United States: the
vapor balance, the hybrid, and the vacuum assist systems. In the vapor balance system, gasoline
vapor in the automobile fuel tank is displaced by the incoming liquid gasoline and is prevented
from escaping to the atmosphere at the fillneck/nozzle interface by a flexible rubber "boot." This
boot is fitted over the standard nozzle and is attached to a hose similar to the liquid hose. The
hose is connected to piping which vents to the underground tank. An exchange is made (vapor
for liquid) as the liquid displaces vapor to the underground storage tank. The underground
storage tank assists this transaction by drawing in a volume of vapor equal to the volume of
liquid removed.28
The vacuum assist system differs from the balance system in that a "blower" (a vacuum
pump) is used to provide an extra pull at the nozzle/fillneck interface. Assist systems can recover
vapors effectively without a tight seal at the nozzle/fillpipe interface because only a close fit is
6-27
necessary. A slight vacuum is maintained at the nozzle/fillneck interface allowing air to be
drawn into the system and preventing the vapors from escaping. Because of this assist, the
interface boot need not be as tight fitting as with balance systems. Further, the vast majority of
assist nozzles do not require interlock mechanisms. Assist systems generally have vapor passage
valves located in the vapor passage somewhere other than in the nozzles, resulting in a nozzle
which is less bulky and cumbersome than nozzles employed by vapor balance systems.28
The hybrid system borrows from the concepts of both the balance and vacuum assist
systems. It is designed to enhance vapor recovery at the nozzle/fillneck interface by a vacuum,
whose low velocity minimizes the level of excess vapor/air returned to the underground storage
tank.
With the hybrid system, a small amount of the liquid gasoline (less than 10 percent)
pumped from the storage tank is routed (before metering) to a restricting nozzle called an
aspirator. As the gasoline passes through this restricting nozzle, a small vacuum is generated.
This vacuum is used to draw vapors into the rubber boot at the interface. Because the vacuum
is so small, very little excess air, if any, is drawn into the boot, hose and underground storage
tank, alleviating the need for a secondary processor, such as an incinerator.28
Onboard vapor control systems consist of carbon canisters installed on the vehicle to
control refueling emissions. The carbon canister system adsorbs, on activated carbon, the vapors
which are displaced from the vehicle fuel tank by the incoming gasoline. Such a system first
adsorbs the emissions released during refueling and subsequently purges these vapors from the
carbon to the engine carburetor when it is operating. This system is essentially an expansion of
the present evaporative emissions control system used in all new cars to minimize breathing
losses from the fuel tank and to control carburetor evaporative emissions. However, unlike the
present system, a refueling vapor recovery system will require a tight seal at the nozzle/fillneck
interface during refueling operations to ensure vapors flow into the carbon canister and are not
lost to the atmosphere.28
6-28

6.5 REFERENCES FOR SECTION 6.0
1. SRI International.U.S. Paint Industry Database. Prepared for the National Paint andCoatings Association. Washington DC. 1990.
2. U.S. Environmental Protection Agency.Compilation of Air Pollutant Emission Factors.AP-42,Fourth edition and supplements. Office of Air Quality Planning and Standards,Research Triangle Park, NC. 1985.
3. U.S. Environmental Protection Agency.Source Assessment: Prioritization of Air Pollutionfrom Industrial Surface Operations, EPA-650/2-75-019a. Research Triangle Park, NC.1975.
4. Bridgewater, A.V. and C.J. Mumford,Water Recycling and Pollution Control Handbook.Van Nostrand Reinhold Company. 1979.
5. Godish, Thad,Air Quality. Director of the Indoor Air Quality Research Laboratory.1985.
6. U.S. Environmental Protection Agency.VOC Pollution Prevention Options for theSurface Coating Industry. Research Triangle Park, NC. 1991.
7. 1987 Census of Manufacturers. U.S. Department of Commerce, Bureau of Census.
8. The NAPL Printer’s Almanac. The Printing Economic Research Center. NationalAssociation of Printers and Lithographers. Teaneck, NJ. 1990.
9. Gale Research Inc.,Ward’s Business Directory of U.S. Private and Public Companies-1991. Volume 4. Detroit, MI. 1991.
10. U.S. Environmental Protection Agency.Guides to Pollution Prevention: The CommercialPrinting Industry, EPA/625/7-90/008. Office of Research and Development. Washington,DC. August 1990.
11. U.S. Environmental Protection Agency.Publication Rotogravure Printing - BackgroundInformation for Proposed Standards, EPA-450/3-80-031a. Office of Air Quality Planningand Standards. Research Triangle Park, NC. October 1980.
12. U.S. Environmental Protection Agency.Control of Volatile Organic Emissions fromExisting Stationary Sources.Volume VIII: Graphic Arts Rotogravure and Flexograph,EPA-450/2-78-033. Office of Air Quality Planning and Standards. Research TrianglePark, NC. December 1978.
13. North Carolina Department of Natural Resources and Community Development.Companion Document for the Conference on Waste Reduction for Industrial Air ToxicsEmissions. Pollution Prevention Pays Program.Greensboro, NC. April 24-24, 1989.
6-29
14. U.S. Environmental Protection Agency, Office of Toxic Substances. Carpenter, Ben H.and Garland K. Hilliard.Overview of Printing Process and Chemicals Used. ConferenceProceedings: Environmental Aspects of Chemical Use in Printing Operations. Volume1. King of Prussia, PA. Washington, DC. September 1975.
15. Printing Ink Handbook, compiled by the Technical and Education Committees, NationalAssociation of Printing Ink Manufacturers, Inc. and the National Printing Ink ResearchInstitute, National Association of Printing Ink Manufacturers, New York, NY. 1967.
16. Neal, Barry and Robert H. Oppenheimer. "Environmental Regulations and Compliancein the Gravure Industry,"Tappi Journal. p. 121. July 1989.
17. Burt, Richard, Radian Corporation.NSPS for VOC Emissions from PublicationRotogravure Printing Industry. National Air Pollution Control Techniques AdvisoryCommittee Meeting Minutes. December 12-13, 1979.
18. U.S. Environmental Protection Agency.Control of Volatile Organic Emissions fromExisting Stationary Sources.Volume III: Graphic Arts - Rotogravure and Flexography,EPA-450/2-78-033. Emission Standards Engineering Division, Chemical and PetroleumBranch. Research Triangle Park, NC. 1978.
19. Profile Survey of the U.S. Gravure Industry. Gravure Association of America, New York,NY. 1989.
20. U.S. Environmental Protection Agency.Best Demonstrated Control Technology forGraphic Arts. EPA-450/3-91-008. Office of Air Quality Planning and Standards.Research Triangle Park, NC. February 1991.
21. U.S. Environmental Protection Agency.Polymeric Coating of Supporting Substrates--Background Information for Promulgated Standards, Final EIS, EPA-450/3-85-022b.Office of Air Quality Planning and Standards. Research Triangle Park, NC. April 1989.
22. U.S. Environmental Protection Agency.Magnetic Tape Manufacturing Industry--Background Information for Promulgated Standards, Final EIS, EPA-450/3-85-029b.Office of Air Quality Planning and Standards. Research Triangle Park, NC. July 1988.
23. Kosusko, Michael and Carlos M. Nunez. Air Waste Management Association.Destruction of Volatile Organic Compounds Using Catalytic Oxidation.Volume 2. pp.254-259. February 1990.
24. Isaksen, Ivar S. A.,et al, "Model Analysis of the Measured Concentration of OrganicGases in the Norwegian Arctic,"Journal of Atmospheric Chemistry. 3(1):3-27. 1985.
25. Sigsby, Jr., John E., Tejada, Silvestic, and Roy, William, "Volatile Organic CompoundEmissions from 46 In-Use Passenger Cars,"Environmental Science Technology. 21(5):466-475. 1987.
6-30

26. Mo, S.H., Gibbs, R.E., Hill, B.J., Johnson, R.E., Webster, W.J., and Whitby, R.A.Relationships Among Time-Resolved Roadside Measurements of Benzene, Toluene, Xyleneand Carbon Monoxide. Presented at the 80th Annual Meeting of APCA. New York, NY.June 21-26, 1987.
27. U.S. Environmental Protection Agency.Toxic Air Pollutant Emission Factors - ACompilation for Selected Air Toxic Compounds and Sources, EPA-450/2-88-006a. Officeof Air Quality Planning and Standards. Research Triangle Park, NC. October 1988.
28. U.S. Environmental Protection Agency.Evaluation of Air Pollution Regulatory Strategiesfor Gasoline Marketing Industry. EPA-450/3-84-012a. Washington, DC. 1984.
29. U.S. Environmental Protection Agency.Bulk Gasoline Terminals - BackgroundInformation for Proposed Standards. Draft EIS, EPA-450/3-80-038a. Office of AirQuality Planning and Standards. Research Triangle Park, NC. December 1980.
30. U.S. Environmental Protection Agency.Development of VOC Compliance Monitoringand Enforcement Strategies: The Wholesale Gasoline Marketing Chain - Volume II,EPA-340/1-80-01-013a. Office of Air Quality Planning and Standards. Research TrianglePark, NC. July 1980.
31. Energy Information Administration. Petroleum Supply Annual 1991, Volume 1.DOE/EIA-0340(91)/1.
32. Telecon. George Woodall, TRC Environmental Corporation to Bonnie Ayotte of theComputer Petroleum Company, St. Paul, MN. September 22, 1992.
33. U.S. Environmental Protection Agency.Air Emissions Species Manual Volume I:Volatile Organic Compound (VOC) Species Profiles, EPA-450/2-88-003a. ResearchTriangle Park, NC. April 1988.
6-31

SECTION 7.0
BY-PRODUCT EMISSIONS:
PROCESSES UNRELATED TO PRODUCTION OR USE OF XYLENE
Xylene and other pollutants can be emitted to the atmosphere as the result of product
manufacturing or from the burning of fossil fuels. Processes that release xylene as by-product
emissions are described in this section. These processes include coal combustion, hazardous and
solid waste incineration, and wastewater treatment processes.
7.1 COAL COMBUSTION
Two coal combustion studies are briefly described in this section. The first combustion
study was performed to collect data on the chemical composition of fugitive aerosol emissions
at a pilot-scale gasifier using lignite coal. Sampling was conducted at the Grand Forks Energy
Technology Center gasifier, Grand Forks, North Dakota. From the gas chromatography (GC) and
gas chromatography/mass spectrometry (GC/MS) analyses that were performed, it was determined
that xylene was emitted from the gasifier. However, no data were reported and emission factors
could not be developed.1
Another air monitoring study was performed on a burning coal refuse (gob) pile in Oak
Hill, West Virginia. The West Virginia Air Pollution Control Commission requested assistance
from EPA to perform a study of the heavy metal and organic chemical emissions from a burning
gob pile. Carbon monoxide emissions are expected from these burning gob piles, while
emissions of other compounds such as xylene are suspected. Under the direction of EPA,
GCA/Technology Division performed a study on the types and quantities of emissions from the
gob pile.2
The gob pile studied was similar to many of the hundred known to exist in coal mining
areas in the country. This coal waste pile was created as the result of a nearby deep mining
operation. The emissions have been generated for decades as a result of the spontaneous
combustion of low grade, yet combustible coal refuse material.2
7-1
Red dog, the solid matrix remaining after the combustible fractions are burned out of the
coal waste, is a popular fill and highway construction material. The two major results of mining
red dog are increased gaseous emissions and an increased fugitive particulate emission rate due
to the excavation and loading of the red dog into trucks. The slow natural combustion process
presents a difficult situation for effective pollution control. Due to cost and the large amount of
material involved, emission control of such a large area source is usually restrictive, although not
impossible.2
GCA’s investigative study was a two-phase approach in order to maximize the quality of
results. The first phase was a preliminary assessment, followed by a more comprehensive
quantitative emissions program. The preliminary assessment assisted in identifying pollutants
present in the gob pile emissions and their approximate concentrations. The second phase of the
investigation began with the siting of GCA’s Mobile Laboratory and the startup of the analytical
instrumentation. In addition, two meteorological monitoring stations were erected and calibrated,
one at approximately 10 feet elevation directly at the test area and one slightly downwind at
approximately 200 feet elevation above the test area, to measure overall regional wind
conditions.2
Samples were collected at the centerpoint of each of 24 equal area grids. All samples
were collected from within 10-inch diameter ductwork positioned over the sample point to
minimize dilution, mixing, and variable wind conditions. After all sample analyses were
completed, a calculation was performed to convert measured concentrations (ppm, ppb, µg/m3)
to average emission rates (lb/hr) for each parameter. An extrapolation of the average emission
rate from the sampled area to that of the total pile was then performed. Also, due to the large
range of values for most parameters, a standard error calculation was used to describe the
variability of each compound-specific average rate. Table 7-1 lists the emission rate and the
emission factor for xylene resulting from this study.2
7-2

TABLE 7-1.XYLENE EMISSIONS FROM COMBUSTIBLE COAL REFUSE
MATERIAL
Total Emission Rate Emission FactorQualityRating
3.2 + 1.7 kg/hr(7.1 + 3.8 lb/hr)
3.1 x 10⁻⁵ kg/hr/m3 (1.9 x 10⁻⁶ lb/hr/ft3)of burning refuse material
D
Source: Reference 2.
In summary, the investigative study resulted in calculated emission rates and emission
factors for various parameters. This study concludes that the possibility of downwind exposure
to toxic and suspected toxic airborne contaminants from the burning coal refuse pile exists.2
However, a search of the XATEF and SPECIATE databases did not identify any emission factors
for coal combustion.3,4
7.2 HAZARDOUS AND SOLID WASTE INCINERATION
Most atmospheric emissions of pollutants from the various hazardous and solid waste
disposal methods come from incineration. In addition to particulate matter, other pollutants, such
as volatile organic compounds (including xylene) and carbon monoxide are frequently emitted
as a result of incomplete combustion of the waste due to improper combustor design or poor
operating conditions.
Several methods are used to incinerate municipal waste. These include mass burn excess
air combustion, starved air or modular combustion, and refuse-derived fuel combustion.
Approximately 70 percent of the total municipal solid waste is incinerated in mass burn units.
More information on the methods of municipal waste combustion can be found in the document,
Characterization of the Municipal Waste Combustion Industry.5 Similarly, hazardous waste can
be incinerated by several methods including thermal, catalytic and regenerative incineration.
Xylene emission factors for incineration sources were not found.
7-3

Open-air burning presents a particularly unique source of atmospheric emissions of
pollutants. This method of solid waste incineration allows for exposure to many variables
including wind, ambient temperatures, and other environmental parameters such as rain and
humidity, degree of compactness of the refuse, and composition and moisture of the refuse. In
general, lower temperatures are achieved in open-air burning than in closed combustion.
Therefore, this allows for increased emissions of particulate matter, carbon monoxide, and volatile
organic compounds (including xylene), with decreased emissions of nitrogen oxides.6 Other
important regulating factors for open-air burning are fuel loading (how much refuse material is
burned per unit of land area) and arrangement of the refuse (in rows, piles, or spread out).4
Although specific xylene emission factors are unavailable for open burning in general, data
indicate that emissions of volatile organic compounds from non-agricultural materials are
approximately 25 percent methane, 8 percent other saturates, 18 percent olefins, and 49 percent
other compounds (oxygenates, acetylene, and aromatics, including xylene). However, emissions
have been measured for the open burning of scrap tires.7 Table 7-2 shows the measured emission
rates and the burn rates that are a critical factor in determining emissions. Figure 7-1 shows a
scatterplot and the basic statistics of the data in Table 7-2. As shown in Figure 7-1, the
relationship of burn rate of tires to the emission rate is nonlinear. Emission factor quality ratings
are not presented in Table 7-2 because these are emission rates calculated from one study and
emission factors were not developed from this data.
7.3 WASTEWATER TREATMENT PROCESSES
Atmospheric emissions of volatile organic compounds such as xylene can occur at any
wastewater treatment process where the wastewater comes into contact with the surrounding
ambient air. The majority of air emissions from wastewater treatment facilities usually comes
from the initial physical processes (e.g., screening, sedimentation, floatation, and filtration) due
to both a higher pollutant concentration in the influent and a greater surface area caused by
turbulence and mixing. Other sources of emissions include equalization and aeration basins and
clarifiers.
7-4

TABLE 7-2.XYLENE EMISSION RATES FROM THE OPEN BURNING OF
SCRAP TIRESBurn Rate Emission Rate
kilograms/hour (pounds/hour) kg xylene/metric ton tires (lbs xylene/ton tires)
0.50 (1.10) 3.212 (6.438)0.80 (1.76) 1.962 (3.932)0.90 (1.98) 1.208 (2.422)1.27 (2.80) 0.381 (0.764)1.30 (2.87) 1.063 (2.130)1.40 (3.09) 1.036 (2.077)1.50 (3.31) 0.736 (1.475)1.70 (3.75) 0.454 (0.909)2.27 (5.00) 0.111 (0.223)2.30 (5.07) 0.480 (0.962)3.50 (7.72) 0.294 (0.590)6.63 (14.62) 0.147 (0.295)
Source: Reference 7.
Figure 7-1. Emissions from open burning of scrap tires.7
7-5
Because of the many factors that may affect emissions of volatile organics, including
xylene, from wastewater treatment processes, calculating actual emissions estimates must be
performed on a chemical-by-chemical, process-by-process basis. Several models have been
developed that estimate emissions from wastewater treatment processes. Brief descriptions of
some appropriate models are presented below; however, further information should be consulted
in the appropriate reference(s).
The SIMS model (Surface Impoundment Modeling System) developed by the Control
Technology Center of the U.S. Environmental Protection Agency is a personal computer-based
software program designed to estimate atmospheric emissions from surface impoundments and
wastewater collection devices.8 The Tsivoglou and Neal Reaeration model can be used with the
SIMS model to estimate VOC emissions from the devices that comprise the headworks of a
POTW (since the SIMS model does not account for emissions from these devices or for
adsorption onto solids).9
Several inherent problems exist with using these models. First, the VOC concentrations
in the wastewater are highly variable among the influent, effluent, and sludge partitions:
therefore, a single emission estimate would be highly questionable. Second, the estimates are
usually based on constant behavior of relatively pure compounds, so mixing and variable
chemical concentrations would render the emission factors less useful. Finally, these estimates
are generally on the conservative side, and actual emissions will often tend to be higher than the
estimates.
A major process resulting in the emission of wastewater pollutants is the separation of the
lighter organic phase from the main body of wastewater and the heavier inorganic solid phase.
A top organic layer consisting of many volatile organic and oil-based compounds is formed and
exposed to ambient air. Factors affecting volatilization of organic compounds from the top
organic layer include characteristics of the wastewater and oil layers, the ambient wind speed,
design characteristics of the wastewater treatment operation, the concentration of pollutants in
the wastewater, detention time in the treatment system, and partition coefficients of the pollutants.
7-6

EPA has published several guidance documents and reports regarding emissions from wastewater
treatment systems which are referenced here.8,9,10
7-7
7.4 REFERENCES FOR SECTION 7.0
1. Joseph R. Stetter, Richard D. Flotard, and Elizabeth Gebert,Environmental Monitoringand Assessment in International Journal, Characterization of Airborne Particles at aHigh-BTU Coal-Gasification Pilot Plant. 1(4). 1982.
2. Seely, Douglas E. and Engle, Ronald J.Investigative Air Monitoring Study at a BurningCoal Refuse Pile in Oak Hill, West Virginia.Presented at the 77th Annual Meeting ofAPCA. San Francisco, CA. June 24-29, 1984.
3. U.S. Environmental Protection Agency.Crosswalk/Air Toxic Emission Factor DatabaseManagement System (XATEF), Version 1.2. Office or Air Quality Planning andStandards. Research Triangle Park, NC. October 1991.
4. U.S. Environmental Protection Agency.Volatile Organic Compound (VOC)/ParticulateMatter (PM) Speciation Database Management System, Version 1.4. Office of AirQuality Planning and Standards. Research Triangle Park, NC. October 1991.
5. Radian Corporation. Characterization of the Municipal Waste Combustion Industry,Appendix A. Research Triangle Park, NC. October 1986.
6. Gerstle, R.W., and D. A. Kemnitz. "Atmospheric Emissions from Open Burning,"Journal of Air Pollution Control Association.12:324-327. May 1967.
7. U.S. Environmental Protection Agency.Characterization of Emissions from the SimulatedBurning of Scrap Tires, EPA-600/2-89-054. Control Technology Center, ResearchTriangle Park, NC. October 1989.
8. U.S. Environmental Protection Agency.Surface Impoundment Modeling System (SIMS)Version 2.0 User’s Manual, EPA-450/4-90-019a. Control Technology Center. ResearchTriangle Park, NC. 1990.
9. Tsivoglou, E.C., and L.A. Neal. "Tracer Measurement of Reaeration, III. Predicting theReaeration Capacity of Inland Streams,"Journal of Water Pollution Control Federation48(12):2669. 1976.
10. U.S. Environmental Protection Agency.Guidance Services, Control of Volatile OrganicCompound Emissions from Industrial Wastewater, Volume I, Preliminary Draft. Office ofAir Quality Planning and Standards. Research Triangle Park, NC. April 1989.
7-8

SECTION 8.0
AMBIENT AIR AND STATIONARY SOURCE TEST PROCEDURES
Xylene(s) emissions can be measured from ambient air and stationary sources utilizing
the test methods presented below. If applied to stack sampling, the ambient air monitoring
methods may require adaptation or modification. To ensure that results will be quantitative,
appropriate precautions must be taken to prevent exceeding the capacity of the methodology.
Ambient methods which require the use of sorbents are susceptible to sorbent saturation if high
concentration levels exist. If this happens, breakthrough will occur, and quantitative analysis will
not be possible.
• EPA Method TO-1: Determination of Volatile Organic Compounds in Ambient Air Using
Tenax® Adsorption and Gas Chromatography/Mass Spectrometry (GC/MS)
• EPA Method TO-3: Determination of Volatile Organic Compounds in Ambient Air Using
Cryogenic Preconcentration Techniques and Gas Chromatography with Flame Ionization
and Electron Capture Detection
• EPA Method TO-14: Determination of Volatile Organic Compounds (VOCs) in Ambient
Air Using SUMMA® Passivated Canister Sampling and Gas Chromatography (GC)
• EPA Method 0030: Volatile Organic Sampling Train (VOST) with EPA Method 5040:
Analysis of Sorbent Cartridges from VOST
• EPA Reference Method 18: Measurement of Gaseous Organic Compound Emissions by
Gas Chromatography
• NIOSH Method 1501: Aromatic Hydrocarbons
8-1

8.1 EPA METHOD TO-1
Ambient air concentrations of xylene(s) can be measured using EPA Method TO-1 from
theCompendium of Methods for the Determination of Toxic Organic Compounds in Ambient Air.1
This method is used to collect and determine nonpolar, volatile organics (aromatic hydrocarbons,
chlorinated hydrocarbons) that can be captured on Tenax® and determined by thermal desorption
techniques. The compounds determined by this method have boiling points in the range of 80°
to 200°C (180° to 390°F).
Figure 8-1 presents a schematic diagram of the sampling system. Figure 8-2 presents a
schematic diagram of a typical Tenax® cartridge design. Ambient air is drawn through the
cartridge which contains approximately 1 to 2 grams of Tenax.® The xylenes are trapped on the
Tenax® cartridge, which is then capped and sent to the laboratory for analysis utilizing gas
chromatograph/mass spectrometry (GC/MS) according to the procedures specified in EPA Method
5040.
The exact run time, flow rate and volume sampled varies from source to source depending
on the expected concentrations and the required detection limit. Typically, 10 to 20 L of ambient
air are sampled. Analysis should be conducted within 14 days of collection. A capillary having
an internal diameter of 0.3mm and a length of 50 meters is recommended. The MS identifies
and quantifies the compounds by mass fragmentation or ion characteristic patterns. Compound
identification is normally accomplished using a library search routine on the basis of GC
retention time and mass spectral characteristics.
8.2 EPA METHOD TO-3
Ambient air concentrations of xylene(s) can be measured directly at the source using EPA
Method TO-3 from theCompendium Methods for the Determination of Toxic Organic
8-2

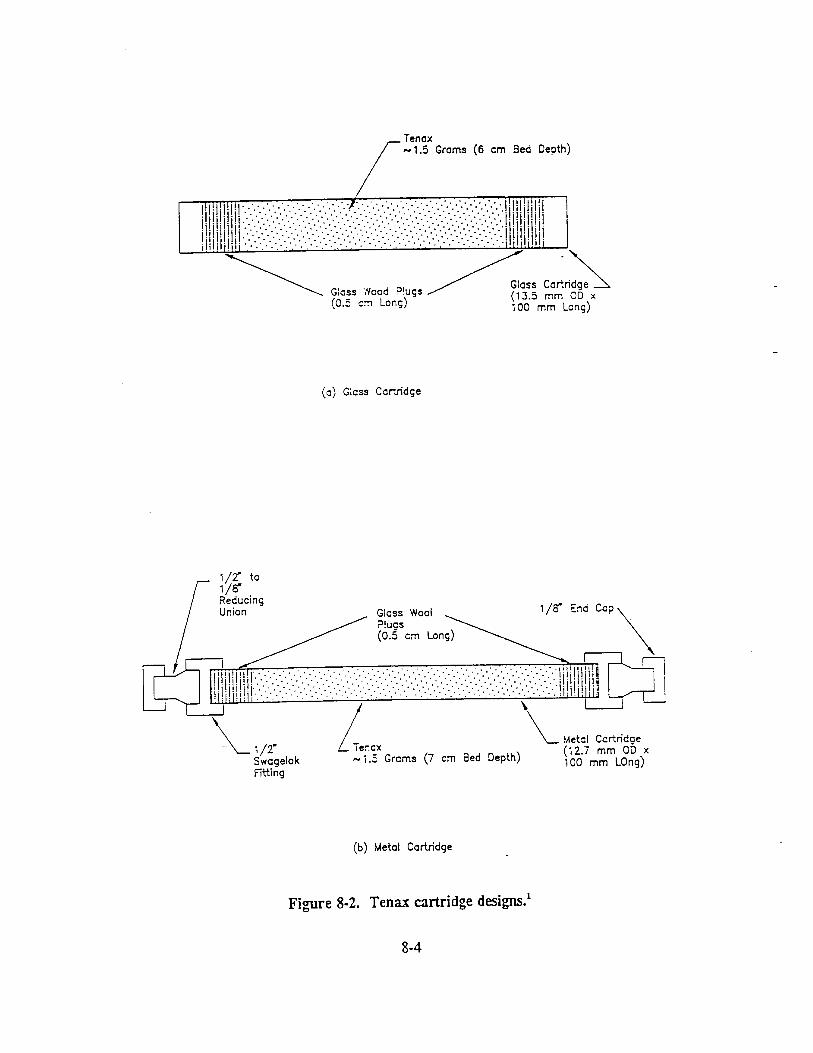

Compounds in Ambient Air.1 This method is designed for the determination of highly volatile
nonpolar organic compounds having boiling points in the range of -10° to 200°C (14° to 390°F).
Figure 8-3 presents a schematic of a typical on-line sampling system.
The ambient air sample is collected in the cryogenic trap utilizing a volume-measuring
device. The GC oven is then chilled to a subambient temperature. The sample valve is then
switched and the sample is carried onto the cooled GC column. Simultaneously, the cryogenic
trap is heated to assist in the sample transfer process. The GC column is heated to the desired
temperature and the peaks are identified and quantified using a flame ionization detector (FID)
or electron capture detector (ECD).
8.3 EPA METHOD TO-14
Ambient air concentrations of xylene(s) can also be measured using EPA Method TO-14
from the Compendium of Methods for the Determination of Toxic Organic Compounds in
Ambient Air.1 This method is based on collection of a whole air sample in SUMMA® passivated
stainless steel canisters and is used to determine semivolatile and volatile organic compounds.
The compounds are separated by gas chromatography and measured by mass-selective detector
or multidetector techniques such as flame ionization detection (FID), electron capture detection
(ECD), and photoionization detection (PID). The recommended column for Method TO-14 is
an HP OV-1 capillary type with 0.32mm I.D. x 0.88 um cross-linked methyl silicone coating or
equivalent. Samples should be analyzed within 14 days of collection.
This method is applicable to specific semivolatiles and VOCs that have been tested and
determined to be stable when stored in pressurized and subatmospheric pressure canisters.
Xylenes have been successfully measured at the parts per billion by volume (ppbv) level using
this method. Figure 8-4 presents a diagram of the canister sampling system.
8-5


8.4 EPA METHOD 0030
The volatile organic sampling train (VOST) is designed for the collection of volatile
organic compounds from the stack gas effluents of hazardous waste incinerators.2 Figure 8-5
presents a schematic of the principle components of the VOST. The VOST method was designed
to collect volatile organics with boiling points in the range of 30° to 100°C (86° to 212°F).
Many compounds with boiling points above 100°C (212°F) may also be effectively collected
using this method. Xylene(s) concentrations have been successfully measured utilizing this
methodology; however, quantitative data require validation.
In most cases, 20 L of effluent stack gas are sampled at an approximate flow rate of
1 L/minute, using a glass-lined heated probe and a volatile organic sampling train. The gas
stream is cooled to 20°C (68°F) by passage through a water-cooled condenser and the volatile
organics are collected on a pair of sorbent resin traps. Liquid condensate is collected in an
impinger located between the two resin traps. The first resin trap contains about 1.6 g Tenax®
and the second trap contains about 1 g each of Tenax® and petroleum-based charcoal.
The Tenax® cartridges are then thermally desorbed and analyzed by purge-and-trap
GC/MS along with the condensate catch as specified in EPA Method 5040.2 Analysis should be
conducted within 14 days of collection.
8.5 EPA METHOD 5040
The contents of the sorbent cartridges (collected using EPA Method 0030) are spiked with
an internal standard and thermally desorbed for 10 minutes at 80°C (176°F) with organic-free
nitrogen or helium gas (at a flow rate of 40 mL/min); bubbled through 5 mL of organic-free
water; and trapped on an analytical adsorbent trap.2 After the 10 minute desorption, the
analytical adsorbent trap is rapidly heated to 180°C (356°F), with the carrier gas flow reversed
8-8
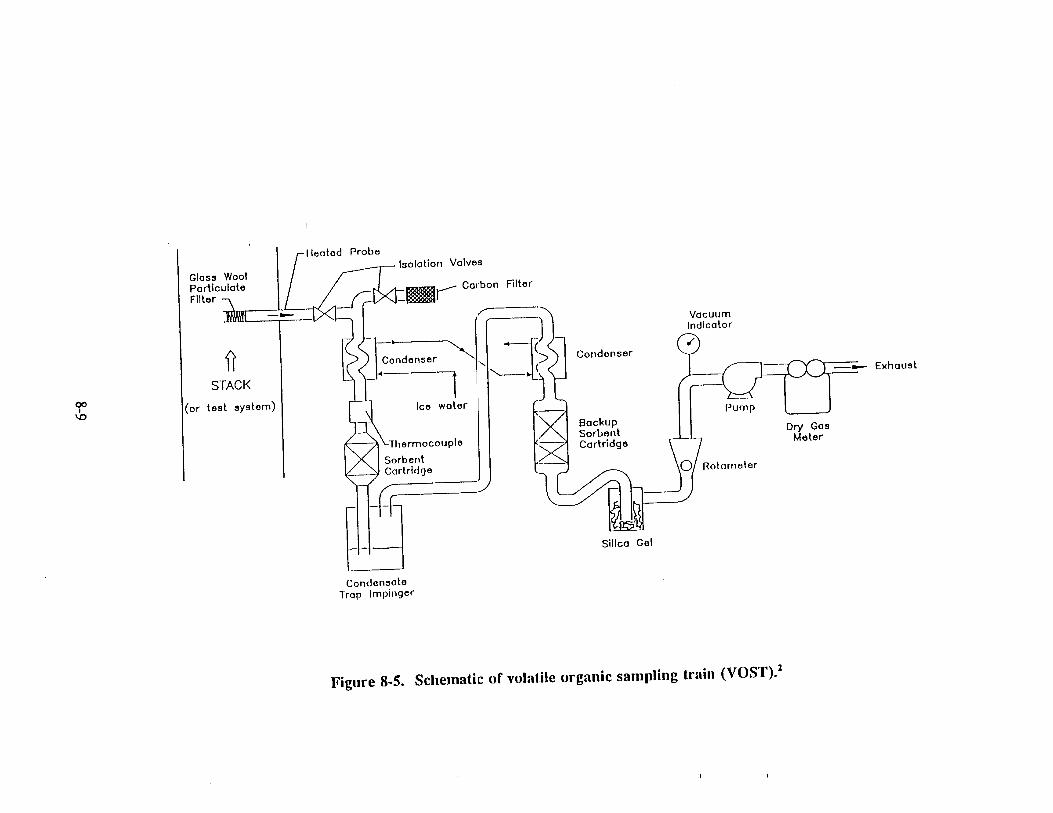
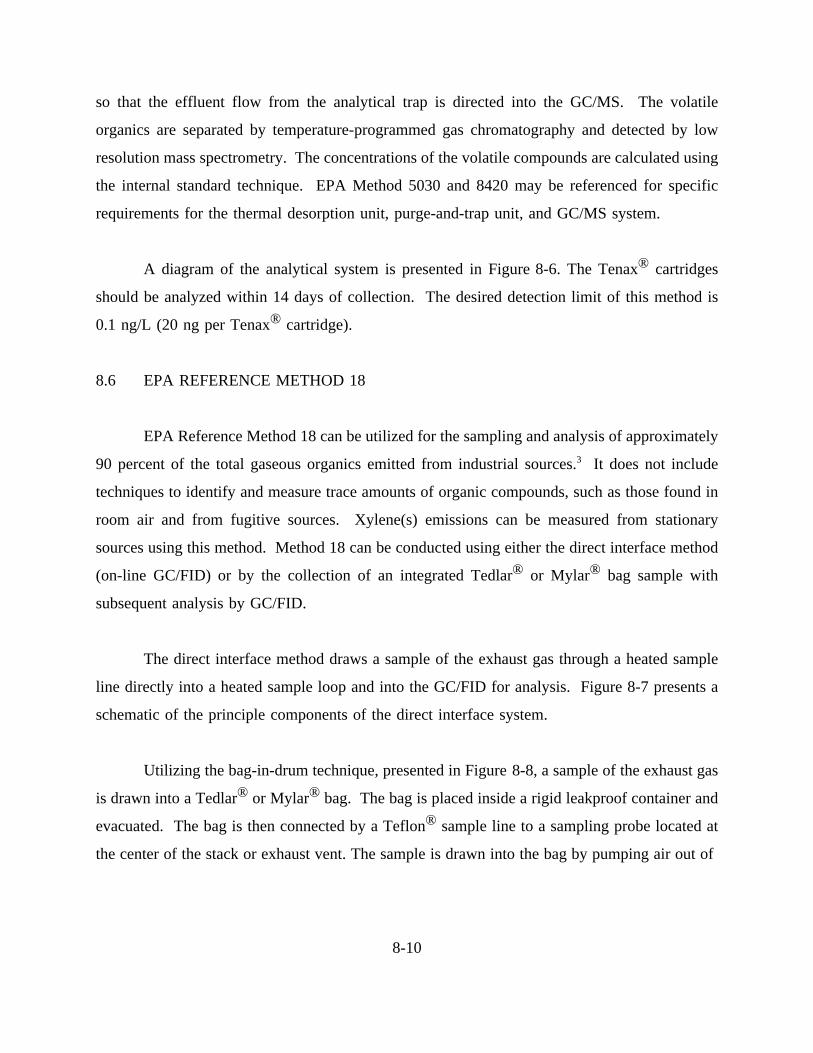
so that the effluent flow from the analytical trap is directed into the GC/MS. The volatile
organics are separated by temperature-programmed gas chromatography and detected by low
resolution mass spectrometry. The concentrations of the volatile compounds are calculated using
the internal standard technique. EPA Method 5030 and 8420 may be referenced for specific
requirements for the thermal desorption unit, purge-and-trap unit, and GC/MS system.
A diagram of the analytical system is presented in Figure 8-6. The Tenax® cartridges
should be analyzed within 14 days of collection. The desired detection limit of this method is
0.1 ng/L (20 ng per Tenax® cartridge).
8.6 EPA REFERENCE METHOD 18
EPA Reference Method 18 can be utilized for the sampling and analysis of approximately
90 percent of the total gaseous organics emitted from industrial sources.3 It does not include
techniques to identify and measure trace amounts of organic compounds, such as those found in
room air and from fugitive sources. Xylene(s) emissions can be measured from stationary
sources using this method. Method 18 can be conducted using either the direct interface method
(on-line GC/FID) or by the collection of an integrated Tedlar® or Mylar® bag sample with
subsequent analysis by GC/FID.
The direct interface method draws a sample of the exhaust gas through a heated sample
line directly into a heated sample loop and into the GC/FID for analysis. Figure 8-7 presents a
schematic of the principle components of the direct interface system.
Utilizing the bag-in-drum technique, presented in Figure 8-8, a sample of the exhaust gas
is drawn into a Tedlar® or Mylar® bag. The bag is placed inside a rigid leakproof container and
evacuated. The bag is then connected by a Teflon® sample line to a sampling probe located at
the center of the stack or exhaust vent. The sample is drawn into the bag by pumping air out of
8-10
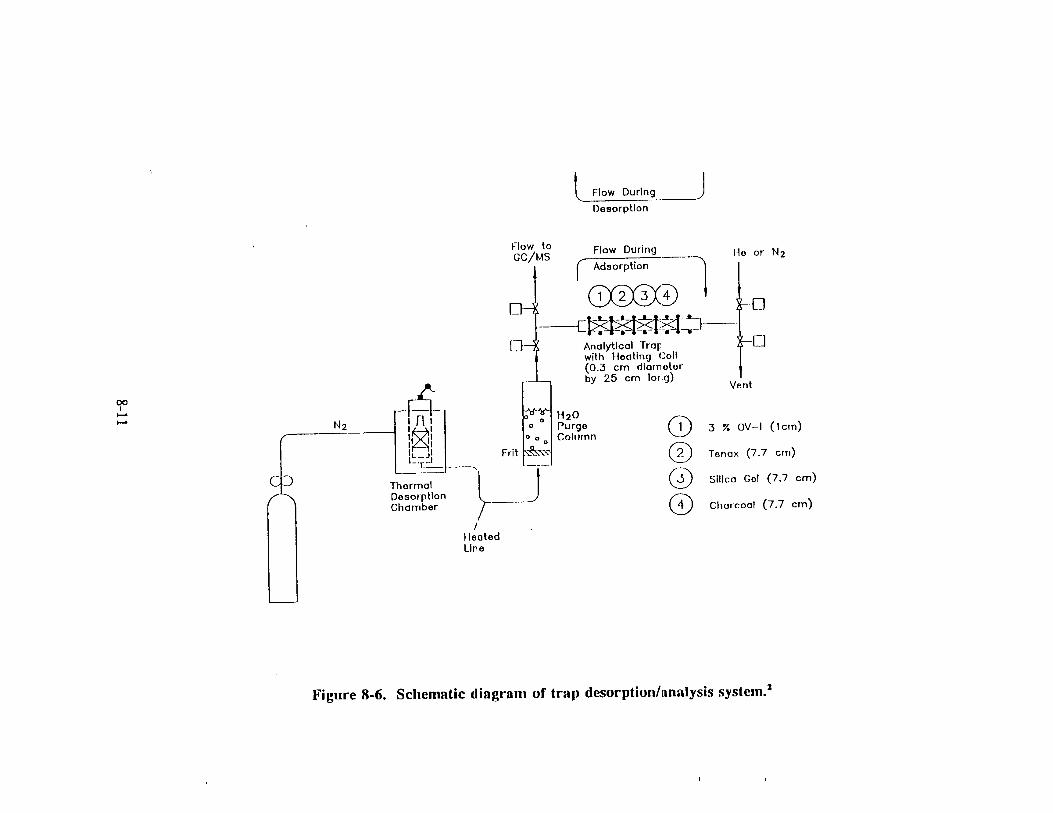

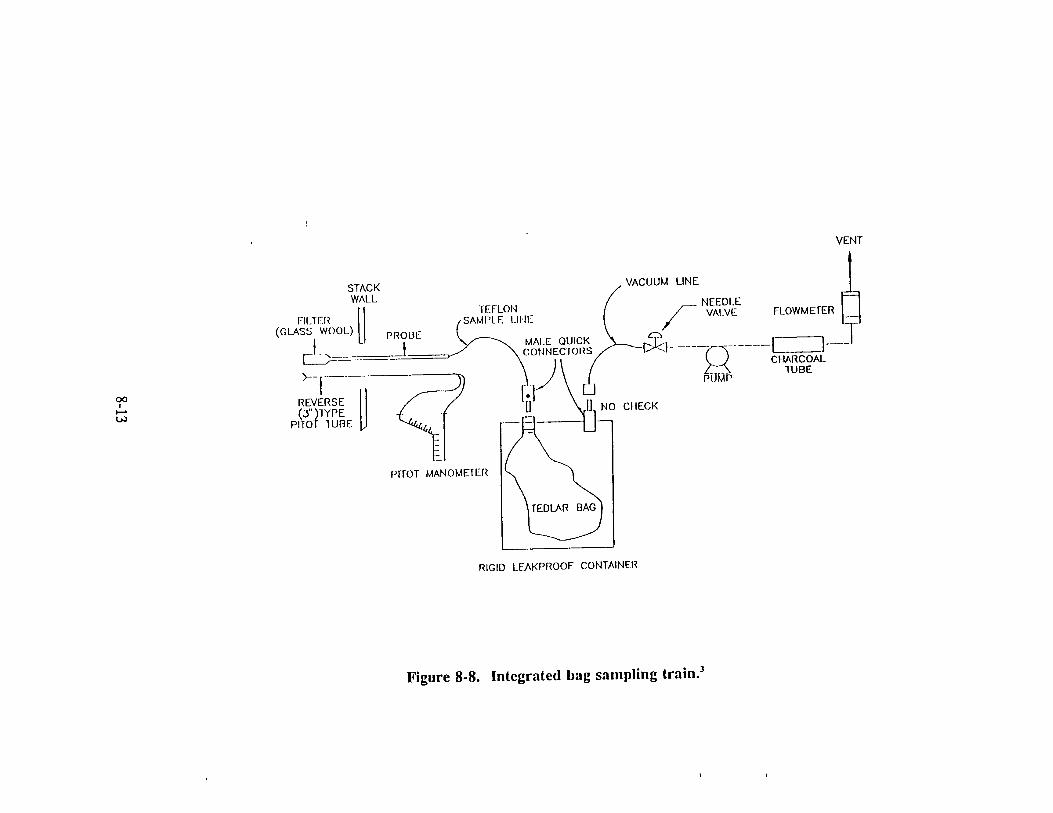

the rigid container. The sample is then analyzed by GC/FID. Based on laboratory studies, the
recommended time limit for analysis is within 14 days of collection.
8.7 NIOSH METHOD 1501
Ambient air and exhaust gas concentrations of xylene(s) can also be measured using
NIOSH Method 1501.4 This method has limited applications and applies to ten specific aromatic
hydrocarbons. The levels of detection are much higher than the other procedures discussed.
Ambient air or exhaust gas samples are collected on solid sorbent tubes containing
coconut shell charcoal. Ten to 20 L of air are collected, depending on the expected
concentrations, using a vacuum pump set at an approximate flow rate of 1 L/minute.
The samples are then capped, sent to the laboratory, desorbed with carbon disulfide and
analyzed by GC/FID. The column specified in NIOSH Method 1501 is a 3.0m x 2mm glass or
stainless steel with 10 percent OV-275 on 100/120 mesh Chromosorb W-AW or equivalent.
Analysis should be conducted within 14 days. Figure 8-9 presents a diagram of the NIOSH
Method 1501 sampling system.
8-14


8.8 REFERENCES FOR SECTION 8.0
1. U.S. Environmental Protection Agency.Compendium of Methods for the Determinationof Toxic Organic Compounds in Ambient Air. EPA/600/4-89/017. Atmospheric Researchand Exposure Assessment Laboratory, Research Triangle Park, NC. June 1988.
2. U.S. Environmental Protection Agency.Test Methods for Evaluating Solid Waste, ThirdEdition. Report No. SW-846. Office of Solid Waste and Emergency Response,Washington, DC. November 1986.
3. 40 CFR, Part 60, Appendix A,Method 18: Measurement of Gaseous Organic Compoundsby Gas Chromatography. pp 823 through 852.
4. NIOSHManual of Analytical Methods, Third Edition, Volumes 1 and 2. Cincinnati, OH.February 1984.
8-16

APPENDIX A
POTENTIAL SOURCE CATEGORIES OF MIXED XYLENE EMISSIONS
A-1

TABLE A-1.POTENTIAL SOURCE CATEGORIES OF MIXED XYLENE
EMISSIONS (continued)
SIC Code Source Description
1311 Crude Petroleum and Natural Gas
1321 Natural Gas Liquids
1382 Oil and Gas Exploration
1400 Nonmetallic Minerals, Except Fuels
1475 Phosphate Rock
1499 Miscellaneous Nonmetallic Minerals
2044 Rice Milling
2082 Malt Beverages
2221 Broadwoven fabric mills, manmade
2231 Broadwoven fabric mills, wool
2261 Finishing plants, cotton
2262 Finishing plants, manmade
2281 Yarn spinning mills
2426 Hardwood dimension and flooring mills
2431 Millwork
2434 Wood kitchen cabinets
2435 Hardwood veneer and plywood
2491 Wood Preserving
2493 Reconstituted wood products
2512 Upholstered household furniture
2515 Mattresses and bedsprings
2517 Wood TV and radio cabinets
2519 Household furniture, nec
2531 Public building and related furniture
(continued)
A-2
TABLE A-1.POTENTIAL SOURCE CATEGORIES OF MIXED XYLENE
EMISSIONS (continued)
SIC Code Source Description
2541 Wood partitions and fixtures
2591 Drapery hardware and blinds and shades
2599 Furniture and fixtures, nec
2611 Pulp mills
2653 Corrugated and solid fiber boxes
2655 Fiber cans, drums and similar products
2672 Paper coated and laminated, nec
2674 Bags: uncoated paper and multiwall
2721 Periodicals
2732 Book printing
2752 Commercial printing, lithographic
2754 Commercial printing, gravure
2761 Manifold business forms
2782 Blankbooks and looseleaf binders
2789 Bookbinding and related work
2796 Platemaking services
2800 Chemicals and Allied Products
2812 Alkalies and Chlorine
2813 Industrial gases
2816 Inorganic Pigments
2819 Industrial Organic Chemicals, nec
2821 Plastics materials and resins
2822 Synthetic rubber
(continued)
A-3

TABLE A-1.POTENTIAL SOURCE CATEGORIES OF MIXED XYLENE
EMISSIONS (continued)
SIC Code Source Description
2823 Cellulosic manmade fibers
2824 Organic fibers, noncellulosic
2834 Pharmaceutical preparations
2841 Soap and other detergents
2842 Polishes and sanitation goods
2843 Surface active agents
2844 Toilet preparations
2851 Paints and allied products
2861 Gum and Wood Chemicals
2865 Cyclic crudes and intermediates
2869 Industrial Organic Chemicals, nec
2873 Nitrogenous Fertilizers
2874 Phosphatic Fertilizers
2879 Agricultural chemicals, nec
2892 Explosives
2893 Printing Ink
2899 Chemical preparations, nec
2911 Petroleum Refining
3011 Tires and inner tubes
3052 Rubber and plastics hose and belting
3053 Gaskets, packing and sealing devices
3061 Mechanical rubber goods
3080 Misc. Plastics Products, nec
(continued)
A-4

TABLE A-1.POTENTIAL SOURCE CATEGORIES OF MIXED XYLENE
EMISSIONS (continued)
SIC Code Source Description
3081 Unsupported plastics film and sheet
3082 Unsupported plastics profile shapes
3086 Plastics foam products
3087 Custom compound purchased resins
3089 Plastics products, nec
3211 Flat glass
3229 Pressed and blown glass, nec
3231 Products of purchased glass
3241 Cement, hydraulic
3251 Brick and Structural Clay Tile
3253 Ceramic wall and floor tile
3255 Clay Refractories
3264 Porcelain electrical supplies
3272 Concrete products, nec
3274 Lime
3275 Gypsum Products
3292 Asbestos products
3295 Minerals, ground or treated
3296 Mineral Wool
3299 Nonmetallic mineral products, nec
3312 Blast furnaces and steel mills
3313 Electrometallurgical products
3315 Steel wire and related products
(continued)
A-5
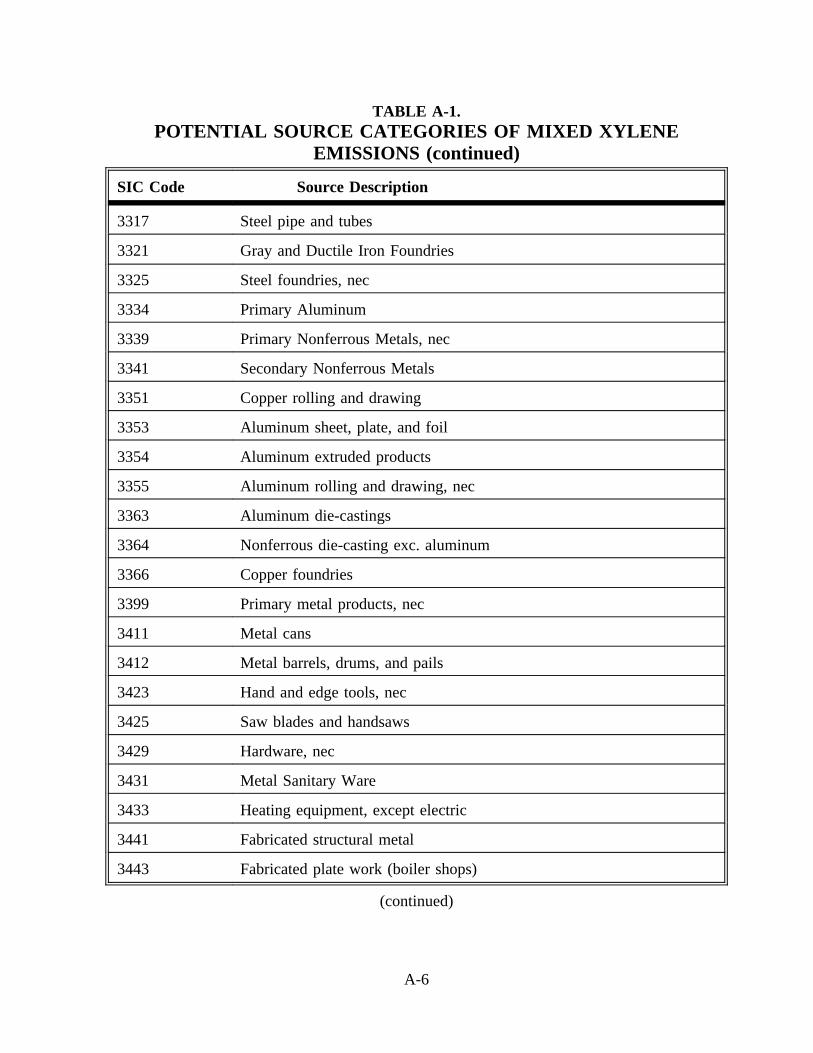
TABLE A-1.POTENTIAL SOURCE CATEGORIES OF MIXED XYLENE
EMISSIONS (continued)
SIC Code Source Description
3317 Steel pipe and tubes
3321 Gray and Ductile Iron Foundries
3325 Steel foundries, nec
3334 Primary Aluminum
3339 Primary Nonferrous Metals, nec
3341 Secondary Nonferrous Metals
3351 Copper rolling and drawing
3353 Aluminum sheet, plate, and foil
3354 Aluminum extruded products
3355 Aluminum rolling and drawing, nec
3363 Aluminum die-castings
3364 Nonferrous die-casting exc. aluminum
3366 Copper foundries
3399 Primary metal products, nec
3411 Metal cans
3412 Metal barrels, drums, and pails
3423 Hand and edge tools, nec
3425 Saw blades and handsaws
3429 Hardware, nec
3431 Metal Sanitary Ware
3433 Heating equipment, except electric
3441 Fabricated structural metal
3443 Fabricated plate work (boiler shops)
(continued)
A-6

TABLE A-1.POTENTIAL SOURCE CATEGORIES OF MIXED XYLENE
EMISSIONS (continued)
SIC Code Source Description
3444 Sheet metalwork
3446 Architectural metal work
3448 Prefabricated metal buildings
3449 Miscellaneous metal work
3451 Screw machine products
3462 Iron and steel forgings
3463 Nonferrous forgings
3465 Automotive stampings
3466 Crowns and closures
3471 Plating and polishing
3482 Small arms ammunition
3483 Ammunition, exc. for small arms, nec
3489 Ordnance and accessories, nec
3491 Industrial valves
3493 Steel springs, except wire
3494 Valves and pipe fittings, nec
3495 Wire springs
3496 Misc. fabricated wire products
3497 Metal foil and leaf
3498 Fabricated pipe and fittings
3511 Turbines and turbine generator sets
3519 Internal combustion engines, nec
3523 Farm machinery and equipment
(continued)
A-7

TABLE A-1.POTENTIAL SOURCE CATEGORIES OF MIXED XYLENE
EMISSIONS (continued)
SIC Code Source Description
3524 Lawn and garden equipment
3531 Construction machinery
3532 Mining machinery
3533 Oil and gas field machinery
3534 Elevators and moving stairways
3535 Conveyors and conveying equipment
3536 Hoists, cranes, and monorails
3537 Industrial trucks and tractors
3541 Machine tools, metal cutting types
3542 Machine tools, metal forming types
3545 Machine tool accessories
3546 Power-driven handtools
3548 Welding apparatus
3549 Metalworking machinery, nec
3553 Woodworking machinery
3554 Paper industries machinery
3555 Printing trades machinery
3556 Food products machinery
3559 Special industry machinery, nec
3561 Pumps and pumping equipment
3563 Air and gas compressors
3564 Blowers and fans
3565 Packaging machinery
(continued)
A-8

TABLE A-1.POTENTIAL SOURCE CATEGORIES OF MIXED XYLENE
EMISSIONS (continued)
SIC Code Source Description
3566 Speed changers, drives, and gears
3569 General industrial machinery, nec
3571 Electronic computers
3572 Computer storage devices
3579 Office machines, nec
3581 Automatic vending machines
3582 Commercial laundry equipment
3589 Service industry machinery, nec
3596 Scales and balances, exc. laboratory
3599 Industrial machinery, nec
3613 Switchgear and switchboard apparatus
3624 Carbon and Graphite Products
3625 Relays and industrial controls
3629 Electrical industrial apparatus, nec
3631 Household cooking equipment
3632 Household refrigerators and freezers
3633 Household laundry equipment
3634 Electric housewares and fans
3635 Household vacuum cleaners
3639 Household appliances, nec
3641 Electric lamps
3643 Current-carrying wiring devices
3644 Noncurrent-carrying wiring devices
(continued)
A-9

TABLE A-1.POTENTIAL SOURCE CATEGORIES OF MIXED XYLENE
EMISSIONS (continued)
SIC Code Source Description
3645 Residential lighting fixtures
3646 Commercial lighting fixtures
3647 Vehicular lighting equipment
3648 Lighting equipment, nec
3651 Household audio and video equipment
3661 Telephone and telegraph apparatus
3669 Communications equipment, nec
3672 Printed circuit boards
3675 Electronic capacitors
3676 Electronic resistors
3677 Electronic coils and transformers
3678 Electronic connectors
3679 Electronic components, nec
3691 Storage batteries
3694 Engine electrical equipment
3695 Magnetic and optical recording media
3699 Electrical equipment and supplies, nec
3711 Motor vehicles and car bodies
3715 Truck trailers
3716 Motor homes
3724 Aircraft engines and engine parts
3728 Aircraft parts and equipment, nec
3731 Ship building and repairing
(continued)
A-10
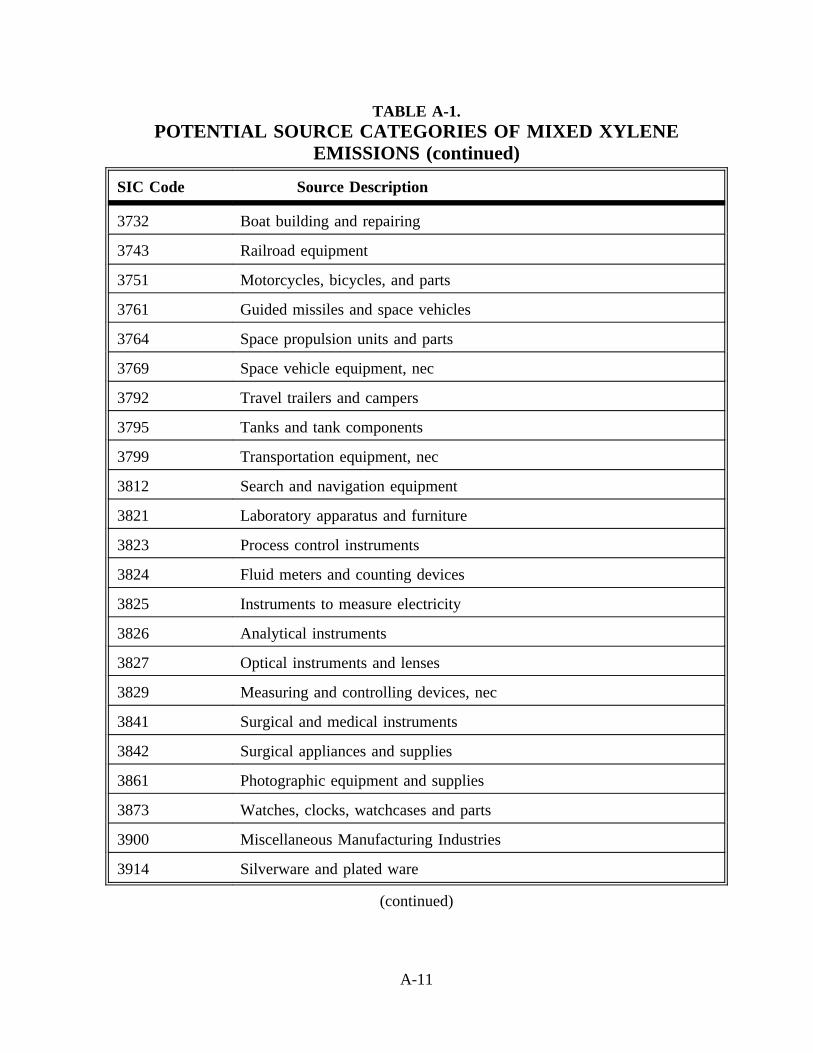
TABLE A-1.POTENTIAL SOURCE CATEGORIES OF MIXED XYLENE
EMISSIONS (continued)
SIC Code Source Description
3732 Boat building and repairing
3743 Railroad equipment
3751 Motorcycles, bicycles, and parts
3761 Guided missiles and space vehicles
3764 Space propulsion units and parts
3769 Space vehicle equipment, nec
3792 Travel trailers and campers
3795 Tanks and tank components
3799 Transportation equipment, nec
3812 Search and navigation equipment
3821 Laboratory apparatus and furniture
3823 Process control instruments
3824 Fluid meters and counting devices
3825 Instruments to measure electricity
3826 Analytical instruments
3827 Optical instruments and lenses
3829 Measuring and controlling devices, nec
3841 Surgical and medical instruments
3842 Surgical appliances and supplies
3861 Photographic equipment and supplies
3873 Watches, clocks, watchcases and parts
3900 Miscellaneous Manufacturing Industries
3914 Silverware and plated ware
(continued)
A-11

TABLE A-1.POTENTIAL SOURCE CATEGORIES OF MIXED XYLENE
EMISSIONS (continued)
SIC Code Source Description
3931 Musical instruments
3944 Games, toys, and children’s vehicles
3949 Sporting and athletic goods, nec
3951 Pens and mechanical pencils
3952 Lead pencils and art goods
3953 Marking devices
3961 Costume jewelry
3993 Signs and advertising specialties
3995 Burial caskets
3996 Hard surface floor coverings, nec
4111 Local and suburban transit
4226 Special warehousing and storage, nec
4491 Marine Cargo Handling
4499 Water transportation services, nec
4512 Air transportation, scheduled
4581 Airports, flying fields, and services
4741 Rental of railroad cars
4789 Transportation services, nec
4911 Electric Services
4925 Gas production and/or distribution
4939 Combination utilities, nec
4952 Sewerage Systems
4953 Refuse systems
(continued)
A-12

TABLE A-1.POTENTIAL SOURCE CATEGORIES OF MIXED XYLENE
EMISSIONS (continued)
SIC Code Source Description
5021 Furniture
5032 Brick, stone, and related materials
5085 Industrial Supplies
5113 Industrial and personal service paper
5153 Grain and field beans
5169 Chemicals and allied products, nec
5171 Petroleum bulk stations and terminals
5172 Petroleum products, nec
5191 Farm supplies
5198 Paints, varnishes, and supplies
5231 Paint, glass, and wallpaper stores
5541 Gasoline service stations
5712 Furniture stores
6512 Nonresidential building operators
7532 Top and body repair and paint shops
7538 General automotive repair shops
7629 Electrical repair shops, nec
7641 Reupholstery and furniture repair
7694 Armature rewinding shops
7699 Repair services, nec
8211 Elementary and secondary schools
8221 Colleges and universities
8299 Schools and educational services, nec
(continued)
A-13
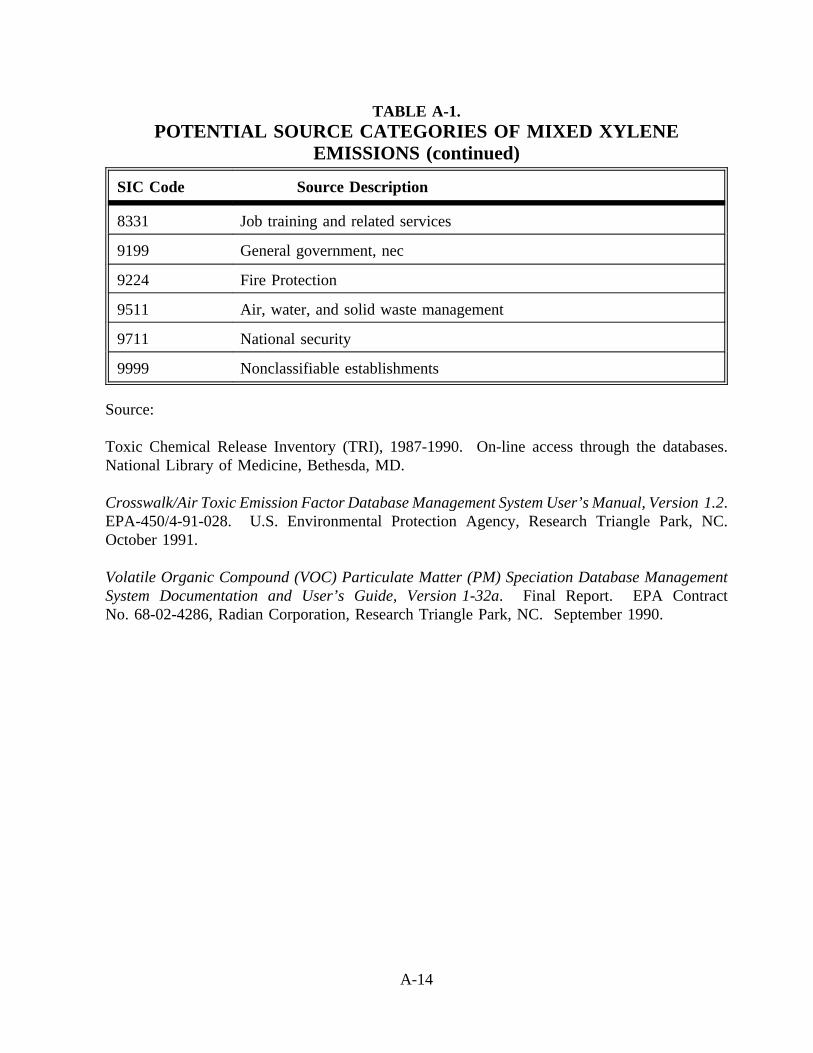
TABLE A-1.POTENTIAL SOURCE CATEGORIES OF MIXED XYLENE
EMISSIONS (continued)
SIC Code Source Description
8331 Job training and related services
9199 General government, nec
9224 Fire Protection
9511 Air, water, and solid waste management
9711 National security
9999 Nonclassifiable establishments
Source:
Toxic Chemical Release Inventory (TRI), 1987-1990. On-line access through the databases.National Library of Medicine, Bethesda, MD.
Crosswalk/Air Toxic Emission Factor Database Management System User’s Manual, Version 1.2.EPA-450/4-91-028. U.S. Environmental Protection Agency, Research Triangle Park, NC.October 1991.
Volatile Organic Compound (VOC) Particulate Matter (PM) Speciation Database ManagementSystem Documentation and User’s Guide, Version 1-32a. Final Report. EPA ContractNo. 68-02-4286, Radian Corporation, Research Triangle Park, NC. September 1990.
A-14

APPENDIX B
LISTS OF PAINT, INK, AND PRINTING FACILITIES WITH ANNUAL SALESGREATER THAN $1 MILLION
B-1

TABLE B-1.PAINT AND ALLIED PRODUCTS FACILITIES (SIC 2851) WITH
ANNUAL SALES GREATER THAN $1 MILLION (continued)
Name AddressSales in
$ Millions
Aervoe-Pacific Co. Inc. PO Box 485, Gardnerville NV 89410 11
AExcel Corp. 7373 Production Dr, Mentor OH 44060 20
Agri-Blend Inc. PO Box 957, Rowlett TX 75088 1*
Akron Paint & Varnish Inc. 1390 Firestone Parkway, Akron OH 44301 4*
Akzo Coatings Inc. Reliance Universal Inc.1930 Bishop Ln, Louisville KY 40218 300
Akzo Coatings Inc. Akzo Resins & Vehicles21625 Oak St, Matteson IL 60443 13
Akzo Coatings Inc. 1600 Watterson Towers, Louisville KY 40218 550*
Allentown Paint Manufacturing Co. PO Box 597, Allentown PA 18105 4
Also Indus Inc. Morton Paint Co. Box 6208, Canton OH 44706 3
Ameritone Paint Corp. PO Box 190, Long Beach CA 90801 40
Ameron Inc. Enmar Finishes Div. PO Box 9610, Little Rock AR 72219 15
Ameron Inc. Ameron Protective CoatingsDiv.
201 N Berry St, Brea CA 92621 112
Amsterdam Color Works Inc. 1546 Stillwell Ave, Bronx NY 10461 7
Aspen Paints 1128 SW Spokane St, Seattle WA 98134 4
Atlas Coating Corp. 820 E 140th St, Bronx NY 10454 7*
Automotive Finishes Inc. 6430 Wyoming Ave, Dearborn MI 48126 4
Baker Sealants & Coating 234 Suydam Ave, Jersey City NJ 07304 5
Barrett Varnish Co. 1532 S 50th Ct, Cicero IL 60650 3
Bee Chem Co. 2700 E 170th St, Lansing IL 60438 66
Behr Process Corp. PO Box 1287, Santa Ana CA 92702 33*
Benjamin Moore & Co. 51 Chestnut Ridge Rd., Montvale NJ 07645 370*
Bennette Paint Manufacturing Co. PO Box 9088, Hampton VA 23670 5
Best Bros Paint Manufacturing Co. PO Box 2056, Sinking Spr PA 19608 1
Beverly Manufacturing Co. (Los Angeles) 9118 S Main St, Los Angeles CA 90003 2
Birk Paint Manufacturing Inc. 230 Kearny Ave, Jersey City NJ 07305 2
Blue Ridge Talc Co. Inc. PO Box 39, Henry VA 24102 9
Brewer Chem Corp. PO Box 48, Honolulu HI 96810 50
Brod-Dugan Co. 2145 Schuetz Rd, St. Louis MO 63146 15
Bruning Paint Co. 601 S Haven, Baltimore, MD 21224 30
Burkes Paint Co. Inc. 727 S 27th St, Washougal WA 98671 3
Buten Paint & Wallpaper 5000 Ridge Ave, Philadelphia PA 19128 40
Cabot Stains 100 Hale St, Newburyport MA 01950 30
Cal Western Paint Corp. 11748 Slauson Ave, Santa Fe Spr CA 90670 5
Calbar Inc. 2626 N Martha St, Philadelphia PA 19125 4
California Products Corp. PO Box 569, Cambridge MA 02139 32
Carbit Paint Co. 927 W Blackhawk St, Chicago IL 60622 5
(continued)
B-2

TABLE B-1.PAINT AND ALLIED PRODUCTS FACILITIES (SIC 2851) WITH
ANNUAL SALES GREATER THAN $1 MILLION (continued)
Name AddressSales in
$ Millions
Carboline Co. 350 Hanley Indus Ct, St. Louis MO 63144 65
Cardinal Color Co. 50-56 1st St, Paterson NJ 07524 7
Cardinal Indus Finish Inc. 1329 Potrero Ave, South El Mon CA 91733 18
Century Chem Co. 5 Lawrence St, Bloomfield NJ 07003 5
Certified Coating Products 2414 S Connor Ave, Los Angeles CA 90040 1
CF Jameson & Co. Inc. PO Box 197, Bradford MA 01835 1
Charles A Crosbie Labs Inc. PO Box 3497, Van Nuys CA 91407 1
Chemical Technology Labs Inc. 12150 S Alameda St, Lynwood CA 90262 3
Chemical Coating Corp. 7300 Crider Ave, Pico Rivera CA 90660 3
Ciba-Geigy Corp. Drakenfeld Colors PO Box 519, Washington PA 15301 28
Clement Coverall Inc. PO Box 557, Camden NJ 08101 4
CM Athey Paint Co. 1809 Bayard St, Baltimore MD 21230 6
Coatings & Chems Corp. 3067 N Elston Ave, Chicago IL 60618 5
Colonial Refining & Chem Co. 20575 Ctr Ridge Rd, Cleveland OH 44116 3
Columbia Paint Corp. PO Box 2888, Huntington WV 25728 5
Columbia Paint Co. PO Box 4569, Spokane WA 99202 17
Colwell Gen Inc. PO Box 329, Fort Wayne IN 46801 20
Commercial Chem Co. Inc. PO Box 2126, Santa Ana CA 92707 4
Con-Lux Coatings Inc. PO Box 847, Edison NJ 08818 25
Cook & Dunn Paint Corp. Pure All PaintCoatings Co.
700 Gotham Ave, Carlstadt NJ 07072 8*
Cook & Dunn Paint Corp. 700 Gotham Parkway, Carlstadt NJ 07072 20
Cook & Dunn Paint Corp. AdelphiCoating
700 Gotham Parkway, Carlstadt NJ 07072 3
Cook Paint & Varnish Co. PO Box 419389, Kansas City MO 64141 100
Coronado Paint Co. Inc. PO Box 308, Edgewater FL 32032 28
Cosan Chem Corp. 400 14th St, Carlstadt NJ 07072 10*
Cotter & Co. Gen Paint & Chem Co. 201 Jandus Rd., Cary IL 60013 120
Courtlaulds Coatings USA Inc. PO Box 1439, Louisville, KY 40201 160*
Cowman & Campbell PO Box 70328, Seattle WA 98107 3
CP Inc. PO Box 333, Connersville IN 47331 5
Crest Chem Indus Ltd. PO Box 85, New Lenox IL 60451 1*
Crosby Coatings Inc. PO Box 1038, Chico CA 95927 6
CWC Indus Inc. 2686 Lisbon Rd, Cleveland OH 44104 5
Dalys Inc. 3525 Stone Way N, Seattle WA 98103 5
Dampney Co. Inc. 85 Paris St, Everett MA 02149 4
Daniel Products Co. 400 Claremont Ave, Jersey City NJ 07304 20
Davis Paint Co. 1311 Iron St, Kansas City MO 64116 13
(continued)
B-3

TABLE B-1.PAINT AND ALLIED PRODUCTS FACILITIES (SIC 2851) WITH
ANNUAL SALES GREATER THAN $1 MILLION (continued)
Name AddressSales in
$ Millions
Davlin Paint Co. Inc. 700 Allston Way, Berkely CA 94702 3*
DC Franche & Co. 1401 W Wabansia Ave, Chicago IL 60622 3
De Boom Paint Co. 645 Texas St, San Francisco CA 94107 5
Dean & Barry Co. 296 Marconi Blvd, Columbus OH 43215 15
Decratrend Paints 251 Mason Way, City of Indu CA 91746 17
Deft Inc. 17451 Von Karman Ave, Irvine CA 92714 15
Del Paint Corp. 3105 E Reno St, Oklahoma City OK 73117 4
Delrac Manufacturers of Bisonite ProductsCo. Inc.
PO Box 764, Tonawanda NY 14151 3*
DeSoto Inc. PO Box 5030, Des Plaines IL 60017 408
Devoe & Raynolds Co. PO Box 7600, Louisville KY 40207 120*
Dexter Corp. Dexter Specialty CoatingsDiv.
1 E Water St, Waukegan IL 60085 80
Diamond Products Co. Inc. 709 S 3rd Ave, Marshalltown IA 50158 18*
DJ Simpson Co. PO Box 2265, South San Francisco CA 94080 5
Dover Sales Co. Inc. PO Box 2479, Berkeley CA 94702 3*
Duncan Enterprises PO Box 7827, Fresno CA 93747 30
Dunn Edwards Corp. PO Box 30389, Los Angeles CA 90039 150*
Dupli-Color Products Co. 1601 Nicholas Blvd, Elk Grove Vi IL 60007 50
Duralac Inc. 84 Lister Ave. Newark NJ 07105 4
Duron Inc. 10406 Tucker St, Beltsville MD 20705 150
Dye Specialties Inc. PO Box 1447, Secaucus NJ 07096 8
Egyptian Lacquer Manufacturing PO Box 4449, Lafayette IN 47903 10
Ellis & Everard (US Holdings) Inc.Prillaman Chem Corp.
PO Box 4024, Martinsville VA 24112 96*
Elpaco Coatings Corp. PO Box 447, Elkhart IN 46515 8
Emco Finishing Products Inc. 470 Cresent St, Jamestown NY 14701 2
Empire State Varnish Co. 38 Varick St, Brooklyn NY 11222 5
Environmental Coatings Inc. 6450 Hanna Lake SE, Caledonia MI 49316 5
Epoca Co. 5 Lawrence St, Bloomfield NJ 07003 1
Epoxy Coatings Co. PO Box 1035, Union City CA 94587 1
Evans Paint Inc. PO Box 4098, Roanoke VA 24015 4*
Everseal Manufacturing Co. Inc. 475 Broad Ave, Ridgefield NJ 07657 12
Fabrionics Inc. Route 130 S, Camargo IL 61919 13
Farboil Co. 8200 Fischer Rd, Baltimore MD 21222 11
Farwest Paint Manufacturing Co. Inc. PO Box 68726, Tukwila WA 98168 3
Federated Paint Manufacturing Co. 1882 S Normal St, Chicago IL 60616 8*
Ferro Corp. Coatings Div. PO Box 6550, Cleveland OH 44101 73*
(continued)
B-4
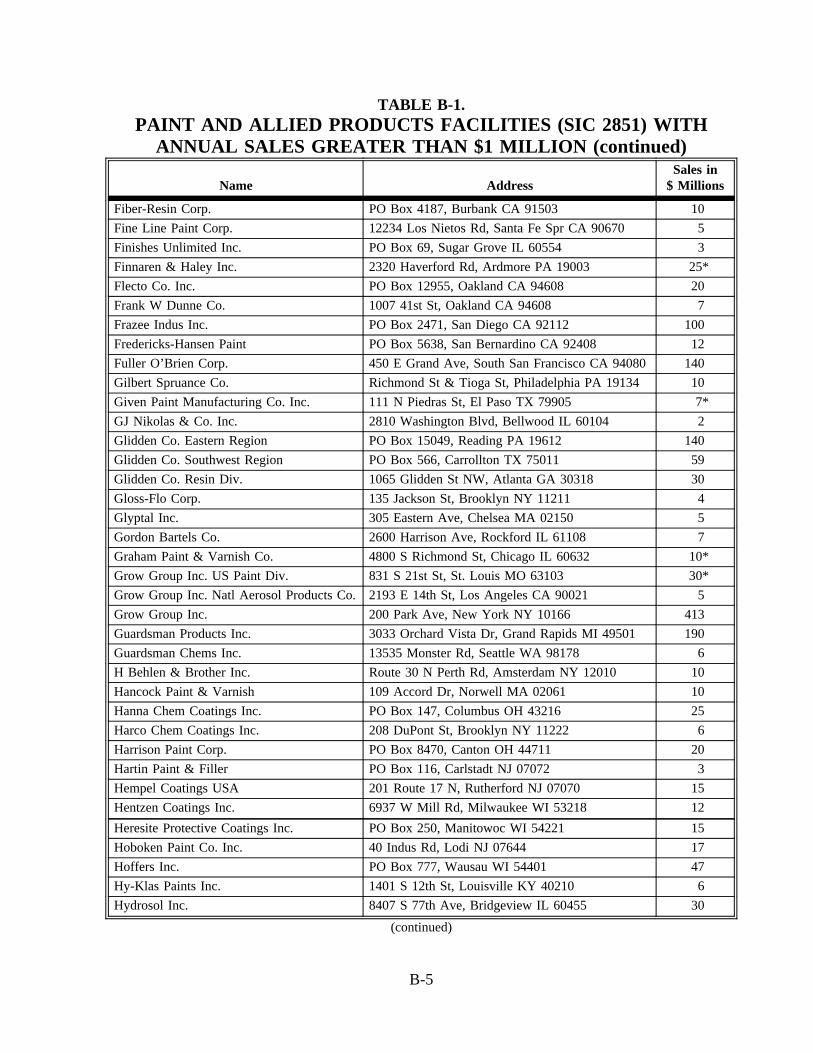
TABLE B-1.PAINT AND ALLIED PRODUCTS FACILITIES (SIC 2851) WITH
ANNUAL SALES GREATER THAN $1 MILLION (continued)
Name AddressSales in
$ Millions
Fiber-Resin Corp. PO Box 4187, Burbank CA 91503 10
Fine Line Paint Corp. 12234 Los Nietos Rd, Santa Fe Spr CA 90670 5
Finishes Unlimited Inc. PO Box 69, Sugar Grove IL 60554 3
Finnaren & Haley Inc. 2320 Haverford Rd, Ardmore PA 19003 25*
Flecto Co. Inc. PO Box 12955, Oakland CA 94608 20
Frank W Dunne Co. 1007 41st St, Oakland CA 94608 7
Frazee Indus Inc. PO Box 2471, San Diego CA 92112 100
Fredericks-Hansen Paint PO Box 5638, San Bernardino CA 92408 12
Fuller O’Brien Corp. 450 E Grand Ave, South San Francisco CA 94080 140
Gilbert Spruance Co. Richmond St & Tioga St, Philadelphia PA 19134 10
Given Paint Manufacturing Co. Inc. 111 N Piedras St, El Paso TX 79905 7*
GJ Nikolas & Co. Inc. 2810 Washington Blvd, Bellwood IL 60104 2
Glidden Co. Eastern Region PO Box 15049, Reading PA 19612 140
Glidden Co. Southwest Region PO Box 566, Carrollton TX 75011 59
Glidden Co. Resin Div. 1065 Glidden St NW, Atlanta GA 30318 30
Gloss-Flo Corp. 135 Jackson St, Brooklyn NY 11211 4
Glyptal Inc. 305 Eastern Ave, Chelsea MA 02150 5
Gordon Bartels Co. 2600 Harrison Ave, Rockford IL 61108 7
Graham Paint & Varnish Co. 4800 S Richmond St, Chicago IL 60632 10*
Grow Group Inc. US Paint Div. 831 S 21st St, St. Louis MO 63103 30*
Grow Group Inc. Natl Aerosol Products Co.2193 E 14th St, Los Angeles CA 90021 5
Grow Group Inc. 200 Park Ave, New York NY 10166 413
Guardsman Products Inc. 3033 Orchard Vista Dr, Grand Rapids MI 49501 190
Guardsman Chems Inc. 13535 Monster Rd, Seattle WA 98178 6
H Behlen & Brother Inc. Route 30 N Perth Rd, Amsterdam NY 12010 10
Hancock Paint & Varnish 109 Accord Dr, Norwell MA 02061 10
Hanna Chem Coatings Inc. PO Box 147, Columbus OH 43216 25
Harco Chem Coatings Inc. 208 DuPont St, Brooklyn NY 11222 6
Harrison Paint Corp. PO Box 8470, Canton OH 44711 20
Hartin Paint & Filler PO Box 116, Carlstadt NJ 07072 3
Hempel Coatings USA 201 Route 17 N, Rutherford NJ 07070 15
Hentzen Coatings Inc. 6937 W Mill Rd, Milwaukee WI 53218 12
Heresite Protective Coatings Inc. PO Box 250, Manitowoc WI 54221 15
Hoboken Paint Co. Inc. 40 Indus Rd, Lodi NJ 07644 17
Hoffers Inc. PO Box 777, Wausau WI 54401 47
Hy-Klas Paints Inc. 1401 S 12th St, Louisville KY 40210 6
Hydrosol Inc. 8407 S 77th Ave, Bridgeview IL 60455 30
(continued)
B-5
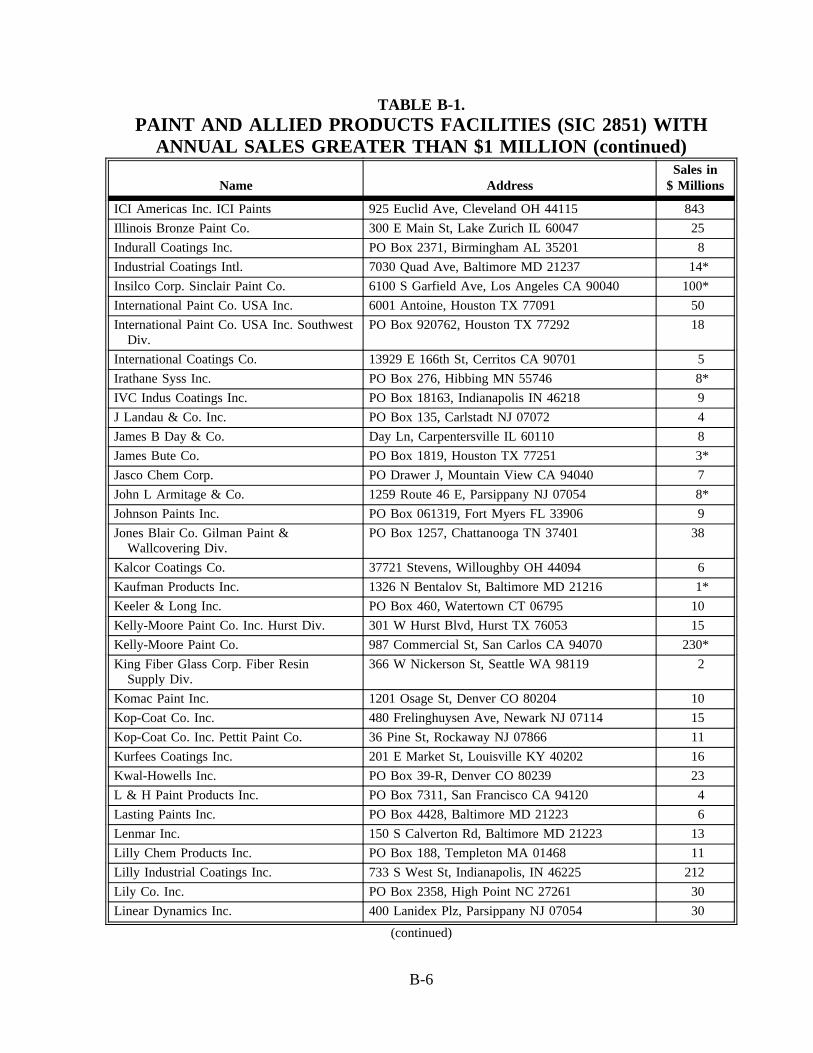
TABLE B-1.PAINT AND ALLIED PRODUCTS FACILITIES (SIC 2851) WITH
ANNUAL SALES GREATER THAN $1 MILLION (continued)
Name AddressSales in
$ Millions
ICI Americas Inc. ICI Paints 925 Euclid Ave, Cleveland OH 44115 843
Illinois Bronze Paint Co. 300 E Main St, Lake Zurich IL 60047 25
Indurall Coatings Inc. PO Box 2371, Birmingham AL 35201 8
Industrial Coatings Intl. 7030 Quad Ave, Baltimore MD 21237 14*
Insilco Corp. Sinclair Paint Co. 6100 S Garfield Ave, Los Angeles CA 90040 100*
International Paint Co. USA Inc. 6001 Antoine, Houston TX 77091 50
International Paint Co. USA Inc. SouthwestDiv.
PO Box 920762, Houston TX 77292 18
International Coatings Co. 13929 E 166th St, Cerritos CA 90701 5
Irathane Syss Inc. PO Box 276, Hibbing MN 55746 8*
IVC Indus Coatings Inc. PO Box 18163, Indianapolis IN 46218 9
J Landau & Co. Inc. PO Box 135, Carlstadt NJ 07072 4
James B Day & Co. Day Ln, Carpentersville IL 60110 8
James Bute Co. PO Box 1819, Houston TX 77251 3*
Jasco Chem Corp. PO Drawer J, Mountain View CA 94040 7
John L Armitage & Co. 1259 Route 46 E, Parsippany NJ 07054 8*
Johnson Paints Inc. PO Box 061319, Fort Myers FL 33906 9
Jones Blair Co. Gilman Paint &Wallcovering Div.
PO Box 1257, Chattanooga TN 37401 38
Kalcor Coatings Co. 37721 Stevens, Willoughby OH 44094 6
Kaufman Products Inc. 1326 N Bentalov St, Baltimore MD 21216 1*
Keeler & Long Inc. PO Box 460, Watertown CT 06795 10
Kelly-Moore Paint Co. Inc. Hurst Div. 301 W Hurst Blvd, Hurst TX 76053 15
Kelly-Moore Paint Co. 987 Commercial St, San Carlos CA 94070 230*
King Fiber Glass Corp. Fiber ResinSupply Div.
366 W Nickerson St, Seattle WA 98119 2
Komac Paint Inc. 1201 Osage St, Denver CO 80204 10
Kop-Coat Co. Inc. 480 Frelinghuysen Ave, Newark NJ 07114 15
Kop-Coat Co. Inc. Pettit Paint Co. 36 Pine St, Rockaway NJ 07866 11
Kurfees Coatings Inc. 201 E Market St, Louisville KY 40202 16
Kwal-Howells Inc. PO Box 39-R, Denver CO 80239 23
L & H Paint Products Inc. PO Box 7311, San Francisco CA 94120 4
Lasting Paints Inc. PO Box 4428, Baltimore MD 21223 6
Lenmar Inc. 150 S Calverton Rd, Baltimore MD 21223 13
Lilly Chem Products Inc. PO Box 188, Templeton MA 01468 11
Lilly Industrial Coatings Inc. 733 S West St, Indianapolis, IN 46225 212
Lily Co. Inc. PO Box 2358, High Point NC 27261 30
Linear Dynamics Inc. 400 Lanidex Plz, Parsippany NJ 07054 30
(continued)
B-6

TABLE B-1.PAINT AND ALLIED PRODUCTS FACILITIES (SIC 2851) WITH
ANNUAL SALES GREATER THAN $1 MILLION (continued)
Name AddressSales in
$ Millions
Lyle Van Patten Co. Inc. 321 W 135th St, Los Angeles CA 90061 3
MA Bruder & Sons Inc. PO Box 600, Broomall PA 19008 140*
Maas & Waldstein Co. 2121 McCarter Highway, Newark NJ 07104 15
MAB Paints Inc. 630 N 3rd St, Terre Haute IN 47808 32
Magruder Color Co. Inc. Radiant Color Div.PO Box 4019, Richmond CA 94804 30
Major Paint Co. 4300 W 190th St, Torrance CA 90509 65
Mansfield Paint Co. Inc. 169 W Longview Ave, Mansfield OH 44905 2
Martec Inc. 760 Aloha St, Seattle WA 98109 3
Martin-Senour Co. 101 Prospect Ave, Cleveland OH 44115 44*
Mautz Paint Co. PO Box 7068, Madison WI 53707 19
McCormick Paint Works Co. 2355 Lewis Ave, Rockville, MD 20851 18*
McWhorter-McCloskey Inc. 5501 E Slauson Ave, Los Angeles CA 90040 5
Mercury Paint Co. Inc. 14300 Schaefer Highway, Detroit MI 48227 18
Mid-States Paint Co. 9315 Watson Indus Park, St. Louis MO 63126 3
Midwest Lacquer Manufacturing Co. 9353 Seymour Ave, Schiller Par IL 60176 5
Midwest Paint Manufacturing Co. 2313 W River Rd N, Minneapolis MN 55411 2
Millmaster Onyx Group Inc. Mantrose-Haeuser Co.
500 Post Rd E, Westport CT 06880 15
Mobile Paint Manufacturing Co. 4775 Hamilton Blvd, Theodore AL 36582 45
Mohawk Finishing Products Route 30 N, Amsterdam NY 12010 35*
Moline Paint Manufacturing Co. 5400 23rd Ave, Moline IL 61265 17
Moling Paint Manufacturing 5400 23rd Ave, Moline IL 61265 125
Monarch Paint Co. PO Box 55604, Houston TX 77255 29*
Morton Intl Inc. Norris Paint/TMT PO Box 2023, Salem OR 97308 5
Muralo Co. Inc. PO Box 455, Bayonne NJ 07002 42
Muralo Co. Inc. Olympic Paint & ChemCo.
5928 S Garfield Ave, Los Angeles CA 90040 2*
N Siperstein Inc. 415 Montgomery St, Jersey City NJ 07302 40
National Paint Co. Inc. 3441 E 14th St, Los Angeles CA 90023 3
National Lacquer & Paint Co. 7415 S Green St, Chicago IL 60621 2
Nelson Tech Coatings Inc. 2147 N Tyler Ave, South El Mon CA 91733 2
New York Bronze Powder Co. Inc. 519 Dowd Ave, Elizabeth NJ 07201 30
Niles Chem Paint Co. PO Box 307, Niles MI 49120 16*
Norton & Son Inc. 148 E 5th St, Bayonne NJ 07002 15*
Nu-Brite Chem Co. Inc. Kyanize Paints 2nd & Boston St, Everett MA 02149 20
O’Brien Corp. 450 E Grand Ave, South San Francisco CA 94080 150*
O’Brien Corp. Powder Coatings Div. 5300 Sunrise Rd, Houston TX 77021 40
O’Brien Corp. Southeast Region PO Box 864, Brunswick GA 31521 11*
(continued)
B-7
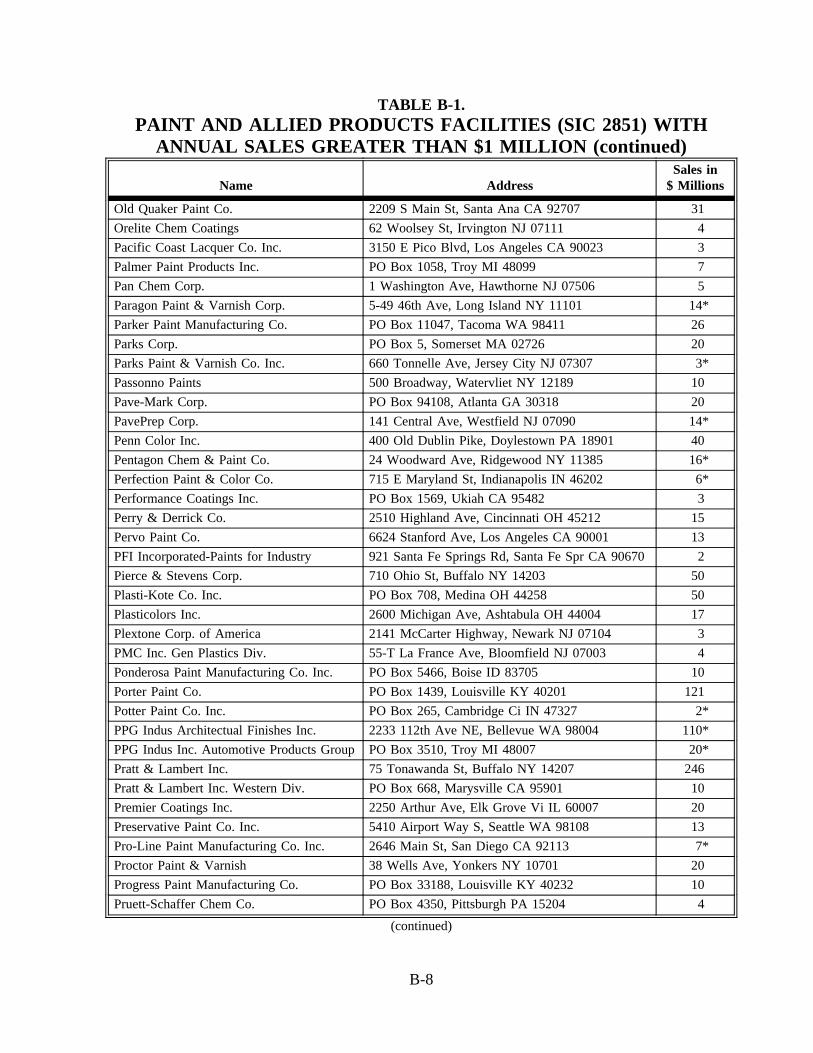
TABLE B-1.PAINT AND ALLIED PRODUCTS FACILITIES (SIC 2851) WITH
ANNUAL SALES GREATER THAN $1 MILLION (continued)
Name AddressSales in
$ Millions
Old Quaker Paint Co. 2209 S Main St, Santa Ana CA 92707 31
Orelite Chem Coatings 62 Woolsey St, Irvington NJ 07111 4
Pacific Coast Lacquer Co. Inc. 3150 E Pico Blvd, Los Angeles CA 90023 3
Palmer Paint Products Inc. PO Box 1058, Troy MI 48099 7
Pan Chem Corp. 1 Washington Ave, Hawthorne NJ 07506 5
Paragon Paint & Varnish Corp. 5-49 46th Ave, Long Island NY 11101 14*
Parker Paint Manufacturing Co. PO Box 11047, Tacoma WA 98411 26
Parks Corp. PO Box 5, Somerset MA 02726 20
Parks Paint & Varnish Co. Inc. 660 Tonnelle Ave, Jersey City NJ 07307 3*
Passonno Paints 500 Broadway, Watervliet NY 12189 10
Pave-Mark Corp. PO Box 94108, Atlanta GA 30318 20
PavePrep Corp. 141 Central Ave, Westfield NJ 07090 14*
Penn Color Inc. 400 Old Dublin Pike, Doylestown PA 18901 40
Pentagon Chem & Paint Co. 24 Woodward Ave, Ridgewood NY 11385 16*
Perfection Paint & Color Co. 715 E Maryland St, Indianapolis IN 46202 6*
Performance Coatings Inc. PO Box 1569, Ukiah CA 95482 3
Perry & Derrick Co. 2510 Highland Ave, Cincinnati OH 45212 15
Pervo Paint Co. 6624 Stanford Ave, Los Angeles CA 90001 13
PFI Incorporated-Paints for Industry 921 Santa Fe Springs Rd, Santa Fe Spr CA 90670 2
Pierce & Stevens Corp. 710 Ohio St, Buffalo NY 14203 50
Plasti-Kote Co. Inc. PO Box 708, Medina OH 44258 50
Plasticolors Inc. 2600 Michigan Ave, Ashtabula OH 44004 17
Plextone Corp. of America 2141 McCarter Highway, Newark NJ 07104 3
PMC Inc. Gen Plastics Div. 55-T La France Ave, Bloomfield NJ 07003 4
Ponderosa Paint Manufacturing Co. Inc. PO Box 5466, Boise ID 83705 10
Porter Paint Co. PO Box 1439, Louisville KY 40201 121
Potter Paint Co. Inc. PO Box 265, Cambridge Ci IN 47327 2*
PPG Indus Architectual Finishes Inc. 2233 112th Ave NE, Bellevue WA 98004 110*
PPG Indus Inc. Automotive Products GroupPO Box 3510, Troy MI 48007 20*
Pratt & Lambert Inc. 75 Tonawanda St, Buffalo NY 14207 246
Pratt & Lambert Inc. Western Div. PO Box 668, Marysville CA 95901 10
Premier Coatings Inc. 2250 Arthur Ave, Elk Grove Vi IL 60007 20
Preservative Paint Co. Inc. 5410 Airport Way S, Seattle WA 98108 13
Pro-Line Paint Manufacturing Co. Inc. 2646 Main St, San Diego CA 92113 7*
Proctor Paint & Varnish 38 Wells Ave, Yonkers NY 10701 20
Progress Paint Manufacturing Co. PO Box 33188, Louisville KY 40232 10
Pruett-Schaffer Chem Co. PO Box 4350, Pittsburgh PA 15204 4
(continued)
B-8

TABLE B-1.PAINT AND ALLIED PRODUCTS FACILITIES (SIC 2851) WITH
ANNUAL SALES GREATER THAN $1 MILLION (continued)
Name AddressSales in
$ Millions
Pyrolac Corp. 55 Schoon Ave, Hawthorne NJ 07506 4*
Quality Coatings Inc. 1700 N State, Chandler IN 47610 2
Raffi & Swanson Inc. 100 Eames St, Wilmington MA 01887 15
Randolph Products Co. Park Place E, Carlstadt NJ 07072 9
Red Spot Paint Varnish Co. Red SpotWestland Inc.
550 S Edwin St, Westland MI 48185 15
Red Spot Paint Varnish Co. PO Box 418, Evansville IN 47703 56
Reliable Coatings Inc. 13108 Euless St, Euless TX 76040 14*
Republic Clear Thru Corp. 211 63rd St, Brooklyn NY 11220 6
Republic Powdered Metals Inc. PO Box 777, Median OH 44258 15
Riley Bros Inc. 860 Washington Ave, Burlington IA 52601 3
River Valley Coatings Inc. PO Box 580, Aurora IL 60507 2*
Riverside Labs Inc. 411 Union St, Geneva IL 60134 3*
RJ McGlennon Co. Inc. 198 Utah St, San Francisco CA 94103 3
Roymal Inc. Route 103, Newport NH 03773 4
RPM Inc. PO Box 777, Medina OH 44258 380
Rudd Co. Inc. 1630 15th Ave W, Seattle WA 98119 10
Rust-Oleum Corp. 11 Hawthorne Parkway, Vernon Hills IL 60061 89
Rutland Fire Clay Co. PO Box 340, Rutland VT 05702 2
Sampson Paint Manufacturing Co. 1900 Ellen Rd, Richmond VA 23224 42
Sampson Coatings Inc. PO Box 6625, Richmond VA 23230 9
Sandstrom Products Co. 218 S High, Port Byron IL 61275 7
Saxon Paint & Home Care Centers Inc.Dreeblan Paint Co.
3729 W 49th St, Chicago IL 60632 15*
Schalk Chems Inc. 2400 Vauxhall Rd, Union NJ 07083 7
Scott Paint Corp. 5940 Palmer Blvd, Sarasota FL 34232 16*
Seagrave Coatings Corp. Clover Leaf Paint& Varnish
320 Paterson Plank Rd, Carlstadt NJ 07072 14*
Seaside Inc. PO Box 2809, Long Beach CA 90801 3
Seibert-Oxidermo Inc. 6455 Strong Ave, Detroit MI 48211 11
SEM Products Inc. 120 Sem Ln, Belmont CA 94002 7
Sentry Paint Technologies Inc. 237 Mill St, Darby PA 19023 10
Seymour of Sycamore Inc. 917 Crosby Ave, Sycamore IL 60178 10
Sheboygan Paint Co. PO Box 417, Sheboygan WI 53082 12
Sheffield Bronze Paint Corp. 17814 S. Waterloo Rd, Cleveland OH 44119 3
Sherwin-Williams Co. 101 Prospect Ave NW, Cleveland OH 44115 2,124
Sherwin-Williams Co. Automotive Div. 101 Prospect Ave NW, Cleveland OH 44115 160
Sherwin-Williams Co. Consumer Div. 101 Prospect Ave NW, Cleveland OH 44115 170*
(continued)
B-9
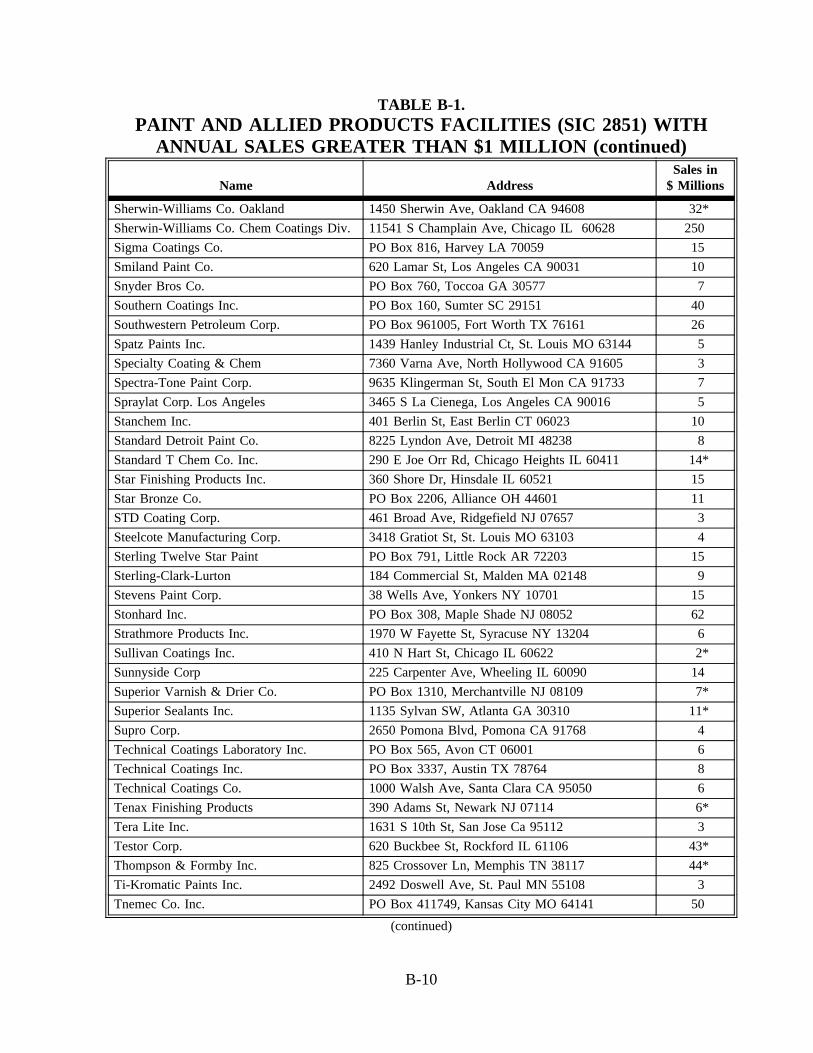
TABLE B-1.PAINT AND ALLIED PRODUCTS FACILITIES (SIC 2851) WITH
ANNUAL SALES GREATER THAN $1 MILLION (continued)
Name AddressSales in
$ Millions
Sherwin-Williams Co. Oakland 1450 Sherwin Ave, Oakland CA 94608 32*
Sherwin-Williams Co. Chem Coatings Div. 11541 S Champlain Ave, Chicago IL 60628 250
Sigma Coatings Co. PO Box 816, Harvey LA 70059 15
Smiland Paint Co. 620 Lamar St, Los Angeles CA 90031 10
Snyder Bros Co. PO Box 760, Toccoa GA 30577 7
Southern Coatings Inc. PO Box 160, Sumter SC 29151 40
Southwestern Petroleum Corp. PO Box 961005, Fort Worth TX 76161 26
Spatz Paints Inc. 1439 Hanley Industrial Ct, St. Louis MO 63144 5
Specialty Coating & Chem 7360 Varna Ave, North Hollywood CA 91605 3
Spectra-Tone Paint Corp. 9635 Klingerman St, South El Mon CA 91733 7
Spraylat Corp. Los Angeles 3465 S La Cienega, Los Angeles CA 90016 5
Stanchem Inc. 401 Berlin St, East Berlin CT 06023 10
Standard Detroit Paint Co. 8225 Lyndon Ave, Detroit MI 48238 8
Standard T Chem Co. Inc. 290 E Joe Orr Rd, Chicago Heights IL 60411 14*
Star Finishing Products Inc. 360 Shore Dr, Hinsdale IL 60521 15
Star Bronze Co. PO Box 2206, Alliance OH 44601 11
STD Coating Corp. 461 Broad Ave, Ridgefield NJ 07657 3
Steelcote Manufacturing Corp. 3418 Gratiot St, St. Louis MO 63103 4
Sterling Twelve Star Paint PO Box 791, Little Rock AR 72203 15
Sterling-Clark-Lurton 184 Commercial St, Malden MA 02148 9
Stevens Paint Corp. 38 Wells Ave, Yonkers NY 10701 15
Stonhard Inc. PO Box 308, Maple Shade NJ 08052 62
Strathmore Products Inc. 1970 W Fayette St, Syracuse NY 13204 6
Sullivan Coatings Inc. 410 N Hart St, Chicago IL 60622 2*
Sunnyside Corp 225 Carpenter Ave, Wheeling IL 60090 14
Superior Varnish & Drier Co. PO Box 1310, Merchantville NJ 08109 7*
Superior Sealants Inc. 1135 Sylvan SW, Atlanta GA 30310 11*
Supro Corp. 2650 Pomona Blvd, Pomona CA 91768 4
Technical Coatings Laboratory Inc. PO Box 565, Avon CT 06001 6
Technical Coatings Inc. PO Box 3337, Austin TX 78764 8
Technical Coatings Co. 1000 Walsh Ave, Santa Clara CA 95050 6
Tenax Finishing Products 390 Adams St, Newark NJ 07114 6*
Tera Lite Inc. 1631 S 10th St, San Jose Ca 95112 3
Testor Corp. 620 Buckbee St, Rockford IL 61106 43*
Thompson & Formby Inc. 825 Crossover Ln, Memphis TN 38117 44*
Ti-Kromatic Paints Inc. 2492 Doswell Ave, St. Paul MN 55108 3
Tnemec Co. Inc. PO Box 411749, Kansas City MO 64141 50
(continued)
B-10

TABLE B-1.PAINT AND ALLIED PRODUCTS FACILITIES (SIC 2851) WITH
ANNUAL SALES GREATER THAN $1 MILLION (continued)
Name AddressSales in
$ Millions
Touraine Paints Inc. 1760 Revere Beach Parkway, Everett MA 02149 17
Tower Paint Manufacturing 620 W 27th St, Hialeah FL 33010 10
Trail Chem Corp. 9904 Gidley St, El Monte CA 91731 4
Triangle Coatings Inc. 1930 Fairway Dr, San Leandro CA 94577 5
United Paint & Chem Corp. 24671 Telegraph Rd, Southfield MI 48034 11*
United Coatings Inc. 2850 Festival Dr, Kankakee IL 60901 65
United Paint Co. 404 E Mallory, Memphis TN 38109 25
United Gilsonite Labs PO Box 70, Scranton PA 18501 22*
Universal Paint Corp. PO Box 1218, La Puente CA 91749 20
Universal Chems & Coatings Inc. 1975 Fox Ln, Elgin IL 60123 10
Universe Paint Co. PO Box 668, Marysville CA 95901 3*
Valspar Corp. MCI Quality Coatings 6110 Gunn Highway, Tampa FL 33625 12
Valspar Corp. Colony Paints Div. PO Box 418037, Kansas City MO 64141 15
Valspar Corp. 1101 S 3rd St, Minneapolis MN 55415 527
Valspar Corp. Masury Paint Co. 1401 Severn St, Baltimore MD 21230 8
Vanex Color Inc. 1700 Shawnee St, Mount Vernon IL 62864 4
VJ Dolan & Co. Inc. 1830 N Laramie Ave, Chicago IL 60639 5
Vogel Paint & Wax Inc. Marwin Paints Inc.2100 N 2nd St, Minneapolis MN 55411 8*
Vogel Paint & Wax Inc. Industrial Air Park Rd., Orange City IA 51041 100
Voplex Corp. Allerton Chem Div. 763 Linden Ave, Rochester NY 14625 1
Waterlox Chem & Coatings Corp. 9808 Meech Ave, Cleveland OH 44105 4
Watson-Standard Co. Jordan PaintManufacturing Co.
7250 Franklin St, Forest Park IL 60130 4
Watson-Standard Co. PO Box 11250, Pittsburgh PA 15238 29*
Wattyl Group Precision Paint Group 5275 Peachtree, Atlanta GA 30341 15
WC Richards Co. Inc. 3555 W 123rd St, Blue Island IL 60406 15*
Welco Manufacturing Co. Inc. 1225 Ozark St, North Kansas MO 64116 10
Wellborn Paint Manufacturing Co. 215 Rossmoor Rd SW, Albuquerque NM 87102 15
Western Automotive Finishes 1450 Ave R, Grand Prairi TX 75050 17*
Westfield Coatings Corp. PO Box 815, Westfiled MA 01086 7
Westinghouse Elec Corp. InsulatingMaterials Div.
Route 993, Manor PA 15665 15
Whittaker Corp. Whittaker Decatur CoatingsPO Box 2238, Decatur AL 35602 12*
William Zinsser & Co. 31 Belmont Dr, Somerset NJ 08873 16
Wiltech Corp. PO Box 517, Longview WA 98632 2
Wisconsin Protective Coatings Corp. PO Box 216, Green Bay WI 54305 10
WM Barr & Co. Inc. PO Box 1879, Memphis TN 38113 95
Yenkin Majestic Paint Corp. PO Box 369004, Columbus OH 43236 80
(continued)
B-11
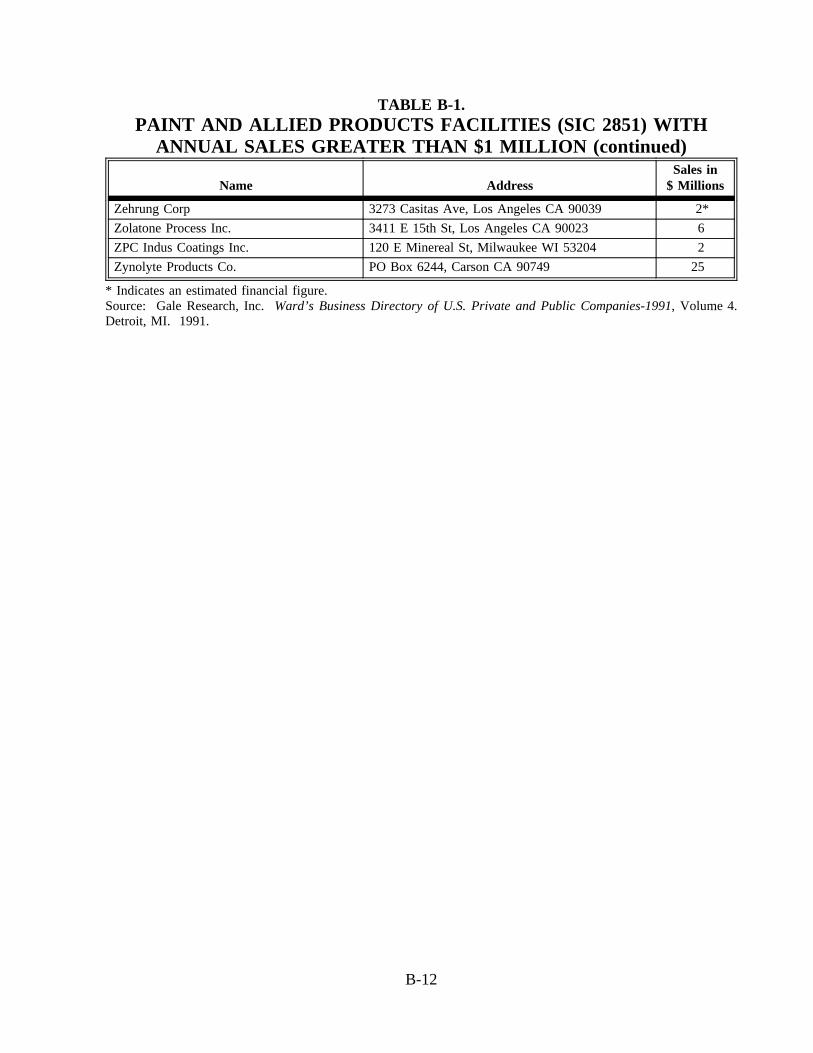
TABLE B-1.PAINT AND ALLIED PRODUCTS FACILITIES (SIC 2851) WITH
ANNUAL SALES GREATER THAN $1 MILLION (continued)
Name AddressSales in
$ Millions
Zehrung Corp 3273 Casitas Ave, Los Angeles CA 90039 2*
Zolatone Process Inc. 3411 E 15th St, Los Angeles CA 90023 6
ZPC Indus Coatings Inc. 120 E Minereal St, Milwaukee WI 53204 2
Zynolyte Products Co. PO Box 6244, Carson CA 90749 25
* Indicates an estimated financial figure.Source: Gale Research, Inc.Ward’s Business Directory of U.S. Private and Public Companies-1991, Volume 4.Detroit, MI. 1991.
B-12
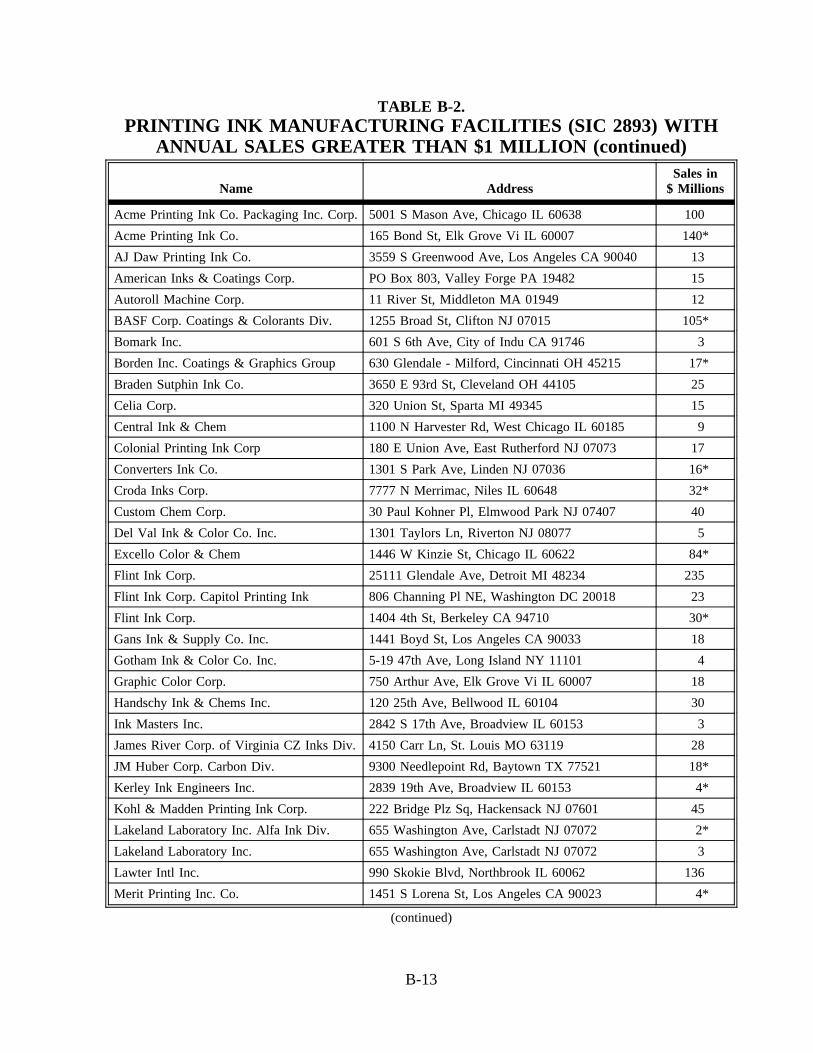
TABLE B-2.PRINTING INK MANUFACTURING FACILITIES (SIC 2893) WITH
ANNUAL SALES GREATER THAN $1 MILLION (continued)
Name AddressSales in
$ Millions
Acme Printing Ink Co. Packaging Inc. Corp.5001 S Mason Ave, Chicago IL 60638 100
Acme Printing Ink Co. 165 Bond St, Elk Grove Vi IL 60007 140*
AJ Daw Printing Ink Co. 3559 S Greenwood Ave, Los Angeles CA 90040 13
American Inks & Coatings Corp. PO Box 803, Valley Forge PA 19482 15
Autoroll Machine Corp. 11 River St, Middleton MA 01949 12
BASF Corp. Coatings & Colorants Div. 1255 Broad St, Clifton NJ 07015 105*
Bomark Inc. 601 S 6th Ave, City of Indu CA 91746 3
Borden Inc. Coatings & Graphics Group 630 Glendale - Milford, Cincinnati OH 45215 17*
Braden Sutphin Ink Co. 3650 E 93rd St, Cleveland OH 44105 25
Celia Corp. 320 Union St, Sparta MI 49345 15
Central Ink & Chem 1100 N Harvester Rd, West Chicago IL 60185 9
Colonial Printing Ink Corp 180 E Union Ave, East Rutherford NJ 07073 17
Converters Ink Co. 1301 S Park Ave, Linden NJ 07036 16*
Croda Inks Corp. 7777 N Merrimac, Niles IL 60648 32*
Custom Chem Corp. 30 Paul Kohner Pl, Elmwood Park NJ 07407 40
Del Val Ink & Color Co. Inc. 1301 Taylors Ln, Riverton NJ 08077 5
Excello Color & Chem 1446 W Kinzie St, Chicago IL 60622 84*
Flint Ink Corp. 25111 Glendale Ave, Detroit MI 48234 235
Flint Ink Corp. Capitol Printing Ink 806 Channing Pl NE, Washington DC 20018 23
Flint Ink Corp. 1404 4th St, Berkeley CA 94710 30*
Gans Ink & Supply Co. Inc. 1441 Boyd St, Los Angeles CA 90033 18
Gotham Ink & Color Co. Inc. 5-19 47th Ave, Long Island NY 11101 4
Graphic Color Corp. 750 Arthur Ave, Elk Grove Vi IL 60007 18
Handschy Ink & Chems Inc. 120 25th Ave, Bellwood IL 60104 30
Ink Masters Inc. 2842 S 17th Ave, Broadview IL 60153 3
James River Corp. of Virginia CZ Inks Div.4150 Carr Ln, St. Louis MO 63119 28
JM Huber Corp. Carbon Div. 9300 Needlepoint Rd, Baytown TX 77521 18*
Kerley Ink Engineers Inc. 2839 19th Ave, Broadview IL 60153 4*
Kohl & Madden Printing Ink Corp. 222 Bridge Plz Sq, Hackensack NJ 07601 45
Lakeland Laboratory Inc. Alfa Ink Div. 655 Washington Ave, Carlstadt NJ 07072 2*
Lakeland Laboratory Inc. 655 Washington Ave, Carlstadt NJ 07072 3
Lawter Intl Inc. 990 Skokie Blvd, Northbrook IL 60062 136
Merit Printing Inc. Co. 1451 S Lorena St, Los Angeles CA 90023 4*
(continued)
B-13

TABLE B-2.PRINTING INK MANUFACTURING FACILITIES (SIC 2893) WITH
ANNUAL SALES GREATER THAN $1 MILLION (continued)
Name AddressSales in
$ Millions
Midland Color Co. 651 Bonnie Ln, Elk Grove Vi IL 60007 85
Miller-Cooper Co. 1601 Prospect Ave, Kansas City MO 64127 6
Morrison Printing Ink Co. 4801 W 160th St, Cleveland OH 44135 14*
Naz-Dar Co. 1087 N Northbranch St, Chicago IL 60622 15*
Nor-Cote Intl Inc. PO Box 668, Crawfordsville IN 47933 5
North American Printing Ink 1524 David Rd, Elgin IL 60123 14
Northern Printing Ink Corp. 8360 10th Ave N, Minneapolis MN 55427 8
Polypore Inc. 4601 S 3rd Ave, Tucson AZ 85714 10
Polytex Color & Chem 820 E 140th St, Bronx NY 10454 3
PPG Indus Inc. PPG Ink Products Co. 1835 Airport Exchange Blvd, Covington KY 41018 15
Rexart Chem Corp. 1183 Westside Ave, Jersey City NJ 07306 6*
Ron Ink Co. Inc. 61 Halstead St, Rochester NY 14610 7
Sicpa Indus of America Inc. 8000 Research Way, Springfield VA 22153 25
Sinclair & Valentine LP 2520 Pilot Knob Rd, St. Paul MN 55120 186
Sun Chem Corp. PO Box 1302, Fort Lee NJ 07024 1,100
Sun Chem Corp. Gen. Printing Ink Div. 135 W Lake St, Northlake IL 60164 410*
Superior Printing Ink Co. Inc. 70 Bethune St, New York NY 10014 50
United States Printing Ink Corp. Leber InkDiv.
PO Box 88700, Seattle WA 98138 6
United States Printing Ink Corp. 343 Murray Hill Pkwy, East Rutherford NJ 07073 65
Van Son Holland Corp. of America 92 Union St, Mineola NY 11501 42
Vivitone Inc. 110 E 27th St, Paterson NJ 07514 8
Walter W Lawrence 9715 Alpaca St, South El Mon CA 91733 1
Wikoff Color Corp. PO Box W, Fort Mill SC 29715 45*
*Indicates an estimated financial figure.Source: Gale Research, Inc.Ward’s Business Directory of U.S. Private and Public Companies-1991, Volume 4.Detroit, MI. 1991.
B-14

TABLE B-3.PRINTING AND PUBLISHING FACILITIES (SIC 27) WITHANNUAL SALES GREATER THAN $1 MILLION (continued)
Company LocationSales in
$ Millions
(SIC 2711) Newspapers
Advance Publications Inc. Staten Island, NY 2,200*
Affiliated Publications Inc. Boston, MA 542
Chicago Tribune Co. Chicago, IL 500
Cox Enterprises Inc. Atlanta, GA 1,970
Dow Jones & Co. Inc. Washington, DC 1,444
EW Scripps Co. Wilmington, DE 1,266
Freedom Newspapers Inc. Irvine, CA 500
Gannett Co. Inc. Arlington, VA 3,518
Hearst Corp. New York, NY 1,900*
Ingersoll Publications Co. Princeton, NJ 1,010*
Knight-Ridder Inc. Miami, FL 2,268
Media Gen Inc. Richmond, VA 606
New York Times Co. New York, NY 1,769
News America Publishing Inc. New York, NY 3,000
Thomson Newspapers Corp. Des Plaines, IL 550*
Times Mirro Co. Los Angeles, CA 3,475
Tribune Co. Chicago, IL 2,455
(SIC 2721) Periodicals
ABC Publishing New York, NY 310*
Billboard Publications Inc. New York, NY 100
BPI Communications Inc. New York, NY 105
Cahners Publishing Co. New York Magazine Div.New York, NY 102
Chilton Co. Radnor, PA 150
CMP Publications Inc. Manhasset, NY 187*
Conde Nast Publications Inc. New York, NY 280*
(continued)
B-15

TABLE B-3.PRINTING AND PUBLISHING FACILITIES (SIC 27) WITHANNUAL SALES GREATER THAN $1 MILLION (continued)
Company LocationSales in
$ Millions
Crain Communicating Inc. Chicago, IL 145
Diamonds Communications Inc. New York, NY 470*
Edgell Communications Inc. Cleveland, OH 205
Forbes Inc. New York, NY 200
International Data Group Inc. Framingham, MA 500
Meredith Corp. Des Moines, IA 792
Meredith Corp. Ladies’ Home Journal New York, NY 100
National Enquirer Inc. Lantana, FL 180
National Geographic Soc. Washington, DC 425
Newsweek Inc. New York, NY 256
Official Airline Guides Inc. Oak Brook, IL 130*
Penthouse Intl. Ltd. New York, NY 160*
Penton Publishing Inc. Cleveland, OH 151
Peterson Publishing Co. Los Angeles, CA 140*
Playboy Enterprises Inc. Chicago, IL 160
Reader’s Digest Assn. Inc. Pleasantville, NY 1,832
Reed Publishing (USA) Inc. Cahners PublishingCo.
Newton, MA 430
Reed Publishing (USA) Inc. Newton, MA 600
Rodale Press Inc. Emmaus, PA 150*
Scholastic Inc. New York, NY 250*
Simon & Shuster Inc. Bur of Bus Practice Waterford, CT 100*
Standard & Poor’s Corp. New York, NY 260*
Thompson Corp. Thompson Bus. Info. Stamford, CT 160*
Time Inc. Magazine Co. New York, NY 1,500*
Times Mirror Magazines Inc. New York, NY 470*
(continued)
B-16

TABLE B-3.PRINTING AND PUBLISHING FACILITIES (SIC 27) WITHANNUAL SALES GREATER THAN $1 MILLION (continued)
Company LocationSales in
$ Millions
Trader Publications Inc. Clearwater, FL 270*
US News & World Report Inc. New York, NY 140*
Warren Gorham & Lamont Inc. New York, NY 130
Whittle Communications Inc. Knoxville, TN 210*
Ziff Communications Co. New York, NY 340*
Ziff Communications Co. Zif-Davis PublishingCo.
New York, NY 160*
(SIC 2731) Book Publishing
Addison-Wesley Publishing Co. Reading, MA 120*
Bantam Doubleday Dell Publishing Group Inc. New York, NY 180*
David C. Cook Publishing Co. Elgin, IL 100
Encyclopedia Britannica Inc. Chicago, IL 624
Field Publications Middletown, CT 100*
Grolier Inc. Danbury, CT 440*
Harcourt Brace Jovanovich Inc. Orlando, FL 1,341
Harper Collins Publishers Inc. New York, NY 450
Houghton Mifflin Co. Boston, MA 370
Insilco Corp. Midland, TX 450*
John Wiley & Sons Inc. New York, NY 282
Lawyers Co-Operative Publishing Co. Inc. Rochester, NY 150*
Macmillan Inc. New York, NY 950*
Macmillan Inc. Info Svcs & Instruction New York, NY 416
MacMillan Intl. Inc. New York, NY 146*
Macmillan-McGraw-Hill School Publishing Co.School Div.
New York, NY 200
(continued)
B-17
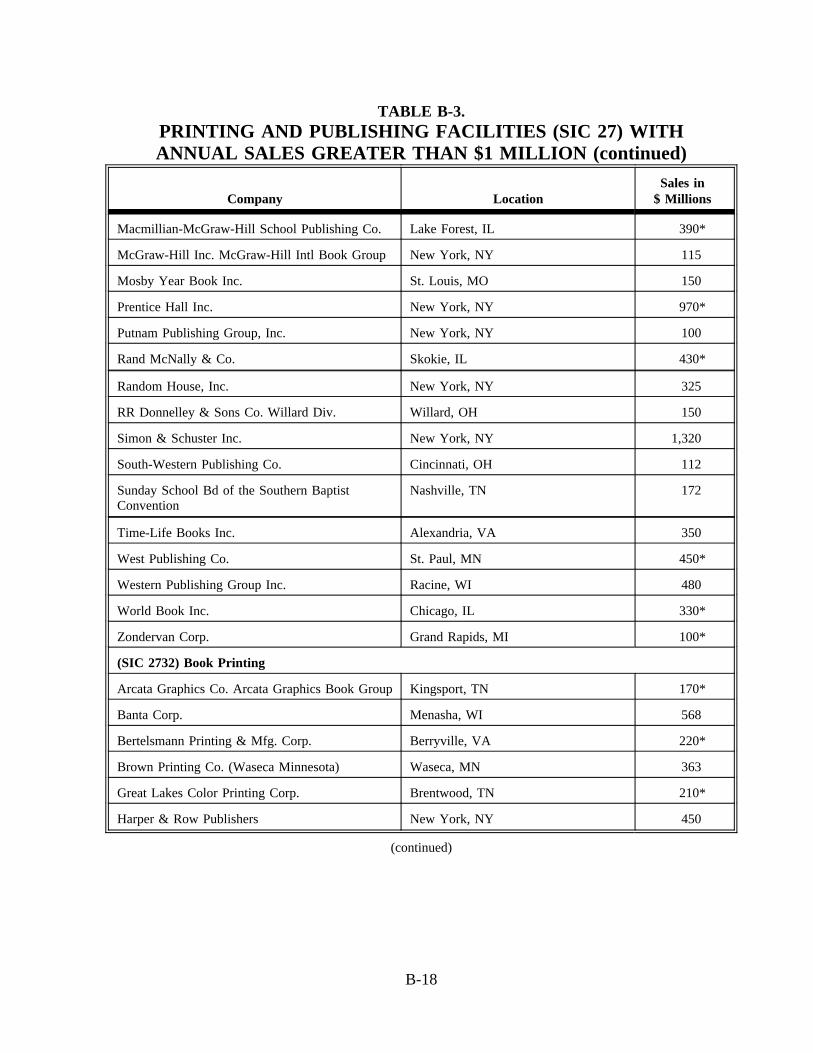
TABLE B-3.PRINTING AND PUBLISHING FACILITIES (SIC 27) WITHANNUAL SALES GREATER THAN $1 MILLION (continued)
Company LocationSales in
$ Millions
Macmillian-McGraw-Hill School Publishing Co. Lake Forest, IL 390*
McGraw-Hill Inc. McGraw-Hill Intl Book Group New York, NY 115
Mosby Year Book Inc. St. Louis, MO 150
Prentice Hall Inc. New York, NY 970*
Putnam Publishing Group, Inc. New York, NY 100
Rand McNally & Co. Skokie, IL 430*
Random House, Inc. New York, NY 325
RR Donnelley & Sons Co. Willard Div. Willard, OH 150
Simon & Schuster Inc. New York, NY 1,320
South-Western Publishing Co. Cincinnati, OH 112
Sunday School Bd of the Southern BaptistConvention
Nashville, TN 172
Time-Life Books Inc. Alexandria, VA 350
West Publishing Co. St. Paul, MN 450*
Western Publishing Group Inc. Racine, WI 480
World Book Inc. Chicago, IL 330*
Zondervan Corp. Grand Rapids, MI 100*
(SIC 2732) Book Printing
Arcata Graphics Co. Arcata Graphics Book GroupKingsport, TN 170*
Banta Corp. Menasha, WI 568
Bertelsmann Printing & Mfg. Corp. Berryville, VA 220*
Brown Printing Co. (Waseca Minnesota) Waseca, MN 363
Great Lakes Color Printing Corp. Brentwood, TN 210*
Harper & Row Publishers New York, NY 450
(continued)
B-18

TABLE B-3.PRINTING AND PUBLISHING FACILITIES (SIC 27) WITHANNUAL SALES GREATER THAN $1 MILLION (continued)
Company LocationSales in
$ Millions
Jostens Inc. Printing & Publishing Div. Minneapolis, MN 121
RR Donnelley & Sons Co. Chicago, IL 3,122
(SIC 2741) Misc Publishing
Commerce Clearing House Inc. Riverwoods, IL 678
Donnelley Directory New York, NY 1,300*
GTE Telephone Operations Inc. GTE DirectoriesCorp.
Dallas-Fort, TX 360*
McGraw-Hill Info. Svcs. Co. New York, NY 668
NYNEX Info Resources Co. Middleton, MA 800
RL Polk & Co. Detroit, MI 280
Simplicity Holdings, Inc. New York, NY 110*
Simplicity Pattern Co. New York, NY 101
Southwestern Bell Yellow Pages Inc. St. Louis, MO 240*
Southwestern Bell Publications Inc. St. Louis, MO 280*
U.S. West Direct (U.S. West MarketingResources Group Inc.)
Aurora, CO 160*
Wonderland Music Co. Inc. Burbank, CA 200*
(SIC 2752) Commercial Printing-Lithographic
American Signature Graphics Foote & DaviesDiv.
Atlanta, GA 195
American Bank Stationary Co. Baltimore, MD 110*
Avery Intl Corp. Avery Label Co. Azusa, CA 110*
Graphic Controls Corp. Buffalo, NY 140
Graphisphere Corp. Des Plaines, IL 110
HS Crocker Co. Inc. South San Francisco, CA 140*
Judd’s Inc. Washington, DC 114
NMG Inc. Los Angeles, CA 105
(continued)
B-19

TABLE B-3.PRINTING AND PUBLISHING FACILITIES (SIC 27) WITHANNUAL SALES GREATER THAN $1 MILLION (continued)
Company LocationSales in
$ Millions
Perry Printing Corp. Waterloo, WI 175
Quebecor Printing (USA) Inc. St. Paul, MN 770
Queens Group Inc. Long Island, NY 100
Ringler America Inc. Itasca, IL 700
RR Donnelley & Sons Co. Mattoon Mfg. Div. Mattoon, IL 110*
RR Donnelley & Sons Co. Lancaster Mfg. Div. Lancaster, PA 190*
Shea Communications Co. Louisville, KY 120
Taylor Corp. Mankato, MN 540*
Treasure Chest Advertising Co. Inc. Glendora, CA 550*
Valassis Inserts Inc. Livonia, MI 400*
World Color Press Inc. Effingham, IL 650
(SIC 2754) Commercial Printing-Gravure
All-State Legal Supply Co. Cranford, NJ 43
Arcata Graphics Co. Baltimore, MD 500*
Beck Co. (Langhorne Pennsylvania) W, Langhorne, PA 10
Clark Printing Co. Inc. North Kansas, MO 14*
ColorArt Inc. St. Louis, MO 30
Dennison Mfg. Co. IPC Dennison Co. Rogersville, TN 60
Dinagraphics Inc. Cincinnati, OH 20
Golden Belt Mfg. Co. Durham, NC 70
Graphic Ctr. Cos. Inc. Blake Printery St. San Luis Obi, CA 11
International Label Co. Clarksville, TN 30
JW Fergusson & Sons Richmond, VA 34
Maxwell Communications Corp. Atglen Atglen, PA 50*
McCleery-Cumming Co. Washington, IA 22
(continued)
B-20

TABLE B-3.PRINTING AND PUBLISHING FACILITIES (SIC 27) WITHANNUAL SALES GREATER THAN $1 MILLION (continued)
Company LocationSales in
$ Millions
Meredith-Burda Corp. Des Moines, IA 500
Perry Printing Corp. Norway Div. Norway, MI 25*
Printing House Inc. (Quincy Florida) Quincy, FL 24
Ringier America Inc. Corinth Div. Corinth, MS 80
Sheridan Press Hanover, PA 15
Southern Gravure Svc. Inc. Louisville, KY 58*
Stevens Graphics Inc. Atlanta, GA 150
Technographic Inc. Decotone Lexington, SC 30
World Color Press Inc. Salem Gravure Div. Salem, IL 80
(SIC 2759) Commercial Printing Nec
Alden Press Inc. Elk Grove Village, IL 170*
Avery Intl. Corp. Soabar Products Group Philadelphia, PA 100*
Bowne & Co. Inc. New York, NY 190
Curtis 1000 Inc. Atlanta, GA 160*
Data Documents Inc. (Omaha) Omaha, NE 200
Deluxe Corp. St. Paul, MN 1,316
Duplex Products Inc. Sycamore, IL 327
Graphic Indus. Inc. Atlanta, GA 310
John H. Harland Co. Atlanta, GA 345
Maxwell Commun Corp. St. Paul, MN 720*
Meehan-Tooker Inc. East Rutherford, NJ 110
Quad Graphics Inc. Pewaukee, WI 380
RR Donnelley & Sons Co. Warsaw Mfg. Div. Warsaw, IN 160*
Webcraft Technologies Inc. North Brunswick, NJ 220*
Williamhouse-Regency Inc. New York, NY 230
(continued)
B-21
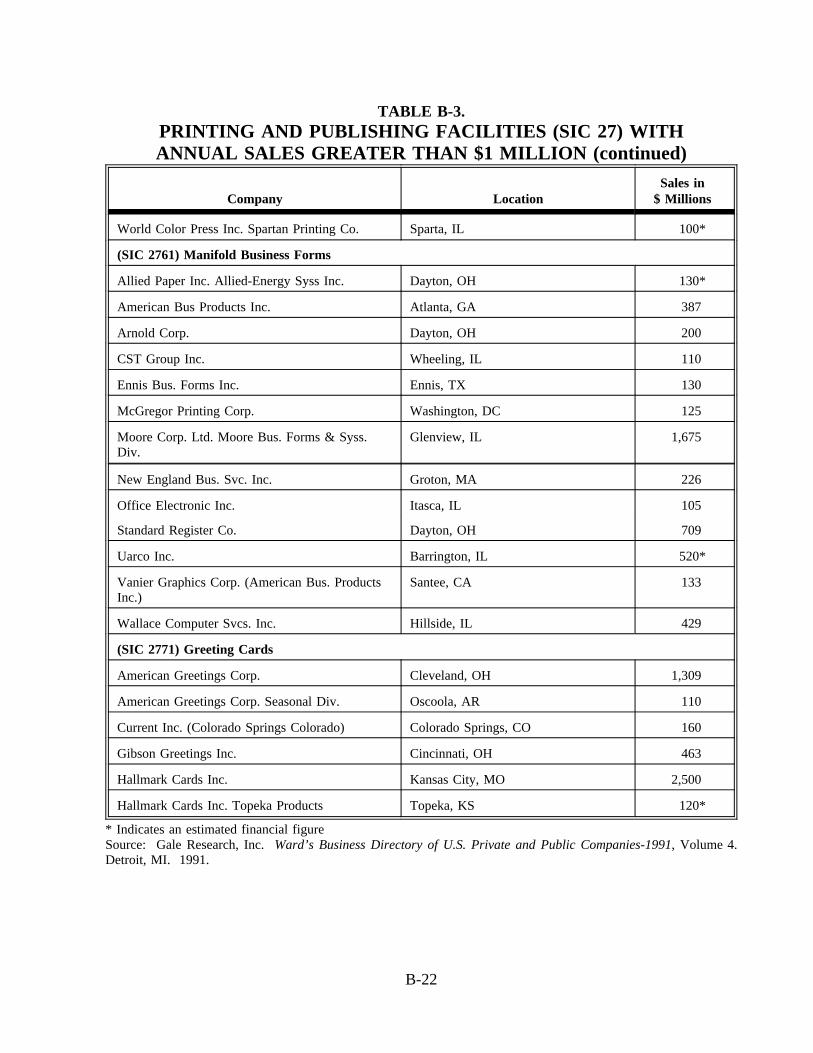
TABLE B-3.PRINTING AND PUBLISHING FACILITIES (SIC 27) WITHANNUAL SALES GREATER THAN $1 MILLION (continued)
Company LocationSales in
$ Millions
World Color Press Inc. Spartan Printing Co. Sparta, IL 100*
(SIC 2761) Manifold Business Forms
Allied Paper Inc. Allied-Energy Syss Inc. Dayton, OH 130*
American Bus Products Inc. Atlanta, GA 387
Arnold Corp. Dayton, OH 200
CST Group Inc. Wheeling, IL 110
Ennis Bus. Forms Inc. Ennis, TX 130
McGregor Printing Corp. Washington, DC 125
Moore Corp. Ltd. Moore Bus. Forms & Syss.Div.
Glenview, IL 1,675
New England Bus. Svc. Inc. Groton, MA 226
Office Electronic Inc. Itasca, IL 105
Standard Register Co. Dayton, OH 709
Uarco Inc. Barrington, IL 520*
Vanier Graphics Corp. (American Bus. ProductsInc.)
Santee, CA 133
Wallace Computer Svcs. Inc. Hillside, IL 429
(SIC 2771) Greeting Cards
American Greetings Corp. Cleveland, OH 1,309
American Greetings Corp. Seasonal Div. Oscoola, AR 110
Current Inc. (Colorado Springs Colorado) Colorado Springs, CO 160
Gibson Greetings Inc. Cincinnati, OH 463
Hallmark Cards Inc. Kansas City, MO 2,500
Hallmark Cards Inc. Topeka Products Topeka, KS 120*
* Indicates an estimated financial figureSource: Gale Research, Inc.Ward’s Business Directory of U.S. Private and Public Companies-1991, Volume 4.Detroit, MI. 1991.
B-22
APPENDIX C
XYLENE SOURCE CATEGORIES IN SURFACE COATING OPERATIONS
C-1
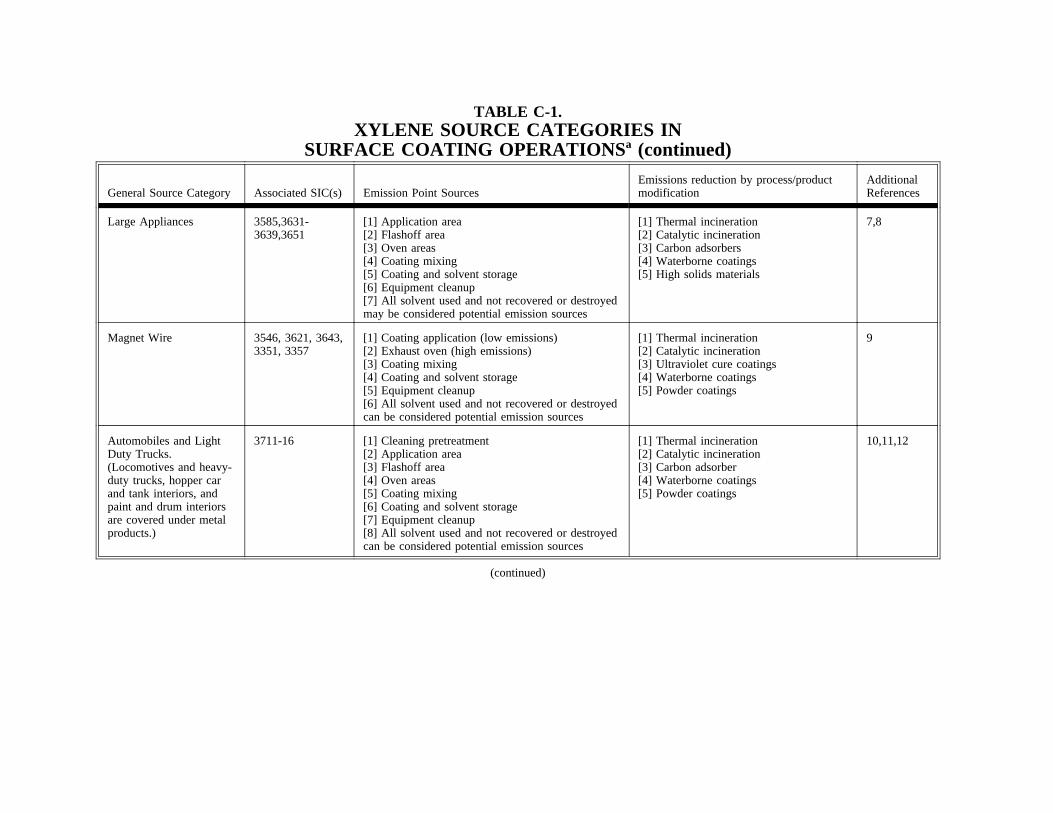
TABLE C-1.XYLENE SOURCE CATEGORIES IN
SURFACE COATING OPERATIONS a (continued)
General Source Category Associated SIC(s) Emission Point SourcesEmissions reduction by process/productmodification
AdditionalReferences
Large Appliances 3585,3631-3639,3651
[1] Application area[2] Flashoff area[3] Oven areas[4] Coating mixing[5] Coating and solvent storage[6] Equipment cleanup[7] All solvent used and not recovered or destroyedmay be considered potential emission sources
[1] Thermal incineration[2] Catalytic incineration[3] Carbon adsorbers[4] Waterborne coatings[5] High solids materials
7,8
Magnet Wire 3546, 3621, 3643,3351, 3357
[1] Coating application (low emissions)[2] Exhaust oven (high emissions)[3] Coating mixing[4] Coating and solvent storage[5] Equipment cleanup[6] All solvent used and not recovered or destroyedcan be considered potential emission sources
[1] Thermal incineration[2] Catalytic incineration[3] Ultraviolet cure coatings[4] Waterborne coatings[5] Powder coatings
9
Automobiles and LightDuty Trucks.(Locomotives and heavy-duty trucks, hopper carand tank interiors, andpaint and drum interiorsare covered under metalproducts.)
3711-16 [1] Cleaning pretreatment[2] Application area[3] Flashoff area[4] Oven areas[5] Coating mixing[6] Coating and solvent storage[7] Equipment cleanup[8] All solvent used and not recovered or destroyedcan be considered potential emission sources
[1] Thermal incineration[2] Catalytic incineration[3] Carbon adsorber[4] Waterborne coatings[5] Powder coatings
10,11,12
(continued)
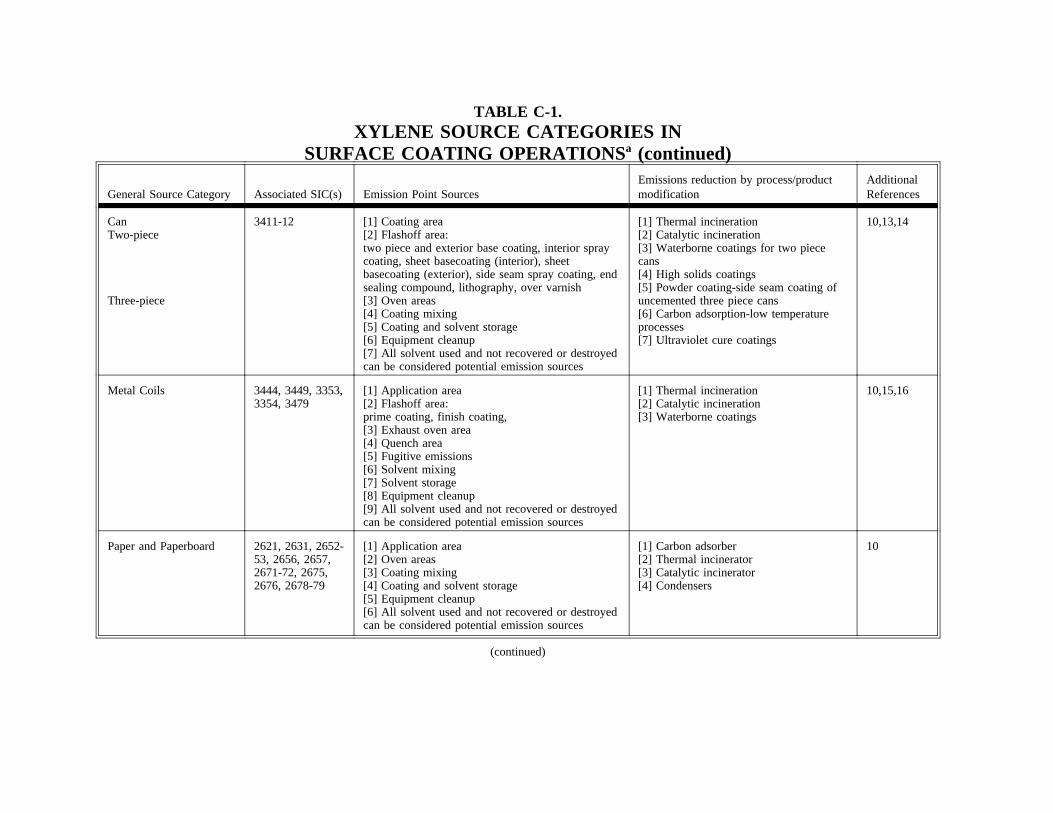
TABLE C-1.XYLENE SOURCE CATEGORIES IN
SURFACE COATING OPERATIONS a (continued)
General Source Category Associated SIC(s) Emission Point SourcesEmissions reduction by process/productmodification
AdditionalReferences
CanTwo-piece
Three-piece
3411-12 [1] Coating area[2] Flashoff area:two piece and exterior base coating, interior spraycoating, sheet basecoating (interior), sheetbasecoating (exterior), side seam spray coating, endsealing compound, lithography, over varnish[3] Oven areas[4] Coating mixing[5] Coating and solvent storage[6] Equipment cleanup[7] All solvent used and not recovered or destroyedcan be considered potential emission sources
[1] Thermal incineration[2] Catalytic incineration[3] Waterborne coatings for two piececans[4] High solids coatings[5] Powder coating-side seam coating ofuncemented three piece cans[6] Carbon adsorption-low temperatureprocesses[7] Ultraviolet cure coatings
10,13,14
Metal Coils 3444, 3449, 3353,3354, 3479
[1] Application area[2] Flashoff area:prime coating, finish coating,[3] Exhaust oven area[4] Quench area[5] Fugitive emissions[6] Solvent mixing[7] Solvent storage[8] Equipment cleanup[9] All solvent used and not recovered or destroyedcan be considered potential emission sources
[1] Thermal incineration[2] Catalytic incineration[3] Waterborne coatings
10,15,16
Paper and Paperboard 2621, 2631, 2652-53, 2656, 2657,2671-72, 2675,2676, 2678-79
[1] Application area[2] Oven areas[3] Coating mixing[4] Coating and solvent storage[5] Equipment cleanup[6] All solvent used and not recovered or destroyedcan be considered potential emission sources
[1] Carbon adsorber[2] Thermal incinerator[3] Catalytic incinerator[4] Condensers
10
(continued)

TABLE C-1.XYLENE SOURCE CATEGORIES IN
SURFACE COATING OPERATIONS a (continued)
General Source Category Associated SIC(s) Emission Point SourcesEmissions reduction by process/productmodification
AdditionalReferences
Adhesives and Sealants 2891 [1] Adhesive application[2] Drying oven exhaust[3] Solvent mixing[4] Solvent storage[5] All solvent used and not recovered or destroyedcan be considered potential emission sources
[1] Thermal incineration[2] Carbon adsorption
17,18
Wood Products 2426-29, 2434,452, 2511-12,2515, 2517, 2519,2521, 2531, 2541,3995
[1] Application area[2] Flashoff coating operations[3] Oven areas[4] Coating mixing[5] Coating and solvent storage[6] Equipment cleanup[7] All solvent used and not recovered or destroyedcan be considered potential emission sources
[1] Waterborne coatings[2] Carbon adsorption[3] Thermal incineration[4] Catalytic incineration
19
Flatwood Products 2435-36, 2491-99 [1] Application area[2] Flashoff area:Filler, sealer, basecoat, topcoat, inks[3] Oven areas[4] Coating mix[5] Coating and solvent storage[6] Equipment cleanup[7] All solvent used and not recovered or destroyedcan be considered potential emission sources
[1] Waterborne coatings specially in fillerand basecoat[2] Ultraviolet cure coatings[3] Afterburners[4] Carbon adsorption
11,20
Misc. Metal Parts andProducts
2514, 2522, 2542,2599, 3412-99,3511-69, 3581-82,3586-99
[1] Application area[2] Flashoff area:flow coating, dip coating or spray application[3] Oven areas[4] Coating mixing[5] Coating and solvent storage[6] Equipment cleanup[7] All solvent used and not recovered can beconsidered potential emission sources
[1] Thermal incinerator[2] Catalytic incinerator[3] Carbon adsorbers[4] Waterborne coatings[5] Powder coatings[6] High solids coating
21,22,23,24
(continued)

TABLE C-1.XYLENE SOURCE CATEGORIES IN
SURFACE COATING OPERATIONS a (continued)
General Source Category Associated SIC(s) Emission Point SourcesEmissions reduction by process/productmodification
AdditionalReferences
Plastic Products 2821, 2823, 3079,3080, 3081-89,3432, 3731
[1] Coating application[2] Flashoff area:flow coating, dip coating or spray application[3] Coating mixing[4] Coating and solvent storage[5] Equipment cleanup[6] All solvent used and not recovered can beconsidered potential emission sources
[1] Carbon adsorber[2] Thermal incinerator[3] Catalytic incinerator
25
Large Ships 3731 [1] Coating application[2] Flashoff:prime coat operation, topcoat operation[3] Oven areas[4] Coating mixing[5] Coating and solvent storage[6] Equipment cleanup[7] All solvent used and not recovered or destroyedcan be considered potential emission sources
None 26
Large Aircraft 3721-28 [1] Coating application[2] Flashoff:prime coat operation, topcoat operating[3] Oven areas[4] Coating and solvent storage[5] Equipment cleanup[6] All solvent used and not recovered or destroyedcan be considered potential emission sources
Unknown 26
aReference 1-6
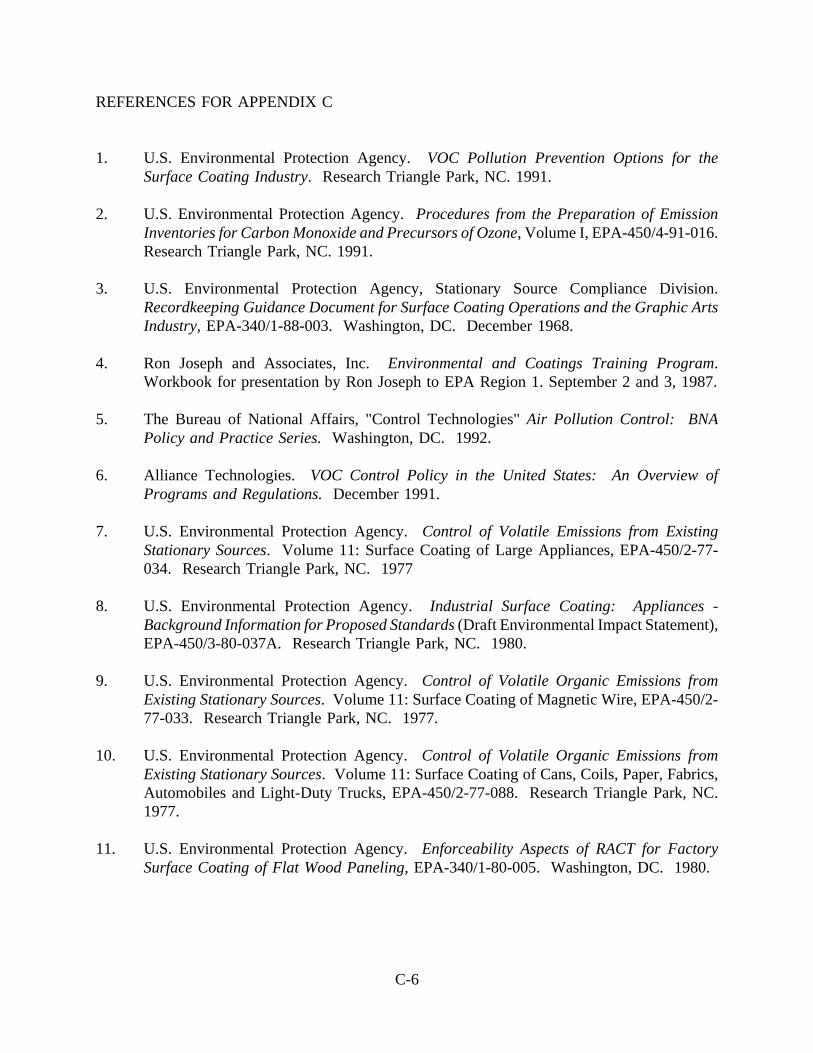
REFERENCES FOR APPENDIX C
1. U.S. Environmental Protection Agency.VOC Pollution Prevention Options for theSurface Coating Industry. Research Triangle Park, NC. 1991.
2. U.S. Environmental Protection Agency.Procedures from the Preparation of EmissionInventories for Carbon Monoxide and Precursors of Ozone, Volume I, EPA-450/4-91-016.Research Triangle Park, NC. 1991.
3. U.S. Environmental Protection Agency, Stationary Source Compliance Division.Recordkeeping Guidance Document for Surface Coating Operations and the Graphic ArtsIndustry, EPA-340/1-88-003. Washington, DC. December 1968.
4. Ron Joseph and Associates, Inc.Environmental and Coatings Training Program.Workbook for presentation by Ron Joseph to EPA Region 1. September 2 and 3, 1987.
5. The Bureau of National Affairs, "Control Technologies"Air Pollution Control: BNAPolicy and Practice Series.Washington, DC. 1992.
6. Alliance Technologies. VOC Control Policy in the United States: An Overview ofPrograms and Regulations.December 1991.
7. U.S. Environmental Protection Agency.Control of Volatile Emissions from ExistingStationary Sources. Volume 11: Surface Coating of Large Appliances, EPA-450/2-77-034. Research Triangle Park, NC. 1977
8. U.S. Environmental Protection Agency.Industrial Surface Coating: Appliances -Background Information for Proposed Standards(Draft Environmental Impact Statement),EPA-450/3-80-037A. Research Triangle Park, NC. 1980.
9. U.S. Environmental Protection Agency.Control of Volatile Organic Emissions fromExisting Stationary Sources. Volume 11: Surface Coating of Magnetic Wire, EPA-450/2-77-033. Research Triangle Park, NC. 1977.
10. U.S. Environmental Protection Agency.Control of Volatile Organic Emissions fromExisting Stationary Sources. Volume 11: Surface Coating of Cans, Coils, Paper, Fabrics,Automobiles and Light-Duty Trucks, EPA-450/2-77-088. Research Triangle Park, NC.1977.
11. U.S. Environmental Protection Agency.Enforceability Aspects of RACT for FactorySurface Coating of Flat Wood Paneling, EPA-340/1-80-005. Washington, DC. 1980.
C-6

12. U.S. Environmental Protection Agency.Automobile and Light Duty Truck SurfaceCoating Operations - Background Information for Promulgated Standards, EPA-450/3-79-030B. 1980.
13. U.S. Environmental Protection Agency.Beverage Can Surface Coating Industry -Background Information for Proposed Standards, EPA-450/3-80-036A. Research TrianglePark, NC. 1980.
14. U.S. Environmental Protection Agency.Beverage Can Surface Coating Industry -Background Information for Promulgated Standards of Performance, EPA-450/3-80-036B.Research Triangle Park, NC. 1983.
15. U.S. Environmental Protection Agency.Metal Coil Surface Coating Industry -Background Information for Proposed Standards, EPA-450/3-80-035A. Research TrianglePark, NC. 1982.
16. U.S. Environmental Protection Agency.Metal Coil Surface Coating Industry -Background Information for Promulgated Standards, EPA-450/3-80-035B. ResearchTriangle Park, NC. 1982.
17. U.S. Environmental Protection Agency.Pressure Sensitive Tape and Label SurfaceCoating Industry - Background Information for Proposed Standards, EPA-450/3-80-003A.Research Triangle Park, NC. 1980.
18. U.S. Environmental Protection Agency.Final Environmental Impact Statement PressureSensitive Tape and Label Surface Coating Industry - Background Information forPromulgated Standards, EPA-450/3-80-003B. Research Triangle Park, NC. 1983.
19. U.S. Environmental Protection Agency.Control of Volatile Organic CompoundEmissions from Wood Furniture Coating Operations.Draft CTG. Research TrianglePark, NC. October 1991.
20. U.S. Environmental Protection Agency.Control of Volatile Organic Emissions fromExisting Stationary Sources. Volume 11: Surface Coating of Flatwood Paneling, EPA-450/2-78-032. Research Triangle Park, NC. 1978.
21. U.S. Environmental Protection Agency.Control of Volatile Organic Emissions fromExisting Stationary Sources. Volume 11: Surface Coating of Metal Furniture, EPA-450/2-77-032. Research Triangle Park, NC. 1977.
22. U.S. Environmental Protection Agency.Control of Volatile Organic Emissions fromExisting Stationary Sources. Volume 11: Surface Coating of Miscellaneous Metal Partsand Products, EPA-450/2-78-015. Research Triangle Park, NC. 1978.
C-7

23. U.S. Environmental Protection Agency.Surface Coating of Metal Furniture -Background Information for Proposed Standards, EPA-450/3-80-007A. Research TrianglePark, NC. 1980.
24. U.S. Environmental Protection Agency.Surface Coating of Metal Furniture -Background Information for Promulgated Standards, EPA-450/3-80-007B. ResearchTriangle Park, NC. 1982.
25. U.S. Environmental Protection Agency.Surface Coating of Plastic Parts for BusinessMachines - Background Information for Proposed Standards, EPA /450-3-85-019a.Research Triangle Park, NC. 1985.
26. U.S. Environmental Protection Agency.Source Screening Study. Document summarizesemission control technology for source categories including the surface coating of largeships, large aircraft, and wood furniture. 1980.
C-8

APPENDIX D
SUMMARY OF XYLENE EMISSION FACTORSLISTED IN THIS DOCUMENT
D-1

TABLE D-1.SUMMARY OF XYLENE EMISSION FACTORS
SIC SIC Description SCC SCC Description Emission FactorQualityRating Reference Note
2865 Cyclic Crudes and Intermediates 407 Organic Chemicals Storage 0.02 g of o-xylene/kg xylene used U 5-4 Storage of phthalic anhydride
2865 Cyclic Crudes and Intermediates 407 Organic Chemicals Storage-Fixed Roof Tanks
0.2 g/kg phthalic anhydrideproduced
E 5-4 Storage of phthalic anhydride fromthe xylene process-uncontrolled
2865 Cyclic Crudes and Intermediates 30101901 Chemical Manufacturing 0.14 g of o-xylene/kg xylene used U 5-4 Phthalic anhydride - processemissions
2865 Cyclic Crudes and Intermediates 301019 Chemical Manufacturing 0.04 g of o-xylene/kg xylene used U 5-4 Phthalic anhydride - fugitiveemissions
2865 Cyclic Crudes and Intermediates 407 Organic Chemicals Storage-Fixed Roof Tanks
0.002 g/kg phthalic anhydrideproduced
E 5-4 Controlled emissionsStorage of phthalic anhydride fromthe xylene process
2865 Cyclic Crudes and Intermediates 301100 Chemical Manufacturing-Maleic anhydride
11.6 g/kg maleic anhydrideproduced
U 5-4 Maleic anhydride - processemissions
2865 Cyclic Crudes and Intermediates 301100 Chemical Manufacturing-Maleic anhydride
0.4 g/kg maleic anhydrideproduced
U 5-4 Maleic anhydride - fugitiveemissions
2865 Cyclic Crudes and Intermediates 301100 Chemical Manufacturing-Maleic anhydride
0.075 g/kg maleic anhydrideproduced
U 5-4 Storage of maleic anhydride
2865 Cyclic Crudes and Intermediates 30116901 Chemical Manufacturing-Ethylbenzene-General
0.1 kg/Mg xylene used U 4-10 Process emissions
2865 Cyclic Crudes and Intermediates 30116980 Chemical Manufacturing-Ethylbenzene-Fugitives
0.05 g/kg xylene used E 4-10 Fugitive emissions - equipmentleaks
2865 Cyclic Crudes and Intermediates 407036 Organic Chemical Storage-Fixed Roof Tanks
0.05 kg/Mg xylene used U 4-10 Storage of mixed benzenes
2869 Industrial Organic Chemicals 301258 Chemical Manufacturing-Organic Chemicals
1.58 kg/Mg m-xylene produced U 4-10 m-xylene production - processemissions
2869 Industrial Organic Chemicals 301258 Chemical Manufacturing-Organic Chemicals
0.3 kg/Mg m-xylene produced U 4-10 Fugitive emissions - equipmentleaks
(continued)

TABLE D-1.SUMMARY OF XYLENE EMISSION FACTORS (continued)
SIC SIC Description SCC SCC Description Emission FactorQualityRating Reference Note
2869 Industrial Organic Chemicals 301258 Chemical Manufacturing-Organic Chemicals
0.12 kg/Mg m-xylene produced U 4-10 Storage of m-xylene
2869 Industrial Organic Chemicals 301258 Chemical Manufacturing-Organic Chemicals
2.09 kg/Mg o-xylene produced D 4-10 o-xylene production - processemissions
2869 Industrial Organic Chemicals 301258 Chemical Manufacturing-Organic Chemicals
0.38 kg/Mg o-xylene produced D 4-10 Fugitive emissions - equipmentleaks
2869 Industrial Organic Chemicals 301258 Chemical Manufacturing-Organic Chemicals
0.06 kg/Mg o-xylene stored D 4-10 Storage of o-xylene
2869 Industrial Organic Chemicals 30125810 Chemical Manufacturing -p-xylene: General
1.14 kg/Mg p-xylene produced D 4-10 p-xylene production - processemissions
2869 Industrial Organic Chemicals 30125810 Chemical Manufacturing -p-xylene: General
0.24 kg/Mg p-xylene produced D 4-10 Fugitive emissions - equipmentleaks
2869 Industrial Organic Chemicals 30125810 Chemical Manufacturing -p-xylene: General
0.19 kg/Mg p-xylene produced D 4-10 Storage of p-xylene
2869 Industrial Organic Chemicals 30125815 Chemical ManufacturingMixed Xylenes: General
0.5 kg/Mg xylene produced U 4-10 Coal-derived mixed xylene treatingtanks
2869 Industrial Organic Chemicals 30125815 Chemical ManufacturingMixed Xylenes: General
0.15 kg/Mg xylene produced U 4-10 Fugitive emissions - equipmentleaks from xylene production fromcoal-derived mixed xylenes
2869 Industrial Organic Chemicals 30125815 Chemical ManufacturingMixed Xylenes: General
0.6 kg/Mg xylene produced U 4-10 Storage of coal-derived mixedxylenes
2869 Industrial Organic Chemicals 30125815 Chemical ManufacturingMixed Xylenes: General
0.07 kg/Mg xylene produced D 4-10 Process emissions - ethylenecracking unit from production ofxylene from pyrolysis gasoline
2869 Industrial Organic Chemicals 30125815 Chemical ManufacturingMixed Xylenes: General
0.03 kg/Mg xylene produced D 4-10 Fugitive emissions - equipmentleaks from xylene production frompyrolysis gasoline
(continued)
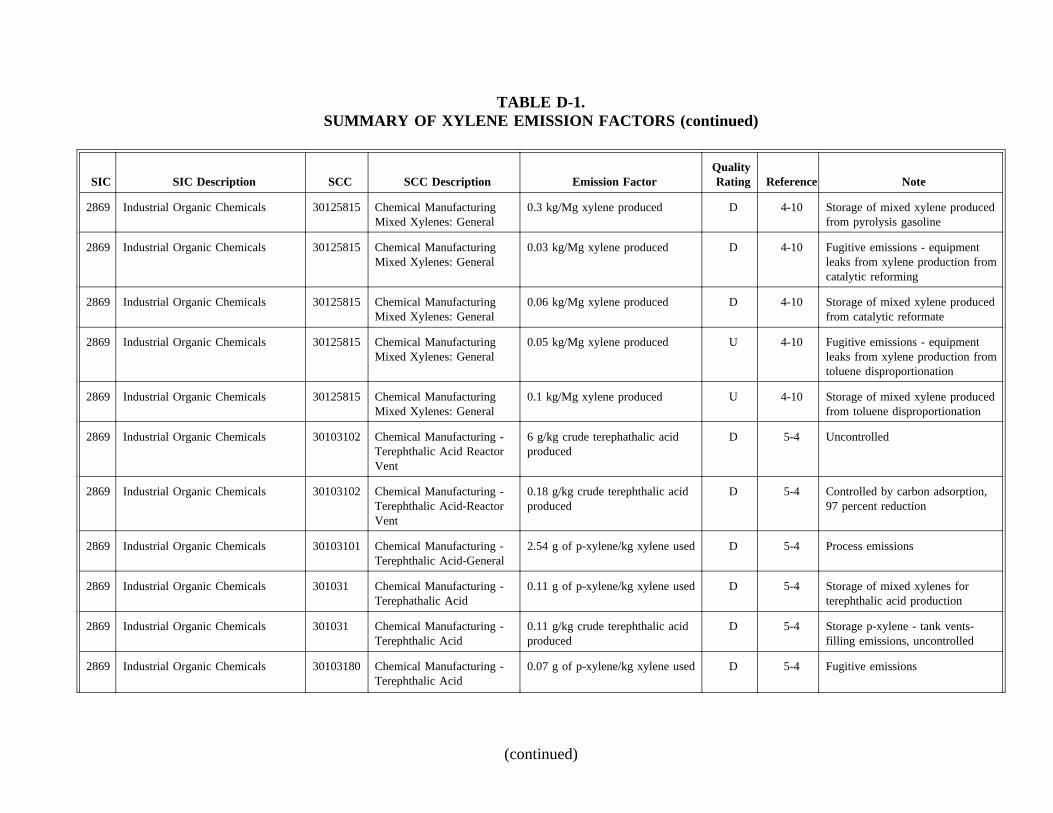
TABLE D-1.SUMMARY OF XYLENE EMISSION FACTORS (continued)
SIC SIC Description SCC SCC Description Emission FactorQualityRating Reference Note
2869 Industrial Organic Chemicals 30125815 Chemical ManufacturingMixed Xylenes: General
0.3 kg/Mg xylene produced D 4-10 Storage of mixed xylene producedfrom pyrolysis gasoline
2869 Industrial Organic Chemicals 30125815 Chemical ManufacturingMixed Xylenes: General
0.03 kg/Mg xylene produced D 4-10 Fugitive emissions - equipmentleaks from xylene production fromcatalytic reforming
2869 Industrial Organic Chemicals 30125815 Chemical ManufacturingMixed Xylenes: General
0.06 kg/Mg xylene produced D 4-10 Storage of mixed xylene producedfrom catalytic reformate
2869 Industrial Organic Chemicals 30125815 Chemical ManufacturingMixed Xylenes: General
0.05 kg/Mg xylene produced U 4-10 Fugitive emissions - equipmentleaks from xylene production fromtoluene disproportionation
2869 Industrial Organic Chemicals 30125815 Chemical ManufacturingMixed Xylenes: General
0.1 kg/Mg xylene produced U 4-10 Storage of mixed xylene producedfrom toluene disproportionation
2869 Industrial Organic Chemicals 30103102 Chemical Manufacturing -Terephthalic Acid ReactorVent
6 g/kg crude terephathalic acidproduced
D 5-4 Uncontrolled
2869 Industrial Organic Chemicals 30103102 Chemical Manufacturing -Terephthalic Acid-ReactorVent
0.18 g/kg crude terephthalic acidproduced
D 5-4 Controlled by carbon adsorption,97 percent reduction
2869 Industrial Organic Chemicals 30103101 Chemical Manufacturing -Terephthalic Acid-General
2.54 g of p-xylene/kg xylene used D 5-4 Process emissions
2869 Industrial Organic Chemicals 301031 Chemical Manufacturing -Terephathalic Acid
0.11 g of p-xylene/kg xylene used D 5-4 Storage of mixed xylenes forterephthalic acid production
2869 Industrial Organic Chemicals 301031 Chemical Manufacturing -Terephthalic Acid
0.11 g/kg crude terephthalic acidproduced
D 5-4 Storage p-xylene - tank vents-filling emissions, uncontrolled
2869 Industrial Organic Chemicals 30103180 Chemical Manufacturing -Terephthalic Acid
0.07 g of p-xylene/kg xylene used D 5-4 Fugitive emissions
(continued)
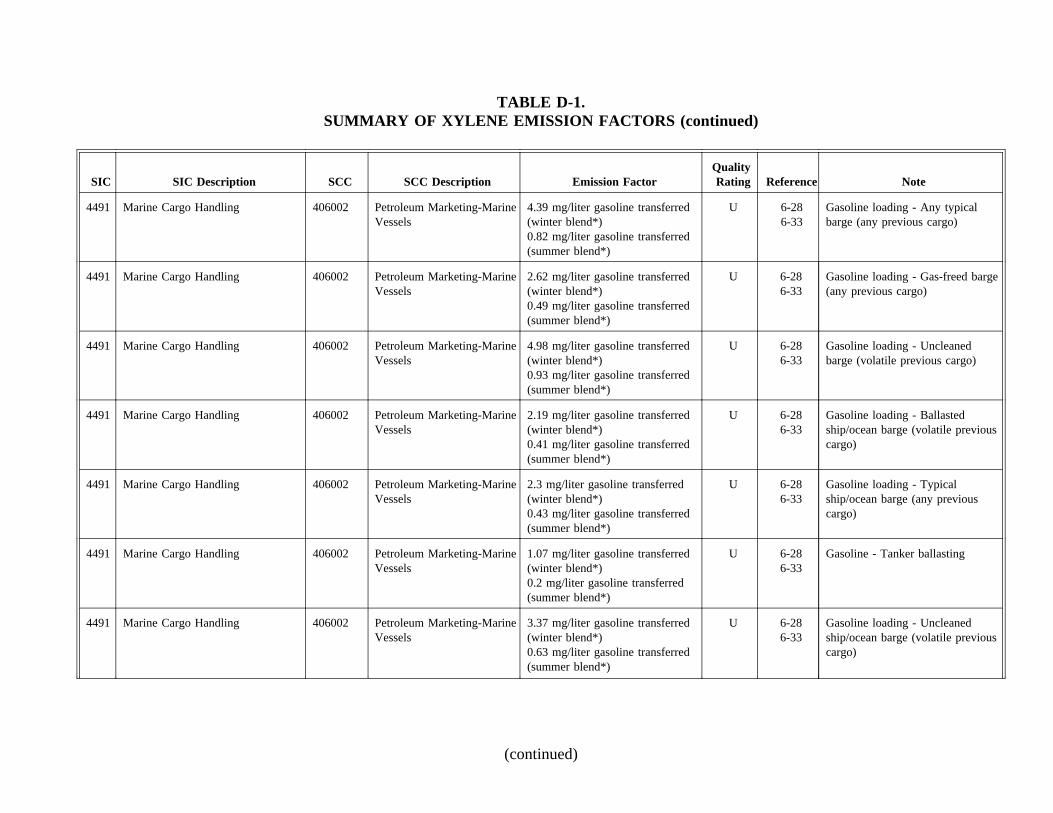
TABLE D-1.SUMMARY OF XYLENE EMISSION FACTORS (continued)
SIC SIC Description SCC SCC Description Emission FactorQualityRating Reference Note
4491 Marine Cargo Handling 406002 Petroleum Marketing-MarineVessels
4.39 mg/liter gasoline transferred(winter blend*)0.82 mg/liter gasoline transferred(summer blend*)
U 6-286-33
Gasoline loading - Any typicalbarge (any previous cargo)
4491 Marine Cargo Handling 406002 Petroleum Marketing-MarineVessels
2.62 mg/liter gasoline transferred(winter blend*)0.49 mg/liter gasoline transferred(summer blend*)
U 6-286-33
Gasoline loading - Gas-freed barge(any previous cargo)
4491 Marine Cargo Handling 406002 Petroleum Marketing-MarineVessels
4.98 mg/liter gasoline transferred(winter blend*)0.93 mg/liter gasoline transferred(summer blend*)
U 6-286-33
Gasoline loading - Uncleanedbarge (volatile previous cargo)
4491 Marine Cargo Handling 406002 Petroleum Marketing-MarineVessels
2.19 mg/liter gasoline transferred(winter blend*)0.41 mg/liter gasoline transferred(summer blend*)
U 6-286-33
Gasoline loading - Ballastedship/ocean barge (volatile previouscargo)
4491 Marine Cargo Handling 406002 Petroleum Marketing-MarineVessels
2.3 mg/liter gasoline transferred(winter blend*)0.43 mg/liter gasoline transferred(summer blend*)
U 6-286-33
Gasoline loading - Typicalship/ocean barge (any previouscargo)
4491 Marine Cargo Handling 406002 Petroleum Marketing-MarineVessels
1.07 mg/liter gasoline transferred(winter blend*)0.2 mg/liter gasoline transferred(summer blend*)
U 6-286-33
Gasoline - Tanker ballasting
4491 Marine Cargo Handling 406002 Petroleum Marketing-MarineVessels
3.37 mg/liter gasoline transferred(winter blend*)0.63 mg/liter gasoline transferred(summer blend*)
U 6-286-33
Gasoline loading - Uncleanedship/ocean barge (volatile previouscargo)
(continued)

TABLE D-1.SUMMARY OF XYLENE EMISSION FACTORS (continued)
SIC SIC Description SCC SCC Description Emission FactorQualityRating Reference Note
4491 Marine Cargo Handling 406002 Petroleum Marketing-MarineVessels
0.91 mg/liter gasoline transferred(winter blend*)0.17 mg/liter gasoline transferred(summer blend*)
U 6-286-33
Gasoline loading - Any conditionship/ocean barge (non-volatileprevious cargo)
4491 Marine Cargo Handling 406002 Petroleum Marketing-MarineVessels
0.91 mg/liter gasoline transferred(winter blend*)0.17 mg/liter gasoline transferred(summer blend*)
U 6-286-33
Gasoline loading - Gas-freedship/ocean barge (volatile previouscargo)
4491 Marine Cargo Handling 406002 Petroleum Marketing-MarineVessels
1.93 mg/liter gasoline transferred(winter blend*)0.36 mg/liter gasoline transferred(summer blend*)
U 6-286-33
Gasoline loading - Cleanedship/ocean barge (volatile previouscargo)
4491 Marine Cargo Handling 406002 Petroleum Marketing-MarineVessels
3.42 mg/liter gasoline transferred(winter blend*)0.64 mg/liter gasoline transferred(summer blend*)
U 6-286-33
Gasoline loss - Marine vesseltransit
4953 Refuse Systems 502002 Solid Waste Disposal - OpenBurning
0.480 kg/metric ton of tires E 7-7 Shred tire scrap (burn rate 2.3kg/hr - uncontrolled
4953 Refuse Systems 502002 Solid Waste Disposal - OpenBurning
1.036 kg/metric ton of tires E 7-7 Shred tire scrap (burn rate 1.4kg/hr) - uncontrolled
4953 Refuse Systems 502002 Solid Waste Disposal - OpenBurning
1.063 kg/metric ton of tires E 7-7 Shred tire scrap (burn rate 1.3kg/hr) - uncontrolled
4953 Refuse Systems 502002 Solid Waste Disposal - OpenBurning
0.736 kg/metric ton of tires E 7-7 Shred tire scrap (burn rate 1.5kg/hr) - uncontrolled
4953 Refuse Systems 502002 Solid Waste Disposal - OpenBurning
1.962 kg/metric ton of tires E 7-7 Shred tire scrap (burn rate 0.8kg/hr) - uncontrolled
4953 Refuse Systems 502002 Solid Waste Disposal - OpenBurning
3.212 kg/metric ton of tires E 7-7 Chunk tire scrap (burn rate 0.5kg/hr) - uncontrolled
(continued)
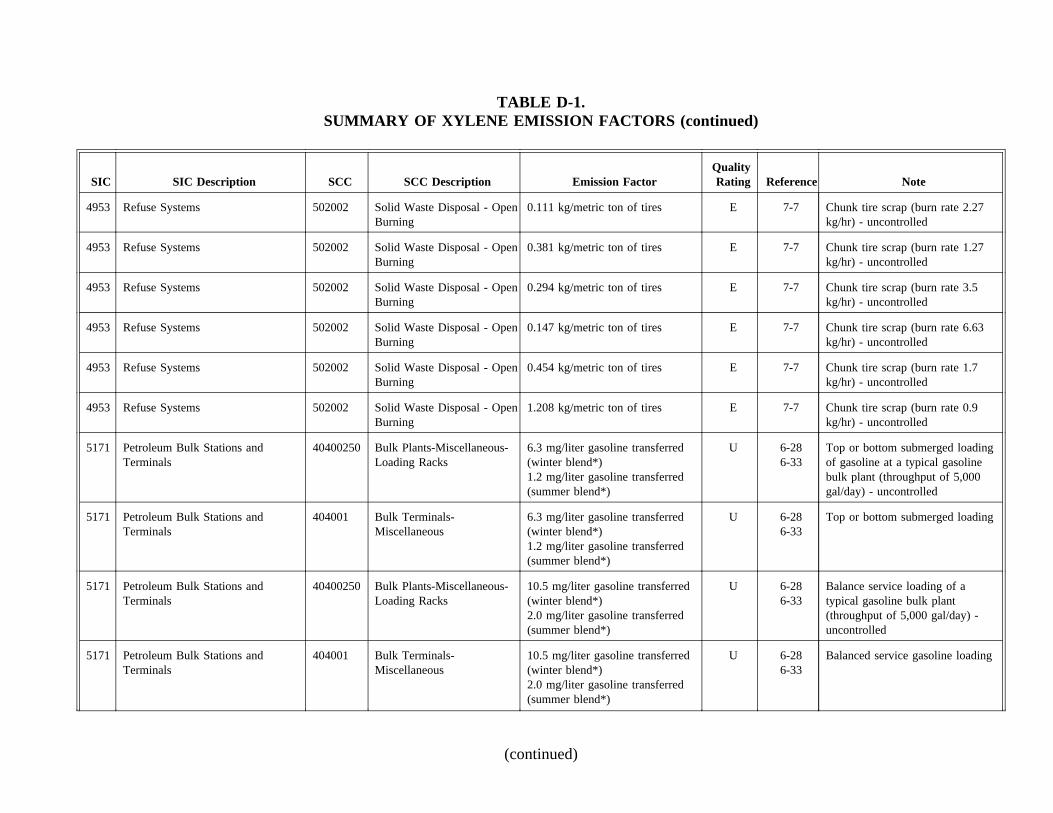
TABLE D-1.SUMMARY OF XYLENE EMISSION FACTORS (continued)
SIC SIC Description SCC SCC Description Emission FactorQualityRating Reference Note
4953 Refuse Systems 502002 Solid Waste Disposal - OpenBurning
0.111 kg/metric ton of tires E 7-7 Chunk tire scrap (burn rate 2.27kg/hr) - uncontrolled
4953 Refuse Systems 502002 Solid Waste Disposal - OpenBurning
0.381 kg/metric ton of tires E 7-7 Chunk tire scrap (burn rate 1.27kg/hr) - uncontrolled
4953 Refuse Systems 502002 Solid Waste Disposal - OpenBurning
0.294 kg/metric ton of tires E 7-7 Chunk tire scrap (burn rate 3.5kg/hr) - uncontrolled
4953 Refuse Systems 502002 Solid Waste Disposal - OpenBurning
0.147 kg/metric ton of tires E 7-7 Chunk tire scrap (burn rate 6.63kg/hr) - uncontrolled
4953 Refuse Systems 502002 Solid Waste Disposal - OpenBurning
0.454 kg/metric ton of tires E 7-7 Chunk tire scrap (burn rate 1.7kg/hr) - uncontrolled
4953 Refuse Systems 502002 Solid Waste Disposal - OpenBurning
1.208 kg/metric ton of tires E 7-7 Chunk tire scrap (burn rate 0.9kg/hr) - uncontrolled
5171 Petroleum Bulk Stations andTerminals
40400250 Bulk Plants-Miscellaneous-Loading Racks
6.3 mg/liter gasoline transferred(winter blend*)1.2 mg/liter gasoline transferred(summer blend*)
U 6-286-33
Top or bottom submerged loadingof gasoline at a typical gasolinebulk plant (throughput of 5,000gal/day) - uncontrolled
5171 Petroleum Bulk Stations andTerminals
404001 Bulk Terminals-Miscellaneous
6.3 mg/liter gasoline transferred(winter blend*)1.2 mg/liter gasoline transferred(summer blend*)
U 6-286-33
Top or bottom submerged loading
5171 Petroleum Bulk Stations andTerminals
40400250 Bulk Plants-Miscellaneous-Loading Racks
10.5 mg/liter gasoline transferred(winter blend*)2.0 mg/liter gasoline transferred(summer blend*)
U 6-286-33
Balance service loading of atypical gasoline bulk plant(throughput of 5,000 gal/day) -uncontrolled
5171 Petroleum Bulk Stations andTerminals
404001 Bulk Terminals-Miscellaneous
10.5 mg/liter gasoline transferred(winter blend*)2.0 mg/liter gasoline transferred(summer blend*)
U 6-286-33
Balanced service gasoline loading
(continued)
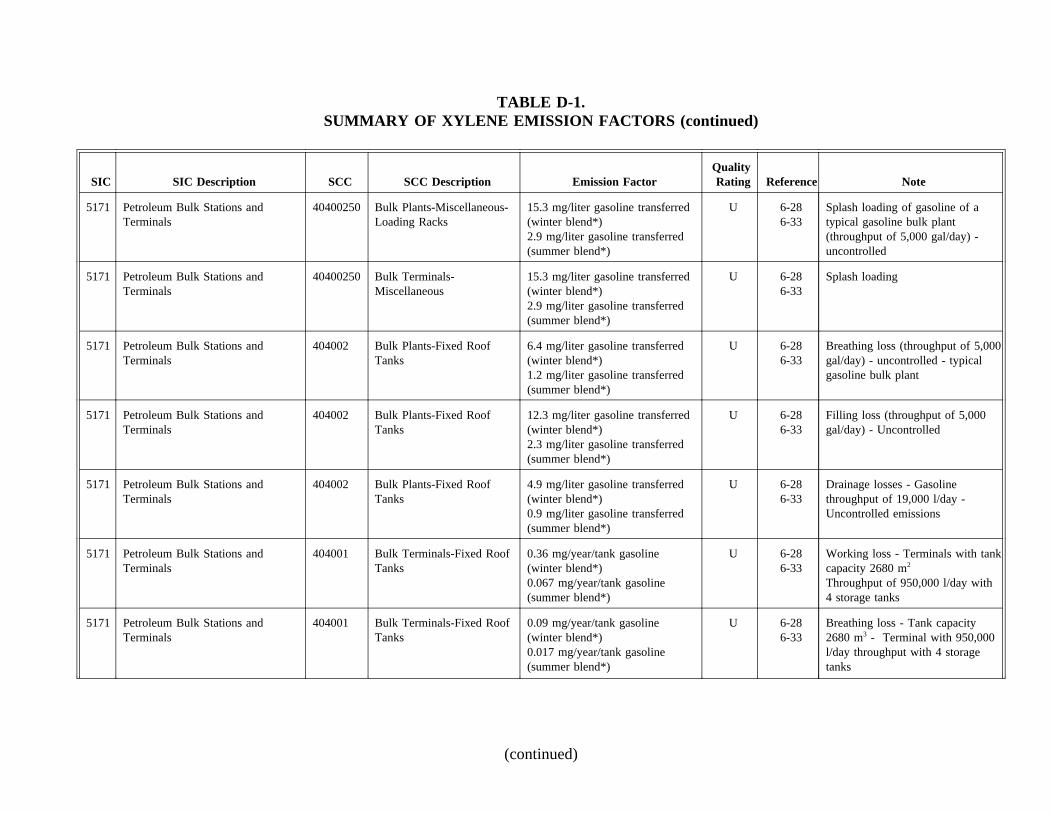
TABLE D-1.SUMMARY OF XYLENE EMISSION FACTORS (continued)
SIC SIC Description SCC SCC Description Emission FactorQualityRating Reference Note
5171 Petroleum Bulk Stations andTerminals
40400250 Bulk Plants-Miscellaneous-Loading Racks
15.3 mg/liter gasoline transferred(winter blend*)2.9 mg/liter gasoline transferred(summer blend*)
U 6-286-33
Splash loading of gasoline of atypical gasoline bulk plant(throughput of 5,000 gal/day) -uncontrolled
5171 Petroleum Bulk Stations andTerminals
40400250 Bulk Terminals-Miscellaneous
15.3 mg/liter gasoline transferred(winter blend*)2.9 mg/liter gasoline transferred(summer blend*)
U 6-286-33
Splash loading
5171 Petroleum Bulk Stations andTerminals
404002 Bulk Plants-Fixed RoofTanks
6.4 mg/liter gasoline transferred(winter blend*)1.2 mg/liter gasoline transferred(summer blend*)
U 6-286-33
Breathing loss (throughput of 5,000gal/day) - uncontrolled - typicalgasoline bulk plant
5171 Petroleum Bulk Stations andTerminals
404002 Bulk Plants-Fixed RoofTanks
12.3 mg/liter gasoline transferred(winter blend*)2.3 mg/liter gasoline transferred(summer blend*)
U 6-286-33
Filling loss (throughput of 5,000gal/day) - Uncontrolled
5171 Petroleum Bulk Stations andTerminals
404002 Bulk Plants-Fixed RoofTanks
4.9 mg/liter gasoline transferred(winter blend*)0.9 mg/liter gasoline transferred(summer blend*)
U 6-286-33
Drainage losses - Gasolinethroughput of 19,000 l/day -Uncontrolled emissions
5171 Petroleum Bulk Stations andTerminals
404001 Bulk Terminals-Fixed RoofTanks
0.36 mg/year/tank gasoline(winter blend*)0.067 mg/year/tank gasoline(summer blend*)
U 6-286-33
Working loss - Terminals with tankcapacity 2680 m2
Throughput of 950,000 l/day with4 storage tanks
5171 Petroleum Bulk Stations andTerminals
404001 Bulk Terminals-Fixed RoofTanks
0.09 mg/year/tank gasoline(winter blend*)0.017 mg/year/tank gasoline(summer blend*)
U 6-286-33
Breathing loss - Tank capacity2680 m3 - Terminal with 950,000l/day throughput with 4 storagetanks
(continued)

TABLE D-1.SUMMARY OF XYLENE EMISSION FACTORS (continued)
SIC SIC Description SCC SCC Description Emission FactorQualityRating Reference Note
5171 Petroleum Bulk Stations andTerminals
404001 Bulk Terminals-ExternalFloating Roof Tanks
1.68 x 10⁻⁷ Q mg/year gasolinethroughput (winter blend*)3.13 x 10⁻⁸ Q mg/year gasolinethroughput (summer blend*)where Q is the throughput throughthe tank in barrels
U 6-286-33
Working loss - Tank capacity 5760m3 - Terminal with 950,000 l/daythroughput with 4 storage tanks
5171 Petroleum Bulk Stations andTerminals
404001 Bulk Plants-External FloatingRoof Tanks
0.04 mg/year/tank(winter blend*)0.0067 mg/year/tank(summer blend*)
U 6-286-33
Storage loss-tank with secondarymetallic shoe seal and a capacityof 36,000 barrels
5171 Petroleum Bulk Stations andTerminals
404001 Bulk Plants-Floating RoofTanks
0.09 mg/year/tank (winter blend*)0.017 mg/year/tank (summerblend*)
U 6-286-33
Storage loss-tank with primary sealonly and a capacity of 36,000barrels
5541 Gasoline Service Stations 40600307 Petroleum Marketing-ServiceStations-Stage I-Breathing-Underground Tank
120 mg/liter gasoline stored(winter blend*)7.6 mg/liter gasoline stored(summer blend*)
U 6-286-33
Breathing losses from undergroundstorage tank throughput of 190,000l/month - Uncontrolled emissions
5541 Gasoline Service Stations 40600306 Petroleum Marketing-ServiceStations-Stage I-SubmergedFilling-Balanced
1.3 mg/liter gasoline stored(winter blend*)0.2 mg/liter gasoline stored(summer blend*)
U 6-286-33
Balanced submerged filling ofunderground tanks (throughput of190,000 l/month) Uncontrolledemissions
5541 Gasoline Service Stations 40600302 Petroleum Marketing-ServiceStations-Stage I-SubmergedFilling-No control
9.4 mg/liter gasoline stored(winter blend*)1.8 mg/liter gasoline stored(summer blend*)
U 6-286-33
Submerged filling of undergroundtanks (throughput of 190,000l/month) Uncontrolled emissions
5541 Gasoline Service Stations 40600301 Petroleum Marketing-ServiceStations-Stages I-SplashFilling
14.8 mg/liter gasoline stored(winter blend*)2.8 mg/liter gasoline stored(summer blend*)
U 6-286-33
Splash filling of underground tanks(throughput of 190,000 l/month)Uncontrolled emissions
(continued)
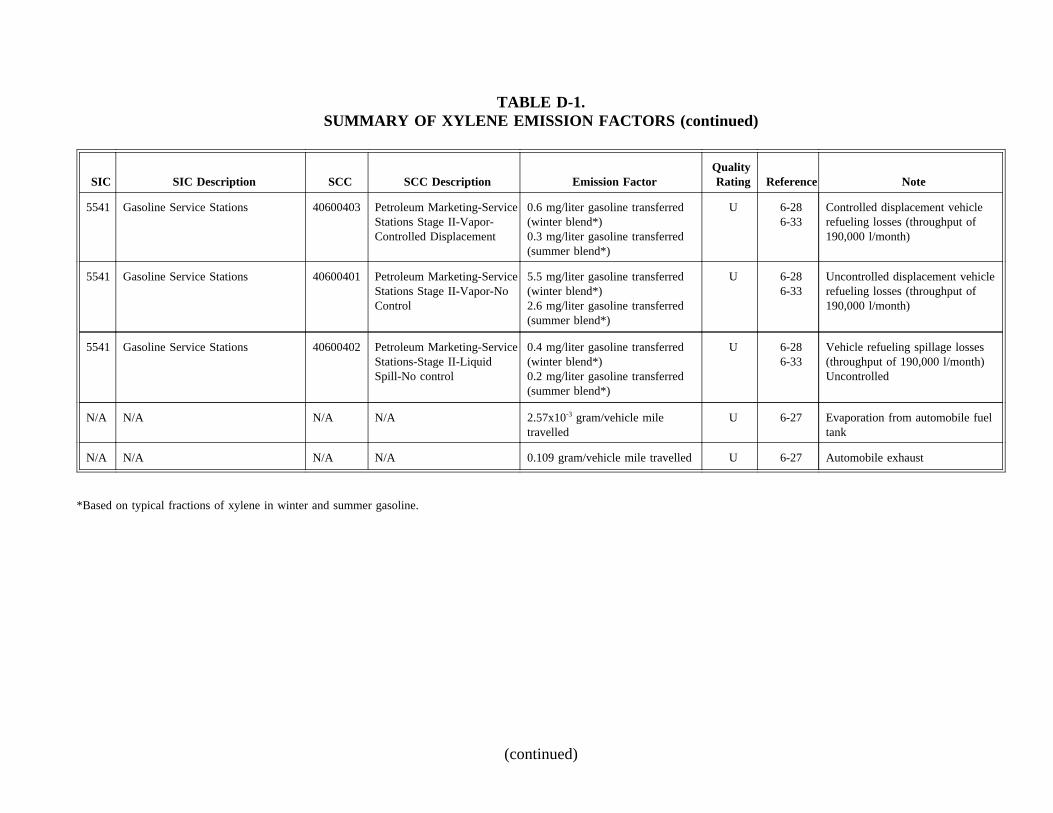
TABLE D-1.SUMMARY OF XYLENE EMISSION FACTORS (continued)
SIC SIC Description SCC SCC Description Emission FactorQualityRating Reference Note
5541 Gasoline Service Stations 40600403 Petroleum Marketing-ServiceStations Stage II-Vapor-Controlled Displacement
0.6 mg/liter gasoline transferred(winter blend*)0.3 mg/liter gasoline transferred(summer blend*)
U 6-286-33
Controlled displacement vehiclerefueling losses (throughput of190,000 l/month)
5541 Gasoline Service Stations 40600401 Petroleum Marketing-ServiceStations Stage II-Vapor-NoControl
5.5 mg/liter gasoline transferred(winter blend*)2.6 mg/liter gasoline transferred(summer blend*)
U 6-286-33
Uncontrolled displacement vehiclerefueling losses (throughput of190,000 l/month)
5541 Gasoline Service Stations 40600402 Petroleum Marketing-ServiceStations-Stage II-LiquidSpill-No control
0.4 mg/liter gasoline transferred(winter blend*)0.2 mg/liter gasoline transferred(summer blend*)
U 6-286-33
Vehicle refueling spillage losses(throughput of 190,000 l/month)Uncontrolled
N/A N/A N/A N/A 2.57x10⁻³ gram/vehicle miletravelled
U 6-27 Evaporation from automobile fueltank
N/A N/A N/A N/A 0.109 gram/vehicle mile travelled U 6-27 Automobile exhaust
*Based on typical fractions of xylene in winter and summer gasoline.
(continued)

TABLE D-2.SUMMARY OF VOC EMISSION FACTORS*
SIC SIC Description SCC SCC Description Emission FactorQualityRating Reference Note
2869 Industrial Organic Chemicals 30125815 Mixed Xylene Production-General 0.104 kg/hr/source U 4-12 Fugitives-Gas/vapor pressure relief seals
2869 Industrial Organic Chemicals 30125815 Mixed Xylene Production-General 0.00083 kg/hr/source U 4-12 Fugitives-Flanges
2869 Industrial Organic Chemicals 30125815 Mixed Xylene Production-General 0.0017 kg/hr/source U 4-12 Fugitives-Open ended lines
2869 Industrial Organic Chemicals 30125815 Mixed Xylene Production-General 0.015 kg/hr/source U 4-12 Fugitives-Sampling connections
2869 Industrial Organic Chemicals 30125815 Mixed Xylene Production-General 0.0056 kg/hr/source U 4-12 Fugitives-Gas valves
2869 Industrial Organic Chemicals 30125815 Mixed Xylene Production-General 0.0071 kg/hr/source U 4-12 Fugitives-Light liquid valves
2869 Industrial Organic Chemicals 30125815 Mixed Xylene Production-General 0.00023 kg/hr/source U 4-12 Fugitives-Heavy liquid valves
2869 Industrial Organic Chemicals 30125815 Mixed Xylene Production-General 0.0494 kg/hr/source U 4-12 Fugitives-Light liquid pump seals
2869 Industrial Organic Chemicals 30125815 Mixed Xylene Production-General 0.0214 kg/hr/source U 4-12 Fugitives-Heavy liquid pump seals
2869 Industrial Organic Chemicals 30125815 Mixed Xylene Production-General 0.228 kg/hr/source U 4-12 Fugitives-Gas/vapor compressor seals
Note: To obtain xylene leak emission factor for each component, multiply VOC emission factor above by the fraction of xylene in the stream.


![ENVIRONMENTAL CONTAMINANTS … ortho-xylene, 45-70% meta-xylene, 23% para-xylene, and 6-10% ethylbenzene [366]. While o-xylene is recognized as a distinct product in](https://static.documents.pub/doc/80x56/5b4c8c857f8b9afe4d8b9be3/environmental-contaminants-ortho-xylene-45-70-meta-xylene-23-para-xylene-and.jpg)


