AIR ’2# United States Office of Air Quality Environmental Protection Planning And Standards July 1998 Agency Research Triangle Park, NC 27711 EPA-454/R-98-014 LOCATING AND ESTIMATING AIR EMISSIONS FROM SOURCES OF POLYCYCLIC ORGANIC MATTER http://www.epa.gov/ttn/chief
Transcript
AIR
'2#
United States Office of Air Quality
Environmental Protection Planning And Standards July 1998Agency Research Triangle Park, NC 27711
EPA-454/R-98-014
LOCATING AND ESTIMATINGAIR EMISSIONS FROM SOURCESOF POLYCYCLIC ORGANIC MATTER
http://www.epa.gov/ttn/chief
This report has been reviewed by the Office of Air Quality Planning and Standards, U.S.Environmental Protection Agency, and has been approved for publication. Mention of tradenames and commercial products does not constitute endorsement or recommendation for use.
U.S. Environmental Protection Agency. Second Supplement to Compendium of Methods for the1
Determination of Toxic Organic Compounds in Ambient Air. Atmospheric Research andExposure Assessment Laboratory, Research Triangle Park, North Carolina. EPA-600/4-89-018. pp. TO-13 to TO-97. 1988.
xix
EXECUTIVE SUMMARY
The 1990 Clean Air Act Amendments contain a list of 188 hazardous air pollutants
(HAPs) which the U.S. Environmental Protection Agency must study, identify sources of, and
determine if regulations are warranted. One of these HAPs, polycyclic organic matter (POM), is
the subject of this document. This document describes the properties of POM as an air pollutant,
how it is formed, identifies source categories of air emissions, and provides POM emissions data
in terms of emission factors. This document is part of an ongoing EPA series designed to assist
the general public at large, but primarily State/local air agencies, in identifying sources of HAPs
and determining emissions estimates.
The principal formation mechanism for POM occurs as part of the fuel combustion
process present in many different types of source categories. A secondary formation mechanism
is the volatilization of light-weight POM compounds. The combustion processes are much more
significant in terms of overall POM air emissions, and include sources such as stationary external
combustion for heat and electricity generation, internal combustion engines and turbines, motor
vehicles, and a variety of fuel combustion processes in the industrial sector.
The term POM defines not one compound, but a broad class of compounds which
generally includes all organic compounds with more than one benzene ring, and which have a
boiling point greater than or equal to 212(F (100(C). Theoretically, millions of POM
compounds could be formed. However, only a small portion of these compounds have actually
been identified and regularly tested for as part of emissions tests.
Sixteen polycyclic aromatic hydrocarbons (PAHs), a subset of the class of POM
compounds, were designated by EPA as compounds of interest under a suggested procedure for
reporting test measurement results. The PAHs included in this measurement procedure are:1
U.S. Environmental Protection Agency. Provisional Guidance for Quantitative Risk Assessment2
of Polycyclic Aromatic Hydrocarbons. Office of Research and Development, Washington, DC. EPA-600/R-93-089. July 1993.
xx
Naphthalene Benzo(ghi)perylene
Acenaphthene Benz(a)anthracene*
Acenaphthylene Chrysene*
Fluorene Benzo(b)fluoranthene*
Phenanthrene Benzo(k)fluoranthene*
Anthracene Benzo(a)pyrene*
Fluoranthene Dibenz(a,h)anthracene*
Pyrene Indeno(1,2,3-cd)pyrene*
The pollutants with asterisks (*) correspond to a subset of seven PAHs that have been identified
by the International Agency for Research on Cancer (IARC) as animal carcinogens and have been
studied by the EPA as potential human carcinogens.2
1-1
SECTION 1.0
PURPOSE OF DOCUMENT
The U.S. Environmental Protection Agency (EPA), State, and local air pollution
control agencies are becoming increasingly aware of the presence of substances in the ambient air
that may be toxic at certain concentrations. This awareness, in turn, has led to attempts to
identify source/receptor relationships for these substances and to develop control programs to
regulate emissions. Unfortunately, limited information is available on the ambient air
concentrations of these substances or about the sources that may be discharging them to the
atmosphere.
To assist groups interested in inventorying air emissions of various potentially
toxic substances, EPA is preparing a series of locating and estimating (L&E) documents such as
this one that compiles available information on sources and emissions of these substances. Other
documents in the series are listed below:
Substance or Source Category EPA Publication Number
Acrylonitrile EPA-450/4-84-007a
Arsenic EPA-454/R-98-013
Benzene EPA-454/R-98-011
1,3-Butadiene EPA-454/R-96-008
Cadmium EPA-454/R-93-040
Carbon Tetrachloride EPA-450/4-84-007b
Chlorobenzenes (revised) EPA-454/R-93-044
Chloroform EPA-450/4-84-007c
Chromium EPA-450/4-84-007g
Chromium (supplement) EPA-450/2-89-002
Coal and Oil Combustion Sources EPA-450/2-89-001
Cyanide Compounds EPA-454/R-93-041
Epichlorohydrin EPA-450/4-84-007j
Ethylene Oxide EPA-450/4-84-007l
Substance or Source Category EPA Publication Number
1-2
Ethylene Dichloride EPA-450/4-84-007d
Formaldehyde EPA-450/2-91-012
Lead EPA-454/R-98-006
Manganese EPA-450/4-84-007h
Medical Waste Incinerators EPA-454/R-93-053
Mercury and Mercury Compounds EPA-453/R-93-023
Methyl Chloroform EPA-454/R-93-045
Methyl Ethyl Ketone EPA-454/R-93-046
Methylene Chloride EPA-454/R-93-006
Municipal Waste Combustors EPA-450/2-89-006
Nickel EPA-450/4-84-007f
Organic Liquid Storage Tanks EPA-450/4-88-004
Perchloroethylene and Trichloroethylene EPA-450/2-90-013
Phosgene EPA-450/4-84-007i
Polychlorinated Biphenyls (PCB) EPA-450/4-84-007n
Sewage Sludge Incineration EPA-450/2-90-009
Styrene EPA-454/R-93-011
Toluene EPA-454/R-93-047
Vinylidene Chloride EPA-450/4-84-007k
Xylenes EPA-454/R-93-048
This document deals specifically with polycyclic organic matter (POM). Its
intended audience includes Federal, State, and local air pollution personnel and others who are
interested in locating potential emitters of POM and estimating their air emissions.
Because of the limited availability of data on potential sources of POM emissions
and the variability in process configurations, control equipment, and operating procedure among
facilities, this document is best used as a primer on (1) types of sources that may emit POM,
(2) process variations and release points that may be expected, and (3) available emissions
information on the potential for POM releases into the air. The reader is cautioned against using
1-3
the emissions information in this document to develop an exact assessment of emissions from
any particular facility. Because of the limited background data available, the information
summarized in this document does not and should not be assumed to represent the source
configuration or emissions associated with any particular facility.
This document represents an update to a previous L&E document for POM that
was published by the EPA in 1987. Since that time there has been new research and testing
associated with some of the source categories that were previously identified. Also, new source
categories emitting POM have been identified and some source categories discussed in the
previous document are no longer in existence. For this update, an effort was made to obtain
more up-to-date information from an extensive literature search. The search was limited to the
years 1986 to the present and to items in the English language.
Databases searched include the following:
& Factor Information Retrieval System (FIRE) - which containsemission factors and other information for a variety of sourcecategories;
& CASEARCH - which contains information on chemistry andapplications literature;
& INSPEC - A database of physics, electronics, and computerabstracts;
& NTIS - which contains information on government-sponsoredresearch, development, engineering, and analysis activities;
& COMPENDEX PLUS - A database of literature from theengineering sciences; and
& APILIT - A database maintained by the American PetroleumInstitute, containing information on activities related to thepetroleum industry.
The literature search identified several hundred potential references or citations.
These citations were journal articles, handbooks and texts, Federal and State documents, and
1-4
conference papers. The list of titles and abstracts from the literature search were reviewed to
identify: (1) new information for known source categories, (2) additional source categories, and
(3) test data for categories that were not otherwise well characterized.
Another potential source of emissions data for POM is the Toxic Chemical
Release Inventory (TRI) reporting data required by Section 313 of Title III of the Superfund
Amendments and Reauthorization Act of 186 (SARA 313). SARA 313 requires owners and
operators of certain facilities that manufacture, import, process, or otherwise use certain toxic
chemicals to report annually their releases of these chemicals to any environmental media. As
part of SARA 313, EPA provides public access to the annual emissions data.
The reader is cautioned that TRI will not likely provide facility, emissions, and
chemical release data sufficient for conducting detailed exposure modeling and risk assessment.
In many cases, the TRI data are based on annual estimates of emissions (i.e., on emission factors,
material balance calculations, and engineering judgment). Also, TRI includes only a limited
number of POM compounds; there are many more POM compounds that are emitted to the air
and which are included in this document. We recommend the use of TRI data in conjunction
with the information provided in this document to locate potential emitters of POM and to make
preliminary estimates of air emissions from these facilities.
As standard procedure, L&E documents are sent to government, industry, and
environmental groups for review wherever EPA is aware of expertise. These groups are given
the opportunity to review the document, comment on its contents, and provide additional data
where applicable. Where necessary, the document is then revised to incorporate these comments.
Although this document has undergone extensive review, there may still be shortcomings.
Comments subsequent to publication are welcome and will be addressed based on available time
and resources. In addition, any information on process descriptions, operating parameters,
1-5
control measures, and emissions information that would enable EPA to improve on the contents
of this document is welcome. Comments and information may be sent to the following address:
Group LeaderEmission Factor and Inventory Group (MD-14)Office of Air Quality Planning and StandardsU. S. Environmental Protection AgencyResearch Triangle Park, North Carolina 27711
2-1
SECTION 2.0
OVERVIEW OF DOCUMENT CONTENTS
This section provides an overview of the contents of this document. It briefly
outlines the nature, extent, and format of the material presented in the remaining sections of this
report.
Section 3.0 of this document provides a brief summary of the physical and
chemical characteristics of POM, its basic formation mechanisms, and its potential
transformations in ambient air. This background section may be useful to someone who needs to
develop a general perspective on the nature of POM, how it is defined, and how it is formed in
the combustion process.
Section 4.0 of this document focuses on major sources of POM air emissions.
Stationary, mobile, and natural sources of POM air emissions are discussed. For each air
emission source category described in Section 4.0, the following subsections are discussed: (1) a
general process description, including emissions control techniques, (2) emission factor
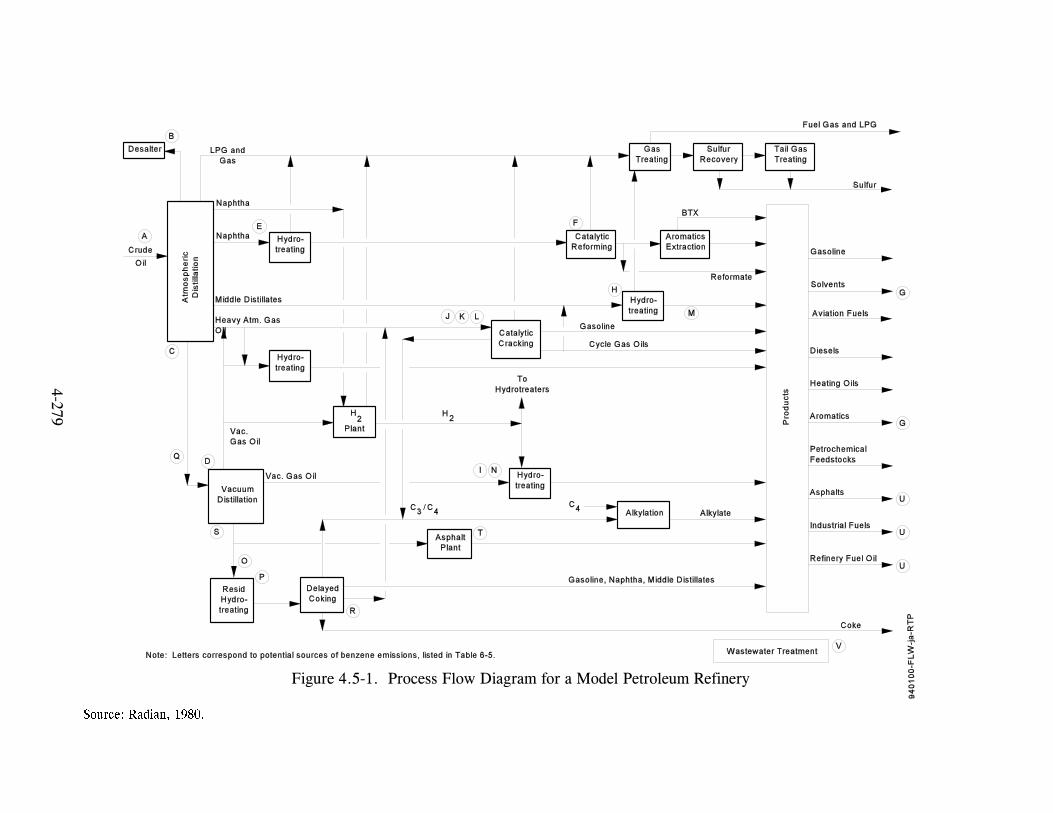
development, and (3) source location. Flow diagrams are provided for most of the
industry-based categories, identifying potential points of emissions. The emission factor
subsections provide a discussion of available data for each source category and present the
emission factors in tabular format. For certain source categories, emission factor data were not
available; in these cases only a process description and source location discussion are provided.
Within the source location subsections, the names and locations of all major stationary source
facilities known to be operating and potentially emitting POM are presented (for industries
having 100 or less facilities). For area sources of POM emissions with distinct national
distributions, and industries with over 100 facilities, geographic areas where such activities
primarily occur are identified.
Section 5.0 describes evaporative emission sources from the production and use of
naphthalene, which is a specific POM compound. Naphthalene is one of the lighter weight POM
compounds that can be emitted through volatilization. The source categories described in
2-2
Section 5.0 involve the direct production and use of naphthalene, which is commercially
produced and widely consumed.
Section 6.0 of this document summarizes available procedures for source
sampling and analysis of POM. The summaries provide an overview of applicable sampling
procedures and cites references for those interested in conducting source tests.
Appendix A provides a summary of emission factors used by the EPA in
developing national emission estimates for POM as part of the supporting data to develop a
national strategy to control POM emissions under Section 112(c)(6) of the Clean Air Act (CAA).
Section 3.2 of this document provides information on the development of the emission factors in
Appendix A.
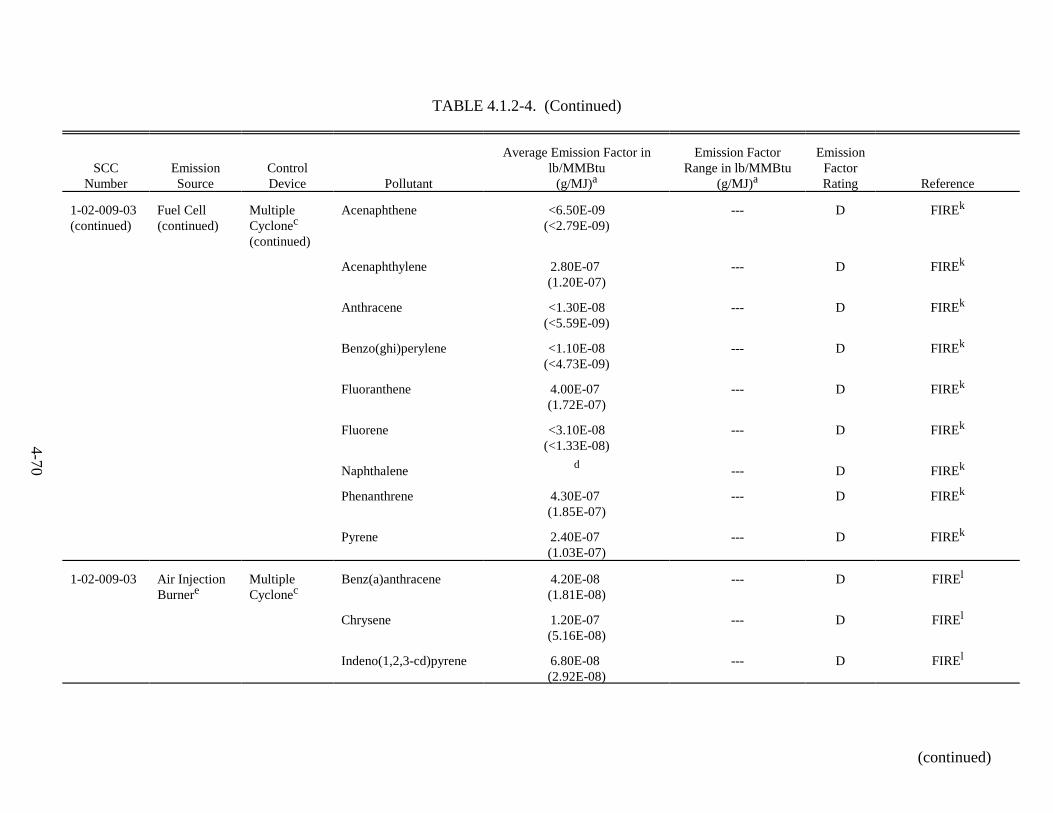
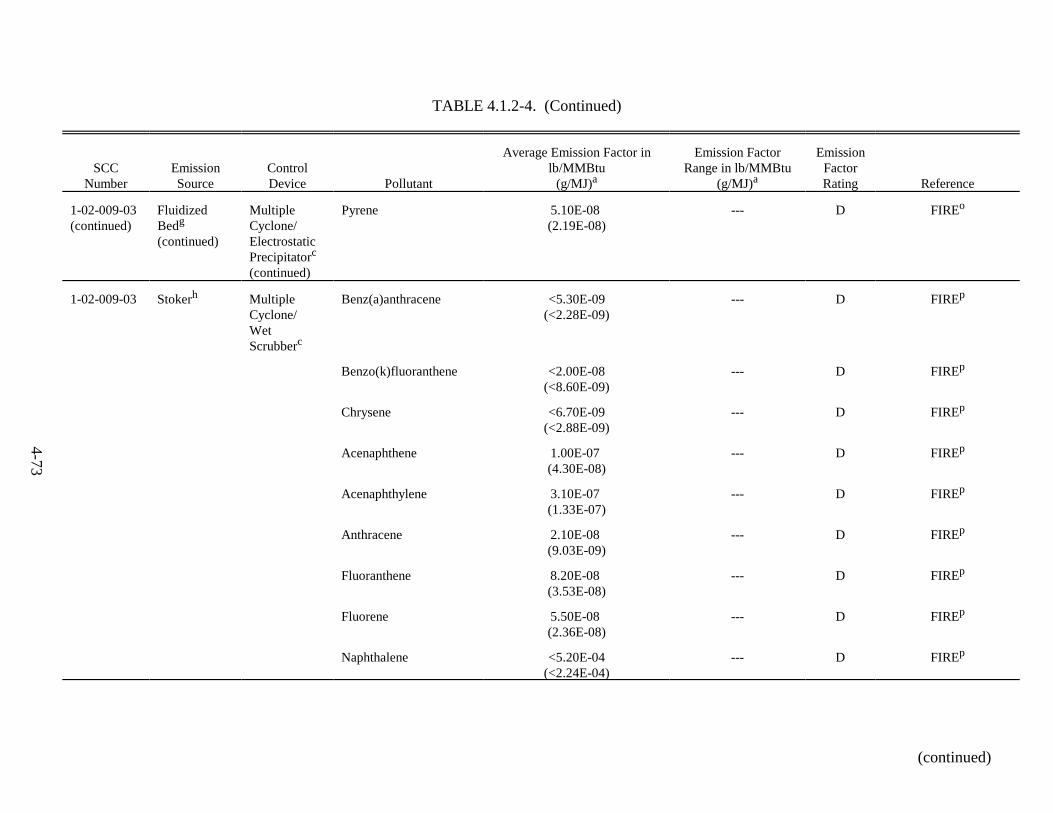
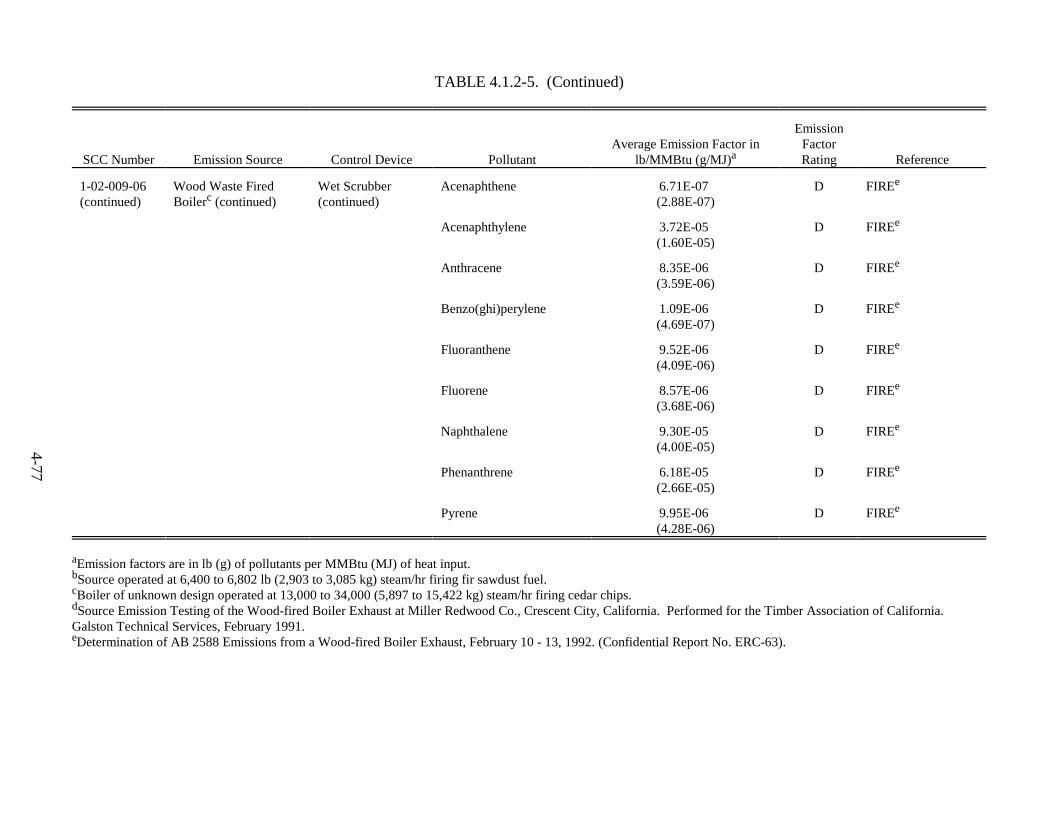
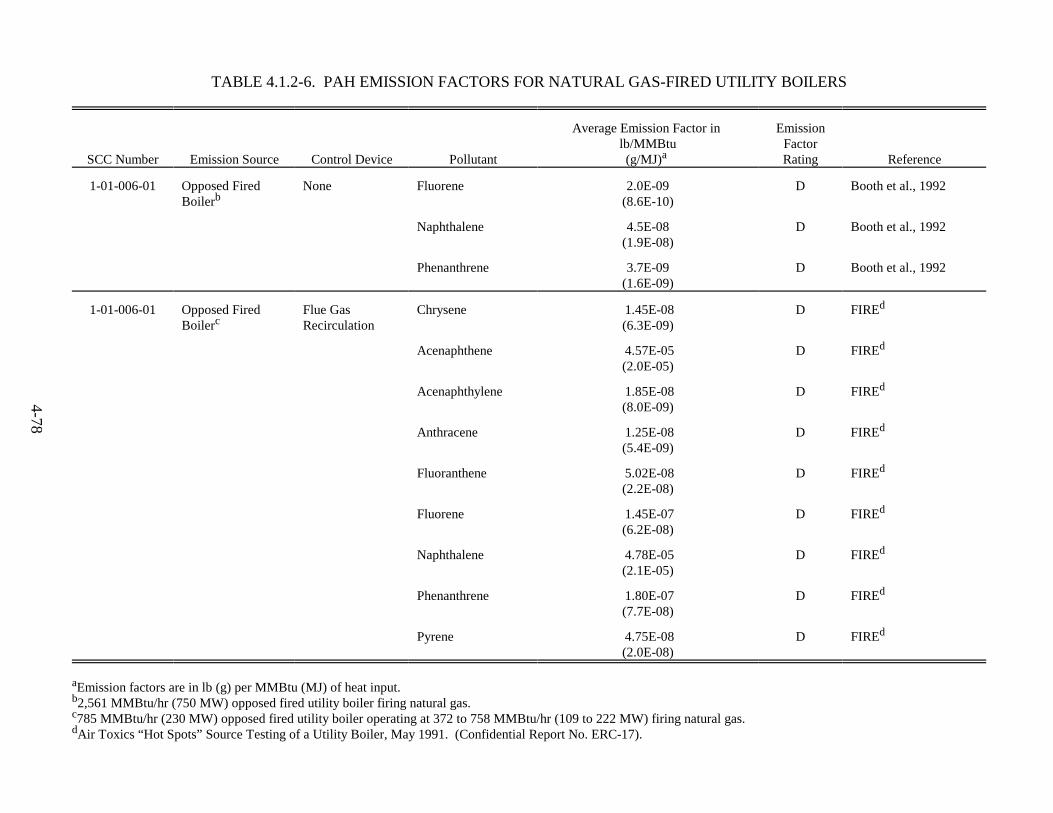
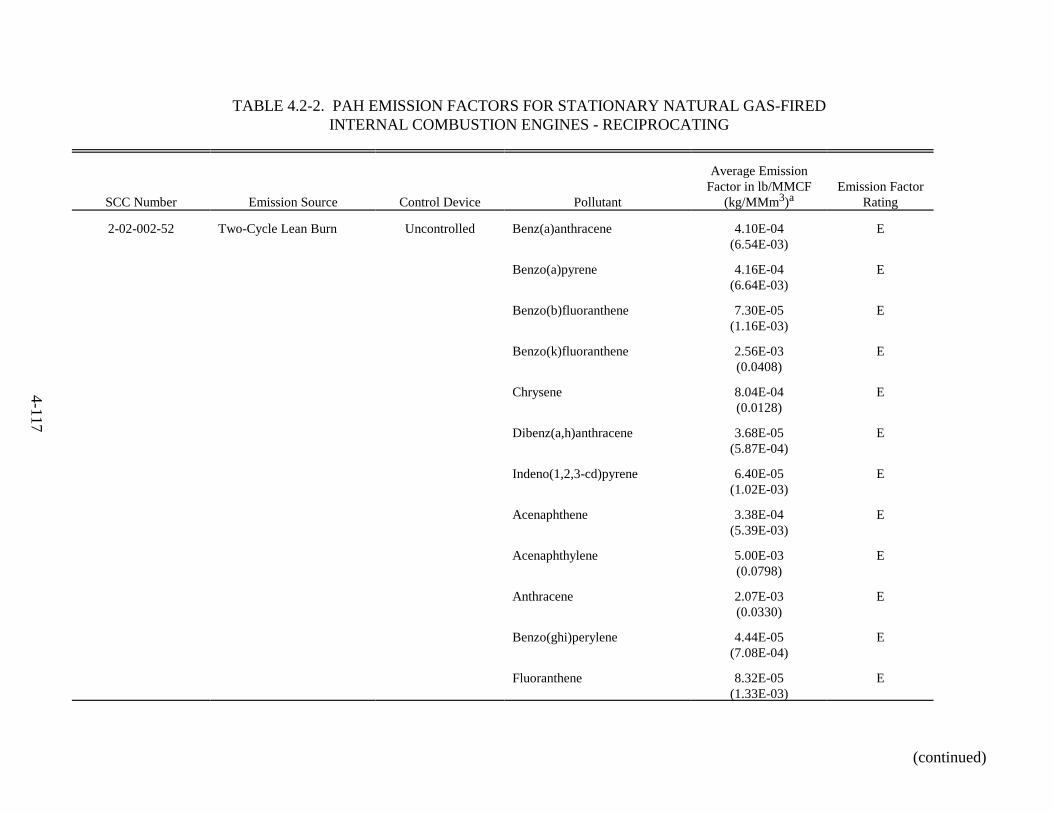
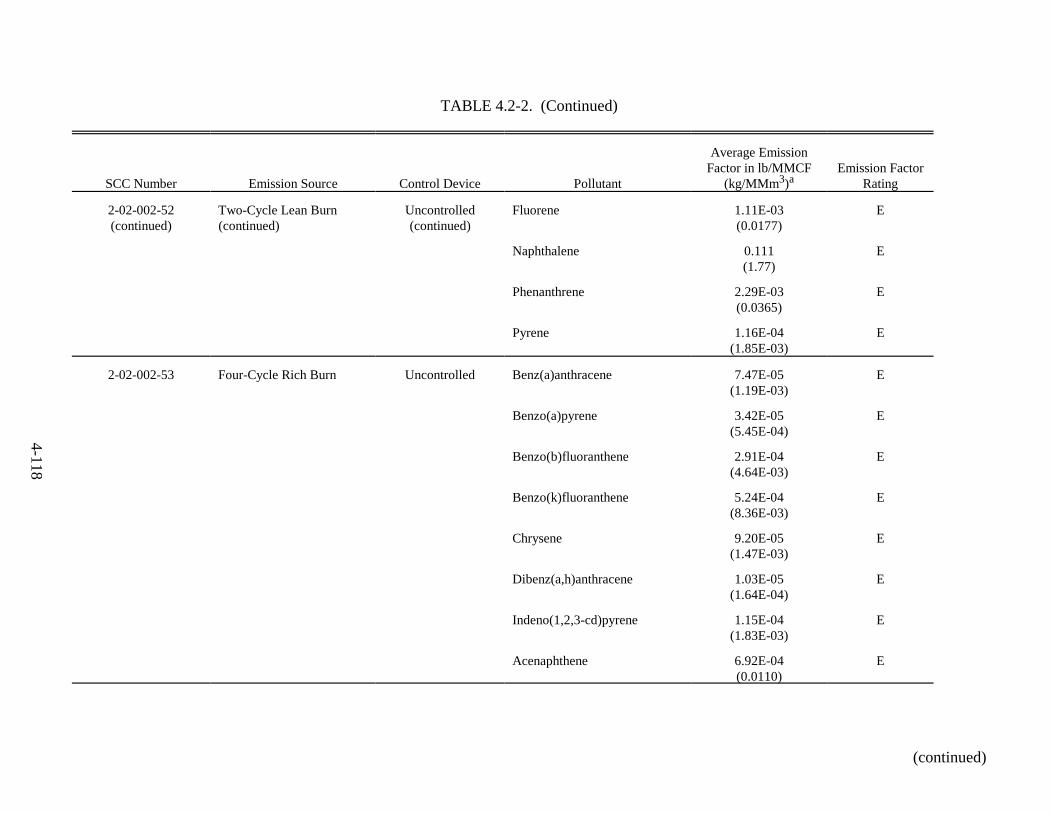
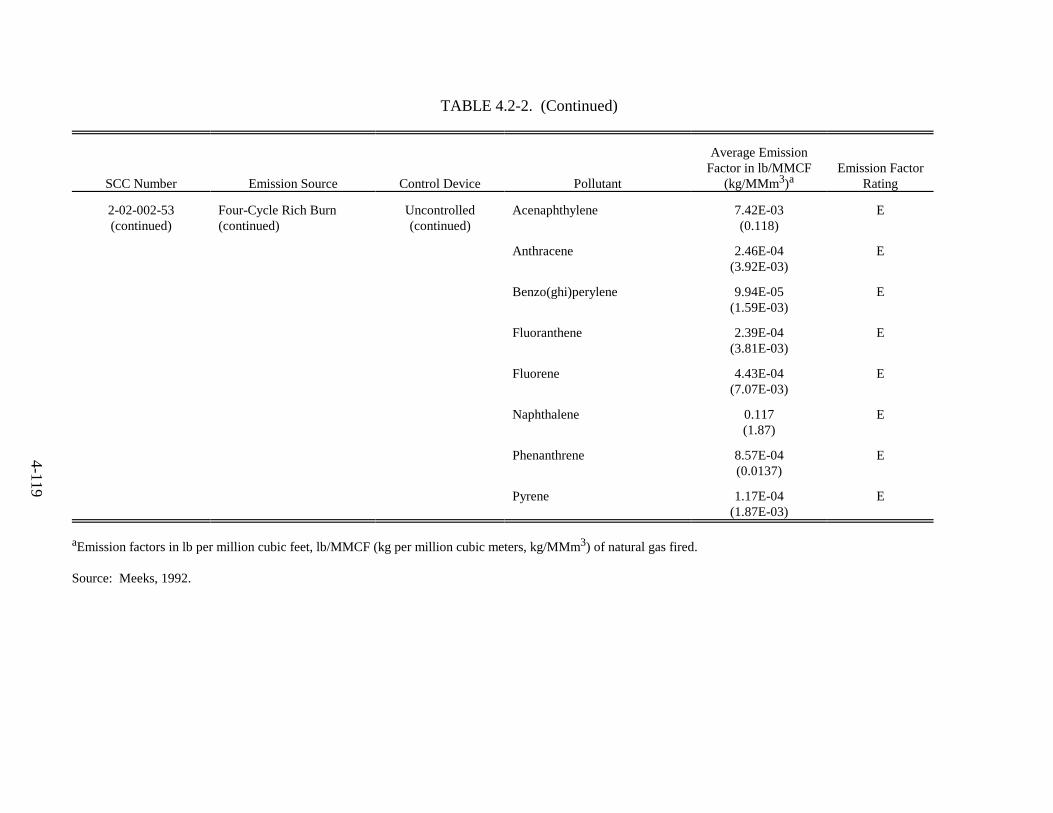
Each emission factor listed in Sections 4.0 and 5.0 was assigned an emission
factor rating (A, B, C, D, E, or U) based on the criteria for assigning data quality ratings and
emission factor ratings as required in the document Procedures for Preparing Emission Factor
Documents (U.S. EPA, 1997). The criteria for assigning the data quality ratings are as follows:
A - Tests are performed by using an EPA reference test method, or when notapplicable, a sound methodology. Tests are reported in enough detail foradequate validation, and raw data are provided that can be used to duplicate theemission results presented in the report.
B - Tests are performed by a generally sound methodology, but lacked enoughdetail for adequate validation. Data are insufficient to completely duplicate theemission result presented in the report.
C - Tests are based on an unproven or new methodology, or are lacking asignificant amount of background information.
D - Tests was based on a generally unacceptable method, but the method mayprovide an order-of-magnitude value for the source.
Once the data quality ratings for the source tests had been assigned, these ratings
along with the number of source tests available for a given emission point were evaluated.
Because of the almost impossible task of assigning a meaningful confidence limit to
2-3
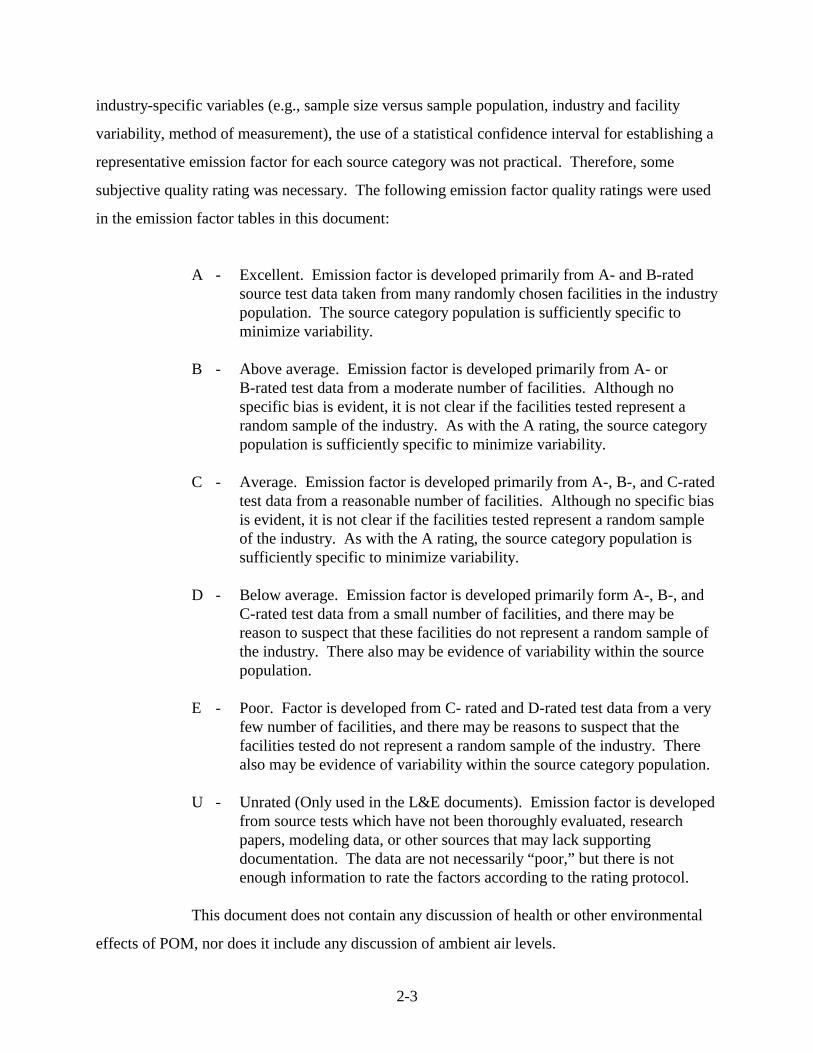
industry-specific variables (e.g., sample size versus sample population, industry and facility
variability, method of measurement), the use of a statistical confidence interval for establishing a
representative emission factor for each source category was not practical. Therefore, some
subjective quality rating was necessary. The following emission factor quality ratings were used
in the emission factor tables in this document:
A - Excellent. Emission factor is developed primarily from A- and B-ratedsource test data taken from many randomly chosen facilities in the industrypopulation. The source category population is sufficiently specific tominimize variability.
B - Above average. Emission factor is developed primarily from A- orB-rated test data from a moderate number of facilities. Although nospecific bias is evident, it is not clear if the facilities tested represent arandom sample of the industry. As with the A rating, the source categorypopulation is sufficiently specific to minimize variability.
C - Average. Emission factor is developed primarily from A-, B-, and C-ratedtest data from a reasonable number of facilities. Although no specific biasis evident, it is not clear if the facilities tested represent a random sampleof the industry. As with the A rating, the source category population issufficiently specific to minimize variability.
D - Below average. Emission factor is developed primarily form A-, B-, andC-rated test data from a small number of facilities, and there may bereason to suspect that these facilities do not represent a random sample ofthe industry. There also may be evidence of variability within the sourcepopulation.
E - Poor. Factor is developed from C- rated and D-rated test data from a veryfew number of facilities, and there may be reasons to suspect that thefacilities tested do not represent a random sample of the industry. Therealso may be evidence of variability within the source category population.
U - Unrated (Only used in the L&E documents). Emission factor is developedfrom source tests which have not been thoroughly evaluated, researchpapers, modeling data, or other sources that may lack supportingdocumentation. The data are not necessarily “poor,” but there is notenough information to rate the factors according to the rating protocol.
This document does not contain any discussion of health or other environmental
effects of POM, nor does it include any discussion of ambient air levels.
2-4
SECTION 2.0 REFERENCES
U.S. Environmental Protection Agency. Procedures for Preparing Emission Factor Documents. Research Triangle, North Carolina. EPA-454/R-95-015. November 1997.
���
SECTION 3.0
BACKGROUND
3.1 NATURE OF POLLUTANT
The term polycyclic organic matter (POM) defines a broad class of compounds
which generally includes all organic structures having two or more fused aromatic rings
(i.e., rings which share a common border). Further definition is provided in Section 112(b)(1) of
the 1990 Clean Air Act Amendments (CAAA), where POM is listed as a hazardous air pollutant
(HAP) with a footnote stating that it includes organic compounds with more than one benzene
ring, and which have a boiling point greater than or equal to 212(F (100(C). Polycyclic organic
matter has been identified with up to seven fused rings and, theoretically, millions of POM
compounds could be formed; however, only about 100 species have been identified and studied
and typically only a small fraction of these are regularly tested for as part of emissions
measurement programs (U.S. EPA, 1980). Any effort to quantify emissions of POM relies on the
group of compounds or analytes targeted by the test method employed.
Eight major categories of compounds have been defined by the EPA to constitute
the class known as POM (U.S. EPA, 1975; Lahre, 1987). The categories are as follows:
1. Polycyclic aromatic hydrocarbons (PAHs) - the PAHs includenaphthalene, phenanthrene, anthracene, fluoranthene,acenaphthalene, chrysene, benz(a)anthracene,cyclopenta(cd)pyrene, the benzpyrenes, indeno(1,2,3-cd)pyrene,benzo(ghi)perylene, coronene, and some of the alkyl derivatives ofthese compounds. PAHs are also known as polynuclear aromatics(PNAs).
2. Aza arenes - aromatic hydrocarbons containing nitrogen in aheterocyclic ring.
3. Imino arenes - aromatic hydrocarbons containing a carbon-nitrogendouble bond (C=NH).
4. Carbonyl arenes - aromatic hydrocarbons containing a one ringcarbonyl divalent group (C=O).
���
5. Dicarbonyl arenes - also known as quinones; contain two ringcarbonyl divalent groups.
6. Hydroxy carbonyl arenes - carbonyl arenes containing hydroxygroups and possibly alkoxy or acyloxy groups.
7. Oxa arenes and thia arenes - oxa arenes are aromatic hydrocarbonscontaining an oxygen atom in a heterocyclic ring; thia arenes arearomatic hydrocarbons containing a sulfur atom in a heterocyclicring.
8. Polyhalo compounds - some polyhalo compounds, such aspolychlorinated dibenzo-p-dioxins (PCDDs) and polychlorinateddibenzofurans (PCDFs), may be considered as POM although theydo not have two or more fused aromatic rings.
These categories were developed to better define and standardize the types of compounds
considered to be POM.
The POM chemical groups most commonly tested for and reported in emission
source exhaust and ambient air are PAHs, which contain carbon and hydrogen only. Information
available in the literature and from emissions testing on POM compounds generally pertains to
PAHs. Because of the dominance of PAH information (as opposed to other POM categories) in
the literature, many reference sources have inaccurately used the terms POM and PAH
interchangeably. By definition, all PAH compounds can be classified as POM but not all POM
compounds can be defined as PAHs. This issue becomes important when comparing POM
inventory and emissions data from different references sources where the term “POM” is not
explicitly defined. In these cases POM could represent two entirely different sets of compounds,
and therefore would not be suitable for direct comparison.
3.2 FORMAT OF POM DATA FOR THE DOCUMENT
In order to avoid the historical problems of using a singular “POM” listing for
emission factor data and information, the emission factor tables presented in Sections 4.0 and 5.0
of this report show individual POM compounds, most of which could be classified as PAH. This
���
allows for a direct calculation of emissions for a known compound. The discussions
accompanying each table will generally refer to “POM” compounds when describing processes
or operations that affect the class of compounds as a whole. However, where the information is
specific to PAHs, the discussion utilizes the “PAH” terminology.
The following list of 16 PAHs were designated by EPA as compounds of interest under a
suggested procedure for reporting test measurement results (U.S. EPA, 1988). The 16 PAHs
included in this measurement procedure are:
Naphthalene Benzo(ghi)perylene
Acenaphthene Benz(a)anthracene*
Acenaphthylene Chrysene*
Fluorene Benzo(b)fluoranthene*
Phenanthrene Benzo(k)fluoranthene*
Anthracene Benzo(a)pyrene*
Fluoranthene Dibenz(a,h)anthracene*
Pyrene Indeno(1,2,3-cd)pyrene*
These 16 compounds are routinely detected and reported from source tests as they are target
analytes in standard EPA and State sampling and analytical methods. The pollutants with
asterisks (*) correspond to the subset of seven PAHs. These seven PAHs have been identified by
the International Agency for Research on Cancer (IARC) as animal carcinogens and have been
studied by the EPA as potential human carcinogens (U.S. EPA, 1993).
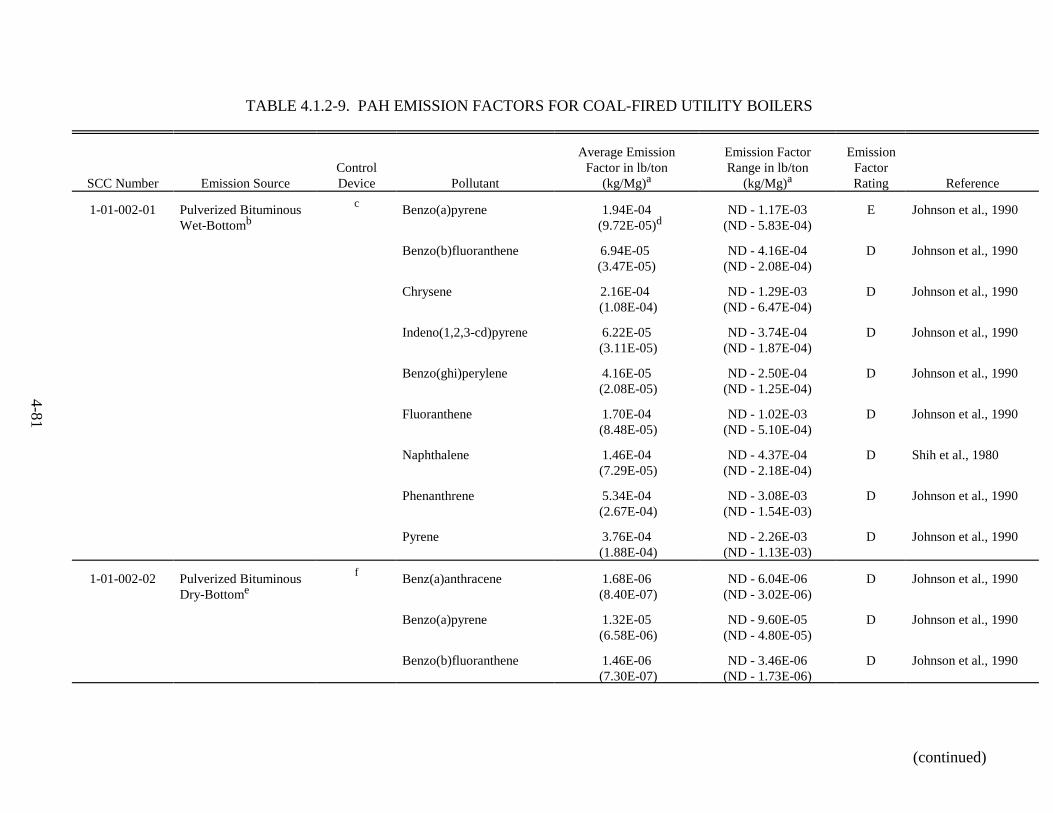
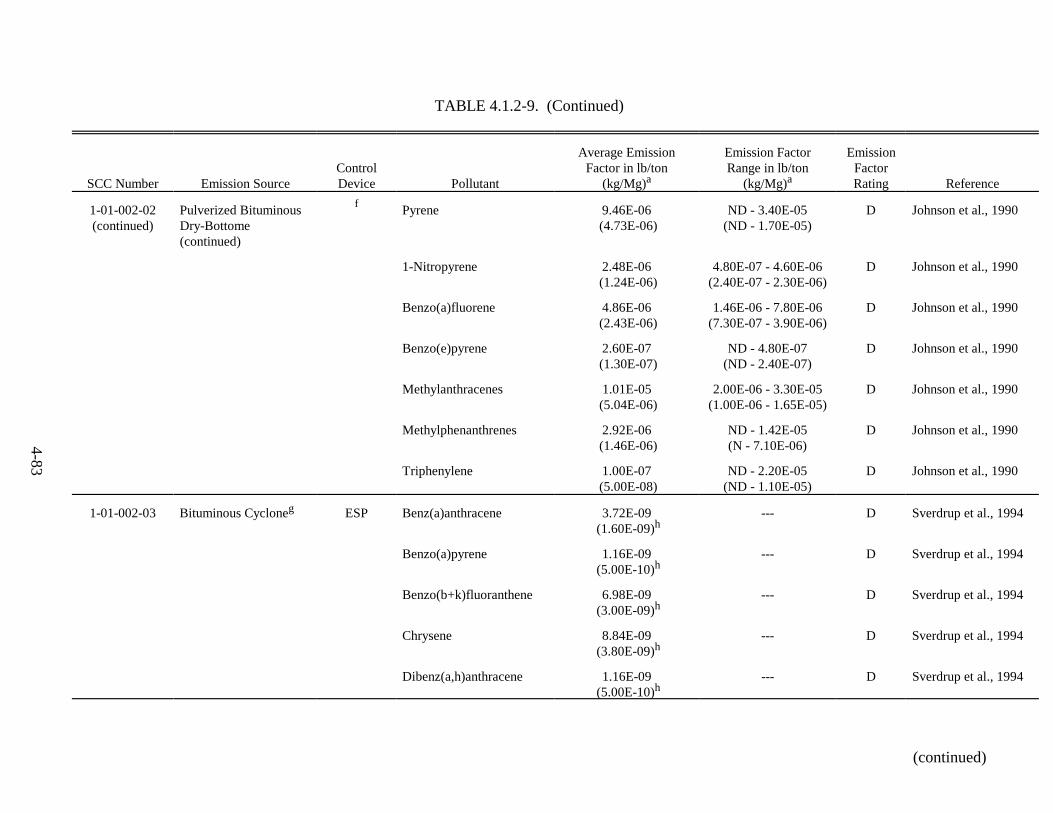
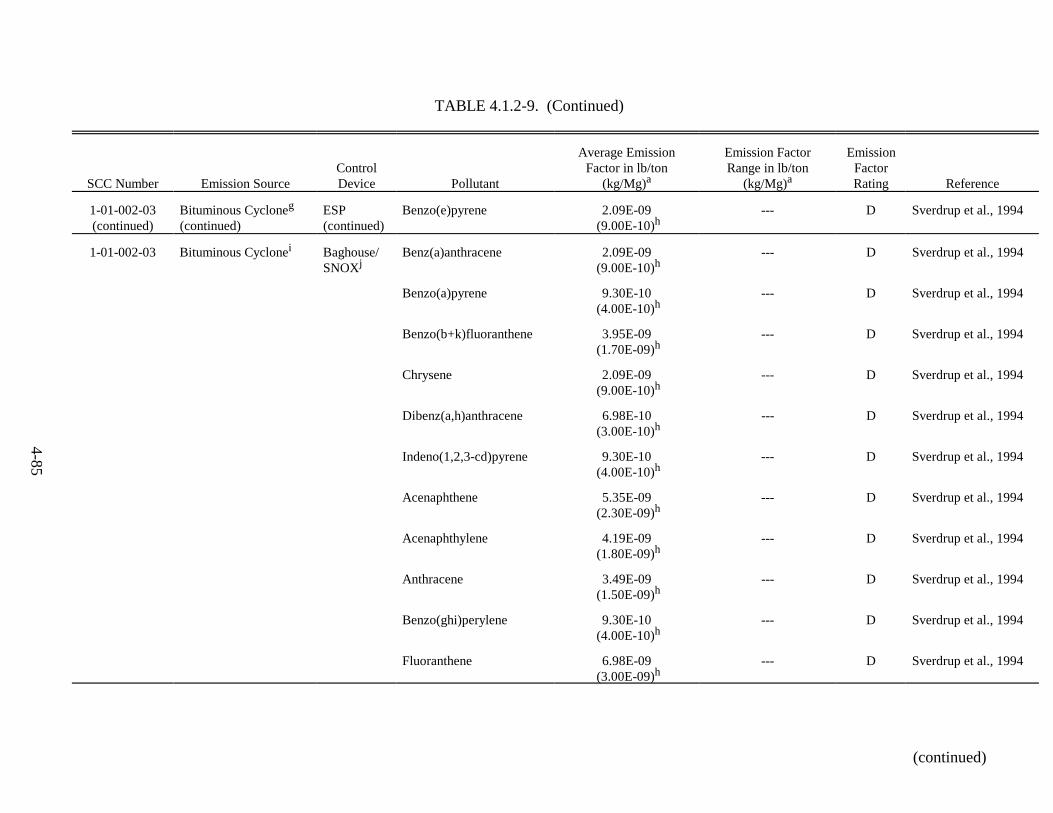
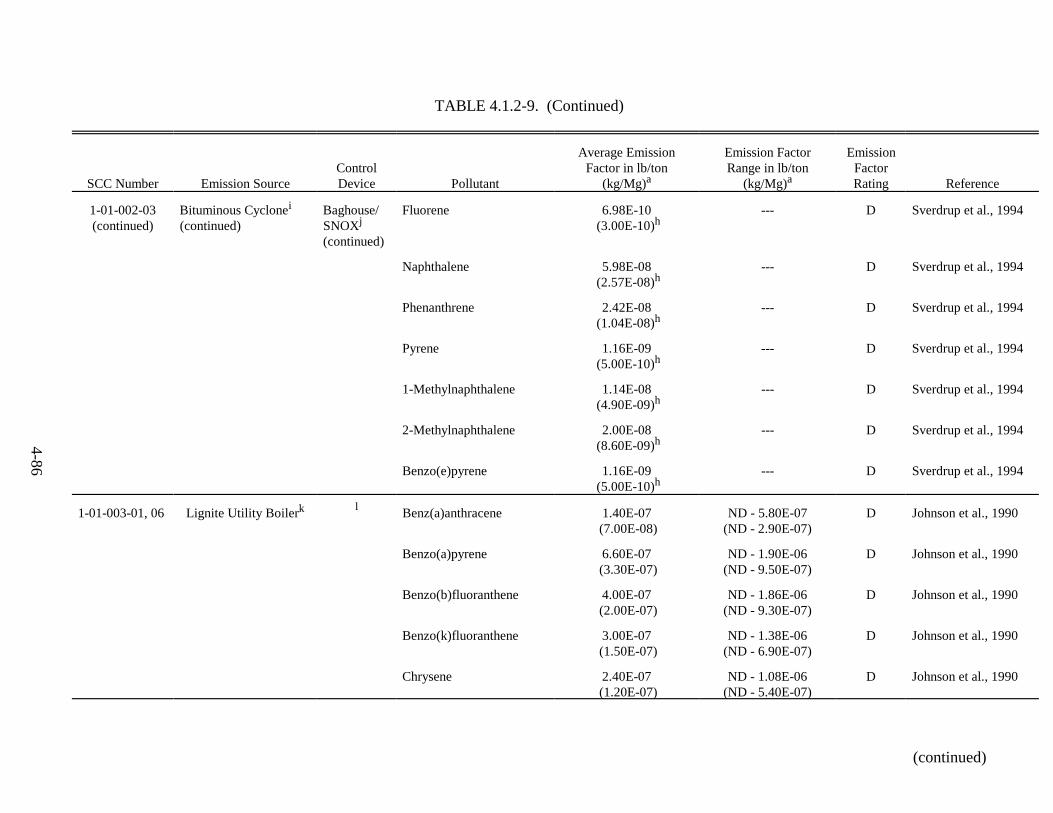
The emission factor tables in Sections 4.0 and 5.0 first list all of the 7-PAH
compounds. The rest of the 16-PAH group of compounds are listed next. Other POM
compounds that are not part of the 16-PAH subset are listed at the end of each table. For some
source categories, there were not individual PAH emission factors for all 16 PAHs in the subset;
therefore, the list of compounds varies from source to source in some cases. However, in all
cases, the order of pollutants begins with compounds from the 7-PAH subset; followed by the
���
remaining compounds from the 16-PAH grouping, and finally, any other POM compounds for
which emission factor data were found.
Appendix A provides a summary of 7-PAH and 16-PAH emission factors for
source categories for which the EPA has developed national emission estimates to meet the
requirements of Section 112 (c)(6) of the CAAA. Section 112 (c)(6) requires the EPA to look at
seven specific pollutants, including POM, in order to develop a national strategy to control these
pollutants. The source categories listed in Appendix A do not represent all the potential POM
source categories discussed in this document. The EPA did not always have activity levels to
match to the available emission factors for every source category, so Appendix A only contains
those categories for which an activity level was available to calculate national emissions.
The 7-PAH and 16-PAH emission factors in Appendix A are presented as the sum
of the individual POM compounds making up the 16-PAH and 7-PAH subsets as described
above. For most of the source categories listed in Appendix A, the 16-PAH and 7-PAH emission
factors were derived from the individual POM compound emission factors presented in the
emission factor tables in this document. The exceptions are the “Ferroalloy Manufacturing” and
the “Onroad Vehicles” source categories; the 16-PAH and 7-PAH emission factors contained in
Appendix A for these source categories were developed by EPA specifically for the purpose of
the national emission inventory efforts and were not derived from the emission factor tables
contained in this document for those categories. The 16-PAH and 7-PAH emission factors for
these categories were developed by EPA from alternative sources for which background
information on the individual POM compounds included in the 16-PAH and 7-PAH subsets was
not available to present in a consistent format with this document (i.e., individual POM species
factors were not available). When using the emission factors in Appendix A, the user should
keep in mind that these were developed to be representative of nationwide activity and do not, in
many cases, represent the particularities of a specific site. If modeling specific site conditions, or
if the focus is on individual POM compounds, the user should refer to the emission factor tables
for the particular source category contained in this document.
���
Because POM is not one compound but potentially several thousand, it is not
reasonable to describe the properties and characteristics of all POM compounds. Instead, general
background information is provided for the primary POM compounds, such as PAHs, that are
known to exist in ambient air. Considerably more detailed data on POM chemical and physical
properties exist than are presented in this document. The prevalent, more useful information is
presented here to provide an understanding of the basic nature of POM compounds and
emissions. The references cited at the end of each section contain useful information and should
be consulted when further detail is required.
3.3 NOMENCLATURE AND STRUCTURE OF SELECTED POMs
In the past, the nomenclature of POM compounds has not been standardized and
ambiguities have existed due to different peripheral numbering systems. The currently accepted
nomenclature is that adopted by the International Union of Pure and Applied Chemistry (IUPAC)
and by the Chemical Abstracts Service Registry (National Academy of Sciences, 1972). The
following rules help determine the orientation from which the numbering is assigned:
1. The maximum number of rings lie in a horizontal row;
2. As many rings as possible are above and to the right of thehorizontal row; and
3. If more than one orientation meets these requirements, the one withthe minimum number of rings at the lower left is chosen (Loeningand Merrit, 1983).
The carbons are then numbered in a clockwise fashion, starting with the first
counterclockwise carbon which is not part of another ring and is not engaged in a ring fusion.
Letters are assigned in alphabetical order to faces of rings, beginning with “a” for the side
between carbon atoms 1 and 2 and continuing clockwise around the molecule. Ring faces
common to two rings are not lettered. The molecular structures of the more predominantly
identified and studied POM compounds (mainly PAHs) are shown in Figure 3-1.
���
Figure 3-1. Structures of Selected Polycyclic Aromatic Orgaic Molecules
Source: U.S. EPA, 1978.
���
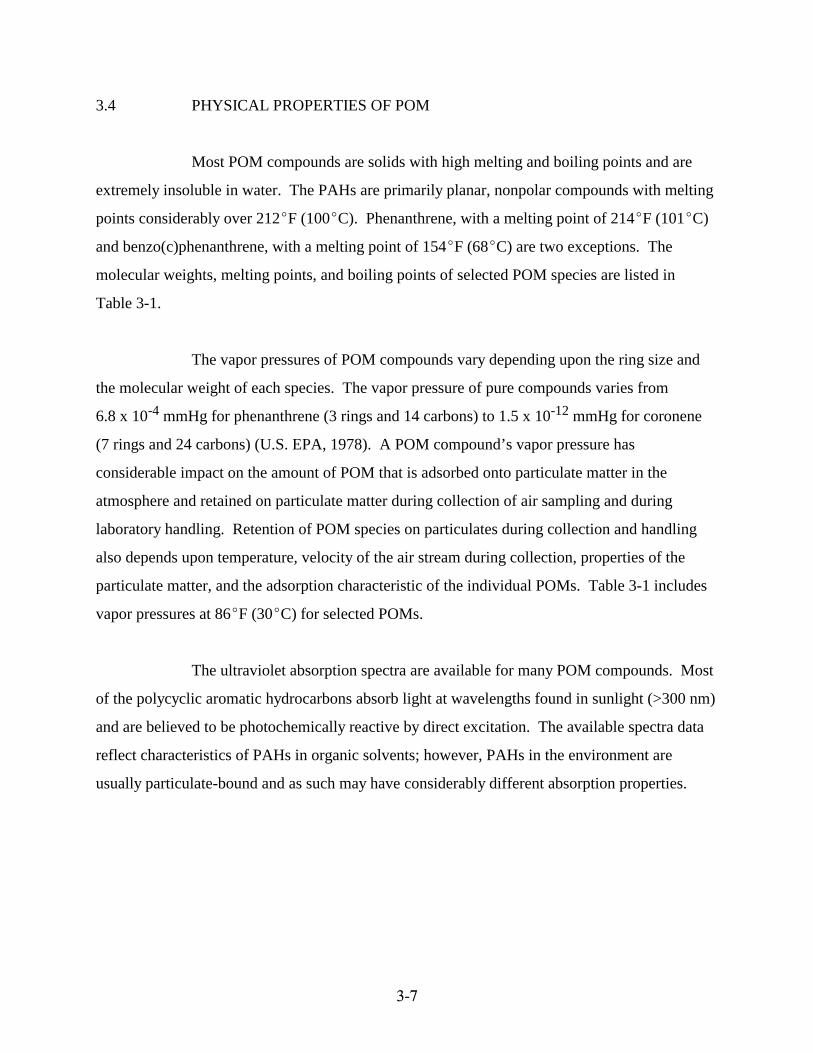
3.4 PHYSICAL PROPERTIES OF POM
Most POM compounds are solids with high melting and boiling points and are
extremely insoluble in water. The PAHs are primarily planar, nonpolar compounds with melting
points considerably over 212(F (100(C). Phenanthrene, with a melting point of 214(F (101(C)
and benzo(c)phenanthrene, with a melting point of 154(F (68(C) are two exceptions. The
molecular weights, melting points, and boiling points of selected POM species are listed in
Table 3-1.
The vapor pressures of POM compounds vary depending upon the ring size and
the molecular weight of each species. The vapor pressure of pure compounds varies from
6.8 x 10 mmHg for phenanthrene (3 rings and 14 carbons) to 1.5 x 10 mmHg for coronene-4 -12
(7 rings and 24 carbons) (U.S. EPA, 1978). A POM compound’s vapor pressure has
considerable impact on the amount of POM that is adsorbed onto particulate matter in the
atmosphere and retained on particulate matter during collection of air sampling and during
laboratory handling. Retention of POM species on particulates during collection and handling
also depends upon temperature, velocity of the air stream during collection, properties of the
particulate matter, and the adsorption characteristic of the individual POMs. Table 3-1 includes
vapor pressures at 86(F (30(C) for selected POMs.
The ultraviolet absorption spectra are available for many POM compounds. Most
of the polycyclic aromatic hydrocarbons absorb light at wavelengths found in sunlight (>300 nm)
and are believed to be photochemically reactive by direct excitation. The available spectra data
reflect characteristics of PAHs in organic solvents; however, PAHs in the environment are
usually particulate-bound and as such may have considerably different absorption properties.
���
TABLE 3-1. PHYSICAL PROPERTIES OF VARIOUS POM COMPOUNDS
Compound Chemical Formula Molecular Weight Melting Point (F ((C) Boiling Point (F ((C)aVapor Pressureb
(mmHg)
Napthalene C H10 8 128.19 177 (80.5) 424 (218) NRc
Acenaphthene C H12 10 154.21 187 (96.2) 534 (279) NR
Fluorene C H13 10 166.22 241-243 (116 - 117) 563 (295) NR
Anthracene C H14 10 178.24 422-423 (216.5 - 217.2) 644 (339.9) 1.95 x 10⁻⁴
Phenanthrene C H14 10 178.24 212-214 (100 - 101) 644 (340) 6.8 x 10⁻⁴
Fluoranthene C H16 10 202.26 231-232 (110.6 - 111.0) 739 (393) NR
Pyrene C H16 10 202.26 306-307 (152.2 - 152.9) 680 (360) 6.85 x 10⁻⁷
Benz(a)anthracene C H18 12 228.30 319-321 (159.5 - 160.5) 815 (435) 1.1 x 10⁻⁷
Chrysene C H18 12 228.30 482-489 (250 - 254) 838 (448) NR
Benzo(a)pyrene C H20 12 252.32 350-352 (176.5 - 177.5) 592 (311) 5.5 x 10⁻⁹
Benzo(k)fluoranthene C H20 12 252.32 420-421 (215.5 - 216) NR 9.6 x 10⁻¹¹
Perylene C H20 12 252.32 523-525 (273 - 274) 932 (500) NR
Benzo(ghi)perylene C H22 12 276.33 523 (273) NR 1.01 x 10⁻¹⁰
Dibenz(a,h)anthracene C H22 14 278.36 401 (205) NR NR
Coronene C H24 12 300.36 820 (438) 977 (525) 1.47 x 10⁻¹²
Each boiling point is at a pressure of 1 atm, except the boiling point of benzo(a)pyrene is at a pressure of 10 mmHg.a
All vapor pressures are at 86(F (30(C).b
NR means data not reported.c
Sources: U.S. EPA, 1980; Tucker, 1979; U.S. EPA, 1978; CRC, 1983.
���
3.5 CHEMICAL PROPERTIES OF POM
The chemistry of POMs is quite complex and differs from one compound to
another. Most of the information available in the literature concerns the polycyclic aromatic
hydrocarbons. Generally, the PAHs are more reactive than benzene and the reactivities toward
methyl radicals tend to increase with greater conjugation. Conjugated rings are structures which
have double bonds that alternate with single bonds. Conjugated compounds are generally more
stable but, toward free radical addition, they are more reactive (Morrison and Boyd, 1978). For
example, in comparison to benzene, naphthalene and benz(a)anthracene, which have greater
conjugation, react with methyl radicals 22 and 468 times faster, respectively.
The PAHs undergo electrophilic substitution reactions quite readily. An
electrophilic reagent attaches to the ring to form an intermediate carbonium ion; to restore the
stable aromatic system, the carbonium ion then gives up a proton. Oxidation and reduction
reactions occur to the stage where a substituted benzene ring is formed. Rates of electrophilic,
nucleophilic, and free radical substitution reactions are typically greater for the PAHs than for
benzene.
Environmental factors also influence the reactivity of PAHs. Temperature, light,
oxygen, ozone, other chemical agents, catalysts, and the surface areas of particulates that the
PAHs are adsorbed onto may play a key role in the chemical reactivity of PAHs.
3.6 POM FORMATION
The principle formation mechanism for POM occurs as part of the combustion
process present in many different types of sources. A secondary formation mechanism, primarily
represented by the naphthalene production and use categories (see Section 5.0 of this document),
is the volatilization of light-weight POM compounds. However, the combustion mechanism is
much more significant when looking at overall POM formation, and it also much more complex.
The following discussion focuses on the combustion mechanism for POM formation.
����
3.6.1 POM from Combustion Processes
POM formation occurs as a result of combustion of carbonaceous material under
reducing conditions. The detailed mechanisms are not well understood; however, it is widely
accepted that POM is formed via a free radical mechanism which occurs in the gas phase
(Natusch et al., 1978). As a result, POM originates as a vapor. There is also overwhelming
evidence that POM is present in the atmosphere predominantly in particulate form
(Thomas et al., 1968). Therefore, a vapor to particle conversion must take place between the
points of formation of POM in the combustion source and its entry to the atmosphere.
It has been recognized that soot (a product of coal combustion) is similar in some
structural characteristics to polycyclic aromatic molecules and that both soot and POM are
products of combustion (Electric Power Research Institute [EPRI], 1978). Comparisons of the
two types of molecules give rise to the first clue as to how POM may be formed in combustion,
namely by incomplete combustion and degradation of large fuel molecules such as coal. It is also
known, however, that carbon black and soot are produced by burning methane (CH ). Thus, it is4
believed that POMs are not only produced by degrading large fuel molecules, but are also
produced by polymerizing small organic fragments in rich gaseous hydrocarbon flames. Before
examining POM formation per se, it is instructive to first examine carbon (soot) formation in
combustion. The two are similar phenomena and a closer examination of some of the earlier
studies on soot formation is helpful in understanding POM formation and behavior.
Soot produced in a flame takes on a number of specific characteristics. Soot or
carbon particles may be hard and brittle, soft and fatty, brown to black, and contain anywhere
from almost 0 to 50 percent hydrogen (based on number of atoms). Generally, it is observed that
flame-produced soot is a fluffy, soft material made up of single, almost spherical particles which
stick together. Soot properties appear to be independent of the fuel burned in a homogeneous gas
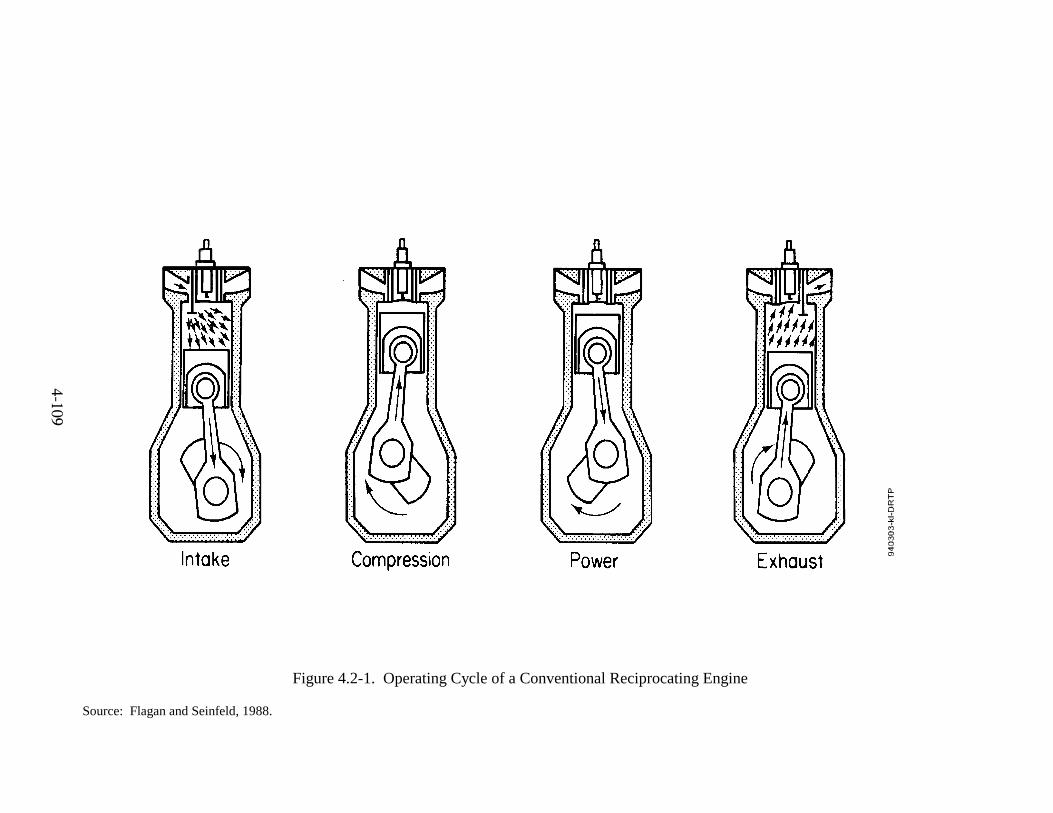
flame. However, if hydrocarbon gases (such as methane, propane, or benzene) are passed down a
hot tube, the carbon product is quite different from the flame-produced soot. The heterogeneous
products are hard, long crystals that are shiny and vitreous.
����
Carbon-producing flames have been identified and labeled as either the acetylenic
type or the benzene type. The acetylenic type flame is one in which carbon, as observed in
C -radiation, is emitted from all parts of the flame. Carbon compounds produced in low2
molecular weight hydrocarbon flames is made up of benzene and other aromatics (benzene type).
Instead of C -radiation being emitted from all parts of the flame, a carbon streak is observed that2
is emitted from the tip of the flame. The basis for the two flame types is related to differences in
diffusion properties between the fuel molecule and oxygen. Where the fuel and oxygen are of
about the same molecular weight, carbon is observed uniformly in the flame front; where the two
differ substantially, enriched pockets of fuel and oxygen occur, and one observes the carbon
streak. Thus, the nature of the soot molecule may be independent of the fuel molecule, but its
formation is quite dependent on the nature of the fuel and on the method of combustion.
Over the past 25 years, procedures have been developed for analyzing the
microstructure and detailed kinetics of processes occurring in flames. A number of investigators
have been applying these techniques to studying POM formation in gaseous hydrocarbon flames
(Howard and Longwell, 1983; Toqan et al., 1983). In one procedure, a pre-mixed
hydrocarbon-air flame is stabilized on a burner (usually as a flat flame) and reactants and
products are removed with the aid of a microprobe and analyzed by electron microscope or other
techniques.
Changes in the molecular weight of POM products as they pass through the flame
have been documented. Just above the flame, a large number of POM products are observed,
while farther downstream the number of products is considerably reduced. Based on this
observation, it appears that a large number of reactive POM products are produced just past the
flame zone. These POMs are referred to as reactive POMs, in that they contain many organic
side chains (CH , C H , etc.) attached to the rings of the basic POM structures. The reactive2 2 5
POMs, however, degrade in the hot region of the flames so that further downstream only the
more stable condensed ring structures are observed.
The changes in POM structure noted above are corroborated in other studies. It
has been shown that with time a steady increase occurs in the production of lower molecular
����
weight POMs (e.g., anthracene, phenanthrene, fluoranthene, and pyrene), while the higher
molecular weight POMs such as benzopyrene, benzoperylene, and coronene reach a maximum
and then decline in concentration with increasing distance from the flame. Studies by
Toqan et al. (1983) show that soot is formed in the region of the flame where a sharp decline of
POM compound is observed. They conclude that the POM (particularly PAH) compounds are
precursors to soot formation. From the preceding discussion, it is apparent that POM may be a
precursor as well as a byproduct of soot formation.
The question of how the polyacetylenes (that are produced by a sequence of rapid
reaction steps) cyclize still remains. One theory is that the polyacetylene chain bends around the
carbon atoms and eventually bonds into the condensed ring structures. Another plausible
hypothesis is illustrated in Figure 3-2. The association shown requires minimum atomic
rearrangements. Also, the formation of polyacetylene cyclics is highly exothermic, thereby
providing sufficient energy to dissociate terminal groups and the free valences to produce
reactive and stable POMs.
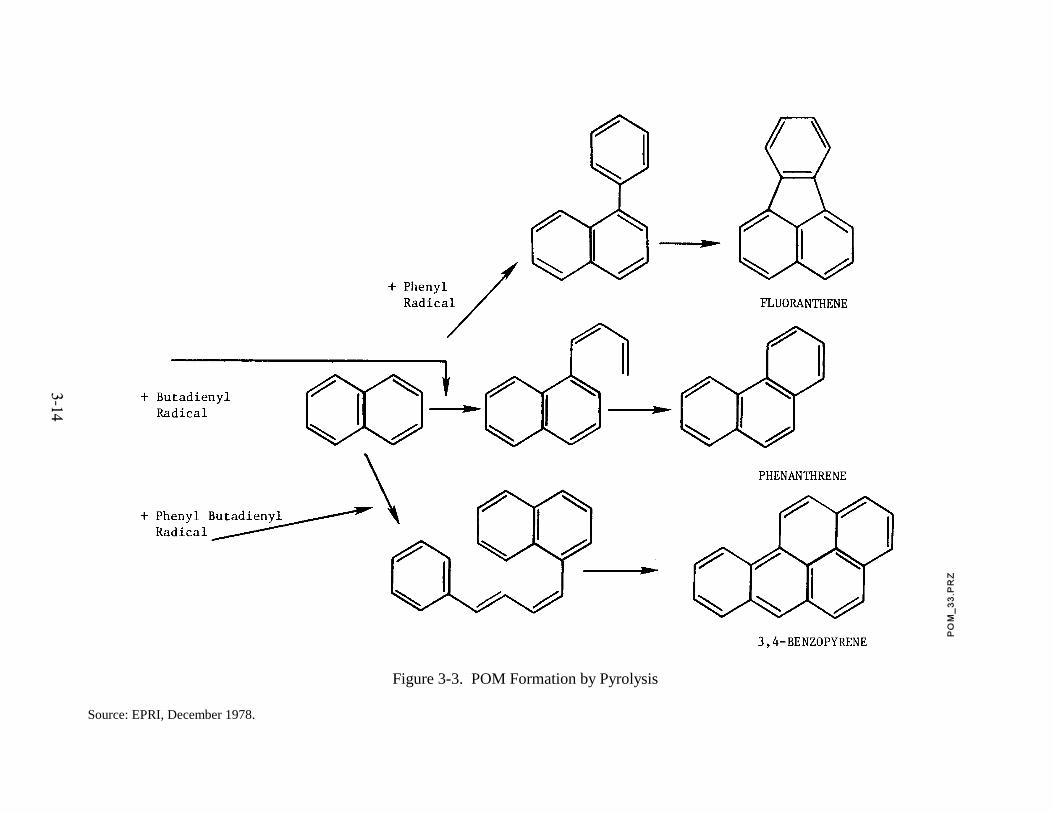
Pyrolytic studies of aromatic and straight chain hydrocarbons have been
conducted which offer logical mechanisms for explaining POM formation (Crittenden and Long,
1976). An example explaining the formation of fluoranthene, phenanthrene, and benzo(a)pyrene
is shown in Figure 3-3. In this instance, the example illustrates how phenyl-, butadienyl-, and
phenyl butadienyl radicals produced in the pyrolysis of phenylbutadiene may react with
naphthalene to produce the three POM products.
In conclusion, there is no single, dominant mechanism for POM formation in
flames. In rich gas flames, polyacetylenes can be built up via a C H polymerization mechanism. 2
In coal and oil droplet flames, pyrolytic degradation mechanisms prevail. In either instance, soot
and POM are related and persist in post-rich flames due to a deficiency of hydroxide radicals.
����
Figure 3-2. Hypothesized Ring Closure
Source: EPRI, December 1978.
����
Figure 3-3. POM Formation by Pyrolysis
Source: EPRI, December 1978.
����
3.6.2 Conversion of POM from Vapor to Particulate
Polycyclic organic matter formed during combustion is thought to exist primarily
in the vapor phase at the temperatures encountered near the flame. However, POM encountered
in the ambient atmosphere is almost exclusively in the form of particulate material (Schure et al.,
1982). It is thought that the vapor phase material formed initially becomes associated with
particles by adsorption as the gas stream cools or possibly by condensation and subsequent
nucleation (Schure et al., 1982; National Academy of Sciences, 1983). The lack of open-channel
porosity, the large concentration of oxygen functional groups on the surface of particulates such
as soot, and the adherence of airborne benzo(a)pyrene to the particle in a manner that allows for
ready extraction indicate that benzo(a)pyrene and presumably other POM compounds are
primarily adsorbed on the surface of particulates through hydrogen bonding.
The physical state of POM in ambient air is determined in part by the amount of
particulate generated by the source. Natusch and Tomkins contend that the extent of POM
adsorption onto particulate is proportional to the frequency of collision of POM molecules with
available surface area, resulting in preferential enrichment of smaller diameter particulates
(Natusch and Tomkins, 1978). In areas of high particulate concentrations, such as the stack of a
fossil fuel power plant, one would expect nearly complete adsorption of the POM onto
particulates. As particulate concentration decreases, as in internal combustion engines, one
would expect to find more POM in the condensed phase. In general, the largest concentration of
POM per unit of particulate mass will be found in the smaller diameter aerosol particulates.
Natusch has developed a detailed mathematical model describing the adsorption and
condensation mechanisms of POM compounds (Natusch, 1978). The model can describe the
temperature dependence of both adsorption and condensation for several different surface
behavioral scenarios.
While both adsorption and condensation may be in operation, it appears that the
POM vapor pressures encountered in most combustion sources are not high enough for
condensation or nucleation to occur (see Table 3-1). The saturation vapor pressure or dew point
of POM must be attained for these processes to take place. Conversely, adsorption of POM
����
vapor onto the surface of particulate material present in stack or exhaust gases can certainly take
place and could account for the occurrence of the particulate POM at ambient atmospheric
temperatures. Specifically, the modeling exercises conducted by Natusch have shown that:
1. The most important parameters to be considered in an adsorptionmodel are the adsorption energetics, the surface area, and the vaporphase concentration of the adsorbate.
2. Surface heterogeneity will broaden the temperature range whereadsorption becomes significant.
3. The particle surface temperature determines the adsorptioncharacteristics. The gas phase temperature is of secondaryimportance.
4. For conditions found in a typical coal-fired power plant,homogenous condensation is not highly favored since vapor phaselevels of POM are, in most cases, below the saturated vaporconcentration.
5. The kinetics of adsorption are predicted to be fast, suggesting thatan equilibrium model may be adequate for modeling the adsorptionbehavior of POM (Natusch, 1984).
Field measurement studies have been conducted to investigate the occurrence of
vapor to particle conversion in a combustion source (DeAngelis et al., 1979). Measurements
were made in the stack system and in the emitted plume of a small coal-fired power plant
possessing no particle control equipment. Fly ash samples were collected during the same time
periods both inside the stack (temperature at 554(F [290(C]) and from the emitted plume
(temperature at 41(F [5(C]). Collected material was extracted and analyzed for POM. Only
crude vapor traps were employed during sample collection so no quantitative measure of vapor
phase POM was obtained. It was assumed that all POM collected was in the particulate phase.
The results of this field test show that considerably more particulate POM is associated with fly
ash collected from the plume at a temperature of 41(F (5(C) than from that collected from the
same stream at a temperature of 554(F (290(C). Furthermore, since the two collection points
were only 100 ft (30.5 m) apart, quite rapid vapor to particle conversion is indicated.
����
Laboratory studies have been conducted to determine the rate and extent of POM
adsorption onto particulate matter. In one study, a stream of air containing pyrene was passed
over a bed of fresh coal fly ash which had previously been shown to contain no detectable POM
(Sonnichsen, 1983). The objective was to expose all particles to the same concentration of
pyrene for different amounts of time and to determine the specific concentrations of adsorbed
pyrene as a function of time at different temperatures. The results of this experiment showed that
the amount of adsorbed pyrene required to saturate the fly ash increased significantly with
decreasing temperature. The rate at which the adsorption process takes place, even at ambient
temperatures, is very rapid; on the order of a few seconds. In another study, PAH and soot were
sampled from the exhaust gases of a laminar, premixed flat flame under laboratory conditions
(Prado et al., 1981). Sampling at different filter temperatures was studied to assess partitioning
of PAH between vapor phase and soot. The data shown in Table 3-2 indicate that at low
temperatures (104(F [40(C]), the compounds were adsorbed or condensed on the soot particles,
while at high temperatures (392(F [200(C]), only the heaviest species were condensed to any
significant extent. While these experiments are essentially qualitative, they do establish that coal
fly ash and soot will strongly adsorb various POM species, and that the saturation capacity of the
adsorbate is inversely related to temperature.
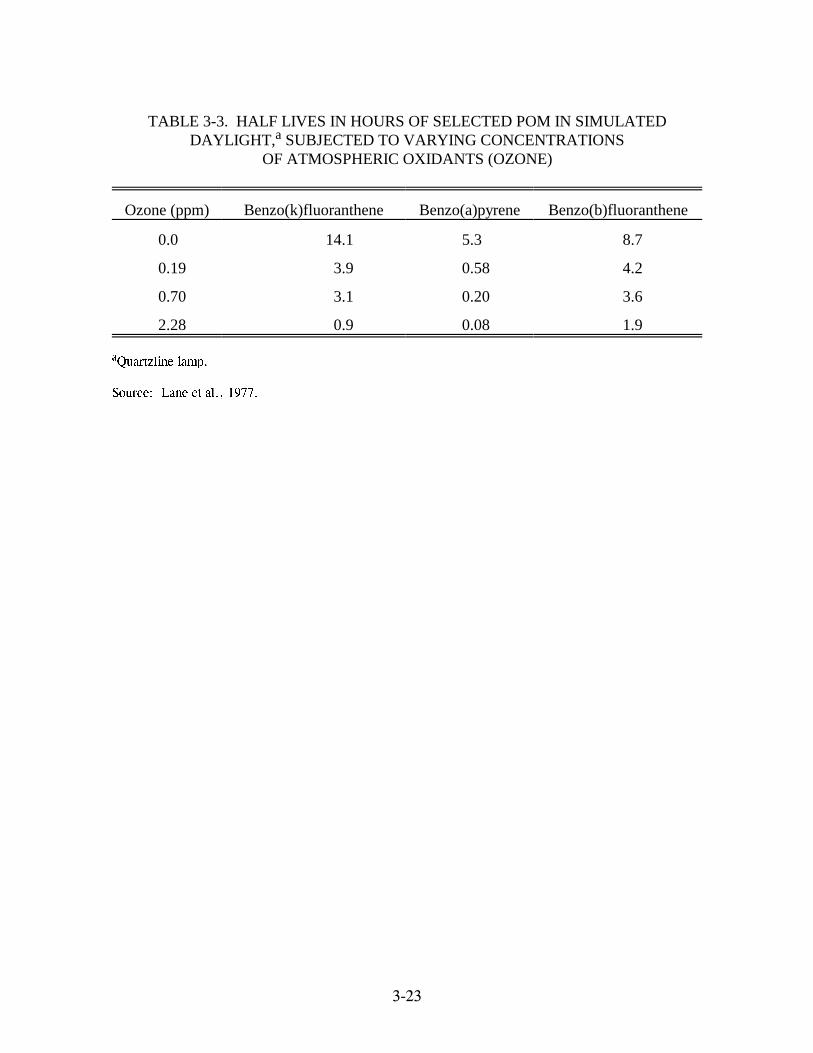
3.6.3 Persistence and Fate in the Atmosphere
Polycyclic organic matter emitted as primary pollutants present on particulate
matter can be subject to further chemical transformation through gas-particle interactions
occurring either in exhaust systems, stacks, emission plumes, or during atmospheric transport.
When emitted into polluted urban atmospheres, especially areas with photochemical smog that
has a high oxidizing potential, particle-adsorbed PAH are exposed to a variety of gaseous
co-pollutants. These include highly reactive intermediates (both free radicals and excited
molecular species) and stable molecules. Seasonal variation in transformation reactions of PAH
have been observed. During winter, with conditions of low temperature and low irradiation, the
major pathway for PAH degradation is probably reactions with nitrogen oxides, sulfur oxides and
with the corresponding acids. During summer months, with conditions of high temperatures and
intense irradiation, photochemical reactions with oxygen and secondary air pollutants produced
����
TABLE 3-2. PERCENT OF TOTAL PAH ASSOCIATED WITH SOOTPARTICLES AS A FUNCTION OF TEMPERATURE
with atmospheric sulfur dioxide, sulfur trioxide, and sulfuric acid have also been observed
(Tebbens et al., 1966).
����
SECTION 3.0 REFERENCES
Bjorseth, A., and B.S. Olufsen. Long-Range Transport of Polycyclic Aromatic Hydrocarbons. In: Handbook of Polycyclic Aromatic Hydrocarbons, Volume 1. A. Bjorseth, ed. MarcelDekker, Inc. pp. 507-521. 1983.
CRC Press, Inc. CRC Handbook of Chemistry and Physics. Boca Raton, Florida. 1983.
Crittenden, B.D., and R. Long. “The Mechanisms of Formation Polynuclear AromaticCompounds in Combustion Systems.” In: Carcinogenesis - A Comprehensive Survey, VolumeI. Polynuclear Aromatic Hydrocarbons: Chemistry, Metabolism and Carcinogenesis. R. Freudenthal, and P.W. Jones, eds. Raven Press, New York, New York. pp. 209-223. 1976.
DeAngelis, D. G. and R. B. Reznik. Source Assessment: Residential Combustion of Coal. EPAReport No. 600/2-79-019a. U.S. Environmental Protection Agency, Research Triangle Park,North Carolina. January 1979.
DeMaio, L., and M. Corn. “Polynuclear Aromatic Hydrocarbons Association with Particulates inPittsburgh Air.” Journal of Air Pollution Control Association. 16(2):67-71. 1966.
Eisenberg, W. C., K. Taylor, D. Cunningham, and R. W. Murray. “Atmospheric Fate ofPolycyclic Organic Material.” In: Polynuclear Aromatic Hydrocarbons: Mechanisms, Methods,and Metabolism, Proceedings of the Eighth International Symposium on Polynuclear AromaticHydrocarbons, Columbus, Ohio, 1983. M. Cooke and A. Dennis, eds. Battelle Press, Columbus,Ohio. pp. 395-410. 1985.
Electric Power Research Institute. Polycyclic Organic Materials and the Electric Power Industry. Energy Analysis and Environment Division. EPRI Report No. EA-787-54. pp. 1-13. December 1978.
Esmen, N. A., and M. Corn. Residence Time of Particles in Urban Air. AtmosphericEnvironment. 5(8):571-578. 1971.
Fox, M. A., and S. Olive. “Photooxidation of Anthracene on Atmospheric Particulate Matter.” Science. 205(10):582-583. 1979.
Howard, J.B., and J.P. Longwell. “Formation Mechanisms of PAH and Soot in Flames.” In: Polynuclear Aromatic Hydrocarbons: Formation, Mechanism, and Measurement, Proceedings ofthe Seventh International Symposium on Polynuclear Aromatic Hydrocarbons, Columbus, Ohio,1982. M. Cooke and A. Dennis, eds. Battelle Press, Columbus, Ohio. pp. 27-61. 1983.
Inscoe, N.M. “Photochemical Changes in Thin Layer Chromatograms of Polycyclic AromaticHydrocarbons.” Analytical Chemistry. 36:2505-2506. 1964.
����
Katz, M., and R. C. Pierce. “Quantitative Distribution of Polynuclear Aromatic Hydrocarbons inRelation to Particle Size of Urban Particulates.” In: Carcinogenesis, Volume 1, PolynuclearAromatic Hydrocarbons: Chemistry, Metabolism, and Carcinogenesis. R. Freudenthal and P.Jones, eds. Raven Press, New York, New York. pp. 412-429. 1976.
Korfmacher, W.A., D.F.S. Natusch, D.R. Taylor, E.L. Wehry, and G. Mamantov. “Thermal andPhotochemical Decomposition of Particulate PAH.” In: Polynuclear Aromatic Hydrocarbons: Chemistry and Biology - Carcinogenesis and Mutagenesis, Proceedings of the Third InternationalSymposium on Polynuclear Aromatic Hydrocarbons, Columbus, Ohio, 1978. P. Jones and P.Leber, eds. Ann Arbor Science Publishers, Inc. Ann Arbor, Michigan. pp. 165-170. 1979.
Korfmacher, W.A., E.L. Wehry, G. Mamantov, and D.F.S. Natusch. “Resistance toPhotochemical Decomposition of Polycyclic Aromatic Hydrocarbons Vapor-Adsorbed on CoalFly Ash.” Environmental Science and Technology. 14(9):1094-1099. 1980.
Lane, D. A., and M. Katz. The Photomodification of Benzo(a)pyrene, Benzo(b)fluoranthene, andBenzo(k)fluoranthene Under Simulated Atmospheric Conditions, In: Fate of Pollutants in theAir and Water Environments. Volume 8, Part 2. J. Pitts and R. Metcalf, eds. Wiley-Interscience, New York. pp. 137-154. 1977.
Loening, K. L., and J. E. Merritt. “Some Aids for Naming Polycyclic Aromatic Hydrocarbonsand Their Heterocyclic Analogs.” In: Polynuclear Aromatic Hydrocarbons: Formation,Metabolism, and Measurement, Proceedings of the Seventh International Symposium onPolynuclear Aromatic Hydrocarbons, Columbus, Ohio, 1982. M. Cooke and A. Dennis, eds. Battelle Press, Columbus, Ohio. pp. 819-843. 1983.
Miguel, A. H. “Atmospheric Reactivity of Polycyclic Aromatic Hydrocarbons Associated withAged Urban Aerosols.” In: Polynuclear Aromatic Hydrocarbons: Formation, Mechanism, andMeasurement, Proceedings of the Seventh International Symposium on Polynuclear AromaticHydrocarbons, Columbus, Ohio, 1982. M. Cooke and A. Dennis, eds. Battelle Press, Columbus,Ohio. pp. 897-903. 1983.
Morrison, R. T., and R. N. Boyd. Organic Chemistry, Third Edition. Chapter 30, PolynuclearAromatic Compounds. Allyn and Bacon, Inc. pp. 967-997. 1978.
National Academy of Sciences. Polycyclic Aromatic Hydrocarbons: Evaluation of Sources andEffects. National Research Council (United States) Committee on Pyrene and SelectedAnalogues, National Academy Press, Washington, DC. pp. 3-1 to 3-14. 1983.
National Academy of Sciences. Biologic Effects of Atmospheric Pollutants: ParticulatePolycyclic Organic Matter. Washington, DC. pp. 36-81. 1972.
National Academy of Sciences. Biologic Effects of Atmospheric Pollutants: ParticulatePolycyclic Organic Matter. Washington, DC. pp. 4-12. 1972.
����
Natusch, D.F.S. Formation and Transformation of Particulate POM Emitted from Coal-firedPower Plants and Oil Shale Retorting. U.S. Department of Energy, Washington, DC. ReportNo. DOE/EV/04960--TI. April 1984.
Natusch, D. F.S. Formation and Transformation of Polycyclic Organic Matter from CoalCombustion. Prepared under U.S. Department of Energy Contract No. EE-77-S-02-4347. pp. 34 1978.
Natusch, D.F.S., W.A. Korfmacher, A.H. Miguel, M.R. Schure, and B.A. Tomkins. “Transformation of POM in Power Plant Emissions.” In: Symposium Proceedings: ProcessMeasurements for Environmental Assessment, U.S. Environmental Protection Agency,Interagency Energy/Environment R and D Program Report. EPA Report No. 600/7-78-168. Research Triangle Park, North Carolina. pp. 138-146. 1978.
Natusch, D.F.S., and B.A. Tomkins. “Theoretical Consideration of the Adsorption of PolynuclearAromatic Hydrocarbon Vapor onto Fly Ash in a Coal-fired Power Plant.” In: Carcinogenesis,Volume 3: Polynuclear Aromatic Hydrocarbons: Second International Symposium on Analysis,Chemistry, and Biology. P. Jones, and R. Freudenthal, eds. Raven Press, New York, New York. pp. 145-153. 1978.
Nielsen, T. Reactivity of Polycyclic Aromatic Hydrocarbons Toward Nitrating Species. Environmental Science and Technology. 18(3):157-163. 1984.
Personal communication between Mr. T. F. Lahre, Air Management Technology Branch,U.S. Environmental Protection Agency, Research Triangle Park, North Carolina, and Dr. LarryJohnson, Air and Energy Engineering Research Laboratory, U.S. Environmental ProtectionAgency, Research Triangle Park, North Carolina. January 4, 1987.
Pitts, J.N., Jr., K.A. Van Cauwenberghe, D. Grosjean, J.P. Schmid, D.R. Fitz, W.L. Belser, Jr.,G.B. Knudson, and P.M. Hynds. Atmospheric Reactions of Polynuclear AromaticHydrocarbons: Facile Formation of Mutagenic Nitro Derivatives. Science, 202:515-519. 1978.
Prado, G., P.R. Westmoreland, B.M. Andon, J.A. Leary, K. Biemann, W.G. Thilly,J.P. Longwell, and J.B. Howard. “Formation of Polycyclic Aromatic Hydrocarbons in PremixedFlames, Chemical Analysis and Mutagenicity.” In: Polynuclear Aromatic HydrocarbonsChemical Analysis and Biological Fate, Proceedings of the Fifth International Symposium, onPolynuclear Aromatic Hydrocarbons, Columbus, Ohio, 1980. M. Cooke, and A. Dennis, eds. Battelle Press, Columbus, Ohio. pp. 189-199. 1981.
Schure, M.R., and D.F.S. Natusch. “The Effect of Temperature on the Association of POM withAirborne Particles.” In: Polynuclear Aromatic Hydrocarbons: Physical and BiologicalChemistry, Proceedings of the Sixth International Symposium on Polynuclear AromaticHydrocarbons, Columbus, Ohio, 1981. M. Cooke, A. Dennis, and G. Fisher, eds. Battelle Press,Columbus, Ohio. pp. 713-724. 1982.
����
Sonnichsen, T.W. Measurements of POM Emissions from Coal-fired Utility Boilers. EPRIReport No. CS-2885. Electric Power Research Institute, Palo Alto, California. 1983.
Taskar, P.K., J.J. Solomon, and J.M. Daisey. “Rates and Products of Reaction of PyreneAdsorbed on Carbon, Silica, and Alumina.” In: Polynuclear Aromatic Hydrocarbons: Mechanisms, Methods, and Metabolism, Proceedings of the Eighth International Symposium onPolynuclear Aromatic Hydrocarbons, Columbus, Ohio, 1983. M. Cooke and A. Dennis, eds. Battelle Press, Columbus, Ohio. pp. 1,285-1,298. 1985.
Tebbens, B. D., J. F. Thomas, and M. Mukai. “Fate of Arenes Incorporated with Airborne Soot.” American Industrial Hygiene Association Journal. 27(1):415-421. 1966.
Thomas, J. F., M. Mukai, and B. D. Tebbens. “Fate of Airborne Benzo(a)pyrene.” In: Environmental Science and Technology. 2(1):33-39. 1968.
Toqan, M., J.M. Beer, J.B. Howard, W. Farmayan, and W. Rovesti. “Soot and PAH in CoalLiquid Fuel Furnace Flames.” In: Polynuclear Aromatic Hydrocarbons: Formation,Mechanisms, and Measurement, Proceedings of the Seventh International Symposium onPolynuclear Aromatic Hydrocarbons, Columbus, Ohio, 1982. M. Cooke and A. Dennis, eds. Battelle Press, Columbus, Ohio. pp. 1,205-1,219. 1983.
Tucker, S. P. “Analyses of Coke Oven Effluents for Polynuclear Aromatic Compounds.” In: Analytical Methods for Coal and Coal Products, Volume II, Chapter 43, pp. 163-169. 1979.
U.S. Environmental Protection Agency. Provisional Guidance for Quantitative Risk Assessmentof Polycyclic Aromatic Hydrocarbons. Office of Research and Development. Washington, D.C. EPA-600/R-93-089. July 1993.
U.S. Environmental Protection Agency. Second Supplement to Compendium of Methods for theDetermination of Toxic Organic Compounds in Ambient Air. Atmospheric Research andExposure Assessment Laboratory. Research Triangle Park, North Carolina. EPA-600/4-89-018. pp. TO-13 to TO-97. 1988.
U.S. Environmental Protection Agency. POM Source and Ambient Concentration Data: Reviewand Analysis. Washington, DC. EPA Report No. 600/7-80-044. March 1980.
U.S. Environmental Protection Agency. Health Assessment Document for Polycyclic OrganicMatter. External Review Draft. Research Triangle Park, North Carolina. EPA ReportNo. 2/102. pp. 3-1 to 3-47. 1978.
U.S. Environmental Protection Agency. Scientific and Technical Assessment Report onParticulate Polycyclic Organic Matter (PPOM). Washington, DC. EPA ReportNo. 600/6-75-001. March 1975.
����
Van Cauwenberghe, K. A. “Atmospheric Reactions of PAH.” In: Handbook of PolycyclicAromatic Hydrocarbons: Emission Sources and Recent Progress in Analytical Chemistry. A. Bjorseth and T. Rambahl, eds. Marcel Dekker, Inc. Volume 2, pp. 351-369. 1985.
Van Noort, P.C.M., and E. Wondergem. Scavenging of Airborne Polycyclic AromaticHydrocarbons by Rain. Environmental Science and Technology. 19(11):1044-1049. 1985.
Yokley, R. A., A. A. Carrison, E.L. Wehry, and G. Mamantov. Photochemical Transformationof Pyrene and Benzo(a)pyrene Vapor-Deposited on Eight Coal Stack Ashes. EnvironmentalScience and Technology. 20(1):86-90. 1986.
���
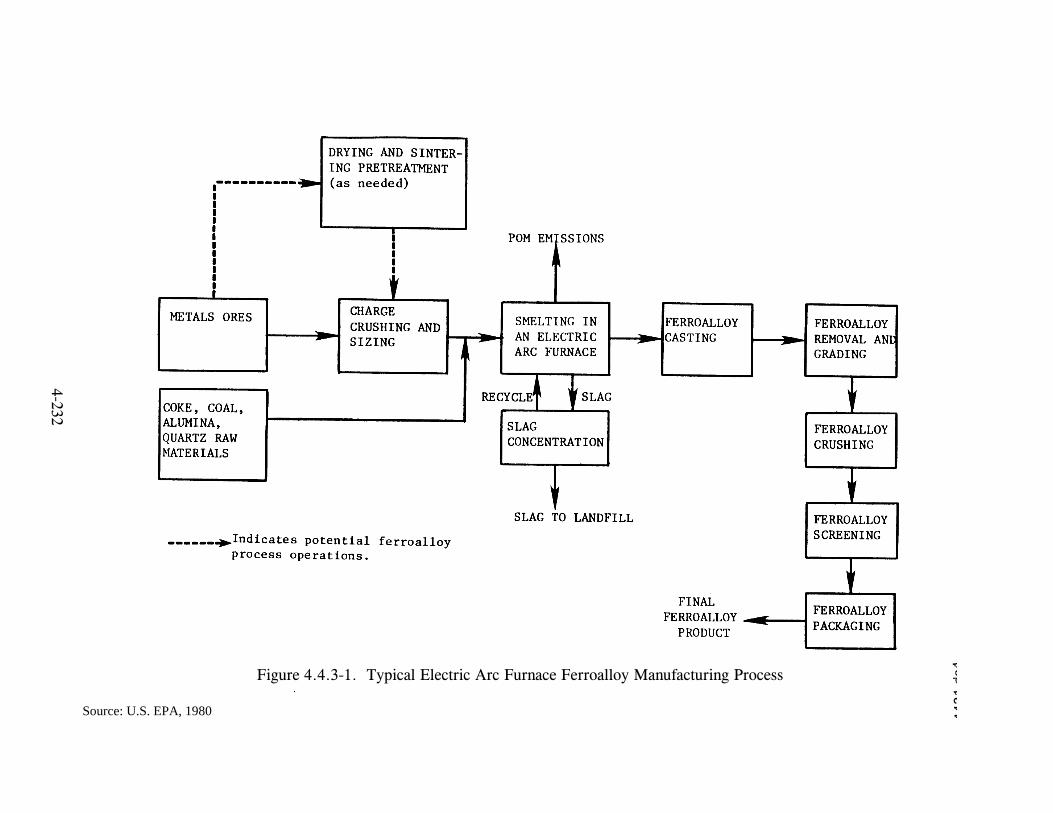
SECTION 4.0
POM EMISSION SOURCE CATEGORIES
This section contains the process descriptions, available emission factor data, and
source locations for source categories of POM emissions. Many of the source categories
discussed in this section emit POM from the fuel combustion process; however, some of the
categories have very unique processes due to the fuel type burned or the type of combustion unit
used.
There are few emission controls that are dedicated solely to reduce POM
emissions, and therefore there are limited data on the effectiveness of control strategies in
reducing POM emissions. Where there are known emission control strategies that may affect
POM emissions from a source category, these are discussed as part of the process description.
Also, in many cases, there are emission factor data provided for both controlled and uncontrolled
units that may be used within a source category.
4.1 STATIONARY EXTERNAL COMBUSTION
The combustion of solid, liquid, and gaseous fuels such as coal, lignite, wood,
bagasse, fuel oil, and natural gas has been shown through numerous tests to be a source of POM
emissions. Polycyclic organic compounds are formed in these sources as products of incomplete
combustion. The rates of POM formation and emissions are dependent on both fuel
characteristics and combustion process characteristics. Emissions of POM can originate from
POM compounds contained in fuels that are released during combustion or from high-
temperature transformations of organic compounds in the combustion zone (Shih et al., 1980;
National Research Council, 1972; National Research Council, 1983).
An important fuel characteristic that affects POM formation in combustion
sources is the carbon-to-hydrogen ratio and the molecular structure of the fuel (Shih et al., 1980).
In general, the higher the carbon-to-hydrogen ratio, the greater the probability of POM compound
���
formation. Holding other combustion variables constant, the tendency for hydrocarbons present
in a fuel to form POM compounds is as follows:
aromatics > cycloolefins > olefins > paraffins
Based on both carbon-to-hydrogen ratio and molecular structure considerations, the tendency for
the combustion of various fuels to form POM compounds is as follows: (Shih et al., 1980)
These general tendencies may not hold true for every scenario because other combustion
characteristics, such as equipment operation and maintenance, also affect POM emissions.
The primary combustion process characteristics affecting POM compound
formation and emissions are: (Shih et al., 1980; Barrett et al., 1983)
& Combustion zone temperature;
& Residence time in the combustion zones;
& Turbulence or mixing efficiency between air and fuel;
& Air-to-fuel ratio; and
& Fuel feed size.
Concentrations of PAH have been shown to decrease rapidly with increasing
temperature (Shih et al., 1980). The degree to which these process variables can be controlled
varies from source to source; however, larger combustion sources, such as utilities and industrial
boilers, generally have more monitoring devices and mechanisms for adjusting these variables in
order to maximize combustion efficiency. Small commercial units and residential sources
typically are more variable in their combustion efficiency because the operator is limited by the
unit design in making any specific adjustments.
���
The main cause of incomplete fuel combustion is insufficient mixing of air, fuel,
and combustion products. Mixing is a function of operating practices and fuel-firing
configuration. Hand- and stoker-fired solid fuel combustion sources generally exhibit very poor
air and fuel mixing relative to other types of combustion sources. Liquid fuel units and
pulverized solid fuel units provide good air and fuel mixing (Shih et al., 1980; Kelly, 1983;
Barrett et al., 1983).
The air-to-fuel ratio present in the combustion environment is important in POM
formation because certain quantities of air (i.e., oxygen) are needed to stoichiometrically carry
out complete combustion. Air supply is particularly important in systems with poor air and fuel
mixing. Combustion environments with a poor air supply will generally have lower combustion
temperatures and will not be capable of completely oxidizing all the fuel. Systems that
experience frequent startups and shutdowns will also have poor air-to-fuel ratios. Unburned
hydrocarbons, many as POM compounds, can exist in such systems and eventually be emitted
through the source stack. Generally, stoker and hand-fired solid fuel combustion sources have
problems with insufficient air supply and tend to generate relatively large quantities of POM as a
result (Shih et al., 1980; Kelly, 1983; Barrett et al., 1983).
In solid and liquid fuel combustion sources, fuel feed size can influence
combustion rate and efficiency; therefore, POM compound formation is affected. For liquid fuel
oils, a poor initial fuel droplet size distribution is conducive to poor combustion conditions and
an enhanced probability of POM formation. In most cases, fuel droplet size distribution is
primarily influenced by fuel viscosity. As fuel viscosity increases, the efficiency of atomization
decreases and the droplet size distribution shifts to the direction of larger diameters. Therefore,
distillate oils are more readily atomized than residual oils and result in finer droplet size
distribution. This behavior, combined with the lower carbon-to-hydrogen ratio of distillate oil,
means that residual oil sources inherently have a higher probability of POM formation and
emissions than distillate oil sources (Shih et al., 1980; Kelly, 1983).
For solid fuels, fuel size affects POM formation by significantly impacting
combustion rate. Solid fuel combustion involves a series of repeated steps, each with the
���
potential to form POM compounds. First, the volatile components near the surface of a fuel
particle are burned, followed by burning of the residual solid structure. As fresh, unreacted solid
material is exposed, the process is repeated. Thus, the larger the fuel particle, the greater the
number of times this sequence is repeated and the longer the residence time required to complete
the combustion process. With succeeding repetitions, the greater the probability of incomplete
combustion and POM formation. Stoker and hand-fired solid fuel combustion units represent the
greatest potential for POM emissions due to fuel size considerations (Shih et al., 1980).
POM can be emitted from fuel combustion sources in both a gaseous and a
particulate phase. The compounds are initially formed as gases, but as the flue gas stream cools,
a portion of the POM constituents adsorb to solid fly ash particles present in the stream. The rate
of adsorption is dependent on temperature and fly ash and POM compound characteristics. At
temperatures above 302(F (150(C), most POM compounds are expected to exist primarily in
gaseous form. In several types of fuel combustion systems, it has been shown that POM
compounds are preferentially adsorbed to smaller (submicron) fly ash particles because of their
larger surface area-to-mass ratios. These behavioral characteristics of POM emissions are
important in designing and assessing POM emission control systems (Shih et al., 1980;
Kelly, 1983; Griest and Guerin, 1979; Sonnichsen, 1983).
The primary stationary combustion sources emitting POM compounds are boilers,
furnaces, heaters, stoves, and fireplaces used to generate heat and/or power in the residential,
utility, industrial, and commercial use sectors. A description of the combustion sources, typical
emission control equipment, and POM emission factors for each of these major use sectors is
provided in the sections that follow.
���
SECTION 4.1 REFERENCES
Barrett, W.J. et al. Planning Studies for Measurement of Chemical Emissions in Stack Gases ofCoal-fired Power Plants. Electric Power Research Institute, Palo Alto, California. EPRI ReportNo. EA-2892. 1983.
Griest, W.H., and M.R. Guerin. Identification and Quantification of Polynuclear Organic Matter(POM) on Particulates from a Coal-fired Power Plant. Electric Power Research Institute, PaloAlto, California. EPRI Report No. EA-1092. 1979.
Kelly, M.E. Sources and Emissions of Polycyclic Organic Matter. U.S. EnvironmentalProtection Agency, Research Triangle Park, North Carolina. EPA Report No. 450/5-83-010b. pp. 5-9 to 5-44. 1983.
National Research Council. Polycyclic Aromatic Hydrocarbons: Evaluation of Sources andEffects. Committee on Pyrene and Selected Analogues, Board on Toxicology and EnvironmentalHealth Hazards, Commission on Life Sciences, National Academy Press, Washington, DC. 1983.
National Research Council. Particulate Polycyclic Organic Matter. Committee on BiologicEffects of Atmospheric Pollutants, Division of Medical Sciences, National Academy of Sciences,Washington, DC. 1972.
Shih, C. et al. “POM Emissions from Stationary Conventional Combustion Processes, withEmphasis on Polychlorinated Compounds of Dibenzo-p-dioxin (PCDDs), Biphenyl (PCBs), andDibenzofuran (DCDFs).” CCEA Issue Paper presented under EPA Contract No. 68-02-3138. U.S. Environmental Protection Agency, Industrial Environmental Research Laboratory, ResearchTriangle Park, North Carolina. January 1980.
Sonnichsen, T.W. Measurements of POM Emissions from Coal-fired Utility Boilers. ElectricPower Research Institute, Palo Alto, California. EPRI Report No. CS-2885. 1983.
���
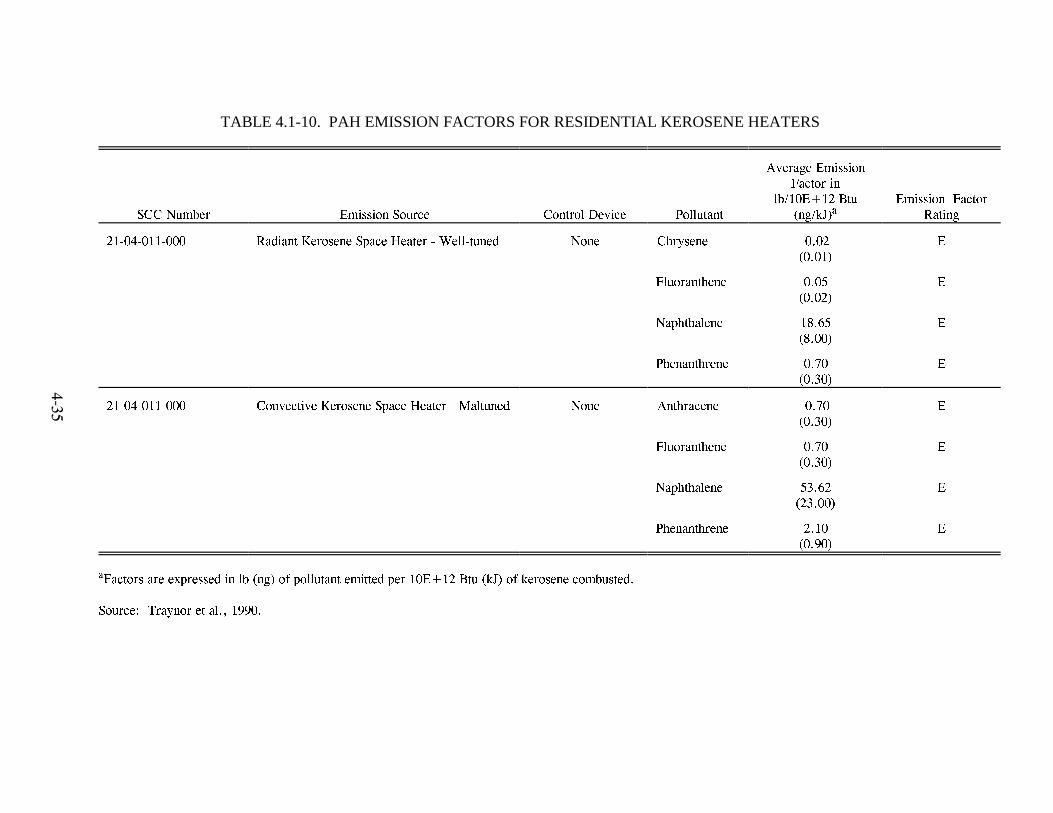
4.1.1 Residential Heating
The residential sector includes furnaces and boilers burning coal, oil, and natural
gas; stoves and fireplaces burning wood; and kerosene heaters. All of these units are designed to
heat individual homes. Residential combustion sources are generally not equipped with
particulate matter (PM) or gaseous pollutant control devices. In coal- and wood-fired sources,
stove design and operating practice changes have been made to lower PM, hydrocarbon, and
carbon monoxide (CO) emissions. Changes include modified combustion air flow control, better
thermal control and heat storage, and the use of combustion catalysts. Such changes can
conceivably lead to reduced POM formation and emissions (Mead et al., 1986; Kelly, 1983).
Process Description--Residential Wood Combustion
Residential wood combustion generally occurs in either a stove or fireplace unit
located inside a house. PAH emissions from wood combustion in residential heating units result
from the combination of free radical species formed in the flame zone, primarily as the result of
incomplete combustion. These emissions can vary widely depending on how the units are
operated and the how the emissions are measured. The following factors will affect PAH
emissions measured from residential wood combustion sources (Johnson et al., 1990a):
& Unit design and degree of excess air;
& Wood type, moisture content, and other wood characteristics;
& Burn rate and stage of burn;
& Firebox and chimney temperatures; and
& Sampling and analytical methods.
The following discussions describe the specific characterization of wood-fired stoves
(woodstoves) and fireplaces.
���
Woodstoves are commonly used in residences as space heaters. They are used
both as the primary source of residential heat and to supplement conventional heating systems.
Woodstoves have varying designs based on the use or non-use of baffles and catalysts, the extent
of combustion chamber sealing, and differences in air intake and exhaust systems. Woodstove
design and operation practices are important determinants of POM formation in wood-fired
sources (Mead et al., 1986; Kelly, 1983).
The EPA has identified five categories of wood-burning devices based on
differences in both the magnitude and the composition of the emissions (U.S. EPA, 1993b):
& Conventional woodstoves;
& Noncatalytic woodstoves;
& Catalytic woodstoves;
& Pellet stoves; and
& Masonry heaters.
Among these categories, there are many variations in device design and operation characteristics.
The conventional woodstove category comprises all stoves without catalytic
combustors not included in the other noncatalytic categories (i.e., noncatalytic and pellet).
Conventional woodstoves do not have any emissions reduction technology or design features
and, in most cases, were manufactured before July 1, 1986. Stoves of many different airflow
designs may be included in this category, such as updraft, downdraft, crossdraft and S-flow
(U.S. EPA, 1993b).
Noncatalytic woodstoves are those units that do not employ catalysts but do have
emissions-reducing technology or features. The typical noncatalytic design includes baffles and
secondary combustion chambers (U.S. EPA, 1993b).
���
Catalytic woodstoves are equipped with a ceramic or metal honeycomb device,
called a combustor or converter, that is coated with a noble metal such as platinum or palladium.
The catalyst reduces the ignition temperature of the unburned VOC and CO in the exhaust gases,
thus augmenting their ignition and combustion at normal stove operating temperatures. As these
components of the gases burn, the temperature inside the catalyst increases to a point at which
the ignition of the gases is essentially self-sustaining (U.S. EPA, 1993b).
Pellet stoves are fueled with pellets of sawdust, wood products, and other biomass
materials pressed into manageable shapes and sizes. These stoves have active air flow systems
and a unique grate design to accommodate this type of fuel. Some pellet stove models are
subject to the 1988 New Source Performance Standards (NSPS); others are exempt because of
their high air-to-fuel ratio (i.e., greater than 35-to-1) (U.S. EPA, 1993b).
The quantities and types of emissions from woodstoves are highly variable,
depending on a number of factors such as stage of the combustion cycle and wood type.
McCrillis and Watts concluded from emissions testing done on three woodstoves that increasing
the burn rate (in terms of mass of wood burned per hour) resulted in increasing PAH emissions
(in terms of mass of pollutant emitted per hour) (McCrillis and Watts, 1992a). Results from
14 tests conducted on conventional and catalytic woodstoves showed a similar trend of
increasing PAH emissions with increasing burn rate (Burnet et al., 1990a).
Regarding wood type, McCrillis and Watts reported that PAH emissions were
higher for stoves burning pine wood as compared to oak wood (McCrillis and Watts, 1992a).
The same conclusion was drawn by Burnet et al., who statistically showed a main effect decrease
in PAH emissions of 849 mg per hour, at a 99-percent confidence bound, in going from pine fuel
to oak fuel (Burnet et al., 1990b).
Fireplaces are used primarily for aesthetic effects and secondarily as a
supplemental heating source in houses and other dwellings. Wood is the most common fuel for
fireplaces, but coal and densified wood “logs” may also be burned (U.S. EPA, 1993a). The user
intermittently adds fuel to the fire by hand. Fireplaces are inefficient combustion devices, with
���
high uncontrolled excess air rates and no sort of secondary combustion. POM emissions result
from the combination of free radical species formed in the flame zone, primarily as a
consequence of incomplete combustion. Under reducing conditions, radical chain propagation is
enhanced, allowing the buildup of complex organic material such as POM. The POM is
generally found in or on smoke particles, although some sublimation into the vapor phase is
probable.
Fireplace heating efficiency may be improved by a number of measures that either
reduce the excess air rate or transfer back into the residence some of the heat that would normally
be lost in the exhaust gases or through fireplace walls. As noted below, such measures are
commonly incorporated into prefabricated units. As a result, the energy efficiencies of
prefabricated fireplaces are slightly higher than those of masonry fireplaces (U.S. EPA, 1993a).
Prefabricated fireplaces are commonly equipped with louvers and glass doors to
reduce the intake of combustion air, and some are surrounded by ducts through which floor-level
air is drawn by natural convection, heated, and returned to the room. Many varieties of
prefabricated fireplaces are now on the market. One general class is the free-standing fireplace,
the most common of which consists of an inverted sheet metal funnel and stovepipe directly
above the fire bed. Another class is the “zero clearance” fireplace, an iron or heavy-gauge steel
firebox lined with firebrick and surrounded by multiple steel walls with spaces for air circulation.
Some zero clearance fireplaces can be inserted into existing masonry fireplace openings, and thus
are sometimes called “inserts.” Some of these units are equipped with close-fitting doors and
have operating and combustion characteristics similar to those of woodstoves (U.S. EPA, 1993a).
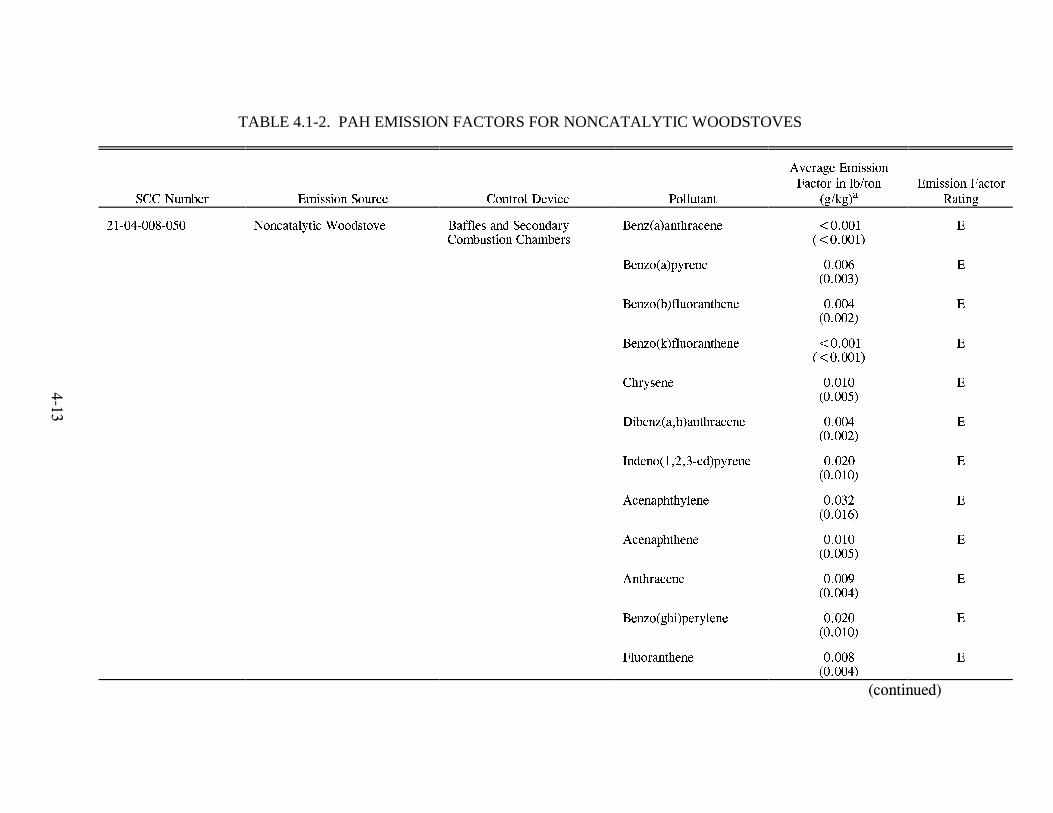
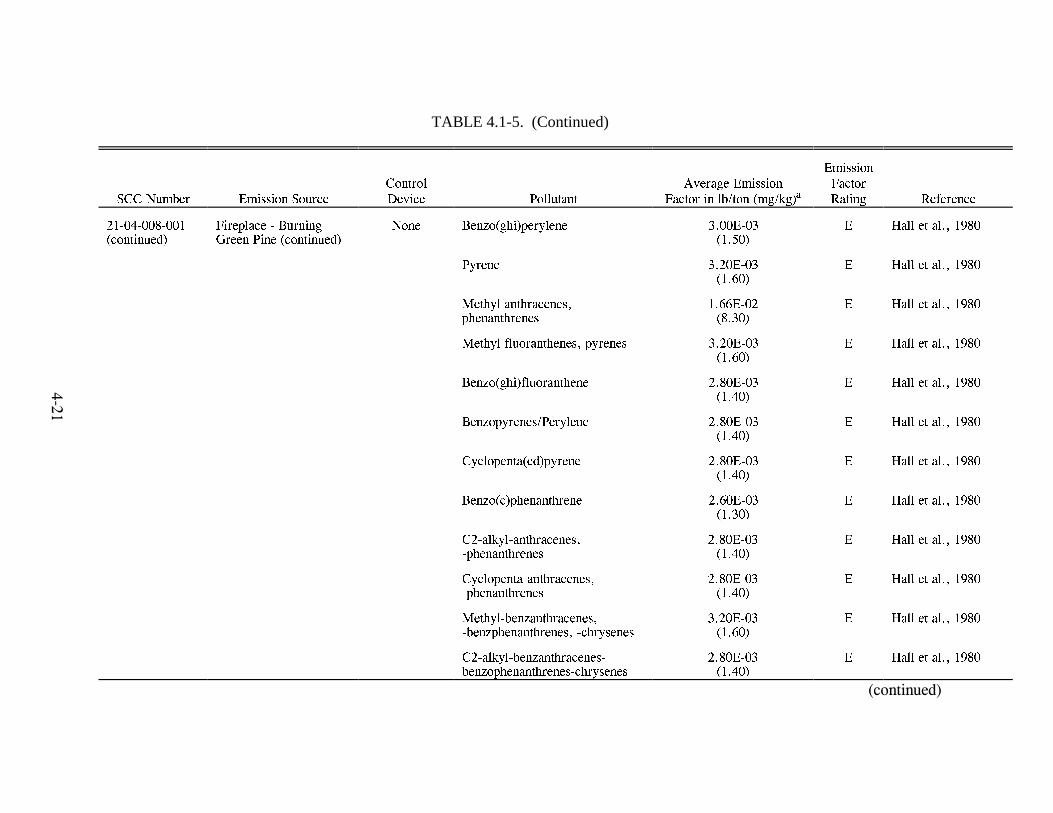
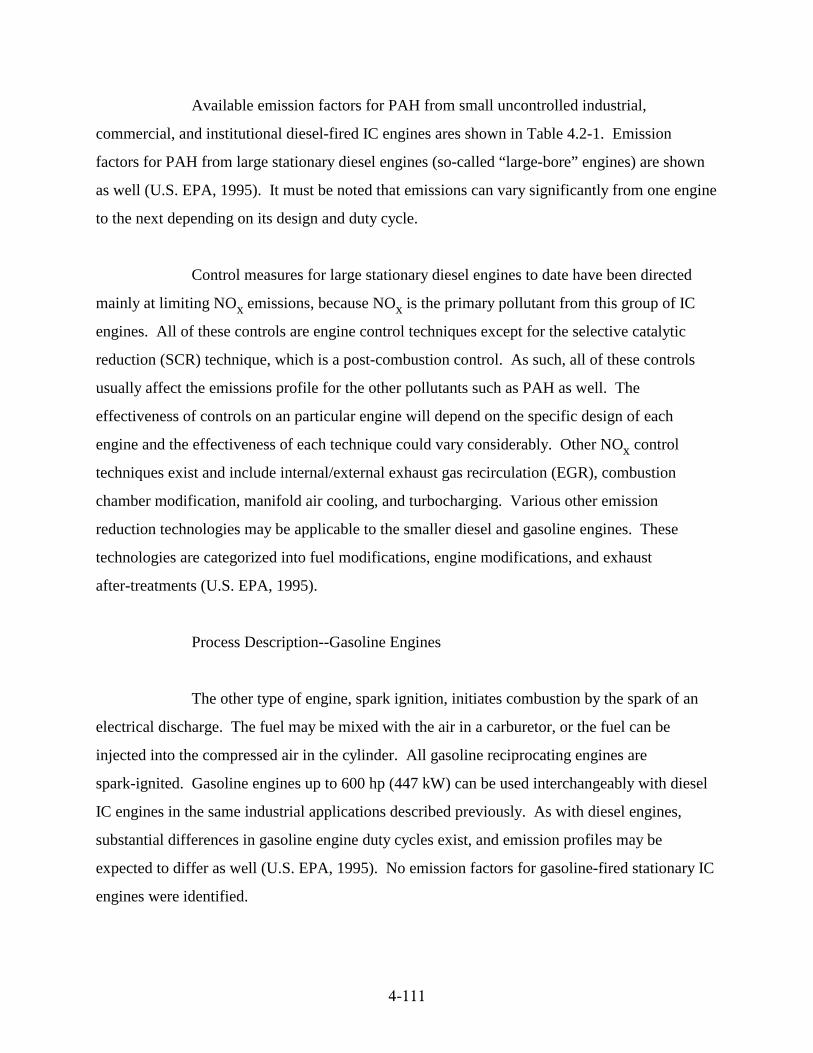
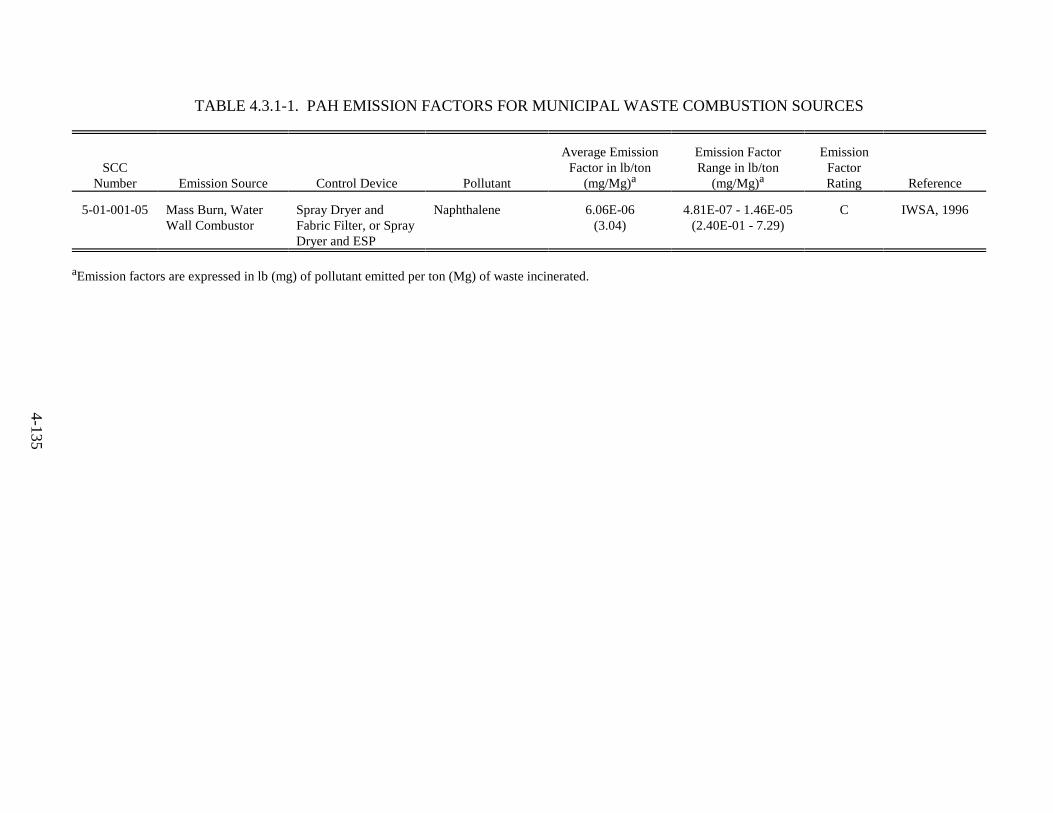
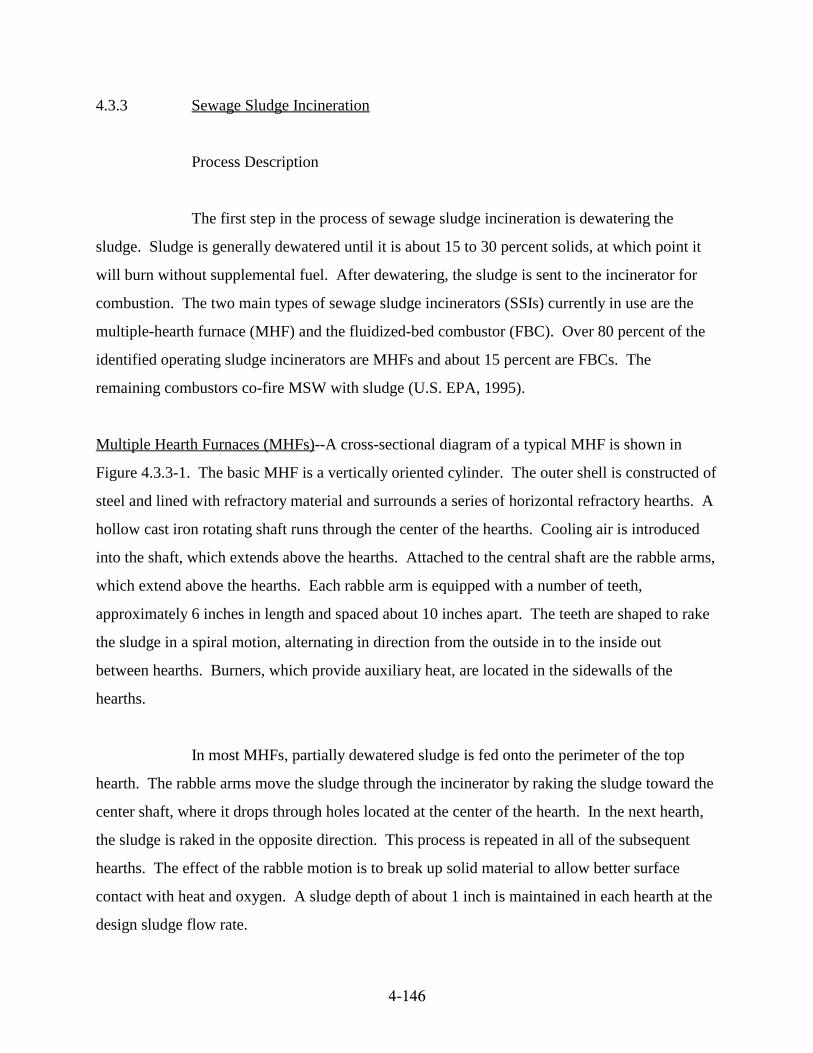
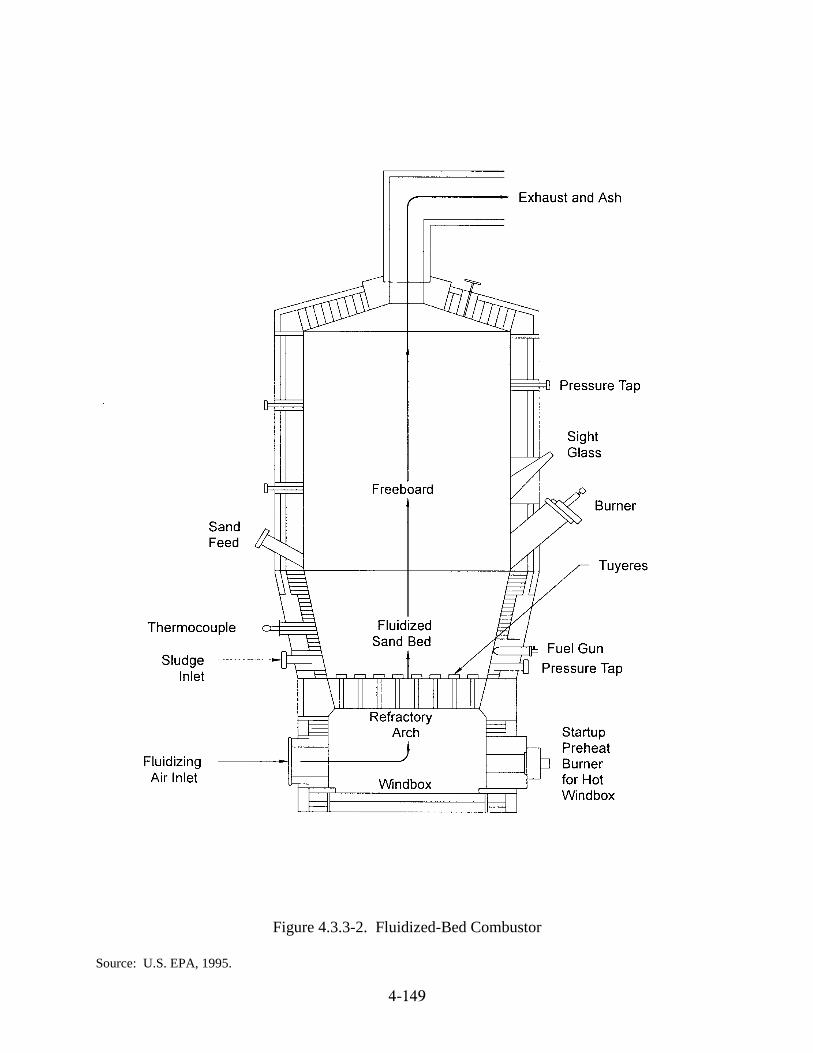
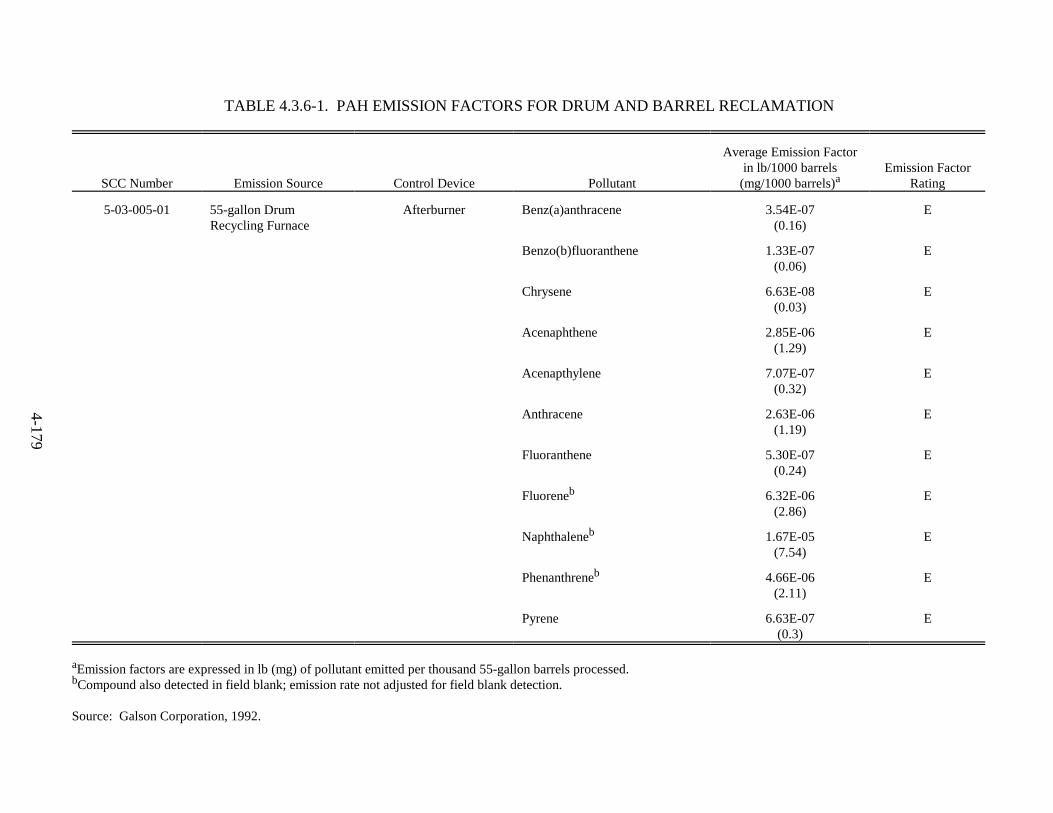
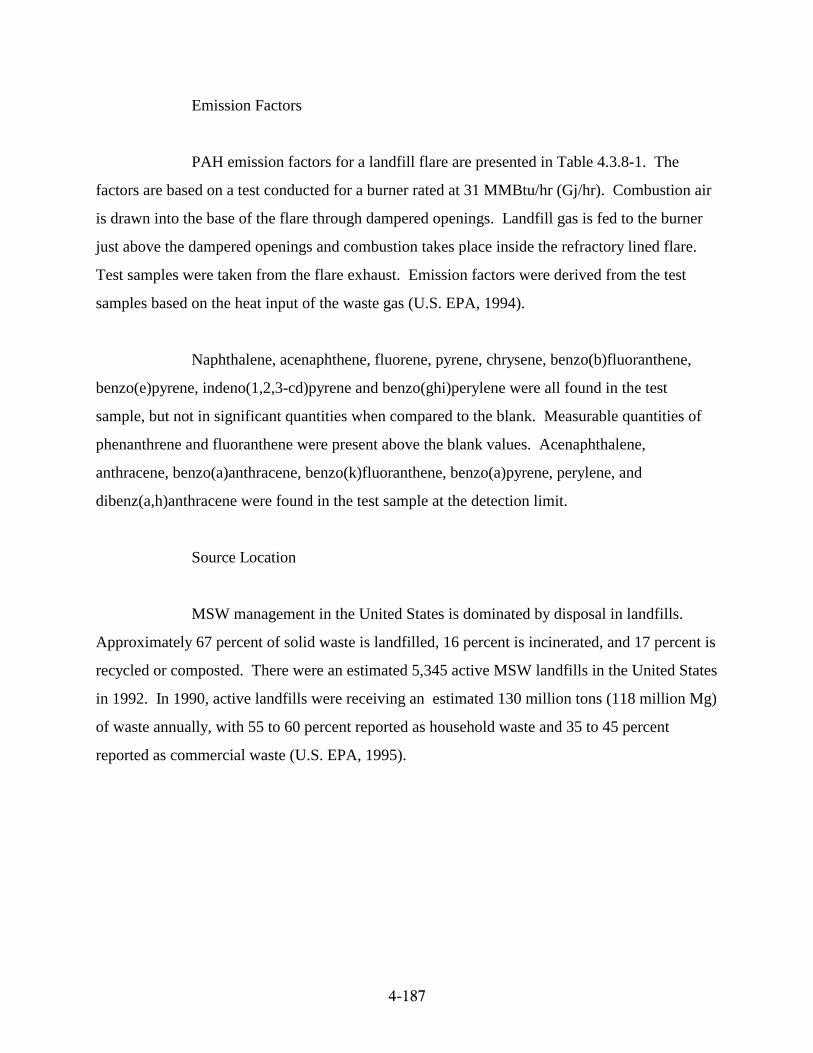
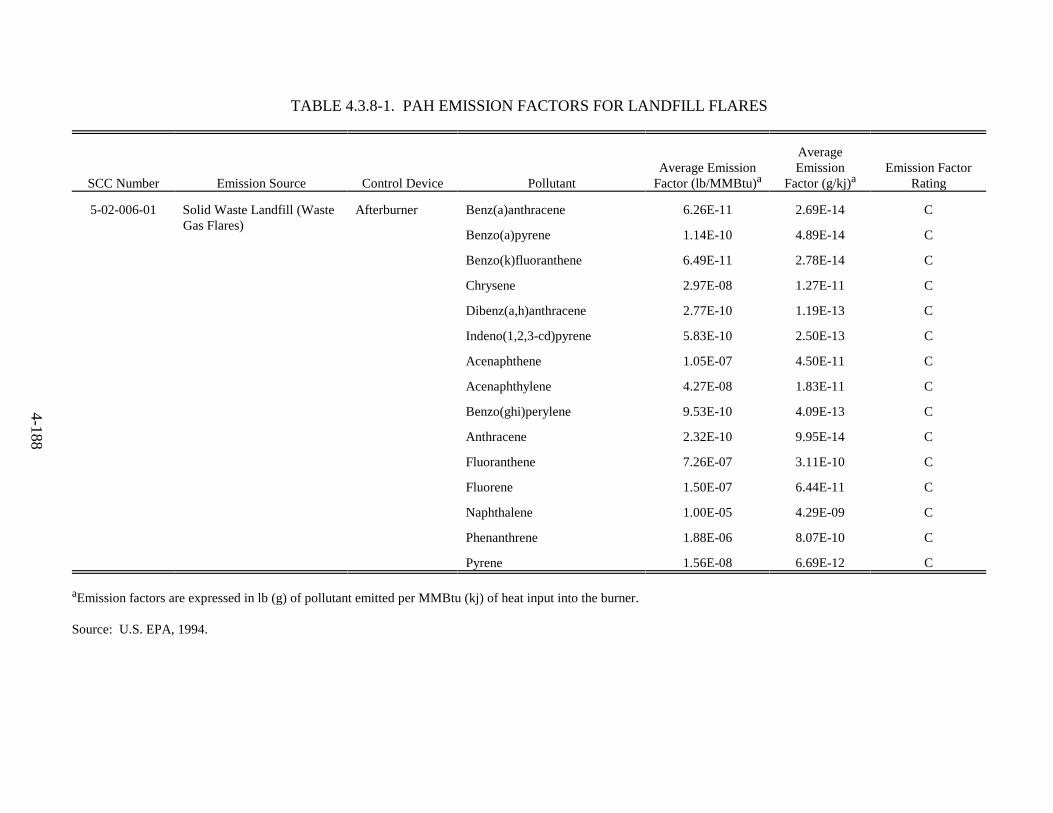
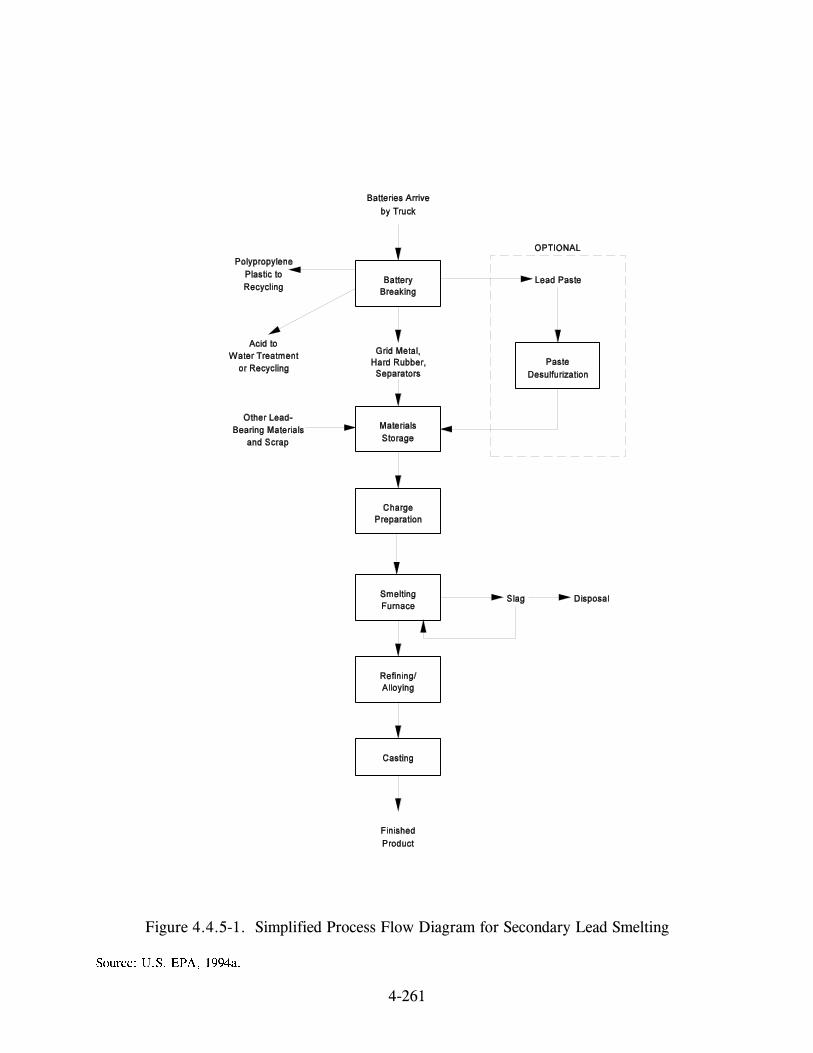
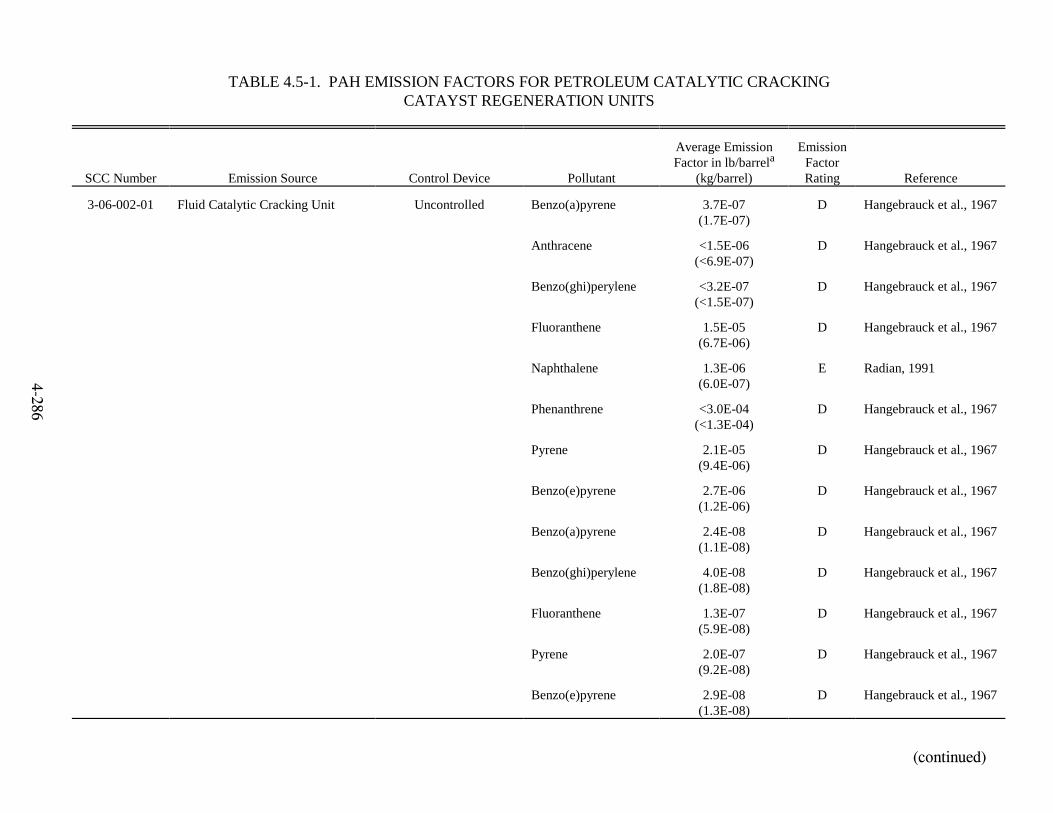
Emission Factors--Residential Wood Combustion
POM is an important component of the condensible fraction of wood smoke. The
POM in wood smoke contains a wide range of compounds, including organic compounds formed
through incomplete combustion by the combination of free radical species in the flame zone.
Emission factors for conventional, noncatalytic, catalytic, and exempt pellet woodstoves were
compiled from various testing studies and reported by EPA (U.S. EPA, 1993b). The emission
����
factors are shown in Tables 4.1-1 through 4.1-4. No factors are reported for masonry heaters;
however, it is probable that POM is emitted from these units as well.
There are fewer PAH emissions test data for fireplaces as compared to
woodstoves. Factors for individual PAH species from the burning of oak and the burning of pine
were obtained from the results of EPA’s research program for controlling residential wood
combustion emissions (Hall and DeAngelis, 1980). As part of that program, PAH emissions
from fireplaces burning seasoned oak wood and green pine were measured. The emission factors
developed from these measurements are shown in Table 4.1-5. Another set of emission factors
collected as part of a literature review by Cooper (Cooper, 1980) is also shown in Table 4.1-5.
The wood type used in the tests supporting those factors was not identified.
Process Description--Residential Coal Combustion
Coal is not a widely used source of fuel for residential heating purposes in the
United States. Only 0.3 percent of the total coal consumption in 1990 was for residential use
(Energy Information Administration, 1992). However, combustion units burning coal are
sources of POM emissions and may be important local sources in areas that have a large number
of residential houses that rely on this fuel for heating.
There are a wide variety of coal-burning stoves in use. These include boilers,
furnaces, stoves that are designed to burn coal, and wood-burning stoves that burn coal. These
units may be hand-fed or automatic feed. Boilers and warm-air furnaces are usually stoker-fed
and are automatically controlled by a thermostat. The stove units are less sophisticated, generally
hand-fed, and less energy efficient than boilers and furnaces. POM emissions from all these
units depend strongly on combustion efficiency, which can vary widely from unit to unit. Higher
POM emissions are typically associated with the stove-type units because they have lower
combustion efficiencies (DeAngelis and Reznik, 1979).
����
TABLE 4.1-1. PAH EMISSION FACTORS FOR CONVENTIONAL WOODSTOVES
SCC Number Emission Source Control Device Pollutant
Burnet, P. G., J. E. Houck, and R. B. Roholt. Effect of Appliance Type and Operating Variableson Woodstove Emissions, Volume I: Report and Appendices A-C. Prepared forU.S. Environmental Protection Agency, Office of Research and Development, Research TrianglePark, North Carolina. PB90-151457. pp. 48-49. 1990a.
Burnet, P. G., J. E. Houck, and R. B. Roholt. Effect of Appliance Type and Operating Variableson Woodstove Emissions, Volume I: Report and Appendices A-C. Prepared forU.S. Environmental Protection Agency, Office of Research and Development, Research TrianglePark, North Carolina. PB90-151457. p. 60. 1990b. Cooper, J. A. “Environmental Impact of Residential Wood Combustion Emissions and ItsImplications.” Journal of the Air Pollution Control Association, Volume 30, No. 8, pp. 855-861. 1980.
DeAngelis, D.G., and R.B. Reznik. Source Assessment: Residential Combustion of Coal. Prepared for U.S. Environmental Protection Agency, Industrial Environmental ResearchLaboratory, Research Triangle Park, North Carolina. EPA-600/2-79-019a. p. 52. 1979.
Energy Information Administration. State Energy Data Report. Office of Energy Markets andEnd Uses, Washington, DC. DOE/EIA-0214(90). pp. 31-32. 1992.
Energy Information Administration. Fuel Oil and Kerosene Sales 1990. Office of Oil and Gas,Washington, DC. DOE/EIA-00535(90). p. 11. 1991.
Giammar, R.D., R.B. Engdahl, and R.E. Barrett. Emissions from Residential and SmallCommercial Stoker-Fired Boilers Under Smokeless Operation. U.S. Environmental ProtectionAgency, Research Triangle Park, North Carolina. EPA-600/7-76-029. 1976.
Hall, R. E., and D. G. DeAngelis. “EPA’s Research Program for Controlling Residential WoodCombustion Emissions.” Journal of the Air Pollution Control Association, Volume 30, No. 8,pp. 862-865. 1980.
Hangebrauck, R.P., P.J. von Lehmden and J.E. Meeker. “Sources of Polynuclear Hydrocarbonsin the Atmosphere.” Public Health Service Report No. AP-33. U.S. Department of Health andWarfare, Public Health Service, Cincinnati, Ohio. 1967.
Johnson, N.D., M.T. Scholtz, V. Cassaday, and K. Davidson. MOE Toxic Chemical EmissionInventory for Ontario and Eastern North America. Prepared for the Air Resources Branch,Ontario Ministry of the Environment, Rexdale, Ontario. Draft Report No. P.89-50-5429/OG. p. 151. 1990a.
����
Johnson, N.D., M.T. Scholtz, V. Cassaday, and K. Davidson. MOE Toxic Chemical EmissionInventory for Ontario and Eastern North America. Prepared for the Air Resources Branch,Ontario Ministry of the Environment, Rexdale, Ontario. Draft Report No. P.89-50-5429/OG. p. 146. 1990b.
Kelly, M.E. Sources and Emissions of Polycyclic Organic Matter. U.S. EnvironmentalProtection Agency, Research Triangle Park, North Carolina. EPA Report No. 450/5-83-010b. pp. 5-9 to 5-44. 1983.
McCrillis, R. C., R. R. Watts, and S. H. Warren. “Effects of Operating Variables on PAHEmissions from Woodstoves.” Journal of the Air and Waste Management Association,Volume 42, No. 5, pp. 691-694. 1992a.
McCrillis, R. C., and R. R. Watts. “Analysis of Emissions from Residential Oil Furnaces.” U.S. Environmental Protection Agency, Air and Energy Research Laboratory and Health EffectsResearch Laboratory, Research Triangle Park, North Carolina. 92-110.06. pp. 1-9. 1992b.
Mead, R.C., G.W. Brooks, and B.K. Post. Summary of Trace Emissions from andRecommendations of Risk Assessment Methodologies for Coal and Oil Combustion Sources. Prepared for U.S. Environmental Protection Agency, Pollutant Assessment Branch, ResearchTriangle Park, North Carolina. EPA Contract No. 68-02-3889, Work Assignment 41. July 1986.
Ryan, J. V., and R. C. McCrillis. “Analysis of Emissions from Residential Natural GasFurnaces.” Paper Presented at 87th Annual Meeting and Exhibition of the Air and WasteManagement Association. Cincinnati, Ohio. Report No. 94-WA75A.04. pp. 2-9. June 19-24, 1994.
Sanborn, C.R., M. Cooke, and M.C. Osborn. Characterization of Emissions of PAHs fromResidential Coal-fired Space Heaters. U.S. Environmental Protection Agency, Research TrianglePark, North Carolina. EPA/600/D-85/243. 1985.
Smith, I.M. “PAH from Coal Utilization-Emissions and Effects.” IEA Coal Research, London,England. PB-85-17728-5. 1984.
Steiber, R. S., and R. C. McCrillis. Comparison of Emissions and Organic Fingerprints fromCombustion of Oil and Wood. U.S. Environmental Protection Agency, Air and EnergyEngineering Research Laboratory, Research Triangle Park, North Carolina. pp. 4-6. 1991.
Suprenant, N.F., R.R. Hall, K.T. McGregor, and A.S. Werner. Emissions Assessment ofConventional Stationary Combustion Systems, Volume 1: Gas- and Oil-Fired ResidentialHeating Sources. U.S. Environmental Protection Agency, Industrial Environmental ResearchLaboratory, Research Triangle Park, North Carolina. pp. 19-20. 1979.
Traynor, G. W., M. G. Apte, and H. A. Sokol. “Selected Organic Pollutant Emissions fromUnvented Kerosene Space Heaters.” Environmental Sciences and Technology, Volume 24,No. 8, pp. 1265-1270. 1990.
����
U.S. Environmental Protection Agency. Supplement F to Compilation of Air Pollutant EmissionFactors, Volume I: Stationary Point and Area Sources. Office of Air Quality Planning andStandards, Research Triangle Park, North Carolina. AP-42, Volume I, Supplement F. pp. 1.9-1to 1.9-5. July 1993a.
U.S. Environmental Protection Agency. Supplement F to Compilation of Air Pollutant EmissionFactors, Volume I: Stationary Point and Area Sources. Office of Air Quality Planning andStandards, Research Triangle Park, North Carolina. AP-42, Volume I, Supplement F. pp. 1.10-1to 1.10-2. July 1993b.
����
4.1.2 Utility, Industrial and Commercial Fuel Combustion
Process Description--Utility Sector
Utility boilers burn coal, oil, and natural gas to generate steam for electricity
Emission factors are in lb (g) of pollutant per MMBtu (MJ) of heat input.a
Source operated at 40,300 to 56,000 lb (18,280 to 25,400 kg) steam/hr firing pine/fir hog fuel and chips.b
Multiple cyclones without flyash reinjection.c
Data suspect; no emission factor developed.d
Source operated at 40,750 to 46,000 (18,484 to 20,865 kg) lb steam/hr firing sander dust fuel.e
Sources operated at 165,820 to 174,400 lb (75,215 to 79,107 kg) steam/hr firing pine/fir hog fuel and chips.f
Source operated at 91,500 to 93,000 lb (41,504 to 42,184 kg) steam/hr firing pine/fir chips.g
Source operated at 90,000 lb (40,824 kg) steam/hr firing pine/cedar hog fuel.h
Source operated at 117,000 to 126,000 lb (53,071 to 57,153 kg) steam/hr firing redwood/fir hog fuel.i
Source Emission Testing of the CE Wood-Fired Boiler at Rosenburg Forest Products (TAC Site #3). Performed for the Timber Association of California.j
Galston Technical Services, January 1991.Source Emission Testing of the Wood-fired Boiler at Big Valley Timber Company, Bieber, California. Performed for the Timber Association of California.k
Galston Technical Services, February, 1991.Source Emission Testing of the Wood-fired Boiler Exhaust at Bohemia, Inc., Rocklin, California. Prepared for the Timber Association of California. Galstonl
Technial Services, December 1990.Source Emission Testing of the Wood-Fired Boiler Exhaust at Sierra Pacific, Burney, California. Performed for the Timber Association of California. Galstonm
Technical Services, February 1991.Source Emission Testing of the Wood-fired Boiler #1 Exhaust Stack at Wheelabrator Shasta Energy Company (TAC Site 9), Anderson, California. Performedn
for the Timber Association of California. Galston Technical Services, January 1991.Source Emission Testing of the Wood-fired Boiler at Yorke Energy, North Fork, California. Performed for the Timber Association of California. Galstono
Technical Services, January 1991.Source Emission Testing of the Wood-fired boiler at Catalyst Hudson, Inc., Anderson California. Performed for the Timber Association of California. Galstonp
Technical Services, February 1991.Source Emission Testing of the Wood-fired Boiler #3 Exhaust at Georgia Pacific, Fort Bragg, California. Performed for the Timber Association of California.q
Emission factors are in lb (g) of pollutants per MMBtu (MJ) of heat input.a
Source operated at 6,400 to 6,802 lb (2,903 to 3,085 kg) steam/hr firing fir sawdust fuel.b
Boiler of unknown design operated at 13,000 to 34,000 (5,897 to 15,422 kg) steam/hr firing cedar chips.c
Source Emission Testing of the Wood-fired Boiler Exhaust at Miller Redwood Co., Crescent City, California. Performed for the Timber Association of California.d
Galston Technical Services, February 1991.Determination of AB 2588 Emissions from a Wood-fired Boiler Exhaust, February 10 - 13, 1992. (Confidential Report No. ERC-63).e
4-78
TABLE 4.1.2-6. PAH EMISSION FACTORS FOR NATURAL GAS-FIRED UTILITY BOILERS
SCC Number Emission Source Control Device Pollutant (g/MJ) Rating Reference
Average Emission Factor in Emissionlb/MMBtu Factor
a
1-01-006-01 Opposed Fired None Fluorene 2.0E-09 D Booth et al., 1992Boiler (8.6E-10)b
Naphthalene 4.5E-08 D Booth et al., 1992(1.9E-08)
Phenanthrene 3.7E-09 D Booth et al., 1992(1.6E-09)
1-01-006-01 Opposed Fired Flue Gas Chrysene 1.45E-08 D FIREBoiler Recirculation (6.3E-09)c
d
Acenaphthene 4.57E-05 D FIRE(2.0E-05)
d
Acenaphthylene 1.85E-08 D FIRE(8.0E-09)
d
Anthracene 1.25E-08 D FIRE(5.4E-09)
d
Fluoranthene 5.02E-08 D FIRE(2.2E-08)
d
Fluorene 1.45E-07 D FIRE(6.2E-08)
d
Naphthalene 4.78E-05 D FIRE(2.1E-05)
d
Phenanthrene 1.80E-07 D FIRE(7.7E-08)
d
Pyrene 4.75E-08 D FIRE(2.0E-08)
d
Emission factors are in lb (g) per MMBtu (MJ) of heat input.a
SCC Number Source Device Pollutant (g/kL) (g/kL) Rating ReferenceEmission Control Factor in lb/MMCF in lb/MMCF Factor
Average Emission Emission Factor Range Emission
a a
1-02-006-01, None Fluoranthene 8.69E-07 ND - 8.69E-6 D Suprenant et al., 1981-02, -03 (1.39E-05) (ND - 1.39E-4)
b
Naphthalene 4.24E-06 ND - 1.47E-5 D Suprenant et al., 1981(6.80E-05) (ND - 2.35E-4)
Phenanthrene 2.52E-07 ND - 1.68E-6 D Suprenant et al., 1981(4.04E-06) (ND - 2.69E-5)
Pyrene 1.97E-07 ND - 1.12E-6 D Suprenant et al., 1981(3.16E-06) (ND - 1.79E-5)
2-Methyl 1.37E-08 ND - 1.37E-7 D Suprenant et al., 1981phenanthrene (2.19E-07) (ND - 2.19E-6)
Carbazole 7.74E-08 ND - 7.74E-7 D Suprenant et al., 1981(1.24E-06) (ND - 1.24E-5)
1-03-006-01 None Acenaphthylene 4.99E-06 ND - 2.04E-5 D Johnson et al., 19901-03-006-02 (8.0E-05) (ND - 3.26E-4)
c
Fluoranthene 4.37E-07 ND - 2.12E-6 D Johnson et al., 1990(7.0E-06) (ND - 3.40E-5)
Naphthalene 1.75E-05 ND - 8.62E-5 D Suprenant et al., 1981(2.8E-04) (ND - 1.38E-3)
Phenanthrene 6.24E-07 ND - 3.37E-6 D Johnson et al., 1990(1.0E-05) (ND - 5.40E-5)
Pyrene 1.87E-06 ND - 8.18E-6 D Johnson et al., 1990(3.0E-05) (ND - 1.31E-4)
ND: Not Detected.Emission factors are in lb (g) per MMCF (kL) of natural gas fired.a
Average emission factors based on 10 units tested: 2 firetube, 1 scotch, 7 watertube. Rated capacity range: 7.2 to 178 MMBtu/hr (2.4 to 52MW).b
Average emission factors based on 5 packaged watertube boilers tested. Rated capacity range: 17.4 to 126 MMBtu/hr (5.1 to 37 MW).c
4-80
TABLE 4.1.2-8. PAH EMISSION FACTORS FOR ANTHRACITE COAL COMBUSTION
SCC Number Emission Source Control Device Pollutant (kg/Mg) Rating Reference
Average EmissionFactor in lb/ton Emission Factor
a
1-01-001-02, Stoker None Naphthalene 0.13 E U.S. EPA, 1995b1-02-001-04 (0.065)
Phenanthrene 6.8E-03 E U.S. EPA, 1995b(3.4E-03)
Emission factors are in lb (kg) per ton (Mg) of coal fired.a
(continued)
4-81
TABLE 4.1.2-9. PAH EMISSION FACTORS FOR COAL-FIRED UTILITY BOILERS
SCC Number Emission Source Device Pollutant (kg/Mg) (kg/Mg) Rating ReferenceControl Factor in lb/ton Range in lb/ton Factor
Average Emission Emission Factor Emission
a a
1-01-002-01 Pulverized Bituminous Benzo(a)pyrene 1.94E-04 ND - 1.17E-03 E Johnson et al., 1990Wet-Bottom (9.72E-05) (ND - 5.83E-04)b
c
d
Benzo(b)fluoranthene 6.94E-05 ND - 4.16E-04 D Johnson et al., 1990(3.47E-05) (ND - 2.08E-04)
Chrysene 2.16E-04 ND - 1.29E-03 D Johnson et al., 1990 (1.08E-04) (ND - 6.47E-04)
Indeno(1,2,3-cd)pyrene 6.22E-05 ND - 3.74E-04 D Johnson et al., 1990 (3.11E-05) (ND - 1.87E-04)
Benzo(ghi)perylene 4.16E-05 ND - 2.50E-04 D Johnson et al., 1990 (2.08E-05) (ND - 1.25E-04)
Fluoranthene 1.70E-04 ND - 1.02E-03 D Johnson et al., 1990 (8.48E-05) (ND - 5.10E-04)
Naphthalene 1.46E-04 ND - 4.37E-04 D Shih et al., 1980 (7.29E-05) (ND - 2.18E-04)
Phenanthrene 5.34E-04 ND - 3.08E-03 D Johnson et al., 1990 (2.67E-04) (ND - 1.54E-03)
Pyrene 3.76E-04 ND - 2.26E-03 D Johnson et al., 1990 (1.88E-04) (ND - 1.13E-03)
1-01-002-02 Pulverized Bituminous Benz(a)anthracene 1.68E-06 ND - 6.04E-06 D Johnson et al., 1990Dry-Bottom (8.40E-07) (ND - 3.02E-06)e
f
Benzo(a)pyrene 1.32E-05 ND - 9.60E-05 D Johnson et al., 1990 (6.58E-06) (ND - 4.80E-05)
Benzo(b)fluoranthene 1.46E-06 ND - 3.46E-06 D Johnson et al., 1990 (7.30E-07) (ND - 1.73E-06)
TABLE 4.1.2-9. (Continued)
SCC Number Emission Source Device Pollutant (kg/Mg) (kg/Mg) Rating ReferenceControl Factor in lb/ton Range in lb/ton Factor
Average Emission Emission Factor Emission
a a
(continued)
4-82
1-01-002-02 Pulverized Bituminous Benzo(k)fluoranthene 8.60E-07 ND - 3.10E-06 D Johnson et al., 1990(continued) Dry-Bottom (4.30E-07) (ND - 1.55E-06)e
(continued)
f
Chrysene 2.96E-06 ND - 1.11E-05 D Johnson et al., 1990 (1.48E-06) (ND - 5.54E-06)
Dibenz(a,h)anthracene 4.60E-06 ND - 1.25E-05 D Johnson et al., 1990 (2.30E-06) (ND - 6.27E-06)
Indeno(1,2,3-cd)pyrene 2.40E-07 ND - 2.40E-06 D Johnson et al., 1990 (1.20E-07) (ND - 1.20E-06)
Acenaphthene 5.80E-07 ND - 1.46E-06 D Johnson et al., 1990 (2.90E-07) (ND - 7.30E-07)
Acenaphthylene 1.02E-06 ND - 3.24E-06 D Johnson et al., 1990 (5.10E-07) (ND - 1.62E-06)
Anthracene 1.70E-06 ND - 4.44E-06 D Johnson et al., 1990 (8.50E-07) (ND - 2.22E-06)
Benzo(ghi)perylene 9.76E-06 ND - 2.76E-05 D Johnson et al., 1990 (4.88E-06) (ND - 1.38E-05)
Fluoranthene 9.00E-06 ND - 3.10E-05 D Johnson et al., 1990 (4.50E-06) (ND - 1.55E-05)
Fluorene 1.38E-06 ND - 5.36E-06 D Johnson et al., 1990 (6.90E-07) (ND - 2.68E-06)
Naphthalene 6.89E-04 ND - 3.77E-03 D Shih et al., 1980 (3.45E-04) (ND - 1.89E-03)
Phenanthrene 1.88E-05 ND - 6.28E-05 D Johnson et al., 1990 (9.38E-06) (ND - 3.14E-05)
TABLE 4.1.2-9. (Continued)
SCC Number Emission Source Device Pollutant (kg/Mg) (kg/Mg) Rating ReferenceControl Factor in lb/ton Range in lb/ton Factor
Average Emission Emission Factor Emission
a a
(continued)
4-83
1-01-002-02 Pulverized Bituminous Pyrene 9.46E-06 ND - 3.40E-05 D Johnson et al., 1990(continued) Dry-Bottome (4.73E-06) (ND - 1.70E-05)
(continued)
f
1-Nitropyrene 2.48E-06 4.80E-07 - 4.60E-06 D Johnson et al., 1990 (1.24E-06) (2.40E-07 - 2.30E-06)
Benzo(a)fluorene 4.86E-06 1.46E-06 - 7.80E-06 D Johnson et al., 1990 (2.43E-06) (7.30E-07 - 3.90E-06)
Benzo(e)pyrene 2.60E-07 ND - 4.80E-07 D Johnson et al., 1990 (1.30E-07) (ND - 2.40E-07)
Methylanthracenes 1.01E-05 2.00E-06 - 3.30E-05 D Johnson et al., 1990 (5.04E-06) (1.00E-06 - 1.65E-05)
Methylphenanthrenes 2.92E-06 ND - 1.42E-05 D Johnson et al., 1990 (1.46E-06) (N - 7.10E-06)
Triphenylene 1.00E-07 ND - 2.20E-05 D Johnson et al., 1990 (5.00E-08) (ND - 1.10E-05)
1-01-002-03 Bituminous Cyclone ESP Benz(a)anthracene 3.72E-09 --- D Sverdrup et al., 1994g
(1.60E-09)h
Benzo(a)pyrene 1.16E-09 --- D Sverdrup et al., 1994 (5.00E-10)h
Benzo(b+k)fluoranthene 6.98E-09 --- D Sverdrup et al., 1994 (3.00E-09)h
Chrysene 8.84E-09 --- D Sverdrup et al., 1994 (3.80E-09)h
Dibenz(a,h)anthracene 1.16E-09 --- D Sverdrup et al., 1994 (5.00E-10)h
TABLE 4.1.2-9. (Continued)
SCC Number Emission Source Device Pollutant (kg/Mg) (kg/Mg) Rating ReferenceControl Factor in lb/ton Range in lb/ton Factor
Average Emission Emission Factor Emission
a a
(continued)
4-84
1-01-002-03 Bituminous Cyclone ESP Indeno(1,2,3-cd)pyrene 6.98E-10 --- D Sverdrup et al., 1994(continued) (continued) (continued) (3.00E-10)
g
h
Acenaphthene 2.65E-08 --- D Sverdrup et al., 1994 (1.14E-08)h
Acenaphthylene 6.75E-09 --- D Sverdrup et al., 1994 (2.90E-09)h
Anthracene 2.07E-08 --- D Sverdrup et al., 1994 (8.90E-09)h
Benzo(ghi)perylene 1.16E-09 --- D Sverdrup et al., 1994 (5.00E-10)h
Fluoranthene 2.70E-08 --- D Sverdrup et al., 1994 (1.16E-08)h
Fluorene 3.14E-08 --- D Sverdrup et al., 1994 (1.35E-08) h
Naphthalene 2.15E-07 --- D Sverdrup et al., 1994 (9.26E-08)h
Phenanthrene 7.77E-08 --- D Sverdrup et al., 1994 (3.34E-08)h
Pyrene 1.40E-08 --- D Sverdrup et al., 1994 (6.00E-09)h
1-Methylnaphthalene 1.58E-08 --- D Sverdrup et al., 1994 (6.80E-09)h
2-Methylnaphthalene 3.74E-08 --- D Sverdrup et al., 1994 (1.61E-08)h
TABLE 4.1.2-9. (Continued)
SCC Number Emission Source Device Pollutant (kg/Mg) (kg/Mg) Rating ReferenceControl Factor in lb/ton Range in lb/ton Factor
Average Emission Emission Factor Emission
a a
(continued)
4-85
1-01-002-03 Bituminous Cyclone ESP Benzo(e)pyrene 2.09E-09 --- D Sverdrup et al., 1994(continued) (continued) (continued) (9.00E-10)
g
h
1-01-002-03 Bituminous Cyclone Baghouse/ Benz(a)anthracene 2.09E-09 --- D Sverdrup et al., 1994i
SNOX (9.00E-10)j h
Benzo(a)pyrene 9.30E-10 --- D Sverdrup et al., 1994 (4.00E-10)h
Benzo(b+k)fluoranthene 3.95E-09 --- D Sverdrup et al., 1994 (1.70E-09)h
Chrysene 2.09E-09 --- D Sverdrup et al., 1994 (9.00E-10)h
Dibenz(a,h)anthracene 6.98E-10 --- D Sverdrup et al., 1994 (3.00E-10)h
Indeno(1,2,3-cd)pyrene 9.30E-10 --- D Sverdrup et al., 1994 (4.00E-10)h
Acenaphthene 5.35E-09 --- D Sverdrup et al., 1994 (2.30E-09)h
Acenaphthylene 4.19E-09 --- D Sverdrup et al., 1994 (1.80E-09)h
Anthracene 3.49E-09 --- D Sverdrup et al., 1994 (1.50E-09)h
Benzo(ghi)perylene 9.30E-10 --- D Sverdrup et al., 1994 (4.00E-10)h
Fluoranthene 6.98E-09 --- D Sverdrup et al., 1994 (3.00E-09)h
TABLE 4.1.2-9. (Continued)
SCC Number Emission Source Device Pollutant (kg/Mg) (kg/Mg) Rating ReferenceControl Factor in lb/ton Range in lb/ton Factor
Average Emission Emission Factor Emission
a a
(continued)
4-86
1-01-002-03 Bituminous Cyclone Baghouse/ Fluorene 6.98E-10 --- D Sverdrup et al., 1994(continued) (continued) SNOX (3.00E-10)
i
j
(continued)
h
Naphthalene 5.98E-08 --- D Sverdrup et al., 1994 (2.57E-08)h
Phenanthrene 2.42E-08 --- D Sverdrup et al., 1994 (1.04E-08)h
Pyrene 1.16E-09 --- D Sverdrup et al., 1994 (5.00E-10)h
1-Methylnaphthalene 1.14E-08 --- D Sverdrup et al., 1994 (4.90E-09)h
2-Methylnaphthalene 2.00E-08 --- D Sverdrup et al., 1994 (8.60E-09)h
Benzo(e)pyrene 1.16E-09 --- D Sverdrup et al., 1994 (5.00E-10)h
1-01-003-01, 06 Lignite Utility Boiler Benz(a)anthracene 1.40E-07 ND - 5.80E-07 D Johnson et al., 1990k l
(7.00E-08) (ND - 2.90E-07)
Benzo(a)pyrene 6.60E-07 ND - 1.90E-06 D Johnson et al., 1990 (3.30E-07) (ND - 9.50E-07)
Benzo(b)fluoranthene 4.00E-07 ND - 1.86E-06 D Johnson et al., 1990 (2.00E-07) (ND - 9.30E-07)
Benzo(k)fluoranthene 3.00E-07 ND - 1.38E-06 D Johnson et al., 1990 (1.50E-07) (ND - 6.90E-07)
Chrysene 2.40E-07 ND - 1.08E-06 D Johnson et al., 1990 (1.20E-07) (ND - 5.40E-07)
TABLE 4.1.2-9. (Continued)
SCC Number Emission Source Device Pollutant (kg/Mg) (kg/Mg) Rating ReferenceControl Factor in lb/ton Range in lb/ton Factor
Average Emission Emission Factor Emission
a a
(continued)
4-87
1-01-003-01, 06 Lignite Utility Boiler Indeno(1,2,3-cd)pyrene 6.40E-07 ND - 1.18E-06 D Johnson et al., 1990(continued) (continued) (3.20E-07) (ND - 5.90E-07)
k l
Anthracene 3.40E-07 ND - 1.08E-06 D Johnson et al., 1990 (1.70E-07) (ND - 5.40E-07)
Benzo(ghi)perylene 1.78E-06 ND - 7.80E-06 D Johnson et al., 1990 (8.90E-07) (ND - 3.90E-06)
Fluoranthene 2.80E-07 ND - 1.32E-06 D Johnson et al., 1990 (1.40E-07) (ND - 6.60E-07)
Fluorene 1.40E-07 ND - 3.60E-07 D Johnson et al., 1990 (7.00E-08) (ND - 1.80E-07)
Phenanthrene 4.40E-07 ND - 1.86E-06 D Johnson et al., 1990 (2.20E-07) (ND - 9.30E-07)
Pyrene 2.80E-06 ND - 1.38E-05 D Johnson et al., 1990 (1.40E-06) (ND - 6.90E-06)
1-Nitropyrene 3.20E-06 8.40E-07 - 5.60E-06 D Johnson et al., 1990 (1.60E-06) (4.20E-07 - 2.80E-06)
Benzo(a)fluorene 3.00E-07 ND - 4.80E-07 D Johnson et al., 1990 (1.50E-07) (ND - 2.40E-07)
Benzo(e)pyrene 1.46E-06 ND -8.00E-06 D Johnson et al., 1990 (7.30E-07) (ND - 4.00E-06)
Dibenz(a,h)acridine 4.00E-07 ND - 7.20E-07 D Johnson et al., 1990 (2.00E-07) (ND - 3.60E-07)
Methylanthracenes 1.70E-06 1.20E-06 - 1.86E-06 D Johnson et al., 1990 (8.50E-07) (6.00E-07 - 9.30E-07)
TABLE 4.1.2-9. (Continued)
SCC Number Emission Source Device Pollutant (kg/Mg) (kg/Mg) Rating ReferenceControl Factor in lb/ton Range in lb/ton Factor
Average Emission Emission Factor Emission
a a
(continued)
4-88
1-01-003-01, 06 Lignite Utility Boiler Triphenylene 4.00E-08 ND - 1.00E-07 D Johnson et al., 1990(continued) (continued) (2.00E-08) (ND - 5.00E-08)
k l
1-01-003-02 Pulverized Lignite ESP/Wet Benz(a)anthracene 2.09E-09 --- D Sverdrup et al., 1994Tangential Dry FGD (9.00E-10)Bottomm
n h
Benzo(a)pyrene 9.30E-10 --- D Sverdrup et al., 1994 (4.00E-10)h
Benzo(b+k)fluoranthene 4.42E-09 --- D Sverdrup et al., 1994 (1.90E-09)h
Chrysene 5.35E-09 --- D Sverdrup et al., 1994 (2.30E-09)h
Dibenz(a,h)anthracene 6.98E-10 --- D Sverdrup et al., 1994 (3.00E-10)h
Indeno(1,2,3-cd)pyrene 6.98E-10 --- D Sverdrup et al., 1994 (3.00E-10)h
Acenaphthene 1.72E-08 --- D Sverdrup et al., 1994 (7.40E-09)h
Acenaphthylene 1.05E-08 --- D Sverdrup et al., 1994 (4.50E-09)h
Anthracene 1.47E-08 --- D Sverdrup et al., 1994 (6.30E-09)h
Benzo(ghi)perylene 6.98E-10 --- D Sverdrup et al., 1994 (3.00E-10)h
Fluoranthene 4.23E-08 --- D Sverdrup et al., 1994 (1.82E-08)h
TABLE 4.1.2-9. (Continued)
SCC Number Emission Source Device Pollutant (kg/Mg) (kg/Mg) Rating ReferenceControl Factor in lb/ton Range in lb/ton Factor
Average Emission Emission Factor Emission
a a
(continued)
4-89
1-01-003-02 Pulverized Lignite ESP/Wet Fluorene 4.16E-08 --- D Sverdrup et al., 1994(continued) Tangential Dry FGD (1.79E-08)
Bottom (continued) (continued)m
n h
Naphthalene 2.56E-07 --- D Sverdrup et al., 1994 (1.10E-07)h
Phenanthrene 3.14E-07 --- D Sverdrup et al., 1994 (1.35E-07)h
Pyrene 1.63E-08 --- D Sverdrup et al., 1994(7.00E-09)h
1-Methylnaphthalene 1.51E-08 --- D Sverdrup et al., 1994(6.50E-09)h
2-Methylnaphthalene 4.09E-08 --- D Sverdrup et al., 1994(1.76E-08)h
Benzo(e)pyrene 1.16E-09 --- D Sverdrup et al., 1994(5.00E-10)h
ND: Not Detected.Emission factors are in lb (kg) per ton (Mg) of coal fired, unless otherwise noted.a
Composite average emission factors based on six tested bituminous pulverized coal fired wet-bottom utility boilers. Rated capacity range: 376 to 2,834 MMBtu/hrb
(110 to 830 MW).Four of six tested units ESP controlled, one mechanical precipitator/ESP controlled and one wet scrubber controlled.c
Laboratory analysis was unable to resolve benzo(a)pyrene and benzo(e)pyrene.d
Composite average emission factors based on six pulverized bituminous coal fired dry-bottom utility boilers. Rated capacity range: 263 to 1,707 MMBtu/hre
(77 to 500 MW).Three of six tested units ESP controlled, two multicyclone/ESP controlled and one wet scrubber controlled.f
Bituminous coal fired cyclone utility boiler with four cyclone burners. Rated capacity: 369 MMBtu/hr (108 MW).g
TABLE 4.1.2-9. (Continued)
4-90
Emission factors are in lb (g) per MMBtu (MJ) of heat input.h
Bituminous coal fired cyclone utility boiler with four cyclone burners. Rated capacity: 369 MMBtu/hr (108 MW).i
Testing was conducted during an SNOX demonstration program. The SNOX process combines selective catalytic reduction (SCR) with wet sulfuric acid technologies toj
remove nitrogen and sulfur oxides from the flue gas. A slip stream (35 MW) was taken after the air preheater and before the ESP for the demonstration. Composite average emission factors based on nine lignite coal fired utility boilers, Five pulverized dry-bottom, two cyclone and two spreader stokers. Rated capacityk
range: 68 to 1,434 MMBtu/hr (20 to 420 MW).Nine tested units multicyclone or ESP controlled.l
1-01-004-01 No. 6 Oil None Benz(a)anthracene <1.02E-07 --- D FIRE Wall-Fired (<4.39E-08)Utility Boilerd
g
Chrysene <4.55E-08 --- D FIRE (<1.96E-08)
g
Dibenz(a,h)anthracene <2.47E-08 --- D FIRE (<1.06E-08)
g
Indeno(1,2,3-cd)pyrene <6.25E-08 --- D FIRE (<2.69E-08)
g
Acenaphthene <2.12E-08 --- D FIRE (<9.11E-09)
g
Anthracene <1.43E-08 --- D FIRE (<6.15E-09)
g
Benz(ghi)perylene <6.95E-08 --- D FIRE (<2.99E-08)
g
TABLE 4.1.2-11. (Continued)
SCC Number Source Control Device Pollutant (g/MJ) (g/MJ) Rating ReferenceEmission in lb/MMBtu lb/MMBtu Factor
Average Emission Factor Emission Factor Range in Emission
a a
(continued)
4-97
1-01-004-01 No. 6 Oil None Fluoranthene <7.78E-08 --- D FIRE (continued) Wall-Fired (<3.34E-08)
Utility Boilerd
(continued)
g
Fluorene <1.12E-08 --- D FIRE (<4.82E-09)
g
Naphthalene 8.44E-06 --- D FIRE (3.63E-06)
g
Phenanthrene <1.08E-07 --- D FIRE (<4.64E-08)
g
Pyrene <7.07E-08 --- D FIRE (<3.04E-08)
g
1-01-004-01 No. 6 Oil Flue Gas Acenaphthene 4.55E-07 --- D FIRE Wall-Fired Recirculation (1.96E-07)Utility Boilere
h
Anthracene <8.73E-09 --- D FIRE (<3.75E-09)
h
Fluoranthene <9.41E-09 --- D FIRE (<4.05E-09)
h
Fluorene 2.55E-08 --- D FIRE (1.10E-08)
h
Naphthalene 2.67E-06 --- D FIRE (1.15E-06)
h
Phenanthrene 2.45E-08 --- D FIRE (1.05E-08)
h
TABLE 4.1.2-11. (Continued)
SCC Number Source Control Device Pollutant (g/MJ) (g/MJ) Rating ReferenceEmission in lb/MMBtu lb/MMBtu Factor
Average Emission Factor Emission Factor Range in Emission
a a
(continued)
4-98
1-01-004-01 No. 6 Oil Flue Gas Pyrene <8.42E-09 --- D FIRE (continued) Wall-Fired Recirculation (<3.62E-09)
Utility Boiler (continued)e
(continued)
h
1-01-004-05 No. 5 Flue Gas Chrysene 1.45E-08 --- D FIRE Oil-Fired Recirculation (6.23E-09)Utility Boilerf
i
Acenaphthene 4.57E-05 --- D FIRE (1.96E-05)
i
Acenaphthylene 1.85E-08 --- D FIRE (7.97E-09)
i
Anthracene 1.25E-08 --- D FIRE (5.37E-09)
i
Fluoranthene 5.02E-08 --- D FIRE (2.16E-08)
i
Fluorene 1.45E-07 --- D FIRE (6.25E-08)
i
Naphthalene 4.78E-05 --- D FIRE (2.06E-05)
i
Phenanthrene 1.80E-07 --- D FIRE (7.74E-08)
i
Pyrene 4.75E-08 --- D FIRE (2.04E-08)
i
TABLE 4.1.2-11. (Continued)
SCC Number Source Control Device Pollutant (g/MJ) (g/MJ) Rating ReferenceEmission in lb/MMBtu lb/MMBtu Factor
Average Emission Factor Emission Factor Range in Emission
a a
(continued)
4-99
1-02-004-01 No. 6 None Chrysene 1.40E-07 --- D FIRE Oil-Fired (6.02E-08)IndustrialBoiler
j
Benzo(b)fluoranthene <2.00E-08 --- D FIRE (<8.60E-09)
j
Acenaphthylene <7.40E-07 --- D FIRE (<3.18E-07)
j
Fluoranthene <1.90E-07 --- D FIRE (<8.17E-08)
j
Fluorene 3.50E-07 --- D FIRE (1.50E-07)
j
Naphthalene 2.12E-04 --- D FIRE (9.11E-05)
j
Phenanthrene 5.10E-07 --- D FIRE (2.19E-07)
j
Pyrene 2.60E-08 --- D FIRE (1.12E-08)
j
2-Methylnaphthalene 9.80E-07 --- D FIRE (4.21E-07)
j
1-02-005-01, No. 2 None Benzo(a)pyrene <5.96E-09 ND - 3.58E-08 E Johnson et al.,1-03-005-01 Oil-Fired (<2.56E-09) (ND - 1.54E-08) 1990
Boiler
Fluoranthene <1.91E-08 ND - 9.54E-08 E Johnson et al.,(<8.20E-09) (ND - 4.10E-08) 1990
TABLE 4.1.2-11. (Continued)
SCC Number Source Control Device Pollutant (g/MJ) (g/MJ) Rating ReferenceEmission in lb/MMBtu lb/MMBtu Factor
Average Emission Factor Emission Factor Range in Emission
a a
4-100
1-02-005-01, No. 2 None Naphthalene <5.00E-05 ND - 1.50E-04 E Suprenant et al.,1-03-005-01 Oil-Fired (<2.15E-05) (ND - 6.45E-05) 1980(continued) Boilerg
(continued)
Pyrene <1.79E-08 ND - 8.34E-08 E Johnson et al.,(<7.69E-09) (ND - 3.59E-08) 1990
NA - Not Applicable.ND - Not Detected.Emission factors are in lb (g) per MMBtu (MJ) of heat input.a
Multiple units tested. Boiler design: front or opposed fired. Rated capacity range: 188 to 2,523 MMBtu/hr (55 to 739 MW).b
Data not available to calculate mean emission factor. Median emission factor may be used.c
598 MMBtu/hr (175 MW) wall-fired utility boiler operated at nominal full load during testing.d
1,639 MMBtu/hr (480 MW) wall-fired utility boiler operated at nominal full load during testing.e
785 MMBtu/hr (230 MW) utility boiler operated over a range of load conditions during testing.f
Bell, Arlene C., and Booth, Richard B. Emissions Inventory Testing at El Segundo Generating Station Unit 1. Prepared for Southern California Edisong
Company, Rosemead, California. For Inclusion in Air Toxics Hot Spots Inventory Required under AB-2588. CARNOT, Tustin, California. ESR 53304-2052. April 1990.McDannel, Mark D. and Green, Lisa A. Air Toxics Emissions Inventory Testing at Alamitos Unit 5. Prepared for Southern California Edison Company,h
Rosemead, California. For Inclusion in Air Toxics Hot Spots Inventory Required under AB-2588. CARNOT, Tustin, California. ESR 53304-2053. May 1990.Air Toxics “Hot Spots” Source Testing of a Utility Boiler, May 1991. (Confidential Report No. ERC-17).i
AB 2588 Testing of an Industrial Boiler at a Creamery, March 5 through 22, 1990. (Confidential Report No. ERC-65).j
4-101
TABLE 4.1.2-12. PAH EMISSION FACTORS FOR OIL-FIRED PROCESS HEATERS
SCC Number Emission Source Device Pollutant (g/MJ) Rating ReferenceControl Factor in lb/MMBtu Factor
Average Emission Emission
a
3-10-004-02 Residual None Benz(a)anthracene <5.51E-05 D FIREOil-Fired Pipeline (<2.37E05)Heater
b
Chrysene <1.07E-05 D FIRE(<4.60E-06)
b
Dibenz(a,h)anthracene 7.72E-06 D FIRE(3.32E-06)
b
Indeno(1,2,3-cd)pyrene 5.10E-06 D FIRE(2.19E-06)
b
Anthracene <1.52E-05 D FIRE(<6.54E-06)
b
Benz(ghi)perylene 1.38E-05 D FIRE(5.93E-06)
b
Fluoranthene 3.21E-05 D FIRE(1.38E-05)
b
Fluorene 1.96E-04 D FIRE(8.43E-05)
b
Naphthalene 2.71E-04 D FIRE(1.17E-04)
b
Phenanthrene 3.38E-04 D FIRE(1.45E-04)
b
Pyrene 9.46E-05 D FIRE(4.07E-05)
b
Emission factors are in lb (g) per MMBtu (MJ) of heat input.a
Emissions Inventory Testing at Huntington Beach Generating Station Fuel Oil Heater No. 2. Prepared for Southern Californiab
Edison Company, Rosemead, California. CARNOT, May 1990.
(continued)
4-102
TABLE 4.1.2-13. PAH EMISSION FACTORS FOR WASTE OIL COMBUSTION
SCC Number Emission Source Device Pollutant (kg/1000 l) Rating ReferenceControl lb/1000 gal Factor
Average Emission Factor in Emission
a
1-05-001-14, Space Heater - None Benz(a)anthracene/Chrysene 4.0E-03 D U.S. EPA, 1995c1-05-002-14 Vaporizing Burner (4.8E-04)
Benzo(a)pyrene 4.0E-03 D U.S. EPA, 1995c(4.8E-04)
Benzofluoranthenes 4.02E-04 D Cooke et al., 1984(4.83E-05)
Acenaphthylene 1.34E-04 D Cooke et al., 1984(1.61E-05)
Anthracene/Phenanthrene 1.10E-02 D U.S. EPA, 1995c(1.3E-03)
Fluorene 4.42E-04 D Cooke et al., 1984(5.31E-05)
Naphthalene 1.30E-02 D U.S. EPA, 1995c(1.6E-03)
Pyrene 7.1E-03 D U.S. EPA, 1995c(8.4E-04)
Benzo(e)pyrene 7.37E-04 D Cooke et al., 1984(8.85E-05)
Perylene 4.02E-04 D Cooke et al., 1984(4.83E-05)
1-05-001-13, Space Heater - None Benz(a)anthracene 3.52E-05 D Cooke et al., 19841-05-002-13 Atomizing Burner (4.22E-06)
Benzo(a)pyrene 5.86E-05 D Cooke et al., 1984(7.04E-06)
TABLE 4.1.2-13. (Continued)
SCC Number Emission Source Device Pollutant (kg/1000 l) Rating ReferenceControl lb/1000 gal Factor
Average Emission Factor in Emission
a
(continued)
4-103
1-05-001-13, Space Heater - None Chrysene 3.52E-05 D Cooke et al., 19841-05-002-13 Atomizing Burner (4.22E-06)(continued) (continued)
Indeno(1,2,3-cd)pyrene 4.69E-05 D Cooke et al., 1984(5.63E-06)
Acenaphthene 2.93E-05 D Cooke et al., 1984(3.52E-06)
Anthracene/Phenanthrene 1.0E-04 D U.S. EPA, 1995c(1.2E-05)
Benzo(ghi)perylene 4.11E-05 D Cooke et al., 1984(4.93E-06)
Fluoranthene 5.82E-05 D Cooke et al., 1984(6.34E-06)
Fluorene 8.80E-05 D Cooke et al., 1984(1.06E-05)
Naphthalene 9.2E-05 D U.S. EPA, 1995c(1.1E-05)
Pyrene 8.3E-06 D U.S. EPA, 1995c(9.95E-07)
Anthanthrene 1.17E-05 D Cooke et al., 1984(1.41E-06)
Benzo(e)pyrene 2.93E-06 D Cooke et al., 1984(3.52E-07)
TABLE 4.1.2-13. (Continued)
SCC Number Emission Source Device Pollutant (kg/1000 l) Rating ReferenceControl lb/1000 gal Factor
Average Emission Factor in Emission
a
4-104
1-05-001-13, Space Heater - None Coronene 5.86E-06 D Cooke et al., 19841-05-002-13 Atomizing Burner (7.04E-07)(continued) (continued)
Perylene 3.52E-05 D Cooke et al., 1984(4.22E-06)
Emission factors are in lb (kg) per 1,000 gal (1,000 l) of waste oil fired.a
�����
SECTION 4.1.2 REFERENCES
Baladi, E. Stationary Source Testing of Bagasse-fired Boilers at the Hawaiian Commercial and SugarCompany, Puunene, Maui, Hawaii. MRI Report Number 3927-C(12). Midwest Research Institute,Kansas City, Missouri. February 1976.
Booth, R. B., and M. D. McDannel. “Summary of Air Toxic Emission Values for Utility Boilers FiringResidual Fuel Oil or Natural Gas.” Presented at the 85th Annual Air and Waste ManagementAssociation Meeting and Exhibition, Kansas City, Missouri. 14 p. June 21-26, 1992.
Cooke, M. et al. Waste Oil Heaters: Organic, Inorganic, and Bioassay Analyses of Combustion Samples. EPA Report No. 600/D-84-130. U.S. Environmental Protection Agency, Research Triangle Park, NorthCarolina. May 1984.
Hubbard, A.J. Hazardous Air Emissions Potential from a Wood-Fired Furnace. Wisconsin Departmentof Natural Resources, Bureau of Air Management, Madison, Wisconsin. 1991.
Johnson, N.D., M.T. Scholtz, V. Cassaday, and K. Davidson. MOE Toxic Chemical Emission Inventoryfor Ontario and Eastern North America. Prepared for the Air Resources Branch, Ontario Ministry of theEnvironment, Rexdale, Ontario. Draft Report No. P.89-50-5429/OG. pp. 110-130. 1990.
Kelly, M.E. Sources and Emissions of Polycyclic Organic Matter. U.S. Environmental ProtectionAgency, Research Triangle Park, North Carolina. Report No. 450/5-83-010b. pp. 5-9 to 5-44. 1983.
Mead, R.C., G.W. Brooks, and B.K. Post. Summary of Trace Emissions from and Recommendations ofRisk Assessment Methodologies for Coal and Oil Combustion Sources. Prepared for U.S. EnvironmentalProtection Agency, Pollutant and Assessment Branch, Research Triangle Park, North Carolina. EPAContract No. 68-02-3889, Work Assignment 41. July 1986.
National Council of the Paper Industry for Air and Stream Improvement (NCASI). A Polycyclic OrganicMaterials Emissions Study for Industrial Wood-fired Boilers. NCASI Technical Bulletin No. 400. NewYork, New York. May 1983.
Sassenrath, C. P. Air Toxic Emissions from Wood-Fired Boilers. In: Proceeding of the 1991 TAPPIEnvironmental Conference. pp. 483-491. 1991.
Shih, C.C. et al. Emissions Assessment of Conventional Stationary Combustion Systems - Volume III: External Combustion Sources for Electricity Generation. Prepared for U.S. Environmental ProtectionAgency, Office of Research and Development, Washington, DC. EPA-600/7-81-003a. pp. 455. November 1980.
Surprenant, N.F., W. Battye, D. Roeck, and S.M. Sandberg. Emissions Assessment of ConventionalStationary Combustion Systems, Volume V: Industrial Combustion Sources. Prepared forU.S. Environmental Protection Agency, Office of Research and Development, Washington, DC. 178 p. April 1981.
�����
Surprenant, N.F., P. Hung, R. Li, K.T. McGregor, W. Piispanen, and S.M. Sandberg. EmissionsAssessment of Conventional Stationary Combustion Systems, Volume IV: Commercial/InstitutionalCombustion Sources. Prepared for U.S. Environmental Protection Agency, Office of Research andDevelopment, Washington, DC. 192 p. June 1980.
Sverdrup, G.M. et al. “Toxic Emissions from a Cyclone Burner Boiler with an ESP and with the SNOXDemonstration and from a Pulverized Coal Burner Boiler with an ESP/Wet Flue Gas DesulfurizationSystem.” Presented at the 87th annual meeting and exhibition of the Air and Waste ManagementAssociation, Cincinnati, Ohio, June 19-24, 1994.
U.S. Environmental Protection Agency. ICCR Inventory Database Version 3.0. Office of Air QualityPlanning and Standards, Research Triangle Park, North Carolina. 1998. ICCR Internet Website:www.epa.gov/ttn/iccr/icl.html. March 1998.
U.S. Environmental Protection Agency. Locating and Estimation Air Emissions from Sources of Dioxinsand Furans. Office of Air Quality Planning and Standards, Emission Inventory Branch, ResearchTriangle Park, North Carolina. EPA-454/R-97-003. 1997.
U.S. Environmental Protection Agency. Compilation of Air Pollutant Emissions Factors. Volume I: Stationary Point and Area Sources. AP-42, Fifth Edition, Section 1.1: Bituminous and SubbituminousCoal Combustion. Office of Air Quality Planning and Standards, Research Triangle Park, NorthCarolina. 1995a.
U.S. Environmental Protection Agency. Compilation of Air Pollutant Emissions Factors. Volume I: Stationary Point and Area Sources. AP-42, Fifth Edition, Section 1.2: Anthracite Coal Combustion. Office of Air Quality Planning and Standards, Research Triangle Park, North Carolina. 1995b.
U.S. Environmental Protection Agency. Compilation of Air Pollutant Emissions Factors. Volume I: Stationary Point and Area Sources. AP-42, Fifth Edition, Section 1.11: Waste Oil Combustion. Officeof Air Quality Planning and Standards, Research Triangle Park, North Carolina. 1995c.
U.S. Environmental Protection Agency. Factor Information Retrieval (FIRE) System Database. Version 5.1a. Office of Air Quality, Planning, and Standards, Emission Factor and Inventory Group. Research Triangle Park, North Carolina. September 1995d.
U.S. Environmental Protection Agency. Alternative Control Techniques Document - NO Emissionsxfrom Utility Boilers. Office of Air Quality Planning and Standards, Research Triangle Park, NorthCarolina. EPA-453/R-94-023. March 1994a.
U.S. Environmental Protection Agency. Compilation of Air Pollutant Emissions Factors. Volume I: Stationary Point and Area Sources. AP-42, Fifth Edition, Section 1.6: Wood Waste Combustion inBoilers. U.S. Environmental Protection Agency, Office of Air Quality Planning and Standards, ResearchTriangle Park, North Carolina. 1994b.
�����
U.S. Environmental Protection Agency. Background Information Document for Industrial Boilers. Office of Air Quality Planning and Standards, Research Triangle Park, North Carolina. EPA-450/3-82-006a. pp. 3-1 to 3-19. March 1982.
�����
4.2 STATIONARY INTERNAL COMBUSTION
Stationary internal combustion (IC) sources are grouped into two categories:
reciprocating engines and gas turbines. POM emissions primarily result from the incomplete
combustion of the gasoline, diesel, or natural gas fuel that is burned in these engines and
turbines. The principal application areas for stationary IC engines and turbines are electricity
generation and industrial applications such as oil and gas transmission, natural gas processing,
and oil and gas production and exploration (Shih et al., 1979). The use of stationary IC engines
is so widespread that source locations are not listed in this document (U.S. EPA, 1995).
4.2.1 Reciprocating Engines
The first group of stationary IC sources, reciprocating engines, may be classified
into two types: spark and compression ignition (diesel), but all reciprocating IC engines operate
by the same basic process shown in Figure 4.2-1. A combustible mixture is first compressed in a
small volume between the head of a piston and its surrounding cylinder. The mixture is then
ignited, and the resulting high pressure products of combustion push the piston through the
cylinder. This movement is converted from linear to rotary motion by a crankshaft. The piston
returns, pushing out exhaust gases, and the cycle is repeated (U.S. EPA, 1995).
Process Description--Diesel Engines
In compression ignition engines, more commonly known as diesel engines,
combustion air is first compression heated in the cylinder, and fuel is then injected into the hot
air. Ignition is spontaneous as the air is above the auto-ignition temperature of the fuel. All
distillate oil reciprocating engines are compression-ignited (U.S. EPA, 1995).
�����
Figure 4.2-1. Operating Cycle of a Conventional Reciprocating Engine
Source: Flagan and Seinfeld, 1988.
�����
Diesel engines usually operate at a higher compression ratio (ratio of cylinder
volume when the piston is at the bottom of its stroke to the volume when it is at the top) than
spark-ignited engines because fuel is not present during compression; hence, there is no danger
of premature auto-ignition. Because engine thermal efficiency rises with increasing pressure
ratio (and pressure ratio varies directly with compression ratio), diesel engines are more efficient
than spark-ignited ones. This increased efficiency is gained at the expense of poorer response to
load changes and a heavier structure to withstand the higher pressures (U.S. EPA, 1995).
The primary domestic use of large stationary diesel engines (greater than 600 hp
[447 kW]) is in oil and gas exploration and production. These engines, in groups of three to five,
supply mechanical power to operate drilling (rotary table), mud pumping and hoisting equipment,
and may also operate pumps or auxiliary power generators. Another frequent application of large
stationary diesels is electricity generation for both base and standby service. Smaller uses of
large diesel engines include irrigation, hoisting and nuclear power plant emergency cooling water
pump operation. The category of smaller diesel engines (up to 600 hp [447 kW]) covers a wide
variety of industrial applications such as aerial lifts, fork lifts, mobile refrigeration units,
generators, pumps, industrial sweepers/scrubbers, material handling equipment (such as
conveyors), and portable well-drilling equipment. The rated power of these engines can be up to
250 hp (186 kW), and substantial differences in engine duty cycles exist (U.S. EPA, 1995).
Emission Factors--Diesel Engines
Most of the pollutants from IC engines are emitted through the exhaust.
However, some hydrocarbons escape from the crankcase as a result of blow-by (gases that are
vented from the oil pan after they have escaped from the cylinder past the piston rings) and from
the fuel tank and carburetor because of evaporation. Nearly all of the hydrocarbons from diesel
engines enter the atmosphere from the exhaust. Crankcase blow-by is minor because
hydrocarbons are not present during compression of the charge. Evaporative losses are
insignificant in diesel engines due to the low volatility of diesel fuels. In general, evaporative
losses are also negligible in engines using gaseous fuels because these engines receive their fuel
continuously from a pipe rather than via a fuel storage tank and fuel pump (U.S. EPA, 1995).
�����
Available emission factors for PAH from small uncontrolled industrial,
commercial, and institutional diesel-fired IC engines ares shown in Table 4.2-1. Emission
factors for PAH from large stationary diesel engines (so-called “large-bore” engines) are shown
as well (U.S. EPA, 1995). It must be noted that emissions can vary significantly from one engine
to the next depending on its design and duty cycle.
Control measures for large stationary diesel engines to date have been directed
mainly at limiting NO emissions, because NO is the primary pollutant from this group of ICx x
engines. All of these controls are engine control techniques except for the selective catalytic
reduction (SCR) technique, which is a post-combustion control. As such, all of these controls
usually affect the emissions profile for the other pollutants such as PAH as well. The
effectiveness of controls on an particular engine will depend on the specific design of each
engine and the effectiveness of each technique could vary considerably. Other NO controlx
techniques exist and include internal/external exhaust gas recirculation (EGR), combustion
chamber modification, manifold air cooling, and turbocharging. Various other emission
reduction technologies may be applicable to the smaller diesel and gasoline engines. These
technologies are categorized into fuel modifications, engine modifications, and exhaust
after-treatments (U.S. EPA, 1995).
Process Description--Gasoline Engines
The other type of engine, spark ignition, initiates combustion by the spark of an
electrical discharge. The fuel may be mixed with the air in a carburetor, or the fuel can be
injected into the compressed air in the cylinder. All gasoline reciprocating engines are
spark-ignited. Gasoline engines up to 600 hp (447 kW) can be used interchangeably with diesel
IC engines in the same industrial applications described previously. As with diesel engines,
substantial differences in gasoline engine duty cycles exist, and emission profiles may be
expected to differ as well (U.S. EPA, 1995). No emission factors for gasoline-fired stationary IC
Emission factors in lb per million cubic feet, lb/MMCF (kg per million cubic meters, kg/MMm ) of natural gas fired.a 3
Source: Meeks, 1992.
�����
Figure 4.2-2. Gas Turbine Engine Configuration
Source: Flagan and Seinfeld, 1988.
�����
Gas turbines may be classified into three general types: simple open cycle,
regenerative open cycle, and combined cycle. In the simple open cycle, the hot gas discharged
from the turbine is exhausted to the atmosphere. In the regenerative open cycle, the gas
discharged from the turbine is passed through a heat exchanger to preheat the combustion air.
Preheating the air increases the efficiency of the turbine. In the combined cycle, the gas
discharged from the turbine is used as auxiliary heat for a steam cycle. Regenerative-type gas
turbines constitute only a very small fraction of the total gas turbine population. Identical gas
turbines used in the combined cycle and in the simple cycle tend to exhibit the same emissions
profiles. Therefore, usually only emissions from simple cycles are evaluated (Shih et al., 1979).
The same fuels used in reciprocating engines are combusted to drive gas turbines.
The primary fuels used are natural gas and distillate (No. 2) fuel oil, although residual fuel oil is
used in a few applications (U.S. EPA, 1995). The liquid fuel used must be similar in volatility to
diesel fuel to produce droplets that penetrate sufficiently far into the combustion chamber to
ensure efficient combustion even when a pressure atomizer is used (Flagan and Seinfeld, 1988).
Stationary gas turbines are applied in electric power generators, in gas pipeline
pump and compressor drives, and in various process industries. Gas turbines [greater than
3 MW(e)] are used in electrical generation for continuous, peaking, or standby power
(U.S. EPA, 1995). In 1990, the actual gas-fired combustion turbine generating capacity for
electric ultilities was 8,524 MW (NAERC, 1991). The current average size of electricity
generation gas turbines is approximately 31 MW. Turbines are also used in industrial
applications, but information was not available to estimate their installed capacity.
Emission Factors
Emission control technologies for gas turbines have advanced to a point where all
new and most existing units are complying with various levels of specified emission limits.
Today most gas turbines are controlled to meet local, State, and/or Federal regulations. For these
sources, emission factors have become an operational specification rather than a parameter to be
quantified by testing (U.S. EPA, 1995). As with reciprocating engines, the primary pollutant
�����
from gas turbines is NO , and techniques for its control still have ramifications for the emissionsx
profiles of other pollutants such as PAHs. Available PAH emission factors for diesel- and
natural gas-fired gas turbines are listed in Table 4.2-3 (Carnot, 1989; Carnot, 1990;
U.S. EPA, 1995).
Water/steam injection is the most prevalent NO control for co-generation/x
combined cycle gas turbines. The water or steam is injected with the air and fuel into the turbine
combuster in order to lower the peak temperatures, which in turn decreases the thermal NOx
produced. The lower average temperature within the combustor can may produce higher levels
of CO and hydrocarbons as a result of incomplete combustion (U.S. EPA, 1995). SCR systems
can be used also, all existing applications of SCR have been used in conjunction with
water/steam injection controls (U.S. EPA, 1995).
4-123
TABLE 4.2-3. PAH EMISSION FACTORS FOR STATIONARY INTERNAL COMBUSTION ENGINES - GAS TURBINES
SCC Number Emission Source Control Device Pollutant (g/MJ) Rating Reference
Average Emission Factor Emissionin lb/MMBtu Factor
a
2-01-001-01 Electric Generation, Afterburner Anthracene <3.43E-08 E Carnot, 1990Diesel-Fired (<1.47E-08)
Fluorene <2.56E-08 E Carnot, 1990(<1.10E-08)
Phenanthrene <5.87E-08 E Carnot, 1990(<2.52E-08)
2-01-001-01 Electric Generation, Steam or Water Phenanthrene <2.69E-08 E Carnot, 1989Diesel-Fired Injection (<1.15E-08)
2-01-002-01 Electric Generation, Natural Selective Naphthalene <4.9E-05 E U.S. EPA, 1995Gas-Fired Catalytic (<2.10E-05)
Reduction
Emission factors in lb/MMBtu (g/MJ) of heat input.a
�����
SECTION 4.2 REFERENCES
Carnot, Inc. Air Toxics Emissions Inventory Testing at Coolwater Generating StationaryCombustion Turbine No. 42. Prepared for Southern California Edison Company, RosemeadCalifornia for inclusion in Air Toxics Hot Spots Inventory Required under AB-2588. ESR53304-2054. May 1990.
Carnot, Inc. Emissions Inventory Testing at Long Beach Combustion Turbine No. 3. Preparedfor Southern California Edison Company, Rosemead California for inclusion in Air Toxics HotSpots Inventory Required under AB-2588. ESR 53304-2050. May 1989.
Meeks, H.N. “Air Toxics Emissions From Gas-Fired Engines.” Journal of PetroleumTechnology, pp. 840-845. July, 1992.
Flagan, R.C., and J.H. Seinfeld. Fundamentals of Air Pollution Engineering. Prentice-Hall, Inc.,Englewood Cliffs, New Jersey. pp. 280-285. 1988.
North American Electric Reliablity Council (NAERC). Electricity Supply and Demand 1991-2000. Princeton, NJ. p. 34. July, 1991.
Shih, C.C., J.W. Hamersma, D.G. Ackerman, R.G. Beimer, M.L. Kraft, and M.M. Yamada. Emissions Assessment of Conventional Stationary Combustion Systems, Volume II: InternalCombustion Sources. U.S. Environmental Protection Agency, Industrial EnvironmentalResearch Laboratory, Research Triangle Park, North Carolina. EPA-600/7-79-029c. pp. 1-2. February 1979.
U.S. Environmental Protection Agency. Compilation of Air Pollutant Emission Factors.Volume I: Stationary Point and Area Sources. AP-42, Fifth Edition. Office of Air QualityPlanning and Standards, Research Triangle Park, North Carolina. pp. 3.1-1 to 3.4-9. 1995.
�����
4.3 WASTE INCINERATION
4.3.1 Municipal Waste Combustion
Process Description
Municipal waste combustors (MWCs) burn garbage and other nonhazardous solid
waste, commonly called municipal solid waste (MSW). Three main design types of technologies
are used to combust MSW: mass burn, refuse-derived fuel-fired (RDF), and modular
combustors.
Mass Burn Combustors--In mass burn units, the MSW is combusted without any preprocessing
other than removal of items too large to go through the feed system. In a typical mass burn
combustor, refuse is placed on a grate that moves through the combustor. Combustion air in
excess of stoichiometric amounts is supplied both below (underfire air) and above (overfire air)
the grate. Mass burn combustors are usually erected at the site (as opposed to being prefabricated
at another location), and range in size from 50 to 1,000 tons/day (46 to 900 Mg/day) of MSW
throughput per unit. Mass burn combustors can be divided into mass burn/waterwall (MB/WW),
mass burn/rotary waterwall combustor (MB/RC), and mass burn refractory wall (MB/REF)
designs.
MB/WW combustor walls are constructed of metal tubes that contain pressurized
water and recover radiant heat for production of steam and/or electricity. A typical MB/WW
combustor is shown in Figure 4.3.1-1. With the MB/RC, a rotary combustion chamber sits at a
slight angle and rotates at about 10 revolutions per hour, causing the waste to advance and
tumble as it burns. The combustion cylinder consists of alternating water tubes and perforated
steel plates. An MB/RC combustor normally operates at about 50 percent excess air.
Figure 4.3.1-2 illustrates a simplified process flow diagram for a MB/RC. MB/REF designs are
older and typically do not include any heat recovery. One type of MB/REF combustor is shown
in Figure 4.1.3-3.
�����
Figure 4.3.1-1. Typical Mass Burn Waterwall Combustor
Source: U.S. EPA, 1993.
�����
Figure 4.3.1-2. Simplified Process Flow Diagram, Gas Cycle for a Mass Burn/Rotary Waterwall Combustor
Source: U.S. EPA, 1993.
�����
Figure 4.3.1-3. Mass Burn Refractory-Wall Combustor with Grate/Rotary Kiln
Source: U.S. EPA, 1993.
�����
RDF-fired Combustors--RDF combustors burn processed waste that varies from shredded waste
to finely divided fuel suitable for co-firing with pulverized coal. Combustor sizes range from
320 to 1,400 tons/day (290 to 1,300 Mg/day). There are three major types of RDF-fired
combustors: (1) dedicated RDF combustors, which are designed to burn RDF as a primary fuel,
(2) coal/RDF co-fired, and (3) fluidized-bed combustors (FBCs) where waste is combusted on a
turbulent bed of limestone, sand, silica or aluminum. A typical RDF-fired combustor is shown in
Figure 4.3.1-4. Waste processing usually consists of removing noncombustibles and shredding,
which generally raises the heating value and provides a more uniform fuel. The type of RDF
used depends on the boiler design. Most boilers designed to burn RDF use spreader stokers and
fire fluff RDF in a semi-suspension mode.
Modular Combustors--Modular combustors are similar to mass burn combustors in that they burn
waste that has not been pre-processed, but they are typically shop fabricated and generally range
in size from 5 to 140 tons/day (4 to 130 Mg/day) of MSW throughput. One of the most common
types of modular combustors is the starved-air or controlled-air type, which incorporates two
combustion chambers. A process diagram of a typical modular starved-air (MOD/SA)
combustor is presented in Figure 4.3.1-5. Air is supplied to the primary chamber at
sub-stoichiometric levels. The incomplete combustion products (CO and organic compounds)
pass into the secondary combustion chamber, where additional air and fuel are added and
combustion is completed. Another type of design is the modular excess air (MOD/EA)
combustor that consists of two chambers, similar to MOD/SA units, but is functionally like the
mass burn unit in that it uses excess air in the primary chamber.
Emissions of PAH from municipal incinerators are suspected to occur primarily
from incomplete combustion of non-PAH carbonaceous material or high-temperature free radical
mechanisms (WHO, 1988). It is unlikely that PAHs in the refuse feed material persist
throughout the combustion process. It is estimated that PAHs account for less than 1 percent of
the total organic carbon (TOC) in the products of incineration.
& Mass burn waterwall with spray dryer and fabric filter (IWSA,1996); and
& Mass burn waterwall with spray dryer and ESP (IWSA, 1996).
�����
The data obtained from the Integrated Waste Services Association (IWSA) was
used to develop PAH emission factors for MWCs because most of the MWC capacity in the
United States is at facilities of the types described in the data. Seventy percent of the MWC
capacity in the United States is at mass burn facilities (Bevington, et al., 1995). Also, the
majority of MSW is combusted at facilities subject to the MWC MACT, which requires that
spray dryers and ESPs or spray dryers and fabric filters be used as emission controls.
Evaluation of the IWSA data shows that naphthalene was the only PAH detected,
although the 16 PAHs were targeted. The other 15 PAHs were not detected in any sampling run
at any facility. Thus, naphthalene was the only PAH for which an emission factor was
developed. The factors for the facilities equipped with spray dryers and ESPs were not
significantly different in value from the factors for facilities equipped with spray dryers and
fabric filters. Therefore, the factors from both types of facilities were averaged together to obtain
the factor presented in Table 4.3.1-1.
Source Location
As of March 1995, there were roughly 130 MWC plants operating or under
construction in the United States with capacities greater than 40 tons/day (36 Mg/day), with a
total national capacity of approximately 103,300 tons/day (93,909 Mg/day) of MSW. Of the total
MWC capacity in the United States, 70 percent is at mass burn facilities, 25 percent is at RDF
facilities, 4 percent is a modular facilities, and the remaining 1 percent is at other technology
facilities such as co-fired RDF combustors. Ninety-one percent of the MWC facilities
(99 percent of MWC capacity) employ air emission controls of some kind (Bevington et al.,
1995). Table 4.3.1-2 lists the geographical distribution of these MWC units and their statewide
capacities (Bevington et al., 1995).
4-135
TABLE 4.3.1-1. PAH EMISSION FACTORS FOR MUNICIPAL WASTE COMBUSTION SOURCES
SCC Factor in lb/ton Range in lb/ton FactorNumber Emission Source Control Device Pollutant (mg/Mg) (mg/Mg) Rating Reference
Average Emission Emission Factor Emission
a a
5-01-001-05 Mass Burn, Water Spray Dryer and Naphthalene 6.06E-06 4.81E-07 - 1.46E-05 C IWSA, 1996Wall Combustor Fabric Filter, or Spray (3.04) (2.40E-01 - 7.29)
Dryer and ESP
Emission factors are expressed in lb (mg) of pollutant emitted per ton (Mg) of waste incinerated.a
(continued)�����
TABLE 4.3.1-2. SUMMARY OF GEOGRAPHICAL DISTRIBUTIONOF MWC FACILITIESa
State Facilities (Mg/day) StatesNumber of MWC tons/day Capacity in the United
State MWC Capacity in Percentage of Total MWC
AK 2 120 <1(109)
AL 1 690 <1(627)
AR 4 283 <1(257)
CA 3 2,560 2(2,330)
CT 7 6,545 6(5,950)
FL 14 18,248 17(16,589)
GA 1 500 <1(450)
HI 1 2,160 2(1,964)
ID 1 50 <1(45)
IL 1 1,600 1(1,450)
IN 1 2,360 2(2,150)
MA 11 11,003 10(10,003)
MD 4 5,910 5(5,373)
ME 4 2,000 2(1,818)
MI 7 5,225 5(4,750)
TABLE 4.3.1-2. (Continued)
State Facilities (Mg/day) StatesNumber of MWC tons/day Capacity in the United
State MWC Capacity in Percentage of Total MWC
(continued)�����
MN 12 5,102 5(4,638)
MS 1 150 <1(140)
MT 1 72 <1(65)
NC 5 1,324 1(1,204)
NH 3 832 1(756)
NJ 6 5,820 6(5,290)
NY 13 11,545 11(10,496)
OH 6 1,800 2(1,636)
OK 2 1,230 1(1,120)
OR 2 675 1(614)
PA 7 8,702 8(7,911)
SC 2 870 1(791)
TN 2 1,250 1(1,136)
TX 3 195 <1(177)
UT 1 400 <1(360)
TABLE 4.3.1-2. (Continued)
State Facilities (Mg/day) StatesNumber of MWC tons/day Capacity in the United
State MWC Capacity in Percentage of Total MWC
�����
VA 6 6,325 6(5,750)
WA 5 1,500 1(1,360)
WI 4 831 1(755)
List of facilities represents the plants in operation or under construction/modification that are expecteda
to be subject to the MACT standards being developed for MWCs.
Source: Bevington et al., 1995.
�����
SECTION 4.3.1 REFERENCES
AMTest, Inc. U.S. Environmental Protection Agency Toxic Evaluation at Thermal ReductionCompany, Bellingham, Washington. Redmond, Washington. pp. 6, 17. August 28, 1989.
Bevington, D. et al., Radian Corporation. “Municipal Waste Combustor Inventory Database.”Memorandum to Walt Stevenson, U.S. Environmental Protection Agency. May 17, 1995.
Federal Register. December 20, 1989. Emission Guidelines: Municipal Waste Combustors,Proposed Guidelines and Notice of Public Hearing. Volume 54, p. 52209.
Haile, C.L. et al. Assessment of Emissions of Specific Compounds from a Resource RecoveryMunicipal Refuse Incinerator. U.S. Environmental Protection Agency, Office of ToxicSubstances, Washington, DC. EPA Report No. 560/5-84-002. June 1984.
Integrated Waste Services Association (IWSA), Written correspondence from Ms. Maria Zannes,to Mr. Dennis Beauregard, U.S. Environmental Protection Agency. February 16, 1996.
Midwest Research Institute (MRI). Emission Data Base for Municipal Waste Combustors. Prepared for U.S. Environmental Protection Agency, Emissions Standards and EngineeringDivision, Research Triangle Park, North Carolina. p. 7-78. June 1987.
Shih, C. et al. “POM Emissions from Stationary Conventional Combustion Processes, withEmphasis on Polychlorinated Compounds of Dibenzo-p-dioxin (PCDDs), Biphenyl (PCBs), andDibenzofuran (DCDFs).” CCEA Issue Paper presented under EPA Contract No. 68-02-3138. U.S. Environmental Protection Agency, Industrial Environmental Research Laboratory, ResearchTriangle Park, North Carolina. January 1980.
U.S. Environmental Protection Agency. Supplement F to Compilation of Air Pollutant EmissionFactors, Volume I: Stationary Point and Area Sources, Section 2.1. Office of Air QualityPlanning and Standards, Research Triangle Park, North Carolina. July 1993.
U.S. Environmental Protection Agency. Locating and Estimating Air Toxics Emissions FromMunicipal Waste Combustors. Research Triangle Park, North Carolina. EPA-450/2-89-006 pp. 4-15 and 4-18. April 1989.
Yasuda, K., and M. Kaneko. “Basic Research on the Emission of Polycyclic AromaticHydrocarbons Caused by Waste Incineration.” Journal of the Air Pollution Control Association,Volume 39, No. 12, pp. 1557-1561. 1989.
World Health Organization (WHO). Emissions of Heavy Metal and PAH compounds fromMunicipal Solid Waste Incinerators. Control Technology and Health Effects. WHO RegionalOffice for Europe. Copenhagen, Denmark. 1988.
�����
4.3.2 Industrial and Commercial Waste Incineration
Process Description
In addition to municipal waste incinerators, some solid waste is also incinerated in
industrial and commercial facilities. Most individual waste incinerators at these sites are subject
to State and local air quality regulations such that these units have varying degrees of emissions
control. Most are equipped with afterburners, and newer units may have or be required to install
scrubbers or ESPs (Kelly, 1983).
Industrial wastes combusted in incinerators consist primarily of processing wastes
and plant refuse and contain paper, plastic, rubber, textiles, and wood. Because of the variety of
manufacturing operations, waste compositions are highly variable between plants, but may be
fairly consistent within a plant. Industrial waste incinerators are basically the same design as
municipal waste incinerators. Available data indicate that approximately 91 percent of the units
are multichamber designs, 8 percent are single chamber designs, and 1 percent are rotary kiln or
fluidized bed designs. About 1,500 of the estimated 3,800 industrial incinerators are used for
volume reduction, 640 units (largely in the petroleum and chemical industries) are used for
toxicity reduction, and the remaining 1,700 units are used for resource recovery, primarily at
copper wire and electric motor plants (Kelly, 1983).
Commercial waste incinerators are used to reduce the volume of wastes from
large office and living complexes, schools, and commercial facilities. Small multichamber
incinerators are typically used and over 90 percent of the units require firing of an auxiliary fuel.
Emission controls are generally not present on commercial units. The inefficient methods of
combustion used in the majority of commercial waste incinerators make these units potentially
significant POM emission sources (Kelly, 1983).
Polycyclic organic matter emissions from industrial and commercial waste
incineration are a function of waste composition, incinerator design and operating practices, and
incinerator emissions control equipment. Both the incineration of wastes and the combustion of
�����
incinerator auxiliary fuel may be sources of POM emissions. Greater organics and moisture
content in wastes increase potential POM emissions upon incineration. Incinerator design and
operating practices affect waste mixing, residence time in the flame zone, combustion
stoichiometry, and other factors that contribute to POM emissions generation. Incinerator
emission controls affect POM emissions by determining whether particulate matter and gaseous
pollutants are controlled and to what extent. Generally, POM emissions exist in both particulate
and gaseous forms, with available data indicating that often gaseous POM emissions
predominate. Incinerators with emission controls designed primarily for particulate matter
collection may be accomplishing little POM emissions control.
Emission Factors
Available POM emission factor data for commercial waste incineration sources
are given in Table 4.3.2-1 (Hangebrauck et al., 1967). There were no available emission factors
for industrial waste incineration; however, to some extent this category is covered in
Section 4.1.2 of this report which includes the incineration of industrial wood waste.
The test data for commercial waste incinerators in Table 4.3.2-1 indicates that
POM emissions are generally greater from commercial sources than from municipal sources
(disregarding differences for controls). This apparent trend is probably attributable to
commercial units being operated and maintained less efficiently than municipal units, with
emphasis not being given to optimizing combustion conditions and waste destruction. In both of
the commercial unit tests described in the literature, pyrene and fluoranthene were consistently
the predominant POM compounds measured of those analyzed.
(continued)
4-142
TABLE 4.3.2-1. PAH EMISSION FACTORS FOR COMMERCIAL WASTE COMBUSTION SOURCES
SCC Number Emission Source Control Device Pollutant (mg/Mg) Rating
Emission factors are expressed in lb (mg) of pollutant emitted per ton (Mg) of waste incinerated.a
Source: Hangebrauk et al., 1967.
�����
Source Location
No site specific location information is available for commercial and industrial
waste incinerators. Commercial units are generally located in urbanized, metropolitan areas with
large concentrations of people. Locations of industrial waste incinerators parallel those of the
industries that use them for waste disposal. The lumber and wood products industries, the
primary metals industry, and the printing industry are the greatest users of incinerators for waste
disposal. Lumber and wood producers are primarily in the Southeast and Northwest. Primary
metals plants are predominantly in the Midwest, the Mideast, and the Southwest. The printing
industry has an essentially nationwide distribution (Kelly, 1983).
�����
SECTION 4.3.2 REFERENCES
Hangebrauck, R.P. et al. Sources of Polynuclear Hydrocarbons in the Atmosphere. U.S. Department of Health, Education, and Welfare, Public Health Service, Cincinnati, Ohio. Public Health Service Report No. AP-33. pp. 14-18. 1967.
Kelly, M.E. Sources and Emissions of Polycyclic Organic Matter. U.S. EnvironmentalProtection Agency, Research Triangle Park, North Carolina. EPA Report No. 450/5-83-010b. pp. 5-75 to 5-82. 1983.
�����
4.3.3 Sewage Sludge Incineration
Process Description
The first step in the process of sewage sludge incineration is dewatering the
sludge. Sludge is generally dewatered until it is about 15 to 30 percent solids, at which point it
will burn without supplemental fuel. After dewatering, the sludge is sent to the incinerator for
combustion. The two main types of sewage sludge incinerators (SSIs) currently in use are the
multiple-hearth furnace (MHF) and the fluidized-bed combustor (FBC). Over 80 percent of the
identified operating sludge incinerators are MHFs and about 15 percent are FBCs. The
remaining combustors co-fire MSW with sludge (U.S. EPA, 1995).
Multiple Hearth Furnaces (MHFs)--A cross-sectional diagram of a typical MHF is shown in
Figure 4.3.3-1. The basic MHF is a vertically oriented cylinder. The outer shell is constructed of
steel and lined with refractory material and surrounds a series of horizontal refractory hearths. A
hollow cast iron rotating shaft runs through the center of the hearths. Cooling air is introduced
into the shaft, which extends above the hearths. Attached to the central shaft are the rabble arms,
which extend above the hearths. Each rabble arm is equipped with a number of teeth,
approximately 6 inches in length and spaced about 10 inches apart. The teeth are shaped to rake
the sludge in a spiral motion, alternating in direction from the outside in to the inside out
between hearths. Burners, which provide auxiliary heat, are located in the sidewalls of the
hearths.
In most MHFs, partially dewatered sludge is fed onto the perimeter of the top
hearth. The rabble arms move the sludge through the incinerator by raking the sludge toward the
center shaft, where it drops through holes located at the center of the hearth. In the next hearth,
the sludge is raked in the opposite direction. This process is repeated in all of the subsequent
hearths. The effect of the rabble motion is to break up solid material to allow better surface
contact with heat and oxygen. A sludge depth of about 1 inch is maintained in each hearth at the
design sludge flow rate.
�����
Figure 4.3.3-1. Typical Multiple-Hearth Furnace
Source: U.S. EPA, 1995.
�����
Under normal operating conditions, 50 to 100 percent excess air must be added to
an MHF in order to ensure complete combustion of the sludge. Besides enhancing contact
between fuel and oxygen in the furnace, these relatively high rates of excess air are necessary to
compensate for normal variations in both the organic characteristics of the sludge feed and the
rate at which it enters the incinerator. When an inadequate amount of excess air is available,
only partial oxidation of the carbon will occur, with a resultant increase in emissions of CO, soot,
and hydrocarbons. Too much excess air, on the other hand, can cause increased entrainment of
particulate and unnecessarily high auxiliary fuel consumption.
Fluidized-Bed Combustors--Figure 4.3.3-2 shows the cross-section diagram of an FBC.
Fluidized-bed combustors consist of a vertically oriented outer shell constructed of steel and
lined with refractory material. Tuyeres (nozzles designed to deliver blasts of air) are located at
the base of the furnace within a refractory-lined grid. A bed of sand, approximately 2.5 feet
(0.75 meters) thick, rests upon the grid. Two general configurations can be distinguished on the
basis of how the fluidizing air is injected into the furnace. In the hot windbox design, the
combustion air is first preheated by passing it through a heat exchanger, where heat is recovered
from the hot flue gases. Alternatively, ambient air can be injected directly into the furnace from
a cold windbox.
Partially dewatered sludge is fed into the lower portion of the furnace. Air
injected through the tuyeres at a pressure of 3 to 5 pounds per square inch grade (20 to
35 kilopascals) simultaneously fluidizes the bed of hot sand and the incoming sludge.
Temperatures of 1,400 to 1,700(F (750 to 925(C) are maintained in the bed. As the sludge
burns, fine ash particles are carried out the top of the furnace. Some sand is also removed in the
air stream and must be replaced at regular intervals.
Combustion of the sludge occurs in two zones. Within the sand bed itself (the
first zone), evaporation of the water and pyrolysis of the organic materials occur nearly
simultaneously as the temperature of the sludge is rapidly raised. In the freeboard area (the
second zone), the remaining free carbon and combustible gases are burned. The second zone
functions essentially as an afterburner.
�����
Figure 4.3.3-2. Fluidized-Bed Combustor
Source: U.S. EPA, 1995.
�����
Fluidization achieves nearly ideal mixing between the sludge and the combustion
air, and the turbulence facilitates the transfer of heat from the hot sand to the sludge. The most
noticeable impact of the better burning atmosphere provided by an FBC is seen in the limited
amount of excess air required for complete combustion of the sludge. Typically, FBCs can
achieve complete combustion with 20 to 50 percent excess air, about half the excess air required
by MHFs. As a consequence, FBCs have generally lower fuel requirements compared to MHFs.
Emission Control Techniques--Many SSIs have greater variability in their organic emissions than
do other waste incinerators because, on average, sewage sludge has a high moisture content and
that moisture content can vary widely during operation. Failure to achieve complete combustion
of organic materials that evolve from the waste can result in emissions of a variety of organic
compounds, including POM. In general, adequate oxygen, temperature, residence time, and
turbulence will minimize emissions of most organics. The conditions of good combustion
practices (GCP) are summarized as follows: (U.S. EPA, 1995)
& Uniform wastefeed;
& Adequate supply and good air distribution in the incinerator;
& Sufficiently high incinerator gas temperatures (1 >500(F[>815(C]);
& Good mixing of combustion gas and air in all zones;
& Minimization of PM entrainment into the flue gas leaving theincinerator; and
& Temperature control of the gas entering the APCD to 450(F(230(C) or less.
Additional reductions in POM emissions may be achieved by utilizing PM control
devices. The types of existing SSI PM controls range from low-pressure-drop spray towers and
wet cyclones to higher-pressure-drop venturi scrubbers and venturi/impingement tray scrubber
combinations. A few electrostatic precipitators and baghouses are employed, primarily where
sludge is co-fired with MSW. The most widely used PM control device applied to an MHF is the
�����
impingement tray scrubber. Older units use the tray scrubber alone; combination
venturi/impingement tray scrubbers are widely applied to newer MHFs and some FBCs.
Afterburners may be utilized to achieve additional reduction of organic emissions
in MHFs. Utilization of an afterburner provides a second opportunity for unburned hydrocarbons
to be fully combusted. In afterburning, furnace exhaust gases are ducted to a chamber, where
they are mixed with supplemental fuel and air and completely combusted. Additionally, some
incinerators have the flexibility to allow sludge to be fed to a lower hearth, thus allowing the
upper hearth(s) to function essentially as an afterburner.
Emission Factors
The potential exists for many organic compounds to be emitted from SSIs because
of the wide variety of organic compounds in the sludge. Lower molecular weight, volatile PAH
compounds such as naphthalene may be emitted by volatilization of the compound. Higher
weight PAH compounds can result from incomplete combustion of the sludge.
Naphthalene is the most commonly reported PAH from emissions testing at SSIs.
One test study identified naphthalene as having one of the highest concentrations among
semi-volatile compounds in pre-control flue gas. Test data associated with other PAHs are
scarce, but the available data do show some PAH compounds besides naphthalene to be present
in small quantities.
Table 4.3.3-1 provides PAH emission factors for SSIs. The factors presented
cover the two main incinerator types: MHFs and FBCs. The factors for the MHF developed by
Johnson et al. (1990) come from testing conducted at three SSIs in Ontario, Canada, and one in
the United States. Naphthalene is by far the PAH compound emitted in the greatest quantity, and
the FBC units showed the highest naphthalene emission factor among the different incinerator
designs.
(continued)
4-152
TABLE 4.3.3-1. PAH EMISSION FACTORS FOR SEWAGE SLUDGE INCINERATORS
SCC Control Factor in lb/ton Emission Factor Range FactorNumber Emission Source Device Pollutant (mg/Mg) in lb/ton (mg/Mg) Rating Reference
Average Emission Emission
a a
5-01-005-15 Multi-Hearth Wet Scrubber Benz(a)anthracene 1.24E-06 3.61E-08 - 2.40E-06 E Johnson et al.,Furnace (0.62) (0.02 - 1.2) 1990
Benzo(a)pyrene 1.02E-06 5.21E-07 - 2.00E-06 E Johnson et al.,(0.51) (0.26 - 1) 1990
Benzo(b)fluoranthene 1.40E-07 --- E Johnson et al.,(0.07) 1990
Benzo(k)fluoranthene 1.22E-06 1.04E-06 - 1.40E-06 E Johnson et al.,(0.61) (0.52 - 0.7) 1990
Chrysene 1.44E-05 8.62E-06 - 1.98E-05 E Johnson et al.,(7.20) (4.30 - 9.9) 1990
Indeno(1,2,3-cd)pyrene 2.00E-07 4.81E-08 - 3.61E-07 E Johnson et al.,(0.10) (0.02 - 0.18) 1990
Acenaphthene 4.61E-07 4.41E-08 - 8.62E-07 E Johnson et al.,(0.23) (0.02 - 0.43) 1990
Acenapthylene 8.02E-09 3.41E-09 - 1.38E-08 E Johnson, et al.,(4.00E-03) (0.00 - 0.0069) 1990
Anthracene 1.60E-07 2.81E-08 - 2.81E-07 E Johnson et al.,(0.08) (0.01 - 0.14) 1990
Benzo(ghi)perylene 8.02E-08 1.6E-08 - 1.24E-07 E Johnson et al.,(0.04) (0.01 - 0.062) 1990
Fluoranthene 1.24E-04 8.82E-06 - 3.81E-04 E Johnson et al.,(62.00) (4.40 - 190) 1990
Fluorene 8.82E-06 2.81E-06 - 1.80E-05 E Johnson et al.,(4.40) (1.40 - 9) 1990
TABLE 4.3.3-1. (Continued)
SCC Control Factor in lb/ton Emission Factor Range FactorNumber Emission Source Device Pollutant (mg/Mg) in lb/ton (mg/Mg) Rating Reference
Phenanthrene 8.82E-05 3.93E-05 - 1.80E-04 E Johnson et al.,(44.00) (19.60 - 90) 1990
Pyrene 3.61E-06 3.21E-07 - 6.87E-06 E Johnson et al.,(1.80) (0.16 - 3.43) 1990
Benzo(a)fluorene 1.76E-06 6.21E-07 - 2.81E-06 E Johnson et al.,(0.88) (0.31 - 1.4) 1990
Benzo(e)pyrene 9.42E-07 4.41E-07 - 1.44E-06 E Johnson et al.,(0.47) (0.22 - 0.72) 1990
Coronene 8.02E-08 ND - 1.48E-07 E Johnson et al.,(0.04) (ND - 0.074) 1990
Methylanthracenes 1.80E-07 8.02E-09 - 3.41E-07 E Johnson et al.,(0.09) (0.00 - 0.17) 1990
Methylphenanthrenes 7.82E-06 6.49E-05 - 9.02E-06 E Johnson et al.,(3.90) (32.40 - 4.5) 1990
Perylene 6.01E-08 6.01E-09 - 1.34E-07 E Johnson et al.,(0.03) (0.00 - 0.067) 1990
5-01-005-15 Multi-Hearth Cyclone/ Naphthalene 1.94E-03 --- D U.S. EPA, 1995Furnace Venturi (970.00)
5-01-005-15 Multi-Hearth None Naphthalene 1.84E-02 --- E U.S. EPA, 1995Furnace (9,200.00)
5-01-005-15 Fluidized-Bed Venturi/ Naphthalene 1.94E-01 --- E U.S. EPA, 1995Combustor Impingement (97,000.00)
Emission factors are expressed in lb (mg) pollutant emitted per ton (Mg) of dry sludge incinerated.a
“--” means data not available.
�����
Source Location
There are approximately 170 sewage sludge incineration plants in operation in the
United States. Most sludge incinerators are located in the eastern United States, though there are
a significant number on the West Coast. New York has the largest number of facilities with 33.
Pennsylvania and Michigan have the next largest number of facilities with 21 and 19 sites,
respectively (U.S. EPA, 1990).
�����
SECTION 4.3.3 REFERENCES
Gerstle, R. W. “Emissions of Trace Metals and Organic Compounds from Sewage SludgeIncineration.” PEI Associates. Cincinnati, Ohio. For Presentation at the 81st Annual Meeting ofAPCA, Dallas, Texas. June 19-24, 1988.
Johnson, N.D., M.T. Scholtz, V. Cassaday, and K. Davidson. MOE Toxic Chemical EmissionInventory for Ontario and Eastern North America. Prepared for the Air Resources Branch,Ontario Ministry of the Environment, Rexdale, Ontario. Draft Report No. P.89-50-5429/OG. p. 173. March 15, 1990.
U.S. Environmental Protection Agency. Compilation of Air Pollutant Emissions Factors.Volume I: Stationary Point and Area Sources. AP-42, Fifth Edition, Section 2.2: SewageSludge Incineration. U.S. Environmental Protection Agency, Office of Air Quality Planning andStandards, Research Triangle Park, North Carolina. 1995.
U.S. Environmental Protection Agency. Locating and Estimating Air Toxics Emissions fromSewage Sludge Incinerators. Office of Air Quality Standards, Research Triangle Park, NorthCarolina. EPA-450/2-90-009. May 1990.
�����
4.3.4 Medical Waste Incineration
Medical waste incinerators (MWIs) burn wastes produced by hospitals, veterinary
facilities, crematories, and medical research facilities. These wastes include both infectious (“red
bag” and pathological) medical wastes and non-infectious general hospital wastes. The primary
purposes of MWIs are to (1) render the waste innocuous, (2) reduce the volume and mass of the
waste, and (3) provide waste-to-energy conversion. The total population of MWIs is estimated at
5,000, with the following distribution by facility category: 3,150 MWIs or 63 percent at
hospitals, 500 MWIs or 10 percent at laboratories, 550 MWIs or 11.6 percent at veterinary
facilities, 500 MWIs or 10 percent at nursing homes, and 300 MWIs at commercial and other
unidentified facilities (U.S. EPA, 1994).
Process Description
Three main types of incinerators are used as MWIs: controlled-air or starved-air,
excess-air, and rotary kiln. The majority (>95 percent) of incinerators are controlled-air units. A
small percentage (<2 percent) are excess-air, and less than 1 percent were identified as rotary
kiln. The rotary kiln units tend to be larger, and typically are equipped with air pollution control
devices. Approximately 2 percent of all the incinerators identified were equipped with air
pollution control devices (U.S. EPA, 1995).
Controlled-Air Incinerators--As noted above, controlled-air incineration is the most widely used
MWI technology, and now dominates the market for new systems at hospitals and similar
medical facilities. This technology is also known as two-stage incineration or modular
combustion. Figure 4.3.4-1 presents a schematic diagram of a typical controlled-air unit.
Combustion of waste in controlled-air incinerators occurs in two stages. In the
first stage, waste is fed into the primary, or lower, combustion chamber, which is operated with
less than the stoichiometric amount of air required for combustion. Combustion air enters the
primary chamber from beneath the incinerator hearth (below the burning bed of waste). This air
is called primary or underfire air. In the primary (starved-air) chamber, the low air-to-fuel ratio
�����
Figure 4.3.4-1. Controlled-Air Incinerator
Source: U.S. EPA, 1995.
�����
dries and facilitates volatilization of the waste and most of the residual carbon in the ash burns.
At these conditions, combustion gas temperatures are relatively low (1,400 to 1,800(F [760 to
980(C]).
In the second stage, excess air is added to the volatile gases formed in the primary
chamber to complete combustion. Secondary chamber temperatures are higher than primary
chamber temperatures--typically 1,800 to 2,000(F (980 to 1,095(C). Depending on the heating
value and moisture content of the waste, additional heat may be needed. This can be provided by
auxiliary burners located at the entrance to the secondary (upper) chamber to maintain desired
temperatures.
Waste feed capacities for controlled-air incinerators range from about 75 to
6,500 lb/hr (0.6 to 50 kg/min) (at an assumed fuel heating value of 8,500 Btu/lb [19,700 kJ/kg]).
Waste feed and ash removal can be manual or automatic, depending on the unit size and options
purchased. Throughput capacities for lower-heating-value wastes may be higher because feed
capacities are limited by primary chamber heat release rates. Heat release rates for controlled-air
incinerators typically range from about 15,000 to 25,000 Btu/hr-ft (430,000 to3
710,000 Kj/hr-m ).3
Excess-Air Incinerators--Excess-air incinerators are typically small modular units. They are also
referred to as batch incinerators, multiple-chamber incinerators, or “retort” incinerators.
Excess-air incinerators are typically a compact cube with a series of internal chambers and
baffles. Although they can be operated continuously, they are usually operated in a batch mode.
Figure 4.3.4-2 presents a schematic for an excess-air unit. Typically, waste is
manually fed into the combustion chamber. The charging door is then closed and an afterburner
is ignited to bring the secondary chamber to a target temperature (typically 1,600 to 1,800(F
[870 to 980(C]). When the target temperature is reached, the primary chamber burner ignites.
The waste is dried, ignited, and combusted by heat provided by the primary chamber burner, as
well as by radiant heat from the chamber walls. Moisture and volatile components in the waste
are vaporized and pass (along with combustion gases) out of the primary chamber and through a
�����
Figure 4.3.4-2. Excess-Air Incinerator
Source: U.S. EPA, 1995.
�����
flame port that connects the primary chamber to the secondary or mixing chamber. Secondary air
is added through the flame port and is mixed with the volatile components in the secondary
chamber. Burners are also installed in the secondary chamber to maintain adequate temperatures
for combustion of volatile gases. Gases exiting the secondary chamber are directed to the
incinerator stack or to an air pollution control device. After the chamber cools, ash is manually
removed from the primary chamber floor and a new charge of waste can be added.
Incinerators designed to burn general hospital waste operate at excess air levels of
up to 300 percent. If only pathological wastes are combusted, excess air levels near 100 percent
are more common. The lower excess air helps maintain higher chamber temperature when
burning high-moisture waste. Waste feed capacities for excess-air incinerators are usually
500 lb/hr (3.8 kg/min) or less.
Rotary Kiln Incinerators--Rotary kiln incinerators, like the other types, are designed with a
primary chamber, where the waste is heated and volatilized, and a secondary chamber, where
combustion of the volatile fraction is completed. The primary chamber consists of a slightly
inclined, rotating kiln in which waste materials migrate from the feed end to the ash discharge
end. The waste throughput rate is controlled by adjusting the rate of kiln rotation and the angle
of inclination. Combustion air enters the primary chamber through a port. An auxiliary burner is
generally used to start combustion and maintain desired combustion temperatures.
Figure 4.3.4-3 presents a schematic diagram of a typical rotary kiln incinerator.
Volatiles and combustion gases pass from the primary chamber to the secondary chamber. The
secondary chamber operates at excess air. Combustion of the volatiles is completed in the
secondary chamber. Because of the turbulent motion of the waste in the primary chamber, solids
burnout rates and particulate entrainment in the flue gas are higher for rotary kiln incinerators
than for other incinerator designs. As a result, rotary kiln incinerators generally have add-on
gas-cleaning devices.
�����
Figure 4.3.4-3. Rotary Kiln Incinerator
Source: U.S. EPA, 1995.
�����
Emission Control Techniques--Air emissions of organic compounds from MWIs
are controlled primarily by promoting complete combustion through the use of Good
Combustion Practice (GCP). As noted above, only a small percentage of MWIs use air pollution
control devices. The most frequently used devices are wet scrubbers and fabric filters. Fabric
filters mainly provide PM control. Other PM control technologies include venturi scrubbers and
electrostatic precipitators (ESPs). Generally, any of the PM control technologies will have a
beneficial effect in reducing particulate-phase PAH emissions as well.
Emissions of PAHs from MWIs are suspected to result primarily from incomplete
combustion. In general, GCP conditions such as adequate oxygen, temperature, residence time,
and turbulence will minimize emissions of most organics. There are little test data to support any
firm conclusions, but it is likely that advanced incinerators operating under GCPs will have lower
emissions of PAHs than poorly maintained or poorly operated incinerators. There are many
small MWIs that are not operating at maximum efficiency because of the minimal amount of
operator control over these units; these units would be expected to emit higher amounts of PAHs.
Emission Factors
The available PAH emission factors for MWIs are presented in Table 4.3.4-1.
Data for PAHs other than naphthalene were not available. It is expected that other PAHs are also
emitted as part of the combustion process and, as with MWCs, waste composition is a critical
factor in the amount of PAHs emitted.
The naphthalene factors developed by Walker and Cooper (1992), are based on
the operating test data from 17 MWIs. Data from 11 MWI facilities with emission controls and
6 MWI facilities without controls were analyzed. The facilities tested burned red bag waste,
pathological waste, and/or general hospital waste. For this study, red bag waste was defined as
any waste generated in the diagnosis or immunization of human beings or animals; pathological
waste was defined as any human and animal remains, tissues, and cultures; and general hospital
waste was defined as a mixture of red bag waste and municipal waste generated by the hospital.
4-163
TABLE 4.3.4-1. PAH EMISSION FACTORS FOR MEDICAL WASTE INCINERATORS
SCC Number Emission Source Control Device Pollutant (mg/Mg) (mg/Mg) Rating
Average Emission Emission Factor RangeFactor in lb/ton in lb/ton Emission Factor
Emission factors are expressed as lb (mg) of naphthalene emitted per ton (Mg) of medical waste incinerated.a
Source: Walker and Cooper, 1992.
�����
Source Location
There are an estimated 5,000 MWIs in the United States, located at such facilities
as hospitals, pharmaceutical companies, research facilities, nursing homes, and other institutions
and companies that incinerate medical waste (U.S EPA, 1993).
�����
SECTION 4.3.4 REFERENCES
U.S. Environmental Protection Agency. Compilation of Air Pollutant Emission Factors.Volume I: Stationary Point and Area Sources. AP-42, Fifth Edition, Section 2.3: MedicalWaste Incineration. Office of Air Quality Planning and Standards, Research Triangle Park,North Carolina. 1995.
U.S. Environmental Protection Agency. Medical Waste Incinerators - Background Informationfor Proposed Standards and Guidelines: Industry Profile Report for New and Existing Facilities. Office of Air Quality Planning and Standards, Research Triangle Park, North Carolina. EPA-453/R-94-042a. July 1994.
U.S. Environmental Protection Agency. Locating and Estimating Air Toxic Emissions fromSources of Medical Waste Incinerators. Office of Air Quality Planning and Standards, ResearchTriangle Park, North Carolina. EPA-454/R-93-053. October 1993.
Walker, B. L., and C. D. Cooper. “Air Pollution Emission Factors for Medical WasteIncinerators.” Journal of the Air and Waste Management Association, Volume 4f2, No. 6,pp. 784-791. 1992.
�����
4.3.5 Hazardous Waste Incineration
Hazardous waste, as defined by the Resource Conservation and Recovery Act
(RCRA) in 40 CFR Part 261, includes a wide variety of waste materials. Hazardous wastes are
produced in the form of liquids (e.g., waste oils, halogenated and nonhalogenated solvents, other
organic liquids, and pesticides/herbicides) and sludges and solids (e.g., halogenated and
nonhalogenated sludges and solids, dye and paint sludges, resins, and latex). Based on a 1986
study, total annual hazardous waste generation in the United States was approximately
292 million tons (265 million metric tons) (Oppelt, 1987). Only a small fraction of the waste
(<1 percent) was incinerated.
Based on an EPA study conducted in 1983, the major types of hazardous waste
streams incinerated were spent nonhalogenated solvents and corrosive and reactive wastes
contaminated with organics. Together, these accounted for 44 percent of the waste incinerated.
Other prominent wastes included hydrocyanic acid, acrylonitrile bottoms, and nonlisted ignitable
wastes.
Industrial kilns, boilers, and furnaces also burn hazardous wastes as fuel to
produce commercially viable products such as cement, lime, iron, asphalt, or steam. These
industrial sources require large inputs of fuel to produce the desired product. Hazardous waste,
which is considered an economical alternative to fossil fuels for energy and heat, is utilized as a
supplemental fuel. In the process of producing energy and heat, the hazardous wastes are
subjected to high temperatures for a sufficient time to destroy the hazardous content and the bulk
of the waste. The sections of this document describing Portland Cement Kilns, the Pulp and
Paper Industry, and Waste Oil Incineration include discussions of POM emissions from these
sources.
Process Description
Hazardous waste incineration is a process that employs thermal decomposition via
thermal oxidation at high temperatures (usually 1,650(F [900(C] or greater) to destroy the
�����
organic fraction of the waste and reduce volume. A diagram of the typical process component
options in a hazardous waste incineration facility is provided in Figure 4.3.5-1. The diagram
shows the major subsystems that may be incorporated into a hazardous waste incineration
system: (1) waste preparation and feeding, (2) combustion chamber(s), (3) air pollution control,
and (4) residue/ash handling.
Five types of hazardous waste incinerators are currently available and in
5-03-005-01 Liquid Injection Scrubber/ Benz(a)anthracene 6.01E-06 E Johnson et al., 1990Incinerator for Baghouse (3.00)Mixed LiquidIndustrial Waste,Dual-Chamber Design
Benzo(a)pyrene 2.00E-06 E Johnson et al., 1990(1.00)
Benzofluoranthenes 5.01E-06 E Johnson et al., 1990(2.50)
Chrysene/Triphenylene 1.10E-05 E Johnson et al., 1990(5.50)
Dibenz(a,h)anthracene 1.20E-06 E Johnson et al., 1990(0.60)
Indeno(1,2,3-cd)pyrene 3.81E-06 E Johnson et al., 1990(1.90)
Acenaphthene 7.21E-06 E Johnson et al., 1990(3.60)
Benzo(ghi)perylene 4.21E-06 E Johnson et al., 1990(2.10)
Anthracene 1.16E-05 E Johnson et al., 1990(5.80)
Fluoranthene 4.97E-05 E Johnson et al., 1990(24.80)
Fluorene 1.34E-05 E Johnson et al., 1990(6.70)
Phenanthrene 1.01E-04 E Johnson et al., 1990(50.20)
Emission factors are expressed as lb (mg) of pollutant per ton (Mg) of waste incinerated, except where otherwise indicated.a
�����
SECTION 4.3.5 REFERENCES
Johnson, N.D., M.T. Scholtz, V. Cassaday, and K. Davidson. MOE Toxic Chemical EmissionInventory for Ontario and Eastern North America. Prepared for the Air Resources Branch,Ontario Ministry of the Environment, Rexdale, Ontario. Draft Report No. P.89-50-5429/OG. p. 151. 1990.
Oppelt, E.T. “Incineration of Hazardous Waste - A Critical Review.” Journal of Air PollutionControl Association, Volume 37, Number 5, pp. 558-586. 1987.
Trenholm, A., P. Gorman, B. Smith, and D.A. Oberacker. Emission Test Results for aHazardous Waste Incineration RIA. U.S. Environmental Protection Agency. EPA-600/9-84-015. 1984.
U.S. Environmental Protection Agency. Permit Writer’s Guide to Test Burn Data - HazardousWaste Incineration. Office of Research and Development, Washington, DC. EPA-625/6-86-012. 1986.
Whitworth, W.E., L.E. Waterland. Pilot-Scale Incineration of PCB-Contaminated Sedimentsfrom the Hot Spot of the New Bedford Harbor Superfund Site. Acurex Corporation. Jefferson,Arkansas. 1992.
�����
4.3.6 Drum and Barrel Reclamation
Process Description
POM emissions have been detected in the stack gases from drum reclamation
facilities. These facilities typically consist of a furnace that is used to heat the drums to an
elevated temperature in order to destroy any residual materials in the containers. The drums are
then repaired, repainted, relined, and sold for reuse.
The drums processed at these facilities come from a variety of sources, such as the
petroleum and chemical industries, and sometimes contain residual waste that is classified as
hazardous according to the EPA’s Resource Conservation and Recovery Act (RCRA) guidelines.
The furnaces are fired by an auxiliary fuel such as oil or natural gas. The used
drums are typically loaded onto a conveyor, which carries them through the heat treatment zone.
As the drums proceed through this process, any residual contents, paint, and interior linings are
burned off or disintegrated. POM formation can occur from either the heat treatment of the
barrels or from the combustion of the auxiliary fuel.
Emission Factors
Only one test report (Galson Corporation, 1992) was found that measured
emissions of specific PAH compounds from a drum reclamation facility. The facility tested
recycles 55-gallon drums. There was no indication as to the physical or chemical characteristics
of the residual waste in the drums, or of the auxiliary fuel type used to fire the furnace. The drum
furnace consists of a boiler with a 10,200 Btu/hr capacity in conjunction with a 8,256,000 Btu/hr
boiler and an afterburner that serves as an emissions control device. Table 4.3.6-1 shows PAH
emission factors developed for this facility.
4-179
TABLE 4.3.6-1. PAH EMISSION FACTORS FOR DRUM AND BARREL RECLAMATION
SCC Number Emission Source Control Device Pollutant (mg/1000 barrels) Rating
Average Emission Factorin lb/1000 barrels Emission Factor
Emission factors are expressed in lb (mg) of pollutant emitted per thousand 55-gallon barrels processed.a
Compound also detected in field blank; emission rate not adjusted for field blank detection.b
Source: Galson Corporation, 1992.
�����
The emission factors for drum reclamation should be used cautiously because the
nature of the residual waste product can vary greatly from facility to facility, which will likely
affect PAH emissions. The type of auxiliary fuel used can also have a significant effect on PAH
emissions from these facilities.
Source Location
Approximately 2.8 to 6.4 million 55-gallon drums are incinerated annually in the
U.S. (U.S. EPA, 1994). This estimate is based on the assumptions that there are 23 to
26 incinerators currently in operation, each incinerator handles 500 to 1,000 drums per day, and
each incinerator operates 5 days a week with 14 days down time for maintenance.
�����
SECTION 4.3.6 REFERENCES
Galson Corporation. Source Emission Test Results for Drum Furnace/Afterburner. GalsonTechnical Services, Berkeley, California. Galson Project #SE-280. 1992.
U.S. Environmental Protection Agency. Estimating Exposures to Dioxin-Like Compounds,Volume II: Properties, Sources, Occurrence, and Background Exposures. External ReviewDraft. EPA-600/6-88-005Cb. Office of Health and Environmental Assessment, Washington,DC. 1994.
�����
4.3.7 Scrap Tire Incineration
Most facilities that burn tires use the tires to supplement a primary fuel, such as
wood. This section, however, addresses those facilities that burn scrap tires as the only fuel. The
primary purpose of these facilities is to recover energy from the combustion of scrap tires.
Process Description
The following process description is based on the operations at the Modesto
Energy Facility in Westley, California, which is a dedicated tire-to-energy facility. This process
should be applicable to most of these types of facilities because the technology is licensed to one
company in the United States.
The Modesto facility consists of two whole-tire boilers that generate steam from
the combustion of the scrap tires. Tires from a nearby supply pile are fed into a hopper located
adjacent to the pile. Tires are then fed into the boilers at a rate of 350 to 400 tires per hour for
each boiler. The boilers can accommodate tires as large as 4 feet in diameter made of rubber,
fiberglass, polyester, and nylon.
The tires are burned on large reciprocating stoker grates in the combustion
chamber at the bottom of the boilers. The grate configuration allows air flow above and below
the tires, which aids in complete combustion. The boilers are operated above 2,000(F (1,093(C)
to ensure complete combustion of organic compounds emitted by the burning tires. The heat
generated by the burning of the tires causes the water contained in the pipes of the refractory
brickwork that lines the boiler to turn into steam. The high-pressure steam is then forced through
a turbine for the generation of power.
Three air pollution control techniques are used at the Modesto facility to control
NO , PM, and SO . The PM control device, a fabric filter, likely has the most significant impactx x
on particulate POM emissions. After exiting the boiler chamber and the NO control system,x
exhaust gases pass through the large fabric filter.
�����
Emission Factors
PAHs have been measured in the post-control exhaust gas at the Modesto facility.
Emission factors developed from these data are provided in Table 4.3.7-1. These factors were
generated assuming a heating value of 300,000 Btu per tire. Emission data from other
tire-to-energy facilities were not available; however, facilities that use similar technology would
be expected to have PAH emissions in the same of order of magnitude as the Modesto facility.
Source Location
The EPA’s Office of Solid Waste has estimated that approximately 25.9 million
scrap tires were incinerated in the United States in 1990 (U.S. EPA, 1992). This equates to
approximately 10.7 percent of the 242 million scrap tires that were generated in 1990. The use of
scrap tires as fuel increased significantly during the late 1980s, and is expected to continue to
increase (U.S. EPA, 1992).
In December 1991, there were two operational, dedicated tire-to-energy facilities
in the United States: the Modesto Energy Project in Westley, California, and the Exter Energy
Company in Sterling, Connecticut. The Erie Energy Project, which was still in the planning
stages when this document was written, was to be located at Lackawanna, New York. The total
capacity for all three plants combined could approach almost 25 million tires per year
(4.5 million at the Modesto plant, and 10 million each at the Exter and Erie plants) (U.S. EPA,
1991).
4-184
TABLE 4.3.7-1. PAH EMISSION FACTORS FOR SCRAP TIRE BURNING
SCC Number Emission Source Control Device Pollutant (g/million tires) Rating
Average Emission Factorin lb/million tires Emission Factor
Emission factors are expressed in lb (g) of pollutant emitted per million scrap tires incinerated.a
Source: U.S. EPA, 1991.
�����
SECTION 4.3.7 REFERENCES
U.S. Environmental Protection Agency. Summary of Markets for Scrap Tires. Office of SolidWaste, Washington, DC. EPA/530-SW-90-074B. 1992.
U.S. Environmental Protection Agency. Burning Tires for Fuel and Tire Pyrolysis: AirImplications. Office of Air Quality Planning and Standards, Research Triangle Park, NorthCarolina. EPA-450/3-91-024. pp. 3-1 to 3-21. 1991.
�����
4.3.8 Landfill Waste Gas Flares
Process Description
A municipal solid waste (MSW) landfill unit is a discrete area of land or an
excavation that receives household waste. An MSW landfill unit may also receive other types of
wastes, such as commercial solid waste, nonhazardous sludge, and industrial solid waste
(U.S. EPA, 1995). POM emissions from MSW landfills are expected to originate from the
flaring of waste gas that evolves from the landfill. Waste gas evolves from the biodegradation
process, vaporization, and chemical reactions at the landfill, and at some sites it is collected
through a piping network and then burned at the top of vent pipes.
Landfill gas collection systems are either active or passive systems. Active
collection systems provide a pressure gradient in order to extract landfill gas by use of
mechanical blowers or compressors. Passive systems allow the natural pressure gradient created
by the increase in landfill pressure from landfill gas generation to mobilize the gas for collection.
Landfill gas control and treatment options include (1) combustion of the landfill
gas, and (2) purification of the landfill gas. Combustion practices producing POM emissions
include techniques that do not recover energy (e.g., flares and thermal incinerators) and
techniques that do recover energy and generate electricity from the combustion of the landfill gas
(e.g., gas turbines and internal combustion engines). Boilers can also be employed to recover
energy from landfill gas in the form of steam (U.S. EPA, 1995). The formation of POM from
boilers, internal combustion engines and turbines are discussed in Sections 4.1.2, 4.2.1, and
4.2.2, respectively, of this report.
Flares involve an open combustion process that requires oxygen for combustion;
the flares themselves can be open or enclosed. Thermal incinerators heat an organic chemical to
a high enough temperature in the presence of sufficient oxygen to oxidize the chemical to CO2
and water. Purification techniques can also be used to process raw landfill gas to pipeline quality
natural gas by using adsorption, absorption, and membranes (U.S. EPA, 1994).
�����
Emission Factors
PAH emission factors for a landfill flare are presented in Table 4.3.8-1. The
factors are based on a test conducted for a burner rated at 31 MMBtu/hr (Gj/hr). Combustion air
is drawn into the base of the flare through dampered openings. Landfill gas is fed to the burner
just above the dampered openings and combustion takes place inside the refractory lined flare.
Test samples were taken from the flare exhaust. Emission factors were derived from the test
samples based on the heat input of the waste gas (U.S. EPA, 1994).
Emission factors are expressed in lb (g) of pollutant emitted per MMBtu (kj) of heat input into the burner.a
Source: U.S. EPA, 1994.
�����
SECTION 4.3.8 REFERENCES
U.S. Environmental Protection Agency. Compilation of Air Pollutant Emissions Factors.Volume I: Stationary Point and Area Sources. AP-42, Fifth Edition, Section 2.4: Landfills. U.S. Environmental Protection Agency, Office of Air Quality Planning and Standards, ResearchTriangle Park, North Carolina. 1995.
U.S. Environmental Protection Agency. Factor Information Retrieval (FIRE) System Database,“Compliance Testing for Non-Criteria Pollutants at a Landfill Flare. November 1990. (Confidential Report No. ERC-2).” Record Reference 1097, Version 2.62. 1994.
�����
4.4 METAL INDUSTRY
4.4.1 Primary Aluminum Production
Process Description
All primary aluminum in the United States is produced by the Hall-Heroult
process of electrolytic reduction of alumina. The general procedures for primary aluminum
reduction are illustrated in Figure 4.4.1-1 (U.S. EPA, 1979). Aluminum reduction is carried out
in shallow rectangular cells (pots) made of carbon-lined steel, with carbon blocks suspended
above and extending down into the pot. The pots and carbon blocks serve as cathodes and
anodes, respectively, for the electrolytical process (U.S. EPA, 1979; Siebert et al., 1978;
Wallingford and Hee, 1985).
Cryolite (Na AlF ), a double fluoride salt of sodium and aluminum, serves as an3 6
electrolyte and a solvent for alumina. Alumina is added to and dissolves in the molten cryolite
bath. The cells are heated and operated between 1,742 to 1,832(F (950 to 1,000(C) with heat
that results from resistance between the electrodes. During the reduction process, the aluminum
is deposited at the cathode where, because of its heavier weight (2.3 g/cm versus 2.1 g/cm for3 3
cryolite), it remains as a molten metal layer underneath the cryolite. The cryolite bath thus also
protects the aluminum from the atmosphere. The byproduct oxygen migrates to and combines
with the consumable carbon anode to form CO and CO, which continually evolve from the cell. 2
The basic reaction of the reduction process is (U.S. EPA, 1979):
Al O + 1.5C ---> 2Al + 1.5CO2 3 2
Alumina and cryolite are periodically added to the bath to replenish material that
is removed or consumed in normal operation. The weight ratio of sodium fluoride (NaF) to
aluminum fluoride (AlF ) in cryolite is 1.5. Fluorspar (calcium fluoride) may also be added to3
lower the bath’s melting point. Periodically, the molten aluminum is siphoned or tapped from
beneath the cryolite bath, moved in the molten state to holding furnaces in the casting area, and
�����
Figure 4.4.1-1. General Flow Diagram for Primary Aluminum Reduction
Source: U.S. EPA, 1979.
�����
fluxed to remove trace impurities. The product aluminum is later tapped from the holding
furnaces and cast into ingots or billets to await further processing or it is shipped as molten in
insulated ladles (U.S. EPA, 1979).
The process of primary aluminum reduction is essentially one of materials
handling. The true difference in the various process modifications used by the industry lies in the
type of reduction cell used. Three types of reduction cells or pots are used in the United States:
Emission factors are in lb (kg) of pollutant emitted per ton (Mg) of paste produced.a
Factor rating of “U” is not indicative of poor data, but reflects the fact that source test reports were not available for extensive review prior to L&Eb
publication.
Source: AmTest Air Quality, Inc., 1994b; Entropy, Inc., 1994.
Emission factors are in lb (kg) of pollutant emitted per ton (Mg) of aluminum produced.a
Factor rating of “U” is not indicative of poor data, but reflects the fact that source test reports were notaavailable for extensive review prior to L&Eb
publication.
Source: Clement International Corporation, 1992; AmTest Air Quality, Inc., 1994a.“---” means no data available.
Emission factors are in lb (kg) of pollutant emitted per ton (Mg) of aluminum produced.a
Factor rating of “U” is not indicative of poor data, but reflects the fact that source test reports were not available for extensive review prior to L&Eb
publication.
Source: Entropy, Inc., 1994.
(continued)
4-208
TABLE 4.4.1-6. PAH EMISSION FACTORS FOR PRIMARY ALUMINUM PRODUCTION:VERTICAL-STUD SODERBERG CELLS, WET SCRUBBER WITH DRY SCRUBBER CONTROLLED
SCC Number Emission Source Control Device Pollutant (kg/Mg) Rating
Emission factors are in lb (kg) of pollutant emitted per ton (Mg) of aluminum produced.a
Factor rating of “U” is not indicative of poor data, but reflects the fact that source test reports were not available for extensive review prior to L&Eb
publication.
Source: Entropy, Inc., 1994.
(continued)
4-210
TABLE 4.4.1-7. PAH EMISSION FACTORS FOR PRIMARY ALUMINUM PRODUCTION: POTROOMS
SCC Number Emission Source Control Device Pollutant lb/ton (kg/Mg) RatingAverage Emission Factor in Emission Factor
Emission factors are in lb (kg) of pollutant emitted per ton (Mg) of aluminum produced.a
Factor rating of “U” is not indicative of poor data, but reflects the fact that source test reports were not available for extensive review prior to L&Eb
publication.
Source: AmTest Air Quality, Inc., 1994a; 1994b; 1994c.
Emission factors are in lb (kg) of pollutant emitted per ton (Mg) of aluminum produced.a
Factor rating of “U” is not indicative of poor data, but reflects the fact that source test reports were not available for extensive review prior to L&Eb
publication.
Source: Entropy, Inc., 1994.
�����
(Johnson et al., 1990). The emission factor data came from a 1986 study of solid adsorber
collection devices (Houle, 1986). The tested process was controlled with dry scrubbers. These
data and those from the proposed MACT rule are presented in Table 4.4.1-10.
The MACT emission factors for two anode bake furnaces controlled by dry
alumina scrubbers are presented in Table 4.4.1-11. Emissions from prebake cell preparation
were not quantified.
Total PAH emission factors (the reference does not present individual PAH
species or indicate exactly which PAH species are included in “total PAH”) from horizontal and
vertical Soderberg reduction cells at a primary aluminum smelter were reported in a Swedish test
report (Alfheim and Wikstrom, 1984). Total PAH emissions from the vertical Soderberg process
(from pot gas dry scrubber and building ventilation) were 1.54 lb/ton (0.7 kg/ton), as opposed to
9.68 lb/ton (4.4 kg/ton) from the horizontal Soderberg process. The PAH emissions of the
horizontal Soderberg process exhibited a higher fraction in the particulate phase than in the vapor
phase. Conversely, PAH emissions from the vertical Soderberg process were predominantly in
vapor form (Alfheim and Wikstrom, 1984).
Emission factors for the pouring, cooling, and shakeout of aluminum castings
were reported (Gressel et al., 1988). A pilot test plant was engineered to quantify emissions of
aerosol and gaseous PAHs from the green sand and evaporative casting (EPC) process. Emission
factors for both processes are presented in Table 4.4.1-12.
Source Locations
As of December 1992, there were 23 primary aluminum reduction plants in the
United States operated by 13 different companies. Washington State has seven
plants, the most of any state in the country. A complete list of all 23 facilities is given in
Emission factors are in lb (kg) pollutant emitted per ton (Mg) of aluminum produced.a
Factor rating of “U” is not indicative of poor data, but reflects the fact that source test reports were not available for extensive review prior to L&Eb
publication.
Source: Johnson et al., 1990; AmTest Air Quality, Inc., 1994c; AmTest Air Quality, Inc., 1994b.
Emission factors are in lb (kg) pollutant emitted per ton (Mg) of anode produced.a
Factor rating of “U” is not indicative of poor date, but reflects the fact that source test reports were not available for extensive review prior to L&Eb
publication.Source: AmTest Air Quality, Inc., 1994b; 1994c.
(continued)
4-221
TABLE 4.4.1-12. PAH EMISSION FACTORS FOR PRIMARY ALUMINUMPRODUCTION: CASTING OPERATIONSa
SCC Number Emission Source Control Device Pollutant (kg/Mg) Rating
SCC Number Emission Source Control Device Pollutant (kg/Mg) Rating
Average EmissionFactor in lb/ton Emission Factor
b
4-222
3-03-001-99 Green Sand Casting None Anthracene 3.20E-04 EOperation (1.60E-04)
Fluorene 4.60E-04 E(2.30E-04)
Naphthalene 1.14E-02 E(5.70E-03)
Emissions from pouring, cooling, and shakeout of aluminum castings.a
Emission factors are in lb (kg) of pollutant emitted per ton (Mg) of aluminum cast.b
Evaporative pattern casting process (lost foam process).c
Source: Gressel et al., 1988.
�����
TABLE 4.4.1-13. PRIMARY ALUMINUM PRODUCTION FACILITIESIN THE UNITED STATES IN 1992
Facility Location
Alcan Aluminum Corporation Sebree, KY
Alumax, Inc. Mount Holly, SCFrederick, MDFerndale, WA
Aluminum Company of America Alcoa, TNBadin, NCEvansville, INMassena, NYRockdale, TXWenatchee, WA
Columbia Aluminum Corporation Goldendale, WA
Columbia Falls Aluminum Company Columbia Falls, MT
Kaiser Aluminum and Chemical Corporation Mead, WATacoma, WA
National-Southwire Aluminum Company Hawesville, KY
Noranda Aluminum, Inc. New Madrid, MO
Northwest Aluminum Corporation The Dalles, OR
Ormet Corporation Hannibal, OH
Ravenswood Aluminum Corporation Ravenswood, WV
Reynolds Metals Company Longview, WAMassena, NYTroutdale, OR
Vanalco Inc. Vancouver, WA
NOTE: This list is subject to change as market conditions and facility ownership changes, plants areclosed down, etc. The reader should verify the existence of specific facilities by consulting currentlists and/or the plants themselves. The level of POM emissions from any given facility is afunction of variables such as capacity, throughput, and control measures, and should bedetermined through direct contacts with plant personnel.
Source: Plunkert and Sehnke, 1993.
�����
SECTION 4.4.1 REFERENCES
Alfheim, I., and L. Wikstrom. “Air Pollution from Aluminum Smelting Plants 1. The Emissionof Polycyclic Aromatic Hydrocarbons and of Mutagens from an Aluminum Smelting Plant Usingthe Soderberg Process.” Toxicological and Environmental Chemistry 8(1):55-72. 1984.
AmTest Air Quality, Inc. “Kaiser Aluminum and Chemical Corporation Method 5/POM and13B Testing: March 1-8, 1994, Tacoma, Washington.” Prepared for Kaiser Aluminum andChemical Corporation, Tacoma, Washington. pp 1-47. 1994a.
AmTest Air Quality, Inc. “Kaiser Aluminum and Chemical Corporation Method 5/POM and13B Testing: March 15-24, 1994, Mead, Washington.” Prepared for Kaiser Aluminum andChemical Corporation, Mead, Washington. pp 1-99. 1994b.
AmTest Air Quality, Inc. “Noranda Aluminum, Inc. Method 5/POM and 13B Testing: September 14-20, 1994, New Madrid, Missouri.” Prepared for Noranda Aluminum, Inc, NewMadrid, Missouri. pp. 1-62. 1994c.
AmTest Air Quality, Inc. “Washington Department and Kaiser Aluminum and ChemicalCorporation Method 5/POM and 13B Testing: May 2-5 1994, Mead, Washington.” Prepared forKaiser Aluminum and Chemical Corporation, Mead, Washington. pp. 1-33. 1994d.
Clement International Corporation. Draft Health Risk Assessment: Kaiser Aluminum Smelter,Tacoma, Washington. Prepared for Kaiser Aluminum and Chemical Company, Tacoma,Washington. pp. 2-1 to 2-10 and 4-1 to 4-19. 1992.
Entropy, Inc. “Emissions Measurement Test Report: Northwest Aluminum Facility.” Preparedfor Northwest Aluminum Corporation, The Dalles, Oregon. p. 77. 1994.
Gressel, M.G., D.M. O’Brien, and R.D. Tenaglia. “Emissions from the Evaporative CastingProcess.” Appl. Ind. Hyg., Volume 3, No. 1, pp. 11-17. 1988.
Houle, G. “Emissions des Hydrocarbures Polycyclic Aromatiques Provenant de L”Aluminercede la Compagnie Secal a Jonquiere.” Ministere de L’Environment, Directionde L’Assainissement de L’Air. 1986.
International Agency for Research on Cancer (IARC). IARC Monographs on the Evaluation ofCarcinogenic Risk of Chemicals to Humans. Volume 34: Polynuclear Aromatic Compounds,Part 3. Industrial Exposures in Aluminum Production, Coal Gasification, Coke Production, Ironand Steel Founding. International Agency for Research on Cancer. p. 40. 1984.
Johnson, N.D., M.T. Scholtz, V. Cassaday, and K. Davidson. MOE Toxic Chemical EmissionInventory for Ontario and Eastern North America. Prepared for the Air Resources Branch,Ontario Ministry of the Environment, Rexdale, Ontario. Draft Report No. P.89-50-5429/OG. p. 80. 1990.
�����
Plunkert, P.A., and E.D. Sehnke. “Aluminum, Bauxite, and Alumina.” In: Minerals Yearbook,1992. U.S. Bureau of Mines, Washington, DC. p. 21. 1993.
Siebert, P.C. et al. Preliminary Assessment of the Sources, Control and Population Exposure toAirborne Polycyclic Organic Matter (POM) as Indicated by Benzo(a)pyrene (BaP). Prepared forU.S. Environmental Protection Agency, Pollutant Strategies Branch, Office of Air QualityPlanning and Standards, Research Triangle Park, North Carolina. EPA ContractNo. 68-02-2836. pp. 82-85. 1978.
State of Washington. Source Test Report: 85-14, Kaiser Aluminum and Chemical Corporation,Tacoma, Washington, Potline No. 4, Emissions of Organic Aromatic Compounds. Departmentof Ecology, Washington. 18 pp. 1985.
Strieter, R.P., The Aluminum Association, Letter to D. Beauregard, U.S. EnvironmentalProtection Agency. January 15, 1996.
U.S. Environmental Protection Agency. Primary Aluminum Draft Guidelines for Control ofFluoride Emissions from Existing Primary Aluminum Plants. Office of Air Quality Planning andStandards, Research Triangle Park, North Carolina. EPA Report No. 450/2-78-049a. 1979.
Wallingford, K.M., and S.S. Que Hee. “Occupational Exposure to Benzo(e)pyrene.” In: Polynuclear Aromatic Hydrocarbons: Mechanisms, Methods, and Metabolism, Proceedings ofthe Eighth International Symposium on Polynuclear Aromatic Hydrocarbons, Columbus, Ohio,1983. M. Cooke and A.J. Dennis, eds. Battelle Press, Columbus, Ohio. 1985.
�����
4.4.2 Sintering in the Iron and Steel Industry
Process Description
In the iron and steel industry, the sintering process converts materials such as fine
iron ore concentrates, blast furnace flue dust, mill scale, turnings, coke fines, and limestone fines
into an agglomerated product that is suitable for use as blast furnace feed material. Sintering is
necessary to prevent fine iron ore material (whether in natural or concentrated ores) from being
blown out of the top of a blast furnace (Kelly, 1983; U.S. EPA, 1981). A typical sintering
operation is illustrated in Figure 4.4.2-1.
Sintering begins with mixing iron-bearing materials with coke or coal fines,
limestone fines (a flux material), water, and other recycled dusts (e.g., blast furnace flue dust) to
obtain the desired sinter feed composition. The prepared feed is distributed evenly onto one end
of a continuous traveling grate or strand. After the feed has been deposited on the strand, the
coke on the mixture is ignited by a gas- or oil-fired furnace. After the coke has been ignited, the
traveling strand passes over windboxes, where an induced downdraft maintains combustion in
the sinter bed. This combustion creates sufficient temperatures (2,400 to 2,700(F [1,300 to
1,500(C]) to fuse the metal particles into a porous clinker that can be used as blast furnace feed
(Kelly, 1983; U.S. EPA, 1981). Approximately 2.5 tons of raw materials, including water and
fuel, are required to produce one ton of product sinter (U.S. EPA, 1995).
After the sintering process is completed, the sintered material is discharged from
the sinter strand into a crushing operation. Following crushing, the broken sinter falls onto sizing
screens, where undersize material is collected and recycled to the start of the sintering process.
The oversize sinter clinker is then sent to a cooling process. The most common types of sinter
coolers include circular or straight-line moving beds, quiescent beds, or shafts. Air or water is
used as the cooling medium in these coolers, with air being prevalent in newer plants and water
being dominant in older plants. The cooled sinter is either sent directly to a blast furnace, sent to
storage, or screened again prior to blast furnace usage to obtain a more precise size specification
(Kelly, 1983; U.S. EPA, 1981).
�����
Figure 4.4.2-1. Configuration of a Typical Sintering Facility
Source: U.S. EPA , 1977.
�����
POM emissions originate in the sintering process from the burning of coke and
potentially oily materials in the sinter feed. POM emissions may be released from the sinter
machine windbox, the sinter machine discharge point, and the sinter product processing
operations (i.e., crushing, screening, and cooling). Because of the high temperatures used in
sintering operations, it is probable that sinter plant POM emissions are in both gaseous and
particulate forms (Kelly, 1983; Siebert et al., 1978).
Emissions control at sintering facilities typically involves emissions collection
and conveyance to a standard particulate control device such as a baghouse, ESP, or wet
scrubber. If substantial quantities of POM emissions are in gaseous form, wet scrubbers would
likely be most efficient in reducing total POM because gaseous compounds would be condensed
in the scrubber (Kelly, 1983; U.S. EPA, 1981; U.S. EPA, 1977; Siebert et al., 1978).
Emission Factors
Emission factor data for PAHs from sintering operations were not available at the
time this report was prepared. The only available information reported an emission factor for
benzo(a)pyrene (BaP) in the range of 1.2 x 10 to 2.2 x 10 lb/ton (600 µg/Mg to 1.1 g/Mg) of6 -3
sinter feed processed. The precise source of the emissions (windbox, discharge point, etc.) and
the control status of the source are not defined in the literature. Available data did not indicate
whether the range of emission factors represented only particulate BaP or particulate and gaseous
BaP emissions (Siebert et al., 1978). Therefore, this emission factor should be applied with
caution, recognizing the uncertainty in its development and low confidence in its quality.
Source Locations
Iron and steel sintering facilities are located in conjunction with the operation of
iron and steel blast furnaces. According to EPA, there were 11 integrated iron and steel
manufacturing facilities in the United States with sintering operations in 1993 (Mulrine
Telecon, 1994). The names and locations of these facilities are listed in Table 4.4.2-1.
�����
TABLE 4.4.2-1. LOCATIONS OF IRON AND STEEL INDUSTRYSINTER PLANTS IN 1993
Company Plant Location
Arnco Steel Ashland, KY
Arnco Steel Middletown, OH
Bethlehem Steel Burns Harbor, IN
Bethlehem Steel Sparrows Point, MD
Geneva Steel Orem, UT
Inland Steel East Chicago, IN
LTV Steel East Chicago, IN
USX Gary, IN
NCI Steel Youngstown, OH
Weirton Steel Weirton, WV
Wheeling-Pittsburgh Steubenville, OH
016'� 6JKU NKUV KU UWDLGEV VQ EJCPIG CU OCTMGV EQPFKVKQPU EJCPIG� HCEKNKV[ QYPGTUJKR EJCPIGU� RNCPVU CTG
Kelly, M.E. Sources and Emissions of Polycyclic Organic Matter. U.S. EnvironmentalProtection Agency, Research Triangle Park, North Carolina. EPA Report No. 450/5-83-010b. pp. 5-58 to 5-62. 1983.
Siebert, P.C. et al. Preliminary Assessment of the Sources, Control and Population Exposure toAirborne Polycyclic Organic Matter (POM) as Indicated by Benzo(a)pyrene (BaP). U.S. Environmental Protection Agency, Office of Air Quality Planning and Standards, PollutantStrategies Branch, Research Triangle Park, North Carolina. Prepared under EPA ContractNo. 68-02-2836. pp. 78-79. 1978.
Telephone Conversation between P. Mulrine, U.S. Environmental Protection Agency, and P.Keller, Radian Corporation. “Preliminary Data from Integrated Iron and Steel MACTDevelopment Program.” June 22, 1994.
U.S. Environmental Protection Agency. Compilation of Air Pollutant Emissions Factors.Volume I: Stationary Point and Area Sources. AP-42, Fifth Edition, Section 7.5. U.S. Environmental Protection Agency, Office of Air Quality Planning and Standards, ResearchTriangle Park, North Carolina. p. 7.5-1. 1995.
U.S. Environmental Protection Agency. Survey of Cadmium Emission Sources. EPA ReportNo. 450/3-81-013. Office of Air Quality Planning and Standards, Research Triangle Park, NorthCarolina. 1981.
U.S. Environmental Protection Agency. An Investigation of the Best Systems of EmissionReduction for Sinter Plants in the Iron and Steel Industry. U.S. Environmental ProtectionAgency, Office of Air Quality Planning and Standards, Research Triangle Park, North Carolina. Preliminary Report. 1977.
�����
4.4.3 Ferroalloy Manufacturing
Process Description
Ferroalloys are crude alloys of iron and one or more other elements that are used
for deoxidizing molten steels and making alloy steels. The major types of ferroalloys produced
are (Houck, 1993):
Ferroaluminum Ferrosilicon
Ferroboron Ferrotitanium
Ferrocolumbium Ferrovanadium
Ferrochromium Ferrotungsten
Ferrochromium-silicon Ferrozirconium
Ferromanganese Manganese metal
Ferromolybdenum Nickelcolumbium
Ferronickel Silicon metal
Ferrophosphorus Silicomanganese
Ferroalloys can be produced by five different processes; the primary method uses
electric arc furnaces (EAFs). Ferroalloy manufacturing is a potential source of emissions of
POM compounds because coke or coal is charged to the high-temperature smelting furnaces used
in the ferroalloy industry and burned. Because combustion efficiency in the furnace environment
is low, unburned hydrocarbons, including PAHs, are formed and emitted with the furnace
exhaust. However, ferroalloy production processes other than EAFs have not been identified as
POM emission sources (Kelly, 1983).
The EAF method of ferroalloy production is depicted in Figure 4.4.3-1
(U.S. EPA, 1980; U.S. EPA, 1974). Metal ores and other necessary raw materials such as quartz
or quartzite (slagging materials), alumina (a reducing agent), limestone, coke or coal, and steel
scrap are brought to ferroalloy facilities by ship, truck, or rail and stored on site. Depending on
its moisture content and physical configuration, metal ore may need to be dried and/or sintered
Satra Concentrates, Inc. Steubenville, OH Slag conversion
Silicon Metaltech, Inc. Wenatchee, WA Electric Arc
TABLE 4.4.3-5. (Continued)
Producer Plant Location Type of Furnace
�����
Simetco Montgomery, AL Electric Arc
SKW Alloys, Inc. Calvert City, KY Electric ArcNiagara Falls, NY
Strategic Minerals Corporation Niagara Falls, NY Electric Arc(STRATCOR)
Teledyne, Inc., Teledyne Wah Albany, OR MetallothermicChang, Albany Division
Union Oil Company of California, Washington, PA Electric Arc andMolycorp, Inc. Metallothermic
Ferrophosphorus
FMC Corporation, Industrial Pocatello, ID Electric Arc andChemical Division metallothermic
Monsanto Company, Monsanto Columbia, TN Electric Arc andIndustrial Chemicals Company Soda Springs, ID metallothermic
Occidental Petroleum Corporation Columbia, TN Electric Arc andmetallothermic
NOTE: This list is subject to change as market conditions change, facility ownership changes, plants are closeddown, etc. The reader should verify the existence of specific facilities by consulting current lists and/orthe plants themselves. The level of PAH emissions from any given facility is a function of variables suchas capacity, throughput, and control measures, and should be determined through direct contacts withplant personnel.
Source: Houck, 1993.
�����
SECTION 4.4.3 REFERENCES
Barnard, W.R. Emission Factors for Iron and Steel Sources - Criteria and Toxic Pollutants. U.S.Environmental Protection Agency, Control Technology Center, Office of Research andDevelopment, Washington, DC. EPA-600/2-90-024. p. 6. 1990.
Houck, G.W. “Iron and Steel.” In: Minerals Yearbook, 1992. U.S. Bureau of Mines,Washington, DC. p. 21. 1993.
Kelly, M.E. Sources and Emissions of Polycyclic Organic Matter. U.S. EnvironmentalProtection Agency, Research Triangle Park, North Carolina. EPA Report No. 450/5-83-010b. pp. 5-58 to 5-62. 1983.
Telephone conversation between Conrad Chin (U.S. Environmental Protection Agency) andEric Goehl (Radian). U.S. Environmental Protection Agency MACT Background Information: U.S. Ferroalloy Production Levels - 1991. October 31, 1994.
U.S. Environmental Protection Agency. Emission Factors for Iron Foundries - Criteria and ToxicPollutants. Control Technology Center, Office of Research and Development, Cincinnati, Ohio. EPA-600/2-90-044. p. A-72. 1990.
U.S. Environmental Protection Agency. Locating and Estimating Air Emissions from Sources ofChromium. Office of Air Quality Planning and Standards, Research Triangle Park, NorthCarolina. EPA Report No. 450/4-84-007g. 1984.
U.S. Environmental Protection Agency. A Review of Standards of Performance for NewStationary Sources - Ferroalloy Production Facilities. Office of Air Quality Planning andStandards, Research Triangle Park, North Carolina. EPA Report No. 450/3-80-041. pp. 1-66.1980.
U.S. Environmental Protection Agency. Background Information for Standards of Performance: Electric Submerged Arc Furnaces for Production of Ferroalloys, Volume I: Proposed Standards. Office of Air Quality Planning and Standards, Research Triangle Park, North Carolina. EPAReport No. 450/2-74-018a. 1974.
Westbrook, C.W. Multimedia Environmental Assessment of Electric Submerged Arc FurnacesProducing Ferroalloys. U.S. Environmental Protection Agency, Industrial EnvironmentalResearch Laboratory, Research Triangle Park, North Carolina. EPA-600/2-83-092. pp. 17-29,48-49. 1983.
�����
4.4.4 Iron and Steel Foundries
Process Description
Iron and steel foundries can be defined as those that produce gray, white, ductile, or
malleable iron and steel castings. Both cast irons and steels are solid solutions of iron, carbon,
and various alloying materials. Although there are many types of each, the iron and steel families
can be distinguished by their carbon content. Cast irons typically contain 2 percent carbon or
greater; cast steels usually contain less than 2 percent carbon (U.S. EPA, 1980).
Iron castings are used in almost all types of equipment, including motor vehicles, farm
machinery, construction machinery, petroleum industry equipment, electrical motors, and iron
and steel industry equipment.
Steel castings are used in motor vehicles, railroad equipment, construction machinery,
aircraft, agricultural equipment, ore refining machinery, and chemical manufacturing equipment
(U.S. EPA, 1980). Steel castings are classified on the basis of their composition and heat
treatment, which determine their end use. Classifications include carbon, low-alloy, general-
purpose-structural, heat-resistant, corrosion-resistant, and wear-resistant.
The following four basic operations are performed in all iron and steel foundries:
& Storage and handling of raw materials;
& Melting of the raw materials;
& Transfer of the hot molten metal into molds; and
& Preparation of the molds to hold the molten metal.
�����
Other processes present in most, but not all, foundries include:
& Sand preparation and handling;
& Mold cooling and shakeout;
& Casting cleaning, heat treating, and finishing;
& Coremaking; and
& Pattern making.
A generic process flow diagram for iron and steel foundries is shown in Figure 4.4.4-1.
Figure 4.4.4-2 depicts the emission points in a typical iron foundry (U.S. EPA, 1995).
Iron and steel castings are produced in a foundry by injecting or pouring molten metal
into cavities of a mold made of sand, metal, or ceramic material. Input metal is melted by the use
of a cupola (a cylindrical shell with either a refractory-lined or water-cooled inner wall), an
electric arc furnace (EAF), or an induction furnace. About 70 percent of all iron castings are
produced using cupolas, with lesser amounts produced in EAFs and induction furnaces.
However, the use of EAFs in iron foundries is increasing. Steel foundries rely almost exclusively
on EAFs or induction furnaces for melting purposes.
In either type of foundry, when the poured metal has solidified, the molds are separated
and the castings removed from the mold flasks on a casting shakeout unit. Abrasive
(shotblasting) cleaning, grinding, and heat treating are performed as necessary. The castings are
then inspected and shipped to another industry for machining and/or assembly into a final
product (U.S. EPA, 1980).
In a typical foundry operation, charges to the melting unit are sorted by size and density
and cleaned (as required) prior to being put into the melter. Charges consist of scrap metal,
ingot, carbon (coke), and flux. Prepared charge materials are placed in crane buckets, weighed,
Emission factors are in lb (Kg) of pollutant emitted per ton (Mg) of cast pipe produced. a
Ranges represent averaged data from two test reports (single facility).b
Source: EMCON, 1990; Normandeau, 1993.
�����
Source Locations
Based on a survey conducted by the EPA in support of the iron and steel foundry
Maximum Achievable Control Technology (MACT) standard development, there were 755 iron
and steel foundries in the United States in 1992 (Maysilles, 1993). Foundry locations can be
correlated with areas of heavy industry and manufacturing and, in general, with the iron and steel
production industry (Ohio, Pennsylvania, and Indiana).
Additional information on iron and steel foundries and their locations may be
obtained from the following trade associations:
& American Foundrymen’s Society, Des Plaines, Illinois;
& National Foundry Association, Des Plaines, Illinois;
& Ductile Iron Society, Mountainside, New Jersey;
& Iron Casting Society, Warrendale, Pennsylvania; and
& Steel Founders’Society of America, Des Plaines, Illinois.
�����
SECTION 4.4.4 REFERENCES
EMCON Associates. Compliance Testing to Quantify Emissions at U.S. Pipe and FoundryCompany. Union City, California. December 1990.
Maysilles, J. H., “Foundry MACT Standards Update.” Presented at the Sixth Annual AmericanFoundrymen’s Society Environmental Affairs Conference. Milwaukee, Wisconsin. August 22-24, 1993.
McCalla, D.R. et al. “Formation of Bacterial Mutagens from Various Mould Binder SystemsUsed in Steel Foundries.” In: Polynuclear Aromatic Hydrocarbons: Mechanisms, Methods, andMetabolism, Proceedings of the Eighth International Symposium on Polynuclear AromaticHydrocarbons. Columbus, Ohio, 1983. M. Cooke and A.J. Dennis, eds. Battelle Press,Columbus, Ohio. pp. 871-884. 1985.
Normandeu Associates. Report to Emissions of Toxics Compounds from the Cupola Baghouseat U.S. Pipe and Foundry Company. Union City, California. February 8-10, 1993.
Quilliam, M.A. et al. “Identification of Polycyclic Aromatic Compounds in MutagenicEmissions from Steel Casting.” In: Biomedical Mass Spectrometry. 12(4):143-150. 1985.
Schimberg, R.W. “Polycyclic Aromatic Hydrocarbons in Foundries.” In: Journal of Toxicologyand Environment Health. 6(5-6):1187-1194. September/November 1980.
U.S. Environmental Protection Agency. Compilation of Air Pollutant Emission Factors, AP-42,Fifth Edition, Section 12.10: Gray Iron Foundries. Office of Air Quality Planning andStandards, Research Triangle Park, North Carolina. 1995.
U.S. Environmental Protection Agency. Emissions Factors for Iron Foundries - Criteria andToxic Pollutants. Control Technology Center, Office of Research and Development, Cincinnati,Ohio. EPA-600/2-90-044. 29 pp. 1990.
U.S. Environmental Protection Agency. Electric Arc Furnaces in Ferrous Foundries -Background Information for Proposed Standards. Office of Air Quality Planning and Standards,U.S. Environmental Protection Agency, Research Triangle Park, North Carolina. EPA ReportNo. 3-80-020a. May 1980.
Verma, D.K. et al. “Polycyclic Aromatic Hydrocarbons in Ontario Foundry Environments.” In: Annals of Occupational Hygiene. 25(1):17-25. 1982.
�����
4.4.5 Secondary Lead Smelting
Process Description
The secondary lead smelting industry produces elemental lead and lead alloys by
reclaiming lead, mainly from scrap automobile batteries. Blast, reverberatory, rotary, and electric
furnaces are used for smelting scrap lead and producing secondary lead. Smelting is the
reduction of lead compounds to elemental lead in a high-temperature furnace, which requires
higher temperatures (2,200 to 2,300(F [1,200 to 1,260(C]) than those required for melting
elemental lead (621(F [327(C]). Secondary lead may be refined to produce soft lead (which is
nearly pure lead) or alloyed to produce hard lead. Most of the lead produced by secondary lead
smelters is hard lead that is used in the production of lead-acid batteries (U.S. EPA, 1994a).
Lead-acid batteries represent about 90 percent of the raw materials at a typical
secondary lead smelter, although this percentage may vary from one plant to the next. These
batteries contain approximately 18 lb (8.2 kg) of lead per battery consisting of 40 percent lead
alloys and 60 percent lead oxide. Other types of lead-bearing raw materials recycled by
secondary lead smelters include drosses (lead-containing byproducts of lead refining), which may
be purchased from companies that perform lead alloying or refining but not smelting; battery
plant scrap, such as defective grids or paste; and scrap lead, such as old pipes or roof flashing.
Other scrap lead sources include cable sheathing, solder, and babbitt-metal (U.S. EPA, 1994a).
POM emissions from secondary lead smelters are expected to occur from the
combustion of the polymeric organic casings (plastic and rubber) on batteries (Bennet et al.,
1979, National Research Council, 1983).
As illustrated in Figure 4.4.5-1, the normal sequence of operations in a secondary
lead smelter is scrap receiving, charge preparation, furnace smelting, and lead refining and
alloying. In the majority of plants, scrap batteries are first sawed or broken open to remove the
lead alloy plates and lead oxide paste material. The removal of battery covers is typically
accomplished using an automatic battery feed conveyor system and a slow-speed saw. Hammer
benzo(c)phenanthrene 12.75; chrysene/benz(a)anthracene 25.25; and benzo(a)pyrene 1
(Bennet et al., 1979).
Source Locations
In 1990, primary and secondary smelters in the United States produced
1,380,000 tons (1,255,000 Mg) of lead. Secondary lead smelters produced 946,000 tons
(860,000 Mg) or about 69 percent of the total refined lead produced in 1990, and primary
smelters produced 434,000 tons (395,000 Mg) (U.S. EPA, 1994a). Table 4.4.5-2 lists U.S.
secondary lead smelters according to their annual lead production capacity.
�����
TABLE 4.4.5-2. U.S. SECONDARY LEAD SMELTERS GROUPEDACCORDING TO ANNUAL LEAD PRODUCTION CAPACITY
Smelter Location
Small-Capacity Group:a
Delatte Metals Ponchatoula, LA
General Smelting and Refining Company College Grove, TN
Master Metals, Inc. Cleveland, OH
Metals Control of Kansas Hillsboro, KS
Metals Control of Oklahoma Muskogee, OK
Medium-Capacity Group:b
Doe Run Company Boss, MO
East Penn Manufacturing Company Lyon Station, PA
Exide Corporation Muncie, IN
Exide Corporation Reading, PA
GNB, Inc. Columbus, GA
GNB, Inc. Frisco, TX
Gulf Coast Recycling, Inc. Tampa, FL
Refined Metals Corporation Beech Grove, IN
Refined Metals Corporation Memphis, TN
RSR Corporation City of Industry, CA
RSR Corporation Middletown, NY
Schuylkill Metals Corporation Forest City, MO
Tejas Resources, Inc. Terrell, TX
Large-Capacity Group:c
Gopher Smelting and Refining, Inc. Eagan, MN
GNB, Inc. Vernon, CA
RSR Corporation Indianapolis, IN
Sanders Lead Company Troy, AL
Schuylkill Metals Corporation Baton Rouge, LA
Less than 22,000 tons (20,000 Mg).a
22,000 to 82,000 tons (20,000 to 75,000 Mg).b
Greater than 82,000 tons (75,000 Mg).c
Source: U.S. EPA, 1994a.
�����
SECTION 4.4.5 REFERENCES
Bennet, R.L. et al. “Measurement of Polynuclear Aromatic Hydrocarbons and Other HazardousOrganic Compounds in Stack Gases.” In: Polynuclear Aromatic Hydrocarbons: Chemistry andBiology - Carcinogenesis and Mutagenesis, Proceedings of the Third International Symposiumon Polynuclear Aromatic Hydrocarbons, Columbus, Ohio. P.W. Jones and P. Leber, eds. AnnArbor Science Publishers, Inc., Ann Arbor, Michigan. 1979.
National Research Council, Committee on Pyrene and Selected Analogues, Board on Toxicologyand Environmental Health Hazards, Commission on Life Sciences. Polycyclic AromaticHydrocarbons: Evaluation of Sources and Effects. p. 2-35. 1983.
U.S. Environmental Protection Agency. Secondary Lead Smelting Background InformationDocument for Proposed Standards: Volume 1. Office of Air Quality Planning and Standards,Research Triangle Park, North Carolina. EPA-450/R-94-024a. pp. 2-1 to 2-36. June 1994a.
U.S. Environmental Protection Agency. Secondary Lead Smelting Background InformationDocument for Proposed Standards: Volume 1. Office of Air Quality Planning and Standards,Research Triangle Park, North Carolina. EPA-450/R-94-024a. pp. 3-1 to 3-13. 1994b.
U.S. Environmental Protection Agency. Secondary Lead Smelting Background InformationDocument for Proposed Standards: Volume 2 - Appendices. Office of Air Quality Planning andStandards, Research Triangle Park, North Carolina. EPA-450/R-94-024b. pp. A-30 and A-40. 1994c.
Roy F. Weston, Inc. Testing on Selected Sources at a Secondary Lead Smelter. Summary ofResults, Draft Data Tables. East Penn Manufacturing Company, Lyon Station, Pennsylvania. Prepared for U.S. Environmental Protection Agency, Emission Measurement Branch, ResearchTriangle Park, North Carolina. EPA Contract No. 68D10104 and 68D20029. Tables 3-25, 3-27. 1993a.
Roy F. Weston, Inc. Emission Test Report - HAP Emission Testing on Selected Sources at aSecondary Lead Smelter. Schuylkill Metals Corporation, Forest City, Missouri. Prepared forU.S. Environmental Protection Agency, Emission Measurement Branch, Research Triangle Park,North Carolina. EPA Contract No. 68D10104. pp. 3-38, 3-39, 3-51. 1993b.
Roy F. Weston, Inc. Emission Test Report - HAP Emission Testing on Selected Sources at aSecondary Lead Smelter. Tejas Resources, Inc., Terrell, Texas. Prepared forU.S. Environmental Protection Agency, Emission Measurement Branch, Research Triangle Park,North Carolina. EPA Contract No. 68D10104. pp. 3-32 to 3-34. 1993c.
�����
4.5 PETROLEUM REFINING
Crude oil contains small amounts of naturally occurring aromatics, including
some POM, that may be emitted from some processes and operations at petroleum refineries.
Other processes may form POM, which may be emitted at the point of generation or downstream
in another operation. A flow diagram of processes likely to be found at a model refinery is
shown in Figure 4.5-1. The arrangement of these processes varies among refineries, and few, if
any, employ all of these processes.
Processes at petroleum refineries can be grouped into five types: (1) separation
Finally, all refineries have a feedstock/product storage area (commonly called a
“tank farm”) with storage tanks whose capacities range from less than 1,000 barrels to more than
500,000 barrels. Feedstock/product handling operations (transfer operations) consist of the
loading and unloading of transport vehicles (including trucks, rail cars, and marine vessels).
Emissions that are associated with these operations are discussed in Section 4.12.8 as part of
gasoline distribution and marketing.
Emissions of HAPs from the different processes in petroleum refineries have been
investigated recently in support of Federal NESHAP development; a MACT standard for the
petroleum refinery source category was promulgated in 1995. The investigations did not focus
on POM because of their relative insignificance compared to lighter aromatics. However, some
indications of total POM quantities emitted from various processes did surface, and emissions of
one PAH, naphthalene, were detected from some processes, which were not reported previously.
In general, the largest sources of POM emissions from petroleum refinery
processes are process heaters and catalytic cracking units. Process heater emissions are discussed
in Section 4.1.2 of this document; emissions from FCC units are discussed next. Other sources
of POM emissions, primarily naphthalene, include process vents on the sulfur recovery, thermal
coking, and blowdown systems, and from wastewater. Because the data for emissions from these
sources are limited and the emissions are relatively minor, the sources are not described in detail;
rather, emissions and controls are summarized in Section 4.5.2.
�����
4.5.1 Catalytic Cracking Units
Process Description
Catalytic cracking processes are the means by which the production of gasoline
can be substantially increased from a given amount of crude oil. Heavier feedstocks such as
atmospheric or vacuum gas oils are cracked in fluidized or moving-bed units to produce slurry
oil, light cycle oil, cracked gasoline, light gases, and coke (Radian, 1980). The cracking takes
place in the presence of a catalyst, which can become deactivated through the continual
deposition of coke (i.e., carbon) on active sites. To combat catalyst degradation, catalysts are
regenerated by combusting the coke deposits on the catalyst. This combustion of coke during
catalyst regeneration has been found to form POM emissions (Hangebrauck et al., 1967).
Two types of catalytic crackers are used in the petroleum industry: fluidized-bed
and moving-bed designs. There are two types of moving-bed designs: Thermofor catalytic®
cracking (TCC) units and Houdriflow catalytic cracking (HCC) units. Fluidized-bed catalytic®
crackers (FCC) greatly dominate over the moving-bed type, constituting well over 90 percent of
total cracking feed capacity. The industry has been generally phasing out the use of moving-bed
units since 1980 in favor of the more efficient FCC units (Radian, 1980).
A process flow diagram of a typical FCC unit is shown in Figure 4.5-2
(Radian, 1980). In the FCC process, hot regenerated catalyst, mixed with hydrocarbon feed, is
transported into the cracking reactor. The reactor, which is maintained at about 900(F (480(C)
and 15 psig, contains a bed of powdered silica-alumina type catalyst which is kept in a fluidized
state by the flow of vaporized feed material and steam (Radian, 1980; Hangebrauck et al., 1967).
Cracking of the feed, which occurs in the riser leading to the reactor and in the fluidized bed,
causes a deposit of coke to form on the catalyst particles. A continuous stream of spent catalyst
is withdrawn from the reactor and steam-stripped to remove hydrocarbons. The catalyst particles
are then pneumatically conveyed to a catalyst regeneration unit. Hydrocarbon vapors from the
cracking process are fractionated in a distillation column to produce light hydrocarbons, cracked
gasoline, and fuel oil (Radian, 1980).
�����
Figure 4.5-2. Diagram of a Fluid-Bed Catalytic Cracking Process
Source: Radian, 1980.
�����
In the catalyst regeneration unit, coke deposits are burned off at temperatures
nearly 1,000(F (540(C) and pressures ranging from 2 to 20 psig (Hangebrauck, 1967). This
coke combustion process is the source of POM emissions in the regeneration portion of FCC
units (Radian, 1980; Hangebrauck, 1967). The regenerated catalyst is continuously returned to
the cracking reactor. Heat added to the catalyst during regeneration (coke combustion) furnishes
much of the required heat for the cracking reaction (Radian, 1980). Uncontrolled regenerator
flue gases contain a high amount of CO along with other unburned hydrocarbons (potentially
including POM compounds). These flue gases can be vented directly to the atmosphere or to a
CO waste heat boiler (Radian, 1980; Hangebrauck et al., 1967).
Moving-bed cracking units are similar to FCC units but use beaded or pelleted
catalysts (Radian, 1980; Hangebrauck et al., 1967). In both TCC and HCC units, the cracking
process is initiated by having regenerated catalyst and vaporized hydrocarbon feed enter the top
of the cracking reactor chamber and travel co-currently downward through the vessel. As the
cracking process proceeds, synthetic crude product is withdrawn and sent to the synthetic crude
distillation tower for processing into light fuels, heavy fuels, catalytic gasoline, and wet gas
(Radian, 1980). At the base of the reactor, the catalyst is purged with steam to remove
hydrocarbons and is then gravity fed into the catalyst regeneration chamber.
In the regeneration chamber, combustion air is added at a controlled rate to burn
off catalyst coke deposits. As in FCC units, burning coke produces POM emissions that are
released in TCC and HCC catalyst regenerator flue gases. Regenerated catalyst is collected at the
bottom of the chamber and is conveyed by airlift to a surge hopper above the cracking reactor
where it can be gravity-fed back into the cracking process (Radian, 1980).
Flue gases from TCC and HCC units are either vented directly to the atmosphere
or to a CO waste heat boiler. Waste heat boilers that are fired with an auxiliary fuel or contain a
catalyst are reported to have been 99 percent efficient in reducing PAH emissions from a
regeneration unit (Radian, 1980). In several installations, particulate matter emissions from the
waste heat boiler are controlled by an ESP (Radian, 1980). Catalytic cracking units constructed
after June 1973 are subject to a new source performance standard that limits CO and particulate
�����
matter emissions to such a level that a waste heat boiler and ESP are generally required for
compliance (Radian, 1980). Cyclones and scrubbers have also been used for added control.
Some TCC units have also been equipped in some installations with direct-fired
afterburners called plume burners. The plume burner is a secondary stage of combustion built
into the catalyst regeneration chambers. This type of burner successfully increases the clarity of
plumes from regeneration flue gases; however, compared to a CO waste heat boiler, the plume
burner is ineffective at reducing POM emissions (Hangebrauck, 1967).
Another way to reduce POM emissions from the catalyst regenerators is to
achieve a more complete combustion of CO to CO . Processes such as the Universal Oil2
Products (UOP) hot regeneration and Amoco Ultracat have been developed to aid in the®
achievement of lower overall POM emissions. The relatively higher temperatures for catalyst
regeneration used in the UOP process serves to improve coke combustion efficiency and thus
potentially reduce POM formation and emissions. One drawback to the UOP process is that due
to its higher temperatures, special materials of construction are required, thus making it more
suitable for new cracking units as opposed to existing units. The Amoco process, however, is
based on improving the catalytic reactor efficiency and allowing more complete combustion to
occur in the catalyst regenerator without having to operate at higher temperatures. Because
changes in basic equipment are minimal with the Amoco process, it is more amenable for
retrofitting existing units (Radian, 1980).
Emission Factors
Emission factors for the catalyst regenerator portion of fluidized- and moving-bed
catalytic cracking units are presented in Table 4.5-1 (Hangebrauck et al., 1967). As indicated by
the date of the reference, POM emission data from catalytic cracking have not been updated since
Hangebrauck summarized these emission factors. The only newer data that are available for
POM from catalytic cracking are those for naphthalene emissions (Radian, 1991).
�����
The emission factors that were reported by Hangebrauck et al. (1967) for all FCC,
TCC, and HCC units exhibit a large amount of variability. In uncontrolled FCC units, pyrene,
phenanthrene, and fluoranthene were the predominant compounds measured. Perylene,
anthracene, and coronene were not detected in uncontrolled emissions from the FCC unit.
Benzo(a)pyrene levels were found to be relatively minor (average of 3.74E10-6 lb
[1.69E10-7 kg] per barrel of oil feed versus an average of 2.94E10-4 lb [1.33E10-4 kg] per barrel
of oil feed for phenanthrene; a standard barrel of oil contains 42 gallons [160 liters]). The
positive effect of CO waste heat boilers as control devices for FCC unit regenerator flue gases
can also be seen (Hangebrauck et al., 1967).
Emissions of PAH were highest in general from the controlled TCC unit (air lift
type) and the uncontrolled HCC unit. In the air lift TCC unit, pyrene, phenanthrene,
benzo(ghi)perylene, and benzo(a)pyrene emission levels were the highest of the ten PAH
measured. Similarly, benzo(ghi)perylene, benzo(e)pyrene, pyrene, and benzo(a)pyrene were the
most significant compounds measured in uncontrolled HCC unit emissions. Both types of TCC
units were equipped with plume burners. The data for the HCC unit suggests the effectiveness of
venting regenerator emissions to CO waste heat boilers for PAH emission control. For each of
the ten PAH compounds measured, the CO waste heat boiler reduced uncontrolled HCC
regenerator emissions by greater than 99 percent.
Data obtained to support the development of the Petroleum Refinery NESHAP
was used to calculate an emission factor for naphthalene from an FCC unit without a CO waste
heat boiler (i.e., uncontrolled) (Radian, 1991). This emission factor, which is presented in
Table 4.5-1, is based on information provided by only one refinery and may not be representative
of similar units. Data for total POM were also provided in response to the EPA ICR and
Section 114 surveys (Radian, 1991). Total annual POM emissions from an uncontrolled catalytic
cracking unit were calculated to be 0.0041 lb (0.0018 kg) per barrel of oil charged, which is
similar in value to the emission factor for naphthalene. Again, these data are not necessarily
representative of the industry as a whole, but they give some small indication of the level of
POM emissions that can be expected from today’s catalytic cracking units.
EQPVKPWGF�
�����
TABLE 4.5-1. PAH EMISSION FACTORS FOR PETROLEUM CATALYTIC CRACKINGCATAYST REGENERATION UNITS
SCC Number Emission Source Control Device Pollutant (kg/barrel) Rating Reference
Average Emission EmissionFactor in lb/barrel Factora
3-06-002-01 Fluid Catalytic Cracking Unit Uncontrolled Benzo(a)pyrene 3.7E-07 D Hangebrauck et al., 1967(1.7E-07)
Anthracene <1.5E-06 D Hangebrauck et al., 1967(<6.9E-07)
Benzo(ghi)perylene <3.2E-07 D Hangebrauck et al., 1967(<1.5E-07)
Fluoranthene 1.5E-05 D Hangebrauck et al., 1967(6.7E-06)
Naphthalene 1.3E-06 E Radian, 1991(6.0E-07)
Phenanthrene <3.0E-04 D Hangebrauck et al., 1967(<1.3E-04)
Pyrene 2.1E-05 D Hangebrauck et al., 1967(9.4E-06)
Benzo(e)pyrene 2.7E-06 D Hangebrauck et al., 1967(1.2E-06)
Benzo(a)pyrene 2.4E-08 D Hangebrauck et al., 1967(1.1E-08)
Benzo(ghi)perylene 4.0E-08 D Hangebrauck et al., 1967(1.8E-08)
Fluoranthene 1.3E-07 D Hangebrauck et al., 1967(5.9E-08)
Pyrene 2.0E-07 D Hangebrauck et al., 1967(9.2E-08)
Benzo(e)pyrene 2.9E-08 D Hangebrauck et al., 1967(1.3E-08)
TABLE 4.5-1. (Continued)
SCC Number Emission Source Control Device Pollutant (kg/barrel) Rating Reference
Average Emission EmissionFactor in lb/barrel Factora
EQPVKPWGF�
�����
3-06-003-01 Moving-bed Catalytic Cracking Plume Burner Benzo(a)pyrene 1.8E-04 D Hangebrauck et al., 1967Process - Thermofor (airlift) (7.9E-05)
Anthracene 3.3E-06 D Hangebrauck et al., 1967(1.5E-05)
Benzo(ghi)perylene 1.3E-04 D Hangebrauck et al., 1967(5.7E-05)
Fluoranthene 2.9E-05 D Hangebrauck et al., 1967(1.3E-05)
Phenanthrene 5.6E-04 D Hangebrauck et al., 1967(2.5E-04)
Pyrene 4.7E-04 D Hangebrauck et al., 1967(2.1E-04)
Anthanthrene 5.5E-06 D Hangebrauck et al., 1967(2.5E-06)
Benzo(e)pyrene 1.1E-04 D Hangebrauck et al., 1967(4.8E-05)
Coronene 2.7E-07 D Hangebrauck et al., 1967(1.2E-07)
Perylene 1.8E-05 D Hangebrauck et al., 1967(8.1E-06)
3-06-003-01 Moving-bed Catalytic Cracking Plume Burner Benzo(a)pyrene 3.5E-08 D Hangebrauck et al., 1967Process - Thermofor (bucket lift) (1.6E-08)
Fluoranthene 1.8E-07 D Hangebrauck et al., 1967(8.3E-08)
Pyrene 7.1E-07 D Hangebrauck et al., 1967(3.2E-07)
TABLE 4.5-1. (Continued)
SCC Number Emission Source Control Device Pollutant (kg/barrel) Rating Reference
Average Emission EmissionFactor in lb/barrel Factora
EQPVKPWGF�
�����
3-06-003-01 Moving-bed Catalytic Cracking Plume Burner Benzo(e)pyrene 9.1E-08 D Hangebrauck et al., 1967(continued) Process - Thermofor (bucket lift) (continued) (4.1E-08)
(continued)
3-06-003-01 Moving-bed Catalytic Cracking Uncontrolled Benzo(a)pyrene 4.8E-04 E Hangebrauck et al., 1967Process - Houdriflow (2.2E-04)
Anthracene 3.2E-06 E Hangebrauck et al., 1967(1.5E-06)
Benzo(ghi)perylene 7.5E-04 E Hangebrauck et al., 1967(3.4E-04)
Fluoranthene 2.2E-05 E Hangebrauck et al., 1967(9.9E-06)
Phenanthrene 5.5E-05 E Hangebrauck et al., 1967(2.5E-05)
Pyrene 2.9E-04 E Hangebrauck et al., 1967(1.3E-04)
Anthanthrene 3.7E-05 E Hangebrauck et al., 1967(1.7E-05)
Benzo(e)pyrene 7.6E-04 E Hangebrauck et al., 1967(3.5E-04)
Coronene 4.1E-05 E Hangebrauck et al., 1967(1.9E-05)
Perylene 7.5E-05 E Hangebrauck et al., 1967(3.4E-05)
3-06-003-01 Moving-bed Catalytic Cracking CO Waste Heat Boiler Benzo(a)pyrene 1.0E-07 E Hangebrauck et al., 1967Process - Houdriflow (4.5E-08)
Anthracene 1.7E-08 E Hangebrauck et al., 1967(7.9E-09)
TABLE 4.5-1. (Continued)
SCC Number Emission Source Control Device Pollutant (kg/barrel) Rating Reference
Average Emission EmissionFactor in lb/barrel Factora
�����
3-06-003-01 Moving-bed Catalytic Cracking CO Waste Heat Boiler Benzo(ghi)perylene 2.8E-07 E Hangebrauck et al., 1967(continued) Process - Houdriflow (continued) (1.3E-07)
(continued)
Fluoranthene 5.1E-08 E Hangebrauck et al., 1967(2.3E-08)
Phenanthrene 1.8E-07 E Hangebrauck et al., 1967(8.3E-08)
Pyrene 8.6E-08 E Hangebrauck et al., 1967(3.9E-08)
Anthanthrene 7.1E-09 E Hangebrauck et al., 1967(3.2E-09)
Benzo(e)pyrene 2.1E-07 E Hangebrauck et al., 1967(9.7E-08)
Coronene 1.8E-08 E Hangebrauck et al., 1967(8.0E-09)
Perylene 1.1E-08 E Hangebrauck et al., 1967(4.8E-09)
Emission factors are expressed in lb (kg) of pollutant per barrel of oil (fresh feed and recycle) charged.a
�����
Source Locations
As of January 1992, there were 192 petroleum refineries in the United States, with
a total crude capacity of 15.3 million barrels per calendar day. The majority of refinery capacity
(54 percent) was located in Texas, Louisiana, and California. Other regions with significant
refinery capacities were the Chicago, Philadelphia, and Puget Sound areas. Only about
two-thirds of these refineries operate catalytic crackers.
4.5.2 Other Petroleum Refinery Sources
Process Description
The recent MACT standard development effort has indicated the possibility of
other minor POM sources in petroleum refineries. Some refineries reported that naphthalene was
emitted from process vents on the sulfur recovery, thermal coking, and blowdown systems, and
points in the wastewater treatment system. The first three processes may generate POM or may
simply emit POM such as naphthalene that are already present in the material being processed.
Because these are minor sources and little data are available, the processes are not described.
Consult the references should be for more detail.
Emission Factors
Even though a few refineries reported that naphthalene was present, emission
factors could be developed only for two points in the wastewater treatment process: the oil-water
separator and biotreatment. Naphthalene emissions from an oil-water separator were calculated
to be on average 1.45 lb (0.65 kg) per million gallons of refinery wastewater treated. An average
factor for naphthalene emissions from a biotreatment unit was calculated as 0.565 lb (0.255 kg)
per million gallons of refinery wastewater treated. As with the naphthalene emission factor for
an uncontrolled FCC unit, it must be emphasized that these data are from a limited number of
facilities. No claim is made that these are representative values; rather, they are the only data
�����
available and serve only to give some indication of the type of refinery processes that may
generate POM.
The process vent provisions included in the Petroleum Refinery NESHAP affect
organic HAP emissions from miscellaneous process vents throughout a refinery. For
miscellaneous process vents, the most reported controls were flares, incinerators, and/or boilers.
Other controls for miscellaneous process vents reported by refineries include scrubbers, ESPs,
fabric filter, and cyclones. The wastewater provisions of the Petroleum Refining NESHAP affect
wastewater collection and treatment systems emissions as well. Therefore, emissions from these
other sources along with catalytic cracking units may be significantly reduced after the Petroleum
Refinery NESHAP is fully implemented (Zarate, 1992).
Source Locations
As stated previously, there are nearly 200 refineries in the United States.
However, not all of them may operate sulfur recovery, thermal coking, or wastewater systems,
although as with catalytic cracking, the majority of the refineries have these systems which can
potentially emit naphthalene.
�����
SECTION 4.5 REFERENCES
Draft Memorandum from Zarate, M.A., Radian Corporation, to Durham, J.F.,U.S. Environmental Protection Agency. “Summary of Nationwide Hazardous Air PollutantEmission Estimates from Process Vents for Petroleum Refineries.” May 12, 1992.
Hangebrauck, R.P. et al. Sources of Polynuclear Hydrocarbons in the Atmosphere. PublicHealth Service, U.S. Department of Health, Education, and Welfare, Cincinnati, Ohio. PublicHealth Service Report No. AP-33. pp. 27-28. 1967.
Radian Corporation. Summary of Hazardous Air Pollutant Emissions from Selected PetroleumRefineries. Prepared for U.S. Environmental Protection Agency, Chemicals and PetroleumBranch, Office of Air Quality Planning and Standards, Research Triangle Park, North Carolina. November 1991.
Radian Corporation. Assessment of Atmospheric Emissions from Petroleum Refining. Preparedfor U.S. Environmental Protection Agency, Industrial Environmental Research Laboratory,Research Triangle Park, North Carolina. EPA-600/2-80-075e. pp. 192-203. July 1980.