Locating Noctiluca miliaris in the Arabian Sea: An optical proxy approach Patricia S. Thibodeau, 1 Collin S. Roesler, 1,* Susan L. Drapeau, 1 S. G. Prabhu Matondkar, 2 Joaquim I. Goes, 3 and P. Jeremy Werdell 4 1 Bowdoin College, Brunswick, Maine 2 National Institute of Oceanography, Dona Paula, Goa, India 3 Lamont-Doherty, Columbia University, Palisades, New York 4 National Aeronautics and Space Administration, Goddard Space Flight Center, Greenbelt, Maryland Abstract Coincident with shifting monsoon weather patterns over India, the phytoplankter Noctiluca miliaris has recently been observed to be dominating phytoplankton blooms in the northeastern Arabian Sea during the winter monsoons. Identifying the exact environmental and/or ecological conditions that favor this species has been hampered by the lack of concurrent environmental and biological observations on time and space scales relevant to ecologic and physiologic processes. We present a bio-optical proxy for N. miliaris measured on highly resolved depth scales coincident with hydrographic observations with the goal to identify conducive hydrographic conditions for the bloom. The proxy is derived from multichannel excitation chlorophyll a fluorescence and is validated with microscopy, pigment composition, and spectral absorption. Phytoplankton populations dominated by either diatoms or other dinoflagellates were additionally discerned. N. miliaris populations in full bloom were identified offshore in low-nutrient and low–N : P ratio surface waters within a narrow temperature and salinity range. These populations transitioned to high-biomass diatom-dominated coastal upwelling populations. A week later, the N. miliaris blooms were observed in declining phase, transitioning to very-low-biomass populations of non–N. miliaris dinoflagellates. There were no clear hydrographic conditions uniquely associated with the N. miliaris populations, although N. miliaris was not found in the upwelling or extremely oligotrophic waters. Taxonomic transitions were not discernible in the spatial structure of the bloom as identified by the ocean color Chl imagery, indicating that in situ observations may be necessary to resolve community structure, particularly for populations below the surface. The Arabian Sea is one of the most productive regions in the world because of periods of strong monsoonally driven coastal upwelling and convective mixing that bring nutrient-rich waters from below the permanent thermocline to the surface waters (Wiggert et al. 2005). Monsoons act as one of the predominant climatic systems in the Arabian Sea and are generated in response to the adjacency of the large Eurasian landmass to the Arabian Sea producing intense land–sea temperature gradients. The main physical forcings that control productivity in the Arabian Sea are winter convective mixing during the northeast monsoon (NEM) in the winter, December through March, and coastal upwell- ing during the southwest monsoon (SWM) in summer, June through September (Parab et al. 2006). Winds associated with SWM along the northwestern coast of Africa and the Arabian Peninsula drive offshore Ekman transport and coastal upwelling in the summer and produce large coastal phytoplankton blooms (Garrison et al. 1998; Latasa and Bidigare 1998; Shalapyonok et al. 2001). The NEM produces cooling of the northern Arabian Sea in the winter, causing the surface water to sink, generating convective mixing, and injecting nutrients to the surface (Madhupratap 1999). In effect, these monsoons create two distinct blooms, a strong bloom in the summer off the coast of Somalia and a weaker bloom in the winter off the northwest coast of India and southern Pakistan (Brock et al. 1992; Banse and English 2000). The Arabian Sea is a relatively biodiverse ocean basin with enhanced biological activity providing large amounts of sinking particulate organic matter that maintains an extraordinarily extended deep oxygen minimum zone. The semi-enclosed basin with convergent and downwelling geostrophic circulation characteristic of subtropical gyres leads to low oxygen regeneration in the interior deep water as well as upwelling driving deep low-oxygen waters to the surface around the perimeter (Wajih et al. 2006). Recent and significant reductions in snow coverage in the Himalayas as well as extremely high summertime landmass temperatures are implicated in driving shifts in the intensity and timing of sea-level pressure gradients from land to sea, intensifying summer monsoons, increasing productivity, and further depleting oxygen in the deep water of the Arabian Sea (Goes et al. 2005). These oxygen- depleted waters are subsequently upwelled to the surface in the northeastern Arabian Sea during the winter monsoons, and contemporaneous changes in phytoplankton composi- tion have been observed (Parab et al. 2006; Gomes et al. 2008). The typical pattern in phytoplankton bloom succession was dominance by diatoms, followed by cyano- bacteria, and then dinoflagellates with the lowest recorded concentrations (Sawant and Madhupratap 1996). However, since the 1990s the phytoplankton community has become dominated by an emergent species, Noctiluca miliaris (also known as the green Noctiluca scintillans; Parab et al. 2006; Gomes et al. 2008; S. Prakash unpubl.). Although this species has been observed extensively in the waters of * Corresponding author: [email protected]Limnol. Oceanogr., 59(6), 2014, 2042–2056 E 2014, by the Association for the Sciences of Limnology and Oceanography, Inc. doi:10.4319/lo.2014.59.6.2042 2042
Transcript
Locating Noctiluca miliaris in the Arabian Sea: An optical proxy approach
Patricia S. Thibodeau,1 Collin S. Roesler,1,* Susan L. Drapeau,1 S. G. Prabhu Matondkar,2
Joaquim I. Goes,3 and P. Jeremy Werdell 4
1 Bowdoin College, Brunswick, Maine2 National Institute of Oceanography, Dona Paula, Goa, India3 Lamont-Doherty, Columbia University, Palisades, New York4 National Aeronautics and Space Administration, Goddard Space Flight Center, Greenbelt, Maryland
Abstract
Coincident with shifting monsoon weather patterns over India, the phytoplankter Noctiluca miliaris hasrecently been observed to be dominating phytoplankton blooms in the northeastern Arabian Sea during thewinter monsoons. Identifying the exact environmental and/or ecological conditions that favor this species hasbeen hampered by the lack of concurrent environmental and biological observations on time and space scalesrelevant to ecologic and physiologic processes. We present a bio-optical proxy for N. miliaris measured on highlyresolved depth scales coincident with hydrographic observations with the goal to identify conducive hydrographicconditions for the bloom. The proxy is derived from multichannel excitation chlorophyll a fluorescence and isvalidated with microscopy, pigment composition, and spectral absorption. Phytoplankton populations dominatedby either diatoms or other dinoflagellates were additionally discerned. N. miliaris populations in full bloom wereidentified offshore in low-nutrient and low–N : P ratio surface waters within a narrow temperature and salinityrange. These populations transitioned to high-biomass diatom-dominated coastal upwelling populations. A weeklater, the N. miliaris blooms were observed in declining phase, transitioning to very-low-biomass populations ofnon–N. miliaris dinoflagellates. There were no clear hydrographic conditions uniquely associated with the N.miliaris populations, although N. miliaris was not found in the upwelling or extremely oligotrophic waters.Taxonomic transitions were not discernible in the spatial structure of the bloom as identified by the ocean colorChl imagery, indicating that in situ observations may be necessary to resolve community structure, particularlyfor populations below the surface.
The Arabian Sea is one of the most productive regionsin the world because of periods of strong monsoonallydriven coastal upwelling and convective mixing that bringnutrient-rich waters from below the permanent thermoclineto the surface waters (Wiggert et al. 2005). Monsoons act asone of the predominant climatic systems in the Arabian Seaand are generated in response to the adjacency of the largeEurasian landmass to the Arabian Sea producing intenseland–sea temperature gradients. The main physical forcingsthat control productivity in the Arabian Sea are winterconvective mixing during the northeast monsoon (NEM) inthe winter, December through March, and coastal upwell-ing during the southwest monsoon (SWM) in summer, Junethrough September (Parab et al. 2006). Winds associatedwith SWM along the northwestern coast of Africa and theArabian Peninsula drive offshore Ekman transport andcoastal upwelling in the summer and produce large coastalphytoplankton blooms (Garrison et al. 1998; Latasa andBidigare 1998; Shalapyonok et al. 2001). The NEMproduces cooling of the northern Arabian Sea in thewinter, causing the surface water to sink, generatingconvective mixing, and injecting nutrients to the surface(Madhupratap 1999). In effect, these monsoons create twodistinct blooms, a strong bloom in the summer off the coastof Somalia and a weaker bloom in the winter off thenorthwest coast of India and southern Pakistan (Brocket al. 1992; Banse and English 2000).
The Arabian Sea is a relatively biodiverse ocean basinwith enhanced biological activity providing large amountsof sinking particulate organic matter that maintains anextraordinarily extended deep oxygen minimum zone. Thesemi-enclosed basin with convergent and downwellinggeostrophic circulation characteristic of subtropical gyresleads to low oxygen regeneration in the interior deep wateras well as upwelling driving deep low-oxygen waters to thesurface around the perimeter (Wajih et al. 2006).
Recent and significant reductions in snow coverage inthe Himalayas as well as extremely high summertimelandmass temperatures are implicated in driving shifts inthe intensity and timing of sea-level pressure gradients fromland to sea, intensifying summer monsoons, increasingproductivity, and further depleting oxygen in the deepwater of the Arabian Sea (Goes et al. 2005). These oxygen-depleted waters are subsequently upwelled to the surface inthe northeastern Arabian Sea during the winter monsoons,and contemporaneous changes in phytoplankton composi-tion have been observed (Parab et al. 2006; Gomeset al. 2008). The typical pattern in phytoplankton bloomsuccession was dominance by diatoms, followed by cyano-bacteria, and then dinoflagellates with the lowest recordedconcentrations (Sawant and Madhupratap 1996). However,since the 1990s the phytoplankton community has becomedominated by an emergent species, Noctiluca miliaris (alsoknown as the green Noctiluca scintillans; Parab et al. 2006;Gomes et al. 2008; S. Prakash unpubl.). Although thisspecies has been observed extensively in the waters of* Corresponding author: [email protected]
Limnol. Oceanogr., 59(6), 2014, 2042–2056
E 2014, by the Association for the Sciences of Limnology and Oceanography, Inc.doi:10.4319/lo.2014.59.6.2042
2042
Southeast Asia, its predominance in the Arabian Sea is arecent occurrence (Harrison et al. 2011).
Combining remotely sensed seasonal bloom distributionwith shipboard microscopic analysis, Gomes et al. (2008)speculate that climatic changes have led to the shift inphytoplankton composition from diatoms to dominanceby dinoflagellates, specifically N. miliaris, in these low-oxygenated waters during the winter NEM (February–March) and the spring intermonsoon (SIM; Madhu et al.2012). Further analysis of the satellite data (Gomes et al.2008) reveals that the once-dominant cyanobacteria Tri-chodesmium sp. in the eastern Arabian Sea (Westberry andSiegel 2006) has been replaced by N. miliaris during theSIM and that the N. miliaris blooms are widespread notonly offshore, but also in the polluted coastal waters off ofIndia (Chaghtai and Saifullah 2006). It is thought thatrecent increases in coastal phosphate concentrations giveN. miliaris a competitive advantage compared to otherphytoplankton species. Observations of ammonia secretionsuggest that N. miliaris has sufficient nitrogen for growth(Furuya et al. 2006), perhaps because of the combination ofboth heterotrophy and symbiosis.
N. miliaris—The phytoplankter N. miliaris (Fig. 1) is anunpigmented phagotrophic and omnivorous dinoflagellatethat is large enough to be seen by eye (.500 mm diameter).It consumes an array of organisms including otherphytoplankton, small zooplankton, fish eggs, and detritus.N. miliaris consumes its food using a tentacle that connectsto the cytosome and can obtain food either by directcontact with food particles that land on the tentacle or byprotruding mucus from the tentacle that acts as a net tocatch food (Kiørboe and Titelman 1998; Chaghtai andSaifullah 2006). Although not an active vertical migrator,N. miliaris is highly buoyant because of its ability to secreteammonia into the cytoplasm and maintain positivebuoyancy (Furuya et al. 2006; Lirdwitayaprasit et al.2012). Despite being relatively immobile, N. miliarisintercepts its food through passive migration (Kahn andSwift 1978). The high buoyancy often causes N. miliarisblooms to accumulate at the surface, forming noticeablydiscolored waters (Kiørboe and Titelman 1998).
N. miliaris is able to tolerate moderate fluctuations inboth salinity and temperature, enabling it to prevail invariable hydrographic conditions (Lirdwitayaprasit et al.2006). It is suggested that N. miliaris tolerates low oxygenconditions because of its symbiont, Pedinomonas noctilu-cae, photosynthesizing more efficiently than other phyto-plankton in low oxygen conditions (Hansen et al. 2004;Gomes et al. 2008). This characteristic facilitates N. miliarisdominance during the NEM when oxygen-deficient water isupwelled (H. Gomes and J. Goes pers. comm.).
Classified as a unicellular microscopic flagellate, P.noctilucae belongs to the class Prasinophyceae, although itgains its green color from the pigments common to theChlorophyceae. Both N. miliaris and P. noctilucae occurpreferably at low temperatures in tropical waters (Chaghtaiand Saifullah 2006). The symbiotic relationship existsbecause P. noctilucae ostensibly provides N. miliaris withphotosynthetic products, which N. miliaris would not have
otherwise. In exchange, N. miliaris gives the symbiontprotection from grazing and provides the low-pH environ-ment (4.5–5) critical to P. noctilucae’s survival (Furuyaet al. 2006). The green pigmentation of P. noctilucae producesthe distinctive green coloration of N. miliaris so differentfrom most other dinoflagellates, specifically the absence ofperidinin and the presence of chlorophyll b (Chl b).
Taxonomic identification via pigment-based phytoplank-ton functional types—Although chlorophyll a (Chl a) isthe primary fluorescing pigment, the energy it fluorescesoriginates from light absorption by the suite of accessoryphotosynthetic pigments (Huot and Babin 2010). Fluores-cence intensity is proportional to light absorption, via thefluorescence quantum yield, and hence to pigment concen-tration. By using the excitation and emission characteristicsassociated with phytoplankton pigment fluorescence, thecomposition of phytoplankton communities can be deter-mined (Yentsch and Phinney 1985; Lutz et al. 2001;Chekalyuk and Hafez 2008, 2013). Because of the distinctchlorophyte-like pigmentation, we suspected that N.
Fig. 1. (A) Microscopic image of Noctiluca miliaris collectedfrom the Arabian Sea in 2009. (B) Water sample collected fromthe surface waters in the Arabian Sea in 2009 showing the largebuoyant green N. miliaris cells. Photo credit J. Goes.
Noctiluca in the Arabian Sea 2043
miliaris would be discernible from diatoms and cyanobac-teria based upon not only its pigmentation (Letelier et al.1993; Roy et al. 2011), but its associated absorption spectra(Hoepffner and Sathyendranath 1993; Sosik and Mitchell1995; Johnsen et al. 2011), and hence its Chl a fluorescenceexcitation (Culver and Perry 1999; Lutz et al. 2001;Richardson et al. 2010) in the blue to green range.
Proctor and Roesler (2010) calibrated the response ofa multi-excitation (three-channel) Chl fluorometer to 13different species of phytoplankton under a range of growthphases and irradiance levels. They found that the majortaxonomic groups could be distinguished from each otherbased upon differential pigment composition. In this paperwe hypothesize that the pigmentation differences betweenN. miliaris and the diatoms and cyanobacteria previouslyfound in the northeastern Arabian Sea are sufficient todevelop a robust bio-optical proxy based upon multichan-nel excitation of Chl fluorescence. Using this proxy, weidentify the extent of N. miliaris populations in thenortheastern Arabian Sea in situ during the wintermonsoon and relate the population distribution to boththe hydrographic features and the spatial structure of thesatellite-derived Chl features. We further hypothesize thatthe distributions of N. miliaris will be associated with thebloom structures identified by high concentrations ofsatellite-derived Chl in the northeastern Arabian Seaduring the winter monsoon and that these populations willoccupy water masses with characteristics distinct fromother phytoplankton communities. In other words, whenN. miliaris is observed, it will be in high concentrations andwill exclude other phytoplankton groups within definedwater masses because of the competitive advantage that ithas by both feeding on phytoplankton and receivingphotosynthate from its symbionts.
Methods
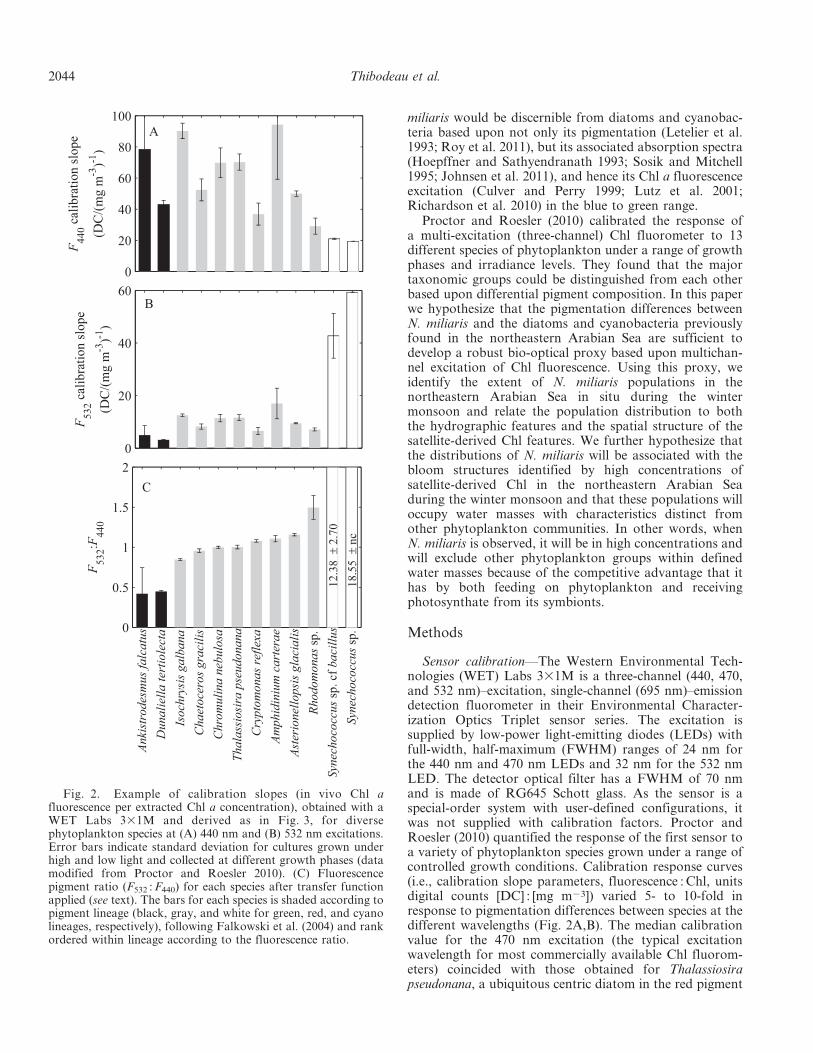
Sensor calibration—The Western Environmental Tech-nologies (WET) Labs 331M is a three-channel (440, 470,and 532 nm)–excitation, single-channel (695 nm)–emissiondetection fluorometer in their Environmental Character-ization Optics Triplet sensor series. The excitation issupplied by low-power light-emitting diodes (LEDs) withfull-width, half-maximum (FWHM) ranges of 24 nm forthe 440 nm and 470 nm LEDs and 32 nm for the 532 nmLED. The detector optical filter has a FWHM of 70 nmand is made of RG645 Schott glass. As the sensor is aspecial-order system with user-defined configurations, itwas not supplied with calibration factors. Proctor andRoesler (2010) quantified the response of the first sensor toa variety of phytoplankton species grown under a range ofcontrolled growth conditions. Calibration response curves(i.e., calibration slope parameters, fluorescence : Chl, unitsdigital counts [DC] : [mg m23]) varied 5- to 10-fold inresponse to pigmentation differences between species at thedifferent wavelengths (Fig. 2A,B). The median calibrationvalue for the 470 nm excitation (the typical excitationwavelength for most commercially available Chl fluorom-eters) coincided with those obtained for Thalassiosirapseudonana, a ubiquitous centric diatom in the red pigment
Fig. 2. Example of calibration slopes (in vivo Chl afluorescence per extracted Chl a concentration), obtained with aWET Labs 331M and derived as in Fig. 3, for diversephytoplankton species at (A) 440 nm and (B) 532 nm excitations.Error bars indicate standard deviation for cultures grown underhigh and low light and collected at different growth phases (datamodified from Proctor and Roesler 2010). (C) Fluorescencepigment ratio (F532 : F440) for each species after transfer functionapplied (see text). The bars for each species is shaded according topigment lineage (black, gray, and white for green, red, and cyanolineages, respectively), following Falkowski et al. (2004) and rankordered within lineage according to the fluorescence ratio.
2044 Thibodeau et al.
lineage. Dinoflagellates typically had higher calibrationslopes and cyanobacteria and chlorophytes had lowerslopes. In addition, the calibration slopes obtained for T.pseudonana were repeatable within 5% among calibrationsseparated by years as long as the growth conditions werereplicated. This provides a useful means for computing atransfer function between sensors, essentially adjusting fordifference in gain at each excitation wavelength. Afteradjustment by the transfer function, the species-specificcalibration factors obtained by Proctor and Roesler (2010)can be computed for any sensor with the same opticalconfiguration. We used this approach to recalibrate boththe original sensor (serial number SN 001) and a newersensor (SN 004), the latter of which was deployed in theArabian Sea.
An acclimated culture of T. pseudonana (CCMP 1335)was grown in sterile filtered L1 medium (a vitamin-, tracemetal–, and nutrient-enriched seawater; Guillard andHargraves 1993, as modified by Guillard and Morton2003) under controlled light conditions (12 : 12 light : darkcycle at 250 mmol photons m22 s21) and harvested inexponential growth at a concentration of approximately20 mg m23 Chl a. A series of 10 dilutions of the culture wasmade, starting with 100% culture and decreasing by afactor of two via dilution with the same filtered seawaterused for media. Two blanks were also run: BarnstadNanopureH water and the filtered seawater diluent.Subsamples from each of the 10 culture dilutions werefiltered for triplicate extractive Chl a analysis (Yentsch andMenzel 1963).
The absorption spectrum for the culture of T. pseudo-nana was determined spectrophotometrically from asubsample of the culture filtered onto a glass fiber filter(Whatman GF/F). The particulate absorption analysis was
performed on the Cary 300 UltraViolet visible spectro-photometer following Kishino et al. (1985) for separationof phytoplankton and non-algal particle absorption andRoesler (1998) for configuration and absorption calcula-tions. The absorption spectrum for T. pseudonana wasthen compared to that for previous calibrations ofinstrument SN 001 (Proctor and Roesler 2010) to ensureconsistent absorption ratios (within 5% coefficient ofvariation) at the fluorometer excitation wavelengthsbetween calibrations.
A type II regression analysis of the median fluorescencevalues for each wavelength at 440 nm, 470 nm, and 532 nmand the extracted Chl a concentrations for each dilutionwas performed (Fig. 3). The linear relationship is of theform Y 5 M 3 X + B, where Y is the observed fluorescence(units DC), X is the concentration of the calibrationcomponent Chl (mg m23), M is the slope of the response(DC : [mg m23]), and B is the y-intercept, representing thesignal from the media blank (DC). Instrumental darkvalues, Fdark (units DC), were measured with the opticalface of the sensor covered in electrical tape and submergedin the media as recommended by the manufacturer. Fromthis calibration, in situ Chl a concentration can beestimated from the sample fluorescence, Fsample, using theexpression
Chl a (mg m{3)~(Fsample{Fdark)�Mcal
ð1Þ
where Fdark is the dark reading of the sensor at the specificwavelength and Mcal is the calibration slope determined forthe T. pseudonana culture for that specific wavelength.Each time the sensor is used to quantify Chl, a media blankreading is collected using filtered sample (either from aculture or from the natural environment). The reading isprocessed as if it were a sample, the media-specific Chlvalue, which is subsequently removed from each samplevalue (Davis and Cullen 2003). Typically this value is notsignificantly different from zero; however, exceptions arefound, particularly in waters with high-colored dissolvedorganic matter (Proctor and Roesler 2010).
Transfer functions between sensors—Just as sensors arecalibrated through time to account for instrument drift, sotoo are multiple sensors intercalibrated with the samestandards to quantify and account for differences in gains(response curves) for each excitation/emission pair. Bycomputing the ratio of the gains for the T. pseudonanaculture, a transfer function between the two 331M sensors(SN 001 and SN 004) was computed at each wavelength(T1{2
l ):
T1{2l ~M1
l�M2
lð2Þ
where M1l and M2
l are the T. pseudonana calibration slopes,Mcal, for sensors 1 and 2 measured at the same excitationwavelength l. The transfer function is then applied tomeasured fluorescence observations of sensor 2 at wave-
length l, F2measl, so that the species calibration table of
Proctor and Roesler (2010) can be used to compute the
corrected fluorescence for sensor 2 at wavelength l, F 2corrl:
Fig. 3. Standard calibration curves for each excitationchannel of the WET Labs 331M sensor using a dilution seriesof Thalassiosira pseudonana. The y error bars represent thestandard deviation of a 60 s burst sample of raw fluorescence foreach dilution, and the x error bars represent the standarddeviation of triplicate extracted Chl a analyses for each dilution.Calibration slopes are computed from type II linear regression.
Noctiluca in the Arabian Sea 2045
F2corrl~F 2
measl|T1{2l ð3Þ
The transfer function serves to correct for differencesbetween sensors and also for a single sensor betweencalibrations if the gains are drifting. As new species areincluded in the calibration table it is necessary to tie themto a calibration with T. pseudonana or another referencespecies already in the table.
Although the fluorescence response (M for each species)varies between species depending upon excitation wave-length, the fluorescence ratios are statistically differentbetween the pigment lineages (Fig. 2C), and in some caseswithin lineages. The calibration slopes often do not groupby lineage (Fig. 2A,B), but the ratios clearly do. Thecalibrated fluorescence ratio F532 : F440 clearly exhibits verylow values for the green lineage relative to the red lineageof the diatoms and dinoflagellates, whereas that of thecyanophyte lineage exhibits very high values compared tothe red lineage. Given that the fluorescence ratios includesuch within-species pigment ratio variations associatedwith photoacclimation and growth phase (shown by error
bars), we predict that the fluorescence ratios associatedwith N. miliaris will be most similar to the green lineage andtherefore significantly different from the red and cyanolineages.
Field observations—In situ profiles of hydrographic andoptical observations as well as water samples were collectedat 13 stations aboard the R/V Sagar Sampada (SS286) from06 to 21 March 2011 in the northeastern Arabian Sea(Fig. 4). At each station, fluorescence profiles weremeasured in concert with a Falmouth Scientific Instru-ments Micro conductivity, temperature, depth sensor.Discrete water samples were collected via a Niskin rosettefor analyses of nutrients, pigments, absorption, andmicroscopy.
Nitrate, nitrite, phosphate, and silicate were determinedby autoanalysis. Pigment composition was determined byhigh-performance liquid chromatography (HPLC) by theNational Aeronautics and Space Administration’s FieldSupport Group. Spectrophotometric absorption of partic-ulates was measured using the quantitative filter technique(Mitchell 1990) as modified by Roesler (1998). Phytoplank-
Fig. 4. Seven-day composite images of (A,B) Chl a and (C,D) sea surface temperature (SST) from the NASA Moderate ResolutionImaging Spectroradiometer onboard the Aqua spacecraft (MODISA). We show two temporal ranges that combine to encompass the fieldcampaign: (A,C) 07–13 March 2011, encompassing Sta. 1 to 6, and (B,D) 13–19 March 2011, encompassing Sta. 7 to 13. We binned alldata to 2 km spatial resolution. We considered all valid MODISA Chl a and SST retrievals when generating these composite images.Black circles indicate in situ sampling stations. Regions of gray and black indicate land and no satellite retrievals, respectively. Weacquired these MODISA data from the NASA Ocean Biology Processing Group (OBPG) at Goddard Space Flight Center (http://oceancolor.gsfc.nasa.gov/cgi/browse.pl) and spatially and temporally binned the imagery using standard NASA OBPG software (http://oceancolor.gsfc.nasa.gov/seadas/).
2046 Thibodeau et al.
ton and non-algal fractions were determined by extraction(Kishino et al. 1985). Phytoplankton species were identifiedand quantified microscopically (Parab et al. 2006).
Results
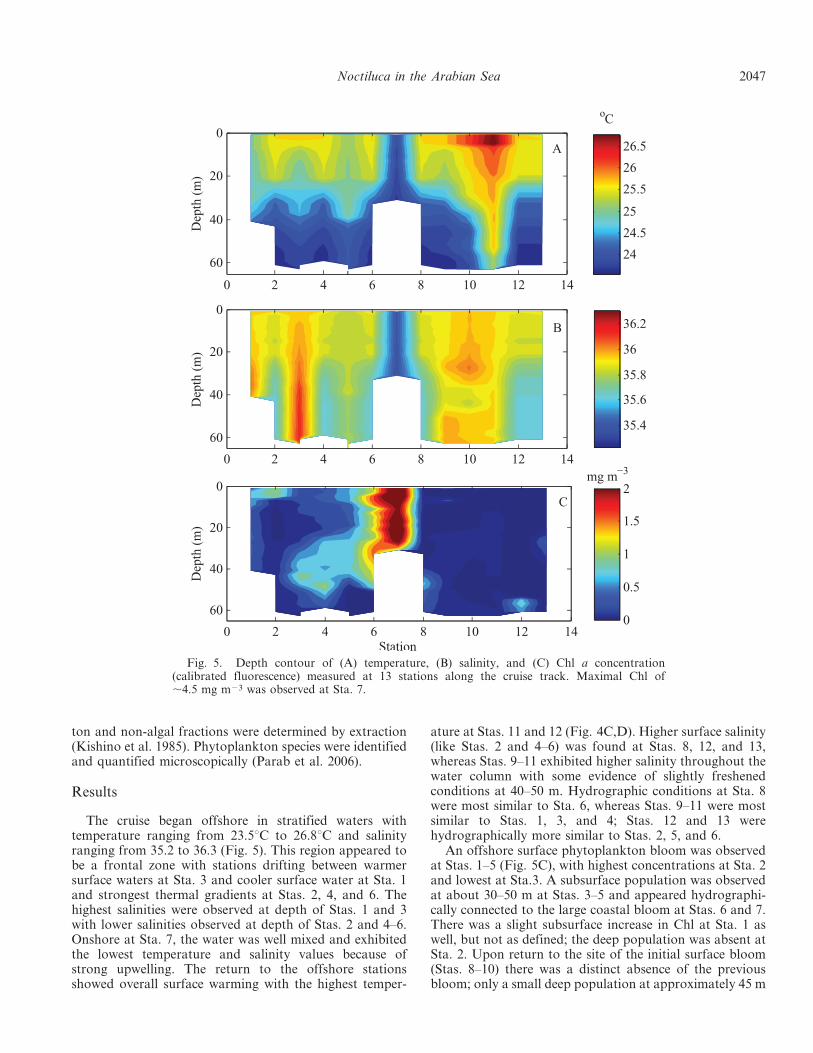
The cruise began offshore in stratified waters withtemperature ranging from 23.5uC to 26.8uC and salinityranging from 35.2 to 36.3 (Fig. 5). This region appeared tobe a frontal zone with stations drifting between warmersurface waters at Sta. 3 and cooler surface water at Sta. 1and strongest thermal gradients at Stas. 2, 4, and 6. Thehighest salinities were observed at depth of Stas. 1 and 3with lower salinities observed at depth of Stas. 2 and 4–6.Onshore at Sta. 7, the water was well mixed and exhibitedthe lowest temperature and salinity values because ofstrong upwelling. The return to the offshore stationsshowed overall surface warming with the highest temper-
ature at Stas. 11 and 12 (Fig. 4C,D). Higher surface salinity(like Stas. 2 and 4–6) was found at Stas. 8, 12, and 13,whereas Stas. 9–11 exhibited higher salinity throughout thewater column with some evidence of slightly freshenedconditions at 40–50 m. Hydrographic conditions at Sta. 8were most similar to Sta. 6, whereas Stas. 9–11 were mostsimilar to Stas. 1, 3, and 4; Stas. 12 and 13 werehydrographically more similar to Stas. 2, 5, and 6.
An offshore surface phytoplankton bloom was observedat Stas. 1–5 (Fig. 5C), with highest concentrations at Sta. 2and lowest at Sta.3. A subsurface population was observedat about 30–50 m at Stas. 3–5 and appeared hydrographi-cally connected to the large coastal bloom at Stas. 6 and 7.There was a slight subsurface increase in Chl at Sta. 1 aswell, but not as defined; the deep population was absent atSta. 2. Upon return to the site of the initial surface bloom(Stas. 8–10) there was a distinct absence of the previousbloom; only a small deep population at approximately 45 m
Fig. 5. Depth contour of (A) temperature, (B) salinity, and (C) Chl a concentration(calibrated fluorescence) measured at 13 stations along the cruise track. Maximal Chl of,4.5 mg m23 was observed at Sta. 7.
Noctiluca in the Arabian Sea 2047
at Sta. 8 was observed. The transect south evidenced twodiscrete populations, one at 60 m at Sta. 12 and a lowerconcentration at 35 m at Sta. 13. These populations werenot observed at neighboring stations but were observedwith two different Chl fluorometers, indicating that theywere likely not artifacts.
Nutrient concentrations were generally low, with thedepth of the nutricline mostly associated with the depth ofthe 25uC isotherm (Fig. 6). Both silicate and phosphatewere generally higher in the offshore stations the first week,decreasing by week 2. The surface waters were relativelydepleted in inorganic nitrogen relative to both silicate andphosphate; the latter was not observed to approach theRedfield molar ratio of 16 within the upper 60 m (Fig. 6C).
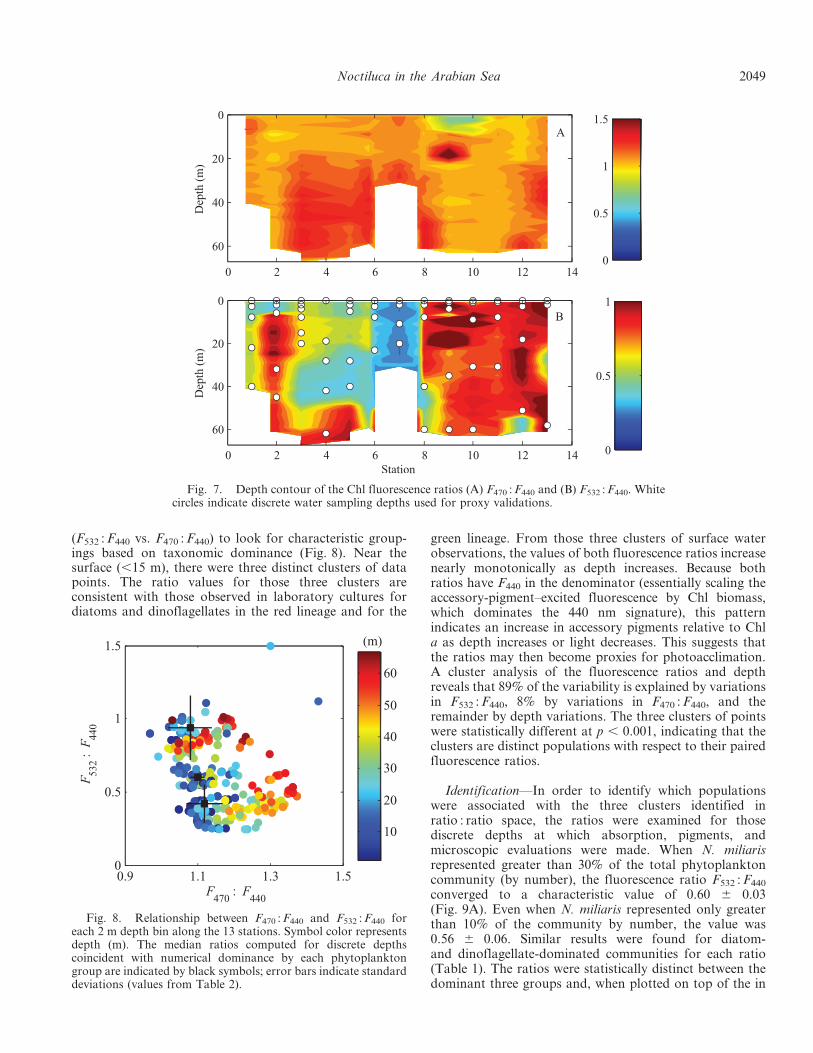
The fluorescence ratios provide insight into the phyto-plankton community composition (Fig. 7). Although thereis some spatial coherence between each ratio and somefeatures in the Chl distribution, neither ratio exhibits
coherence over the whole transect. The ratio of F470 : F440
generally increased with depth and ranged in value fromabout 0.8 to 1. The ratio of F532 : F440 had a much broaderrange, generally 0.25–0.8, although some higher valueswere observed in the lower biomass waters. The ratios forthe near-surface Chl patch in Stas. 1 and 2 were distinctfrom those observed in deeper populations and were moresimilar to the values offshore of the coastal upwellingstations. The mid-depths of Stas. 3–5 had a population thatdiffered significantly from the bordering population aboveand below it. The F532 : F440 values were consistently muchlarger and most similar to that found at depth at Sta. 2.Discrete populations were recognizable in the small patchesas observed at the bottom of Stas. 8 and 12 and at themiddle depths of Sta. 13.
Distribution of phytoplankton groups—Profile fluores-cence ratios in 2 m bins were plotted in ratio : ratio space
Fig. 6. Depth distribution of discrete (A) nitrate, (B) silicate, and (C) phosphateconcentrations (mmol L21) measured at 13 stations along the cruise track. (A) Black lineindicates the approximate top of the nitricline as determined by the maximal concentrationgradient. (B,C) Contours indicate three molar ratio values of nitrate to either silicate (0.5, 1.0, and2.0) or phosphate (1, 10, 16) concentrations; dashed, solid, and bold indicate lowest to highestmolar ratio values.
2048 Thibodeau et al.
(F532 : F440 vs. F470 : F440) to look for characteristic group-ings based on taxonomic dominance (Fig. 8). Near thesurface (,15 m), there were three distinct clusters of datapoints. The ratio values for those three clusters areconsistent with those observed in laboratory cultures fordiatoms and dinoflagellates in the red lineage and for the
green lineage. From those three clusters of surface waterobservations, the values of both fluorescence ratios increasenearly monotonically as depth increases. Because bothratios have F440 in the denominator (essentially scaling theaccessory-pigment–excited fluorescence by Chl biomass,which dominates the 440 nm signature), this patternindicates an increase in accessory pigments relative to Chla as depth increases or light decreases. This suggests thatthe ratios may then become proxies for photoacclimation.A cluster analysis of the fluorescence ratios and depthreveals that 89% of the variability is explained by variationsin F532 : F440, 8% by variations in F470 : F440, and theremainder by depth variations. The three clusters of pointswere statistically different at p , 0.001, indicating that theclusters are distinct populations with respect to their pairedfluorescence ratios.
Identification—In order to identify which populationswere associated with the three clusters identified inratio : ratio space, the ratios were examined for thosediscrete depths at which absorption, pigments, andmicroscopic evaluations were made. When N. miliarisrepresented greater than 30% of the total phytoplanktoncommunity (by number), the fluorescence ratio F532 : F440
converged to a characteristic value of 0.60 6 0.03(Fig. 9A). Even when N. miliaris represented only greaterthan 10% of the community by number, the value was0.56 6 0.06. Similar results were found for diatom-and dinoflagellate-dominated communities for each ratio(Table 1). The ratios were statistically distinct between thedominant three groups and, when plotted on top of the in
Fig. 7. Depth contour of the Chl fluorescence ratios (A) F470 : F440 and (B) F532 : F440. Whitecircles indicate discrete water sampling depths used for proxy validations.
Fig. 8. Relationship between F470 : F440 and F532 : F440 foreach 2 m depth bin along the 13 stations. Symbol color representsdepth (m). The median ratios computed for discrete depthscoincident with numerical dominance by each phytoplanktongroup are indicated by black symbols; error bars indicate standarddeviations (values from Table 2).
Noctiluca in the Arabian Sea 2049
situ 2 m binned observations, coincide with the threeclusters (Fig. 8).
In order to link the species composition to thefluorescence ratios via pigmentation, characteristic pig-mentation ratios were examined. Chl b in P. noctilucaesymbionts was expected to provide the strongest pigmentindicator of N. miliaris. A comparison between thepercentage N. miliaris by number and the Chl b : Chl aratio shows that there is a strong linear relationshipbetween Chl b and N. miliaris (Fig. 9B). The Chl b to Chla ratio observed for N. miliaris ranged from approximately0.05 to 0.2 (mg Chl b : mg Chl a) and appeared as twodifferent groupings with similar slope but differentintercept values (approximately 0.08 and 0.14 [mg Chlb : mg Chl a]). These roughly correspond to surface anddeep stations (i.e., high-light and low-light conditions,respectively). However, presence of N. miliaris alone is notsufficient to explain Chl b concentrations. In fact, therewere seven samples with ratios above 0.15 that had no N.miliaris, indicating the presence of other Chl b–containingtaxa. Interestingly, this other Chl b–containing communitydid not have the same fluorescence ratio signature as N.miliaris and thus would not be misidentified optically.
The discrete samples were separated according tomicroscopic dominance by N. miliaris, diatoms, anddinoflagellates and the associated phytoplankton absorp-
tion spectra distinguished by dominant group (Fig. 10).The absorption spectra cluster significantly according tomicroscopic evaluation, with N. miliaris-dominated sam-ples exhibiting the highest blue to red absorption peak ratioand the steepest blue to green slope (e.g., 440–532 nm),followed by the dinoflagellates, then the diatoms. Thesystematic decrease in blue to green absorption slope iscomparable to a systematic increase in green to blueabsorption or accessory to Chl a pigment absorption. Thusthe clustering observed in the fluorescence ratios isconsistent with the clustering observed in absorptionspectra.
Application—Starting with the characteristic F470 : F440
and F532 : F440 values determined for the samples withnearly pure community composition (Table 1) and extend-ing those values to the depth_dependent clusters identifiedin ratio : ratio space (three clusters identified in Fig. 8),each 2 m bin of the in situ fluorescence profiles wasassigned a dominant taxonomic group (Fig. 11). A generalcharacterization of the stations sampled in the Arabian Seaas a function of depth and station indicated that there wasan evident species shift from the beginning offshore stationsto the ending offshore stations. N. miliaris was prevalent atthe surface and mid-depths of all beginning offshore Stas.1–5, except Sta. 2, whereas diatoms primarily characterizedthe deep populations of those stations (except at Stas. 1 and2) and dominated the high-biomass coastal upwelling Stas.6 and 7. The return to the offshore bloom (Stas. 8–10)yielded warm and salty stratified waters, quite differentconditions of very low Chl concentrations, and a commu-nity dominated by dinoflagellates. The very same Chl andcommunity characteristics were observed at Sta. 2 the weekbefore. A remnant of the N. miliaris underlain by diatomswas observed below 40 m at Sta. 8.
Fluorometrically, cyanobacteria were identified in a fewlocations; however, some species are too small to identifymicroscopically for direct validation. An examination ofthe HPLC-derived pigment composition in those regionsindicated the presence of the pigment zeaxanthin, poten-
Table 1. Characteristic median and standard deviationfluorescence ratios for the three major taxonomic groupsobserved at depths coincident with discrete samples analyzedmicroscopically. Noctiluca miliaris values computed for caseswhen dominance exceeded 30% by cell number (Fig. 9A). Diatomand dinoflagellate values computed for cases when dominanceexceeded 60% of population and sample depths were shallowerthan 30 m.
Phytoplankton group F532 : F440 F470 : F440
N. miliaris 0.6060.03 1.1060.02Diatom 0.4260.13 1.1260.05Dinoflagellate 0.9460.22 1.0860.06
Fig. 9. (A) Chl fluorescence ratio F532 : F440 and (B) HPLC-determined pigment ratio of Chl b : Chl a as a function of percentageN. miliaris by cell number.
2050 Thibodeau et al.
tially indicating the existence of phytoplankton of the blue-green pigment class (most likely cyanobacteria) at thesespecific locations. However, biomass was very low in thesewaters, and thus the signal to noise ratio was larger.Although zeaxanthin is not unique to cyanobacteria andcould therefore be indicative of other species, the highfluorescence ratios support some cyanobacterial presence.
Validation—Modeled fluorescence data were comparedto measured microscopy data to confirm successfultaxonomic identification at the discrete sample locations(Table 2). The fluorescence ratios falsely indicated thedominance of N. miliaris on two occasions; in one of thosesamples N. miliaris was a large portion of the communitynumerically, and, because of its large size, likely was
optically dominant. In no case was a population of N.miliaris present and not identified by the fluorescencesignatures. Fluorescence distinguished dominant taxonom-ic group 80% of the time, and of the 20% for whichfluorescence-based dominance did not match microscopi-cally measured dominance, it occurred either in very-low-biomass areas emitting limited fluorescence signal, or, in 7of the 12 cases, there was a significant contribution by thegroup identified fluorometrically. It is notable that thediatoms are distinguishable from dinoflagellates by thisapproach despite somewhat similar absorption spectra, aresult consistent with those of Proctor and Roesler (2010).Only eight of the discrete water samples identified N.miliaris microscopically, but fluorescence identified contin-uous populations, most of which were missed by the low-
Fig. 10. Phytoplankton absorption spectra scaled to Chl a absorption peak at 676 nm.Spectra are color coded based upon dominance by taxonomic group determined microscopically:diatoms (blue), dinoflagellates (red), and N. miliaris (green). Average spectra for each group areshown in black.
Fig. 11. Spatial distribution and dominance of N. miliaris and other taxonomic groups as predicted by the paired Chl fluorescenceratios. Each symbol represents a 2 m depth bin.
Noctiluca in the Arabian Sea 2051
resolution water sampling, such as the deep populations atSta. 3 and 5.
Distribution of N. miliaris—The distribution for N.miliaris predicted by the fluorescence ratio proxy suggestssome continuous hydrographic region along Stas. 1, 3–5,which is tightly linked to distribution of diatoms in thehigher biomass regions but transitions to dinoflagellates asbiomass decreases. However, these features are not soclearly outlined in the satellite-derived Chl image, as Sta. 2does not appear to be significantly different from Stas. 1 or3 whereas Sta. 5 does appear to be a separate feature. Thereturn track exhibits large variations in the Chl features fromSta. 8 to Sta. 13, which are lower Chl concentrations butappear to be dominated by a single group (dinoflagellates).
Hydrographically, N. miliaris are not uniquely found inwaters of distinct temperature or salinity ranges (Fig. 12)although the observed ranges are narrower than for theother detected groups. With the exception of two datapoints, the temperature range is about 24.25–25.5uC andthe salinity range is 35.75–36.25. But within these sametemperature and salinity ranges the other three planktongroups are observed to be dominant at some locationswithin the cruise transect.
A cluster analysis of the discrete observations ofnutrients, hydrography (temperature and salinity), andmicroscopic cell concentrations of the three phytoplanktongroups (log transformed) indicates that 83% of thevariability in the distribution of the phytoplankton groupscan be explained by two components (Fig. 13). Diatomsappear to be more covariant with colder waters that havehigher nutrient concentrations, whereas N. miliaris andother dinoflagellates appear to covary and prefer the highersalinity waters that are characterized by low N : P ratios.
Discussion
A three-wavelength excitation Chl fluorometer, of a typethat was previously calibrated to quantify the Chl-specificfluorescence response (i.e., the calibration slope) for 13species in the laboratory (Proctor and Roesler 2010), wasdeployed in the Arabian Sea with the goal to develop afluorescence-ratio–based optical proxy for the elusivedinoflagellate N. miliaris. Isolation of the Arabian Sea N.miliaris strain is challenging (S. Parab pers. comm.) and thesymbiotic relationships observed in the Arabian Sea andadjacent regions are likely to vary tremendously dependingupon environmental conditions (Saito et al. 2006; Sriwoonet al. 2008). Considering these constraints we used an insitu approach to develop the fluorescence ratio proxy for N.miliaris, statistically determining the ratio from sampledepths at which it numerically dominated the phytoplank-ton community. Because of its exceedingly large size (andhence absorption cross section) the fluorescence proxyvalues were statistically significant above a numericaldominance of 10% of the total population.
A significant outcome of this analysis was the capabilityof using this approach to statistically distinguish diatoms
Table 2. Validation of modeled vs. measured taxonomicidentification. Comparison between the modeled phytoplanktongroup estimated from the fluorescence ratio proxy and themeasured phytoplankton group determined by microscopy.Numbers in bold indicate the number of groups identified thatmatched the modeled and measured data. Numbers in parenthesesindicate number of cases for which the measured community hadsignificant contributions by the predicted dominant group.
Modeled : measured N. miliaris Diatom Dinoflagellate
Fig. 12. Temperature–salinity diagram for the 2 m binaveraged values observed along the cruise transect. Symbols arecoded by dominant phytoplankton groups as in Fig. 11.
Fig. 13. Cluster analysis of discrete observations of temper-ature, salinity, nutrients, and log-transformed microscopic cellcounts grouped into diatoms, non-Noctiluca dinoflagellates, andNoctiluca. Eighty-three percent of the variation is explained by thefirst two components.
2052 Thibodeau et al.
from dinoflagellates, although because of the overallsmaller cell diameters and absorption cross sections, theproxy values were determined when each group was foundin a higher percentage of numerical dominance. Although ithas been previously demonstrated that certain species ofdiatoms and dinoflagellates were distinguishable underlaboratory culture conditions (Proctor and Roesler 2010),extending these results to the field with mixed communitiesand a range of environmental conditions is encouraging.The pigment differences between the green and red lineagephytoplankton groups is significant, whereas the predom-inant pigmentation differences between diatoms anddinoflagellates are in their carotenoids (fucoxanthin andperidinin), which have somewhat similar absorption spectra(Roy et al. 2011).
The strength of the fluorescence ratio optical proxyapproach is the capability for direct observation of thedistribution of target phytoplankton species and/or pigment-based phytoplankton functional types (PFTs) measured ontime and space scales consistent with hydrographic obser-vations and on scales relevant to the ecological andphysiological process of the phytoplankton. As targetspecies and communities transition between dominance byone group over another, the continuous evolution of theproxy values from one to another provides the context forsingle observations. In situ validation improves confidencein the proxy signal.
The capability for discerning the depth distribution ofphytoplankton groups via an optical proxy yields anapproach for rapidly assessing phytoplankton populationsfrom remote platforms such as moorings, floats, andgliders, among others, and can provide the necessaryvalidation data sets for the next generation of ocean colorsensors, such as the hyperspectral radiometer that isexpected to comprise the National Aeronautics and SpaceAgency’s Pre-Aerosol Clouds and Ocean Ecosystemmission (decadal.gsfc.nasa.gov/pace.html). Hyperspectralremote sensing promises to improve capabilities fordetermining pigment-based PFTs but requires depthdistributions of phytoplankton populations to validateinversion algorithms (Werdell et al. 2014). Such validationdata sets have been difficult to match up to satelliteobservations historically (Werdell and Bailey 2005) but areprogressing with improved bio-optical observations andproxies for phytoplankton community structure (Werdellet al. 2013).
The continuous profiles of the fluorescence ratios in theArabian Sea were instrumental in revealing informationabout the distribution and dynamics of the species N.miliaris with respect to the phytoplankton community. Theapproach allowed us to separate phytoplankton groups insitu as a function of depth. At the same time, we observedthat within the range for a specific species or phytoplank-ton group, both fluorescence ratios increased as depthincreased, consistent with the photoacclimation strategy ofpreferential increase in accessory pigments relative to Chl aas incident irradiance decreased. That the taxonomicdistinctions remained separated as photoacclimation oc-curred indicates the robustness of the approach and theability to use it as a means of assessing acclimation history
temporally. Other environmental conditions that affectpigment composition, such as nutrient limitation andstarvation (Henriksen et al. 2002), are also likely to yieldvariations in proxy values and by inversion provide additionalphysiological information under certain conditions.
Contrary to our hypotheses, the populations of N.miliaris were not uniquely associated with a particularwater mass or water characteristics. The temperature andsalinity ranges in which N. miliaris was found werenarrower than but encompassed the ranges identified forphytoplankton communities dominated by diatoms anddinoflagellates, with the exception of the strong upwellingconditions at Sta. 7. However, it was determined thatgradients in phytoplankton composition somewhat corre-sponded with biomass gradients—that is, as the ship movedout of the original blooms and later returned to itsremnants, there was a decrease in biomass as well as ashift in the dominant phytoplankton community and asbiomass decreased with depth, there was often a change inphytoplankton dominance.
The R/V Sagar Sampada cruise began by entering into alarge N. miliaris bloom that was predominantly at thesurface and mid-depth waters. These waters are typicallyoligotrophic and maximal Chl concentrations were,2 mg m23. A large bloom of diatoms appeared about300 km from shore at a depth of 40–50 m at Stas. 3, 4,and 5 and Sta. 8 a week later. These offshore diatompopulations were associated with the N. miliaris popula-tions but separated by depth. This diatom populationappeared contiguous with the large bloom in the upwellingalong the Gujarat coast.
The exception to this pattern was observed at Sta. 2, alocation that was identified at the time as the ship driftingout of the bloom. This station was characterized by verydifferent hydrography compared to Stas. 1 and 3, and asmall surface diatom population was underlain by very lowChl concentrations dominated by dinoflagellates. Fromsatellite this station was shown to be located at the edge ofthe bloom, and the conditions of Sta. 2 were remarkablysimilar to those observed at Stas. 4, 6, and 8, albeit withmuch lower Chl concentrations and very different phyto-plankton composition. A week later the remaining tendrilsof enhanced satellite-detected Chl were associated with lowconcentrations of dinoflagellates and the vestige of a deepdiatom population likely extending from the coastalupwelling bloom. Because the phytoplankton compositiontransitioned from N. miliaris to other dinoflagellates uponreturning to the offshore stations, we suggest that the N.miliaris bloom had terminated by this time, allowing theprevalence of other species to occupy the water column.The presence of salps, with N. miliaris cells observed intheir guts, confirmed that the original N. miliaris bloomhad evolved to a demise stage.
Satellite observations confirm a declining bloom featurefrom the first to the second weeks of the field campaign aswell as significant warming of the surface waters. However,there is nothing in the remotely sensed Chl features thatwould indicate the transitions in phytoplankton dominance.An analysis of these features using semi-analytical inversionof remotely sensed reflectance suggested that N. miliaris
Noctiluca in the Arabian Sea 2053
populations appear on the fringes of diatom blooms (P. J.Werdell unpubl.), features that are easily missed bytraditional shipboard sampling, but were captured in thecontinuous profiles of multichannel fluorescence. That N.miliaris was observed in the transition zones between well-developed diatom blooms and the low concentrations ofdinoflagellate populations in the oligotrophic regionssuggests a sequencing of the three groups that plays outboth temporally at a single location and spatially at anygiven time. N. miliaris may be at once both grazing upon thedeclining diatom bloom and expanding its distribution inlow N : P waters by secreting ammonia into the cytoplasm toalleviate nitrogen stress in its symbionts. Both processes aresupported by the observations here.
Thus three distinct ecological regions are identified: (1)the initial N. miliaris bloom associated with satellite-derived Chl features, located in cooler and saltier watersto about 40 m; (2) diatom populations associated with thecolder and fresher coastal upwelling features and theoffshore extensions of those blooms, which are adjacentto the N. miliaris bloom initially and the dinoflagellatepopulations in later stages; and (3) the dinoflagellate-dominated community inhabiting the fringes of thesatellite-derived Chl features and into the increasinglystratified, oligotrophic waters characterized by very warmand salty waters. The latter populations are found in thesame salinity ranges as N. miliaris but in warmertemperatures. In this region the warmer temperatures arelikely proxies for age of the bloom in stratified watersas temperatures of the surface increase with time. Thus,the transitions between phytoplankton communities arenot necessarily associated with hydrographic featuresor processes such as mixing and stratification, but areindicative of the temporal evolution of species succession.
That said, there are limitations to identifying changes inN. miliaris dominance both through the fluorescence proxyand through satellite imagery. N. miliaris is no longeridentifiable once it sheds its symbionts, having lost itspigments and therefore its fluorescence proxy. N. miliarisidentification by satellite is limited to the upper depths ofthe water column, emphasizing the need for in situvalidation such as fluorescence proxies. Although N.miliaris is not an active vertical migrator, its ability tosecrete ammonia and maintain positive buoyancy prolongsits exposure to surface water while it is in its growth phase.Satellite imagery provides insights into phytoplanktondynamics that cannot be determined by traditional in situsampling methods and indicates specific places and timesfor target species activity (Werdell et al. 2014; P. J. Werdellunpubl.). Information obtained from satellite is used inconjunction with the fluorescence proxy to understandwidespread trends of N. miliaris distribution.
Although the oxygen data are not available, comparingthe oxygen levels between the beginning and endingoffshore stations would be significant in consideringwhether N. miliaris inhabits low-dissolved-oxygen watersand/or exacerbates low-oxygen zones by creating largeareas of decomposition and subsequent oxygen utilizationat depth during its decay. Because N. miliaris’ supportiveenvironment continues to widen because of increasing
oxygen minimum zones as well as the expanding zoneaffected by agricultural runoff from the Indian subconti-nent (D’Silva et al. 2012), having continuous observation ofN. miliaris will be extremely important in the immediateand near future in order to best understand the anthropo-genic and natural mechanisms supporting this species.
Contrary to our hypothesis, the populations of N.miliaris did not necessarily correspond with high-biomassfeatures detected from satellite. Although the highestbiomass was typically associated with the diatom popula-tion (driven largely but not exclusively by the coastalupwelling stations), the next highest biomass regions wereassociated with N. miliaris and the lowest with dinoflagel-lates. There was not, however, a clear demarcation inphytoplankton group dominance that corresponded exclu-sively to the Chl features identified in the remotely sensedimagery, suggesting that phytoplankton composition in thisregion did not strictly control total biomass. In otherwords, biomass was not a robust marker of composition ashas been found for other species such as Karenia brevis inthe waters around Florida (Stumpf et al. 2003). Thisimplies that remote sensing approaches to detect N. miliariscannot rely on biomass indicators but must incorporatespectral signatures associated with pigment absorptionfeatures and perhaps reduced backscattering efficienciesfound in large, strongly absorbing phytoplankton cells(Cannizzaro et al. 2008).
AcknowledgmentsFunding provided by National Aeronautics and Space
Administration Ocean Biology and Biogeochemistry Program.Bowdoin College Grua and O’Connell award provided funds fortravel to present this research at the 2013 Association for theSciences of Limnology and Oceanography Conference. Specialthanks to the captain and crew of the R/V Sagar Sampada fortheir dedicated efforts. P. Thibodeau wishes to thank herundergraduate honors thesis committee members, Rachel Beaneand Michele LaVigne, for comments on earlier versions of themanuscript. Two anonymous reviewers provided helpful com-ments, for which we are very grateful.
References
BANSE, K., AND D. C. ENGLISH. 2000. Geographical differences inseasonality of CZCS-derived phytoplankton pigment in theArabian Sea for 1978–1986. Deep-Sea Res. II 47: 1623–1677,doi:10.1016/S0967-0645(99)00157-5
BROCK, J. C., C. R. MCCLAIN, D. M. ANDERSON, W. L. PRELL, AND
W. W. HAY. 1992. Southwest monsoon circulation andenvironments of recent planktonic foraminifera in theNorthwestern Arabian Sea. Paleoceanography 7: 799–813,doi:10.1029/92PA01267
CANNIZZARO, J. P., K. L. CARDER, F. R. CHEN, C. A. HEIL, AND G.A. VARGO. 2008. A novel technique for detection of the toxicdinoflagellate, Karenia brevis, in the Gulf of Mexico fromremotely sensed ocean color data. Cont. Shelf Res. 28:137–158, doi:10.1016/j.csr.2004.04.007
CHAGHTAI, F., AND S. M. SAIFULLAH. 2006. On the occurrence ofgreen Noctiluca scintillans blooms in coastal waters ofPakistan, North Arabian Sea. Pak. J. Bot. 38: 893–898.
CHEKALYUK, A. M., AND M. A. HAFEZ. 2008. Advanced laserfluorometry of natural aquatic environments. Limnol. Ocean-ogr.: Methods 6: 591–609, doi:10.4319/lom.2008.6.591
———, AND ———. 2013. Analysis of spectral excitation formeasurements of fluorescence constituents in natural waters.Opt. Express 21: 29255–29268, doi:10.1364/OE.21.029255
CULVER, M. E., AND M. J. PERRY. 1999. The response ofphotosynthetic absorption coefficients to irradiance in cultureand in tidally mixed estuarine waters. Limnol. Oceanogr. 44:24–36, doi:10.4319/lo.1999.44.1.0024
DAVIS, R. F., AND J. J. CULLEN. 2003. The blank can make a bigdifference in oceanographic measurements. Limnol. Ocean-ogr. Bull. 12: 29–35.
D’SILVA, M. S., A. C. ANIL, R. K. NAIK, AND P. M. D’COSTA. 2012.Algal blooms: A perspective from the coasts of India. Nat.Hazards 63: 1225–1253, doi:10.1007/s11069-012-0190-9
FALKOWSKI, P. G., M. E. KATZ, A. H. KNOLL, A. QUIGG, J. A.RAVEN, O. SCHOFIELD, AND F. J. R. TAYLOR. 2004. Theevolution of modern eukaryotic phytoplankton. Science 305:354–360, doi:10.1126/science.1095964
FURUYA, K., AND OTHERS. 2006. Persistent whole-bay red tide ofNoctiluca scintillans in Manila Bay, Philippines. Coastal Mar.Sci. 30: 74–79.
GARRISON, D. L., M. M. GOWING, AND M. P. HUGHES. 1998.Nano- and microplankton in the northern Arabian Sea duringthe southwest monsoon, August–September 1995 A US-JGOFS study. Deep-Sea Res. II 45: 2269–2299, doi:10.1016/S0967-0645(98)00071-X
GOES, J. I., P. G. THOPPIL, H. D. R. GOMES, AND J. T. FASULLO.2005. Warming of the Eurasian landmass is making theArabian Sea more productive. Science 308: 345–347,doi:10.1126/science.1106610
GOMES, H. D. R., S. G. P. MATONDKAR, S. G. PARAB, J. I. GOES, S.PEDNEKAR, A. R. N. AL-AZRI, AND P. G. THOPILL. 2008.Unusual blooms of green Noctiluca miliaris (Dinophyceae) inthe Arabian Sea during the winter monsoon. Geophys.Monogr. Ser. 185: 347–363.
GUILLARD, R. R. L., AND P. E. HARGRAVES. 1993. Stichochrysisimmobilis is a diatom, not a chrysophyte. Phycologia 32:234–236, doi:10.2216/i0031-8884-32-3-234.1
———, AND S. L. MORTON. 2003. Culture methods, p. 77–97. InG. M. Hallegraeff, D. M. Anderson, and A. D. Cembella[eds.], Manual on harmful marine microalgae. UNESCO.
HANSEN, P. J., L. MIRANDA, AND R. AZANZA. 2004. Green Noctilucascintillans: A dinoflagellate with its own greenhouse. Mar.Ecol. Prog. Ser. 275: 79–87, doi:10.3354/meps275079
HARRISON, P. J., AND OTHERS. 2011. Geographical distribution ofred and green Noctiluca scintillans. Chin. J. Oceanol. Limnol29: 807–831, doi:10.1007/s00343-011-0510-z
HENRIKSEN, P., H. K. BORIEMANN, H. M. SØRENSEN, AND H. L.SØRENSEN. 2002. Effects of nutrient-limitation and irradianceon marine phytoplankton pigments. J. Plankton Res 24:835–858, doi:10.1093/plankt/24.9.835
HOEPFFNER, N., AND S. SATHYENDRANATH. 1993. Determination ofthe major groups of phytoplankton pigments from theabsorption of total particulate matter. J. Geophys. Res 98:22789–22803, doi:10.1029/93JC01273
HUOT, Y., AND M. BABIN. 2010. Overview of fluorescence protocols:Theory, basic concepts, and practice, p. 31–74. In D. Suggett, M.A. Borowitzka, and O. Prasil [eds.], Chlorophyll a fluorescencein aquatic science: Methods and applications. Developments inapplied phycology, v. 4. Springer.
JOHNSEN, G., M. A. MOLINE, L. H. PETERSON, J. PINCKNEY, D. V.POZDNYAKOV, E. S. EGELAND, AND O. SCHOFIELD. 2011. Opticalmonitoring of phytoplankton bloom pigment signatures,p. 538–581. In S. Roy, E. K. Egeland, C. Llewellyn, and G.Johnsen [eds.], Phytoplankton pigments: Updates on charac-terization, chemotaxonomy and application in oceanography.Cambridge Univ. Press.
KAHN, N., AND E. SWIFT. 1978. Positive buoyancy through ioniccontrol in the nonmotile marine dinoflagellate Pyrocystisnoctiluca Murray ex Schuett. Limnol. Oceanogr. 23: 649–658,doi:10.4319/lo.1978.23.4.0649
KIØRBOE, T., AND J. TITELMAN. 1998. Feeding, prey selection andprey encounter mechanisms in the heterotrophic dinoflagel-late Noctiuca scintillans. J. Plank. Res. 20: 1615–1636,doi:10.1093/plankt/20.8.1615
KISHINO, M., N. OKAMI, AND S. ICHIMURA. 1985. Estimation of thespectral absorption coefficients of phytoplankton in the sea.Bull. Mar. Sci. 37: 634–642.
LATASA, M., AND R. R. BIDIGARE. 1998. A comparison ofphytoplankton populations of the Arabian Sea during thespring intermonsoon and southwest monsoon of 1995 asdescribed by HPLC-analyzed pigments. Deep-Sea Res. II 45:2133–2170, doi:10.1016/S0967-0645(98)00066-6
LETELIER, R. M., R. R. BIDIGARE, D. V. HEBEL, M. ONDRUSEK,C. D. WINN, AND D. M. KARL. 1993. Temporal variability ofphytoplankton community structure based on pigmentanalysis. Limnol. Oceanogr. 38: 1420–1437, doi:10.4319/lo.1993.38.7.1420
LIRDWITAYAPRASIT, T., P. CHUABKARNRAI, C. NITITHAMYONG, AND
K. FURUYA. 2012. Effect of salinity on vertical migration ofgreen Noctiluca under laboratory conditions. Coastal Mar.Sci. 35: 70–72.
———, S. MEKSUMPUN, S. RUNGSUPA, AND K. FURUYA. 2006.Seasonal variations in cell abundance of Noctiluca scintillansin the coastal water off Chonburi, Province, the upper Gulf ofThailand. Coastal Mar. Sci. 30: 80–84.
LUTZ, V. A., S. SATHYENDRANATH, E. J. H. HEAD, AND W. D. W.LI. 2001. Changes in the in vivo absorption and fluorescenceexcitation spectra with growth irradiance in three species ofphytoplankton. J. Plankton Res. 23: 555–569, doi:10.1093/plankt/23.6.555
MADHU, N. V., R. JYOTHIBABU, P. A. MAHESWARAN, K. A.JAYARAJ, AND C. T. ACHUTHANKUTTY. 2012. Enhancedchlorophyll a and primary production in the northernArabian Sea during the spring intermonsoon due to greenNoctiluca scintillans bloom. Mar. Biol. Res. 8: 182–188,doi:10.1080/17451000.2011.605143
MADHUPRATAP, M. 1999. Free-living copepods of the Arabian Sea:Distributions and research perspectives. Indian J. Mar. Sci.28: 146–149.
MITCHELL, B. G. 1990. Algorithms for determining the absorptioncoefficient for aquatic particulates using the quantitative filtertechnique. Proc. SPIE 1302, Ocean Opt. X 1302: 137–148,doi:10.1117/12.21440
PARAB, S. G., S. G. P. MATONDKAR, H. D. R. GOMES, AND J. I.GOES. 2006. Monsoon driven changes in phytoplanktonpopulations in the eastern Arabian Sea as revealed bymicroscopy and HPLC pigment analysis. Cont. Shelf Res.26: 2538–2558, doi:10.1016/j.csr.2006.08.004
PROCTOR, C. W., AND C. S. ROESLER. 2010. New insights onobtaining phytoplankton concentration and compositionfrom in situ multispectral chlorophyll fluorescence. Limnol.Oceanogr.: Methods 8: 695–708, doi:10.4319/lom.2010.8.695
RICHARDSON, T. L., E. LAWRENZ, J. L. PINCKNEY, R. C. GUAJARDO,E. A. WALKER, H. W. PAERL, AND H. L. MACINTYRE. 2010.Spectral fluorometric characterization of phytoplanktoncommunity composition using the algae online analyzer.Water Res. 44: 2461–2472, doi:10.1016/j.watres.2010.01.012
ROESLER, C. S. 1998. Theoretical and experimental approaches toimprove the accuracy of particulate absorption coefficientsfrom the quantitative filter technique. Limnol. Oceanogr. 43:1649–1660, doi:10.4319/lo.1998.43.7.1649
ROY, S., C. A. LLEWELLYN, E. S. EGELAND, AND G. JOHNSEN. 2011.Phytoplankton pigments: Characterization, chemotaxonomy,and applications in oceanography. Cambridge EnvironmentalChemistry Series.
SAITO, H., K. FURUYA, AND T. LIRDWITAYAPRASIT. 2006. Photoau-totrophic growth of Noctiluca scintillans with the endosym-biont Pedinomonas noctilucae. Plankton Benthos Res. 1:97–101, doi:10.3800/pbr.1.97
SAWANT, S., AND M. MADHUPRATAP. 1996. Seasonality andcomposition of phytoplankton in the Arabian Sea. Curr.Sci. 71: 869–873.
SHALAPYONOK, A., R. J. OLSON, AND L. S. SHALAPYONOK. 2001.Arabian Sea phytoplankton during southwest and northeastmonsoons 1995: Composition, size structure and biomassfrom individual cell properties measured by flow cytometry.Deep-Sea Res. II 48: 1231–1261, doi:10.1016/S0967-0645(00)00137-5
SOSIK, H. M., AND B. G. MITCHELL. 1995. Light absorption byphytoplankton, photosynthetic pigments and detritus in theCalifornia Current System. Deep-Sea Res. I 42: 1717–1748,doi:10.1016/0967-0637(95)00081-G
SRIWOON, R., P. PHOLPUNTHIN, T. LIRDWITAYAPRASIT, M. KISHINO,AND K. FURUYA. 2008. Population dynamics of greenNoctiluca scintillans (Dinophyceae) associated with themonsoon cycle in the upper Gulf of Thailand. J. Phycol 44:605–615, doi:10.1111/j.1529-8817.2008.00516.x
STUMPF, R. P., AND OTHERS. 2003. Monitoring Karenia brevisblooms in the Gulf of Mexico using satellite ocean colorimagery and other data. Harmful Algae 2: 147–160,doi:10.1016/S1568-9883(02)00083-5
WAJIH, S., A. NAQVI, H. NAIK, D. A. JAYAKUMAR, M. S. SHAILAJA,AND P. V. NARVEKAR. 2006. Seasonal oxygen deficiency overthe western continental shelf of India, p. 195–224. In L. N.Neretin [ed.], Past and present water column anoxia. NATOscience series: IV: Earth and environmental sciences. Springer.
WERDELL, P. J., AND S. W. BAILEY. 2005. An improved in-situ bio-optical data set for ocean color algorithm development andsatellite data product validation. Remote Sens. Environ 98:122–140, doi:10.1016/j.rse.2005.07.001
———, C. W. PROCTOR, E. BOSS, T. LEEUW, AND M. OUHSSAIN.2013. Underway sampling of marine inherent optical proper-ties on the Tara Oceans expedition as a novel resource forocean color satellite data product validation. MethodsOceanogr 7: 40–51, doi:10.1016/j.mio.2013.09.001
———, C. S. ROESLER, AND J. I. GOES. 2014. Discrimination ofphytoplankton functional groups using an ocean reflectanceinversion model. Appl. Opt. 53: 4833–4849, doi:10.1364/AO.53.004833
WESTBERRY, T. K., AND D. A. SIEGEL. 2006. Spatial and temporaldistribution of Trichodesmium blooms in the world’s oceans.Global Biogeochem. Cycles 20: GB4016, doi:10.1029/2005GB002673
WIGGERT, J., D. R. R. HOOD, K. BANSE, AND J. C. KINDLE. 2005.Monsoon-driven biogeochemical processes in the ArabianSea. Prog. Oceanogr. 65: 176–213, doi:10.1016/j.pocean.2005.03.008
YENTSCH, C. S., AND C. W. MENZEL. 1963. A method for thedetermination of phytoplankton chlorophyll and phaeophytinby fluorescence. Deep-Sea Res. 10: 221–231.
———, AND D. A. PHINNEY. 1985. Spectral fluorescence: Anataxonomic tool for studying the structure of phytoplanktonpopulations. J. Plankton Res. 7: 617–632, doi:10.1093/plankt/7.5.617