Locating Sources of PQ disturbance using an Artificial Neural Network. Edward Bentley Director of Studies: Ghanim Putrus Second supervisors: Peter Minns Steve McDonald New and Renewable Energy Centre. Locating Sources of PQ disturbance using an Artificial Neural Network. - PowerPoint PPT Presentation
Locating Sources of PQ disturbance using an Artificial Neural Network • Edward Bentley • Director of Studies: Ghanim Putrus • Second supervisors: Peter Minns Steve McDonald New and Renewable Energy Centre
Transcript
Locating Sources of PQ disturbance using an Artificial Neural Network
• Edward Bentley• Director of Studies: Ghanim Putrus• Second supervisors:
Peter MinnsSteve McDonald New and Renewable Energy
Centre
Locating Sources of PQ disturbance using an Artificial Neural Network
Presentation Outline• Introduction• Importance of Power Quality Monitoring
– PQ Events– Existing approaches to location– FFT Analysis– Feature Vectors– SOM – Progress so far– Conclusion
Locating Sources of PQ disturbance using an Artificial Neural Network
• In modern power networks, the issue of electrical Power Quality (PQ) is becoming very important.
• This is due to:-– Continuous increase in using power electronic devices that draw
current which is not sinusoidal; creating a voltage distortion which affects all loads connected to the network.
– Increasing penetration of loads which are sensitive to such voltage disturbances, such as Personal Computers.
• As a result there is an increasing need for PQ to be monitored to establish the type, source and location of the disturbance, allowing remedial measures to be taken.
A mixture of power electronics and resistive loads may be ok
Too many power electronic loads within a system may interract causing malfunctioning
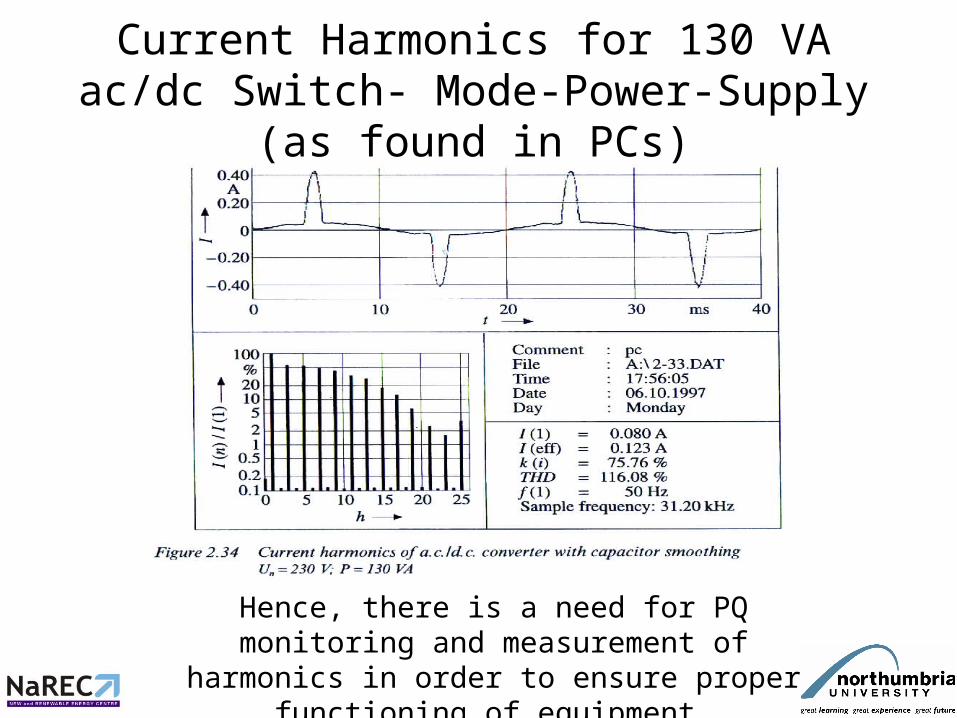
Current Harmonics for 130 VA ac/dc Switch- Mode-Power-Supply (as found in PCs)
Hence, there is a need for PQ monitoring and measurement of harmonics in order to ensure
proper functioning of equipment
Disturbances – oscillatory transient
Disturbances –impulsive transient
• x axis time(s) y axis Voltage (pu)
Disturbances – sag
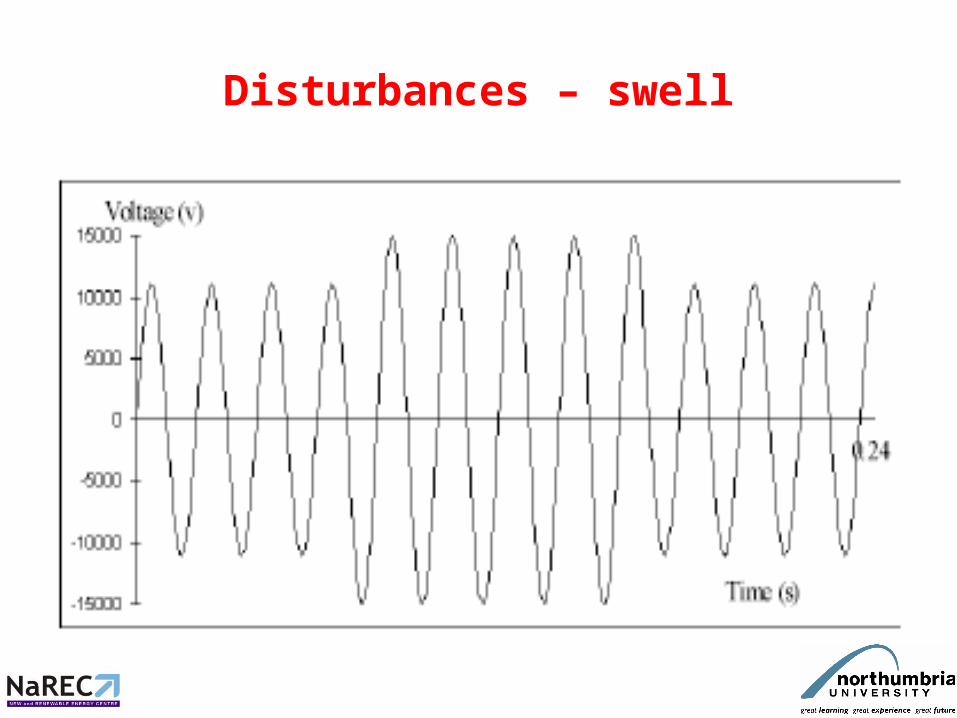
Disturbances – swell
Disturbances – DC offset
Disturbances – Voltage Flicker
• y axis V x axis time(s)
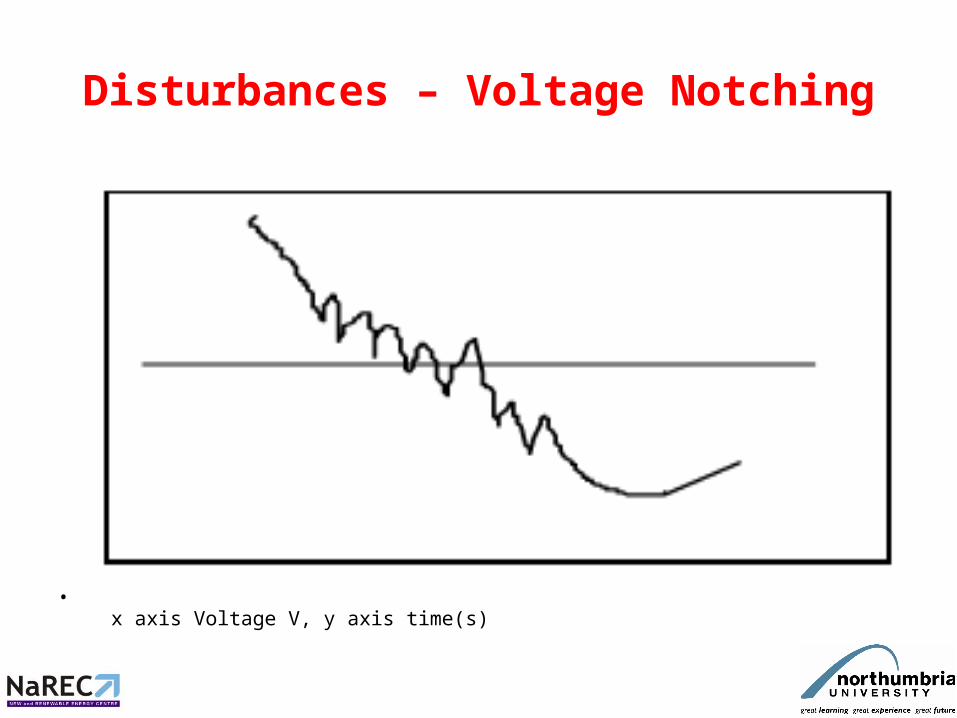
Disturbances – Voltage Notching
• x axis Voltage V, y axis time(s)
How do you locate a disturbance?
EXISTING TECHNIQUES
• In 2005, a technique was suggested that uses a combination of DWT, a supervised and an unsupervised Neural Network to successfully determine which of two network capacitors had been switched.
• In a power system, a bus is a heavy gauge conductor forming an electrical node. Only a very rudimentary system could be coped with, comprising 2 busses only.
EXISTING TECHNIQUES
• In 2007, another research achieved good accuracy (98%) in locating capacitor switching transients using Wavelet Transform measurements and a hybrid Neural Network based on an 18 bus network, but a minimum of 4 sets of separate PQ monitors were required.
• Selection of the composition of the chosen feature vectors allowed accuracy to be achieved with a reasonable processing time
EXISTING TECHNIQUES
• In 2007, it proved possible, using voltage and current measurements, to establish whether capacitor switching was occurring ‘upstream’ or ‘downstream’ of the monitoring point using measurements made at a single location.
• Only one monitoring point was used, but no location at a single bus level was achieved.
Observations
• Actual components in a real power
• Real systems are not ideal, but
• Possess, inter alia,
inductance and resistance
???
• Can one take advantage of the system’s actual (non ideal) properties to locate the source of a PQ disturbance?
FFT• The FFT analyzer is a batch processing device; • That is it samples the input signal for a
specific time interval collecting the samples in a buffer,
• After which it performs the FFT calculation on that "batch" and
• Displays the resulting spectrum showing the magnitude, phase and frequency of the signal components.
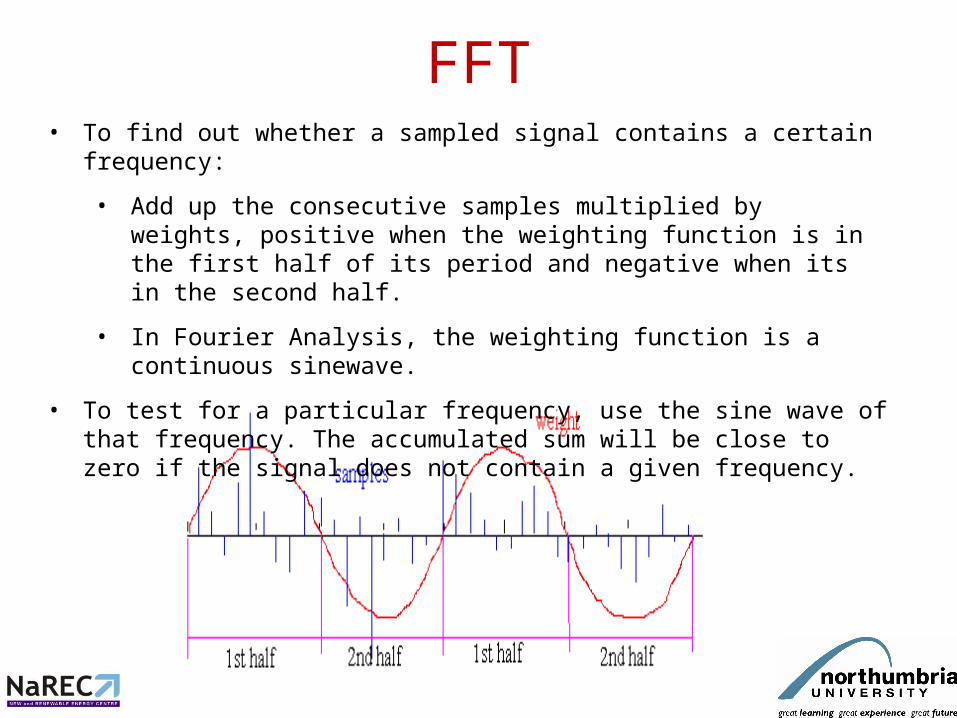
• To find out whether a sampled signal contains a certain frequency:
• Add up the consecutive samples multiplied by weights, positive when the weighting function is in the first half of its period and negative when its in the second half.
• In Fourier Analysis, the weighting function is a continuous sinewave.
• To test for a particular frequency, use the sine wave of that frequency. The accumulated sum will be close to zero if the signal does not contain a given frequency.
FFT
FFT
• Using the FFT technique, a base weighting function is applied to the signal under test, then frequency multiples (‘harmonics’) of the weighting function 2x 3x 4x 5x ......etc.
• This procedure allows analysis of the signal under test to determine the levels of the various harmonics within it.
Observation
• If you monitor at one bus, a particular applied disturbance will have different measured levels of Fourier harmonic amplitude, depending upon where the given disturbance occurs within a system, owing to the presence of system reactances
Example• In a simulation of the IEEE 14 bus system, for a given
disturbance caused by switching a capacitor at bus 3, measured at bus 6 the following harmonic levels (v) were measured:
• Second third fourth fifth sixth seventh 0.39 0.37 1.32 0.28 0.38 0.08 • Switching at bus 4 again measured at bus 6 gives the
following measurements:-• Second third fourth fifth sixth seventh• 3.48 1.81 0.85 0.66 0.34 0.69
The harmonic structure of a signal, monitored at a given location, varies with its source
Observation
• If you monitor the magnitude of differing frequencies, for a given disturbance a ‘feature vector’ can be obtained,
• The components of the vector varying depending upon the source of the disturbance in the system
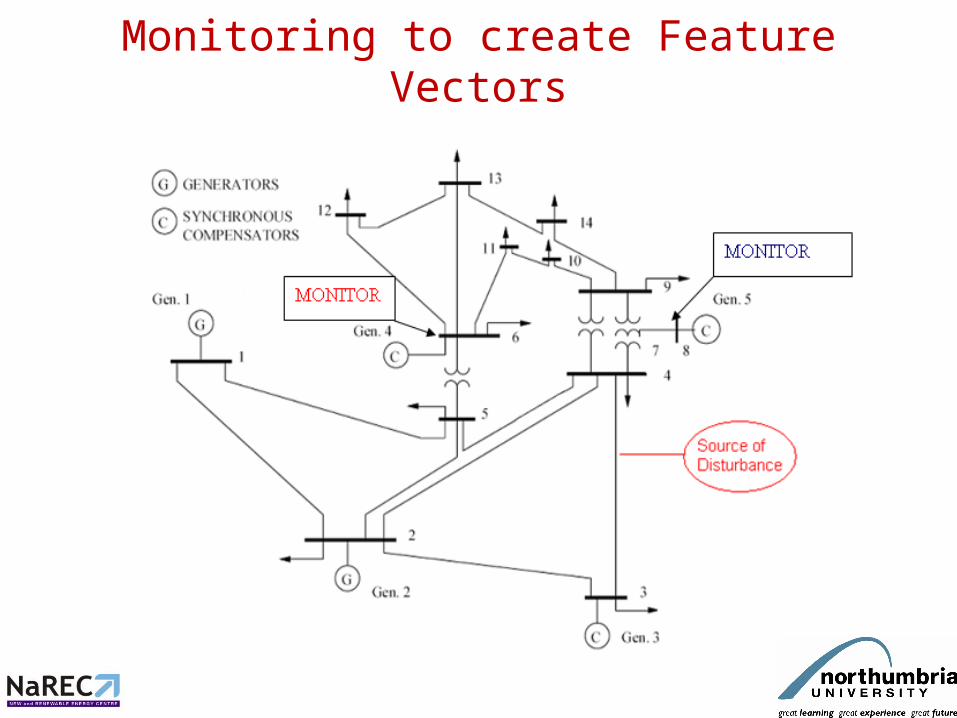
Monitoring to create Feature Vectors
Monitoring to create Feature Vectors
• If monitoring at two locations is used, a combined feature vector may be obtained, giving greater power of identification
• For instance, monitoring a given disturbance (originating from bus 4), at bus 6 gave the following harmonics
• Second third fourth fifth sixth seventh
3.48 1.81 0.85 0.66 0.34 0.69
Monitoring to create Feature Vectors
• Monitoring the same given disturbance (originating from bus 4), at bus 8 gave the following harmonic measurements:-
• Second third fourth fifth sixth seventh
2.47 0.72 2.20 0.80 0.88 0.20
Monitoring to create Feature Vectors
• Combined feature vector for disturbance originating at bus 4
• Measured at bus 6B6SEC B6THIRD B6FOUR B6FIV B6SIXTH B6SEV 3.48 1.81 0.85 0.66 0.34 0.69
• Measured at bus 8B8SEC B8THIRD B8FOUR B8FIV B8SIX B8SEV 2.47 0.72 2.20 0.80 0.88 0.20
Proposal
• Differing feature vectors should allow differentiation of source locations ...............
HOW?
SELF ORGANISING MAP (SOM)
SELF ORGANISING MAP (SOM)
• SOM can organise incoming feature vectors so that input vectors which are topologically close to others in the input to the system appear so displayed in the output.
• The output forms a map of the feature vectors, often in 2 dimensions
SELF ORGANISING MAP (SOM)
• Big advantage: • Similar feature vectors are located adjacent
to each other on the SOM.• Feature vectors originating from adjacent
locations in a power system will appear close to each other on the SOM
SELF ORGANISING MAP (SOM)
• SOM will locate feature vectors similar to those it is ‘trained’ with, and locate them in an appropriate location.
• You can train the system using signals from defined busses, and the system can interpolate the location of signals originating between busses
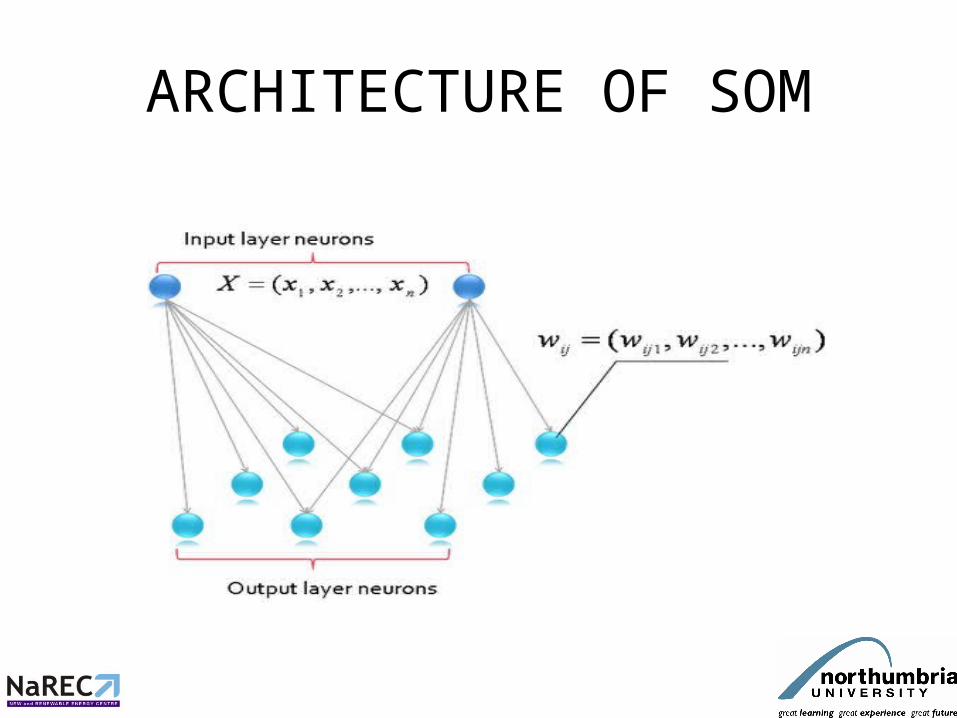
• A SOM normally comprises a 2-dimensional grid of processing elements known as nodes, operated in computer software.
• A model of the data representing a measurement is associated with each node
THE PERCEPTRON
ARCHITECTURE OF SOM
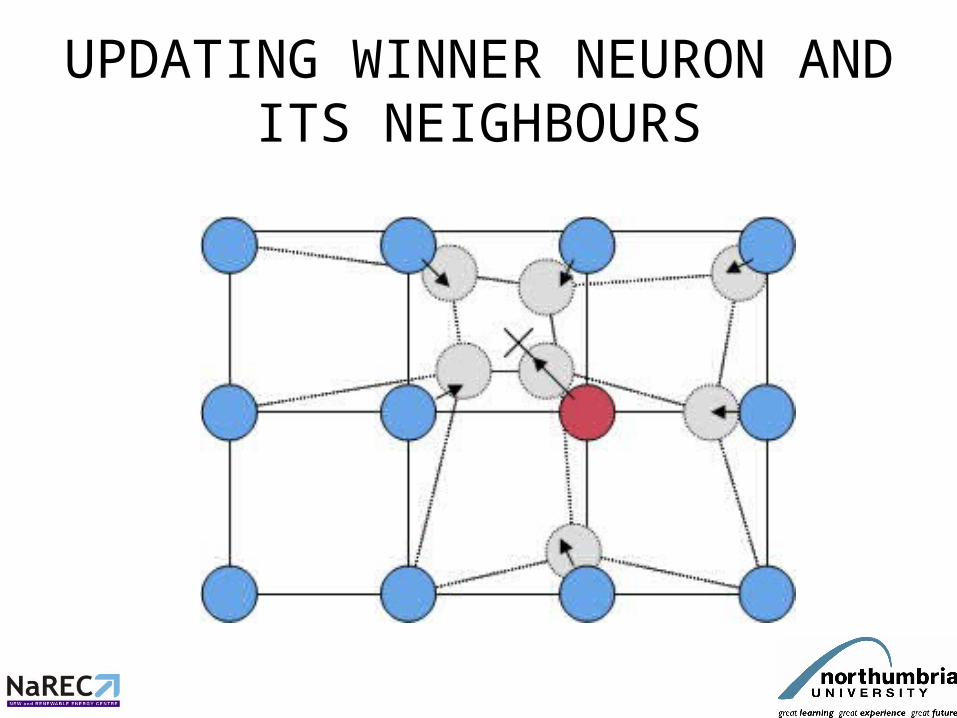
UPDATING WINNER NEURON AND ITS NEIGHBOURS
• Each node in this grid holds a model of a short-time spectrum derived from natural speech.
• Neighbouring models are mutually similar• The SOM algorithm deals with the models in such a way that
they recreate the topology of the observations
Phonemes Represented in an SOM
Application
• A different map will be required for each class of disturbance to be located
• The final system will identify a PQ disturbance using existing technique to enable the correct map to be used
PRACTICAL WORK
• IEEE 14 bus system modelled in PSCAD software• 10,000 uF capacitor switched at each bus in turn• Harmonic components 2nd to 7th recorded at
buses 6 and 8 using FFT Combined feature vectors obtained
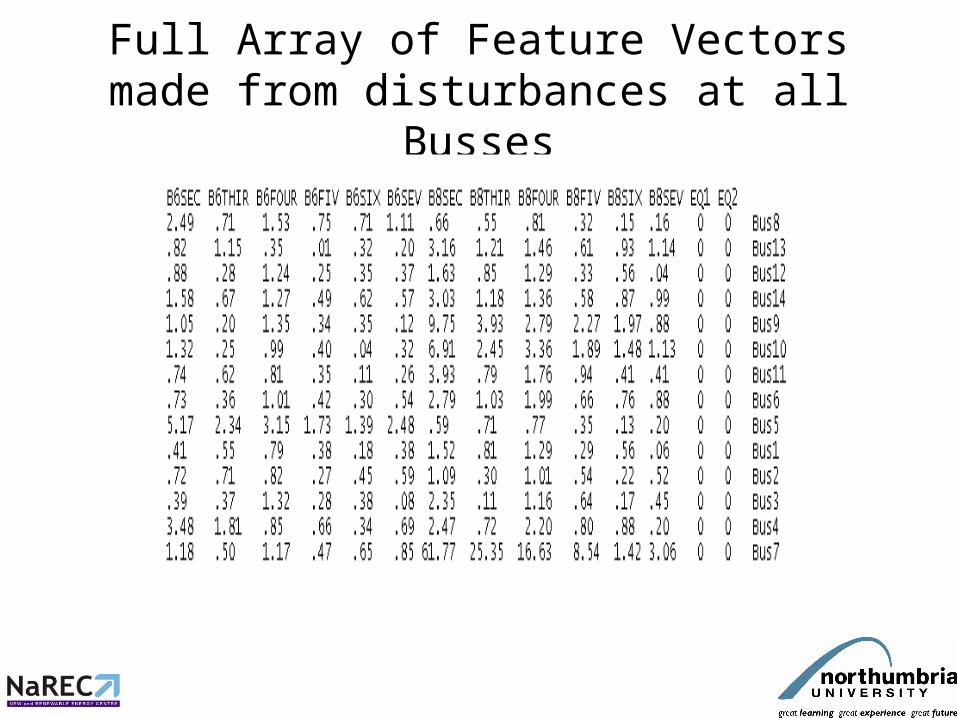
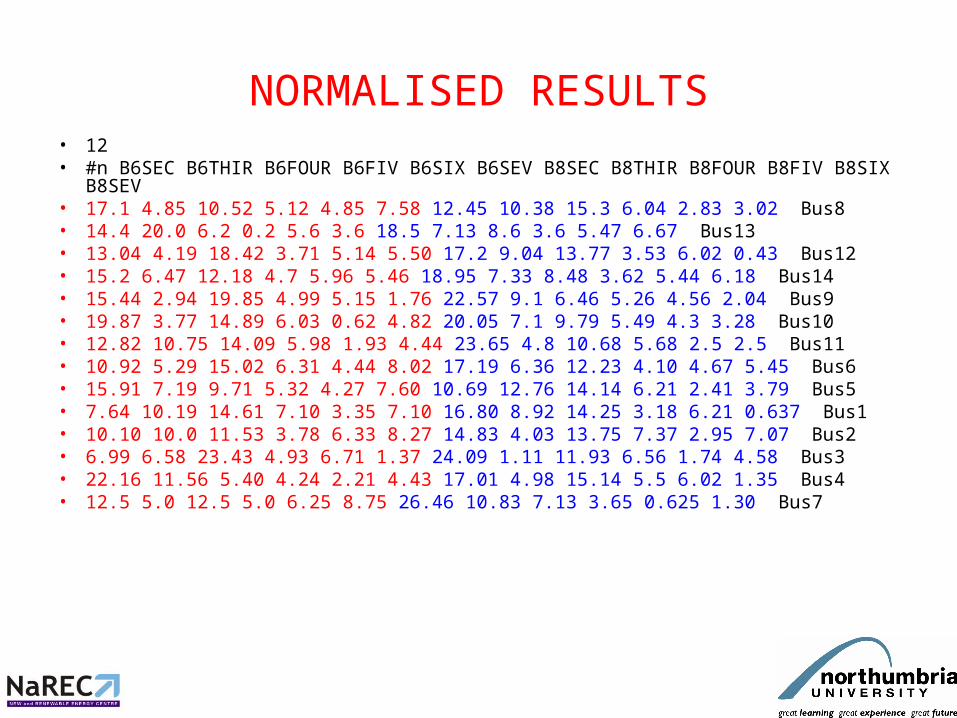
Feature Vector produced from disturbance at Bus 8
Full Array of Feature Vectors made from disturbances at all Busses
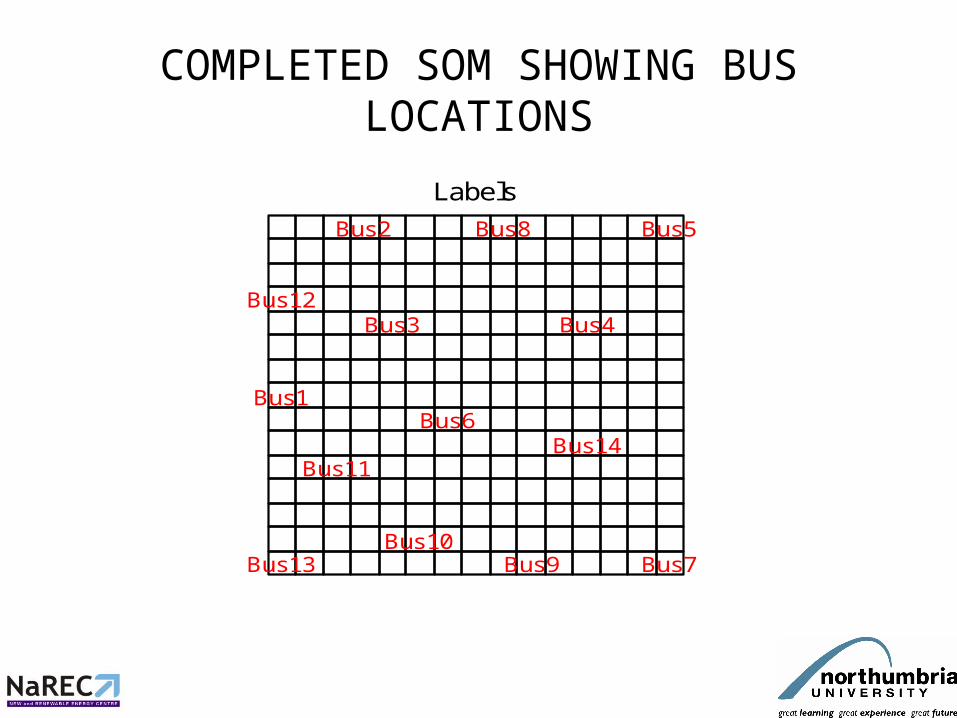
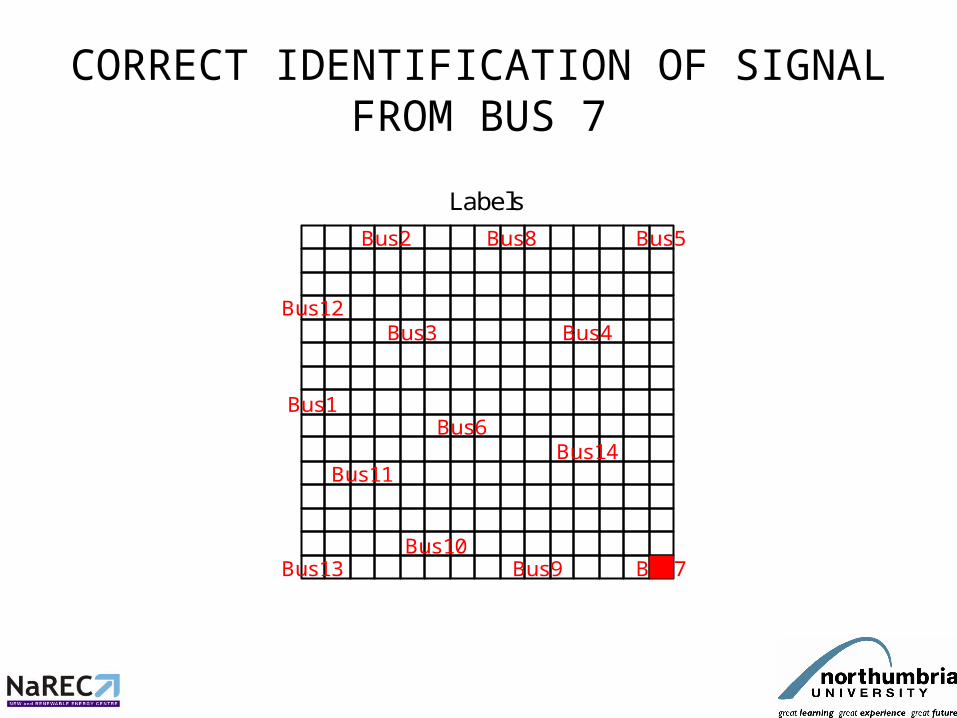
COMPLETED SOM SHOWING BUS LOCATIONS
U-matrix
0.0518
3.32
6.58
SOM 25-Mar-2008
Labels
Bus12
Bus1
Bus13
Bus11
Bus2
Bus3
Bus10
Bus6
Bus8
Bus9
Bus4
Bus14
Bus5
Bus7
FEATURE VECTOR FROM BUS 12 APPLIED TO SOM WITH ERRONEOUS
• Som very sensitive to normalisation of signal amplitudes• After due attention to this point 13/14 busses so far
correctly identified using 2 monitoring points• 8/14 busses correctly identified using 1 monitoring point only Small changes made to a feature vector give small change
in location as expected.
Further Improvements
• 100 % location accuracy using 2 monitoring points achieved when already normalised feature vectors have variance normalised over the full data set used to train the SOM:-
Location Error for Bus 11 With 25% Disturbance Power
Attempted Location of Sag at Bus 4 With Harmonic Interference
Future Work• Develop software to transfer data from PSCAD
environment to MATLAB for analysis• Improve robustness of technique• Develop SOM for each type of disturbance• Develop location system for disturbances not on
system busses• Combine the new system with an existing technique,
based upon DWT measurements of a signal, thus allowing the creation and invocation of suitable initial conditions and the correct SOM mapping for the PQ event concerned.
• Build real system and test using DSP sampling techniques