Page 1
i
Location Motivations for Foreign Direct Investment in the Petrochemicals Industry:
The Case of Saudi Arabia
A thesis submitted for the degree of Doctor of Philosophy
By
Fawaz Binsaeed
Brunel Business School
Brunel University
July 2010
Page 2
ii
Copyright © Fawaz Binsaeed
2010
Page 3
iii
Acknowledgements
The process associated with this PhD programme has been a long and complicated voyage.
However, it has also been a learning adventure. I have had the good fortune of being the
recipient of advice, knowledge and effort from so many.
First and foremost, I am deeply grateful to my supervisor, Dr. Frederick Mmieh at Brunel
University, for his depth of insight, understanding, involvement and dedicated supervision at
every critical stage, making it possible for me to complete this all-important study. I would
like also to thank my supervisor, Dr. Chima Mordi, for his support and encouragement during
my study.
I would like to thank the Saudi General Investment Authority (SAGIA) for allowing me to use
their facilities and their support in the collection of the data, which has been used in this
research. I would also like to thank various organisations and all the Saudi government
officials who contributed to this study, both directly and indirectly.
I would also like to express my appreciation to the 42 participating firms and senior executives
for their cooperation, patience and valuable advice.
Finally, I would like to express my heartfelt thanks to all my family members for their wishes
and encouragement, and their everlasting support, deep understanding and patience during my
three-year study at Brunel University.
Page 4
iv
Abstract
Foreign Direct Investment (FDI) is an important source of capital and economic growth in
developing countries. It provides a package of new technologies, management techniques,
finance and market access for the production of goods and services. However, attracting FDI
is a major challenge for host countries, as they face the challenge of identifying the major
factors that motivate and affect the FDI location decision, and also the key competitive
drivers that determine FDI location.
After reviewing the literature on FDI, we identified the major location factors for FDI with
regard to the petrochemicals industry. These location factors are as follows: cost factors,
market factors, economic factors, infrastructure and technological factors, political and legal
factors, and social and cultural factors. We have noticed that previous studies have failed to
discuss the complexity of the relative importance of location factors in relation to a specific
industry and a specific country, and the competitiveness of these factors in terms of other FDI
locations. This study therefore aims to fill the gap in the literature by examining the relative
importance of the location factors on FDI location decision, and the major competitive forces
that determine the attraction of FDI inflows in the petrochemicals industry in Saudi Arabia.
We have found in this study that the most important location factors that affect the location
decisions for FDI in the Saudi petrochemicals industry are cost factors, followed by political
and legal factors, and infrastructure and technological factors. An interesting finding of this
study is that economic factors, followed by market factors, and social and cultural factors,
which in previous studies in the literature have been found to be important factors for
multinational enterprises‘ (MNEs) location decisions for FDI have not been found in this
study to be important for FDI location decisions in the Saudi petrochemicals industry.
Another finding of this study is that the most competitive location factors for FDI inflows in
the Saudi petrochemicals industry are cost factors, political and legal factors, followed by
infrastructure and technological factors, and economic factors. This study found that market
factors and social and cultural factors are not the key competitive drivers in terms of
attracting FDI inflows into the Saudi petrochemicals industry.
Page 5
v
Table of Contents
Acknowledgements ................................................................................................................. iii
Abstract ................................................................................................................................... iv
Table of Contents ..................................................................................................................... v
List of Abbreviations .............................................................................................................. ix
List of Tables ........................................................................................................................... xi
List of Figures ....................................................................................................................... xiv
Chapter 1 : Introduction ......................................................................................................... 2
1.1 Introduction ..................................................................................................................... 2
1.2 Research Background ...................................................................................................... 2
1.3 Research Objectives ........................................................................................................ 2
1.4 Research Questions ......................................................................................................... 2
1.5 Research Structure ........................................................................................................... 5
1.6 Research Contributions ................................................................................................... 5
1.7 Research Limitations ....................................................................................................... 6
1.8 Future Research ............................................................................................................... 6
1.9 Summary.......................................................................................................................... 7
Chapter 2 : Literature Review ............................................................................................... 9
2.1 Introduction ..................................................................................................................... 9
2.2 Definitions of FDI ........................................................................................................... 9
2.3 Literature on FDI Location Factors ............................................................................... 10
2.3.1 General Overview of FDI Location Factors ........................................................... 10
2.4 Summary........................................................................................................................ 31
Chapter 3 : Globalization and the Political Economy of FDI ........................................... 33
3.1 Political Economy of FDI .............................................................................................. 33
3.1.1 FDI in Developing Countries ................................................................................. 35
3.1.2 FDI in GCC Countries ............................................................................................ 46
3.1. 3 FDI in Saudi Arabia ............................................................................................... 48
3.1.4 Summary................................................................................................................. 51
3.2 Research Methods ......................................................................................................... 52
3.2.1 Introduction ............................................................................................................ 52
3.2.2 Research Approaches ............................................................................................. 52
3.2.3 Research Design ..................................................................................................... 53
3.2.4 Data Sources ........................................................................................................... 54
3.2.4.1 Secondary Data ................................................................................................ 54
3.2.4.2 Primary Data .................................................................................................... 56
3.2.5 Data Collection ....................................................................................................... 57
3.2.5.1 Qualitative Versus Quantitative Methods ....................................................... 57
3.2.5.2 Observation...................................................................................................... 57
3.2.5.3 Communications .............................................................................................. 58
3.2.5.4 Surveys ............................................................................................................ 58
3.2.5.5 Interviews ........................................................................................................ 59
3.2.5.6 Focus Group .................................................................................................... 60
3.2.5.7 Structured Interviews....................................................................................... 61
Page 6
vi
3.2.5.8 Self-Completion Questionnaire (Mail Questionnaire) .................................... 61
3.2.5.9 Survey Methods ............................................................................................... 63
3.2.5.9.1 Mail Surveys ............................................................................................. 63
3.2.5.9.2 Internet Survey ......................................................................................... 63
3.2.5.9.3 Telephone Survey ..................................................................................... 64
3.2.5.9.4 Face-To-Face Surveys .............................................................................. 65
3.2.6 Population Definition ............................................................................................. 66
3.2.7 Sample Size ............................................................................................................ 66
3.2.8 Pilot Study .............................................................................................................. 67
3.2.9 Survey Design ........................................................................................................ 68
3.2.10 Survey Introduction or Cover Letter .................................................................... 71
3.2.11 Data Collection for This Study ............................................................................. 72
3.2.11.1 Network Approach ........................................................................................ 73
3.2.11.2 Facsimile-Telephone Approach..................................................................... 74
3.2.11.3 Interview Process........................................................................................... 74
3.2.11.4 Complimentary Letter ................................................................................... 75
3.2.12 Response Rate ...................................................................................................... 75
3.2.13 Data Analysis........................................................................................................ 76
3.2.14 Research Questions and Hypotheses .................................................................... 77
3.2.15 Summary............................................................................................................... 82
Chapter 4 : Social-Political and Economic Context of Saudi Arabia ............................... 84
4.1 Introduction ................................................................................................................... 84
4.2 Background on Saudi Arabia......................................................................................... 84
4.3 Economic Environment of Saudi Arabia ................................................................... 85
4.3.1 Criteria of the Saudi Economy‘s Openness ............................................................ 85
4.3.2 Increasing Interest Regarding Investment in Saudi Arabia .................................... 85
4.4 FDI in Saudi Arabia....................................................................................................... 85
4.4.1 Investment Environment in Saudi Arabia .............................................................. 85
4.4.1.1 Saudi Arabia Competitive Advantages ........................................................... 86
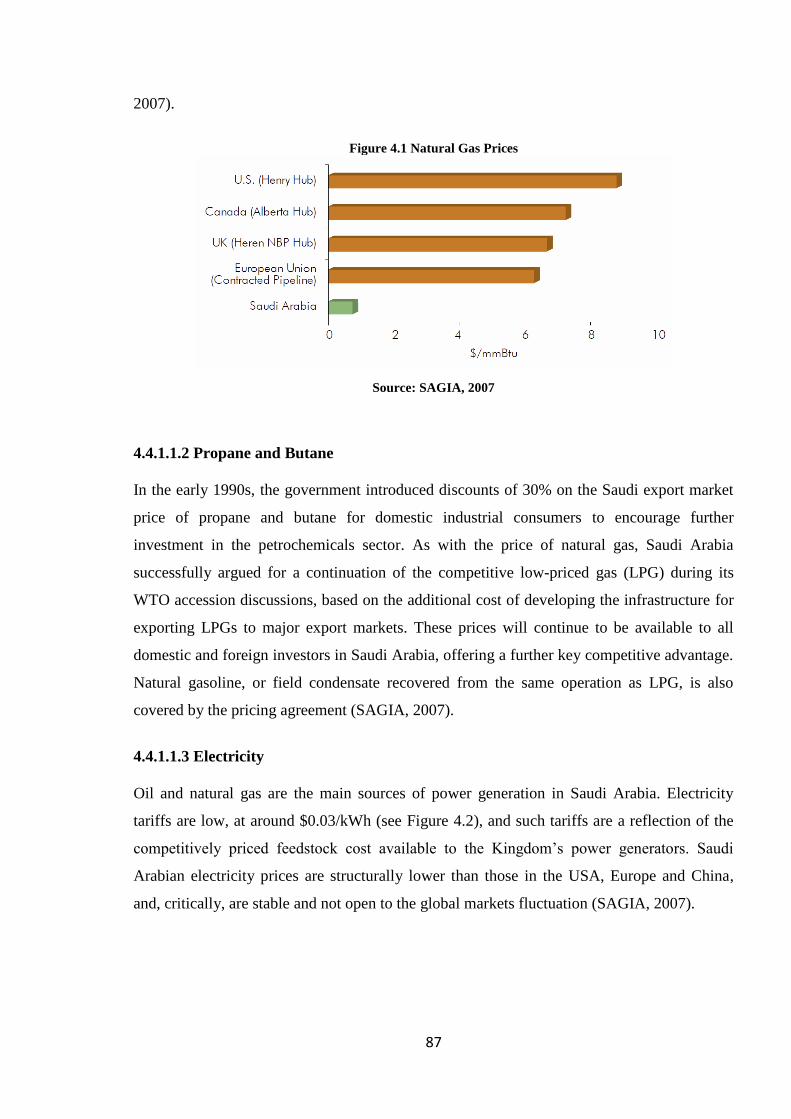
4.4.1.1.1 Natural Gas ............................................................................................... 86
4.4.1.1.2 Propane and Butane .................................................................................. 87
4.4.1.1.3 Electricity ................................................................................................. 87
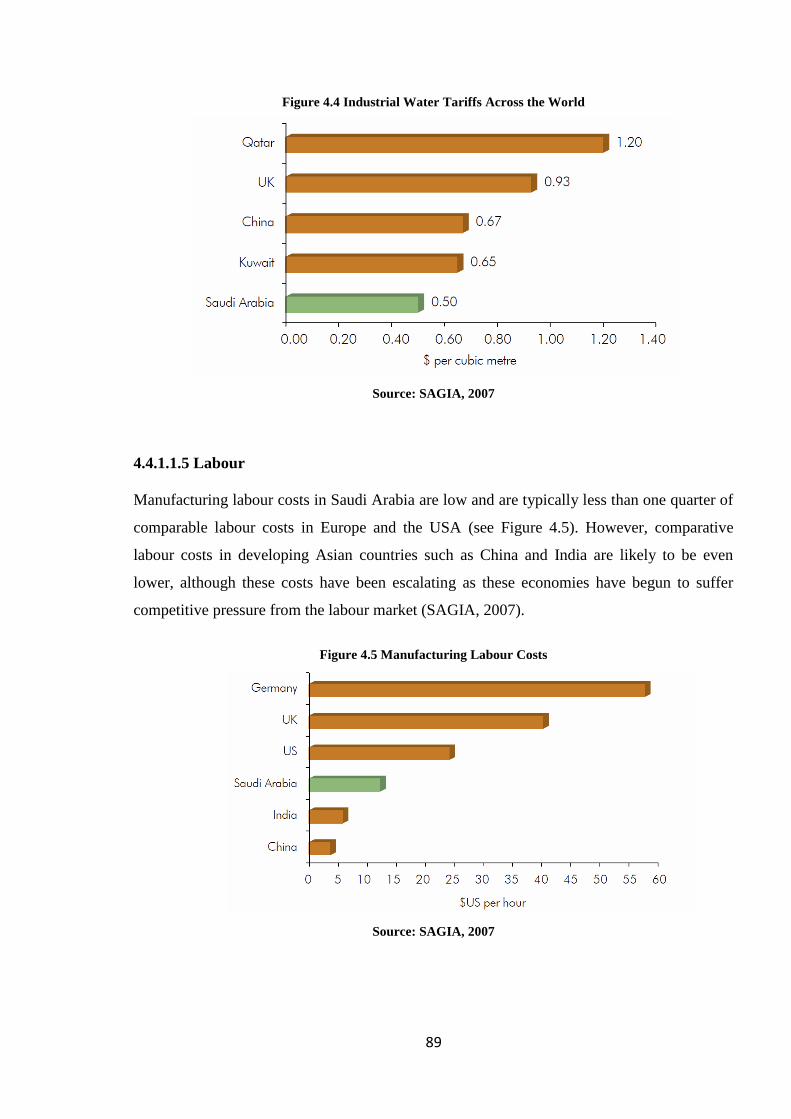
4.4.1.1.4 Water ........................................................................................................ 88
4.4.1.1.5 Labour....................................................................................................... 89
4.4.1.1.6 Corporate Taxation ................................................................................... 90
4.4.1.1.7 Land Rental .............................................................................................. 90
4.4.2 Special Economic and Industrial Zones ................................................................. 91
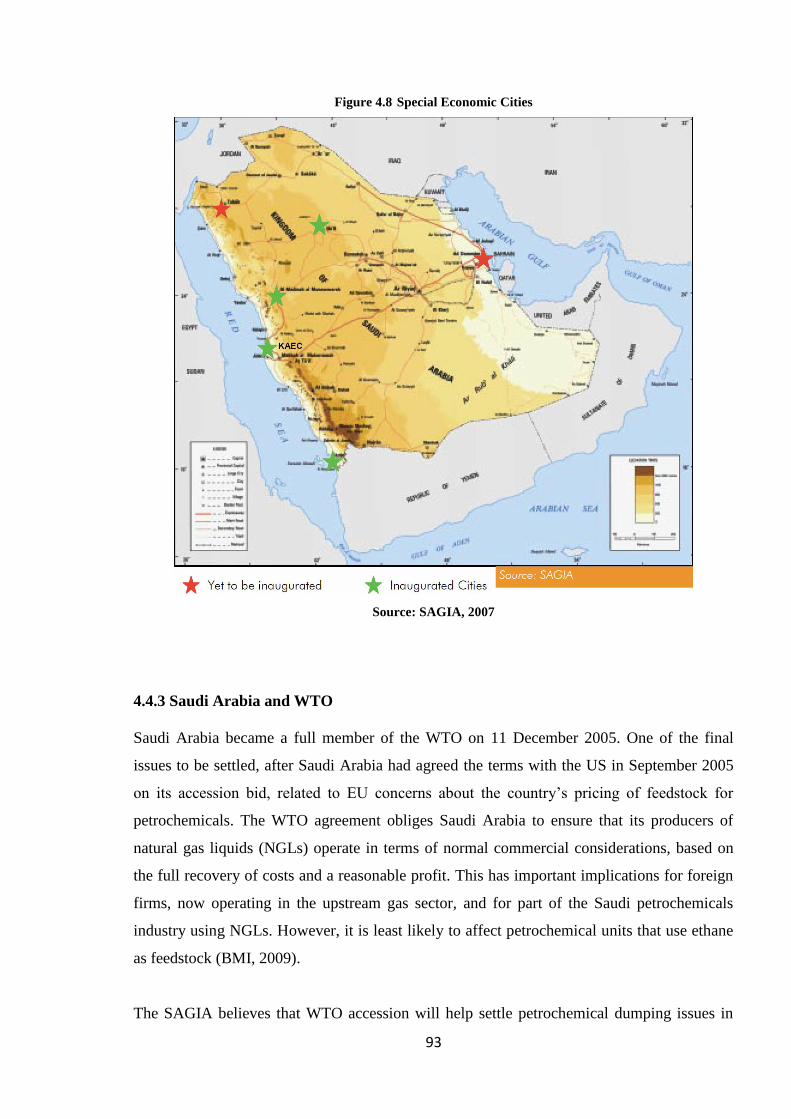
4.4.3 Saudi Arabia and WTO .......................................................................................... 93
4.4.4 Infrastructure Development .................................................................................... 94
4.4.5 Transport Development .......................................................................................... 95
4.4.6 Saudi General Investment Authority (SAGIA) ...................................................... 96
4.5 FDI Patterns in Saudi Arabia ......................................................................................... 97
4.5.1 Sectoral Distribution of FDI in Saudi Arabia ......................................................... 97
4.5.2 Source of FDI in Saudi Arabia ............................................................................. 101
4.5.3 Regional Distribution of FDI in Saudi Arabia ..................................................... 106
4.6 FDI in the Petrochemicals Industry ............................................................................. 108
4.6.1 Petrochemicals Definition .................................................................................... 108
4.6.2 Overview of the Saudi Petrochemicals Industry .................................................. 108
4.6.3 History and Current Trends With Regard to the Saudi Petrochemicals Industry . 108
Page 7
vii
4.6.4 Petrochemicals Market ......................................................................................... 110
4.6.5 Basis of Competition in the Petrochemicals Industry .......................................... 110
4.6.6 Saudi‘s Petrochemicals Market Overview ........................................................... 110
4.6.7 Saudi Arabian Value Proposition ......................................................................... 111
4.6.8 Competitively Priced Feedstock ........................................................................... 113
4.6.9 Implications and Investment Attractiveness of Saudi Arabia .............................. 114
4.6.10 Saudi Petrochemicals Industry Key Strengths ................................................... 115
4.6.11 The Future of the Saudi Petrochemicals Industry .............................................. 117
4.7 Summary...................................................................................................................... 117
Chapter 5 : Analysis of the Research Findings ................................................................. 120
5.1 Research Findings ....................................................................................................... 120
5.1.1 Introduction .......................................................................................................... 120
5.1.2 Location Factors‘ Importance ............................................................................... 120
5.1.2.1 Major Factors‘ Importance ............................................................................ 123
5.1.2.2 Cost Factors‘ Importance .............................................................................. 124
5.1.2.3 Market Factor‘ Importance ............................................................................ 125
5.1.2.4 Economic Factors‘ Importance...................................................................... 126
5.1.2.5 Infrastructure and Technological Factors‘ Importance ................................. 127
5.1.2.6 Political and Legal Factors‘ Importance ........................................................ 128
5.1.2.7 Social and Cultural Factors‘ Importance ....................................................... 129
5.1.3 Location Factors‘ Competitiveness ...................................................................... 131
5.1.3.1 Major Factors‘ Competitiveness.................................................................... 133
5.1.3.2 Cost Factors‘ Competitiveness ...................................................................... 134
5.1.3.3 Market Factors‘ Competitiveness .................................................................. 135
5.1.3.4 Economic Factors‘ Competitiveness ............................................................. 136
5.1.3.5 Infrastructure and Technological Factors‘ Competitiveness ......................... 137
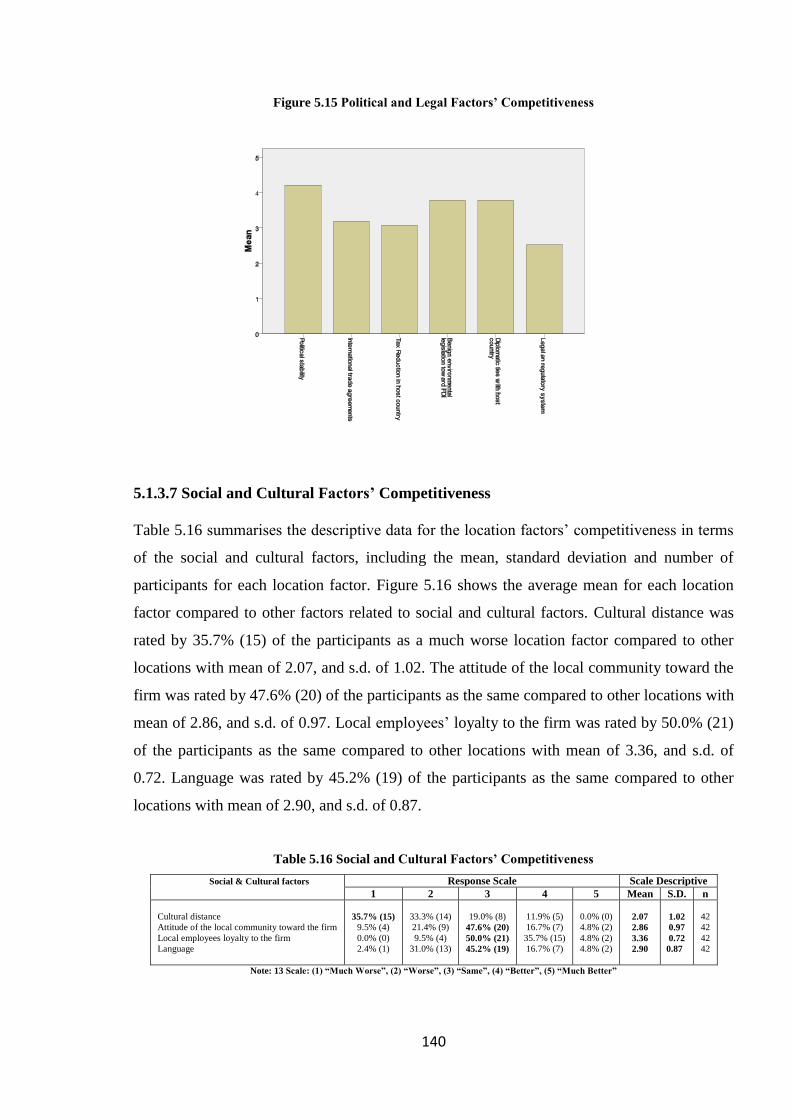
5.1.3.6 Political and Legal Factors‘ Competitiveness ............................................... 139
5.1.3.7 Social and Cultural Factors‘ Competitiveness .............................................. 140
5.2 Location Factors‘ Ranking .......................................................................................... 142
5.2.1 Introduction .......................................................................................................... 142
5.2.2 Location Factors‘ Importance Ranking ................................................................ 142
5.2.2.1 Major Factors‘ Importance Ranking ............................................................. 147
5.2.2.2 Cost Factors‘ Importance Ranking ................................................................ 149
5.2.2.3 Market Factors‘ Importance Ranking ............................................................ 150
5.2.2.4 Economic Factors‘ Importance Ranking ....................................................... 151
5.2.2.5 Infrastructure and Technological Factors‘ Ranking ...................................... 152
5.2.2.6 Political and Legal Factors‘ Importance Ranking ......................................... 154
5.2.2.7 Social and Cultural Factors‘ Importance Ranking ........................................ 155
5.2.3 Location Factors‘ Competitiveness Ranking........................................................ 156
5.2.3.1 Major Factors Competitiveness Ranking ...................................................... 160
5.2.3.2 Cost Factors‘ Competitiveness Ranking ....................................................... 162
5.2.3.3 Market Factors‘ Competitiveness Ranking ................................................... 163
5.2.3.4 Economic Factors‘ Competitiveness Ranking............................................... 164
5.2.3.5 Infrastructure and Technological Factors‘ Competitiveness Ranking .......... 165
5.2.3.6 Political and Legal Factors‘ Competitive Ranking ....................................... 167
5.2.3.7 Social and Cultural Factors‘ Competitiveness Ranking ................................ 168
5.3 Summary...................................................................................................................... 169
Chapter 6 : Empirical Evidence of the Importance/Competitiveness of the Saudi
Petrochemicals Industry ..................................................................................................... 171
Page 8
viii
6.1 Importance/Competitiveness Analysis of the Saudi Petrochemicals Industry ............ 171
6.1.1 Analysis ................................................................................................................ 171
6.2 Testing the Location Factors ....................................................................................... 180
6.2.1 Introduction .......................................................................................................... 180
6.2.2 Testing the Location Factors‘ Importance ............................................................ 180
6.2.2.1 Major Factors‘ Importance ............................................................................ 185
6.2.2.2 Cost Factors‘ Importance .............................................................................. 190
6.2.2.3 Market Factors‘ Importance .......................................................................... 195
6.2.2.4 Economic Factors‘ Importance...................................................................... 198
6.2.2.5 Infrastructure and Technological Factors ...................................................... 200
6.2.2.6 Political and Legal Factors‘ Importance ........................................................ 205
6.2.2.7 Social and Cultural Factors‘ Importance ....................................................... 210
6.2.3 Testing Location Factors‘ Competitiveness ......................................................... 213
6.2.3.1 Major Factors‘ Competitiveness.................................................................... 219
6.2.3.2 Cost Factors‘ Competitiveness ...................................................................... 222
6.2.3.3 Market Factors‘ Competitiveness .................................................................. 225
6.2.3.4 Economic Factors‘ Competitiveness ............................................................. 227
6.2.3.5 Infrastructure and Technological Factors‘ Competitiveness ......................... 229
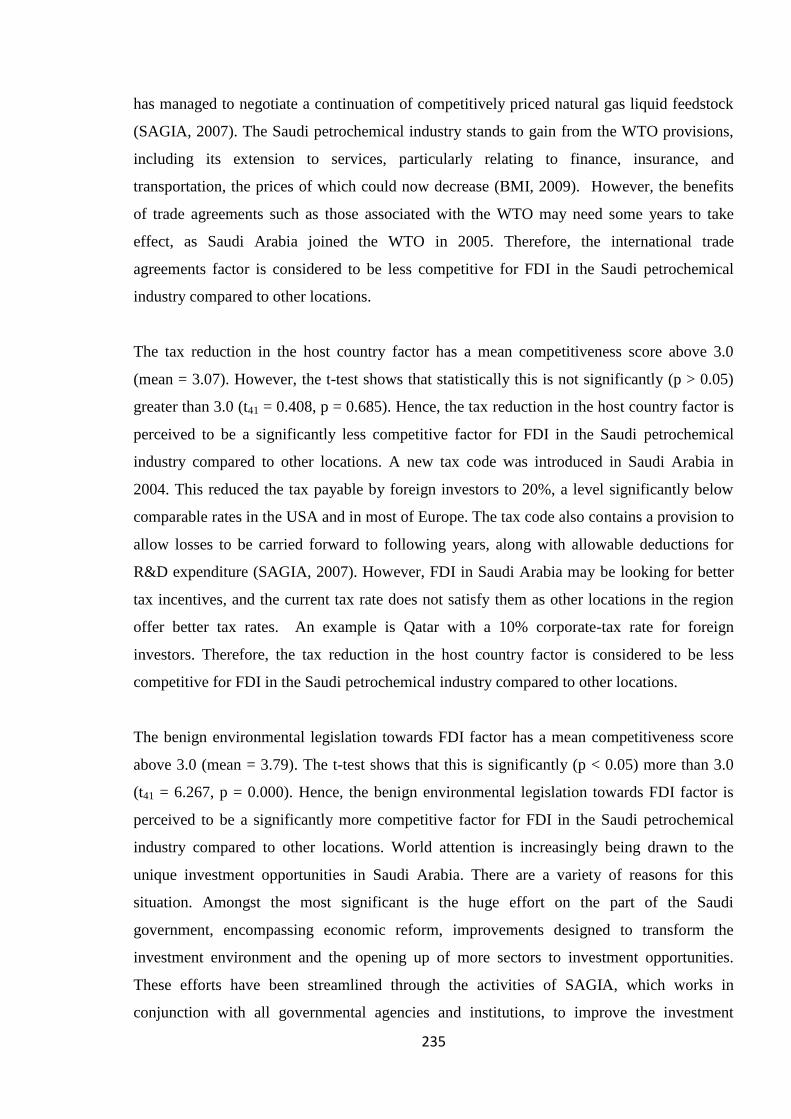
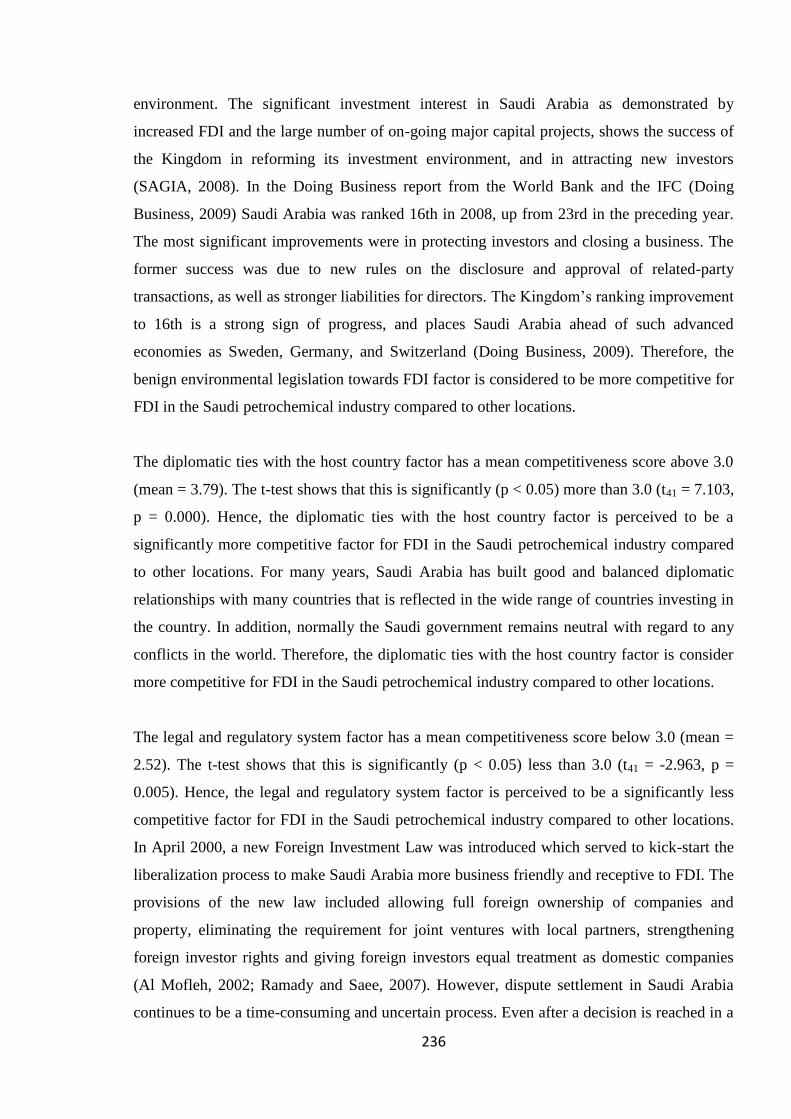
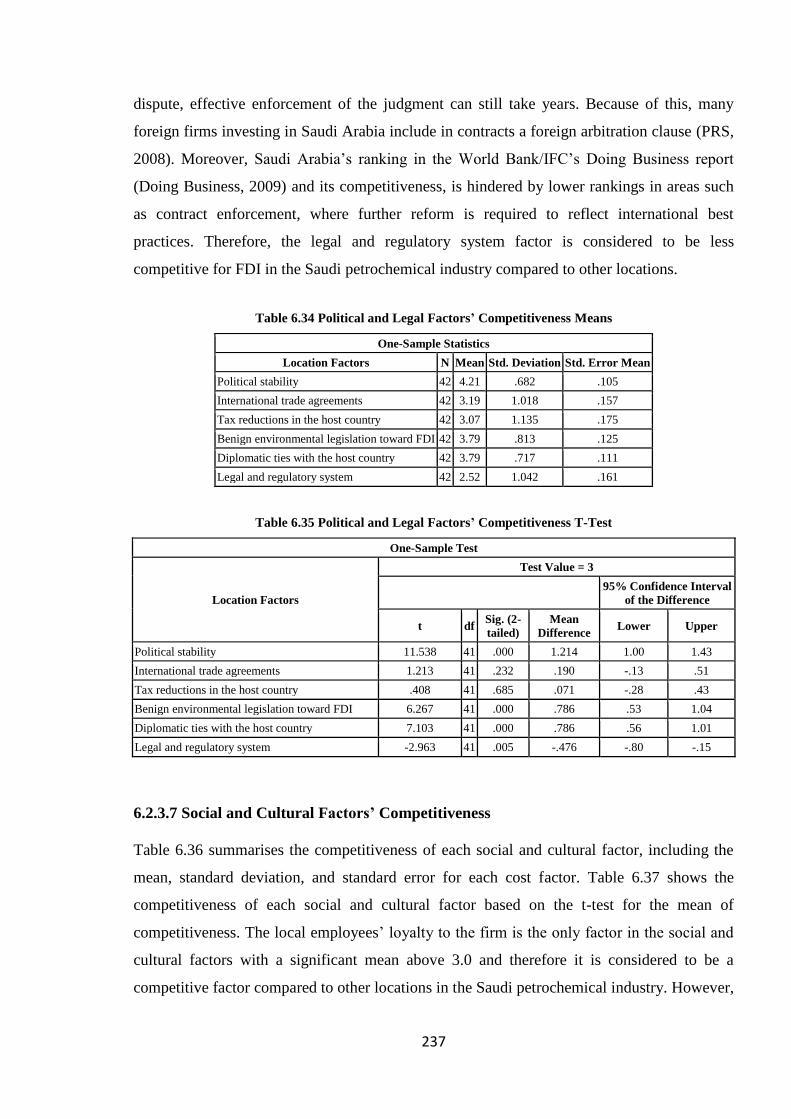
6.2.3.6 Political and Legal Factors‘ Competitiveness ............................................... 234
6.2.3.7 Social and Cultural Factors‘ Competitiveness .............................................. 237
6.3 Location Factors Correlations ..................................................................................... 240
6.3.1 Introduction .......................................................................................................... 240
6.3.2 Correlation Analysis ............................................................................................. 241
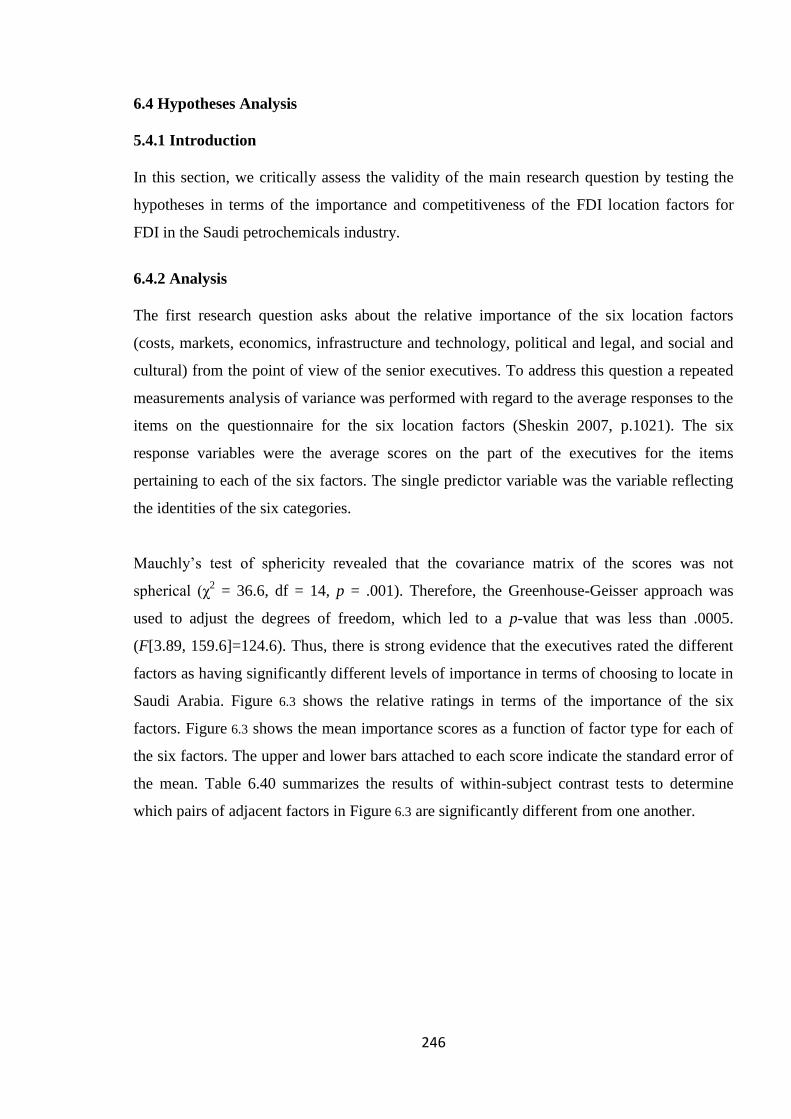
6.4 Hypotheses Analysis ................................................................................................... 246
5.4.1 Introduction .......................................................................................................... 246
6.4.2 Analysis ................................................................................................................ 246
6.4.3 One-Way Between-Groups ANOVA ................................................................... 253
6.4.4 Statistical Significance ......................................................................................... 254
6.4.5 Testing the Hypotheses......................................................................................... 254
6.4.5.1 Testing the Hypothesis for Location Factors‘ Importance ............................ 254
6.4.5.2 Testing the Hypothesis for Location Factors‘ Competitiveness.................... 262
6.4.6 Testing the Significance of the Differences between the Mean Scores of
Importance and Competitiveness .................................................................................. 268
6.5 Summary...................................................................................................................... 270
Chapter 7 : Conclusions and Implications ........................................................................ 273
7.1 Introduction ................................................................................................................. 273
7.2 Conclusions of the Study ............................................................................................. 273
7.2.1 Testing the Location Factors ................................................................................ 274
7.2.2 The Research Questions and Hypothesis Analysis .............................................. 279
7.3 Research Limitations ................................................................................................... 283
7.4 Future Research Implications ...................................................................................... 283
7.5 Research Contributions ............................................................................................... 284
7.6 Summary...................................................................................................................... 285
References ............................................................................................................................ 287
Appendices ........................................................................................................................... 312
The survey ............................................................................................................................ 312
Page 9
ix
List of Abbreviations
ACNOVA Analysis of Covariance
ANOVA Analysis of Variances'
ARAMCO Arabian American Oil Company (now Saudi ARAMCO)
BMI Business Monitor Group
BPM Balance of Payments and International Investment Position Manual
CEECs Central and Eastern European Countries
CSAs Competitive Specific Advantages
CUFTA Canada-Us Free Trade Agreement
EPC Engineering, Procurement and Construction
EU European Union
FDI Foreign Direct Investment
FSAs Firm Specific Advantages
GCC Gulf Cooperation Counsel
GCR Global Competitiveness Report
GDP Gross Domestic Product
GNP Gross National Product
ICSID Center for Settlement of Investment Disputes
IEA International Energy Agency
IFC International Finance Cooperation
IMF International Monetary Fund
JEE Jazan Economic City
JV Joint Venture
KAEC King Abdul-Aziz Economic City
KEC Knowledge Economic City
KSA Kingdome of Saudi Arabia
LDPE Low-Density Poly-Ethane
LPG Low Price Gas
M&A Mergers and Acquisition
MNC Multinational Corporation
MNE Multi-National Enterprises
NAFTA North American Free Trade Agreement
NCC National Competitiveness Center (Saudi Arabia)
NGLs Natural Gas Liquids
NIDL New International Davison of Labor
OECD Organization for Economic Cooperation and Development
OLI Ownership, Location and Internationalization
PABMEC Prince Abdul-Aziz Bin Musaed Economic City
PPP Public Privet Partnership
PRS Political Risk Services
R&D Research and Development
RCJY Royal Commission of Jubail and Yanbu
SA Saudi Arabia
SABIC Saudi Basic Industrials Company
SAGIA Saudi General Investment Authority
SAIAC Saudi International Arbitration Commission
SECS Special Economic Cities
SIDF Saudi Industrial Development Fund
Page 10
x
SNA System of National Accounts
SPSS Statistical Package for Social Since
SR Saudi Riyal
TNCs Trans-National Corporations
UK United Kingdome
UN United Nations
UNCTAD United Nations Conferences for Trade and Development
USA United State of America
USD United State Dollar
WIR World Investment Report
WTO World Trade Organization
Page 11
xi
List of Tables
Table 2.1 Changing Locational Variables Affecting FDI, 1970-80 and 1990-2000 ... 20
Table 4.1 Summary Background on Saudi Arabia ...................................................... 84
Table 4.2 Major Infrastructures and Transport Projects in Development ................... 96
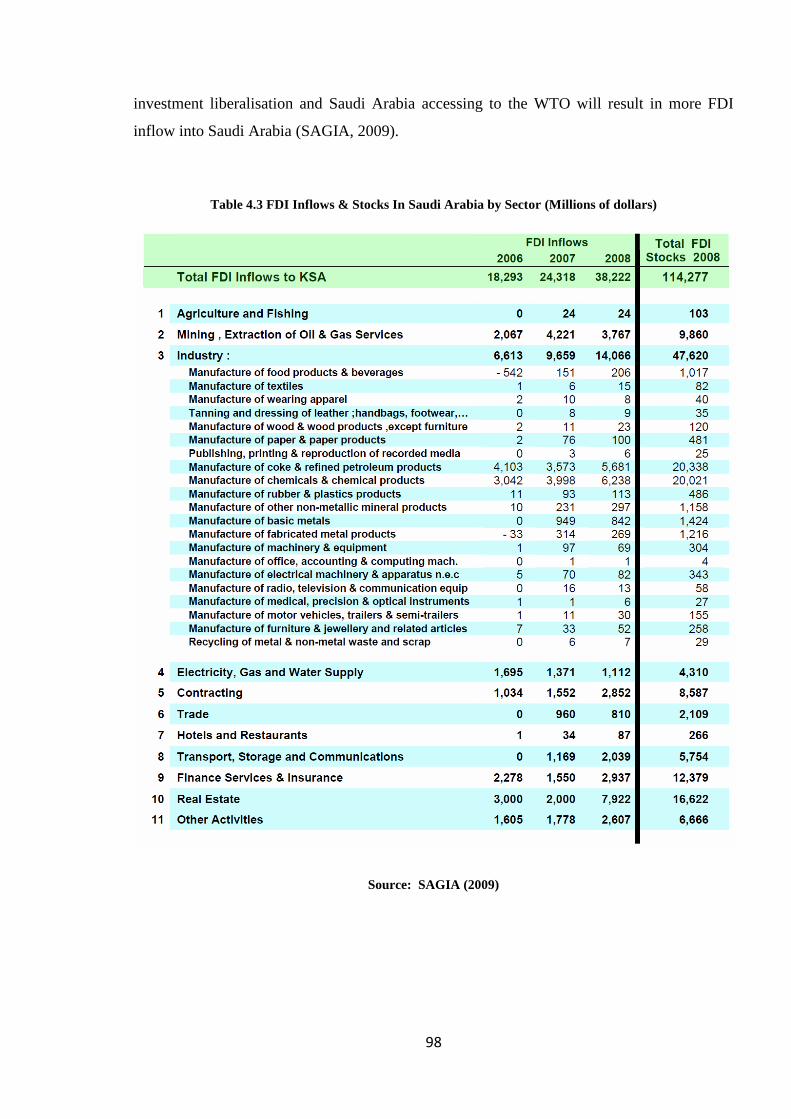
Table 4.3 FDI Inflows & Stocks In Saudi Arabia by Sector (Millions of dollars)...... 98
Table 4.4 Major FDI Projects in Saudi Arabia in 20088 ........................................... 100
Table 4.5 Continue Major FDI Projects in Saudi Arabia in 2008 ............................. 101
Table 4.6 FDI Inflows by Country in Saudi Arabia (Millions of dollars) ................. 102
Table 4.7 Continue. FDI Inflows by Country In Saudi Arabia (Millions of dollars) 103
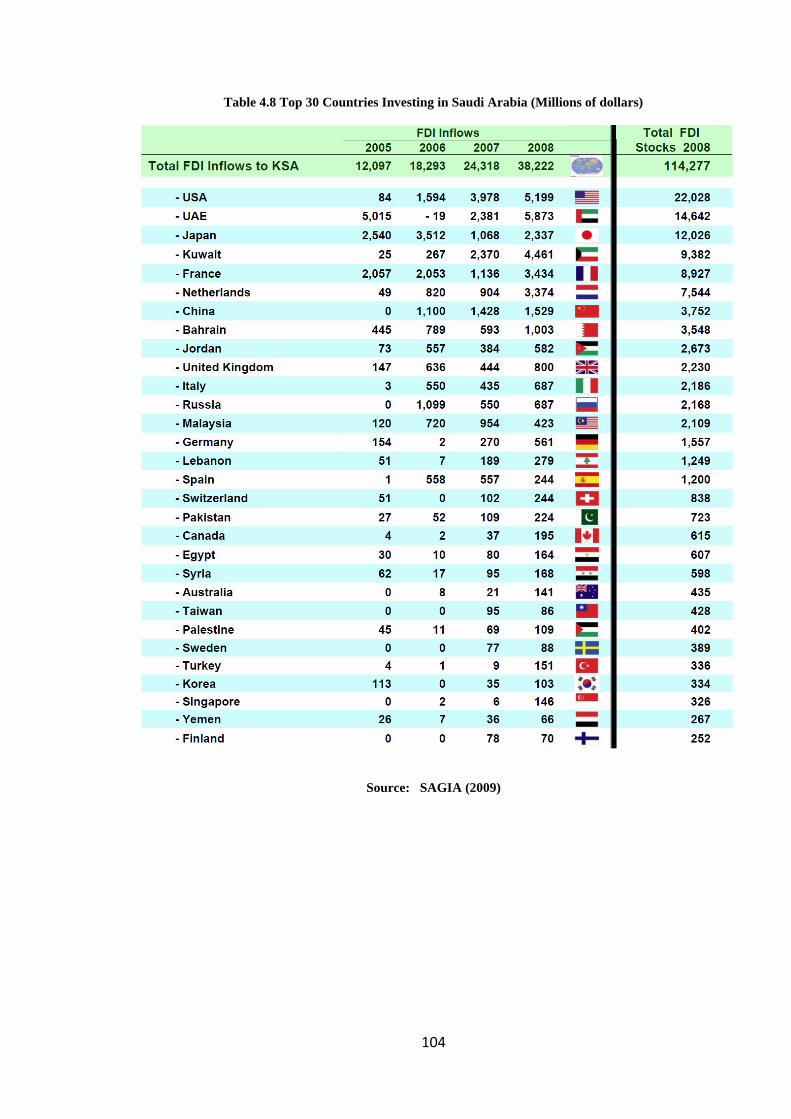
Table 4.8 Top 30 Countries Investing in Saudi Arabia (Millions of dollars) ............ 104
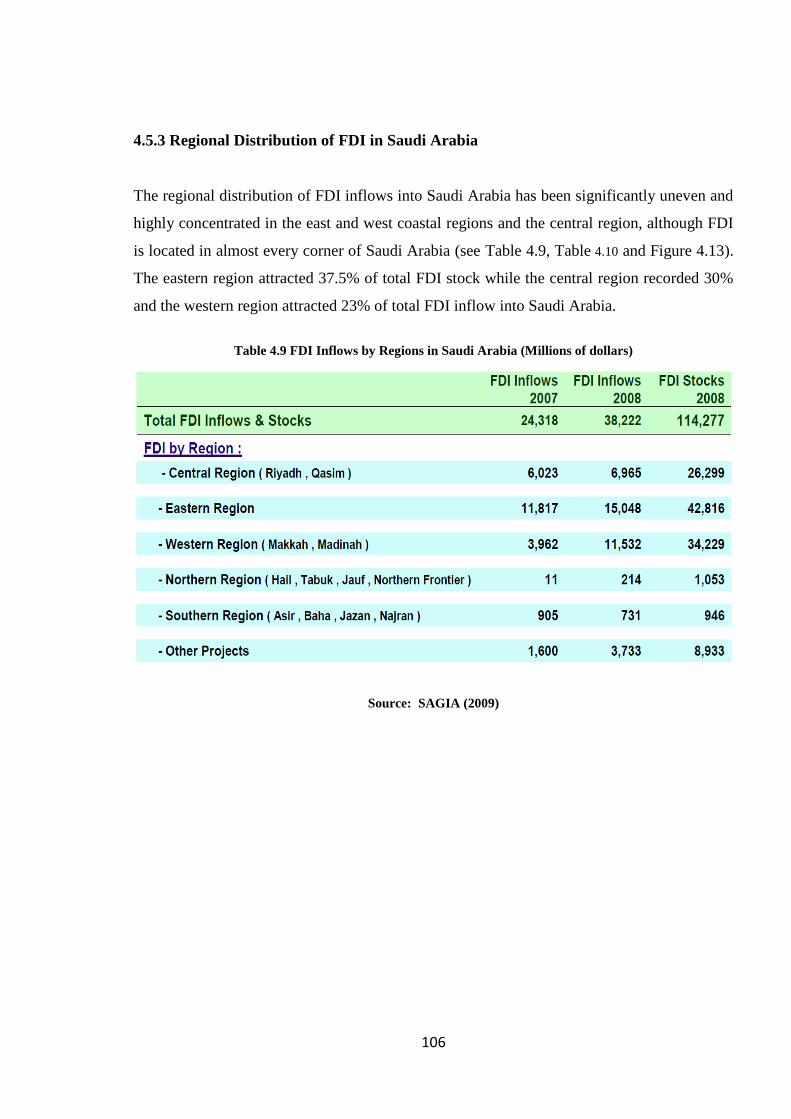
Table 4.9 FDI Inflows by Regions in Saudi Arabia (Millions of dollars) ................. 106
Table 4.10 FDI Stocks by Regions in Saudi Arabia (Millions of dollars) ................ 107
Table 5.1 Location Factors in the Petrochemicals Industry (Mean) ......................... 122
Table 5.2 Major Factors‘ Importance ........................................................................ 124
Table 5.3 Cost Factors‘ Importance .......................................................................... 125
Table 5.4 Market Factors‘ Importance ...................................................................... 126
Table 5.5 Economic Factors‘ Importance ................................................................. 126
Table 5.6 Infrastructure and Technological Factors‘ Importance ............................. 128
Table 5.7 Political and Legal Factors‘ Importance ................................................... 129
Table 5.8 Social and Cultural Factors‘ Importance ................................................... 130
Table 5.9 Saudi Arabia‘s Competitiveness Compared to Other Locations in the
Petrochemicals Industry (Mean) ................................................................................ 132
Table 5.10 Major Factors‘ Competitiveness ............................................................. 134
Table 5.11 Cost Factors‘ Competitiveness ................................................................ 135
Table 5.12 Market Factors‘ Competitiveness ............................................................ 136
Table 5.13 Economic Factors‘ Competitiveness ....................................................... 137
Table 5.14 Infrastructure and Technological Factors‘ Competitiveness ................... 138
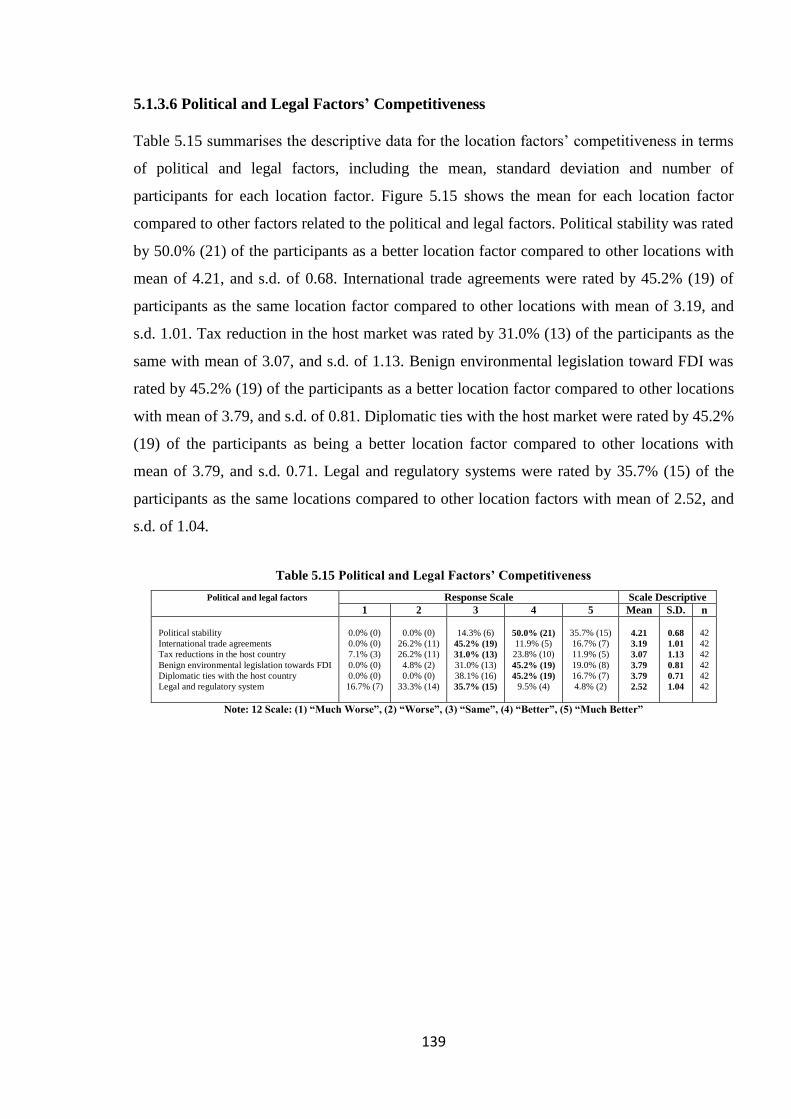
Table 5.15 Political and Legal Factors‘ Competitiveness ......................................... 139
Table 5.16 Social and Cultural Factors‘ Competitiveness ........................................ 140
Table 5.17 The Relative Importance of Location Factors in the Petrochemicals
Industry ...................................................................................................................... 143
Table 5.18 Location Factors‘ Importance Ranking ................................................... 146
Table 5.19 Major Factors‘ Importance Ranking ....................................................... 148
Table 5.20 Priority of Cost Factors ........................................................................... 149
Table 5.21 Priority of Market Factors ....................................................................... 150
Table 5.22 Priority of Economic Factors .................................................................. 152
Table 5.23 Priority of Infrastructure and Technological Factors .............................. 153
Table 5.24 Priority of Political and Legal Factors .................................................... 154
Table 5.25 Priority of Social and Cultural Factors .................................................... 156
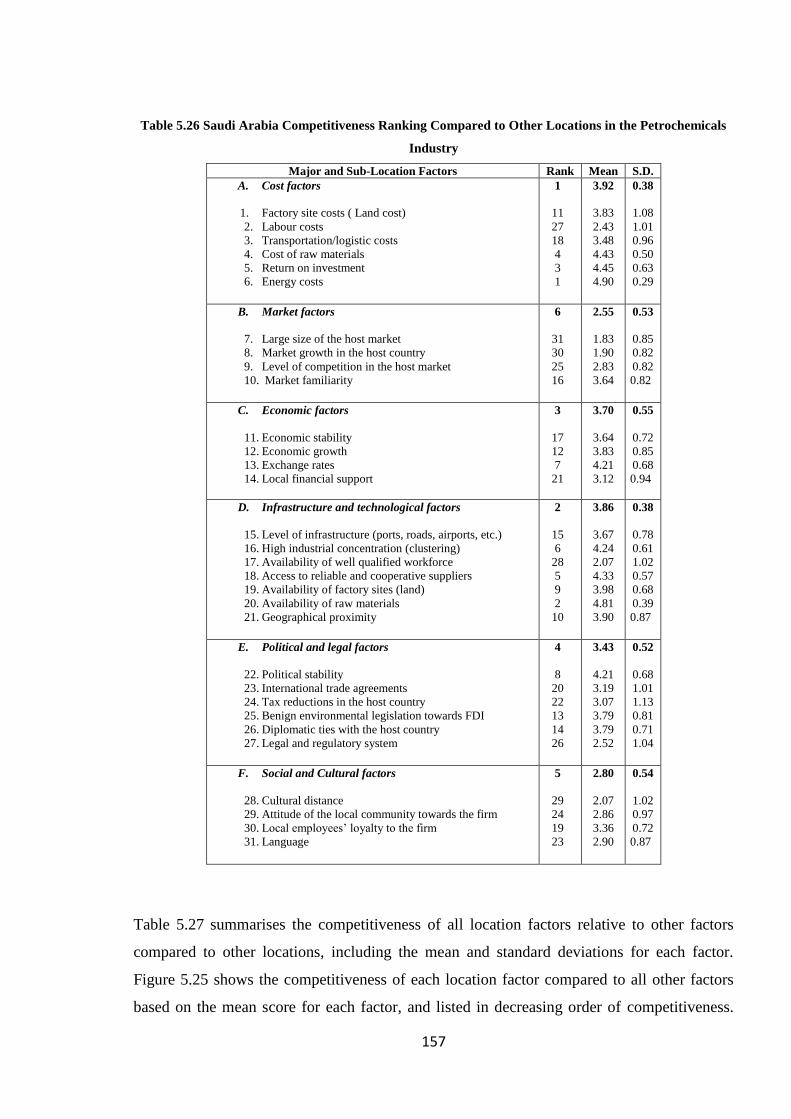
Table 5.26 Saudi Arabia Competitiveness Ranking Compared to Other Locations in
the Petrochemicals Industry ...................................................................................... 157
Table 5.27 Location Factors Competitiveness Ranking ............................................ 159
Table 5.28 Major Factors‘ Competitiveness Ranking ............................................... 161
Table 5.29 Competitiveness of Cost Factors ............................................................. 162
Table 5.30 Competitiveness of Market Factors ......................................................... 164
Table 5.31 Competitiveness of Economic Factors .................................................... 165
Table 5.32 Competitiveness of Infrastructure and Technological Factors ................ 166
Table 5.33 Competitiveness of Political and Legal Factors ...................................... 167
Table 5.34 Competitiveness of Social and Cultural Factors ..................................... 169
Page 12
xii
Table 6.1 the Importance and Competitiveness of Location Factors ........................ 172
Table 6.2 Location Factors‘ Importance Means ........................................................ 181
Table 6.3 Location Factors‘ Importance T-Test ........................................................ 182
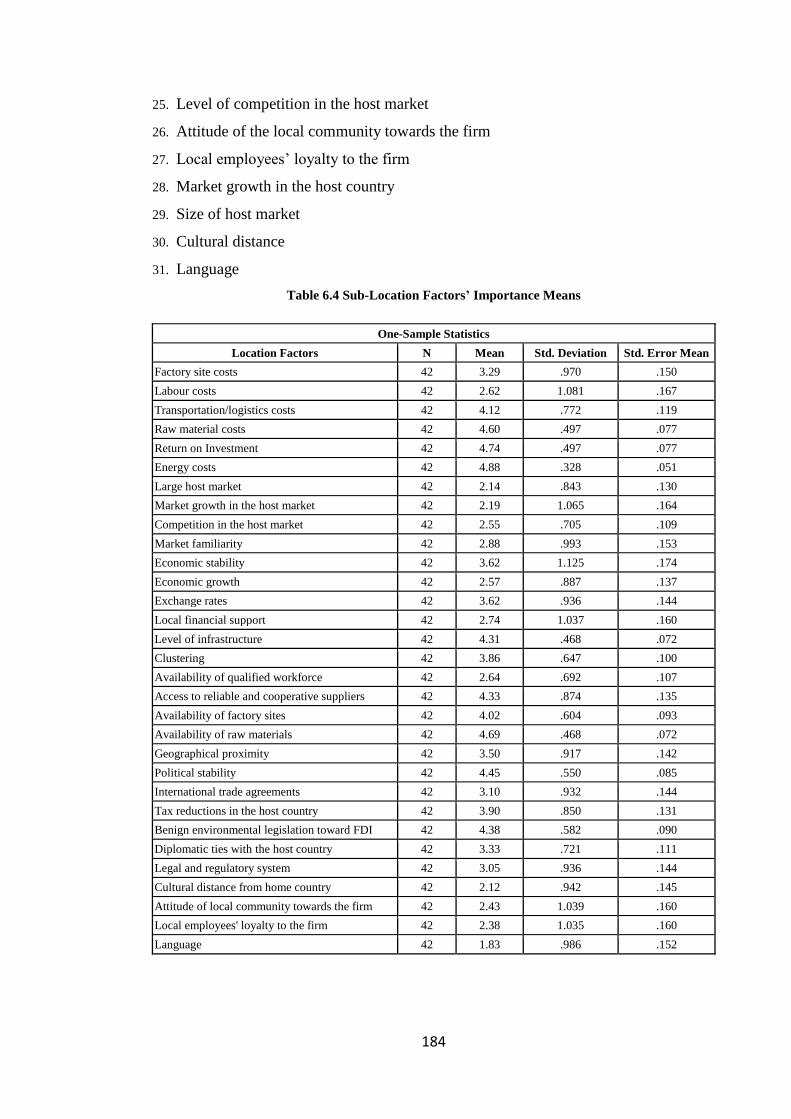
Table 6.4 Sub-Location Factors‘ Importance Means ................................................ 184
Table 6.5 Sub-Location Factors‘ T-Test ................................................................... 185
Table 6.6 Major Factors‘ Importance Means ............................................................ 190
Table 6.7 T-Test for Major Factors‘ Importance ....................................................... 190
Table 6.8 Cost Factors‘ Importance Means ............................................................... 194
Table 6.9 Cost Factors‘ Importance T-Test ............................................................... 194
Table 6.10 Market Factors‘ Importance Means ........................................................ 197
Table 6.11 Market Factors‘ Importance T-Test ........................................................ 198
Table 6.12 Economic Factors‘ Importance Means .................................................... 200
Table 6.13 Economic Factors‘ Importance T-Test .................................................... 200
Table 6.14 Infrastructure and Technological Factors‘ Importance T-Test ................ 205
Table 6.15 Infrastructure and Technological Importance T-Test .............................. 205
Table 6.16 Political and Legal Factors‘ Importance Means ...................................... 210
Table 6.17 Political and Legal Importance T-Test .................................................... 210
Table 6.18 Social and Cultural Factors‘ Importance Means ..................................... 213
Table 6.19 Social and Cultural Factors‘ Importance T-Test ..................................... 213
Table 6.20 Location Factors‘ Competitiveness Means ............................................. 214
Table 6.21 Location Factors‘ Competitiveness T-Test ............................................. 215
Table 6.22 Sub-Location Factors‘ Competitiveness Means ...................................... 217
Table 6.23 Sub-Location Factors‘ Competitiveness T-Test ...................................... 218
Table 6.24 Major Factors‘ Competitiveness Means .................................................. 222
Table 6.25 Location Factors‘ Competitiveness T-Test ............................................. 222
Table 6.26 Cost Factors‘ Competitiveness Means .................................................... 225
Table 6.27 Cost Factors‘ Competitiveness T-Test .................................................... 225
Table 6.28 Market Factors‘ Competitiveness Means ................................................ 227
Table 6.29 Market Factors‘ Competitiveness T-Test ................................................ 227
Table 6.30 Economic Factors‘ Competitiveness Means ........................................... 229
Table 6.31 Economic Factors‘ Competitiveness T-Test ........................................... 229
Table 6.32 Infrastructure and Technological Factors‘ Competitiveness Means ....... 233
Table 6.33 Infrastructure and Technological Factors‘ Competitiveness T-Test ....... 233
Table 6.34 Political and Legal Factors‘ Competitiveness Means ............................. 237
Table 6.35 Political and Legal Factors‘ Competitiveness T-Test ............................. 237
Table 6.36 Social and Cultural Factors‘ Competitiveness Means ............................. 239
Table 6.37 Social and Cultural Factors‘ Competitiveness T-Test ............................. 239
Table 6.38 Pearson Correlations between the 12 Factors‘ Scores ............................. 244
Table 6.39 Spearman Rank Correlations between the 12 Factors‘ Scores ................ 245
Table 6.40 Within-Subjects Contrasts of Mean Location Factors‘ Scores ............... 247
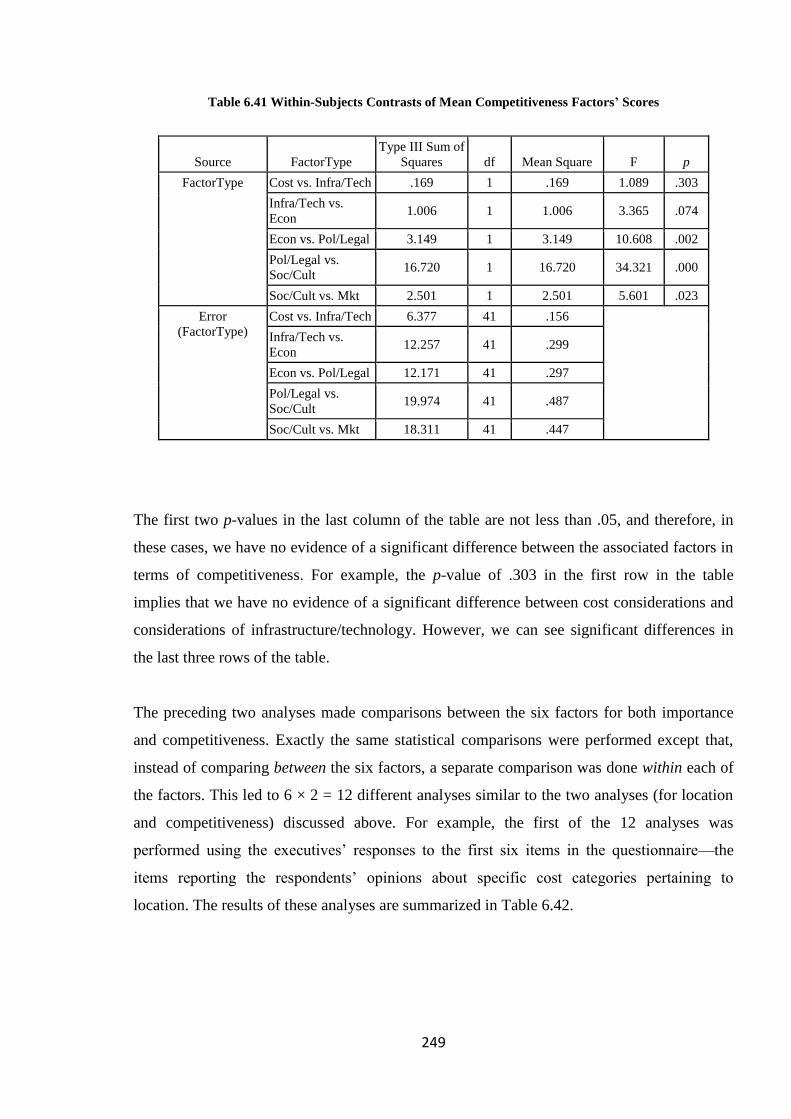
Table 6.41 Within-Subjects Contrasts of Mean Competitiveness Factors‘ Scores ... 249
Table 6.42 Analyses of the Relative Significance of Location Item Scores within Each
Major Factor .............................................................................................................. 250
Table 6.43 Analyses of the Relative Significance of Competitiveness Item Scores
within Each Major Factor .......................................................................................... 251
Table 6.44 Descriptive Statistics for the Six Location Scores .................................. 252
Table 6.45 Results of One-Sample T-Tests for Location Factors ............................. 252
Table 6.46 Descriptive Statistics for the Six Competitiveness Scores ...................... 253
Table 6.47 Results of One-Sample T-Tests for Competitiveness Factors ................. 253
Table 6.48 Multivariate Tests for Different Factors for Importance ......................... 254
Page 13
xiii
Table 6.49 Tests of Within-Subjects Effects for the Importance of the Factors ....... 254
Table 6.50 Tests of Between-Subjects Effects for the Importance of the Factors .... 255
Table 6.51 One-Sample Test for the Importance of Different Factors ...................... 257
Table 6.52 Multivariate Tests for Different Factors for Competitiveness ................. 264
Table 6.53 Tests of Within-Subjects Effects for the Competitiveness of the Factors264
Table 6.54 Tests of Between-Subjects Effects for the Competitiveness of the Factors
................................................................................................................................... 264
Table 6.55 One-Sample Test for the Competitiveness of Different Factors ............. 265
Table 6.56 Paired Samples Statistics ......................................................................... 269
Table 6.57 Paired T-Test for Different Factors ......................................................... 270
Page 14
xiv
List of Figures
Figure 2.1 Host Government Determinants of FDI ..................................................... 18
Figure 3.1 FDI more stable than equity and short-term debt ...................................... 39
Figure 4.1 Natural Gas Prices ...................................................................................... 87
Figure 4.2 Electricity Prices ........................................................................................ 88
Figure 4.3 Water Tariffs in GCC ................................................................................. 88
Figure 4.4 Industrial Water Tariffs Across the World ................................................ 89
Figure 4.5 Manufacturing Labour Costs ..................................................................... 89
Figure 4.6 Corporate Tax Rates for Foreign Companies ............................................ 90
Figure 4.7 Industrial Land Rents ................................................................................. 91
Figure 4.8 Special Economic Cities ............................................................................ 93
Figure 4.9 FDI Stock by Sector in 2008 (Total US $ 114.3 Billion) .......................... 99
Figure 4.10 FDI Inflow by Sector in 2008 (Total US $ 38.2 Billion) ......................... 99
Figure 4.11 FDI Stock by Source in 2008 ( Total US $ 114.3 Billion)..................... 105
Figure 4.12 FDI Inflows by Source in 2008 (Total US $ 38.2 Billion) .................... 105
Figure 4.13 FDI Stock by Region in 2008: (Total US $ 114.3 Billion) .................... 107
Figure 4.14 Saudi Arabia‘s Petrochemicals Capacity 1985-2015 ............................. 109
Figure 4.15 Planned New Global Capacity of Ethylene till 2011 by Region............ 112
Figure 4.16 Major Petrochemical Contracts Awarded in the GCC in 2005-06 ........ 113
Figure 4.17 Planned New Capacity for Propylene till 2010 in the Middle East ....... 113
Figure 4.18 Ethylene Cash Cost of Production in 2006 ............................................ 114
Figure 4.19 World Ethylene Cash Costs (USGC Natural Gas $8.28 per mmbtu, Brent
@ $55 per bbl) ........................................................................................................... 115
Figure 5.1 Importance of Location Factors ............................................................... 123
Figure 5.2 Major Factors‘ Importance....................................................................... 124
Figure 5.3 Cost Factors‘ Importance ......................................................................... 125
Figure 5.4 Market Factors‘ Importance ..................................................................... 126
Figure 5.5 Economic Factors‘ Importance ................................................................ 127
Figure 5.6 Infrastructure and Technological Factors‘ Importance ............................ 128
Figure 5.7 Political and Legal Factors‘ Importance .................................................. 129
Figure 5.8 Social and Cultural Factors‘ Importance ................................................. 130
Figure 5.9 Competitiveness of Location Factors ....................................................... 133
Figure 5.10 Major Factors‘ Competitiveness ............................................................ 134
Figure 5.11 Cost Factors‘ Competitiveness............................................................... 135
Figure 5.12 Market Factors‘ Competitiveness .......................................................... 136
Figure 5.13 Economic Factors‘ Competitiveness ...................................................... 137
Figure 5.14 Infrastructure and Technological Factors‘ Competitiveness ................. 138
Figure 5.15 Political and Legal Factors‘ Competitiveness ........................................ 140
Figure 5.16 Social and Cultural Factors‘ Competitiveness ....................................... 141
Figure 5.17 Location Factors‘ Importance Ranking.................................................. 147
Figure 5.18 Major Factors‘ Importance Ranking ...................................................... 148
Figure 5.19 Cost Factors‘ Importance Ranking ........................................................ 150
Figure 5.20 Market Factors‘ Importance Ranking .................................................... 151
Figure 5.21 Economic Factors‘ Importance Ranking................................................ 152
Figure 5.22 Infrastructure and Technological Factors‘ Importance Ranking ........... 153
Figure 5.23 Political and Legal Factors‘ Importance Ranking .................................. 155
Figure 5.24 Social and Cultural Factors‘ Importance Ranking ................................. 156
Figure 5.25 Location Factors Competitiveness Ranking .......................................... 160
Figure 5.26 Major Factors‘ Competitiveness Ranking.............................................. 161
Page 15
xv
Figure 5.27 Cost Factors‘ Competitiveness Ranking ................................................ 163
Figure 5.28 Market Factors‘ Competitiveness Ranking ............................................ 164
Figure 5.29 Economic Factors‘ Competitiveness Ranking ....................................... 165
Figure 5.30 Infrastructure and Technological Factors‘ Competitiveness Ranking ... 166
Figure 5.31 Political and Legal Factors‘ Competitiveness Ranking ......................... 168
Figure 5.32 Social and Cultural Factors‘ Competitiveness Ranking ........................ 169
Figure 6.1 The Importance/Competitiveness Matrix for the Petrochemicals Industry
................................................................................................................................... 173
Figure 6.3 The Relative Ratings of Importance of the Six Factors ........................... 247
Figure 6.4 The Relative Ratings of the Competitiveness of Saudi Arabia on the Six
Factors ....................................................................................................................... 248
Page 17
2
Chapter 1 : Introduction
1.1 Introduction
In this chapter, we introduce the main body of this research including research background,
research objectives, research questions and hypotheses, research structure, research
contributions, research limitations, and future research direction.
1.2 Research Background
Foreign Direct Investment (FDI) is an important source of capital for growth in developing
countries. It provides a package of new technologies, management techniques, finance and
market access for the production of goods and services. Thus, it contributes significantly to
raising total factor productivity in host countries and helps improve their overall rate of
economic growth.
The Kingdom of Saudi Arabia considers the attraction of increased levels of foreign direct
investment as one of its major economic goals for sustained economic growth. Thus, this
research examines and analyses the location factors that influence location decisions with
regard to FDI, and the major competitive forces that determine FDI inflows in the
petrochemicals industry in Saudi Arabia.
1.3 Research Objectives
There is a startling gap between previous studies and our study on the relative importance and
competitiveness of location factors in respect of FDI location decision-making on the part of
countries and industries. The main objective of this research is to narrow this gap by making
use of comprehensive survey data to identify the relative importance of the location factors in
relation to a specific industry (petrochemicals) and a specific country (Saudi Arabia) and the
competitive drivers that determine the location decision of FDI inflows compared to other
locations.
1.4 Research Questions
Following exponents such as (Tatoglu and Glaister, 1998; Oh, 2001; MacCarthy and
Atthirawong, 2003; Buckley, Devinney and Louviere, 2007; Galan, Benito and Vincente,
2007; Tam, Newton, Strange and Enright, 2008, among others), we use the same questions
that these researchers have asked in their various studies to ascertain whether in the case of
Page 18
3
Saudi Arabia which of the location factors are the main determinants of MNEs FDI location
decisions. Therefore, the questions that we are exploring in this research are as follows:
Q1: What is the relative importance of FDI location factors in the Saudi
petrochemicals industry?
Q2: What is the relative competitiveness of FDI location factors in the Saudi
petrochemicals industry compared to other locations?
Q1 is divided into sub-questions to clarify the purpose of the research. The sub-questions are
as follows:
Q1a: What is the relative importance of cost factors in FDI location decisions in the
Saudi petrochemicals industry?
Q1b: What is the relative importance of market factors in FDI location decisions in
the Saudi petrochemicals industry?
Q1c: What is the relative importance of economic factors in FDI location decisions in
the Saudi petrochemicals industry?
Q1d: What is the relative importance of infrastructure and technological factors in
FDI location decisions in the Saudi petrochemicals industry?
Q1e: What is the relative importance of political and legal factors in FDI location
decisions in the Saudi petrochemicals industry?
Q1f: What is the relative importance of social and cultural factors in FDI location
decisions in the Saudi petrochemicals industry?
The main objective of this research is to explore the relative importance of FDI location
factors in the Saudi petrochemicals industry. In order to answer the research questions, the
main question is expressed in the form of a hypothesis as follows:
H1: The relative importance of FDI location factors will vary in the Saudi petrochemicals
industry.
The main hypothesis above (H1) is divided into the following sub-hypotheses:
H1a: Cost factors play an important role in FDI location decisions in the Saudi
petrochemicals industry.
H1b: Market factors play an important role in FDI location decisions in the Saudi
petrochemicals industry.
H1c: Economic factors play an important role in FDI location decisions in the Saudi
petrochemicals industry.
Page 19
4
H1d: Infrastructure and technological factors play an important role in FDI location
decisions in the Saudi petrochemicals industry.
H1e: Political and legal factors play an important role in FDI location decisions in the
Saudi petrochemicals industry.
H1f: Social and cultural factors play an important role in FDI location decisions in the
Saudi petrochemicals industry.
In the second part of this research, we aim to test the competitiveness of FDI location factors
in the Saudi petrochemicals industry. In view of this, the following questions were expressed
in hypothesis form as follows:
Q2: What is the relative competitiveness of FDI location factors in the Saudi
petrochemicals industry compared to other locations?
Q2 is divided into sub-questions to clarify the purpose of the research as follows:
Q2a: What is the relative competitiveness of cost factors for FDI in the Saudi
petrochemicals industry compared to other locations?
Q2b: What is the relative competitiveness of market factors for FDI in the Saudi
petrochemicals industry compared to other locations?
Q2c: What is the relative competitiveness of economic factors for FDI in the Saudi
petrochemicals industry compared to other locations?
Q2d: What is the relative competitiveness of infrastructure and technological factors for
FDI in the Saudi petrochemicals industry compared to other locations?
Q2e: What is the relative competitiveness of political and legal factors for FDI in the
Saudi petrochemicals industry compared to other locations?
Q2f: What is the relative competitiveness of social and cultural factors for FDI in the
Saudi petrochemicals industry compared to other locations?
The second main question was expressed in hypothesis form as follows:
H2: The relative competitiveness of FDI location factors will vary in the Saudi
petrochemicals industry compared to other locations.
The main hypothesis was further divided into sub-hypotheses as follows:
H2a: Cost factors are competitive for FDI in the Saudi petrochemicals industry compared
to other locations.
H2b: Market factors are competitive for FDI in the Saudi petrochemicals industry
Page 20
5
compared to other locations.
H2c: Economic factors are competitive for FDI in the Saudi petrochemicals industry
compared to other locations.
H2d: Infrastructure and technological factors are competitive for FDI in the Saudi
petrochemicals industry compared to other locations.
H2e: Political and legal factors are competitive for FDI in the Saudi petrochemicals
industry compared to other locations.
H2f: Social and cultural factors are competitive for FDI in the Saudi petrochemicals
industry compared to other locations.
1.5 Research Structure
Chapter 1 includes the research background, the research objectives, the research questions,
hypotheses, the research structure, the contributions of the research and the research
limitations and future directions. Chapter 2 reviews the literature on FDI including definitions
of FDI, the reasons for studying FDI, trends with regard to FDI, types of FDI, key theories of
FDI and the literature on FDI location factors. Chapter 3 includes the background information
on Saudi Arabia, an overview of FDI in Saudi Arabia, and a discussion of FDI inflows into
the petrochemicals industry in Saudi Arabia. Chapter 4 reviews in the first section the
globalization and the political economy of FDI, including political economy of FDI, trends
with regards to FDI, FDI in developing countries, FDI in GCC countries, and FDI in Saudi
Arabia, the second section reviews the research methods, population definition, sample size,
selection of methods, the survey design, data collection, and response rate and the research
questions and hypotheses. Chapter 5 presents the analysis of the research findings, including
analysis of the importance and competitiveness of location factors. Chapter 6 presents the
empirical evidences of the importance/competitiveness of the Saudi petrochemicals industry.
Chapter 7 present the conclusions and implication of the study including the research
conclusions, limitations, future research directions and research contributions.
1.6 Research Contributions
The study derives its importance from its coverage of an area in which there are relatively
few studies in the context of developing countries. We notice that developing countries in
general, and Saudi Arabia in particular, have a great need for this kind of study to understand
what location factors matters the most for FDI location decision and what are the
Page 21
6
competitiveness of theses location factors compare to other locations. As far as the researcher
is aware, this study is the first of its kind in Saudi Arabia to investigate the importance and
competiveness of FDI location factors in the Saudi petrochemicals industry. We therefore
hope that it will be the starting point for subsequent studies, and will provide some useful
insights, policy implications and recommendations for the Saudi Arabian government,
international firms and the international business community. Reviewing Saudi Arabia‘s
economic reform policies and private sector-led investment initiatives, its legal, monetary,
political and social issues and business procedures that enhance or delay FDI inflows are
important steps for local and foreign investors, as well as for the Saudi government, to
understand in terms of the major obstacles that investors face in Saudi Arabia. It also
provides the Saudi government with a clear picture of the strategic steps that should be taken
to attract more FDI into the country. As the global demand for FDI grows, and the supply of
FDI contracts, there is an overwhelming need to understand better the effect of location
factors in respect of FDI location decisions and how these factors shape the final location
destination for FDI.
1.7 Research Limitations
The research has limited geographical focus as it focuses only on FDI located in Saudi
Arabia. Thus, the generalisability of these results to petrochemical industries in other
countries remains to be established. Another limitation is that the survey samples are only
from the petrochemicals industry in Saudi Arabia, and are not representative of other FDI
sectors in the country as well as other sectors in other countries.
1.8 Future Research
Given that this research area has not been covered extensively in the past, the results and
conclusions of this study therefore constitute a significant platform for future work in this
area. It thus gives the opportunity for scholars to extend further international business
research into the relative importance of the location factors and the competitive drivers that
determine FDI location decisions in other industries and in other countries. The finding's of
this study are critical to the international development community and the business
community alike, in order to understand better the complexity of MNEs‘ location decisions.
Page 22
7
1.9 Summary
The introductory chapter serves as a plan for the thesis. An introduction to the tenets of the
research, including the research background and objectives, have been drawn up in this
chapter. In addition, the research questions and hypotheses have also been illustrated. The
chapter also outlines the research structures, research contributions, research limitations, and
future research directions. The next chapter discusses prior studies that have been undertaken
in the area of foreign direct investment location.
Page 24
9
Chapter 2 : Literature Review
2.1 Introduction
For researchers using quantitative methods, the existing literature has a specific use, as they
can discover the gaps in the current studies. It also helps them to develop theoretical and
conceptual frameworks and models and to identify important variables and test the
relationships between them. For qualitative studies, quite often the researcher wants to
discover relevant variables and the relationships between them, and to put these variables
together in a new way. Therefore, the main goal of the literature review is to identify the
problem under consideration, identify related concepts, methods/techniques and facts, and
position the study to add something new to knowledge (Ghauri and Gronhaug, 2005).
2.2 Definitions of FDI
The Organisation for Economic Co-Operation and Development‘s ( OECD) Benchmark
Definition of Foreign Direct Investment (OECD, 2008) sets the world standard for direct
investment statistics. It is fully compatible with the underlying concepts and definitions of the
International Monetary Fund’s (IMF) Balance of Payments and International Investment
Position Manual (BPM). It also follows the general economic concepts set out by the System
of National Accounts (SNA) (Dunning, 2008).
According to the OECD (2008, p. 10), FDI as a ―…direct investment is a category of cross-
border investment made by a resident firm in one economy (the direct investor) with the
objective of establishing a lasting interest in an enterprise (the direct investment enterprise)
that is resident in an economy other than that of the direct investor‖.
The United Nations 1999 World Investment Report (UNCTAD, 1999, p. 465) defines FDI as
―…an investment involving a long term relationship and reflecting a lasting interest and
control of a resident entity in one economy (foreign direct investor or parent enterprise) in an
enterprise resident in an economy other than that of the foreign direct investor (FDI
enterprise, affiliate enterprise or foreign affiliate)‖.
The IMF (1993, p. 7) Balance of Payments Manual defines FDI: ―...Foreign direct investment
reflects the objective of obtaining a lasting interest by a resident entity in one economy
(‗direct investor‘) in an entity resident in an economy other than that of the investor (‗direct
Page 25
10
investment enterprise‘). The lasting interest implies the existence of a long-term relationship
between the direct investor and the enterprise and a significant degree of influence on the
management of the enterprise‖. The IMF recommends a 10% stake for identifying direct
investment. There is, nonetheless, as yet no firm international consensus on the minimum
equity stake deemed necessary for such an effective voice, but for the majority of countries it
is likely to vary between 10% and 25% of the total equity stake of an enterprise (Dunning,
2008).
2.3 Literature on FDI Location Factors
Due to the fact that the literature on FDI location factors is massive, we are limiting our study
to the most important ones related to our study objectives. Moreover, many scholars‘ studies
have focused on several factors, and some of these factors may overlap with each other. For
this reason, we may have some repeatable factors in different sections. Many researchers
have theorised about the potential determinants of FDI location which, when taken together,
identity many possible factors. These factors are now considered along with a brief rationale
for their importance. In the next section, the empirical evidence for these variables is
reviewed (Jones and Wren, 2006).
2.3.1 General Overview of FDI Location Factors
Dunning (1998) stressed that, in recent years, the location behaviour of MNEs when
expanding into cross-border locations has not been the focus in studies on the part of
international business scholars. He explained that the lack of attention of scholars on MNEs‘
location decisions has been because scholars have believed that a firm‘s national location
decisions can be expanded to explain the cross-border location choice and because economics
scholars may have found the current explanations of MNEs‘ location choices to be
acceptable. In addition, they may not be interested in the subject of MNEs‘ location
decisions. According to Cleeve (2007), economists in the 1960s and 1970s (for example,
Hymer, 1960; Kindleberger, 1969) gave more attention in their studies to analysing the
ownership advantages of multinational firms, mostly overlooking the location advantages of
FDI location decisions. However, not much has changed recently, as scholars are still not
giving much attention to the location-specific advantages that have influenced FDI inflows
(Cleeve, 2007; Dunning, 1998; 2002).
Dunning (2000) argues that international business scholars and economists have not focused
Page 26
11
on how MNE activities across the world can be explained by the location-related theories and
how the FDI location can affect the competitiveness of these firms globally. However, the
interest on the part of scholars in the subject of FDI location factors has grown in stature in
recent years. Economists such as Audretsch (1998), Krugman (1991; 1993) and Venables
(1998) and industrial clustering analysts such as Scott (1996), Storper (1995), Storper and
Scott (1995), Cushman (1985), Froot and Stein (1991) and Rangan (1998) identify the role of
exchange rates in affecting the extent, geography and timing of FDI. In addition, business
scholars such as Porter (1994; 1996) and Enright (1991; 1998) have evaluated the
competitiveness of FDI location. Recent studies have extended the location factors that may
affect FDI location to include exchange rates, political risks, host government investment
policies, cultural differences and other new factors (Dunning, 2000).
Dunning‘s (1998) eclectic paradigm points out that the importance of the location decision in
a host country is a critical factor in terms of the location choice of MNEs for their operation
site selection. According to Dunning (2000), since the 1930s there have been many theories
attempting to explain the location choice of FDI and the competitive advantages firms will
gain from locating in a particular country. Some of these theories include the location aspect
of Vernon‘s (1966) ‗product life-cycle‘ theory and that of Knickerbocker‘s (1979) ‗follow the
industry leader‘ theory that improves on earlier theories in terms of explaining the clustering
of an industry. Rugman‘s (1979) risk diversification theory demonstrates that firms prefer to
diversify their investments in different locations to minimise risk. However, as stated by
Dunning (2000), the question of where to locate was not the focus of interest for students of
MNE activities.
According to UNCTAD (1998), when studying FDI location factors, some points should be
acknowledged. First, FDI is not similar to trade, licensing or portfolio investment. Rather,
FDI tends to relate to complex projects that involve long-term commitment to MNEs in
foreign countries. Second, the relative importance of FDI location factors is dependent on
four features of investment: the motive for investment (e.g. market-seeking or efficiency-
seeking FDI), the type of investment (e.g. new or sequential FDI), the sector in which the
investment takes place (e.g. services or manufacturing) and the size of the investors (small-
and medium-sized or large companies). Furthermore, the relative importance of location
factors will change over time in particular countries, as the economic environment in the host
country, and globally, changes. At the same time, the importance of some location factors
Page 27
12
remains stable (UNCTAD, 1998). This document concluded that host countries that offer
what FDI is seeking, and host countries with favourable investment policies toward FDI, will
be in a good position to attract FDI. Moreover, MNEs will also evaluate the relative
importance of location factors based on their ownership and on the international advantages
that support their strategies.
According to Ho and Lau (2007), investment location decisions tend to be dominated by
three theoretical approaches suggested by researchers, including the stepwise approach, the
maximisation approach and the conceptual framework. First, the stepwise approach suggested
by Blair and Premus (1987) shows that firms will firstly form a committee to choose the new
location, and the committee will list the ‗must have‘ factors and the desirable factors in the
new location and will compare potential locations that mostly fulfil the list of factors. The
committee will then choose the location. Second, the maximisation approach is based on
Dunning‘s (1989) eclectic paradigm of FDI, where the location decision is the solution to a
maximisation problem, with ownership advantages, internationalisation advantages and
location advantages all being considered. Although Dunning‘s paradigm provides a
framework for location decision levels, the relevant factors associated with the decision
making process have not been revealed (Ho and Lau, 2007). Third, the conceptual framework
is based on Porter‘s competitive advantages framework. Porter (1990) suggested that a firm
will gain a competitive advantage based on the location they choose, and that the firm must
evaluate the advantages and restrictions of potential locations before they make the final
location decision. The restrictions include the host country‘s investment policies toward
foreign investment, technology limitations and transportation costs.
Cohen (2007) points out that the diverse impact of FDI and MNEs on the world economy and
on the location behaviour of MNEs has not been explained completely in spite of almost forty
years of theories. Cohen points out that the limitations of theory when it comes to explaining
MNE locations are a reflection of the assumptions made by scholars that the local strategic
location of a firm can be generalised to MNE global expansion. Moreover, a single theory
with regard to why FDI take place in foreign markets cannot be applied to other MNE
subsidiaries in other locations, regardless of the size and objectives of the industry. Or, as
Cohen (2007, p. 126) concludes, ―Calculating trade-offs between positive and negative
country characteristics is an art, not a science‖. Investing overseas by MNEs cannot be
blended into a broad economic model that can explain the location behaviour of firms.
Page 28
13
Furthermore, another mistaken assumption in the literature is that a firm‘s decision to invest
overseas normally occurs as a result of detailed research by the firm, and calculations of the
risk and return associated with the investment, without the involvement of senior
management objectives. However, the decision to invest overseas, as suggested by Cohen
(2007, p. 127), is as follows: ―Decisions to build foreign subsidiaries ultimately are based on
the perceptions of a small group of senior managers, not a scientific formula‖ and sometimes
the decision to locate in a particular location is the result of the strong preferences of the
executives concerned. Furthermore, Dunning (1993, p. 68) believes that ―it is not possible to
formulate a single operationally testable theory that can explain all forms of foreign-owned
production any more than it is possible to construct a generalized theory to explain all forms
of trade or the behaviour of all kinds of firms‖.
The FDI location literature is loaded with studies that identify which location factors have the
most important effect on FDI location decisions. However, as explained by Cohen (2007), the
critical objective for firms when expanding overseas is to find a location that gives them the
highest return on investment with the least risk. Cohen (2007) points out that two location
factors play a major role in the location decision in terms of FDI. First, the firms focus on the
return on investment in the foreign market, and what the profit margin will be compared to
other locations, and they will not pay too much attention to a single factor such as labour
costs, but rather, will group factors that will result in a higher profit margin and return on
their investment. Second, firms will focus on the investment environment of the host country
and how friendly and unfriendly the host country is to foreign investors, relative to other
countries in terms of the location for a long-term investment commitment. Cohen (2007)
urges that there are no factors with relative importance to location decisions that cannot be
found in the studies of FDI location decisions. The decision to choose a cross-border location
on the part of a firm is a case-by-case decision, and cannot be generalised to other location
decisions, because the same location factors may be viewed differently by corporate
executives, and the relative importance of these factors will vary according to the type of
investment and the objectives of the firm. In addition, personal firm cultures will give a
different rating to what are considered as important factors. Cohen (2007) believes that only a
resource-seeking FDI has a clear, unchanging priority in terms of location factors when they
make their location decisions. The most important location factors are access to raw
materials, quality infrastructure and a benign investment environment in the host country.
Market-seeking FDI is attracted to large market sizes, economic growth and host government
Page 29
14
membership of free trade agreements. Efficiency-seeking FDI is attracted to less well-
developed countries with low wage costs. Strategic asset-seeking FDI, such as merging with
another firm, may overshadow the host country location factors. Here, the corporate-specific
factors would be the most important aspects to consider.
Surveys asking corporate executives how they rate the relative importance of location factors
are the best way to understand what is important in terms of the location factors for MNEs
(Cohen, 2007). Deloitte and Touche‘s (2002) study of 130 companies from around the world
is the most widely cited survey on the relative importance of location factors from the point
of view of executives. Access to customers is the highest rated factor among the 20 factors in
the survey. Other location factors listed in the survey in decreasing order of importance are: a
stable social and political environment, the ease of doing business, the reliability and quality
of the physical infrastructure, the ability to hire technical professionals, the ability to hire
management staff, the level of corruption, the cost of labour, crime and safety, the ability to
hire skilled labourers, national tax rates, the cost of utilities, the quality of roads, raw
materials, the availability and quality of university and technical training, the availability of
land with services, local taxes, access to suppliers, labour relations and unionisation, and air
facilities.
Buckley, Devinney and Louvriere (2007) believe that most of the empirical studies of FDI
location factors are based on surveys on the location decisions made by firms when they
choose their international investment location. However, Buckley, Devinney and Louvriere
(2007) suggest that these studies contain two limitations. First, they rely only on the location
factor choices of firms, and they presume that these factors can be applied to other firms.
Second, these studies assume that the location decisions of firms follow a systematic
approach. However, the location decisions are made by a range of executives who may
follow different approaches when they make their international location decisions. Buckley,
Devinney and Louvriere (2007, p. 2) conclude that FDI location decisions have not received
attention in the international business literature, and they point out that ―FDI is not a point-of-
time ‗go/no-go‘ decision, but a process‖. Mudambi and Navarra (2003) believe that FDI
location choice studies are missing in the literature. Many empirical FDI location studies that
were based on surveys did not show several important issues, as pointed out by Devinney et
al. (2003). First, the surveys deal with the final location choices of firms, thus we do not
Page 30
15
know what other choices they had and what the relative importance of these choices was
from the point of view of the executives. Second, the surveys are based on internal decisions
within the firms, thus we do not know if the choices are unique to the executives making
them and how these executives‘ location factor choices can be applied to other firms.
Buckley, Devinney and Louvriere (2007) studied the effect of managers‘ experience on the
location decision with regard to FDI. They found that firms with extensive international
experience will give low priority to familiar markets or those similar to those of the home
country. Moreover, as the firms gain experience in the international markets, they may give
higher priority to a host market that is less attractive to other less experienced firms, due to
their lack of unfamiliarity.
Scholars face difficulty in showing the relative importance of FDI location factors because of
scalar differences (Cohen, 2003). Scalar differences appear because of differences in
response styles, which are defined as ―tendencies to respond systematically to questionnaire
items on some basis other than what the items were specifically designed to measure‖
(Paulhus, 1991, p. 17). Dunning (1998) suggests that the motives for FDI location decisions
are influenced by the industry involved in the investment process. Furthermore,
manufacturing FDI would need large investments in fixed assets such as equipment, natural
resources and land than would service FDI. Therefore, service FDI may not give high priority
to the availability of land or natural resources in the host country. Mellahi, Gurmat, Frynas
and Al-Bortmani (2003) also suggested that the relative importance of location factors would
be affected by the sector to which the FDI relates. Bass et al. (1977) found that different
industries place different emphases on FDI factors. Fatehi and Safizadeh (1994) concluded
that political factors affect different sectors in different ways and confirm the diversity of the
importance of FDI location factors by sector.
Identifying the FDI location factors has significant policy implications for the host
governments and international business community alike (Cleeve, 2007). Understanding what
influenced FDI location choices can help policy makers in host countries to understand what
matters the most to FDI location decisions and modify their investment policy accordingly in
order to attract more FDI inflow (Cleeve, 2007). Many policy makers in developing countries
face the problem of identifying the related important factors of FDI inflow. Many studies
provide vast variations of factors that influence FDI inflow, or, as Dunning (2008) suggested,
a shopping list of factors that fail to give the policy makers the correct and specific
Page 31
16
recommendations that identify the most important related factors that influence FDI inflow
for a specific location. Cleeve (2009) believes that policy makers in host markets should
know their markets and economies better and accordingly, they should formulate the policies
that fit their markets the most, because the empirical results are only predictions that will
work differently for each country under the right set of conditions.
Cheng and Kwan (2000) did a study on the influence of FDI location factors in China
between 1985 and 1995, and found that China‘s large market size, well-established
infrastructure and benign environment toward FDI including government policies had a
positive influence on FDI inflow into the country. The authors, however, found that the cost
of wages had a negative effect on FDI inflows into China. Furthermore, they found that
education also had a positive effect on FDI inflow, but was not statistically significant.
Biswas (2002) believes that traditional and non-traditional location factors will jointly
determine the location decisions of FDI. By studying FDI in the US from 44 countries during
the period 1983 to 1990, Biswas concluded that good infrastructure, low wages, political
stability and a good legal system are important factors in attracting FDI. From the author‘s
point of view, these factors play a major role in determining the investor‘s FDI location
decision. Banga (2003) pointed out that, until recently, there had been a strong agreement
between scholars that MNEs choose a specific location for their operations, largely due to the
good economic environment of the host country, such as the existence of a large market,
stable economy, etc. Dunning (1993), Globerman and Shapiro (1999), Shapiro and
Globerman (2001), however, counter-argued that economic factors alone may not be
sufficient to induce FDI inflows due to the globalisation and the integration of global
markets. Therefore, there is an urgent need for international scholars to investigate the new
factors that affect the FDI location in the new global market (Banga, 2003).
According to Banga, the impact of host government policies and investment agreements
would be an important factor to consider. He also concludes that the host country‘s large
market size, low labour costs, availability of qualified labour, good financial system,
investment agreements, low tariffs and low energy costs are significant factors for attracting
FDI inflows. Banga (2003) showed that the effect of the location factors will vary
significantly from one nation to another, especially from developed nations to developing
nations. For example, low tax incentives is a significant factor for the attraction of FDI in
developing countries, but this is not an important factor in terms of attracting FDI to
Page 32
17
developed countries. The UNCTAD report (1992) shows that market factors, human capital,
economic stability, a good financial system and the availability of an infrastructure in a host
country would have a positive effect on FDI inflows. However, an increase in cost factors
such as energy costs and labour costs would have a negative impact on FDI inflows.
According to Cleeve (2004; 2009), the location decision of FDI would be affected by the
motives of investment such as natural resource seeking, market seeking, efficiency seeking
and strategic asset seeking FDI. The natural resource seeking FDI, according to Dunning
(1998) and Caves (1996), is influenced by the availability, cost and quality of natural
resources, the availability of an infrastructure and the investment incentives in the host
country. The market seeking FDI will be influenced by the size and growth of the host
market, the availability and cost of skilled labour, the quality of infrastructures and
institutional, agglomeration and support services, and the macroeconomic policy of the host
government. The efficiency seeking FDI location decision is affected mainly by the
production cost-related factors, the availability of skilled labour, the completion in the host
market, the quality of the infrastructure, economic stability and the availability of
agglomeration economies. The strategic asset seeking FDI location decision is influenced by
the availability of knowledge-related assets, institutional quality, the price and availability of
assets and access to the different cultures and institutions in the host market (Caves, 1996
;Dunning, 1998). Dunning (2004) points out that the location decisions for FDI in most
empirical studies are seen to be affected by motivation factors such as market-seeking,
resource-seeking, efficiency-seeking and asset-seeking. The host-country business
environment, economic conditions, government policies and mode of entry will play a major
role in shaping the FDI location motivations.
The UNCTAD (1998) report has been extensively used by many scholars, including Dunning
(2004), to explain the significance of the location determinants for FDI in a host country and
how these determinants change with the motives for FDI and the investment environment in
the host country (see Figure 2.1). Dunning (2004) asserted that increased intensive
competition in the global markets has forced MNEs to re-evaluate their international location
strategies and has also forced the host governments to reconfigure their investment policies to
attract new FDI and to protect current FDI from going to more competitive countries.
However, MNEs‘ location strategies will be affected by the FDI industry and the motivations
for FDI. Dunning (2004) also pointed out that host governments who want to attract more
Page 33
18
FDI should understand that the location factors that FDI seek in a new location have changed
in recent years. For example, MNEs in developing countries are attracted to traditional
economic factors such as market size, natural resources and cheap labour, while MNEs in
developed countries seek a good business environment, good legal setup, infrastructures to
support the investments, supportive industries and services, and a range of institutions and
government policies that would help improve the FDI operations and global competitiveness
in the host country (Dunning, 2004). Cleeve (2009) also believes that the FDI location
decision in developing countries is motivated by either market access, low costs of
production or the availability and price of natural resources. However, Cleeve (2009) believes
that the importance of market factors is declining.
Figure 2.1 Host Government Determinants of FDI
Source: UNCTAD (1998); Dunning (2004)
Nunnenkamp (2002) believed that the movement of MNEs in the direction of globalising the
marketing and production of their operations has affected the developing countries‘
attractiveness in terms of FDI. MNEs in the early 1990s increased their FDI inflows into
Page 34
19
developing countries as they considered these new locations as profitable for their operations.
Many scholars, including Kokko (2002) and Nunnenkamp (2002), pointed out that
globalisation has reshaped the importance of location factors for FDI in developing countries
and host countries with attractive markets would not be sufficient to attract FDI to them.
Therefore, host governments will face a challenge with regard to offering the right policies to
attract FDI. UNCTAD (1998) pointed out that because of globalisation, MNEs have changed
the way they attempt to achieve their market-seeking, resource-seeking and efficiency-
seeking goals. As countries open their markets for FDI, MNEs now have a large variety of
locations to choose from that best serve their strategies and objectives (Dunning, 1999).
MNEs seek locations where they can combine their own assets most efficiently with the
resources they need for their production for the target market (UNCTAD, 1998).
Nunnenkamp (2002) concluded that globalisation would have two effects on FDI location
factors. First, MNEs have used a wide range of policies when evaluating the host country
with regard to potential investment. Second, the relative importance of FDI location factors
has changed as a result of globalisation. Furthermore, the importance of traditional location
factors has not diminished as a result of globalisation, but their importance in terms of FDI
location decisions has declined. For example, the market size of the host country is one of the
most important location factors in the opinion of many scholars. However, this factor has
diminished in importance in terms of FDI location decisions. At the same time, new factors
have become more important with regard to FDI location decisions – factors such as low
costs, infrastructure quality, a benign business environment and the availability of highly
skilled workers in the host country (UNCTAD, 1996; Nunnenkamp, 2002).
Dunning (1999) concluded that globalisation has changed FDI location motivations.
According to Dunning (2002), the motives for FDI in developing countries have changed
from resource- and market-seeking FDI to (vertical) efficiency-seeking FDI. Moreover,
Dunning (2004), in Table 2.1, shows the changes in the significance of some of these
variables during the last decade or so. Note the four types of FDI set out in Table 2.1 and how
both the principal economic determinants and the responses of host country governments to
these determinants have affected, and are affecting, the location strategies of MNEs.
Globalisation has increased the competition between MNEs and has forced them to cut their
prices. As a result, MNEs would transfer their production sites to low-cost developing
countries. However, FDI in developing countries remain motivated to access natural
resources or the market opportunities provided by the host country (Nunnenkamp, 2002). If
Page 35
20
globalisation changes the FDI location motivational importance, host governments would
find it hard and complex to shape their investment policies in such a way as to attract FDI.
Therefore, host governments can no longer rely on the classic location factors defined in the
literature by many scholars (e.g. market factors) that explain the FDI location decisions.
Moreover, Cleeve (2009) urges that the FDI inflow is shifting from oil and mineral reserves
toward service sectors such as banking and telecommunications. This, according to Cleeve
(2009), indicates that FDI factors are changing and shifting from resource seeking to more
efficiency seeking FDI.
Table 2.1 Changing Locational Variables Affecting FDI, 1970-80 and 1990-2000
Source: Dunning (2004)
Globalisation increased the international competition between countries to induce FDI;
locational advantages based only on traditional location factors that explain FDI location
decisions may be insufficient to attract FDI (Cleeve, 2004). Moreover, Nunnenkamp (2002)
made the point that there is no strong evidence in recent empirical studies to support the view
of the influence of globalisation on competition for FDI between countries, and of the
changes in the relative importance of traditional and non-traditional location factors for FDI
in developing countries. He also concluded that surprisingly slight has change in the relative
Page 36
21
importance of location factors utile now. According to Nunnenkamp (2002), traditional
market factors are still some of the most important factors for FDI location decisions, and the
large size of the host market has become more important rather than weaker. On the other
hand, non-traditional location factors such as cost factors and the business environment have
become less important with globalisation. Furthermore, UNCTAD (1998) concluded that it is
hard to derive any conclusion from these studies as to whether the list of determinants has
changed over time or whether some have gained or lost importance.
Flores and Aguilera (2007) believe that the assumptions underpinning FDI location choices
have shifted in the last 20 years, and that the change in the factors associated with choosing a
location over other locations in terms of FDI remains uncertain and needs more study.
Dunning (1998) urges international business scholars to pay more attention to the changing of
MNEs‘ location preferences in the last few decades due to the globalisation of the world
economies. Buckley and Ghauri (2004, p. 81) pointed out that the ‗next big question‘ in
international business will be ―the analysis of globalization, with a focus on economic
geography, arising from the changing strategy and the external impact of multinational
enterprises (MNE) on the world economy‖. Flores and Aguilera‘s (2007) findings show that
neither economic factors nor institutional-cultural factors taken alone fully explain foreign
location choice. Instead, systematically considering these two factors jointly, we are better
able to explain MNEs‘ choices. They also reveal that the relative importance of location
factors on the part of a firm‘s managers is dependent on the host country. They found that
managers consider a group of location factors related to assets when seeking a motive to
invest in a developed country. However, when they target a developing country, social and
cultural factors play the most important roles with regard to location.
Galan, Benito and Vincente (2007) believed that the FDI location decision is one of the most
complex decisions that managers have to make, especially on the part of MNE managers.
Therefore, MNE managers must understand how the location factors in different countries
can affect their location decisions and how they can benefit from that knowledge in order to
be successful in highly competitive global markets (Dunning, 1998; Narula and Dunning,
2000). Galan, Benito and Vincente (2007) urged that most studies of FDI location factors
have been written without clearly taking into consideration the views of MNE managers,
since they have tended to rely on econometric approaches using secondary data (e.g.
Swamidass, 1990; Woodward and Rolfe, 1993; Loree and Guisinger, 1995; Grosse and
Page 37
22
Trevino, 1996; Tan and Vertinsky, 1996; Ulgado, 1996; Cheng and Kwan, 2000; Zhou et al.,
2002). Galan, Benito and Vincente (2007) point out how the scholars‘ view on FDI location
movements has changed in recent years and how international business studies have had only
a slight interest in FDI location. Dunning (1998) suggests this because scholars wrongly
believe that the location behaviour in the home country of firms can be extended to describe
their international location choices. Dunning (2000), Hosseini (2005) and Galan, Benito and
Vincente (2007) point out that until the 1950s, most theories explaining MNE locations were
based on the exchange of natural resources between countries.
The comparative advantages between countries were the dominant explanation for MNEs
where countries and firms traded the products they produced for products that required
resources and efforts that they were relatively incapable of producing (Dunning, 1998).
However, the model of comparative advantage has been shown to be lacking when it comes
to explaining recent FDI locations (Dunning, 2000; Hosseini, 2005). Because of this, in
recent years, a large number of scholars and researchers have tried to come up with a better
explanation, including new theories and empirical studies explaining the motivations for the
FDI location decisions of MNE managers (Galan, Benito and Vincente, 2007). Some of the
major theories on FDI location are as follows: theories related to the product cycle (Vernon,
1966; 1979); exchange rate theories (Aliber, 1971; Blonigen, 1997); internationalisation
process theories (Hirsch, 1976; Johanson and Vahlne, 1977; 1990); theories of risk
diversification (Rugman, 1979); agglomeration theories (Krugman, 1991; 1993; Porter, 1994;
1996); government incentive theories (Loree and Guisinger, 1995); and theories of location
(Dunning, 1997; Kuemmerle, 1997; Chen and Chen, 1998). However, even these new
theories tend to understate FDI location decisions; they mostly rely on frameworks or models
that test the effect of specific factors on determining the other factors that may be of
importance, as well as the location choice. None of them, however, provides an acceptable
rationalisation of the location factors that influence MNE managers when it comes to making
the final location decision for FDI globally (Galan, Benito and Vincente, 2007).
Dunning (1998) pointed out that the FDI location choice will not be influenced mostly by the
type of industry of the FDI, but will also be affected by the motives of investments and
whether it is a repeated or a new investment. Furthermore, FDI will require a different type of
incentive on the part of host countries when it comes to attracting FDI inflow, where the
types of incentives required by market seeking, natural resource seeking or efficiency seeking
Page 38
23
firms are different (Dunning, 1998). For example, efficiency seeking FDI, which target
markets, are not interested in the national market of the host country. Instead, they may target
the export markets and will be less influenced by the market size of the host country. Instead,
the cost of production will be more important. In contrast, the market size of the host country
will be a very important factor in terms of market-seeking FDI (Campos and Kinoshita,
2003).
Blonigen (2005) points out that recent world trends have led to extensive recent interest on
the part of economists and academics in empirically studying the major factors that motivate
FDI location activities. The literature explaining FDI location decisions is relatively large.
Nevertheless, it is perhaps still in its early years and is still available for anyone to study.
Therefore, it is perhaps not surprising that Chakrabarti (2001) found that most FDI location
factors are quite weak statistically. Scholars should avoid using the general hypotheses that
generally explain the location motivation for FDI inflows, such as low labour costs
encouraging FDI inflows. Additionally, the more innovative and ground-breaking studies that
have studied FDI location factors in the literature have created hypotheses that test which FDI
location factors are considered to be important for FDI and when they are not, and found
innovative solutions to test these hypotheses empirically (Blonigen, 2005). Sethi, Guisinger,
Phelan and Berg (2003) pointed out that, despite most FDI location studies and theories
offering a reasonable explanation for the location behaviour of MNEs, none, however, have
included all the factors related to FDI location, and the methodologies used by these studies
also vary significantly. Sethi, Guisinger, Phelan and Berg (2003) statistically analysed US
FDI into the Western European and Asian regions over the 20-year period 1981-2000. They
revealed that although the Asian region is not considered to be the ultimate location choice
according to the traditional USE FDI location factors, MNEs have made large investments in
Asia to benefit from the considerable low wage costs in this region. Furthermore, the
openness of these countries‘ markets and infrastructure development has influenced US FDI
location in Asia. The Economist Intelligence Unit (2002) studied the most important factors
that affect the location decision for FDI. The business executives in the study indicated that
political stability, institutions, infrastructures, investment policies toward FDI, competition in
the host country and economic conditions are the most important location factors that will
influence the future location of FDI in the coming years.
Tatoglu and Glaister (1998) studied FDI inflow into Turkey and found that the market size,
Page 39
24
the return on investment, economic growth and the host government policies toward FDI are
the most important location factors with regard to FDI in Turkey. They also found that the
relative importance of the location factors in the host country would vary in terms of the
origin of FDI, the sector of interest to the FDI and the size of the investment, and they found
no relationship between the importance of location factors and the type of FDI ownership.
Furthermore, Tatoglu and Glaister (1998) revealed that location motivations for FDI can take
two forms and all play an important role in FDI location decisions. The first is the Ricardian
form that includes natural resources, the labour market and market proximity. The second is
the environmental factors that include the economic, political, infrastructure and legal factors
in the host country. Tatoglu and Glaister summarise the studies that explained the location
factors in terms of market size and economic growth (Aharoni, 1966; Kobrin, 1979;
Davidson, 1980; Buckley and Mathew, 1980; Root, 1987; Young et al., 1989; Sabi, 1988),
raw materials and labour supply (Moxon, 1975; Buckley and Casson, 1985; Dunning, 1988),
the political and legal environment (Goodnow and Hansz, 1972; Kobrin, 1979; Anderson and
Gatignon, 1986; Agarwal, 1994), host government policies (Davidson and McFetridge, 1985;
Goodnow, 1985), the level of industrial competition in the host country market (Goodnow,
1985; Harrigan, 1985a; 1985b), geographical proximity and transportation costs (Goodnow
and Hansz, 1972; Davidson and McFetridge, 1985) and host country infrastructure (Dunning
and Kundu, 1995; Ulgado, 1996). However, according to Tatoglu and Glaister (1998), there
is limited empirical research into the relative importance of location factors for FDI and how
these would vary according to the type of investment.
According to UNCTAD (2006), there are motivations that influence firms when it comes to
expanding or moving their operations to cross-border markets or internationalisation. The
motivations for internationalisation can be defined in terms of ‗push‘ (home country) and
‗pull‘ (host country) factors. Home country push factors that motivate or force the firms to
expand or move their operations out of the home country can include market conditions, costs
of production, local business conditions and domestic government policies. The market
conditions in the home country include the limited opportunity to expand in the local market,
especially when it is a mature market. The cost conditions in the home market may be the
higher production costs, especially labour and resource costs. Home country business
conditions can also force a firm to expand overseas, especially when competition is high in
the home market. The home country‘s conditions can act as a push factor when the local
government policies towards trade are not favourable to domestic companies. Host country
Page 40
25
pull factors include the attractive market of the host country, cost savings in the host country,
the availability of production resources in the host country, a benign business environment in
the host country and the host government‘s open policy to trade. However, UNCTAD (2006)
pointed out that while push and pull factors may influence the location decision of MNEs,
these factors are not sufficient to explain the final choice of MNEs, as the motive and
strategies of firms must be taken into account when analysing the location choice. Location
factors can have a different impact on MNEs‘ location strategies and motives, which explains
the location diversity of MNEs. Furthermore, the motives for investing can differ between
developed country MNEs and developing country MNEs. For example, in the oil extraction
industry, the motive on the part of MNEs from developed countries is to discover resources,
but for MNEs from developing countries, their motive may be to enter a new market because
they already have the raw materials (UNCTAD, 2006).
Campos and Kinoshita (2003) believe that the FDI motive will play a major role in the
location choice and in what type of host country they are looking for. According to Campos
and Kinoshita (2003), there are three types of FDI location motives including market-seeking
FDI, resource-seeking FDI and efficiency-seeking FDI. For market-seeking FDI, the size and
growth of the host-country market is the main driver with regard to location choice. For the
resource seeking FDI, the natural resources, the labour costs and the raw materials in the host
country, that are not available in the home country, are many of the drivers when it comes to
location choice. For efficiency seeking FDI, the clustering of industries and the geographical
location play a major role in FDI location choice. Campos and Kinoshita (2003) conclude
that a host country with a large market, natural resources, geographical proximity to major
markets and low labour costs would be an attractive location for FDI. However, other studies
have shown that other factors also play an important role in FDI location choice (Campos and
Kinoshita, 2003).
Ramady and Saee (2007) studied FDI inflow into Saudi Arabia between 1984 and 1997. They
found that a lack of skilled Saudi manpower, the Saudisation (nationalisation) labour policy
of the Saudi government, high taxes, the fear of foreign companies with regard to entering the
Saudi market alone, and the fact that FDI is concentrated mostly in the petrochemicals and
related industries – all of these factors negatively affect FDI inflows. Mellahi, Gurmat,
Frynas and Al-Bortmani (2003) studied FDI in Oman and found that political and economic
stability are the most important FDI location factors. In contrast, they found that the
Page 41
26
purchasing power of customers, the market size and the availability of low-cost inputs are not
important location factors for FDI in Oman. Abdel-Rahman‘s (2002) study indicated that the
location factors that influence location decisions for FDI in Saudi Arabia are economic
factors, political factors, cost factors, the degree of openness of the economy and the
macroeconomic environment of the country. However, the country‘s GDP growth, exports
and imports, and domestic investment are not significant factors for FDI inflow. Globerman
and Shapiro (1999) believed that the business environment will affect the FDI location
choice. Brewer (1993) concluded that the host government policies towards FDI can
influence the FDI location by changing the relative attractiveness of the host country to FDI,
compared to other locations. If the host countries identify the location factors that are of
greatest importance to FDI, they can use these factors to influence and attract new FDI to the
host country (Billington, 1999). Zitta and Powers (2003) show that human resources, the
political climate, the need for capital, the need for technology, the need for profit, the market
size and the need for growth were found to be important location factors for FDI in the
United States. Mina (2007) examined the location determinants that are favourable in terms
of attracting FDI flows to GCC countries. He found that the market size, trade openness,
institutional quality and the quality of the infrastructure attract FDI inflows, while human
capital, including the availability of well-qualified personnel, has a negative influence on FDI
inflows into the GCC countries.
According to Cleeve (2009), the location advantages are divided into three groups. The first
is the access to and the relative cost of production factors. A firm‘s decision to invest abroad
will be affected by certain geographical factors such as natural resources and man-made
resources. Some of these factors are the quality and productivity of the labour, materials
quality and cost, energy costs, and language and cultural differences between the home and
host country. The second is tax and trade barriers. A foreign company‘s location decision is
affected by the government policies towards foreign firms. These policies include
government intervention, tax rates, incentives, investment claimed, political stability and
trade freedom. The third is transportation costs and access to the market. The importance of
transportation costs in the FDI location decision will be affected by the type of industry. In
some industries such as the construction materials and food, when the quantity and volume
are high, the transportation costs and distance are of importance. On the other hand, in the
knowledge and high technology industry the transportation costs are not important in the FDI
location decision. Usually firms will locate near their market when the goods they produce
Page 42
27
have a higher transportation cost.
Dunning (1993) and others (e.g. Narula and Dunning, 2000; Zaheer and Manrakhan, 2001;
Makino et al., 2002) suggest that MNEs expand into new cross-border markets for several
reasons, all of which are related to the intense competitive global market. These include
overcoming the restrictions on exporting by the home government, to achieve economies of
scale, to expand into new markets, to access new suppliers, to compete with competitors in
the host market, to build a relationship with local customers, to reduce transportation costs
and to benefit from host government incentives (Galan, Benito and Vincente, 2007). All of
these reasons explain the location factors that influence FDI inflow. These have been
highlighted by several empirical studies (e.g. Terpstra and Yu, 1988; Li and Guisinger, 1992;
Woodward and Rolfe, 1993; Grosse and Trevino, 1996; Cheng and Kwan, 2000). Kang and
Lee (2007) found that market size and government policies in terms of economic zones,
quality of labour and transport infrastructure play a positive role in deciding on the location.
On the other hand, labour costs, in-country waterways and distance show negative and
significant correlations. According to Hong and Chen (2001), the major FDI location factors
in China are the controlling advantages of technology for foreign investors, the management
experience of foreign investors, the large market size and growth of China, low labour costs,
the availability of product suppliers, the deflation of the Chinese currency compared to other
major currencies, geographical location, culture and the international business strategies of
foreign investors. Bensebaa (2005) concluded that labour costs, market size, agglomeration
economies, geographical risk and the quality of the infrastructure all play an important part in
influencing the FDI location choice.
Asiedu (2001) examined why Sub-Saharan Africa has been relatively unsuccessful in
attracting FDI, even with policy reform in these countries. He found that in Africa, the FDI
factors that may be recognised by many as being important factors for FDI location might
have a different effect. In particular, infrastructure quality and a high return on investment
would be major factors in other locations, but in Africa they are not considered to be
important enough to attract FDI. However, openness to trade and trade liberalisation received
equal importance in African countries and in other countries. According to Asiedu (2001), all
this suggests that Africa is different. Cleeve (2005; 2006; 2008) showed that the most critical
factors for FDI inflow into Sub-Saharan Africa are market openness, the real exchange rate,
market growth, market size and policy factors such as tax holidays. However, the significance
Page 43
28
of market size and growth rate has become less important in recent years (Cleeve, 2009). In
contrast, human capital, political stability and infrastructure development are becoming more
important in FDI inflow over time (Cleeve, 2009). After studying 16 Sub-Saharan Africa
countries, Cleeve (2004) concluded that traditional factors such as a large market size, good
infrastructures, quality labour and labour costs are important FDI location factors.
Government policies toward FDI are also considered as an important factor for FDI inflows.
The fiscal policy of the host country such as tax holidays and institutions play a very
important role in attracting FDI. Furthermore, after studying the Japanese electronics firms in
the UK, Cleeve (2007) concluded that access to financial markets, the real exchange rate,
agglomeration economies, and the cost and quality of labour are the factors that are important
in FDI inflow. Moreover, Cleeve‘s ( 1997) study on the Japanese firms in the UK concludes
that the most important factors that influenced Japanese firms to locate in the UK were the
low cost and availability of raw materials, low labour costs, low energy costs, tax incentives,
the language and the opportunity to access neighbouring markets. Moreover, Cleeve (2004)
urges that Africa‘s image, as a high-risk investment destination, is affecting the FDI inflow
into Africa as FDI is very sensitive to economic and political risk in the target markets of
their investment. Furthermore, Cleeve (2004) shows that fiscal incentives provided by
African governments have failed to increase FDI in Africa. Cleeve (2004) believes that what
is needed in Africa to attract FDI is political and economic stability, improvements in
investment regulations and improvements in infrastructure and service-supporting services.
According to Cleeve (2004), host countries that provide a stable economic and political
environment have implemented trade liberalisation and privatisation policies and have
adopted international trading agreements that will be more successful in attracting FDI
inflow. Mmieh and Owusu-Frimpong (2004) studied Ghana‘s FDI inflow and showed that
the Ghanaian government‘s execution of its Structural Adjustment Program (SAP) and the
economic improvements policy has led to an increase in FDI inflow. Furthermore, Mmieh
and Owusu-Frimpong concluded that the Ghanaian government‘s efforts to reduce inflation,
promote financial stability, remove FDI licensing requirements, eliminate exchange controls
and limit the foreign exchange black market all lead to Ghana increasing its FDI inflow.
Gilmore, O‘Donnel, Carson and Cummins (2003) studied the FDI location motivations in two
countries – Northern Ireland and Bahrain – in that they share comparable economic and
political features. The study compared the view of executives in foreign companies who had
Page 44
29
invested in the two countries. The findings revealed that the responses in the two countries
were relatively different. However, in both countries, low labour costs were not considered as
an important factor for the FDI location. Moreover, the availability of skilled labour was
regarded as an important motivation for the FDI location in both countries. The findings also
revealed that transportation costs and cultural similarity were regarded as significant location
factors for FDI in Bahrain, more so than in Northern Ireland. Furthermore, the host
government‘s influence in terms of attracting FDI inflow was found to be stronger in
Northern Ireland than in Bahrain, but not to a statistically significant extent.
Tahir and Larimo‘s (2005) research results indicate that the large size of the parent firm,
international experience, large host country market, cultural similarity and low labour costs
will influence the market-seeking and efficiency-seeking FDI. Moreover, a host country with
low inflation, political stability and a stable currency will attract risk-reduction seeking FDI.
In addition, a high level of research and development in the parent firm will attract
knowledge-seeking FDI. Stoian and Filippaios‘s (2008) study showed that Greek firms will
enter similar host countries with a small market size and open economies, and the legal issues
and ease of doing business will play a major role in the location decision for FDI. Buckley,
Devinney and Louvriere‘s (2007) study suggests that the relative importance of location
factors on FDI location decision in decreasing order of importance are return on investment,
market growth, market size, remaining in the same line of business, market stability,
exploitation of assets, asset protection and the cost of the product. They also identified the
least important factors as being established relations in the market, barriers to trade, pre-
emption of competition, access to new resources, currency depreciation, investment
incentives, having a democratic government and culture. MacCarthy and Atthirawong (2003)
suggest that the research into the factors that affect FDI location decisions for manufacturing
companies is limited. By studying a range of location factors that include the location
decision, MacCarthy and Atthirawong‘s study reveals that the top five location factors are
costs, infrastructures, labour, economic factors, and government and political factors. They
also identified other sub-location factors including the quality and the availability of
transportation, political stability, legal factors, telecommunications, the quality and
availability of labour, and other costs related to operations.
Dunning (2008) believes that institutions play a critical role in explaining an MNE‘s location
choice and, because of this, he added such institutions to his OLI framework. Bevan et al.
Page 45
30
(2004) show that MNEs have recently become increasingly interested in the creating-assets
locations, including knowledge-based assets, the infrastructures and the institutions in the
host country (Narula and Dunning, 2000). According to Mudambi and Navarra (2002),
institutions play a major role in terms of FDI location decisions because they symbolise the
intangible factor in the host country, including the political, legal and administrative
environments that will affect, directly or indirectly, the relative transaction costs of
production and will determine the locational attractiveness of the host country. However,
Pournarakis and Varsakelis (2004) found that institutions alone do not give a full explanation
for FDI location choice. Rather, FDI location decisions need a combination of market and
institution factors. Accordingly, FDI prefer locations where the institutional framework helps
the development of their firm-specific advantages, as a result, creating new challenges for
both MNEs and host-government policymakers (Rugman and Verbeke, 2001).
One of the few publications that we found that focuses on the location of the petrochemicals
industry is the paper by Molle and Wever (1984). There are three reasons behind the slow
development of the petrochemicals industry in Western European countries before 1960.
First, the demand for petrochemical products was weak in Western Europe in the 1960s.
Second, the supply of petrochemical raw materials needed for petrochemicals production was
low in Western Europe as they had a limited refining capacity. Third, in Western Europe,
they were relying on coal for producing products similar to petrochemical products and this
was sufficient for satisfying the demand for such products (Molle and Wever, 1984).
However, in the 1960s there was a dramatic change in the petrochemicals industry in Western
Europe as production shifted from a predominantly coal-based operation to a completely oil-
based production process. The increased demand for petrochemical products such as plastics,
fibres and rubber, as well as increasing the capacity of feedstock production in Western
Europe, all contributed to the dramatic increase in the demand for, and production of,
petrochemical products (Molle and Wever, 1984). According to Molle and Wever (1984),
several factors contributed to the location of the petrochemicals industries. These factors
were the output market, the availability of raw materials, the availability of an infrastructure
for transportation and the economics of scale. Molle and Wever made the point that with
limited crude oil production and few sources of raw materials in Western Europe, the location
of the petrochemicals industry there was dominated by market pull factors and transport
factors in terms of minimising transportation costs. Furthermore, other factors also played an
Page 46
31
important role in the location of the petrochemicals industry in Western Europe, including
economies of scale, the availability of raw materials, transportation costs due to locations
near markets, minimising the risks of the transportation of products as most petrochemicals
are dangerous to transport, the proximity to the buyer and the availability of production
complexes (clustering) of the petrochemicals industry (Molle and Wever, 1984).
2.4 Summary
In this chapter, we introduced the concept of FDI and discussed the FDI location factors
including FDI definitions, the reasons for studying FDI, the history of FDI, FDI trends, types
of FDI and key theories of FDI. Furthermore, we also discussed the general literature on FDI
location factors including literature on cost factors, market factors, economic factors,
infrastructures and technological factors, political and legal factors, and social and cultural
factors. This chapter helped this research to formulate the research objectives and to examine
the related location factors in detail. It also helped this research to formulate the research
questions, hypotheses, and explore the gap in the literature. The above review of prior studies
suggests that globalization and the political economy of FDI have had impact on FDI, the
theoretical underpinning which is illuminated in the next chapter.
Page 48
33
Chapter 3 : Globalization and the Political Economy of FDI
3.1 Political Economy of FDI
There have been international organisations engaged in trading activities as far back as 2500
BC, with banks and churches also having formed international organisations throughout
history (Ghertman and Allen, 1984). The appearance of the modern MNE‘s control over
foreign production units did not occur until the nineteenth century (Wilkins, 1977), but early
resemblances to the modern MNE appeared in the 1600s and 1700s, when large trading
companies from the UK and the Netherlands entered parts of Asia, the West Indies and
America. It is generally accepted that the true birth of the modern multinational arose in
Europe in the nineteenth century (see Wilkins, 1986; Rugman and Brewer, 2001; Mossa,
2002; Jones and Wren, 2006; Dunning and Lundan, 2008). However, it was not until the
latter part of the nineteenth century that larger-scale foreign direct investment started to
emerge. A major motivation for the spread of these firms was the increase in the protectionist
behaviour of countries, which in turn was a by-product of increased nationalism
(Micklethwait and Wooldridge, 2003). Other important reasons for the upsurge in FDI and
the growth of MNEs were the search for larger markets as enterprises began to grow in size
and improvements occurring in transportation and communication, most notably the railways
and telegraphs (see Wilkins, 1988; 1986; Rugman and Brewer, 2001; Mossa, 2002; Jones and
Wren, 2006; Dunning and Lundan, 2008).
The increase in FDI at the turn of the twentieth century was halted in the interwar period,
both by the destruction caused by the First World War and by the threat of another war,
leading to discrimination against foreigners by the occupants of many countries (Rugman and
Brewer, 2001; Mossa, 2002; Jones and Wren, 2006; Dunning and Lundan, 2008). The First
World War also resulted in European multinationals being forced to sell their pre-war
investments, with political upheaval and border changes also impacting on cross-border
activities (Dunning, 1983). Other factors leading to a worldwide fall in investment included
the Great Depression of the late 1920s and early 1930s and the substantial rise in inflation in
Europe (Jones, 1995). However, after the Second World War, a new wave of FDI began to
emerge, arising mainly from the US. The factors behind this were improvements in
technology and communication systems, greater economic and political stability, the
formation of trading blocks and a more liberalised attitude on the part of host governments
Page 49
34
(Hood and Young, 1999).
European firms were hindered by a lack of finance from their governments, which, at the
time, were still recovering from the effects of the Second World War. Despite this, both the
US government and the European government welcomed the new wave of FDI into Europe,
as it enabled European firms to gain the latest technologies and helped to reduce European
dependence on US government aid. In the immediate post-war period, the UK had become
the home to the largest share of US investment, mainly as it had a common language, close
historical links and could offer access to the Commonwealth market. Yet, by the end of the
1950s, there was a shift of US FDI from the UK to Continental Europe, following the
establishment of the Common Market (Rugman and Brewer, 2001; Mossa, 2002; Jones and
Wren, 2006; Dunning and Lundan, 2008).
It was not until the latter part of the twentieth century that world FDI flows began to increase
substantially. There are three periods of growth – the late 1970s, the late 1980s and the late
1990s – which were interrupted by recession, so that FDI follows the movement in the
economic cycle. The early years of the twenty-first century saw FDI fall from its record level
in 2000. The main reason for the decline was the slowdown in the world economy, which
included a recession in the world‘s three largest economies, as well as lower stock-market
valuations and reduced corporate profits. However, there have been signs of a recovery, with
flows rising again in 2004 (UNCTAD, 2002; 2003).
The upward trend in FDI in recent decades is seen by many to be part of a wider and growing
phenomenon known as ‗globalisation‘. For many authors, globalisation is seen to represent
the increase in cross-border commercial activities that were a prominent feature of the global
economy in the latter part of the twentieth century (Rugman and Brewer, 2001; Mossa, 2002;
Jones and Wren, 2006; Dunning and Lundan, 2008). According to Teeple (2000), the
conditions that led to a rise in international economic integration, FDI and ‗globalisation‘
stemmed from changes in the world economy that took place after the Second World War.
This process was assisted by the creation of institutions and agencies such as the United
Nations, the International Monetary Fund and the General Agreement on Tariffs and Trade.
These factors provided a framework for international economic integration, but it was not
until the last decade of the twentieth century that globalisation became apparent. Dunning
(2008) attributes this to the increase in technological progress and to market deregulation and
Page 50
35
liberalisation. Dunning (2008) thinks that technological progress is the key component of
rapid globalisation, which has led to a rapid improvement in infrastructures and
communication networks. This has enabled a faster transfer of information at a lower cost,
facilitating the transfer and diffusion of ideas, and has enabled much quicker communication
between firms located in different countries. According to Dunning (2008), policy reforms,
including privatisation, deregulation and the de-monopolisation of national markets, have
also led to an environment that promotes globalisation and FDI. National policy reforms have
resulted in greater competition within countries, while greater international liberation of trade
and investment has resulted in greater competition across world markets. This increased
competition has, in turn, led to a need for firms to invest abroad in order to compete
effectively with their rivals (Rugman and Brewer, 2001; Mossa, 2002; Jones and Wren, 2006;
Dunning and Lundan, 2008).
3.1.1 FDI in Developing Countries
Developing countries are being integrated into the global economy through growing foreign
investment. During the 19th Century, foreign investment was driven by a search for natural
resources. However, companies today are largely either seeking growth by entering
developing markets or reducing costs by relocating some or all of their production facilities to
a location with lower costs. Two factors play a major role in this change: the removal of
policy on the part of the host countries barriers to foreign investment and the large reduction
in transactions cost for MNCs when it comes to relocating their operations to low cost
countries. Many developing countries have been removing trade barriers with regard to FDI.
India, for example, has removed some of the restrictions on FDI entry to the country. The
transaction costs have declined rapidly as the cost of transactions and telecommunications
have been reduced. This has enabled MNCs to relocate their production processes to lower
cost countries (McKinsey, 2003).
According to Dunning (1994), there are many factors contributing to the increase in FDI.
From a host country's perspective, there is the renaissance of the market system, the
globalization of economic activities, the enhanced mobility of wealth-creating assets, the
increasing number of countries approaching the ―take-off‖ stage in development, the
convergence of economic structures among developed countries and in some newly
industrializing economies, the changing criteria by which governments evaluate FDI and a
better appreciation by governments of the cost and benefits of FDI. From an MNE‘s
Page 51
36
perspective there is the increasing need to exploit global markets, competitive pressures to
procure inputs (raw materials, components etc.) from the cheapest possible sources, regional
integration which has prompted more efficiency-seeking investment, the growing ease of
trans-border communications and reduced transport costs, heightened oligopolistic
competition among leading firms, the opening up of new territorial opportunities for FDI, the
need to tap into foreign sources of technology and organizational capabilities and to exploit
economies of agglomeration, new incentives to conclude alliances with foreign forms,
changes in the significance of particular location costs and benefits and the need to better
balance the advantages of globalization with those of localization (Dunning, 1994).
The motives for investment for foreign investors could affect the impact of FDI on a host
country. For example, efficiency-seeking FDI could impact on the sector in terms of the host
country‘s productivity, output and employment. Furthermore, these investments focus on
exports and do not have significant costs to the incumbent domestic firms. For this reason,
many developing countries focus on increasing export-oriented FDI, even while keeping local
markets closed to foreign investors (e.g. India). A typical example of efficiency-seeking FDI
is the business process off-shoring in India. Foreign companies have located part of their
value chain in a lower labour cost country such as labour-intensive data management and
customer support in India. According to a study by McKinsey (2003), the positive impact of
multinational corporations in developing countries goes beyond the claim that efficiency
seeking FDI are consuming their host countries because they pay lower wages and fewer
benefits than they provide in their home countries. In reality, the McKinsey study for
different developing countries found that beyond the economic impact of FDI on the host
country, FDI paid a wage above that of their domestic competitors, and they were expected to
obey the labour regulations of the host country more than were domestic companies. Market
seeking FDI also had a positive impact on the host country‘s productivity and output. In
Mexico, Wall-Mart acquired a leading modern retailer and introduced aggressive pricing cuts
and advanced practices in the operation and supply chain. This change has led other leading
domestic food retailers to improve their operations and, in turn, this has improved the sector‘s
productivity (McKinsey, 2003).
Foreign investors seek local markets and export platforms based on the host country‘s
resources such as low labour cost or the existence of natural resources. Many foreign
investors follow market-seeking intentions. Nevertheless, resource-seeking FDI represent the
majority of large projects, giving them an important role when measuring FDI. Primarily,
Page 52
37
many FDI may be motivated by only one of the objectives, but over time, most FDI create a
range of activities and objectives and serve local and global markets (Mayer, 2005).
The role of MNCs in developing countries has become a major part of the modern argument
over the advantages of globalization (Mayer, 2005). Globalization has led to the opening of
many markets and thus increased competition, not only in developing countries, but also in
developed countries. The supporters of globalization see MNCs as the reason behind many of
the failures of the global economy, from persistent inequality, to sweatshop working
conditions and to environmental degradations. Supporters of MNCs, on the other hand, point
to many of the benefits that the global economy and markets may bring, from lower
consumer prices, knowledge and technology transfer, and the transfer of modern working
values and management practices (Mayer, 2005).
There are two reasons for the changing outlook towards FDI (Chudnovsky and Lopez, 1999).
At the microeconomic level, FDI is considered as a powerful tool for access to international
markets, and for acquiring the technological and management capabilities needed for
producing and exporting new products and services in global competitive markets. In this
way, FDI may enhance the international competitiveness of the host country. At the
macroeconomic level, FDI may be a major source for financing the current account deficit in
the balance of payments of the host country. Furthermore, FDI is considered as less unstable
than portfolio investment and other types of international financial flows. For both reasons,
an increasing volume of FDI is often taken as a major contribution to the development
process in the host country (Chudnovsky and Lopez, 1999). As Dunning (1993, pp. 284)
states, "…many countries in the world are dependent on MNCs as providers of resources,
capabilities and markets, as creators of job and wealth, as suppliers of foreign currency, as
stimulators of entrepreneurship and worker motivation, and as raiser of demand
expectancies".The impact of FDI on the host country depends not only on its volume, but also
on the quality of investment, the type of investment, the destination sector, the type of assets
brought by FDI, and the role played by the affiliates within the global network of MNEs
(Chudnovsky and Lopez, 1999).
Access to foreign technology or know-how is a key factor for economic development in
developing countries. The more complex and rapidly changing the technology, the more
difficult it is for local companies to access the technology they need without foreign
investment (McKinsey, 2003). The economic literature identifies technology transfer as the
Page 53
38
most important benefit of FDI in terms of the host developing country (OECD, 2002). MNCs
are the creator and developer of the world‘s most important technology and research and
development activities, and they normally hold a higher level of technology than is available
in developing countries. For this reason MNCs are likely generate substantial technological
spillovers in host developing countries. However, the level of MNCs generating such
spillovers would vary according to the host country and sector (OECD, 2002).
According to OECD (2002), technology transfer to a host country works via four
interconnected channels: vertical linkages with suppliers or purchasers in the host country;
horizontal linkages with competing or complementary companies in the same industry; the
migration of skilled labour; and the internationalisation of research and development. For
technology transfer to have a positive impact, the technologies transferred by foreign
investors need to be relevant to the host country‘s business sector and the technology gap
between domestic firms and foreign investors must be relatively limited (OECD, 2002). The
importance of FDI technology transfer to the developing countries lies in the fact that
technology transfer to the host developing country cannot be accomplished by way of the
trading of goods and services as well as the investment of financial resources (Economy
Watch, 2010).
FDI has become an important source of private external finance for developing countries. It is
different from other types of capital flows in that it is motivated mainly by the foreign
investors' long term approach to making profits in the host country (Mallampally and
Sauvant, 1999). Capital inflow from FDI is critical for a sector‘s performance and for
development in developing countries. From a macroeconomic perspective, FDI is less
volatile than other types of capital flow (see Figure 3.1). Equity and short-term debt tend to
be highly volatile and speculative, and they were considered to play a major role in starting
and deepening the financial crises of the 1990s. FDI's relative stability and long term
commitment make it the preferred source of foreign capital for many developing countries
(Kumar, 2007). The resilience of FDI during the financial crises may have led many
developing countries to regard it as the private capital of the choice, and some economists
have referred to it as "good cholesterol" for developing countries (IMF, 2001). FDI is viewed
as "good cholesterol" because FDI is bolted down and cannot leave easily at the first sign of
trouble as is the case with other types of capital flows such as short-term debt.
Page 54
39
There are many examples of FDI‘s resilience during financial crises. For example, in East
Asian countries, FDI was extremely stable during the global financial crises of 1997-1998. In
contrast, other forms of private capital flows such as portfolio equity and debt flows,
especially short-term flows, were subject to large reversals during the same period. Domestic
banks in Mexico had been severely undercapitalized after the financial crisis of 1997, and the
FDI inflow was critical for capitalizing and maintaining the stability of the Mexican financial
system (McKinsey, 2003; Economy Watch, 2010). Moreover, the resilience and stability of
FDI during financial crises was also made clear during the Mexican crises of 1994-1995 and
the Latin American debt crises of 1998 (IMF, 2001).
Figure 3.1 FDI more stable than equity and short-term debt
Source: Federal Reserve Bank of Dallas, 2007
FDI provides a broad range of skills to the host country that improves local sector
productivity and leads to a growth in output. These skills include operations/organizations of
functions and tasks, marketing and product design, managerial and organizational skills and
global market access (McKinsey, 2003).
Page 55
40
Operations/organizations of functions and tasks. Large foreign players coming from
developed and competitive home markets brought with them global capabilities in operations
to the host developing country. For example, in China, foreign investors brought to the
country supply chain processes and inventory management, plant operations and disruptions
and advanced business operations (McKinsey, 2003).
Marketing and product design. The host developing country experienced improvement in
marketing skills as a result of foreign players entering the country. For example, MNCs
introduced competitive pricing practices in food retailing in Mexico, improved in-store
marketing and merchandizing in Brazil, while in China and India, some MNCs modified
products to suit local markets (McKinsey, 2003).
Managerial and organizational skills. MNCs brought new organizational and managerial
skills to the host country. These skills included more professionalism in the country‘s culture
and increased accountability, and more specific management tools like performance
measurement and wage structures (McKinsey, 2003).
FDI contributes to human capital formation through training and labour mobility. Employees
who are trained as a result of FDI may move to local firms or create their own entrepreneurial
businesses. FDI helps in creating new jobs and increasing the salaries of the workers in
developing countries. MNCs normally pay salaries and benefits above local standards in
developing countries, which persuades highly trained employees not to leave the foreign firm.
Many successful local firms in developing countries have prior links to MNCs, either by
entrepreneurs or by top managers who worked in MNCs (Mayer, 2005; Economy Watch,
2010).
FDI‘s positive impact on human capital in developing countries could be indirect, occurring
not mainly through the MNCs, but rather through policy makers in the host country seeking
to attract FDI via enhanced human capital. When local employees are employed by MNC
subsidiaries, their human capital may be enhanced further through training and on-the-job
learning. Those subsidiaries may also have a positive influence on human capital
enhancement in other local firms and suppliers. These enhancements can be stronger when
the employees move to other local firms, and some employees become entrepreneurs (OCSD,
2002; Economy Watch, 2010).
Page 56
41
The positive impact of FDI on human capital would depend on the level of human capital in
the host country. This confirms the success of FDI on the growth of China and India, which
have vast, untapped technical workforces, in that China graduates 600,000 engineers every
year and India also produces 210,000 graduate engineers yearly (Kumar, 2007).
The competition within sectors within the host country is a critical driver for improvements in
sector performance as a result of FDI. FDI and the presence of MNCs could have a
significant influence on competition in the host country markets. The presence of FDI in
developing countries may greatly support economic development by encouraging domestic
competition and consequently lead to higher productivity, lower prices and more efficient
resource allocation (OCSD, 2002). The positive impact of FDI on host country competition
can be great because of the combination of scale, capital, and global access capabilities that
allowed MNCs to aggressively narrow the productivity gaps in local markets. FDI can
improve competition in the host market. Such markets tend to be distinguished by low
competition and poor productivity. Competition caused by FDI can benefit domestic
consumers through lower prices. For example, in China, the aggressive competition caused
by foreign players has kept the supplier margins low, and has led to rapidly declining prices
for both Chinese and global consumers (McKinsey, 2003).
FDI, especially in efficiency-seeking cases, provides access to export markets through their
global distribution networks, market position, and brands. MNCs in developing countries are
more likely to share general trade knowledge with local firms, as it is less industry-specific
and not part of their core capabilities. Therefore, sharing that knowledge with local firms
does not jeopardize their own competitive advantage. Furthermore, foreign investors may
help build trade channels and improve the reputation of the country of origin. Local firms
may benefit from this and use it to support their export activities (Mayer, 2005). For example,
in India, leading global players like IBM which have located their off-shoring operations in
India, have established the credibility of the Indian IT sector and opened the door for local
Indian companies to follow suit. This is also the case for the consumer electronics sector in
China as well as the automotive industry in Brazil and Mexico (McKinsey, 2003).
Many developing countries attract FDI as tool for export promotion rather than for
production for local markets. For example, FDI build plants in countries where they can
produce products for export at a lower cost. At the same time, FDI helps boost exports
through the favoured access to markets of the FDI parent country. MNCs, the originators of
Page 57
42
FDI, play a dominate role in global trade, accounting for two-thirds of all cross-border sales.
Foreign affiliates accounted for more than half of China's exports in 2001, and represented
21% of Brazil's exports (Kumar, 2007). The profits that are generated by FDI can contribute
to commercial tax revenue in the host country (Economy Watch, 2010).
FDI also has a positive impact on suppliers in the host country. FDI may support local
suppliers in the host country and markets for specialized inputs, such as labour and materials.
FDI may enhance the quality of products and the services provided by suppliers, such as just-
in-time delivery and default rates. As a result, local firms in turn may improve their
productivity (Mayer, 2005). When a foreign company needs to create a full value chain
within the host country, FDI would lead to major supplier spillovers. For example, in Mexico,
Wall-Mart led to improvements in supplier distribution and to low prices on the part of the
suppliers that led to increased competitions among suppliers and led to productivity
improvements through increases in scale and productivity-improving investment (McKinsey,
2003).
FDI may make a planned effort to improve the quality of local suppliers, particularly for
components that cannot be cost-efficiently imported due to higher transportation cost or
where the local industry has natural cost advantages (e.g. for labour-intensive components).
These effects also benefit firms in other industries such as business service providers such as
accounting or legal services (Mayer, 2005).
The most positive impact of FDI entry to protected markets is to local consumers, who
experience reduced prices, improvements in the quality of products and services, more
product range selection, and increasing domestic competition. For example, in China,
consumers experienced car prices falling by more than 30% between 1995 and 2001 after
multinational auto companies entered the market (McKinsey, 2003). Another example of
FDI benefits to local consumers is Wall-Mart in Mexico, where everyday low prices ended a
long history of hefty margins for local leading retailers, to such an extent that some analysts
credit Wall-Mart for helping Mexico to reduce the inflation rate. In India, the price of
electronic appliances such as air conditions, televisions and washing machines fell by around
10% in 2001 alone, after foreign companies entered the market (McKinsey, 2003).
FDI has the significant potential to promote enterprise development in host countries. The
direct impact includes the achievement of synergies within the acquiring MNE, efforts to
raise efficiency and to reduce costs in local enterprises. Moreover, local firms may benefit
Page 58
43
from efficiency gains in unrelated demonstration effects and other spillovers like those that
lead to technology and human capital spillovers (OCSD, 2002).
The available evidence points to a significant improvement in economic efficiency in local
firms acquired by MNEs, although to degrees that vary by country and by sector. Local firm
acquisition by MNEs leads to changes in the management and corporate governance of such
firms. MNEs normally impose their own company polices, internal reporting systems and
principles of information disclosure on the acquired firm, and a number of foreign managers
normally come from the MNEs. As foreign corporate practices are superior to the ones
existing in the host country, especially in developing countries, this may enhance corporate
efficiency (OCSD, 2002).
Local firms can benefit from FDI in many ways: learning by example, labour mobility, export
market access, improved supply base, or direct relationships with suppliers or customers.
However, the impact varies depending on the type of FDI project, and its ability to develop
local supply networks, its investment in human capital, employee mobility, and the value
added in terms of local operations. Moreover, the impact of FDI will vary with the ability of
local firms to obtain benefits from foreign partners and as a result of FDI by learning from
them. After contact with MNEs, local firms can learn from MNEs and observe innovations
adapted to local conditions and can imitate them (Myer, 2005).
FDI has the potential to bring social and environmental benefits to host countries through the
demonstrations of good practice and technologies within MNEs, and through their spillover
to local firms. The technologies that are transferred to developing countries through FDI tend
to be more modern, and environmentally cleaner, than what is available locally. Furthermore,
local firms may imitate foreign firms' environmental practices through employment turnover
and supply-chain requirements that lead to more environmental improvements in the host
countries. However, to obtain the full environmental benefits of FDI in host countries,
adequate local capacity is needed with regards to environmental practices and the general
technological capabilities of host country enterprises.
In the least developing countries, FDI have, to some extent, a smaller effect on growth within
the host country. Therefore, developing countries have to have reached a certain level of
Page 59
44
development in education, technology, infrastructures, and health before being able to benefit
from FDI (OCSD, 2002).
Negative spillover of FDI in host countries is also possible, notably through crowding out
effects. Foreign firms may gain a market share at the expense of local firms. This could leave
the local firms with excess production capacity leading to low productivity and profitability.
Furthermore, FDI in a host country may be sourced internationally, and therefore weaken the
local industry's suppliers (Mayer, 2005).
Through FDI, foreign investors can gain vital inside information about the productivity of the
local firms under their control. This gives them an informational advantage over uninformed
local investors. Taking advantage of this superior information, foreign investors will tend to
hold productive firms under their control and ownership, and sell low productivity firms to
uninformed local investors (IMF, 2001). FDI may not be of benefit to the host country when
such investment is geared toward serving domestic markets protected by high tariffs or non-
tariff barriers. FDI may strengthen lobbying efforts to maintain the existing misallocation of
resources (IMF, 2001). Through ownership and control of domestic firms, foreign firms
learn more about local firms and the host country's productivity, and they could overinvest, at
the expense of local producers. Moreover, there is the possibility that the most productive
firms will be financed through FDI, leaving local investors stuck with low productivity firms
(Kumar, 2007).
FDI may flow to relatively risky destinations. FDI tends to take advantage of countries where
the market is inefficient. This happens because foreign investors prefer to operate directly
instead of relying on local financial markets, suppliers, or legal arrangements (Liquori, 2009).
Some host countries, especially developing countries, may be worse off as result of FDI
activities. The host-country may lose national control over strategic economic sectors,
domestic firms may move out of certain activities, and local jobs may be lost (Dunning,
1993). As Dunning has clearly pointed out, this implies a difficult and a controversial
question on the real benefits of FDI to the host country, and what would happen in the
absence of MNCs or in the absence of a set of policies aimed at maximizing the net benefits
of MNCs and at building national capability (Chudnovsky and Lopez, 1999). Although FDI
inflows to a host country where domestic polices and institutions are weak, this cannot be
regarded as a criticism of FDI in itself. In reality, without it, developing countries would be
much poorer (Liquori, 2009).
Page 60
45
The relative advantages of FDI during crises are well documented. However, capital escape
during crises can't be ruled out. During financial crises, FDI may be accompanied by distress
sales of local assets, which could be damaging to the host country. Even in normal times,
FDI can be overturned or reduced through domestic borrowing by affiliates of MNEs and the
repatriation of funds (Kumar, 2007).
FDI leads to the import of capital to host countries, but at a later stage, capital is repatriated
through profit payment or project termination. Therefore, the host country pays for the capital
and this could weaken the balance of payment of that country (OECD, 2002). Nevertheless,
FDI capital is critical and welcomed by host countries because it tends to be less volatile than
other forms of capital inflow (UN, 1999).
FDI creates employment, especially in developing countries, and additional jobs may be
created on the part of domestic suppliers. However, FDI may crowd out domestic enterprises
that use more labour-intensive methods of production and accordingly can lead to more
unemployment. The policy related to the net-employment effect in the host country is
therefore hard to assess (Dunning, 1993; UN, 1999).
FDI increases gross domestic investment. However, part of it may be locally funded or the
capital inflow might increase the exchange rate in the host country. Thus the cost of
international borrowing to the host country might increase. This would lead to the crowding
out of domestic investment (Mayer, 2005). FDI generate exports. Yet FDI also generates
imports, especially in the case of market-seeking FDI, and in the case of outsourcing
operations that process imported components (Mayer, 2005).
Dunning concluded in 1993 (p.413) that “…the question is not whether MNE activity is trade
promoting or trade replacing, but whether it is an efficient instrument for the reorganization
of the cross-border allocation of economic activity in a way that is conducive to both national
and international economic welfare”. This conclusion was true in 2009, as transactions have
grown in complexity.
There is the potentially harmful environmental impact of FDI, especially in the extractive and
heavy industries. There are also the risks that a foreign firm could use FDI to export
production processes that are no longer approved in their home countries for environmental
reasons. Moreover, MNEs may move equipment considered environmentally unstable in the
home country to their affiliates in developing countries (OECD, 2002).
Page 61
46
FDI may lack positive linkages with local communities, and the social distractions of
hastened commercialization, especially in developing countries (OECD, 2002). Some
authorities in host countries especially in developing countries have experienced an
increasing dependence on MNEs, resulting in a loss of political sovereignty. Some expected
benefits of FDI may even prove indefinable if, for example, the host country is not be able to
take advantage of the technologies or know-how transferred through FDI (OECD, 2002).
3.1.2 FDI in GCC Countries
According to recent economic development plans and political rhetoric on the part of Gulf
Cooperation Council (GCC) countries, the future prospects for these country‘s social,
economic and political development depends on their ability to attract more FDI inflows.
Since the late 1990s, the GCC countries have improved their business environment, including
their legal business framework, have liberalised entry, have insisted on fewer performance
requirements, have created more incentives, and have initiated more guarantees and
protection for foreign investors. The number of activities with regard to which FDI is banned
or controlled, have been reduced, especially in manufacturing, natural resources and the
service sectors (Mellahi, et al., 2003)
The goal for this improvement in the business environment and in the globalization policies
of GCC governments has been the promotion of increased efficiency through competition,
both locally and globally, with the view to providing a sounder basis for sustainable and real
employment-creating growth. The outlook of global competition demands that enterprises in
GCC countries make the most of their existing assets in order to survive and to succeed in the
global economy (Mellahi, et al., 2003).
Officials and managers in GCC countries often claim that FDI firms in their countries will
improve productivity levels among local enterprises in the same industries in which FDI
occurs, and will operate by improving the distribution of resources and managing them more
efficiently. This is likely for three main reasons. First, FDI and other forms of foreign
investment tend to arise in sectors with relatively high entry barriers. As a result it will help
limit monopolistic distortion and related inefficiencies in the host country. Second, through
either the FDI competitive force or through demonstration, local enterprises operating in
imperfect markets such as in the GCC countries, may be encouraged to introduce a higher
level of efficiency. Finally, FDI present in GCC countries may speed the process and reduce
Page 62
47
the cost of technology and knowledge transfer. Imitation effects and the movement of local
employees who trained at FDI firms in host country also enhance the transfer of management
practices, knowledge or know-how to local firms (Mellahi, et al., 2003).
Based on an interview with King Abdullah of Saudi Arabia (Business Week, 2000), it was
noted that "..GCC countries hope to encourage a more open economy where companies
compete on their merit rather than by connections. They want foreign investors to bring not
just capital but management know-how and technology" (Mellahi, et al., 2003). However, the
FDI slipovers don't arise automatically in the host country. Instead, for the host country to
take full advantage of the presence of FDI, local firms need to invest in learning activities, on
their ability to catch up, and on their level of commitment to learning new ways and
unlearning old ways of management (Mellahi, et al., 2003). Gulf oil producing countries are
going through a foreign investment boom as significant as their first oil boom when they
started to realise the benefits of foreign investment to their economies. While the GCC
countries have played a major part in attracting FDI inflows, their strong economies and
resilience to global crisis have also attracted FDI.
The favourable FDI polices in GCC countries have arisen in acknowledgment of the
unquestionable economic benefits of FDI. Foreign capital in many cases involves a strategic
long-term commitment, and tends to be stable and sticky. Therefore, it provides an attractive
alternative to historically dominated bank credit which is often not readily available on
favourable term for long-term investment (NCB, 2010).
The ability of GCC countries to attract large amounts of FDI in recent years has emerged as
one of the most impressive success stories of the Gulf Region, and a sign of its growing
integration into the global economy. The relative resilience of the GCC countries to global
crises in attracting FDI flows has highlighted the progress made in improving the business
environment and the favourable macroeconomic fundamentals in these countries.
Governments in the Region are continuing with their efforts to attract FDI with a number of
new regulatory programmes as well as image building. However, the regulatory environment
facing FDI in GCC countries remains unfavourable (NCB, 2010). FDI is also an important
supporter of the GCC countries‘ increasingly urgent diversification efforts.
Access to know-how, experience, and pre-existing solutions can serve as an effective way of
development with regards to new areas, and the accelerating of the catch-up process in
sectors that are lagging behind objectives or their proper perspective (NCB, 2010). FDI can
Page 63
48
improve the competitive edge of local firms by exposing them to established foreign rivals,
thereby forcing them to develop their management practices and strategies and to learn from
example. The main challenge for the GCC countries in attracting FDI has been their status as
one of the world's leading holders of capital. This has shaped the perception that the region,
which controls around 45% of the world reserves of oil, does not need foreign capital from
FDI. Rather they need technology transfer, know-how and employment (NCB, 2010).
3.1. 3 FDI in Saudi Arabia
The Saudi Arabian government has sent a strong signal that it welcomes FDI inflows into the
country by establishing the Saudi Arabian General Investment Authority (SAGIA) to
improve the business environment and to attract more FDI inflow (Ramady, 2006). Some
host countries evaluate the level of economic reform programmes in terms of how successful
they are in attracting large quantities of FDI. However, the quantity of capital inflow is not
enough to evaluate the effectiveness and benefits of FDI to a host country.
The advantages related to FDI for those countries such as Saudi Arabia that have experienced
a capital surplus are many. First, FDI in Saudi Arabia will lead to higher productivity and
improved labour standards through the demonstration effect of FDI in the way that they
manage production processes and systems. Second, local firms will benefit from modern
know-how and technology transfer as a result of FDI. Third, the government of Saudi Arabia
looks at FDI as a potential method of reducing the high level of unemployment among
Saudis. In a 2010 study by the National Commercial Bank (NCB), Saudi Arabia's largest
bank, FDI in the GCC countries is an important source of employment. According to the
NCB, FDI projects in Saudi Arabia employ 375,000 people, 27 per cent of whom are Saudis,
and generate salaries of $7.8 billion (NCB, 2010). Fourth, FDI improves and creates a local
skilled workforce, and who can be employed by local firms. For example, the Saudi
petrochemical industry is one such case in point, whereby the foreign joint venture
petrochemical partners have brought in advanced management and training practices and
young Saudis have benefitted from foreign partners training programmes and have moved on
to senior positions and taken up management responsibilities in other domestic firms.
However, this argument does not hold if the foreign firm is highly capital-intensive and relies
on a small skilled workforce (Ramady, 2006). Fifth, FDI within the Saudi Arabian economy
will not lead to banking or debt crises compared with financing lending from abroad, such as
happened with many Latin American countries that saw an inward inflow of capital, not in
Page 64
49
terms of projects, but as government lending. Many countries have become so dependent on
foreign loans that it takes them many years to remove the debt servicing obligations and for
them to obtain a better borrowing rating (Ramady, 2006). Sixth, unlike international loans,
part of the profit of FDI in Saudi Arabia is reinvested in the country, which leads to further
growth in project investment.
The disadvantages of FDI should not be ignored. One such disadvantage is that successful
foreign operations could drive local competitive firms out of the market as foreign investors,
especially in developing countries, have superior technological know-how and management
techniques compared to domestic enterprises. When MNEs may borrow from local banks in
order to expand, the result could drive borrowing rates up, causing difficulties for domestic
firms when it comes to borrowing. FDI could concentrate on narrow base sectors and
investment in the host country such as mining and other forms of natural resource extraction,
which could limited the benefits to a small section of the population (Ramady, 2006).
Fortunately, for Saudi Arabia, some of these potential drawbacks in relation to FDI are
limited, as the oil sector is under government control, and most mineral and petrochemical
projects are through joint ventures. Despite the fact that there is significant FDI concentration
in the petrochemical industry in Saudi Arabia, equally there is also evidence that foreign
firms are operating in many sectors of the economy. Furthermore, the Saudi petrochemical
sector doesn't seem excessively worried at the opening up of this profitable sector to FDI.
FDI has forced Saudi petrochemical companies to become more competitive, more
productive, and have a greater global perspective than before (Ramady, 2006).
The major FDI benefit that Saudi Arabia obtained from the opening up of its market was to
be considered in terms of the transfer of up-to-date technology, the transfer of knowledge or
know-how, employment for Saudis, and sophisticated management practices, rather than
capital inflows in terms of FDI. Based on an interview with King Abdullah of Saudi Arabia
(Business Week, 2000), it was noted that "…GCC countries hope to encourage a more open
economy where companies compete on their merit rather than by connections. They want
foreign investors to bring not just capital but management know-how and technology"
(Mellahi, et al., 2003).
The Saudi government developed a strategic plan to diversify its economy from its almost
complete dependence on crude oil exports, to a broader industrial base. The diversification of
Page 65
50
the country's sectors became a major aspect of the Saudi government‘s economic strategy. As
a result, the government has encouraged the development of a wide range of industries.
In its efforts to diversify its economy and to transfer technology, management and training
for its nationals, in 1976, the Saudi government created the Saudi Basic Industries
Corporation (SABIC), that manufactures petrochemical products. SABIC was founded as the
fruit of an ambitious vision. Natural gas, a previously useless by-product of oil extraction
which often polluted the air has been transformed into valuable petrochemical products and
has also been a major source of supply to the world and an export earner to the Saudi
government (SABIC, 2000).
In just 25 years, SABIC now ranks second among the top 100 Saudi companies, exceeded in
assets only by Saudi Aramco. SABIC has become the largest non-oil industrial company in
the region. SABIC today sells its products to customers in more than 100 countries. SABIC
has made itself a leading manufacturing and global marketer of hydrocarbon and metal
products. It has made a major contribution to the Saudi economy and has led the way into
industrial diversification. Moreover, SABIC has created thousands of new jobs, both directly
and indirectly, for Saudi nationals. It has more than 30,000 Saudi and multinational
employees, and has developed a highly trained skilled workforce capable of operating the
company safely and efficiently.
Much of the success of SABIC today can be rooted in its founders‘ strategy to reach out to
multinational companies through partnership, such as FDI through joint-ventures, to enable
the company to have the technology, the technical expertise, and the market access and
experience that they need from well-known companies such as Shell, Chevron and Exxon.
The majority of SABIC projects are joint-ventures. As Abdulaziz Al-Zamil (SABIC, 2000.
p.5), the first Vice-Chairman of SABIC, recalled "As we took steps to develop a
petrochemical industry for Saudi Arabia, we had as assets the money, the raw materials, and a
delivery system. What we did not have was the technological know-how and the commercial
experience in the markets of the world that we needed to make a quality product and sell it.
For these two assets, we needed to draw from wells of knowledge outside the Kingdom." The
Saudi government knew from the start that the world‘s major oil companies possessed the
world's leading technologies, global market experience, and sophisticated management
expertise, but what those companies needed was petroleum. On the other hand, Saudi Arabia
has the world's largest petroleum reserves, but they need technology, know-how, and
Page 66
51
training. Therefore, the relationship between the two parties was a relation of equal and
mutual interest, and each party got what it needed, and everyone benefits. The joint venture
firms associated with SABIC provided the company with the technology, the know-how, the
sophisticated management practices, and training for the Saudi workforce. Saudis were
trained in the United States, Japan, and other developed countries as a result of the
partnership between foreign companies and SABIC. The training of a young Saudi workforce
for the role they would have to play in their nation‘s drive toward industrialization, was the
most critical element with regard to the achievement of long-term success. As result, the
Saudi workforce learned how to run modern petrochemical plants in a more productive way.
When the foreign professionals go home, Saudis will have to take over, do the work and do it
well. Saudi nationals at SABIC today account for 85% of the total number of employees
(30,000), most of whom are engineers and skilled technicians. They also occupy 99% of
management positions in SABIC and its affiliates. Furthermore, Saudis make up 79% of
employees in the administrative field, 77% in technical areas, 63% in engineering, 72% in
information technology, 78% in finance and 100% in safety and security (SABIC, 2009).
Long-term SABIC partnerships with industrial leaders is one of the company‘s core strategies
for growth, and its success in joint ventures has been cited as a model for developing
countries.
3.1.4 Summary
In this section we showed that FDI are integrating developing countries into the global
economy, creating large economic benefits for both the global economy and for the
developing countries. As far as the developing countries are concerned, FDI is a major tool
for integrating them into the global economy by improving the standards of living,
transferring technology, transferring and improving management skills, increasing
productivity, sources of finance (capital), encouraging stability during crises, transferring
marketing and production design, increasing competition, increasing access to export
markets, reducing prices and improving quality to local consumers, and introducing social
and environmental benefits. However, FDI may be considered a disadvantage to host
developing countries through negative spillover. Foreign firms may gain access to inside
information about local firms and come to control them, FDI may flow to riskier countries,
and FDI may be harmful to a host country's environment. The future prospects of the GCC
countries in terms of social, economic and political development depends on its ability to
attract FDI. FDI in GCC countries improve productivity levels among local enterprises and
Page 67
52
improves and manages resources more efficiently. They bring in not just capital, but
management know-how and advanced technology. Saudi Arabia considers the FDI inflow as
being vital to its economic and social improvements. FDI in Saudi Arabia will lead to higher
productivity and labour standards, local firms benefitting from know-how and technology
transfer, a reduction in unemployment among Saudis, and capital inflows. There are some
disadvantages of FDI in Saudi Arabia including the fact that FDI could drive local
competitors out of the market, could drive borrowing rates up, causing difficulties for local
firms when it comes to borrowing, and could concentrate on narrowly based sectors such as
mining and other forms of natural resource extraction. However, the disadvantages associated
with FDI are limited in Saudi Arabia, as the oil sector is under government control, and most
mineral, petrochemical, and other large projects are done through joint ventures. This section
helped us to shape the research methodology for this research, which is discussed in detail in
the next section.
3.2 Research Methods
3.2.1 Introduction
This section describes the instruments used in this research, including the population
definition, the survey sample, instrument development, data collection procedures and data
analysis techniques. The techniques that are most suitable for a particular type of research
depends on the research objectives and problems. Ghauri and Gronhaug (2005, p. 109) define
research methods as follows: ―Research methods refer to systematic, focused and orderly
collection of data for the purpose of obtaining information from them, to solve/answer a
particular research problem or question. The methods are different from techniques of data
collection‖. The methods in research refer to the way that we gather the data through
historical review and analysis, surveys, experiments and case studies. On the other hand,
research techniques refer to the step-by-step procedure that the researcher follows in order to
collect data and to analyse and answer the research questions (Ghauri and Gronhaug, 2005).
3.2.2 Research Approaches
A researcher observes and faithfully records what is seen without any prejudice. Some of these
statements of observation are established as true and serve as the basis for theories and laws.
There are two ways of establishing what is true or false and to draw conclusions: induction
and deduction. Induction is based on empirical evidence, while deduction is based on logic
Page 68
53
(Ghauri and Gronhaug, 2005). Deduction owes more to positivism and induction to
interpretivism (Saunders, Lewis and Thornhill, 2007).
Inductive approach theory would follow data rather than vice versa, as is the case with a
deductive approach (Saunders, Lewis and Thornhill, 2007). Through induction, we draw
general conclusions from our empirical observations. In this type of research, the process goes
from observations, findings, theory building and incorporating findings back into existing
knowledge (literature/theories) to improve theories. In this research, therefore, theory will be
the outcome of the research (Bryman and Bell, 2007). This type of research is often associated
with a qualitative type of research. It is, however, important to note that we can never be 100
per cent sure about the above inductive conclusions, as these conclusions are based on some
empirical observations.
Deduction owes much to what we would think of as scientific research. It involves the
development of a theory that is subjected to a rigorous test. As such, it is the dominant
research approach in the natural sciences, where laws present the basis of explanation, allow
the anticipation of phenomena, predict their occurrence and therefore permit them to be
controlled (Saunders, Lewis and Thornhill, 2007). By deduction, we mean that we draw
conclusions through logical reasoning. In this case, it need not be true in reality, but it has to
be logical. The researcher in this type of research builds/deduces hypotheses from the existing
knowledge (literature), which can then be subject to empirical scrutiny (testing) and thus can
be accepted or rejected. The researcher‘s main job is not only to built hypotheses from existing
knowledge, but also to present them in operational terms (operationalisation), to show how
information can be collected in order to test these hypotheses and the concepts being used
(Bryman and Bell, 2007). In this type of research, theory and hypotheses build on it, come first
and influence the rest of the research process. This type of research is often associated with the
quantitative type of research.
3.2.3 Research Design
The research design is the overall plan for relating the conceptual research problem to
relevant and practicable empirical research. In other words, the research design provides a
plan or a framework for data collection and its analysis. It reveals the type of research (e.g.
exploratory, descriptive or causal) and the priorities of the researcher. Research methods, on
the other hand, refer to the techniques used to collect data (Ghauri and Gronhaug, 2005).
Page 69
54
Empirical research is carried out in order to answer or elucidate research questions. Poorly
formulated research questions will lead to a misguided research design. The strategic choice
of research design should come up with an approach that allows the researcher to solve the
research problem in the best possible way, within the given constraints.
Based on the structure of the problem, we may distinguish between the three main classes of
research design. There is exploratory research. When the research problem is badly
understood, a (more or less) exploratory research design is adequate. In terms of descriptive
research, the problem is structured and well understood. In causal research, the problem
under scrutiny is also structured. However, in contrast to descriptive research, the researcher
is also confronted with ‗cause and effect‘ problems (Ghauri and Gronhaug, 2005).
3.2.4 Data Sources
A first distinction can be made between secondary and primary data sources, according to
Ghauri and Gronhaug (2005, p. 91), as follows: ―Secondary data are information collected by
others for purposes that can be different from ours. Primary data are original data collected by
us for the research problem at hand‖. These two types of data sources are discussed in some
detail.
3.2.4.1 Secondary Data
Bryman and Bell (2007, p. 326) defined secondary data as ―the analysis of data by researchers
who will probably not have been involved in the collection of those data, for purposes that in
all likelihood were not envisaged by those responsible for the data collection‖. Secondary
data are useful, not only to find information to solve our research problem, but also to better
understand and explain our research problem. In most research, we need to begin with a
literature review involving earlier studies on and around our topic of research. This will
include books, journal articles or data sources such as web pages of firms, government
publications, those of semi-government organisations and catalogues (Ghauri and Gronhaug,
2005; Bryman and Bell, 2007). Secondary data can help researchers in the following manner:
by answering research questions or solving some or all of the research problems; helping in
problem formulation and/or devising more concrete and focused research questions; deciding
about the appropriateness of a certain research method or even suggesting better research
methods for a particular problem; providing benchmarking measures and other findings that
Page 70
55
can be compared later on with the results of the study at hand (Ghauri and Gronhaug, 2005;
Bryman and Bell, 2007).
Secondary data offer some advantages over other types of data. The biggest advantage of
using secondary data is the vast saving in resources, especially time and cost, compared to the
researcher collecting the data. If the researcher needs to gather data quickly, secondary data is
the best choice (Ghauri and Gronhaug, 2005; Bryman and Bell, 2007).The majority of the
data collected by international organisations and governments are of high quality and
trustworthy, because the collection has been done by experts in their fields (Ghauri and
Gronhaug, 2005; Bryman and Bell, 2007).Opportunity for longitudinal analysis. Secondary
analysis can offer the chance for accessing and analysing data over a long period of time or
using a time series analysis (longitudinal research), which is rather uncommon in business
and management research because it involves high costs and takes a long time to perform
(Bryman and Bell, 2007).Opportunity for cross-cultural/international research. Secondary
data offers the opportunity to compare data from other countries at low cost and takes less
time (Ghauri and Gronhaug, 2005; Bryman and Bell, 2007).Help in finding a suitable method
or source of data. With secondary data, a researcher can screen research done by others to
find the best methods and data for a specific piece of research (Ghauri and Gronhaug,
2005).Offers more time for data analysis. As data collection is considered to be one of the
most difficult phases of research because of the time and the cost involved, and could affect
and limit the time spent on analysis, secondary data provide more time for the analysis of the
data (Bryman and Bell, 2007).Re-analysis may offer new interpretations. By re-analysing
secondary data, the researcher may arrive at new findings (Bryman and Bell, 2007).
Taking into account all these advantages, many scholars recommend that all research should
start with secondary data sources. Occasionally, secondary data give enough information to
find the research problem and answer the research questions. In such a situation, there may be
no need to collect primary data (Ghauri and Gronhaug, 2005).
However, secondary have some disadvantages over other types of data. It may not be
appropriate for the study that the researcher wishes to undertake. As the data in the form of
secondary data were collected for a different study that had a different aim, they may not
completely fit the current study and may not answer the current study‘s research questions,
and consequently will not meet the study‘s objectives (Ghauri and Gronhaug, 2005;
Page 71
56
Saunders, Lewis and Thornhill, 2007).Difficulty in understanding the data. As the secondary
data were collected by others, the researcher may find it difficult to understand the structures
and outlines of the data as they are not familiar to the researcher (Ghauri and Gronhaug,
2005; Bryman and Bell, 2007).Absence of key variables. Because the secondary data were
collected by others for a purpose other than that of the current study, some variables may be
absent or may have been ignored (Bryman and Bell, 2007).No control over data quality. The
researcher may find it difficult to ascertain the accuracy and the quality of the secondary data
(Bryman and Bell, 2007).Variables may be defined differently. Secondary data involve
variables or measurement units that are very different from those used in the current research.
This makes the comparison between the two data or studies invalid (Ghauri and Gronhaug,
2005). Access may be difficult or costly. As secondary data may have been collected for
commercial reasons, gaining access may be difficult or costly (Saunders, Lewis and
Thornhill, 2007)
3.2.4.2 Primary Data
When secondary data are not available or are unable to help answer our research questions,
we must collect the data that are relevant to our particular study and research problem
ourselves; these data are called primary data (Ghauri and Gronhaug, 2005). What we should
look for, ask about and collect depends upon our research problem and the research design.
We have several choices as regards the means of collecting primary data. Usually this
includes observations, experiments, surveys (questionnaires) and interviews.
Primary data have some advantages over other types of data (Ghauri and Gronhaug, 2005).
The main advantage of primary data is that they are collected specifically for our study and
research. This means that they are more reliable and more closely fit our research questions
and research objectives. Primary data can help us to understand peoples‘ attitudes and buying
behaviour for a specific product or service.
However, primary data have some disadvantages (Ghauri and Gronhaug, 2005) . The main
disadvantage of primary data is that it takes a long time to collect and is expensive to collect,
compared to secondary data. Difficult to gain access to the participants. Finding participants
who are willing to participate in the research and answer the research questions may be
difficult, especially when the study involves sensitive information or deals with different
cultures in other countries. Difficulty in using the proper research tools. The researcher may
Page 72
57
find it difficult to find the best tools, research methods and methods of analysis to answer the
research questions, as the methods may not have been used by others and the researcher may
put at risk the reliability and applicability of the study. Less control over data. A researcher
collecting primary data would have limited control over the data collection. This might lead
to the emergence of unexpected factors that may hinder the efficient collection of data. Fully
dependent on respondents. The quality and focus of the information collected from primary
sources are fully dependent on the willingness and ability of the respondents. Some
respondents may refuse to participate or cooperate because of limited time or the lack of
incentives or fear of providing sensitive information (Ghauri and Gronhaug, 2005).
3.2.5 Data Collection
3.2.5.1 Qualitative Versus Quantitative Methods
The main difference between qualitative and quantitative research is not the quality but the
procedures used in the research. In qualitative research, findings are not arrived at by
statistical methods or through other quantification procedures (Ghauri and Gronhaug, 2005).
Normally, the basic distinction between quantitative and qualitative research is that it is
considered that quantitative researchers employ measurements and qualitative researchers do
not (Bryman and Bell, 2007). The difference between quantitative and qualitative methods
and approaches is not just a question of quantification, but also a reflection of different
perspectives on knowledge and research objectives. One argument for using quantitative data
is that quite often we collect individual data and aggregate it to analyse organisations. It is
generally accepted that, for inductive and exploratory research purposes, qualitative methods
are most useful, as they can lead us to hypothesis building and explanations. Historical
review, group discussions and case studies are mostly qualitative research methods. These
qualitative methods use relatively more qualitative techniques, such as conversations and in-
depth, unstructured or semi-structured interviews (Ghauri and Gronhaug, 2005).
3.2.5.2 Observation
Ghauri and Gronhaug (2005, p. 120) define observation as ―a data collection tool entails
listening and watching other people‘s behaviour in a way that allows some type of learning
and analytical interpretation‖. The advantages of observation are that we can collect the data
in a real format as we have collected the data ourselves. Moreover, we can understand and
analyse the observed attitudes, behaviour and case in a more accurate way compared to the
Page 73
58
use of questionnaires and interviews. However, observation has some disadvantages
including the difficulty in transferring what the individual has observed to a scientific format,
as most observations are done by individuals who have observed and recorded a phenomenon
and who may find it difficult to transfer what they have observed into scientifically useful
data.
3.2.5.3 Communications
For primary data, the researcher has to decide whether to communicate with the
respondents/subjects or just to observe them. Communication does not have to be direct or
face-to-face. We could send our questions by mail or email and ask for answers to be sent
back to us in the same manner. The instrument used for this type of data collection is called a
survey questionnaire. A questionnaire can be structured, unstructured or semi-structured. We
could also use methods that are more personal, by meeting with the respondents/subjects face
to face and asking questions. Ghauri and Gronhaug (2005, p. 123) define communication as
―the collection of data by asking those who have experienced a particular phenomenon so that
they can explain it to the researcher‖. This type of data collection makes it possible to
generalise the results and test theories.
The most commonly used primary data collection method is through communication. Many
students and business researchers collect their data through surveys or interviews. In this
case, the first question to ask is how structured or standardised the questions should be. In
most structured questionnaires, whether in the form of a survey or an interview, the questions
and the answers are predetermined. In the case of unstructured questionnaires or interviews,
the questions are only roughly predetermined (Ghauri and Gronhaug, 2005).
3.2.5.4 Surveys
Surveys refer to a method of data collection that utilises questionnaires or interview
techniques for recording the verbal behaviour of respondents (Ghauri and Gronhaug, 2005).
The survey is an effective tool to obtain opinions, attitudes and descriptions as well as for
exploring cause-and-effect relationships. However, there are several circumstances that might
influence respondents and their reactions, as well as their answers. According to Ghauri and
Gronhaug (2005), there are factors that influence respondents. These might include:
Sponsor: when a study is financed or sponsored by a particular organisation, this might
Page 74
59
lead to suspicion and deter respondents from answering questions correctly.
Appeal: when a researcher makes an appeal with regard to why or how important it is for
him or her to get answers to his or her questions, and how it can be useful for the
respondent/society if the study at hand is performed.
Stimulus: when some type of reward is given to the respondents. Here a decision has to be
made on whether the reward should be financial or non-financial.
Questionnaire format: the appearance, layout, length and even the colour of the paper
used can have an influence on whether the questionnaire will be responded to properly or
not.
Covering letter: its tone and stance can have an enormous impact on the respondent.
Stamped and self-addressed envelope: so that the responder need not incur any expense
while providing you with information, and to make it easier or more convenient for
him/her to send the answers back.
3.2.5.5 Interviews
Interviews need a real interaction between the researcher and the participant. The researcher
needs to understand and take into account the respondent‘s background, values and
expectations in order to carry out an interview effectively. There are two types of interviews.
The first involves survey research or a structured interview, where the researcher uses a
standard format of interview using fixed questions and answer choices, standard quantitative
measures and statistical methods. The second type is the unstructured interview, where the
researcher gives the respondent room for discussion, and permits the respondent to offer
opinions and behaviour on specific points. The questions and answers in unstructured
interviews are generally unstructured. In the literature, there is some discussion on another
form of interview known as semi-structured interviews, which differ from both structured and
unstructured interviews (Ghauri and Gronhaug, 2005). They differ in terms of the subjects
and the points to be covered, the sample size, the questions, and the participants may have
been determined beforehand. They also differ in that bias is minimised.
When doing the interview, the researcher or interviewer should take into consideration the
following points (Ghauri and Gronhaug, 2005):
Prepare for the interview by analysing the research problem, what information is sought
from the interview and who is willing to provide this information.
Page 75
60
Draft the interview questions and pre-test them by undertaking a pilot study.
Determine how much time is needed for the interview through the pilot study.
Approach the persons you want to interview by telephone, letter or both.
Create a reason for why the respondent should participate in the interview by explaining
why they should participate, perhaps explaining how the study would help the industry,
country and policymakers and the respondent firms.
Consider all the costs associated with interviews such as travelling costs, the time
necessary for the interview and the time needed to process it.
On the day of the interview, the researcher should introduce the study to the respondent.
The interviewer should assure the respondent of confidentiality.
The interviewer should use clear and simple language and avoid using any terminology
that is not understood by the respondent.
The interviewer should avoid using leading questions or try to lead the respondent to the
answer as this might force the respondent to answer in a way that the interviewer wants.
The interviewer should explain to the respondent any questions that are not clear to the
respondent.
The interviewer should have control over the time.
3.2.5.6 Focus Group
A focus group is another method used to collect data. This method is made up of different
types such as discussion groups, focus interviews, group interviewing and group research.
This method is often used in business research. Ghauri and Gronhaug (2005, p. 114) define a
focus group as ―a small group of people interacting with each other to seek information on a
small (focused) number of issues‖.
There are advantages of focus group (Ghauri and Gronhaug, 2005). Focus groups provide the
researcher with rich and in-depth data from the respondents‘ own words and reactions. Focus
groups are low cost, fast and a flexible method of collecting data. This method gives a
researcher the chance to observe people‘s reactions and behaviour and gives the researcher
the opportunity to interact with the respondents. Focus groups allow the collection of data
from people of all walks of life, including children. The results from focus groups are easy to
understand (Ghauri and Gronhaug, 2005).
Page 76
61
However, focus group has disadvantages (Ghauri and Gronhaug, 2005). It is hard to
summarise and categorise the information collected. Sometimes, it is difficult to get useful
information from people when the moderator is unskilled. It may be difficult to gather people
at a specific location. The people who participate in a focus group may not be representative
of the population (Ghauri and Gronhaug, 2005).
3.2.5.7 Structured Interviews
In a business research interview, the goal of the interviewer is to extract from the respondent
all the information needed for the research including the respondent‘s behaviours and beliefs.
There are different types of research interviews. However, the structured interview is the
most widely used method in survey research (Bryman and Bell, 2007). The research
interview is used as a data collection method in both quantitative and qualitative research.
The main reason behind using the structured interview is that it provides standardisation in
terms of asking questions and recording answers (Bryman and Bell, 2007).
A structured interview, sometimes called a standardised interview, needs the administration
of the interview to be planned ahead by the interviewer. The goal is to give the respondents or
interviewees the same set of questions, and to ensure that the interviewees are given the same
friendly interview environment and incentives. The aim here is to make sure that the
respondents‘ feedback can be aggregated, and this can be fulfilled only if they respond to the
same questions and same survey design. The interviewer should read out the questions to the
interviewees in the same format as they are printed. The questions in the structured interview
are usually focused and specific, and offer the interviewees a fixed range of answers. A
structured interview is a classic form of interview in social survey research (Bryman and
Bell, 2007).
3.2.5.8 Self-Completion Questionnaire (Mail Questionnaire)
In self-completion questionnaires, the respondents complete the questionnaire by themselves
without the presence of the researcher. Mail or postal questionnaires are the most widely used
form of self-completion questionnaires and they are sent to the respondents by post. The
respondents are then asked to return the questionnaire to the researcher by post or at a
specific location (Bryman and Bell, 2007).
There are some advantages of self-completion questionnaires over structured interviews
Page 77
62
(Bryman and Bell, 2007).When the sample is geographically dispersed, the self-completion
questionnaire would be the cheapest choice compared to interviews because of the time and
cost of travel for interviewers, which can be expensive. Self-completion questionnaires can
be sent by post and distributed in large quantities over a short period of time. In self-
completion questionnaires, the interviewer‘s influence is limited because the interviewer is
not present at the interview (Bryman and Bell, 2007).With self-completion questionnaires,
the probing by interviewers by asking questions in a different order or in a different format is
minimised. Self-completion questionnaires are more convenient for the respondents as they
can fill out or complete the questionnaires in their own time and at a speed that suits them
(Bryman and Bell, 2007).
However, self-completion questionnaires have some disadvantages compared to structured
interviews (Bryman and Bell, 2007).When a respondent has difficulty in answering a
question or questions, there is no one present to help them. There is no chance to investigate
respondents by asking them to provide further details or more information on an answer.
With self-completion questionnaires, respondents are more likely to become tired or bored of
answering questions that are not relevant or not important to them. The respondents in self-
completion questionnaires may not answer many open-ended questions because usually
respondents do not want to write a lot. In a self-completion questionnaire, respondents can
read the entire questionnaire before answering the first question or other questions. When that
happens none of the questions is independent of the others, and the researcher cannot be sure
whether the questions are answered in the correct format or order. One of the major
drawbacks of self-completion questionnaire is that the researcher can never be sure that the
right and targeted person answered the questionnaire. As firms receive many requests for
survey participation, managers sometimes transfer the questionnaires to someone else in their
firm such as a personal assistant to complete the questionnaires on their behalf. With self-
completion questionnaires compared to interviews, the researcher cannot collect other
relevant information about the firm. Managers tend to ignore questions that are not pertinent
to the firm. As we have mentioned above, with a long questionnaire respondents may become
tired and bored, and may not complete the questionnaire. Self-completion questionnaires will
not be accessible for some respondents who have limited use of the English language or other
language in which the questionnaire is based. There is also the added problem of illiteracy
that may limit or prevent them from answering the questions. Due to lack of supervision and
lack of prompting, unanswered questions are very common in self-completion questionnaires
Page 78
63
(Bryman and Bell, 2007).
3.2.5.9 Survey Methods
There is no best survey method as each one has its advantages and disadvantages. The
decision to select the best survey collection method must be made on a study-by-study basis
(Czaja and Blair, 2005).
3.2.5.9.1 Mail Surveys
Mail surveys involve sending invitation letters to participate in a study to potential
respondents, which are then followed by a cover letter and a questionnaire sent to a specific
person. The mail survey should be totally self-explanatory and in a format that is simple and
uniformly understood by different participants (Czaja and Blair, 2005).
There are some advantages of mail surveys (Czaja and Blair, 2005).Less expensive than
telephone or personal interviews. The respondents may consult household or personal
records. With mail questionnaires, it is much easier than with other survey methods to collect
data about sensitive topics. The time needed to collect mail survey data is shorter than with
other survey methods (Czaja and Blair, 2005).
However, mail surveys have some disadvantages (Czaja and Blair, 2005).Response bias
occurs when one subgroup is more likely to cooperate than another .The questionnaire can be
very long or complex to complete, and the respondent can look over the questionnaire and
decide whether to complete it or not .No one is present to explain a complex or unclear
question that may prevent the respondent from completing the questionnaire .The researcher
does not know who really answers the questions, as the researcher is not present when the
respondent completes the questionnaire .The order of answering the questions cannot be
controlled. This may affect the order of answering the questions set by the researcher
.Limited feedback and detail in the responses to the questions compared with other types of
surveys (Czaja and Blair, 2005).
3.2.5.9.2 Internet Survey
An internet survey is a relatively new approach. It is a popular type of self-administrated
survey and is similar to a mail survey, but with some differences (Czaja and Blair, 2005).
Page 79
64
There are advantages of internet surveys (Czaja and Blair, 2005).With an internet survey, the
interviewer-related costs found in face-to-face, telephone and mail surveys are minimised.
Internet surveys will not be affected by the geographical distribution of the sample .Data
collection using an internet survey is quicker than with other survey methods. It is possible to
obtain detailed answers to open-ended questions. A researcher using an internet survey can
use visual aids such as pop-up instructions, pictures, animations and other aids (Czaja and
Blair, 2005).
However, Internet Survey have some disadvantages (Czaja and Blair, 2005).Some
populations do not have access to the internet and so cannot participate in an internet survey.
Low response rate and response bias. Difficult to obtain answers to a long questionnaire as
the respondent may get bored or tired as a result of a large number of questions .There is no
interviewer present to explain any complex questions. For this reason the internet survey
must be simple. There is no control over who answers the questions. Internet surveys may not
be suitable when it comes to collecting data about sensitive topics. There are concerns about
the security of data over the Web, which may prevent people from participating in an internet
survey (Czaja and Blair, 2005).
3.2.5.9.3 Telephone Survey
In telephone surveys, telephone numbers are selected from phone books or from a specific
telephone number list and the respondents are selected from that list. The interviewer then
contacts the respondent and collects information in a uniform and consistent manner. The
respondent asks questions exactly as written in the questionnaire and in the same order for all
respondents (Czaja and Blair, 2005).
There are advantages of telephone surveys (Czaja and Blair, 2005).Relatively low cost
compared to other survey methods such as face-to-face surveys. High response rate. Short
data collection time compared with other survey methods. Can use a sample with a wide
geographical dispersion as it is easy and cheap to reach respondents. High quality and reliable
data compared with other survey methods. The interviewer can control the order of the
questions. The interviewer can convince the respondents over the phone to complete the
questionnaire or to answer sensitive questions. The increase in the availability of telephone
lines makes it easy to reach potential respondents (Czaja and Blair, 2005).
Page 80
65
However, Telephone Surveys have some disadvantages (Czaja and Blair, 2005). The
increased variety of telecommunication devices such as mobile phones, pagers and other
devices in recent years makes it difficult and time consuming to reach potential participants.
The increased use of telephones for telemarketing in recent years may annoy some people.
For this reason they may refuse to participate in telephone surveys as they think it is the same
as telemarketing. The interviewer cannot ask long or complicated questions and obtain
detailed answers, as the questions in a telephone survey must be short and simple, and the
answer choices must be few, short and simple. The interviewer cannot use visual aids such as
product samples, videos and pictures. The interviewer cannot control the response situation.
There may be limited responses to open-ended questions. The information about refusals and
non-contacts is limited with a telephone survey (Czaja and Blair, 2005).
3.2.5.9.4 Face-To-Face Surveys
With face-to-face surveys, also known as personal interview surveys, data is usually collected
by the interviewer in the location that is most convenient for the respondent. The respondent
and the interviewer are together in the same location. The face-to-face survey is the most
expensive method of survey as it involves travel costs and it takes a long time to collect data
(Czaja and Blair, 2005).
There are advantages of face-to-face surveys (Czaja and Blair, 2005). Higher response rate
compared to other survey methods. The reason behind the high response rate in face-to-face
surveys is that the researcher usually sends a letter in advance, explaining the research or the
study, the sponsor and the confidentiality issues related to the study. Another reason behind
the high response rate is that it is more difficult to refuse some face-to-face surveys than other
survey methods. Response bias is normally low in a face-to-face survey as the rate of co-
operation is equal for all respondents. More control of the response situation. High quality
recorded responses as the interviewer receives training in asking questions and recording
answers. Can perform complex questionnaires and can ask for more detailed answers,
because the interviewer and respondent are in the same location. Best for open-ended
questions as the face-to-face survey allows a more relaxed atmosphere. The face-to-face
interview can be longer compared to other survey methods as it takes place in the
respondent‘s location and the answers can be longer and more detailed. There is the ability to
consult records as the interview takes place in the respondent‘s location (Czaja and Blair,
Page 81
66
2005).
However, there are disadvantages of face-to-face surveys (Czaja and Blair, 2005).High cost
of performing a face-to-face survey compared with other survey methods as it involves
travelling expenses. A face-to-face survey takes a long time to collect data as it involves
travelling, collecting and analysing the data on the part of the researcher. Respondents may
be hesitant to report personal behaviour or sensitive information in a face-to-face survey. The
respondents are more likely to give socially desirable responses in face-to-face interviews
(Czaja and Blair, 2005).
3.2.6 Population Definition
According to Czaja and Blair (2005, p. 130), the population is ―the group or aggregation of
elements that we wish to study, the group to which we want to generalize the results of our
study‖. As stated in Chapter 4, the Saudi petrochemicals industry is one of the most important
industrial sectors in Saudi Arabia in terms of foreign investment. The industry has developed
rapidly and has played an important role in Saudi economic development. FDI in
petrochemicals have become a vital force in the Saudi petrochemicals industry. Therefore, the
petrochemicals industry has been selected for this research study.
It was particularly difficult to obtain a complete directory of information about foreign
investment in petrochemical companies in Saudi Arabia. However, without the assistance of
SAGIA and other complementary sources such as business associations and other sources, it
would not have been possible to obtain the necessary data for this study. According to
SAGIA (2008) and the Ministry of Trade (2009), 430 petrochemical companies operate in
Saudi Arabia. From this total, 107 companies had received significant investments from
foreign petrochemical firms. Consequently, 107 petrochemical companies with foreign equity
were defined as the population for the research (SAGIA, 2008). However, due to the limited
number of petrochemicals FDI in Saudi Arabia, we have a limited population.
3.2.7 Sample Size
The sampling size in international business surveys involves complicated strategies and
decision-making, as it involves people and organisations from different backgrounds. In some
developing countries, it is usually difficult to obtain data with regard to potential participants,
as the addresses are difficult to obtain or are not available. In some countries that have
Page 82
67
several sub-cultural differences such as India, a sample selected from a specific region cannot
be generalised to the whole country. Therefore, the major problem in international survey
research is the ability to select the most representative and random sample of a country
(Punnett and Shenkar, 2003).
One of the most frequently asked questions in research methods relates to the size of the
sample: ―How large should the sample be?‖ (see Bryman and Bell, 2007; Czaja and Blair,
2005). According to Bryman and Bell (2007) and Czaja and Blair (2005), there is no simple
answer to this question, as it depends on a number of considerations and there is no definite
answer to it. Most of the time, the sample size of the study would be affected by the cost and
the time of the study. What really matters with regard to the sample size is the absolute size
of the sample, not its relative size (Czaja and Blair, 2005). The sample size is a function of
the research design, the variability of the key variables, the extent of the differences between
variables, and the standard error of their differences (Czaja and Blair, 2005). In this study, 74
petrochemical companies with foreign equities operate in Saudi Arabia and account for 69.15
per cent of the population. This was defined as the sample size of this study.
3.2.8 Pilot Study
Pilot testing the research instruments can control many of the problems found in
questionnaires and interviews (Bryman and Bell, 2007). It is always desirable, if possible, to
perform a pilot study before doing the structured interview and the self-completion
questionnaire. By undertaking a pilot study, the researcher can be confident that the survey
questions operate well and that the research instruments function well, and it allows them to
detect any flaws in the questionnaire (Bryman and Bell, 2007). In a pilot study, a number of
interviews or questionnaires are undertaken using the same methods planned for the main
study. When the cost of the main study is high, or when some of the measures are innovative,
complex, or unfamiliar to the researcher, it may be risky to proceed to the main data
collection without a pilot study (Czaja and Blair, 2005).
There are advantages of using a pilot study (Bryman and Bell, 2007). When the main study
uses mainly closed questions, open questions can be asked in the pilot study to come up with
fixed-choice answers. A pilot study can provide the necessary training for the researcher who
will be doing the research interviews. It will give him/her some experience and allow him/her
to become confident with regard to conducting interviews. A pilot study can identify a
Page 83
68
question(s) that may be answered the same by everyone. The researcher can then eliminate
that question or questions from the main study. With a pilot study, the researcher can identify
any questions that would make the respondents feel uncomfortable, such as sensitive
questions, and the researcher could then eliminate those questions from the main study or
rephrase them to make them less contentious. Questions that cannot be understood or
questions that are often not answered would be visible in the pilot study, and could be
eliminated or rephrased in the main study. A pilot study can help the researcher to identify
how the questions flow and the logic of the questions, causing some moving around if
necessary (Bryman and Bell, 2007).
In this study, a questionnaire was developed based around the factors and sub-factors that
emerged from the literature. We identified five major factors and 19 sub-factors. The
questionnaire was first pre-tested with a number of colleagues to check for clarity and
consistency, and appropriate changes were made. Then, it was reviewed by, and discussed
with, several academics. It was subsequently reviewed by the top executives of two firms
who were working in foreign petrochemical firms in Saudi Arabia. They were asked to
provide comments and feedback. This process led to an improvement in the questionnaire
content, its design, its wording and its clarity, thus making the completion of the
questionnaire both easier and more attractive. A proper pilot study of the questionnaire was
conducted using a structured interview with 12 senior managers, who had engaged in the
location decision for their firms when it came to choosing Saudi Arabia as the location for
their petrochemicals FDI.
The pilot study provided the researcher with very useful suggestions and feedback with
regard to improvements of the questionnaire in terms of structure, content, wording,
questions and adding more factors to the questionnaire. The results of the pilot study have not
been included here as the main goals of the pilot study were to improve the questionnaire and
to make sure that the tools and instruments used functioned well. Moreover, the pilot study
provided the researcher with very useful information on the interview process, timing and
procedures.
3.2.9 Survey Design
For survey research, the questionnaire design plays an important role with regard to the
quality and reliability of the data collected. The design and administration of the tools used in
Page 84
69
the questionnaire needed to be adapted according to the respondents‘ background and
education level. Ghauri and Gronhaug (2005) introduced some guidelines for constructing the
questionnaire, including the following:
The questions must be asked in a very simple and brief language and should not have
ambiguous meanings.
The questions should take into account the level of knowledge, education, culture, etc. of
the respondents when formulating the questions, and should avoid any sensitive questions
that may prevent them from answering.
Every participant should be able to understand the questionnaire and the questions should
have the same meanings for each of them.
Each question should be limited to asking about one variable or one element.
The questions should be constructed in a format that does not permit the respondent to
miss a question.
The questions should be precise and not too broad, so that the respondent does not give
more than one answer.
The questions should not lead the respondents to the answer or the opinion.
The questions should be phrased politely.
The questions should be formatted in a correct and logical order from general to specific
questions.
The layout of the questionnaires should be smart and well organised, in order to motivate
the respondents to answer.
The questionnaires should be pre-tested by an advisor, colleague or friend before starting
the official or main questionnaire, in order to eliminate any mistakes and avoid any of the
issues raised above.
Long questionnaires should be avoided as respondents may become tired or lose interest in
answering the questions.
The questionnaire should cover all the important issues. It should produce sufficient data
for meaningful analysis and interpretation.
The length of time needed to complete the questionnaire should be around 30 minutes on
average, taking into consideration the busy lives of and limited time available to the
participants.
Participants should be assured of privacy by not asking for their name or for information
about the firm they work for.
Page 85
70
The process of designing a survey covering all the relevant areas and issues began by
drawing an outline based on the theoretical framework (Czaja and Blair, 2005). In this study,
for each factor included in the framework, a number of appropriate questions were created.
The survey contained 62 questions. In the first part of the questionnaire, we had 31 questions
testing the importance of each location factor in terms of the location decision with regard to
petrochemicals FDI in Saudi Arabia. The second part of the questionnaire contained 31
questions testing the competitiveness of Saudi Arabia with regard to each location factor for
FDI petrochemicals, compared to other locations.
There was an improvement in the survey design and contents after we had conducted the pilot
study. We added one major factor (economic factor) and 12 sub-factors to the survey.
Therefore, we had a total of six major factors and 31 sub-factors. After reviewing the related
literature on FDI location factors and studying the Saudi petrochemicals industry, and after
conducting the pilot study, we chose the following six major location factors and 31 sub-
factors:
1. Cost factors, including the following sub-factors: factory site cost (land cost), labour
costs, transportation/logistic costs, cost of raw materials, return on investment and energy
costs.
2. Market factors, including the following sub-factors: large size of host market, market
growth in host country, level of competition in host market and market familiarity.
3. Economic factors, including the following sub-factors: economic stability, economic
growth, exchange rates and local financial support.
4. Infrastructure and technological factors, including the following sub-factors: level of
infrastructure (ports, roads, airports, etc.), extent of industrial concentration (clustering),
availability of well-qualified workforce, access to reliable and co-operative suppliers,
availability of factory sites (land), availability of raw materials and geographical
proximity to markets.
5. Political and legal factors, including the following sub-factors: political stability,
international trade agreements, tax reductions in host country, benign environmental
legislation with regard to FDI, diplomatic ties with host country, and legal and regulatory
system.
6. Social and cultural factors, including the following sub-factors: cultural distance,
Page 86
71
attitude of the local community toward the firm, local employees‘ loyalty to the firm and
language.
In the planning and design of the research methodology for this study, an empirical survey
was constructed based on the previous location factors and was distributed to senior
managers working in FDI petrochemical firms in Saudi Arabia. The managers chosen were in
high managerial positions such as president, CEO, vice president or other managers who
were engaged directly in the location decision on the part of the firm when they chose Saudi
Arabia as their investment location. The respondents were first asked to rate the importance
of each of the 31 factors associated with the location decision on a five-point Likert scale
(with 1 = very unimportant, 2 = unimportant, 3 = neutral, 4 = important and 5 = very
important). Then, the respondents were asked to rate the attractiveness (competitiveness) of
Saudi Arabia relative to its main competitors in other locations on each of the 31 factors,
again on a five-point Likert scale (with 1 = much worse, 2 = worse, 3 = same, 4 = better, 5 =
much better). The survey instrument was used to conduct a structured face-to-face interview
with the senior managers of the petrochemicals FDI in Saudi Arabia, as identified by the
Saudi General Investment Authority (SAGIA) and by professional industry associations.
The methodology used in this study improves upon previous studies on FDI location factors
in three important ways. First, the previous studies have considerable benefits in terms of
their simplicity, but did not capture the full complexity of the determinants of a location‘s
attractiveness in a particular industry. However, in this study, a much larger range of
potential location factors have been considered. Second, previous studies have a major
drawback at the operational level in that they did not provide any mechanism for prioritising
the location factors in terms of the relative importance of the location decisions of FDI and
the attractiveness of Saudi Arabia compared to other locations. Third, on a conceptual level,
most studies on the location factors assume that the importance of location factors could be
applied to all countries and industries. In this study, we have identified the importance of
location factors and noted that they vary significantly from one industry and country to
another compare to other locations.
3.2.10 Survey Introduction or Cover Letter
A survey introduction letter was sent to the respondents before conducting the interview. The
introduction letter introduced the study, explained the subject of the study to the respondents,
Page 87
72
its purpose, sponsorship and other details. The main purpose of the introduction letter was to
provide the respondents with sufficient information to encourage him/her to participate in the
survey. The instructions explained what the study was about, who was conducting it, who the
sponsor was, the importance of the study and what will be done with the study results. A
cover letter accompanied the questionnaire, which was part of the mail survey. Its purpose
was similar to that of the introduction letter, but it also provided the respondents with a
promise of information confidentiality, the importance of the respondent to the study, and a
phone number and address for the researcher if the respondents needed to ask questions
(Czaja and Blair, 2005).
In this study, an introductory letter in English, addressed to foreign general managers or
representatives, was sent by fax to the selected sample of firms in Saudi Arabia in February
2009. The letter introduced the purpose of the research and sought the participation of the
foreign general managers. The letter also indicated a period of time when contact would be
made by the researcher. The introductory letter particularly emphasised that all responses
would be treated as strictly confidential, and that the results would be reported in aggregated
form so that no individual company or person could be identified. A promise was made to
send participating companies a report summarising the major findings of the study on
completion of this research study. Pre-test samples were also given the same assurances. The
main purpose of the introductory letter was to give the potential respondents an initial
impression that they would be contacted for an interview questionnaire survey.
3.2.11 Data Collection for This Study
In recent years, more and more researchers have been actively conducting research fieldwork,
and senior executives receive survey questionnaires and invitations to participate in research
studies from time to time. In most cases, the senior executives do not readily accept any
invitations to participate in survey research. Because we are approaching the top executives
(senior managers) in targeted firms (FDI in petrochemicals), normal random sampling was
abandoned for a more targeted approach.
In this study, approaching and seeking potential respondents to participate in the survey was,
therefore, a complex and time-consuming process, and certainly a difficult task as well. To
ensure the success of the fieldwork research, three major approaches were used to achieve the
participation of the firms in the sample; i.e. introduction letter, networking and facsimile-
Page 88
73
telephone approaches. The fieldwork began in early April 2009 and was conducted over a
three-month period. The networking approach played the most crucial role in seeking the
respondents‘ participation in the survey. The surveys were dependent on personal interviews.
In this study, as we explained earlier in this chapter, there are different methods of data
collection. Questionnaires were used to collect data mainly from lower level employees,
while interviews were used to collect data from high-ranking managers (Punnett and Shenkar,
2003). Moreover, after taking into consideration the complexity of network connections and
relationships within Saudi business and social networks, it was clear that a structured
personal interview that had been arranged with the assistance of the author‘s personal
network and relevant Saudi government authorities would be the most appropriate approach
for collecting the large amount of data required for this study. It was required that the
interviewee/respondent be a senior executive (e.g. president, general manager or deputy
general manager, etc.) or a representative of a foreign partner that has invested in a
petrochemical company in Saudi Arabia. A senior member of management assigned by the
firm or general manager, and who had sufficient knowledge about the parent firm‘s FDI
decision-making process, was considered to be an acceptable participant. Furthermore,
structured interview also presented other advantages when collecting data that were suitable
for this study. First, it allowed a high level of standardisation, which simplified the data
analysis and comparisons. A strict structure also helped avoiding different interpretations and
misunderstandings of the questions, which is of great importance, since surveys offer no
possibilities to explain the questions further to the respondent (Bryman and Bell, 2007).
However, to avoid missing information that was not covered by the survey but still might be
relevant to the study, secondary data such as national statistics and economic indicators were
gathered from SAGIA and other official sources and used to compare the survey results with
the data provided.
3.2.11.1 Network Approach
Two approaches were adopted. The first one sought assistance from relevant Saudi
authorities and government agencies such as SAGIA through both existing personal network
connections and newly developed connections. This was necessary because the relevant
SAGIA authorities had direct contacts with senior executives in foreign organisations in
Saudi Arabia. The author started contacting personal network acquaintances in Saudi Arabia
in April 2009. SAGIA officially provided the author with an introduction letter to the relevant
Page 89
74
senior executives in petrochemical organisations with foreign equities in Saudi Arabia. This
approach resulted in significant support for the survey.
The second approach involved seeking assistance from network members in terms of
contacting potential respondents. This approach worked most effectively and efficiently. The
author had worked for five years as a consultant for major organisations in Saudi Arabia,
including foreign firms, and had developed strong network connections in the Saudi
petrochemicals business, including relevant petrochemical administration authorities and
petrochemical manufacturers in Saudi Arabia. The members of the network had direct and
indirect connections with the potential respondents. The 12 pre-test respondents also provided
effective assistance with the actual research fieldwork through their network connections in
the Saudi petrochemicals industry.
3.2.11.2 Facsimile-Telephone Approach
This approach was used to send a facsimile first to potential responding firms, and then use a
follow-up telephone call. The facsimile provided information with a brief introduction of the
purpose and the significance of the research, and promised that no sensitive information
would be disclosed and that no responding firm or individual respondent would be identified
in the resulting research report. It also specified when a follow-up phone call would be made
to the company, so as to discuss any possible arrangements for an interview or a mail
questionnaire survey. This approach allowed the potential respondents to take their time and
to take a closer look into the details of the research. This approach was particularly applicable
to companies that were not accessible through the network connections. In some cases, the
potential respondents called the researcher after receiving the facsimile for further
information. In this case, an arrangement for an interview was most likely to be possible. On
average, five to 10 phone calls were needed to gain a successful interview arrangement.
3.2.11.3 Interview Process
Most interviews were pre-arranged. A number of interviews were scheduled by one of the
networking members and, for these interviews, the member actually accompanied the author
all the way through the interviews. However, on a number of occasions, the author was on
call, depending on the availability of the respondents. The senior executives in the Saudi
petrochemical companies seemed particularly busy with company meetings and other
external meetings. Some of them travelled frequently within Saudi Arabia and even overseas.
Page 90
75
The length of the interviews differed significantly, from the shortest one lasting about 25
minutes to the longest one lasting two hours, depending on the interview environment and
respondents‘ willingness. Interviews generally took longer when the interviews were
conducted after hours, within a non-company environment.
About 25 per cent of the interviews were conducted in the respondents‘ homes, hotels and
other non-company environments after business hours. In such instances, the interviews
would take much longer than expected, as most of the respondents responded in a relaxed
manner and gave rather detailed explanations as to why a particular variable scored higher or
lower. The shorter interviews were mainly conducted in the respondents‘ workplaces and
during normal business hours. However, some of the interviews conducted in the company
environment did take much longer than the average when the respondents were interested in
the topic. During the interviews, the respondents relied heavily on the questionnaire structure
and its instructions in order to answer the questions. Both the interviewer and the interviewee
had a copy of the questionnaire when the interview was being conducted. English was used
during most of the interviews as the majority of the foreign managers had an excellent
mastery of the English language. Five respondents requested a copy of the blank
questionnaire after the interviews for their own purposes.
3.2.11.4 Complimentary Letter
On completion of the fieldwork, a letter was sent to each participating company. The author
expressed his appreciation to the respondents for their cooperation during the survey and
confirmed that the responses would be treated strictly on a confidential basis and that a brief
summary of the major findings would be sent to them on completion of the research.
3.2.12 Response Rate
When conducting survey research, whether by structured interviews or by self-completion
questionnaires, usually some people in the sample refuse to participate in the study.
Therefore, the response rate is the percentage of a sample that agrees to participate in the
study (Bryman and Bell, 2007). Czaja and Blair (2005) defined the response rate as ―the
number of eligible sample members who complete a questionnaire divided by the total
number of eligible sample members‖. The response rate reflects the survey quality, in that the
higher the response rate, the better the quality of the research (Czaja and Blair, 2005).
Page 91
76
In this study, 42 companies participated in the research. Therefore, a 56.74% response rate
was achieved, and this represented 39.25% of the entire population. We collected 42 survey
instruments, representing 42 petrochemicals FDI from 107 petrochemicals FDI operating in
Saudi Arabia out of a total of 430 petrochemical companies operating in Saudi Arabia.
Because we had chosen a specific industry (petrochemicals) and specific companies in the
same industry (FDI), and because the participants in each company (senior managers) were
limited in number and difficult to reach, there were a limited number of participants in the
study. However, the response rate is considered to be very good compared to other studies in
the same field.
3.2.13 Data Analysis
There are different types of statistical techniques which we can use to analyse the data. We
have briefly listed them as follows (Pallant, 2007):
T-tests are used when we have only two groups (e.g. males/females) or two time points
(e.g. pre-intervention, post-intervention).
Analysis of variance techniques are used when you have two or more groups or time
points.
Paired samples or repeated measures techniques are used when we are testing the same
people on more than one occasion, or we have matched pairs.
Between-groups or independent-samples techniques are used when the subjects in each
group are different people.
One-way analysis of variance is used when we have only one independent variable.
Two-way analysis of variance is used when we have two independent variables.
Multivariate analysis of variance is used when we have more than one dependant
variable.
Analysis of covariance (ANCOVA) is used when we need to control for an additional
variable that may be influencing the relationship between the independent and dependent
variables.
In this study, we used a combination of data analysis statistical techniques such as t-test,
repeated measures (ANOVA), and Pearson and Spearman correlation analysis. To analyse the
data, the Statistics Package for Social Science (SPSS) version 17 was used. The statistics
analysis techniques were carefully considered and selected, with attention being paid to the
Page 92
77
nature of the data (e.g. level of measurement) with a small sample size (42 cases) and
relatively large number of variables (62 variables).
3.2.14 Research Questions and Hypotheses
After reviewing the literature on FDI location factors, we had two main questions that we
were seeking to investigate in terms of the importance and competitiveness of location factors
in the Saudi petrochemicals industry. The first main question sought to investigate the
relative importance of major location factors for FDI in the Saudi petrochemicals industry.
Furthermore, the first question investigated which one of these factors plays the most
important role in the location decisions for FDI in the Saudi petrochemicals industry and
which major factors are of least importance. The second question sought to investigate the
relative competitiveness of major factors in Saudi Arabia in terms of FDI in the Saudi
petrochemicals industry compared to other locations. Moreover, the second question
investigated which of the location factors are the most competitive with regard to FDI in the
Saudi petrochemicals industry. The two main questions were divided into sub-questions that
focused on each major factor in terms of its importance and competitiveness. Therefore, this
research attempted to answer the following main questions and sub-questions:
Q1: What is the relative importance of FDI location factors in the Saudi
petrochemicals industry?
Question 1 is investigating what is the relative importance of FDI location factors in the
Saudi petrochemicals industry including cost factors, market factors, economic factors,
infrastructures and technological factors, political and legal factors, and social and
cultural factors.
Q2: What is the relative competitiveness of FDI location factors in the Saudi
petrochemicals industry compared to other locations?
Question 2 is investigating the relative competitiveness of FDI location factors in the
Saudi petrochemicals industry including cost factors, market factors, economic factors,
infrastructures and technological factors, political and legal factors, and social and
cultural factors.
One purpose of the research was to explore the relative importance of FDI location factors in
Page 93
78
the Saudi petrochemicals industry. The importance of major location factors in FDI location
decisions in the Saudi petrochemicals industry will vary, and some of these factors will play
an important role in the location decisions for FDI, while others may not be particularly
important for FDI location decisions in the Saudi petrochemicals industry. Based on this, we
tested the relative importance of the major location factors in the location decisions for FDI
in the Saudi petrochemicals industry. These factors include cost factors, market factors,
economic factors, infrastructure and technological factors, political and legal factors, and
social and cultural factors. Based on this, the following main hypotheses will be tested:
H1: The relative importance of FDI location factors will vary in the Saudi
petrochemicals industry.
The main hypothesis is divided into sub-hypotheses to identify the importance of each major
factor to the FDI location decision in the Saudi petrochemicals industry, what factors are
perceived to play an important role in the FDI location decision and which factors are
perceived to be relatively unimportant in terms of FDI location decisions in the Saudi
petrochemicals industry. According to this, the following hypotheses will be tested:
Hypothesis 1a:
Cost factors play an important role in the location of FDI in the Saudi petrochemicals
industry. These factors include factory site costs (land costs), labour costs,
transportation/logistics costs, raw materials costs, return on investment and energy costs.
H1a: Cost factors play an important role in FDI location decisions in the Saudi
petrochemicals industry.
Hypothesis 1b:
Market factors would play an important role in the location of FDI in the Saudi
petrochemicals industry. These factors include the size of the host market, market growth in
the host country, the level of competition in the host market and market familiarity.
H1b: Market factors play an important role in FDI location decisions in the Saudi
petrochemicals industry.
Page 94
79
Hypothesis 1c:
Economic factors play an important role in the location of FDI in the Saudi petrochemicals
industry. These factors include economic stability, economic growth, exchange rates and
local financial support.
H1c: Economic factors play an important role in FDI location decisions in the Saudi
petrochemicals industry.
Hypothesis 1d:
Infrastructure and technology play an important role in the location decision with regard to
FDI in the Saudi petrochemicals industry. These factors include the level of infrastructure
(ports, roads, airports, etc.), high industrial concentration (clustering), the availability of a
well-qualified workforce, access to reliable and co-operative suppliers, the availability of
factory sites (land), the availability of raw materials and geographical proximity to the
markets.
H1d: Infrastructure and technological factors play an important role in FDI location
decisions in the Saudi petrochemicals industry.
Hypothesis 1e:
Political and legal factors play an important role in the location of FDI in the Saudi
petrochemicals industry. These factors include political stability, international trade
agreements, tax reductions in the host country, a benign environmental legislation towards
FDI, diplomatic ties with the host country, and a good legal and regulatory system.
H1e: Political and legal factors play an important role in FDI location decisions in the
Saudi petrochemicals industry.
Hypothesis 1f:
Social and cultural factors play an important role in the location of FDI in the Saudi
petrochemicals industry. These factors include the cultural distance, the attitude of the local
community toward the firm, local employees‘ loyalty to the firm and language.
Page 95
80
H1f: Social and cultural factors play an important role in FDI location decisions in the
Saudi petrochemicals industry.
In the second part of the research, we tested the relative competitiveness of the Saudi
petrochemicals location factors compared to other locations in the region. The
competitiveness of major location factors compared to other locations in terms of the FDI
location decisions in the Saudi petrochemicals industry will vary. Some of these factors
would be competitive factors for FDI in the Saudi petrochemicals industry compared to other
locations. Based on this, we tested the competitiveness of the major location factors in the
Saudi petrochemicals industry compared to other locations. These factors included cost
factors, market factors, economic factors, infrastructure and technological factors, political
and legal factors, and social and cultural factors. According to the second main question, the
following main hypothesis will be used:
H2: The relative competitiveness of FDI location factors will vary in the Saudi
petrochemicals industry compared to other locations.
The main hypothesis can be divided into sub-hypotheses to identify the competitiveness of
each major factor for FDI in the Saudi petrochemicals industry compared to other locations.
Moreover, the sub-hypotheses investigate which factors are perceived to be competitive
factors for FDI in the Saudi petrochemicals industry, and which factors are perceived not to
be competitive factors for FDI in the Saudi petrochemicals industry. According to this, the
following hypothesis will be tested:
Hypothesis 2a:
Cost factors are perceived to be competitive factors for FDI in the Saudi petrochemicals
industry. These factors include factory site costs (land costs), labour costs,
transportation/logistics costs, raw materials costs, return on investment and energy costs.
H2a: Cost factors are competitive for FDI in the Saudi petrochemicals industry
compared to other locations.
Hypothesis 2b:
Page 96
81
Market factors are perceived to be competitive factors for FDI in the Saudi petrochemicals
industry. These factors include the large size of the host markets, market growth in the host
country, the level of competition in the host markets and market familiarity.
H2b: Market factors are competitive for FDI in the Saudi petrochemicals industry
compared to other locations.
Hypothesis 2c:
Economic factors are perceived to be competitive factors for FDI in the Saudi petrochemicals
industry. These factors include economic stability, economic growth, exchange rates and
local financial support.
H2c: Economic factors are competitive for FDI in the Saudi petrochemicals industry
compared to other locations.
Hypothesis 2d:
Infrastructure and technological factors are perceived to be competitive factors for FDI in the
Saudi petrochemicals industry. These factors include the level of infrastructure (ports, roads,
airports, etc.), high industrial concentration (clustering), the availability of a well-qualified
workforce, access to reliable and co-operative suppliers, the availability of factory sites
(land), the availability of raw materials and geographical proximity to the market.
H2d: Infrastructure and technological factors are competitive for FDI in the Saudi
petrochemicals industry compared to other locations.
Hypothesis 2e:
Political and legal factors are perceived to be competitive factors for FDI in the Saudi
petrochemicals industry. These factors include political stability, international trade
agreements, tax reductions in the host country, benign environmental legislation towards FDI,
diplomatic ties with the host country, and a good legal and regulatory system.
H2e: Political and legal factors are competitive for FDI in the Saudi petrochemicals
industry compared to other locations.
Page 97
82
Hypothesis 2f:
Social and cultural factors are perceived to be competitive factors for FDI in the Saudi
petrochemicals industry. These factors include cultural distance, the attitude of the local
community toward the firm, local employees‘ loyalty to the firm and language.
H2f: Social and cultural factors are competitive for FDI in the Saudi petrochemicals
industry compared to other locations.
3.2.15 Summary
In this section, we introduced the research methodology used in this study. The chapter gives
an overview of the research methods, and the advantages and disadvantages of using each
method that helped us when it came to choosing the most suitable methods for our research.
It also explains how the data were collected, including the research population, sample size,
pilot study, survey design, response rates, data analysis, the research questions and the
formulation of the hypotheses. In addition, we used structured interviews to collect the data
as the most suitable for our research. 107 petrochemical companies with foreign equity were
defined as the population for this research. In this study, 74 petrochemical companies
involved in FDI in Saudi Arabia and accounting for 69.15% of the population, was identified
as the sample for this research. Moreover, 42 companies participated in this research
representing a 56.74% response rate and representing 39.25% of the entire population. This
chapter has indicated how these methodological constraints were reasonably handled, and
how a specific statistical technique was selected to help extend the data analysis. The next
chapter represents the social-political and economics context of FDI in Saudi Arabia.
Page 99
84
Chapter 4 : Social-Political and Economic Context of Saudi Arabia
4.1 Introduction
This chapter gives a general background on Saudi Arabia including country data, the
economic environment, FDI in Saudi Arabia, the FDI pattern and FDI in the petrochemicals
industry.
4.2 Background on Saudi Arabia
Table 4.1 gives a summary background on Saudi Arabia.
Table 4.1 Summary Background on Saudi Arabia
Area 2,240,000 sq km
Population 27,019,731 million
Density of Population 2.18%
Capital Riyadh
Main Cities Riyadh (the Capital)
Makkah (the most sacred place to Muslims, and their direction of
prayer)
Al Madinah (second most sacred place)
Jeddah (Saudi‘s business capital. An important port and a major
gateway for pilgrims).
Dammam (capital of the Eastern region, well-off in terms of oil,
and an important port).
Dhahran (a military city, the location of Saudi Aramco‘s headquarters. This is the largest oil company in the world.
Political System
Monarchy
Judicial Law The constitution of Saudi Arabia is based on the Quran and the Sunnah. All
legislative regulations have been derived from these two sources. The regime in
Saudi Arabia is a based on a monarchial system. The King and the Council of
Ministers from the executive and the legislative authority. The State Consultative
council has the mission of giving its opinion on any general issue submitted to the
Council by the Prime Minister.
Language Arabic
Currency Saudi Riyal
Overview of Saudi Arabia Saudi Arabia is located in South-west Asia. It is bounded by the Red Sea on the
west, Jordan, Iraq and Kuwait on the north, the Arabian Gulf, Bahrain, Qatar, and
the United Arab Emirates on the East and Yemen and Oman on the South.
Source: SAGIA, 2008
Page 100
85
4.3 Economic Environment of Saudi Arabia
4.3.1 Criteria of the Saudi Economy’s Openness
According to the criteria of economic openness that measures foreign trade in goods and
services as a ratio of the GDP, the Kingdom recorded the third highest level of openness,
with an average of 79.1% during the period 1990-2006, compared to 23.5% for the USA,
25.2% for Japan, 45.8% for Australia, 44.7% for China, 49.2% for Turkey, 50.5% for Italy,
54.9% for France, 79.6% for the UK and 79.2% for Canada (UNCTAD, 2007).
4.3.2 Increasing Interest Regarding Investment in Saudi Arabia
The world‘s attention is increasingly being drawn to the unique investment opportunities in
the Kingdom of Saudi Arabia (KSA). There is a variety of reasons for this situation. Amongst
the most significant is the huge effort on the part of the Saudi government, encompassing
economic reform, improvements designed to transform the investment environment and the
opening up of more sectors to investment opportunities. These efforts have been streamlined
through the Saudi Arabian General Investment Authority (SAGIA), which works in
conjunction with all governmental agencies and institutions, to improve the investment
environment (SAGIA, 2008). The objectives have been clearly expressed by the launch of the
national 10X10 programme, which seeks to ensure that Saudi Arabia will become one of the
ten most competitive nations in the world by 2010 (SAGIA, 2008).
Additional reasons for the encouragement of foreign investment in Saudi Arabia include the
continuing increase in oil prices, combined with the Kingdom‘s membership of the World
Trade Organization. During the 2005-2006 fiscal year, the Kingdom witnessed increasing
interest on the part of the most significant international companies regarding investment
opportunities in Saudi Arabia. During 2006, 1,389 branches concerned with the licensing of
foreign and joint venture projects were opened, with an aggregate finance amounting to $67
billion. This showed a growth rate of 25% compared with 2005. The SAGIA has a target of
raising foreign and shared investment in excess of $80 billion during 2007 (SAGIA, 2008).
4.4 FDI in Saudi Arabia
4.4.1 Investment Environment in Saudi Arabia
In the new millennium, the KSA has set itself the objective of reducing the economy‘s
vulnerability and heavy dependence on oil market income, and has opted for decentralised,
Page 101
86
private market-based economic activities. The KSA aims to achieve this via a three-pronged
approach that involves (1) joining the World Trade Organization (WTO) to enable a bigger
Saudi world market share; (2) a domestic programme of privatisation of core government
services; and (3) FDI to foster technology transfer and domestic economic stimulus (Najem
and Hetherington, 2003; Ramady and Saee, 2007).
The significant investment interest in the KSA, as demonstrated by increased FDI and the
large number of ongoing major capital projects, shows the success of the Kingdom in
reforming its investment environment and in attracting new investors. The Kingdom
continues to develop new infrastructure and economic cities to provide the foundation for
new industries, and to adopt a more investor-friendly approach in the face of increasing
competition from other investment locations (SAGIA, 2007).
Saudi Arabia has a number of input cost competitive advantages over other locations which
make it an attractive destination for investment. The competitive advantages of the KSA are
in natural gas, propane and butane, electricity, water, labour, inflation and the cost of living,
corporate taxation and land rental (SAGIA, 2007).3.1. W
4.4.1.1 Saudi Arabia Competitive Advantages
4.4.1.1.1 Natural Gas
Because of the ready availability of natural gas associated with the production of crude oil,
and the government‘s desire to encourage the industrialisation drive, Saudi Arabia has among
the lowest natural gas prices in the world. Prices are currently fixed by the government at
$0.75/mmBtu. This is significantly lower than prices elsewhere in the world, where typical
gas prices were above $6/mmBtu in 2005 (see Figure 4.1). This attractive pricing for gas is
available for any foreign or domestic investor willing to invest in the Kingdom. During its
WTO accession discussions, Saudi Arabia was successful in arguing for a continuation of its
competitive pricing formula, based on the additional costs of the alternative of exporting the
gas. The Kingdom has therefore secured a continued and significant competitive advantage
for any foreign or domestic investor willing to invest in the Kingdom (SAGIA, 2007). This
favourable differential has clear benefits for domestic consumers of natural gas feedstock
such as the petrochemicals industry, where about 60% of the integrated cash costs are
hydrocarbon-based. This compares with figures of between 30% and 40% in power
generation and water desalination, and in excess of 30% for metals processing (SAGIA,
Page 102
87
2007).
Figure 4.1 Natural Gas Prices
Source: SAGIA, 2007
4.4.1.1.2 Propane and Butane
In the early 1990s, the government introduced discounts of 30% on the Saudi export market
price of propane and butane for domestic industrial consumers to encourage further
investment in the petrochemicals sector. As with the price of natural gas, Saudi Arabia
successfully argued for a continuation of the competitive low-priced gas (LPG) during its
WTO accession discussions, based on the additional cost of developing the infrastructure for
exporting LPGs to major export markets. These prices will continue to be available to all
domestic and foreign investors in Saudi Arabia, offering a further key competitive advantage.
Natural gasoline, or field condensate recovered from the same operation as LPG, is also
covered by the pricing agreement (SAGIA, 2007).
4.4.1.1.3 Electricity
Oil and natural gas are the main sources of power generation in Saudi Arabia. Electricity
tariffs are low, at around $0.03/kWh (see Figure 4.2), and such tariffs are a reflection of the
competitively priced feedstock cost available to the Kingdom‘s power generators. Saudi
Arabian electricity prices are structurally lower than those in the USA, Europe and China,
and, critically, are stable and not open to the global markets fluctuation (SAGIA, 2007).
Page 103
88
Figure 4.2 Electricity Prices
Source: SAGIA, 2007
4.4.1.1.4 Water
Saudi Arabia is the world‘s largest producer of desalinated water, and currently has 30
desalination plants in operation, pumping 2.9 million litres of water daily, meeting almost
50% of its drinking water demand. Desalinated water prices are the lowest in the Gulf
Corporation Council (GCC), and are negligible for consumption at less than 100m3/month
and around $0.5/m3 for volumes above (see Figure 4.3) (SAGIA, 2007).
Figure 4.3 Water Tariffs in GCC
Source: SAGIA, 2007
Prices in Saudi Arabia are also low compared to other countries across the world, especially
developed countries. For example, industrial users in the UK can typically pay around
$0.93/m3, while the industrial tariff in Beijing, China, was $0.67/m3 in 2004 (see Figure 4.4).
Page 104
89
Figure 4.4 Industrial Water Tariffs Across the World
Source: SAGIA, 2007
4.4.1.1.5 Labour
Manufacturing labour costs in Saudi Arabia are low and are typically less than one quarter of
comparable labour costs in Europe and the USA (see Figure 4.5). However, comparative
labour costs in developing Asian countries such as China and India are likely to be even
lower, although these costs have been escalating as these economies have begun to suffer
competitive pressure from the labour market (SAGIA, 2007).
Figure 4.5 Manufacturing Labour Costs
Source: SAGIA, 2007
Page 105
90
4.4.1.1.6 Corporate Taxation
A new tax code was introduced in the Kingdom in 2004, which reduced the tax payable by
foreign investors to 20%, a level significantly below comparable rates in the USA and in
most of Europe (see Figure 4.6). The tax code also contains a provision to allow losses to be
carried forward to following years, along with allowable deductions for R&D expenditure
(SAGIA, 2007).
Figure 4.6 Corporate Tax Rates for Foreign Companies
Source: SAGIA, 2007
4.4.1.1.7 Land Rental
Saudi Arabia provides land for new development at very low rents compared to the rest of the
world. For example, in the industrial cities of Jubail and Yanbu, land is being offered to new
investors at an annual rate of SR1/m2, compared to international rentals of around SR45-
50/m2 in Rotterdam and SR30-80/m2 in Jurong Island, Singapore (see Figure 4.7) (SAGIA,
2007).
Page 106
91
Figure 4.7 Industrial Land Rents
Source: SAGIA, 2007
4.4.2 Special Economic and Industrial Zones
Saudi Arabia is also currently planning several new economic industrial cities, which it refers
to as Special Economic Cities (SECs) (see Figure 4.8). The government is hoping the SECs
will replicate the success of Jubail and Yanbu in attracting new investments and job creation
to the Kingdom. The SECs will also serve to meet one of the SAGIA‘s objectives – that of
achieving balanced economic growth throughout the Kingdom. Whereas Jubail and Yanbu
were primarily developed and managed by the government (through the Royal Commission),
the intention is that the SAGIA will be responsible for launching and managing the SECs,
which will be entirely funded and developed by the private sector. All of the SECs will
involve developing an excellent infrastructure and supporting facilities for industrial users.
They may also be structured with a package of incentives to attract private investors, such as
tax breaks, some relaxation of visa policies, and competitive energy and utility costs. SECs
will also have a relaxed regulatory environment to attract foreign investors and their
employees (SAGIA, 2007).
The first SEC, announced in December 2005, was the King Abdullah Economic City
(KAEC). KAEC is currently the single largest private sector investment in Saudi Arabia,
valued at around $27 billion (SAGIA, 2008). In October 2006, the SAGIA announced a
major expansion of KAEC, by nearly four times the original size. KAEC is now planned to
cover an area of 168 million m2, is expected to generate 1 million jobs and will house 2
Page 107
92
million residents. The city will be located north of Jeddah on the Red Sea at Rabigh, offering
easy access to Makkah and Madinah. The current priority for the project is the construction of
a new port, which will be on a similar scale to the world‘s largest ports. The port will have
the facilities to handle cargo and dry bulk, and will be able to handle the world‘s largest
vessels. 40 million m2 is earmarked for an industrial park, which will house manufacturers
operating mainly in the downstream petrochemicals and finished products and plastics
sectors. These producers will be able to take advantage of the product streams planned from
the integrated refinery-petrochemicals development at nearby Rabigh (SAGIA, 2007).
In October 2006, the SAGIA announced plans to establish a ‗Plastics Valley‘ at KAEC,
which will contain an excellent infrastructure to promote growth amongst local plastic
manufacturers. Supporting all of this will be appropriate accommodation, leisure, health care
and education facilities. The construction of KAEC began in December 2005, and the first
tenants were expected in 2007, with the port planned for start-up operation in 2008. The
second SEC was announced in July 2006, and will be the Prince Abdul Aziz bin Musaed
Economic City (PABMEC) located at Hail. Although a smaller development than KAEC,
PABMEC is nevertheless a substantial undertaking, costing $8 billion to develop and creating
55,000 jobs during its development. The development will cover 156 million m2 and will be
focused on creating the leading logistics and transport hub in the Middle East, taking
advantage of its close proximity to multiple markets and the region‘s raw mineral resources
(SAGIA, 2007). The third SEC was announced in June 2006, and will be the Knowledge
Economic City (KEC) to be located in Madinah, in the West of the Kingdom, with a focus on
knowledge-based industries. KEC is a $6.7 billion development and will cover 4.8 million
m2, creating 20,000 new jobs during its construction (SAGIA, 2007). The fourth SEC was
announced early in November 2006 and will be located in Jizan, in the South of the
Kingdom, with a focus on energy-intensive industries such as metals processing and oil
refining (SAGIA, 2007).
Page 108
93
Figure 4.8 Special Economic Cities
Source: SAGIA, 2007
4.4.3 Saudi Arabia and WTO
Saudi Arabia became a full member of the WTO on 11 December 2005. One of the final
issues to be settled, after Saudi Arabia had agreed the terms with the US in September 2005
on its accession bid, related to EU concerns about the country‘s pricing of feedstock for
petrochemicals. The WTO agreement obliges Saudi Arabia to ensure that its producers of
natural gas liquids (NGLs) operate in terms of normal commercial considerations, based on
the full recovery of costs and a reasonable profit. This has important implications for foreign
firms, now operating in the upstream gas sector, and for part of the Saudi petrochemicals
industry using NGLs. However, it is least likely to affect petrochemical units that use ethane
as feedstock (BMI, 2009).
The SAGIA believes that WTO accession will help settle petrochemical dumping issues in
Page 109
94
the Kingdom on the part of producers from tariff-protected economies, adding that it will also
improve Saudi companies‘ competitiveness and strengthen the sector‘s position in the
international market. The Saudi petrochemical industry stands to gain from the WTO
provisions, including its extension to services, particularly relating to finance, insurance and
transportation, the prices of which could now decrease. As these are purchased in large
quantities by the Saudi petrochemicals industry, any reduction in costs will be of benefit
(BMI, 2009). The SAGIA says that the removal of trade barriers will enable Saudi producers
to offer lower prices to tariff-protected markets such as the EU, the US and Japan, which
could lead to a sizeable increase in Saudi exports to these areas. Saudi Arabia is also having
to lower its own tariffs: PE, PP and PS are to be reduced to 8% from 12% by 2008, and then
to 6.5% by 2010. This will affect profit margins, and the SAGIA says that producers will
need to reduce costs and increase efficiency to remain competitive. The nation has also
committed to reducing tariffs on processed plastic imports from 20% to 6.5% by 2010. Over
50% of Saudi petrochemical exports go to non-tariff-protected Asian markets (Business
Monitor International (BMI), 2009).
It is clear that WTO membership will create sustainable macroeconomic benefits for Saudi
Arabia, and will create substantial opportunities for producers in the Kingdom to exploit
growing export markets. Greater competition will serve to accelerate the pace of change in
the private sector, more transparency will mean a more confident environment for foreign
investors and exporters will benefit from greater access to foreign markets (SAGIA, 2007).
The petrochemicals industry will be a major beneficiary of WTO accession, as the Kingdom
has managed to negotiate the continuation of competitively priced natural gas liquid (NGL)
feedstock. Using the logic that the opportunity cost of exporting the gas to international
markets would entail high capital cost for NGL export facilities, the Kingdom has ensured it
can continue to offer this key competitive advantage to any foreign or domestic investor
choosing to locate in the Kingdom (SAGIA, 2007).
4.4.4 Infrastructure Development
There are also a number of significant infrastructure developments in the Kingdom, which are
set to improve the project enabler and logistics facilities for investors in the energy sector.
These include expansions of the existing industrial cities of Jubail and Yanbu, the creation of
new economic cities around the Kingdom and the development of a number of standalone
projects to improve the Kingdom‘s transport and logistics network. The Royal Commission
Page 110
95
has had great success in attracting new industries to the industrial cities of Jubail on the
Arabian Gulf and Yanbu on the Red Sea. Over 200 companies have invested more than
$60bn in the cities, providing employment for over 85,000 workers. They also host some of
the world‘s largest petrochemical facilities, and both cities are currently being expanded to
cater for increased demand (SAGIA, 2007).
So far, Jubail has attracted over half of the Kingdom‘s total foreign direct investment, mainly
in the petrochemicals sector. It is home to 77% of Saudi Arabia‘s petrochemical production,
which makes up 6-7% of the world‘s supply. In total, Jubail produces around 70% of the
Kingdom‘s non-oil exports, with 181 industries already present and another 95 in design or
construction. In February 2005, the Financial Times Foreign Direct Investment magazine
named Jubail as the city with the best economic potential in the Middle East, reflecting its
future growth prospects. A SR255 billion expansion of Jubail is currently underway, of which
SR240 will be funded by the private sector. This ‗Jubail-2‘ expansion will upgrade the King
Fahd industrial and commercial port, and add to the supporting infrastructure in the city. The
project is planned in four stages, from now until 2012, and will eventually double the size of
the serviced industrial area, catering for 25 industries producing 49 million tonnes of products
per year (SAGIA, 2007).
4.4.5 Transport Development
There are a number of transport projects in development which will significantly improve the
logistics networks in the Kingdom (see Table 4.2). This is a key sector for the government
and is one of the SAGIA‘s core sectors for development outside of the energy sector
(SAGIA, 2007). The consumption of products from more distant Asian economies (in
particular, China) is forecast to continue growing rapidly. Establishing the Kingdom as an
excellent transport and logistics hub is therefore important if it is to exploit growing export
markets fully. Some of the key transport projects in development include:
• The Land Bridge railway project. This is a $1.3 billion railway, which will connect Jeddah
on the Red Sea to Dammam on the Gulf Coast, via Riyadh. It is intended to be used mainly
for freight, and has a start-up date of 2010.
• The 2,400 km North-South freight and passenger railway is a $2.8 billion link which will
transport phosphates and bauxite from mines in the north of the country for processing at the
new industrial city of Ras Az Zawr on the Gulf Coast.
Page 111
96
• Expansion of the King Abdulaziz airport in Jeddah is scheduled for 2010, at a cost of $1
billion. It is intended that other airports in the country will also be expanded to meet
predicted increases in air transport.
• The development of the Special Economic Cities and the expansion of Jubail and Yanbu
will involve significant expansions or construction of new ports and supporting facilities.
Table 4.2 Major Infrastructures and Transport Projects in Development
Source: SAGIA, 2007
4.4.6 Saudi General Investment Authority (SAGIA)
SAGIA is the Saudi government agency responsible for managing the investment
environment in the Kingdom, promoting investments within it, providing government
services to investors and managing the Kingdom‘s Special Economic Cities (SECs). The
SAGIA was established in April 2000 by Royal Decree and was created at the same time as
the introduction of a new Foreign Investment Law, which grants foreign investors the same
benefits as domestic investors (SAGIA, 2008).
Page 112
97
The SAGIA‘s vision is to achieve rapid economic growth in Saudi Arabia, by capitalising on
the Kingdom‘s competitive strengths in energy and on its strategic location between East and
West. To achieve this vision, the SAGIA‘s primary objectives centre on contributing towards
policy improvements which directly impact on the overall investment climate in the
Kingdom, fostering and marketing investment opportunities to prospective investors, and
supporting interested parties through the investment process by providing relevant services
and information (SAGIA, 2008).
In the last few years, the SAGIA has therefore been at the forefront of implementing several
initiatives to improve the business environment in Saudi Arabia. As a direct result, the
Kingdom saw the level of foreign direct investment (FDI) on the part of international
investors leap from $0.2 billion in 2000 to over $38.2 billion in 2008 (UNCTAD, 2009),
reflecting increasing confidence among investors about the long-term stability and
competitive benefits of operating in the Kingdom.
4.5 FDI Patterns in Saudi Arabia
4.5.1 Sectoral Distribution of FDI in Saudi Arabia
As far as the sectoral distribution of FDI inflows in Saudi Arabia are concerned, the
manufacturing sector, especially refined petroleum products and petrochemical products,
have alone attracted the lion‘s share of foreign investment (see Table 4.4 and Table 4.5), and
made up almost 42% of the total FDI stock by 2008. In fact, almost 85% of manufacturing
industry is concentrated on the manufacture of refined petroleum products and petrochemical,
while the remaining part is distributed among other industries including real estate, finance
services and insurance, mining, the extraction of oil and gas, electricity, transport, storage and
communications, gas and water supply and other activities with minimal investment (see
Table 4.3). The largest contribution to the FDI inflow was to the refining petroleum industry
with 17.8% of total FDI stock in 2008, and to the petrochemical industry with a share of
17.5% of the total FDI stock in 2008, indicating a heavy concentration of FDI in that activity.
Next comes real estate with a share of 14.5%, finance services and insurance with the share
of 10.8%, mining, oil and gas with a share of 8.6%, contracting with a share of 7.5%,
transportation, storage and telecommunications with a share of 5.0% and the remaining share
distributed among other activities (see Figure 4.9 and Figure 4.10). As we can see, foreign
investment in Saudi Arabia has been distributed across a very wide range of fields. Future
Page 113
98
investment liberalisation and Saudi Arabia accessing to the WTO will result in more FDI
inflow into Saudi Arabia (SAGIA, 2009).
Table 4.3 FDI Inflows & Stocks In Saudi Arabia by Sector (Millions of dollars)
Source: SAGIA (2009)
Page 114
99
Figure 4.9 FDI Stock by Sector in 2008 (Total US $ 114.3 Billion)
Source: SAGIA (2009)
Figure 4.10 FDI Inflow by Sector in 2008 (Total US $ 38.2 Billion)
Source: SAGIA (2009)
Page 115
100
Table 4.4 Major FDI Projects in Saudi Arabia in 20088
Source: SAGIA (2009)
Page 116
101
Table 4.5 Continue Major FDI Projects in Saudi Arabia in 2008
Source: SAGIA (2009)
4.5.2 Source of FDI in Saudi Arabia
While the number of FDI source countries in Saudi Arabia is quite large, a handful of
countries account for the sums invested. The USA comes first as a single investor in term of
total FDI stock in Saudi Arabia with a share of 19.3% (see Table 4.6, Table 4.7, Table 4.8,
Figure 4.11 and Figure 4.12). Other source countries with regard to FDI include the United
Arab Emirates (UAE) (12.8%, ranked as second), Japan (10.5%, ranked as third), Kuwait
(8.2%, ranked as fourth), France (7.8%, ranked as fifth), the Netherlands (6.6%, ranked as
sixth), and China (3.3%, ranked as seventh) with other countries playing a minor role.
Page 117
102
Table 4.6 FDI Inflows by Country in Saudi Arabia (Millions of dollars)
Source: SAGIA (2009)
Page 118
103
Table 4.7 Continue. FDI Inflows by Country In Saudi Arabia (Millions of dollars)
Source: SAGIA (2009)
Page 119
104
Table 4.8 Top 30 Countries Investing in Saudi Arabia (Millions of dollars)
Source: SAGIA (2009)
Page 120
105
Figure 4.11 FDI Stock by Source in 2008 ( Total US $ 114.3 Billion)
Source: SAGIA (2009)
Figure 4.12 FDI Inflows by Source in 2008 (Total US $ 38.2 Billion)
Source: SAGIA (2009)
Page 121
106
4.5.3 Regional Distribution of FDI in Saudi Arabia
The regional distribution of FDI inflows into Saudi Arabia has been significantly uneven and
highly concentrated in the east and west coastal regions and the central region, although FDI
is located in almost every corner of Saudi Arabia (see Table 4.9, Table 4.10 and Figure 4.13).
The eastern region attracted 37.5% of total FDI stock while the central region recorded 30%
and the western region attracted 23% of total FDI inflow into Saudi Arabia.
Table 4.9 FDI Inflows by Regions in Saudi Arabia (Millions of dollars)
Source: SAGIA (2009)
Page 122
107
Table 4.10 FDI Stocks by Regions in Saudi Arabia (Millions of dollars)
Source: SAGIA (2009)
Figure 4.13 FDI Stock by Region in 2008: (Total US $ 114.3 Billion)
Source: SAGIA (2009)
Page 123
108
4.6 FDI in the Petrochemicals Industry
4.6.1 Petrochemicals Definition
Petrochemicals are chemical products made from the raw material of petroleum or products
of other hydrocarbon origins. Although some of the chemical compounds that originate from
petroleum may also be derived from other sources (such as coal or natural gas), petroleum is
a major source of many petrochemicals products (Matar and Hatch, 2001).
4.6.2 Overview of the Saudi Petrochemicals Industry
The petrochemicals sector is the largest and most important non-oil industrial sector in Saudi
Arabia. Saudi Arabia‘s current strengths are in the production of basic petrochemical building
blocks such as ethylene and methanol; the Kingdom currently ranks second in the world for
methanol and ethylene glycol production, and fifth in ethylene production. Overall, Saudi
Arabia is the 11th largest supplier of petrochemicals globally, producing 7-8% of the world‘s
supply, and the Kingdom has ambitious plans to increase this to 13-14% by 2010 (SAGIA,
2007). Saudi Arabia is the only country in the Gulf Cooperation Counsil (GCC) that has
opened up its petrochemical sector to private investment, and the private sector has not been
slow in mobilising to pursue new opportunities. As a further spur towards increasing
competition in the sector, Saudi Aramco is currently planning two integrated petrochemical
developments at its Rabigh and in Ras Tanura refineries, which will establish it as a major
market player in partnership with international giants Sumitomo Chemical and the Dow
Chemical Company (SAGIA, 2007).
4.6.3 History and Current Trends With Regard to the Saudi Petrochemicals Industry
The petrochemicals sector in Saudi Arabia was established in the mid-1970s with the
Kingdom‘s decision to start utilising its vast natural gas resources, 60% of which is ethane-
rich gas associated with crude oil production as fuel and feedstock for domestic industries
(International Energy Agency (IEA), 2008). Prior to this, all of the associated gas was flared,
due to the lack of a developed domestic market and the lack of any gas export infrastructure
(SAGIA, 2007). The government realised that establishing a domestic petrochemicals
industry would provide the best way to add value to the gas. A number of key events
subsequently occurred in 1976 as follows:
• The government formed the Royal Commission for Jubail and Yanbu (RCJY), which was
entrusted with the responsibility of developing and managing the construction of two new
Page 124
109
industrial cities. The intention was to develop an excellent infrastructure in order to attract
industrial users to locate in the Kingdom.
• The cross-country grid, known as the Master Gas System, was developed by Aramco, and
included gas and NGL processing, distribution and storage infrastructures.
• The government created the Saudi Basic Industries Corporation (SABIC), a national
champion for domestic petrochemical manufacturing, whose role was to drive the industry
forward through a number of key projects in Jubail and Yanbu.
To encourage industrial growth, the government also fixed the price by Royal Decree for its
methane-ethane gas fuel and feedstock at a competitive level (originally $0.50/mmBtu,
currently $0.75/mmBtu) to reduce the volatility for domestic companies. This price was fixed
until 2011, at which time it will be reviewed. The government also set up the Saudi Industrial
Development Fund (SIDF) to provide soft financing for projects. Since then, the
petrochemicals sector has grown exponentially, mainly by focussing on commodity
petrochemicals. Production capacity increased from 4 million tonnes per year from the initial
investment in 1985 to around 50 million tonnes in 2005, representing a compound annual
growth rate of 13.4%. This growth trend is forecast to continue, because of the Kingdom‘s
continuing investment in first-rate infrastructure and the significant number of ongoing
petrochemical projects in development. Capacity is forecast to increase to 75 million tonnes
by 2010, raising the Kingdom‘s share of world capacity to 13-14% (see Figure 4.14)
(SAGIA, 2007).
Figure 4.14 Saudi Arabia’s Petrochemicals Capacity 1985-2015
Source: SAGIA, 2007
Page 125
110
4.6.4 Petrochemicals Market
The global petrochemicals market is driven by the ever-increasing appetite for chemicals and
plastic, which are part of our everyday lives, from cars to packaging to paints. After some
difficult years in what is a highly volatile industry from an earnings point of view, the
sustained Asian growth of the past decade has allowed the development of projects to serve
those new growth markets, while the previous generation of European and North American
producers has struggled to meet the cost-focused needs of the commodity sector. While the
industry over time may trend towards GDP level growth, the penetration of commodity
petrochemicals and plastics still has a long way to go (SAGIA, 2007).
4.6.5 Basis of Competition in the Petrochemicals Industry
The industry has changed dramatically over the past 20 years, and the barriers to entry have
reduced significantly as technology has become available, mainly off the shelf, for relatively
affordable licence fees. In addition, the capability to compete in terms of product
differentiation has become more challenging with end-use customers and their retail suppliers
demanding greater performance from their chemical suppliers at a lower price. As such, the
sector today is driven by either market proximity or large-scale projects leveraging low-cost,
secure feedstock. This is amply demonstrated by the level of project activity in East Asia and
the Middle East, and most notably in China and Saudi Arabia over the past five years
(SAGIA, 2007).
4.6.6 Saudi’s Petrochemicals Market Overview
The Saudi Arabian petrochemicals business environment is by far the most attractive in the
Middle East region due to substantial reserves of cheaply extractable feedstock – including
the largest oil reserves in the world. The petrochemicals sector accounts for about 7% of the
global supply of basic and intermediate petrochemical products. The sector also benefits from
a supportive government, plenty of foreign companies willing to invest, an ideal location to
export to Europe and Asia, and a rapidly growing capacity that could lead to its becoming the
second-largest ethylene producer in the world (behind the US) by the end of the decade
(BMI, 2009). From being a net importer, the country has emerged as a leading exporter in the
petrochemicals sector, supplying to over 100 countries. The primary drivers for such a
turnaround have been strong infrastructure, significant cost advantages due to lower average
variable and fixed costs, and competitive and fixed natural gas prices. These factors have also
Page 126
111
resulted in substantial investment inflows into the sector (BMI, 2009).
The petrochemicals industry is growing at a consistent and exponential rate, accounting for
about 7% of the global supply of basic and intermediate petrochemical products. The
country‘s strong infrastructure, significant cost advantage due to lower average variable and
fixed costs, and competitive and fixed natural gas prices make it an attractive destination for
investment in crackers of olefins and derivatives. SAGIA energy strategy promotes
diversification into the downstream sector and the development of export-oriented plastic
conversion industries, resulting in further opportunities. Investor confidence in the industry is
evident from the large investment commitments made by global companies over the last few
years through joint ventures (JVs) and expansions (BMI, 2009).
The Saudi petrochemicals industry is expected to satisfy 13% of the global demand for basic
and intermediate products by the end of the decade. The Kingdom‘s low production and
feedstock costs make it particularly attractive for investments in olefins and derivatives,
while the government is also keen to encourage export-oriented plastic conversion projects.
As oil prices increase, the relative feedstock cost advantage also increases, thus leading to
extremely low feedstock costs in a high oil price scenario in comparison with other nations.
The country provides feedstock at a price that provides a petrochemicals producer with an
incentive to invest, while offering better value for hydrocarbon producers. This advantage in
feedstock cost translates itself into the ability to manufacture and deliver polyolefins from a
strong competitive cost position. A Saudi producer utilising ethane/propane as a feedstock
and producing low-density polyethylene (LDPE) could deliver material to a Chinese
customer at substantial cost savings. The result has been a substantial capacity growth in the
Saudi Arabian petrochemicals markets, especially with regard to gas-petrochemicals growth
in the region. Many new projects are the result of public private partnerships (PPP) and/or
JVs with foreign petrochemical firms. More than US$70bn of investment is being channelled
into the country‘s petrochemicals sector (BMI, 2009).
4.6.7 Saudi Arabian Value Proposition
Saudi Arabia‘s historic position in the industry is now secure, with a new generation of
commodity projects being built to leverage the additional feedstock being made available, as
the Kingdom‘s role in meeting the world‘s energy needs becomes increasingly important.
These projects will follow the pattern that has made the industry successful: secure,
Page 127
112
advantaged feedstock being transformed in state-of-the-art, world-scale plants. In addition to
the historic model, however, the development of Saudi Arabia‘s refining sector, with more
complex refineries integrated with petrochemical plants, signals a new era in the industry in
Saudi Arabia, as new and more complex chemistries are added to existing success stories,
adding maximum value to the barrel for the Saudi economy and for the consumer (SAGIA,
2007).
On the supply side, the Middle Eastern petrochemicals industry, and the Saudi Arabian
industry in particular, has benefited strongly from demand growth, due to the competitive
advantage afforded by the availability of some of the lowest cost natural gas and feedstocks
in the world. That historical source of competitive advantage is now likely to be joined by a
number of highly integrated refining and petrochemical investments, which will broaden the
types of petrochemical building blocks available and will offer new sources of created
advantage from the optimisation of the refining/chemicals interface. According to the Oil and
Gas Journal, 71% of the new ethylene plant capacity coming on stream prior to 2011 will be
based in the Middle East, with Saudi Arabia making up 25% (see Figure 4.15) (SAGIA,
2007).
Figure 4.15 Planned New Global Capacity of Ethylene till 2011 by Region
Source: SAGIA, 2007
In the Middle East, Saudi Arabia is the focus of most of the region‘s upcoming petrochemical
projects, reflecting the intense level of interest in the Kingdom. For example, MEED suggests
that three-quarters of the $17.5 billion of petrochemical engineering, procurement and
construction (EPC) contracts awarded in the GCC in the 12 months leading up to June 2006
were in Saudi Arabia (see Figure 4.16) (SAGIA, 2007). In particular, the Kingdom will be
Page 128
113
the location of around 70% of the planned propylene capacity expansions over the next five
years in the GCC, far more than in any other country (see Figure 4.17).
Figure 4.16 Major Petrochemical Contracts Awarded in the GCC in 2005-06
Source: SAGIA, 2007
Figure 4.17 Planned New Capacity for Propylene till 2010 in the Middle East
Source: SAGIA, 2007
4.6.8 Competitively Priced Feedstock
In addition to increased feedstock volumes, in its recent WTO accession negotiations, Saudi
Arabia was successful in agreeing the basis for a continuation of the competitive pricing
formulae for methane, ethane and NGL feedstock. The price $0.75/mmBtu for methane and
ethane, and a 30% discount on the prices for propane, butane and natural gasoline provide a
significant competitive advantage for any foreign or domestic investor in the petrochemicals
Page 129
114
sector. This favourable differential has clear benefits for the petrochemicals industry, where
feedstock costs can account for 60% of the cost of production (see Figure 4.18). For example,
in 2006, the cash cost of ethane-based ethylene production in the Kingdom was around $100-
110 per tonne, compared to naphtha-based ethylene production in Asia costing four times as
much. Relative to Europe and the US, the difference is even greater (see Figure 4.18)
(SAGIA, 2007).
Figure 4.18 Ethylene Cash Cost of Production in 2006
Source: SAGIA, 2007
4.6.9 Implications and Investment Attractiveness of Saudi Arabia
The Saudi Arabian petrochemicals sector has successfully developed a robust industry in the
past 25 years, which has been highlighted by two critical success factors. The first is the
feedstock advantage and the second is the non-feedstock operational excellence. In reviewing
the operations of the world‘s leading petrochemical companies over the past several decades,
the growth and profit leaders have had an absolute fixation with feedstock. In considering
projects, the industry leaders search for two attributes – security and price (SAGIA, 2007).
We shall briefly explore each of these. First, given the scale of investment in modern
petrochemicals, security is essential to underwrite a project. The growing demand for fuel, as
much as for petrochemicals, makes this an increasingly important aspect, as can be seen by
the move of companies with traditionally fewer upstream ties, such as Dow Chemical
Company and BASF, to invest in projects which reduce their exposure to feedstock security.
As the world‘s number one resource holder, the security of supply in Saudi Arabia is
Page 130
115
unparalleled (SAGIA, 2007). Second, the basic price level of feedstock is also critical as it
represents the majority of the cost for most of the petrochemicals under consideration in the
KSA. In the following figure we look at the cash cost of ethylene in 2005 as analysed by
Deutsche Bank/CMAI. The Saudi value proposition needs little explanation in terms of this
chart (see Figure 4.19) (SAGIA, 2007).
Figure 4.19 World Ethylene Cash Costs (USGC Natural Gas $8.28 per mmbtu, Brent @ $55 per bbl)
Source: SAGIA, 2007
The increase in differentiated chemicals, and the wider production base, including new
refineries, will transform the Saudi Arabian petrochemicals sector into one featuring a broad
range of products, and a new level of operational, commercial and strategic sophistication.
This will itself generate more opportunities for new investment in speciality chemicals, and in
performance polymers in particular (SAGIA, 2007). WTO accession has also meant
increasing opportunities to serve export markets, with Saudi Arabia located close to the fast-
growing markets in the GCC, Asia and North Africa. Future projects will present sizeable
opportunities, not only for these petrochemical producers and their financial backers, but also
for a wide range of supporting service sector companies, such as those operating in the
engineering, construction, health and safety, and operations and maintenance sectors. Higher
prices are encouraging growth and new entrants to the petrochemical services sector,
potentially offering many attractive opportunities (SAGIA, 2007).
4.6.10 Saudi Petrochemicals Industry Key Strengths
Saudi Arabia has the largest oil reserves in the world and ample gas reserves, both of
which are comparatively easy to extract, providing abundant and extremely inexpensive
Page 131
116
feedstock for its growing petrochemicals industry. Long-term feedstock supply security is
unparalleled (SAGIA, 2008; BMI, 2009).
The country is strategically located for export to Europe and Asia – and has a strong
relationship with China (SAGIA, 2008; BMI, 2009).
The sector is now fully open to private local and foreign investors (SAGIA, 2008; BMI,
2009).
Petrochemical support industries are growing rapidly with the efficiency effects of the
cluster being seen in the quality of contracting, and the management, operational and
marketing skills of the now experienced Saudi Arabian workforce (SAGIA, 2008; BMI,
2009).
Excellent infrastructure in Jubail and Yanbu, which is undergoing constant expansion and
upgrading (SAGIA, 2008; BMI, 2009).
The total erected cost of capital projects is now highly competitive due to the scale of the
petrochemical clusters on the East and West coasts (SAGIA, 2008; BMI, 2009).
Extensive and wide-ranging business opportunities for the supply of support services to
the petrochemicals sector (SAGIA, 2008; BMI, 2009).
WTO membership allows free access to new export markets for Saudi petrochemical
producers (SAGIA, 2008; BMI, 2009).
The government has undertaken substantial investments in the sector and is encouraging
foreign companies to enter into JVs with Saudi partners with regard to new projects
(SAGIA, 2008; BMI, 2009).
A major increase in refining capacity between now and 2011 will ensure adequate, cost-
effective feedstock supplies for new petrochemical projects (SAGIA, 2008; BMI, 2009).
US$70bn of investment in the petrochemicals sector by 2011 (SAGIA, 2008; BMI, 2009).
South East Asia has emerged as a major destination for the country‘s petrochemicals
output, with the Kingdom being well located for trading purposes (SAGIA, 2008; BMI,
2009).
Business links with China are being actively promoted (SAGIA, 2008; BMI, 2009).
Large-scale expansions are underway for various petrochemical production facilities
(SAGIA, 2008; BMI, 2009).
Government support for an upward movement in the petrochemicals value chain in the
form of incentives (exemptions and grants) to industrialists investing in the plastics
industry (SAGIA, 2008; BMI, 2009).
Page 132
117
4.6.11 The Future of the Saudi Petrochemicals Industry
Saudi Arabia‘s export-oriented petrochemicals industry is likely to be severely affected by
the economic downturn, particularly in one of its most lucrative export markets, China. Saudi
producers are already facing a highly competitive Chinese market, as China‘s domestic
petrochemicals industry expands and imports diminish. With Chinese economic growth
dipping to a seven-year low of 6.8% in Q4/08, dragging full-year growth for 2008 to 9.0%
from 13.0% in 2007, the rate of decline in Chinese petrochemicals import demand is set to
increase. Imports plummeted by 21.3% year-on-year in December 2008, the GDP growth
slowed to 5.6% in 2009. Taking a longer term view, China is set to remain a net ethylene
importer over the next five years, despite an additional 11.95mn tpa of new production
capacity coming online, but will decline throughout the rest of the forecast period as the rate
capacity expansion outstrips the rate of demand, with the deficit falling from an estimated
13.49mn tonnes in 2008 to 8.89mn tonnes by 2013 (BMI, 2009).
Saudi companies are still enjoying profits as they receive ethane feedstock at a very
competitive rate of US$0.75/BTU, compared with US$8.00/BTU in the US. While the
decline in oil prices has narrowed the gap between ethane and naphtha, they are not likely to
make much of a difference to the competitiveness of Saudi petrochemicals production (BMI,
2009). The government‘s strategic plan for investment in the petrochemicals industry will
increase investments in the plastics industry, and grant various exemptions to industrialists
and business persons who invest in these industries. The country‘s low production and
feedstock costs make it particularly attractive for investments in olefins and derivatives,
while the government is keen to encourage export-oriented plastic conversion projects (BMI,
2009).
4.7 Summary
In this chapter, we discussed the Saudi Arabia background, including the country‘s
background, the economic environment, criteria for Saudi economy openness, and increasing
interest regarding investment in Saudi Arabia. In addition, the chapter discussed the FDI in
Saudi Arabia, including the history of FDI in Saudi Arabia, forms of FDI in Saudi Arabia, the
investment environment in Saudi Arabia, Saudi Arabia‘s competitive advantages, special
economic and industrial zones, Saudi Arabia and the WTO, infrastructure development.
transport development, and the investment regulations in Saudi Arabia. Moreover, the chapter
Page 133
118
We also discussed the FDI patterns in Saudi Arabia and how Saudi Arabia is benchmarked as
a place for business, including the Doing Business report, the Global Competitive report, and
the World Investment report. The chapter also offered an overview of the Saudi
petrochemical industry, including a history of the industry, the basis for competition in the
petrochemical industry, a market overview, competitively priced feedstock, and the
investment attractiveness of Saudi Arabia. Finally, the chapter gives a general overview of
the FDI with regard to the Saudi petrochemical industry, and shows many advantages of FDI
in Saudi Arabia, including the fact that Saudi Arabia feedstock prices are the lowest in the
world, the country‘s strategic location for export to Europe and Asia, very good industrial
support to the petrochemical industry, excellent infrastructure in Jubail and Yanbu, the fact
that joining the WTO has allowed free access to new markets, and strong government
incentives to FDI in the petrochemical industry. The next chapter will present the analysis of
the research findings.
Page 135
120
Chapter 5 : Analysis of the Research Findings
5.1 Research Findings
5.1.1 Introduction
In this section, we discuss the data used to test for the importance and competitiveness of
location factors using frequency tables. A frequency table provides the number of people who
participated in the study and the percentage belonging to each of the type for the variable in
the survey (Bryman and Bell, 2007).
5.1.2 Location Factors’ Importance
The data for the location factors‘ importance are analyzed in Table 5.1, including the main
location factors and the sub-factors, the responses scale in numbers and percentages for each
location factor in the questionnaire, the mean, the standard deviation and the number of
responses for each location factor. Figure 5.1 shows the description of the sub- location
factors based on the mean for each location factor compared to other factors.
Six major factors were used to constitute the importance of the location factors. They were
cost factors, market factors, economic factors, infrastructure and technological factors,
political and legal factors, and social and cultural factors. Also, six factors were used to
constitute the cost factors. These were factory site costs (land cost), labour costs,
transportation/ logistic costs, costs of raw materials, return on investment and energy costs.
The market factors consist of the size of the host market, market growth in the host country,
level of competition in the host market and market familiarity. The economic factors
comprised of four sub-factors which include economic stability, economic growth, exchange
rates, and local financial support. Seven sub-factors constitute the infrastructure and
technological factors. These include the level of infrastructure (ports, roads, airports, etc.),
high industrial concentration (clustering), availability of a well qualified workforce, access to
reliable and co-operative suppliers, availability of factory sites (land), availability of raw
materials and geographical proximity to the markets. The political and legal factors comprise
of the political stability, international trade agreements, tax reductions in the host country,
Page 136
121
benign environmental legislation towards FDI, diplomatic ties with the host country and a
good legal and regulatory system. Four factors where used to constitute the social and
cultural factors. These were cultural distance, attitude of the local community towards the
firm, local employees‘ loyalty to the firm, and language.
The next section, discusses in detail the results of each of these major factors and the sub-
factors related to them.
Page 137
122
Table 5.1 Location Factors in the Petrochemicals Industry (Mean)
Note: 1: Scale: (1) “Very Unimportant,” (2) “Unimportant,” (3) “Neutral,” (4) “Important,” (5) “Very Important”
Scale Descriptive Response Scale Major and Sub-Location Factors
n S.D. Mean 5 4 3 2 1
42 42
42
42 42
42
0.46
0.96
1.08
0.77
0.49
0.49
0.32
4.04
3.29
2.62
4.12
4.60
4.74
4.88
9.5% (4) 2.4% (1)
33.3% (14)
59.5% (25)
76.2% (32)
88.1% (37)
35.7% (15)
19.0% (8)
47.6% (20)
40.5% (17) 21.4% (9)
11.9% (5)
28.6% (12)
35.7% (15)
16.7% (7)
0.0% (0) 2.4% (1)
0.0% (0)
26.2% (11) 23.8% (10)
2.4% (1)
0.0% (0) 0.0% (0)
0.0% (0)
0.0% (0) 19.0% (8)
0.0% (0)
0.0% (0) 0.0% (0)
0.0% (0)
A.Cost factors
1. Factory site cost ( Land cost) 2. Labour costs
3. Transportation/ logistic costs
4. Cost of raw materials 5. Return on investment
6. Energy costs
42
42 42
42
0.69
0.84
1.06
0.70
0.99
2.44
2.14
2.19
2.55
2.88
0.0% (0)
4.8% (2) 0.0% (0)
4.8% (2)
2.4% (1)
4.8% (2) 7.1% (3)
21.4% (9)
35.7% (15)
23.8% (10)
45.2% (19)
38.1% (16)
35.7% (15)
38.1% (16)
42.9% (18)
28.6% (12)
26.2% (11)
28.6% (12) 4.8% (2)
7.1% (3)
B.Market factors
7. Size of host markets
8. Market growth in the host country 9. Level of competition in the host market
10. Market familiarity
42 42
42
42
0.76
1.12
0.88
0.93
1.03
3.14
3.62
2.57
3.62
2.74
28.6% (12)
0.0% (0)
19.0% (8)
2.4% (1)
26.2% (11) 19.0% (8)
35.7% (15)
26.2% (11)
23.8% (10) 26.2% (11)
33.3% (14)
23.8% (10)
21.4% (9)
47.6% (20)
11.9% (5)
38.1% (16)
0.0% (0) 7.1% (3)
0.0% (0)
9.5% (4)
C.Economic factors 11. Economic stability 12. Economic growth
13. Exchange rates
14. Local financial support
42
42
42
42 42
42
42
0.36
0.46
0.64
0.69
0.87
0.60
0.46
0.91
3.91
4.31
3.86
2.64
4.33
4.02
4.69
3.50
31.0% (13)
14.3% (6)
0.0% (0)
57.1% (24)
19.0% (8)
69.0% (29)
16.7% (7)
69.0% (29)
57.1% (24)
11.9% (5)
21.4% (9)
64.3% (27)
31.0% (13)
28.6% (12)
0.0% (0)
28.6% (12)
40.5% (17)
19.0% (8) 16.7% (7)
0.0% (0)
42.9% (18)
0.0% (0)
0.0% (0)
47.6% (20)
2.4% (1) 0.0% (0)
0.0% (0)
11.9% (5)
0.0% (0)
0.0% (0)
0.0% (0)
0.0% (0) 0.0% (0)
0.0% (0)
0.0% (0)
D. Infrastructure and technological factors 15. Level of infrastructure (ports, roads, airports, etc.)
16. High industrial concentration (clustering)
17. Availability of well qualified workforce
18. Access to reliable and cooperative suppliers 19. Availability of factory sites (land)
20. Availability of raw materials
21. Geographical proximity to markets
42
42 42
42
42 42
0.42
0.55
0.93
0.84
0.58
0.72
0.93
3.70
4.45
3.10
3.90
4.38
3.33
3.05
47.6% (20)
9.5% (4) 23.8% (10)
42.9% (18)
2.4% (1) 7.1% (3)
50.0% (21)
19.0% (8)
50.0% (21)
52.4% (22)
40.5% (17) 23.8% (10)
2.4% (1)
42.9% (18)
19.0% (8)
4.8% (2)
45.2% (19)
35.7% (15)
0.0% (0)
28.6% (12) 7.1% (3)
0.0% (0)
11.9% (5) 33.3% (14)
0.0% (0)
0.0% (0) 0.0% (0)
0.0% (0)
0.0% (0) 0.0% (0)
E. Political and legal factors 22. Political stability
23. International trade agreements 24. Tax reductions in the host country
25. Benign environmental legislation towards FDI
26. Diplomatic ties with the host country 27. Legal and regulatory system
42 42
42
42
0.66
0.94
1.03
1.03
0.98
2.19
2.12
2.43
2.38
1.83
0.0% (0) 0.0% (0)
0.0% (0)
2.4% (1)
7.1% (3) 16.7% (7)
19.0% (8)
2.4% (1)
28.6% (12)
33.3% (14)
21.4% (9)
19.0% (8)
33.3% (14)
26.2% (11)
38.1% (16)
28.6% (12)
31.0% (13) 23.8% (10)
21.4% (9)
47.6% (20)
F. Social & Cultural factors 28. Cultural distance 29. Attitude of the local community towards the firm
30. Local employees‘ loyalty to the firm
31. Language
Page 138
123
Figure 5.1 Importance of Location Factors
5.1.2.1 Major Factors’ Importance
Table 5.2 summarises the importance of the major location factors, including the mean and
standard deviation for each factor. Figure 5.2 shows the distributions of each major factor
mean relative to other location factors. The major factors are calculated by the total average
response rate for the sub-factors for each major location factor. The cost factors have
arithmetic mean score of 4.04, and standard deviation (s.d.) of 0.46; market factors have
mean score of 2.44, and s.d. of 0.69; economic factors have mean of 3.14, and s.d. of 0.76;
infrastructure and technological factors have mean score of 3.91, and s.d. of 0.36; political
and legal factors have mean score of 3.70, and s.d. of 0.42; social and cultural factors have
Page 139
124
mean score of 2.19, and s.d. of 0.66.
Table 5.2 Major Factors’ Importance
Major Factors’ Importance Mean S.D.
Cost factors
Market factors
Economic factors
Infrastructure and technological factors
Political and legal factors
Social & Cultural factors
4.04
2.44
3.14
3.91
3.70
2.19
0.46
0.69
0.76
0.36
0.42
0.66
Figure 5.2 Major Factors’ Importance
5.1.2.2 Cost Factors’ Importance
Table 5.3 shows the descriptive data for the importance of the cost factors and the arithmetic
mean, standard deviation and number of responses for each sub-location factor related to cost
factors. Figure 5.3 shows the distributions of the cost factors‘ average mean for each sub-
factor compared to other cost sub-factors. Evidence in Table 5.3 shows that 35.7 % (15) of
respondents rated the site cost as an important factor with a mean of 3.29, and s.d. of 0.96.
35.7 % (15) of respondents rated labour costs as neutral, with a mean score of 2.26, and s.d.
of 1.06. Transportation and logistics costs were rated by 47.6% (20) as an important factor
with a mean of 4.12, and s.d of 0.77. Low costs of raw materials were rated by 59.5 % (25) as
a very important location factor with a mean of 4.60, and s.d. of 0.49. Return on investment
was rated by 76.2% (32) of the participants as a very important factor for their location
decision with a mean of 4.74, and s.d. of 0.49. Energy costs were rated by 88.1% (37) of the
participants as a very important factor for their location decision with a mean of 4.88, and s.d.
Page 140
125
of 0.32.
Table 5.3 Cost Factors’ Importance
Scale Descriptive Response Scale Cost Factors
n S.D. Mean 5 4 3 2 1
42
42
42
42
42
42
0.96
1.08
0.77
0.49
0.49
0.32
3.29
2.62
4.12
4.60
4.74
4.88
9.5% (4)
2.4% (1)
33.3% (14)
59.5% (25)
76.2% (32)
88.1% (37)
35.7% (15)
19.0% (8)
47.6% (20)
40.5% (17)
21.4% (9)
11.9% (5)
28.6% (12)
35.7% (15)
16.7% (7)
0.0% (0)
2.4% (1)
0.0% (0)
26.2% (11)
23.8% (10)
2.4% (1)
0.0% (0)
0.0% (0)
0.0% (0)
0.0% (0)
19.0% (8)
0.0% (0)
0.0% (0)
0.0% (0)
0.0% (0)
Factory site costs (Land cost)
Labour costs
Transportation/logistic cost
Cost of raw materials
Return on investment
Energy costs
Note: 2: Scale: (1) “Very Unimportant”, (2) “Unimportant”, (3) “Neutral”, (4) “Important”, (5) “Very Important”
Figure 5.3 Cost Factors’ Importance
5.1.2.3 Market Factor’ Importance
Table 5.4 summarises the descriptive data for the market factors‘ importance, including the
mean, standard deviation and number of responses for each sub-location factor associated
with market factors. Figure 5.4 shows the average mean of each location factor under market
factors compared to other location factors. The large size of the host market was rated by
35.7% (15) of the participants as unimportant and neutral equally with a mean of 2.14, and
s.d. of 0.84. Evidence in Table 5.4 also shows that market growth in the host market was
rated by 38.1% (16) as an unimportant location factor with a mean of 2.19, and s.d. of 1.06.
The level of competition in the host market was rated by 45.2% (19) of participants as a
neutral location factor with a mean of 2.55, and s.d. of 0.70. Market familiarity was rated by
38.1% (16) as neutral in terms of their location decision with a mean of 2.88, and s.d. of 0.99.
Page 141
126
Table 5.4 Market Factors’ Importance
Scale Descriptive Response Scale Market factors
n S.D. Mean 5 4 3 2 1
42
42 42
42
0.84
1.06
0.70
0.99
2.14
2.19
2.55
2.88
0.0% (0)
4.8% (2) 0.0% (0)
4.8% (2)
2.4% (1)
4.8% (2) 7.1% (3)
21.4% (9)
35.7% (15)
23.8% (10)
45.2% (19)
38.1% (16)
35.7% (15)
38.1% (16)
42.9% (18)
28.6% (12)
26.2% (11)
28.6% (12) 4.8% (2)
7.1% (3)
Size of the host markets
Market growth in the host country Level of competition in the host market
Market familiarity
Note: 3 Scale: (1) “Very Unimportant”, (2) “Unimportant”, (3) “Neutral”, (4) “Important”, (5) “Very Important”
Figure 5.4 Market Factors’ Importance
5.1.2.4 Economic Factors’ Importance
Table 5.5 summarises the descriptive data for the economic factors‘ importance for each sub-
economic location factor including the mean, standard deviation and number of participants.
Figure 5.5 shows the average mean of each location factor compared to other location factors
related to economic factors. Economic stability was rated by 28.6% (12) of the participants as
a very important location factor with a mean of 3.62, and s.d. of 1.12. Economic growth was
rated by 47.6% (20) of participants as being an unimportant location factor with a mean sore
of 2.57, and s.d. of 0.88. Exchange rates were rated by 35.75% (15) of the participants as
being an important location factor with a mean of 3.62, and s.d. of 0.93. Local financial
support was rated by 38.1% (16) as being an unimportant location factor with a mean of 2.74,
and s.d. of 1.03.
Table 5.5 Economic Factors’ Importance
Page 142
127
Scale Descriptive Response Scale Economic factors
n S.D. Mean 5 4 3 2 1
42
42
42
42
1.12
0.88
0.93
1.03
3.62
2.57
3.62
2.74
28.6% (12)
0.0% (0)
19.0% (8)
2.4% (1)
26.2% (11)
19.0% (8)
35.7% (15)
26.2% (11)
23.8% (10)
26.2% (11)
33.3% (14)
23.8% (10)
21.4% (9)
47.6% (20)
11.9% (5)
38.1% (16)
0.0% (0)
7.1% (3)
0.0% (0)
9.5% (4)
Economic stability
Economic growth
Exchange rates
Local financial support
Note: 4 Scale: (1) “Very Unimportant”, (2) “Unimportant”, (3) “Neutral”, (4) “Important”, (5) “Very Important”
Figure 5.5 Economic Factors’ Importance
5.1.2.5 Infrastructure and Technological Factors’ Importance
Table 5.6 summarises the descriptive data for each location factor related to infrastructure
and technological factors, including the mean, standard deviations and number of participants
for each location factor. Figure 5.6 shows the average mean of each sub-location factor
compared to other location factors associated with infrastructure and technological factors.
The level of infrastructure (ports, roads, airports, etc.) was rated by 69.0% (29) of the
participants as being an important location factor with a mean of 4.31, s.d. and of 0.46.
Higher industrial concentration was rated by 57.1% (24) of the participants as being an
important factor with mean of 3.86, and s.d. of 0.64. The availability of a well-qualified
workforce was rated by 47.6% (20) of the participants as being an unimportant factor with a
mean of 2.64, and s.d. of 0.69. Access to reliable and cooperative suppliers was rated by
57.1% (24) of participants as being a very important factor with a mean of 4.33, and s.d. of
0.87. The availability of a factory site (land) was rated by 64.3% (27) of participants as being
Page 143
128
an important factor with a mean of 4.02, and s.d. of 0.60. The availability of raw materials
was rated by 69.0% (29) of the participants as being a very important factor with a mean of
4.69, and s.d. of 0.46. Geographical proximity to the markets was rated by 42.9% (18) of the
participants as being a neutral factor with a mean of 3.50, and s.d. of 0.91.
Table 5.6 Infrastructure and Technological Factors’ Importance
Scale Descriptive Response Scale Infrastructure and technological factors
n S.D. Mean 5 4 3 2 1
42
42
42
42
42
42
42
0.46
0.64
0.69
0.87
0.60
0.46
0.91
4.31
3.86
2.64
4.33
4.02
4.69
3.50
31.0% (13)
14.3% (6)
0.0% (0)
57.1% (24)
19.0% (8)
69.0% (29)
16.7% (7)
69.0% (29)
57.1% (24)
11.9% (5)
21.4% (9)
64.3% (27)
31.0% (13)
28.6% (12)
0.0% (0)
28.6% (12)
40.5% (17)
19.0% (8)
16.7% (7)
0.0% (0)
42.9% (18)
0.0% (0)
0.0% (0)
47.6% (20)
2.4% (1)
0.0% (0)
0.0% (0)
11.9% (5)
0.0% (0)
0.0% (0)
0.0% (0)
0.0% (0)
0.0% (0)
0.0% (0)
0.0% (0)
Level of infrastructure (ports, roads, airports etc.)
High industrial concentration (clustering)
Availability of well qualified workforce
Access to reliable and cooperative suppliers
Availability of factory site (land)
Availability of raw materials
Geographical proximity to the markets
Note: 5 Scale: (1) “Very Unimportant”, (2) “Unimportant”, (3) “Neutral”, (4) “Important”, (5) “Very Important”
Figure 5.6 Infrastructure and Technological Factors’ Importance
5.1.2.6 Political and Legal Factors’ Importance
Table 5.7 summarises the descriptive data for the importance of political and legal factors
including the mean, standard deviation and number of participants for each location factor.
Figure 5.7 shows the average rating for each location factor compared to other factors related
to the political and legal factors. Political stability was rated by 50.0% (21) of the participants
as an important factor with a mean of 4.45, and s.d. of 0.55. International trade agreements
Page 144
129
were rated by 42.9 % (18) of the participants as a neutral factor with a mean of 3.10, and s.d.
of 0.93. Tax reductions in the host country were rated by 50.0% (21) of the participants as
being important with mean of 3.90, and s.d. 0.84. Benign environmental legislation toward
FDI was rated by 52.4% (22) of the participants as being important with a mean of 4.38, and
s.d. of 0.58. Diplomatic ties with the host market were rated by 45.2% (19) of the participants
as a neutral factor with a mean of 3.33, and s.d. of 0.72. The legal and regulatory system was
rated by 35.7% (15) of the participants as a neutral factor with a mean of 3.05, and s.d. of
0.93.
Table 5.7 Political and Legal Factors’ Importance
Scale Descriptive Response Scale Political and legal factors
n S.D. Mean 5 4 3 2 1
42
42
42
42
42
42
0.55
0.93
0.84
0.58
0.72
0.93
4.45
3.10
3.90
4.38
3.33
3.05
47.6% (20)
9.5% (4)
23.8% (10)
42.9% (18)
2.4% (1)
7.1% (3)
50.0% (21)
19.0% (8)
50.0% (21)
52.4% (22)
40.5% (17)
23.8% (10)
2.4% (1)
42.9% (18)
19.0% (8)
4.8% (2)
45.2% (19)
35.7% (15)
0.0% (0)
28.6% (12)
7.1% (3)
0.0% (0)
11.9% (5)
33.3% (14)
0.0% (0)
0.0% (0)
0.0% (0)
0.0% (0)
0.0% (0)
0.0% (0)
Political stability
International trade agreements
Tax reductions in the host country
Benign environmental legislation towards FDI
Diplomatic ties with host country
Legal and regulatory system
Note: 6 Scale: (1) “Very Unimportant”, (2) “Unimportant”, (3) “Neutral”, (4) “Important”, (5) “Very Important”
Figure 5.7 Political and Legal Factors’ Importance
5.1.2.7 Social and Cultural Factors’ Importance
Table 5.8 summarises the descriptive data for the location factors in terms of social and
cultural factors including the mean, standard deviations and number of participants for each
location factor. Figure 5.8 shows the average mean for each location factor compared to other
factors associated with social and cultural factors. Cultural distance was rated by 33.3% (14)
Page 145
130
of the participants as being an unimportant factor with a mean of 2.21, and s.d. of 0.94. The
attitude of the local community towards the firm was rated by 33.3% (14) of the participants
as a neutral factor with a mean of 2.43, and s.d. of 1.03. Local employees‘ loyalty to the firm
was rated by 38.1% (16) of the participants as being an unimportant factor with a mean score
of 2.38, and s.d. of 1.03. Language was rated by 47.6% (20) of the participants as being a
very unimportant factor with a mean of 1.83, and s.d. of 0.98.
Table 5.8 Social and Cultural Factors’ Importance
Scale Descriptive Response Scale Social & Cultural factors
n S.D. Mean 5 4 3 2 1
42
42
42
42
0.94
1.03
1.03
0.98
2.12
2.43
2.38
1.83
0.0% (0)
0.0% (0)
0.0% (0)
2.4% (1)
7.1% (3)
16.7% (7)
19.0% (8)
2.4% (1)
28.6% (12)
33.3% (14)
21.4% (9)
19.0% (8)
33.3% (14)
26.2% (11)
38.1% (16)
28.6% (12)
31.0% (13)
23.8% (10)
21.4% (9)
47.6% (20)
Cultural distance
Attitude of the local community toward the firm
Local employees loyalty to the firm
Language
Note: 7 Scale: (1) “Very Unimportant”, (2) “Unimportant”, (3) “Neutral”, (4) “Important”, (5) “Very Important”
Figure 5.8 Social and Cultural Factors’ Importance
Page 146
131
5.1.3 Location Factors’ Competitiveness
The descriptive data for the location factors‘ competitiveness are summarised in Table 5.9,
which includes the main location factors and the sub-factors. the table also shows the
responses scale is represented in numbers and percentages for each location factor in the
questionnaire, and the mean, standard deviation and the number of response for each location
factor is also presented. Figure 5.9 shows the distribution of the sub-location factors based on
the mean for each location factor compared to other factors.
Six major factors were used to constitute the competitiveness of the location factors. They are
cost factors, market factors, factors, infrastructure and technological factors, political and
legal factors and social and cultural factors. Six factors were used to comprise of the cost
factors. These are factory site costs (land cost), labour costs, transportation/logistic costs, cost
of raw materials, return on investment and energy costs. Four factors were used to constitute
the market factors. These are the size of the host markets, market growth in the host country,
the level of competition in the host market and market familiarity. Four factors were used to
comprise of the economic factors. These are economic stability, economic growth, exchange
rates, and local financial support. Seven factors were used to comprise of the infrastructure
and technological factor. These are the levels of infrastructure (ports, roads, airports, etc.),
high industrial concentration (clustering), the availability of a well-qualified workforce,
access to reliable and cooperative suppliers, the availability of factory sites (land), the
availability of raw materials and geographical proximity to the markets. Six factors were used
to constitute the political and legal factors. These are political stability, international trade
agreements, tax reductions in the host country, benign environmental legislation towards FDI,
diplomatic ties with the host country and legal and regulatory systems. Four factors were
used to comprise of the social and cultural factors. These are cultural distance, the attitude of
the local community toward the firm, local employees‘ loyalty to the firm and language. In
the next section, we discuss in detail each major factor and its sub-factors.
Page 147
132
Table 5.9 Saudi Arabia’s Competitiveness Compared to Other Locations in the Petrochemicals Industry (Mean)
Note :Scale: (1) “Much Worse,” (2) “Worse,” (3) “Same”, (4) “Better,” (5) “Much Better”
Scale Descriptive Response Scale Major and Sub-Location Factors
n S.D. Mean 5 4 3 2 1
42
42
42
42
42
42
0.38
1.08
1.01
0.96
0.50
0.63
0.29
3.92
3.83
2.43
3.48
4.43
4.45
4.90
33.3% (14)
0.0% (0)
14.3% (6)
42.9% (18)
50.0% (21)
90.5% (38)
33.3% (14)
19.0% (8)
38.1% (16)
57.1% (24)
47.6% (20)
9.5% (4)
16.7% (7)
23.8% (10)
28.6% (12)
0.0% (0)
0.0% (0)
0.0% (0)
16.7% (7)
38.1% (16)
19.0% (8)
0.0% (0)
2.4% (1)
0.0% (0)
0.0% (0)
19.0% (8)
0.0% (0)
0.0% (0)
0.0% (0)
0.0% (0)
A. Cost factors
1. Factory site costs (Land cost)
2. Labour costs
3. Transportation/ logistics costs
4. Cost of raw materials
5. Return on investment
6. Energy costs
42
42
42
42
0.53
0.85
0.82
0.82
0.82
2.55
1.83
1.90
2.83
3.64
2.4% (1)
0.0% (0)
0.0% (0)
14.3% (6)
2.4% (1)
7.1% (3)
23.8% (10)
42.9% (18)
7.1% (3)
7.1% (3)
38.1% (16)
35.7% (15)
52.4% (22)
54.8% (23)
35.7% (15)
7.1% (3)
35.7% (15)
31.0% (13)
2.4% (1)
0.0% (0)
B. Market factors
7. Size of host markets
8. Market growth in the host country
9. Level of competition in the host market
10. Market familiarity
42
42
42
42
0.55
0.72
0.85
0.68
0.94
3.70
3.64
3.83
4.21
3.12
11.9% (5)
19.0% (8)
33.3% (14)
2.4% (1)
42.9% (18)
54.8% (23)
57.1% (24)
38.1% (16)
42.9% (18)
16.7% (7)
7.1% (3)
33.3% (14)
2.4% (1)
9.5% (4)
2.4% (1)
21.4% (9)
0.0% (0)
0.0% (0)
0.0% (0)
4.8% (2)
C. Economic factors
11. Economic stability
12. Economic growth
13. Exchange rates
14. Local financial support
42
42
42
42
42
42
42
0.38
0.78
0.61
1.02
0.57
0.68
0.39
0.87
3.86
3.67
4.24
2.07
4.33
3.98
4.81
3.90
11.9% (5)
31.0% (13)
0.0% (0)
38.1% (16)
19.0% (8)
81.0% (34)
28.6% (12)
50.0% (21)
64.3% (27)
14.3% (6)
57.1% (24)
61.9% (26)
19.0% (8)
38.1% (16)
31.0% (13)
2.4% (1)
11.9% (5)
4.8% (2)
16.7% (7)
0.0% (0)
28.6% (12)
7.1% (3)
2.4% (1)
40.5% (17)
0.0% (0)
2.4% (1)
0.0% (0)
4.8% (2)
0.0% (0)
0.0% (0)
33.3% (14)
0.0% (0)
0.0% (0)
0.0% (0)
0.0% (0)
D. Infrastructure and technological factors
15. Level of infrastructure (ports, roads, airports etc.)
16. High industrial concentration (clustering)
17. Availability of well qualified workforce
18. Access to reliable and cooperative suppliers
19. Availability of factory sites (land)
20. Availability of raw materials
21. Geographical proximity to the markets
42
42
42
42
42
42
0.52
0.68
1.01
1.13
0.81
0.71
1.04
3.43
4.21
3.19
3.07
3.79
3.79
2.52
35.7% (15)
16.7% (7)
11.9% (5)
19.0% (8)
16.7% (7)
4.8% (2)
50.0% (21)
11.9% (5)
23.8% (10)
45.2% (19)
45.2% (19)
9.5% (4)
14.3% (6)
45.2% (19)
31.0% (13)
31.0% (13)
38.1% (16)
35.7% (15)
0.0% (0)
26.2% (11)
26.2% (11)
4.8% (2)
0.0% (0)
33.3% (14)
0.0% (0)
0.0% (0)
7.1% (3)
0.0% (0)
0.0% (0)
16.7% (7)
E. Political and legal factors
22. Political stability
23. International trade agreements
24. Tax reductions in the host country
25. Benign environmental legislation towards FDI
26. Diplomatic ties with the host country
27. Legal and regulatory system
42
42
42
42
0.54
1.02
0.97
0.72
0.87
2.80
2.07
2.86
3.36
2.90
0.0% (0)
4.8% (2)
4.8% (2)
4.8% (2)
11.9% (5)
16.7% (7)
35.7% (15)
16.7% (7)
19.0% (8)
47.6% (20)
50.0% (21)
45.2% (19)
33.3% (14)
21.4% (9)
9.5% (4)
31.0% (13)
35.7% (15)
9.5% (4)
0.0% (0)
2.4% (1)
F. Social and cultural factors
28. Cultural distance
29. Attitude of the local community toward the firm
30. Local employees loyalty to the firm
31. Language
Page 148
133
Figure 5.9 Competitiveness of Location Factors
5.1.3.1 Major Factors’ Competitiveness
Table 5.10 summarises the competitiveness of the major location factors, including the mean
and standard deviation for each factor. Figure 5.10 shows the competitiveness of each major
factor‘s mean relative to other location factors. The major factors were calculated by the total
average mean for the sub-factors on each major location factor. Cost factors have a mean of
3.92, and s.d. of 0.38; market factors have a mean of 2.55, and s.d. of 0.53; economic factors
have a mean of 3.70, and s.d. of 0.55; infrastructure and technological factors have a mean of
3.86, and s.d. of 0.38; political and legal factors have a mean of 3.43, and s.d. of 0.52; finally,
social and cultural factors have a mean score of 2.80, and s.d. of 0.54.
Page 149
134
Table 5.10 Major Factors’ Competitiveness
Major Factors and Competitiveness Mean S.D.
Cost factors
Market factors
Economic factors
Infrastructure and technological factors
Political and legal factors
Social and Cultural factors
3.92
2.55
3.70
3.86
3.43
2.80
0.38
0.53
0.55
0.38
0.52
0.54
Figure 5.10 Major Factors’ Competitiveness
5.1.3.2 Cost Factors’ Competitiveness
Table 5.11 summarises the descriptive data for the competitiveness of the cost factors
including the mean, standard deviation and number of responses for each sub-location factor.
Figure 5.11 shows the average mean for each location factor compared to other factors in
terms of the cost factors. Factory site costs (land costs) were rated equally by 33.3% (14) of
the participants as being better and much better compared to other locations with mean score
of 3.83, and s.d. of 1.08. Labour costs were rated by 38.1% (16) of the participants as a worse
factor compared to other locations with mean of 2.43, and s.d. of 1.01. Transportation and
logistics costs were rated by 38.1% (16) of the respondents as a better factor compared to
other locations with mean of 3.48, and s.d of 0.96. The cost of raw materials were rated by
57.1% (24) as a better location factor compared to other location with mean of 4.43, and s.d.
of 0.50. Return on investment was rated by 50.0% (21) of the participants as a much better
Page 150
135
location factor compared to other locations with mean of 4.45, and s.d. of 0.63. Energy costs
were rated by 90.5% (38) of the participants as a much better location factor compared to
other locations with mean of 4.90, and s.d. of 0.29.
Table 5.11 Cost Factors’ Competitiveness
Scale Descriptive Response Scale Cost Factors
n S.D. Mean 5 4 3 2 1
42
42
42 42
42
42
1.08
1.01
0.96
0.50
0.63
0.29
3.83
2.43
3.48
4.43
4.45
4.90
33.3% (14)
0.0% (0)
14.3% (6) 42.9% (18)
50.0% (21)
90.5% (38)
33.3% (14)
19.0% (8)
38.1% (16)
57.1% (24)
47.6% (20)
9.5% (4)
16.7% (7)
23.8% (10)
28.6% (12) 0.0% (0)
0.0% (0)
0.0% (0)
16.7% (7)
38.1% (16)
19.0% (8) 0.0% (0)
2.4% (1)
0.0% (0)
0.0% (0)
19.0% (8)
0.0% (0) 0.0% (0)
0.0% (0)
0.0% (0)
Factory site costs (Land cost)
Labour costs
Transportation/logistic costs Cost of raw materials
Return on investment
Energy costs
Note: 8 Scale: (1) “Much Worse”, (2) “Worse”, (3) “Same”, (4) “Better”, (5) “Much Better”
Figure 5.11 Cost Factors’ Competitiveness
5.1.3.3 Market Factors’ Competitiveness
Table 5.12 summarises the descriptive data for the market factors‘ competitiveness including
the mean, standard deviation, and number of responses for each sub-location factor included
under market factors. Figure 5.12 shows the mean score of competitiveness for each location
factor under market factors compared to other location factors. The size of the host market
was rated by 52.4% (22) of the participants as a worse location factor compared to other
locations with a mean of 1.83, and s.d. of 0.85. Market growth in the host market was rated
by 54.8% (23) of the participants as a worse location factor compared to other locations with
Page 151
136
mean of 1.90, and s.d. of 0.82. The level of competition in the host market was rated by
38.1% (16) of the participants as the same compared to other locations with a mean of 2.83,
and s.d. of 0.82. Market familiarity was rated by 42.9% (18) of the participants as a better
location factor compared to other locations with a mean score of 3.64, and s.d. of 0.82.
Table 5.12 Market Factors’ Competitiveness
Scale Descriptive Response Scale Market factors
n S.D. Mean 5 4 3 2 1
42
42 42
42
0.85
0.82
0.82
0.82
1.83
1.90
2.83
3.64
2.4% (1)
0.0% (0) 0.0% (0)
14.3% (6)
2.4% (1)
7.1% (3) 23.8% (10)
42.9% (18)
7.1% (3)
7.1% (3)
38.1% (16)
35.7% (15)
52.4% (22)
54.8% (23)
35.7% (15)
7.1% (3)
35.7% (15)
31.0% (13) 2.4% (1)
0.0% (0)
Size of host market
Market growth in the host country Level of competition in the host market
Market familiarity
Note: 9 Scale: (1) “Much Worse”, (2) “Worse”, (3) “Same”, (4) “Better”, (5) “Much Better”
Figure 5.12 Market Factors’ Competitiveness
5.1.3.4 Economic Factors’ Competitiveness
Table 5.13 summarises the descriptive data for the economic factors‘ competitiveness for
each economic location factor including the mean, standard deviation and number of
participants. Figure 5.13 shows the average mean of each location factor compared to other
location factors in terms of economic factors. Economic stability was rated equally by 42.9%
(18) of the participants as the same and as a better location factor compared to other locations
Page 152
137
with mean of 3.64, and s.d. of 0.72. Economic growth was rated by 54.8% (23) of the
participants as a better location factor compared to other locations with mean of 3.83, and s.d.
of 0.85. Exchange rates were rated by 57.1% (24) of participants as a better location factor
compared to other locations with mean of 4.21, and s.d. of 0.68. Local financial support was
rated by 38.1% (16) as a better location factor compared to other locations with mean of 3.12,
and s.d. of 0.94.
Table 5.13 Economic Factors’ Competitiveness
Scale Descriptive Response Scale Economic factors
n S.D. Mean 5 4 3 2 1
42
42 42
42
0.72
0.85
0.68
0.94
3.64
3.83
4.21
3.12
11.9% (5)
19.0% (8) 33.3% (14)
2.4% (1)
42.9% (18)
54.8% (23)
57.1% (24)
38.1% (16)
42.9% (18)
16.7% (7) 7.1% (3)
33.3% (14)
2.4% (1)
9.5% (4) 2.4% (1)
21.4% (9)
0.0% (0)
0.0% (0) 0.0% (0)
4.8% (2)
Economic stability
Economic growth Exchange rates
Local financial support
Note: 10 Scale: (1) “Much Worse”, (2) “Worse”, (3) “Same”, (4) “Better”, (5) “Much Better”
Figure 5.13 Economic Factors’ Competitiveness
5.1.3.5 Infrastructure and Technological Factors’ Competitiveness
Table 5.14 summarises the descriptive data for the competitiveness of each location factor in
terms of infrastructure and technological factors, including the mean, standard deviations and
number of participants. Figure 5.14 shows the average response rate of competitiveness for
each location factor compared to other locations in terms of infrastructure and technological
factors. Levels of infrastructure (ports, roads, airports, etc.) were rated by 50.0% (21) of
Page 153
138
participants as being better location factor compared to other locations with mean of 3.76, s.d.
and 0.78. Higher industrial concentration was rated by 64.3% (27) of the participants as being
a better location factor compared to other locations with mean of 4.24, s.d. and of of 0.61.
The availability of a well-qualified workforce was rated by 40.5% (17) of the participants as
being a worse location factor compared to other locations with a mean of 2.07, and s.d. of
1.02. Access to reliable and cooperative suppliers was rated by 57.1% (24) of the participants
as being a better location factor compared to other locations with mean of 4.33, and s.d. of
0.57. The availability of a factory site (land) was rated by 61.9% (26) of the participants as
being a better location factor compared to other locations with mean of 3.98, and s.d. of 0.68.
The availability of raw materials was rated by 81.0% (34) of the participants as being a much
better location factor compared to other locations with mean of 4.81, and s.d. of 0.39.
Geographical proximity to the markets was rated by 38.1% (16) of the participants as being a
better location factor compared to other locations with mean of 3.90, and s.d. of 0.87.
Table 5.14 Infrastructure and Technological Factors’ Competitiveness
Scale Descriptive Response Scale Infrastructure and technological factors
n S.D. Mean 5 4 3 2 1
42
42
42
42
42
42
42
0.78
0.61
1.02
0.57
0.68
0.39
0.87
3.67
4.24
2.07
4.33
3.98
4.81
3.90
11.9% (5)
31.0% (13)
0.0% (0)
38.1% (16)
19.0% (8)
81.0% (34)
28.6% (12)
50.0% (21)
64.3% (27)
14.3% (6)
57.1% (24)
61.9% (26)
19.0% (8)
38.1% (16)
31.0% (13)
2.4% (1)
11.9% (5)
4.8% (2)
16.7% (7)
0.0% (0)
28.6% (12)
7.1% (3)
2.4% (1)
40.5% (17)
0.0% (0)
2.4% (1)
0.0% (0)
4.8% (2)
0.0% (0)
0.0% (0)
33.3% (14)
0.0% (0)
0.0% (0)
0.0% (0)
0.0% (0)
Level of infrastructure (ports, roads, airports, etc.)
High industrial concentration (clustering)
Availability of well qualified work force
Access to reliable and cooperative suppliers
Availability of factory sites (land)
Availability of raw materials
Geographical proximity to the markets
Note: 11 Scale: (1) “Much Worse”, (2) “Worse”, (3) “Same”, (4) “Better”, (5) “Much Better”
Figure 5.14 Infrastructure and Technological Factors’ Competitiveness
Page 154
139
5.1.3.6 Political and Legal Factors’ Competitiveness
Table 5.15 summarises the descriptive data for the location factors‘ competitiveness in terms
of political and legal factors, including the mean, standard deviation and number of
participants for each location factor. Figure 5.15 shows the mean for each location factor
compared to other factors related to the political and legal factors. Political stability was rated
by 50.0% (21) of the participants as a better location factor compared to other locations with
mean of 4.21, and s.d. of 0.68. International trade agreements were rated by 45.2% (19) of
participants as the same location factor compared to other locations with mean of 3.19, and
s.d. 1.01. Tax reduction in the host market was rated by 31.0% (13) of the participants as the
same with mean of 3.07, and s.d. of 1.13. Benign environmental legislation toward FDI was
rated by 45.2% (19) of the participants as a better location factor compared to other locations
with mean of 3.79, and s.d. of 0.81. Diplomatic ties with the host market were rated by 45.2%
(19) of the participants as being a better location factor compared to other locations with
mean of 3.79, and s.d. 0.71. Legal and regulatory systems were rated by 35.7% (15) of the
participants as the same locations compared to other location factors with mean of 2.52, and
s.d. of 1.04.
Table 5.15 Political and Legal Factors’ Competitiveness
Scale Descriptive Response Scale Political and legal factors
n S.D. Mean 5 4 3 2 1
42
42
42
42
42
42
0.68
1.01
1.13
0.81
0.71
1.04
4.21
3.19
3.07
3.79
3.79
2.52
35.7% (15)
16.7% (7)
11.9% (5)
19.0% (8)
16.7% (7)
4.8% (2)
50.0% (21)
11.9% (5)
23.8% (10)
45.2% (19)
45.2% (19)
9.5% (4)
14.3% (6)
45.2% (19)
31.0% (13)
31.0% (13)
38.1% (16)
35.7% (15)
0.0% (0)
26.2% (11)
26.2% (11)
4.8% (2)
0.0% (0)
33.3% (14)
0.0% (0)
0.0% (0)
7.1% (3)
0.0% (0)
0.0% (0)
16.7% (7)
Political stability
International trade agreements
Tax reductions in the host country
Benign environmental legislation towards FDI
Diplomatic ties with the host country
Legal and regulatory system
Note: 12 Scale: (1) “Much Worse”, (2) “Worse”, (3) “Same”, (4) “Better”, (5) “Much Better”
Page 155
140
Figure 5.15 Political and Legal Factors’ Competitiveness
5.1.3.7 Social and Cultural Factors’ Competitiveness
Table 5.16 summarises the descriptive data for the location factors‘ competitiveness in terms
of the social and cultural factors, including the mean, standard deviation and number of
participants for each location factor. Figure 5.16 shows the average mean for each location
factor compared to other factors related to social and cultural factors. Cultural distance was
rated by 35.7% (15) of the participants as a much worse location factor compared to other
locations with mean of 2.07, and s.d. of 1.02. The attitude of the local community toward the
firm was rated by 47.6% (20) of the participants as the same compared to other locations with
mean of 2.86, and s.d. of 0.97. Local employees‘ loyalty to the firm was rated by 50.0% (21)
of the participants as the same compared to other locations with mean of 3.36, and s.d. of
0.72. Language was rated by 45.2% (19) of the participants as the same compared to other
locations with mean of 2.90, and s.d. of 0.87.
Table 5.16 Social and Cultural Factors’ Competitiveness
Scale Descriptive Response Scale Social & Cultural factors
n S.D. Mean 5 4 3 2 1
42
42
42
42
1.02
0.97
0.72
0.87
2.07
2.86
3.36
2.90
0.0% (0)
4.8% (2)
4.8% (2)
4.8% (2)
11.9% (5)
16.7% (7)
35.7% (15)
16.7% (7)
19.0% (8)
47.6% (20)
50.0% (21)
45.2% (19)
33.3% (14)
21.4% (9)
9.5% (4)
31.0% (13)
35.7% (15)
9.5% (4)
0.0% (0)
2.4% (1)
Cultural distance
Attitude of the local community toward the firm
Local employees loyalty to the firm
Language
Note: 13 Scale: (1) “Much Worse”, (2) “Worse”, (3) “Same”, (4) “Better”, (5) “Much Better”
Page 156
141
Figure 5.16 Social and Cultural Factors’ Competitiveness
Page 157
142
5.2 Location Factors’ Ranking
5.2.1 Introduction
In this section, the thesis shows the relative importance and competitiveness of location
factors compared to other factors, and how the location factors are rated by FDI flows into
the Saudi petrochemicals industry. In the first part of this section, we provide details of the
relative importance of all factors, including major factors and sub-factors and the relative
importance of sub-factors for each major factor. In the second part of this section, we show
the competitiveness of Saudi location factors compared to other locations in the
petrochemicals industry, including the competitiveness of the major factors and the sub-
factors and the competitiveness of the sub-factors under each major factor.
5.2.2 Location Factors’ Importance Ranking
Table 5.17 summarises the relative importance of the major factors and sub-factors for the
petrochemicals FDI in terms of their decision to locate their business in Saudi Arabia. In the
first part of the questionnaire, the participants were asked to rate the relative importance of
the sub-location factors for their decision to locate their business in Saudi Arabia. After
calculating the average rating of the sub-factors, the ranking of the major location factors was
recorded. We discuss these factors in detail in the following section.
Page 158
143
Table 5.17 The Relative Importance of Location Factors in the Petrochemicals Industry
S.D. Mean Rank Major and Sub-Location Factors
0.46
0.96
1.08
0.77
0.49
0.49
0.32
4.04
3.29
2.62
4.12
4.60
4.74
4.88
1
17
23
9
4
2
1
A. Cost factors
1. Factory site costs (Land cost)
2. Labour costs
3. Transportation/logistic costs
4. Cost of raw materials
5. Return on investment
6. Energy costs
0.69
0.84
1.06
0.70
0.99
2.44
2.14
2.19
2.55
2.88
5
29
28
25
20
B. Market factors
7. Size of host markets
8. Market growth in the host country
9. Level of competition in the host market
10. Market familiarity
0.76
1.12
0.88
0.93
1.03
3.14
3.62
2.57
3.62
2.74
4
13
24
14
21
C. Economic factors
11. Economic stability
12. Economic growth
13. Exchange rates
14. Local financial support
0.36
0.46
0.64
0.69
0.87
0.60
0.46
0.91
3.91
4.31
3.86
2.64
4.33
4.02
4.69
3.50
2
8
12
22
7
10
3
15
D. Infrastructure and technological factors
15. Level of infrastructure (ports, roads, airports, etc.)
16. High industrial concentration (clustering)
17. Availability of well qualified workforce
18. Access to reliable and cooperative suppliers
19. Availability of factory sites (land)
20. Availability of raw materials
21. Geographical proximity to the markets
0.42
0.55
0.93
0.84
0.58
0.72
0.93
3.70
4.45
3.10
3.90
4.38
3.33
3.05
3
5
18
11
6
16
19
E. Political and legal factors
22. Political stability
23. International trade agreements
24. Tax reductions in the host country
25. Benign environmental legislation towards FDI
26. Diplomatic ties with the host country
27. Legal and regulatory system
0.66
0.94
1.03
1.03
0.98
2.19
2.12
2.43
2.38
1.83
6
30
26
27
31
F. Social and Cultural factors
28. Cultural distance
29. Attitude of the local community towards the firm
30. Local employees‘ loyalty to the firm
31. Language
Page 159
144
Table 5.18 summarises the relative importance of all location factors relative to other factors
including the mean and standard deviations for each factor. Figure 5.17 shows the relative
importance of each location factor compared to all other factors, based on the mean for each
factor and listed in decreasing order of importance. All sub-factors identified from the list of
each of the major factors are ranked according to their average scores in Table 5.18. From the
analysis of the sub-factors, an average rating above 3.0 was considered to indicate an
important location factor in the petrochemicals industry. The importance ranking of each
location factor identified according to their relative importance with regard to FDI location
decisions among other location factors are listed below in decreasing order of importance:
1. Energy costs
2. Return on investment
3. Availability of raw materials
4. Cost of raw materials
5. Political stability
6. Benign environmental legislation for FDI
7. Access to reliable and cooperative suppliers
8. Level of infrastructure
9. Transportation/logistic costs
10. Availability of factory sites (land)
11. Tax reductions in the host country
12. High industrial concentration (clustering)
13. Economic stability
14. Exchange rates
15. Geographical proximity
16. Diplomatic ties with the host country
17. Production site costs (land costs)
18. International trade agreements
19. Legal and regulatory system
The least important location factors among other location factors based on the average means
of importance are listed below in decreasing order of importance as:
20. Market familiarity
21. Local financial support
22. Availability of well-qualified workforce
Page 160
145
23. Labour costs
24. Economic growth
25. Level of competition in the host market
26. Attitude of the local community towards the firm
27. Local employees‘ loyalty to the firm
28. Market growth in the host country
29. Size of the host market
30. Cultural distance
31. Language
Page 161
146
Table 5.18 Location Factors’ Importance Ranking
Location Factors Ranking Mean S.D.
1. Energy costs 4.88 0.32
2. Return on investment 4.74 0.49
3. Availability of raw materials 4.69 0.46
4. Cost of raw materials 4.60 0.49
5. Political stability 4.45 0.55
6. Benign environmental legislation for FDI 4.38 0.58
7. Access to reliable and cooperative suppliers 4.33 0.87
8. Level of infrastructure 4.31 0.46
9. Transportation/logistic costs 4.12 0.77
10. Availability of factory sites (land) 4.02 0.60
11. Tax reductions in the host country 3.90 0.84
12. High industrial concentration (clustering) 3.86 0.64
13. Economic stability 3.62 1.12
14. Exchange rates 3.62 0.93
15. Geographical proximity 3.50 0.91
16. Diplomatic ties with the host country 3.33 0.72
17. Production site costs (land costs) 3.29 0.96
18. International trade agreements 3.10 0.93
19. Legal and regulatory system 3.05 0.93
20. Market familiarity 2.88 0.99
21. Local financial support 2.74 1.03
22. Availability of well qualified workforce 2.64 0.69
23. Labour costs 2.62 1.08
24. Economic growth 2.57 0.88
25. Level of competition in the host market 2.55 0.70
26. Attitude of the local community towards the firm 2.43 1.03
27. Local employees‘ loyalty to the firm 2.38 1.03
28. Market growth in the host country 2.19 1.06
29. Large size of host market 2.14 0.84
30. Cultural distance 2.12 0.94
31. Language 1.83 0.98
Page 162
147
Figure 5.17 Location Factors’ Importance Ranking
5.2.2.1 Major Factors’ Importance Ranking
Table 5.19 summarises the relative importance of each major location factor compared to all
other major factors based on the average mean in terms of their importance. Figure 5.18
shows the relative importance of each major factor compared to other major factors, based on
their average mean of importance and listed in decreasing order of importance. After
calculating the average rating of the sub-factors associated with each major factor, we have
the average mean for each major factor. From the analysis of all the major location factors, an
average rating above 3.0 was considered to indicate important location factors in the
petrochemicals industry. The relative importance of the major factors are listed below in
decreasing order of their importance as:
1. Cost factors
2. Infrastructure and technological factors
3. Political and legal factors
4. Economic factors
5. Market factors
Page 163
148
6. Social and cultural factors
Cost factors, infrastructure and technological factors, political and legal factors and economic
factors are rated relatively high among other major location factors, which indicate that they
are considered to be important location factors for FDI when choosing their location in the
Saudi petrochemicals industry. Market factors as well as the social and cultural factors are
rated relatively low among other major location factors, which indicate that they are
considered to be relatively unimportant location factors for FDI location decisions in the
Saudi petrochemicals industry.
Table 5.19 Major Factors’ Importance Ranking
Major Factors Importance Ranking Rank Mean S.D.
Cost factors 1 4.04 0.46
Infrastructure and technological factors 2 3.91 0.36
Political and legal factors 3 3.70 0.42
Economic factors 4 3.14 0.76
Market factors 5 2.44 0.69
Social and Cultural factors 6 2.19 0.66
Figure 5.18 Major Factors’ Importance Ranking
Page 164
149
5.2.2.2 Cost Factors’ Importance Ranking
Table 5.20 summarises the importance of the cost factors relative to each other, including the
mean and standard deviation for each factor. Figure 5.19 shows the ranking of the cost factors
based on the average mean of each factor. The relative importance of the cost factors are
listed in decreasing order of importance as:
1. Energy costs
2. Return on investment
3. Cost of raw materials
4. Transportation/logistic costs
5. Production site costs (land costs)
6. Labour costs
Most of the cost factors are considered as important factors with an average mean of greater
than 3.0 including energy costs, return on investment, cost of raw materials,
transportation/logistic costs and production site costs (land costs). However, labour cost
received a mean score of less than 3.0, indicating that it is considered to be a relatively
unimportant factor among the cost factors for the petrochemicals industry.
Table 5.20 Priority of Cost Factors
Cost Factors Rank Mean S.D.
Energy costs 1 4.88 0.32
Return on investment 2 4.74 0.49
Low cost of raw materials 3 4.60 0.49
Transportation/ logistic cost 4 4.12 0.77
Production site cost (land cost) 5 3.29 0.96
Labour costs 6 2.62 1.08
Page 165
150
Figure 5.19 Cost Factors’ Importance Ranking
5.2.2.3 Market Factors’ Importance Ranking
Table 5.21 summarises the relative importance of the market location factors relative to other
market factors, including the mean and standard deviation for each factor. Figure 5.20 shows
the relative importance of the ranking for each market factor, based on the average mean in
terms of their importance. The relative importance of the market factors are listed below, in
decreasing order of importance as:
1. Market familiarity
2. Level of competition in the host market
3. Market growth in the host country
4. Size of the host market
All market factors received an average mean scores of less than 3.0, indicating that they are
considered to be relatively unimportant factors in terms of location decisions in the Saudi
petrochemicals industry.
Table 5.21 Priority of Market Factors
Market Factors Rank Mean S.D.
Market familiarity 1 2.88 0.99
Level of competition in the host market 2 2.55 0.70
Market growth in the host country 3 2.19 1.06
Size of the host market 4 2.14 0.84
Page 166
151
Figure 5.20 Market Factors’ Importance Ranking
5.2.2.4 Economic Factors’ Importance Ranking
Table 5.22 summarises the relative importance of economic factors, including the mean and
standard deviation for each economic factor. Figure 5.21 shows the relative importance of
each economic factor, based on the average mean in terms of importance. The relative
importance of economic factors are listed below in decreasing order of importance:
1. Economic stability
2. Exchange rates
3. Local financial support
4. Economic growth
Economic stability and exchange rates are considered as important factors in the location
decision in the Saudi petrochemicals industry with a mean of more than 3.0. Financial
support and economic growth received a mean of less than 3.0, which suggests that they are
relatively unimportant factors in terms of the location for the FDI in the petrochemicals
industry.
Page 167
152
Table 5.22 Priority of Economic Factors
Economic Factors Rank Mean S.D.
Economic stability 1 3.62 1.12
Exchange rates 2 3.62 0.93
Local financial support 3 2.74 1.03
Economic growth 4 2.57 0.88
Figure 5.21 Economic Factors’ Importance Ranking
5.2.2.5 Infrastructure and Technological Factors’ Ranking
Table 5.23 summarises the relative importance of infrastructure and technological factors
based on the mean of importance including the mean and standard deviation for each factor.
Figure 5.22 shows the relative importance of each infrastructure and technological factors
based on the average response rate in terms of their importance and listed in decreasing order
of importance. The relative importance of infrastructure and technological factors are listed
below in decreasing order of importance as:
1. Availability of raw materials
2. Access to reliable and cooperative suppliers
3. Level of infrastructure
4. Availability of factory sites (land)
5. High industrial concentration (clustering)
6. Geographical proximity
7. Availability of a well-qualified workforce
Page 168
153
Most of the infrastructure and technological factors including the availability of raw
materials, access to reliable and cooperative suppliers, the level of infrastructure, the
availability of factory sites (land), high industrial concentration (clustering) and geographical
proximity are considered to be important factors in terms of location decisions in the
petrochemicals industry, in that each received a mean of more than 3.0. However, the
availability of a well-qualified workforce has a mean score of less than 3.0 and can therefore
be considered to be a relatively unimportant factor in terms of location decisions in the Saudi
petrochemicals industry.
Table 5.23 Priority of Infrastructure and Technological Factors
Infrastructure and technological factors Rank Mean S.D.
Availability of raw materials 1 4.69 0.46
Access to reliable and cooperative suppliers 2 4.33 0.87
Level of infrastructure 3 4.31 0.46
Availability of factory sites (land) 4 4.02 0.60
High industrial concentration (clustering) 5 3.86 0.64
Geographical proximity 6 3.50 0.91
Availability of a well qualified workforce 7 2.64 0.69
Figure 5.22 Infrastructure and Technological Factors’ Importance Ranking
Page 169
154
5.2.2.6 Political and Legal Factors’ Importance Ranking
Table 5.24 summarises the relative importance of political and legal factors based on the their
average response rate of importance, including the mean and standard deviation for each
factor. Figure 5.23 shows the relative importance of the political and legal factors based on
the average mean of importance and listed in decreasing order of importance. The relative
importance of political and legal factors are listed below in decreasing order of importance
as:
1. Political stability
2. Benign environmental legislation for FDI
3. Tax reductions in the host country
4. Diplomatic ties with the host country
5. International trade agreements
6. Legal and regulatory system
All of the political and legal factors including political stability, benign environmental
legislation for FDI, tax reductions in the host country, diplomatic ties with the host country,
international trade agreements, and the legal and regulatory systems are rated as over 3.0 and
considered to be important location factors in the Saudi petrochemicals industry.
Table 5.24 Priority of Political and Legal Factors
Political and legal factors Rank Mean S.D.
Political stability 1 4.45 0.55
Benign environmental legislation for FDI 2 4.38 0.58
Tax reductions in the host country 3 3.90 0.84
Diplomatic ties with the host country 4 3.33 0.72
International trade agreements 5 3.10 0.93
Legal and regulatory system 6 3.05 0.93
Page 170
155
Figure 5.23 Political and Legal Factors’ Importance Ranking
5.2.2.7 Social and Cultural Factors’ Importance Ranking
Table 5.25 summarises the relative importance of the social and cultural factors based on the
average response rate of importance, including the mean and standard deviations. Figure 5.24
shows the relative importance of the social and cultural factors, based on their mean of
importance, and they are listed in decreasing order of importance. The relative importance of
the social and cultural factors are listed below in decreasing order of importance as:
1. Attitude of the local community toward the firm
2. Local employees‘ loyalty to the firm
3. Cultural distance
4. Language
All of the social and cultural factors including the attitude of the local community towards the
firm, local employees‘ loyalty to the firm, cultural distance and language are rated below 3.0
and are considered to be relatively unimportant factors in terms of the location decisions in
the Saudi petrochemicals industry.
Page 171
156
Table 5.25 Priority of Social and Cultural Factors
Social and Cultural Factors Rank Mean S.D.
Attitude of the local community towards the firm 1. 2.43 1.03
Local employees‘ loyalty to the firm 2. 2.38 1.03
Cultural distance 3. 2.12 0.94
Language 4. 1.83 0.98
Figure 5.24 Social and Cultural Factors’ Importance Ranking
5.2.3 Location Factors’ Competitiveness Ranking
Table 5.26 summarises the competitiveness of major location factors and sub-factors for the
Saudi petrochemicals industry when compared to other locations. In the second part of the
questionnaire, the participants were asked to rate the competitiveness of all sub-locating
factors for the Saudi petrochemicals industry compared to other locations. After calculating
the mean of all the sub-factors under each major factor, the mean score of each major factor
was recorded. These factors are discussed in detail in the following section.
Page 172
157
Table 5.26 Saudi Arabia Competitiveness Ranking Compared to Other Locations in the Petrochemicals
Industry
S.D. Mean Rank Major and Sub-Location Factors
0.38
1.08
1.01
0.96
0.50
0.63
0.29
3.92
3.83
2.43
3.48
4.43
4.45
4.90
1
11
27
18
4
3
1
A. Cost factors
1. Factory site costs ( Land cost)
2. Labour costs
3. Transportation/logistic costs
4. Cost of raw materials
5. Return on investment
6. Energy costs
0.53
0.85
0.82
0.82
0.82
2.55
1.83
1.90
2.83
3.64
6
31
30
25
16
B. Market factors
7. Large size of the host market
8. Market growth in the host country
9. Level of competition in the host market
10. Market familiarity
0.55
0.72
0.85
0.68
0.94
3.70
3.64
3.83
4.21
3.12
3
17
12
7
21
C. Economic factors
11. Economic stability
12. Economic growth
13. Exchange rates
14. Local financial support
0.38
0.78
0.61
1.02
0.57
0.68
0.39
0.87
3.86
3.67
4.24
2.07
4.33
3.98
4.81 3.90
2
15
6
28
5
9
2
10
D. Infrastructure and technological factors
15. Level of infrastructure (ports, roads, airports, etc.)
16. High industrial concentration (clustering)
17. Availability of well qualified workforce
18. Access to reliable and cooperative suppliers
19. Availability of factory sites (land)
20. Availability of raw materials
21. Geographical proximity
0.52
0.68
1.01
1.13
0.81
0.71
1.04
3.43
4.21
3.19
3.07
3.79
3.79 2.52
4
8
20
22
13
14
26
E. Political and legal factors
22. Political stability
23. International trade agreements
24. Tax reductions in the host country
25. Benign environmental legislation towards FDI
26. Diplomatic ties with the host country
27. Legal and regulatory system
0.54
1.02
0.97
0.72
0.87
2.80
2.07
2.86
3.36
2.90
5
29
24
19
23
F. Social and Cultural factors
28. Cultural distance
29. Attitude of the local community towards the firm
30. Local employees‘ loyalty to the firm
31. Language
Table 5.27 summarises the competitiveness of all location factors relative to other factors
compared to other locations, including the mean and standard deviations for each factor.
Figure 5.25 shows the competitiveness of each location factor compared to all other factors
based on the mean score for each factor, and listed in decreasing order of competitiveness.
Page 173
158
All of the sub-factors identified from the list of each of the major factors are ranked
according to their average scores in Table 5.26. From the analysis of all the sub-factors, an
average rating of greater than 3.0 is considered to indicate a competitive location factor in the
petrochemicals industry. The competitiveness of location factors are identified below
according to their relative competitiveness compared to other location factors, and they are
listed in decreasing order of competitiveness as:
1. Energy costs
2. Availability of raw materials
3. Return on investment
4. Cost of raw materials
5. Access to reliable and cooperative suppliers
6. High industrial concentration (clustering)
7. Exchange rates
8. Political stability
9. Availability of factory sites (land)
10. Geographical proximity
11. Production site costs (land costs)
12. Economic growth
13. Benign environmental legislation towards FDI
14. Diplomatic ties with the host country
15. Level of infrastructure
16. Market familiarity
17. Economic stability
18. Transportation/logistic costs
19. Local employees‘ loyalty to the firm
20. International trade agreements
21. Local financial support
22. Tax reductions in the host country
The least competitive location factors among other location factors based on the average
response rates of competitiveness are listed below in decreasing order of competitiveness:
23. Language
24. Attitude of the local community towards the firm
25. Level of competition in the host market
Page 174
159
26. Legal and regulatory system
27. Labour costs
28. Availability of well-qualified workforce
29. Cultural distance
30. Market growth in the host country
31. Size of the host market
Table 5.27 Location Factors Competitiveness Ranking
Location Factors Ranking Mean S.D.
1. Energy costs 4.90 0.29
2. Availability of raw materials 4.81 0.39
3. Return on investment 4.45 0.63
4. Low cost of raw materials 4.43 0.50
5. Access to reliable and cooperative suppliers 4.33 0.57
6. High industrial concentration (Clustering) 4.24 0.61
7. Exchange rate 4.21 0.68
8. Political stability 4.21 0.68
9. Availability of factory site (land) 3.98 0.68
10. Geographical proximity 3.90 0.87
11. Production site cost (land cost) 3.83 1.08
12. Economic growth 3.83 0.85
13. Benign environmental legislation towards FDI 3.79 0.81
14. Diplomatic ties with host country 3.79 0.71
15. Level of infrastructure 3.67 0.78
16. Market familiarity 3.64 0.82
17. Economic stability 3.64 0.72
18. Transportation/ logistic cost 3.48 0.96
19. Local employees loyalty to firm 3.36 0.72
20. International trade agreements 3.19 1.01
21. Local financial support 3.12 0.94
22. Tax reduction in host country 3.07 1.13
23. Language 2.90 0.87
24. Attitude of the local community toward the firm 2.86 0.97
25. Level of competition in host market 2.83 0.82
26. Legal and regularity system 2.52 1.04
27. Labour costs 2.43 1.01
28. Availability of well qualify of work force 2.07 1.02
29. Cultural distance 2.07 1.02
30. Market growth in host country 1.90 0.82
31. Large size of host markets 1.83 0.85
Page 175
160
Figure 5.25 Location Factors Competitiveness Ranking
5.2.3.1 Major Factors Competitiveness Ranking
Table 5.28 summarises the competitiveness of each major location factor compared to other
major factors based on the mean score of their competitiveness. Figure 5.26 shows the
competitiveness of each major factor compared to other major factors based on the mean
score of competitiveness and listed in decreasing order of competitiveness. After calculating
the sum of the average ratings of the sub-factors under each major factor, we have the
average mean for each major factor. From the analysis of all the major location factors, an
average rating above 3.0 was considered a competitive location factor in the petrochemicals
industry. The competitiveness of the major factors is listed below in decreasing order of
competitiveness as:
Cost factors, infrastructure and technological factors, economic factors and political and legal
factors are rated relatively highly among other major location factors, indicating that they are
Page 176
161
considered to be competitive location factors for FDI compared to other locations in the
Saudi petrochemicals industry. The social and cultural factors and the market factors rated
relatively low among other major location factors, indicating that they are not considered to
be competitive location factors for FDI compared to other locations in the Saudi
petrochemicals industry.
1. Cost factors
2. Infrastructure and technological factors
3. Economic factors
4. Political and legal factors
5. Social and cultural factors
6. Market factors
Table 5.28 Major Factors’ Competitiveness Ranking
Major Factors Competitiveness Ranking Rank Mean S.D.
Cost factors 1 3.92 0.38
Infrastructure and technological factors 2 3.86 0.38
Economic factors 3 3.70 0.55
Political and legal factors 4 3.43 0.52
Social and cultural factors 5 2.80 0.54
Market factors 6 2.55 0.53
Figure 5.26 Major Factors’ Competitiveness Ranking
Page 177
162
5.2.3.2 Cost Factors’ Competitiveness Ranking
Table 5.29 summarises the competitiveness of each cost factor relative to other cost factors,
including the mean and standard deviation for each factor. Figure 5.27 shows the ranking of
the competitiveness of the cost factors based on the mean of each factor. The relative
competitiveness of each cost factor is listed below in decreasing order of competitiveness:
1. Energy costs
2. Return on investment
3. Cost of raw materials
4. Production site costs (land costs)
5. Transportation/ logistic costs
6. Labour costs
Most of the cost factors are considered as competitive factors with a mean of over 3.0
including energy costs, return on investment, cost of raw materials, production site costs
(land costs) and transportation/logistics costs. However, labour costs received a mean of less
than 3.0, which suggests that it is an uncompetitive factor among cost factors for the
petrochemicals industry.
Table 5.29 Competitiveness of Cost Factors
Cost Factors Rank Mean S.D.
Energy costs 1 4.90 0.29
Return on investment 2 4.45 0.63
Cost of raw materials 3 4.43 0.50
Production site costs (land costs) 4 3.83 1.08
Transportation/logistic costs 5 3.48 0.96
Labour costs 6 2.43 1.01
Page 178
163
Figure 5.27 Cost Factors’ Competitiveness Ranking
5.2.3.3 Market Factors’ Competitiveness Ranking
Table 5.30 summarises the competitiveness of market location factors relative to other market
factors including the mean and standard deviation for each factor. Figure 5.28 shows the
competitiveness ranking for each market factor based on the mean of competitiveness. The
competitiveness of market factors are listed below in decreasing order of competitiveness:
1. Market familiarity
2. Level of competition in the host market
3. Market growth in the host country
4. Size of the host market
Market familiarity is the only competitive factor among market factors with a mean over 3.0.
All other market factors received a mean of less than 3.0, which suggests that they are
uncompetitive factors in comparison with other location factors in the Saudi petrochemicals
industry, including the level of competition in the host market, market growth in the host
country and the size of the host market.
Page 179
164
Table 5.30 Competitiveness of Market Factors
Market Factors Rank Mean S.D.
Market familiarity 1 3.64 0.82
Level of competition in the host market 2 2.83 0.82
Market growth in the host country 3 1.90 0.82
Size of the host market 4 1.83 0.85
Figure 5.28 Market Factors’ Competitiveness Ranking
5.2.3.4 Economic Factors’ Competitiveness Ranking
Table 5.31 summarises the competitiveness of economic factors compared to other location
factors in the Saudi petrochemicals industry, including the mean and standard deviation for
each economic factor. Figure 5.29 shows the competitiveness of each economic factor based
on the mean of competitiveness and listed in decreasing order of competitiveness. The
competitiveness of economic factors are listed below in decreasing order of competitiveness:
1. Exchange rate
2. Economic growth
3. Economic stability
4. Local financial support
All economic factors including the exchange rate, economic growth, economic stability and
Page 180
165
local financial support received an average rating of greater than 3.0 and therefore they are
considered as competitive factors compared to other location factors in the Saudi
petrochemicals industry.
Table 5.31 Competitiveness of Economic Factors
Economic Factors Rank Mean S.D.
Exchange rate 1 4.21 0.68
Economic growth 2 3.83 0.85
Economic stability 3 3.64 0.72
Local financial support 4 3.12 0.94
Figure 5.29 Economic Factors’ Competitiveness Ranking
5.2.3.5 Infrastructure and Technological Factors’ Competitiveness Ranking
Table 5.32 summarises the competitiveness of infrastructure and technological factors based
on the mean of competitiveness, including the means and standard deviation for each factor.
Figure 5.30 shows the competitiveness of each infrastructure and technologic factor based on
the mean of competitiveness and listed in decreasing order of competitiveness. The
competitiveness of infrastructure and technological factors are listed below in decreasing
order of competitiveness:
1. Availability of raw materials
2. Access to reliable and cooperative suppliers
3. High industrial concentration (clustering)
Page 181
166
4. Availability of factory sites (land)
5. Geographical proximity
6. Level of infrastructure
7. Availability of a well-qualified workforce
Most of the infrastructure and technological factors received a mean of over 3.0, including
the availability of raw materials, access to reliable and cooperative suppliers, high industrial
concentration (clustering), the availability of factory sites (land), geographical proximity and
the level of infrastructure, and are considered to be competitive factors for FDI compared to
other location factors in the Saudi petrochemicals industry. However, the availability of a
well-qualified workforce received an average mean of less than 3.0 and it is considered to be
an uncompetitive factor for FDI compared to other location factors in the Saudi
petrochemicals industry.
Table 5.32 Competitiveness of Infrastructure and Technological Factors
Infrastructure and technological factors Rank Mean S.D.
Availability of raw materials 1 4.81 0.39
Access to reliable and cooperative suppliers 2 4.33 0.57
High industrial concentration (clustering) 3 4.24 0.61
Availability of factory sites (land) 4 3.98 0.68
Geographical proximity 5 3.90 0.87
Level of infrastructure 6 3.67 0.78
Availability of well qualified workforce 7 2.07 1.02
Figure 5.30 Infrastructure and Technological Factors’ Competitiveness Ranking
Page 182
167
5.2.3.6 Political and Legal Factors’ Competitive Ranking
Table 5.33 summarises the competitiveness of political and legal factors based on the average
mean of competitiveness, including the mean and standard deviation for each factor. Figure
5.31 shows the competitiveness of the political and legal factors based on the mean for
competitiveness for each factor. These are listed in decreasing order of competitiveness. The
competitiveness of the political and legal factors are listed below in decreasing order of
competitiveness:
1. Political stability
2. Benign environmental legislation towards FDI
3. Diplomatic ties with the host country
4. International trade agreements
5. Tax reductions in the host country
6. Legal and regulatory system
Most of the political and legal factors received a mean of more than 3.0, including political
stability, benign environmental legislation towards FDI, diplomatic ties with the host country,
international trade agreements and tax reductions in the host country, and are considered to
be competitive location factors compared to other location factors in the Saudi
petrochemicals industry. However, legal and regulatory systems received a mean of less than
3.0, and therefore is considered to be an uncompetitive factor compared to other location
factors in the Saudi petrochemicals industry.
Table 5.33 Competitiveness of Political and Legal Factors
Political and legal factors Rank Mean S.D.
Political stability 1 4.21 0.68
Benign environmental legislation towards FDI 2 3.79 0.81
Diplomatic ties with the host country 3 3.79 0.71
International trade agreements 4 3.19 1.01
Tax reductions in the host country 5 3.07 1.13
Legal and regulatory system 6 2.52 1.04
Page 183
168
Figure 5.31 Political and Legal Factors’ Competitiveness Ranking
5.2.3.7 Social and Cultural Factors’ Competitiveness Ranking
Table 5.34 summarises the competitiveness of social and cultural factors based on the mean
of competitiveness, including the mean and the standard deviation for each factor. Figure
5.32 shows the competitiveness of the social and cultural factors based on the mean of
competitiveness and are listed in decreasing order of competitiveness. The competitiveness of
each social and cultural factor is listed below in decreasing order of competitiveness:
1. Local employees‘ loyalty to the firm
2. Language
3. Attitude of the local community towards the firm
4. Cultural distance
Local employees‘ loyalty to the firm is the only factor in the social and cultural factors with a
mean of more than 3.0 and it is therefore considered to be a competitive factor compared to
other location factors in the Saudi petrochemicals industry. However, all other social and
cultural factors received a mean of less than 3.0, including language, the attitude of the local
community towards the firm and cultural distance, and are considered as uncompetitive
factors compared to other location factors in the Saudi petrochemicals industry.
Page 184
169
Table 5.34 Competitiveness of Social and Cultural Factors
Social and Cultural Factors Rank Mean S.D.
Local employees loyalty to the firm 1 3.36 0.72
Language 2 2.90 0.87
Attitude of the local community towards the firm 3 2.86 0.97
Cultural distance 4 2.07 1.02
Figure 5.32 Social and Cultural Factors’ Competitiveness Ranking
5.3 Summary
In this chapter, we summarized the findings of the descriptive data obtained from the 42
executives interviewed. The analysis shows a wide range and diversity of responses to the
same location factors. The evidence reveals the distribution of responses to each question in
the questionnaire, including the percentage rate of response for each of the 31 factors that
measure the importance and competitiveness of location factors in the Saudi petrochemical
industry. In addition, we showed the details of the ranking of the location factors for FDI in
the Saudi petrochemical industry based on the ranking of importance and competitiveness of
location factors. In the first part of this section we detail the importance of the ranking of the
location factors for FDI location decisions with regard to the Saudi petrochemical industry. In
the second part of this section, we detail the FDI location factors‘ competitiveness ranking in
the Saudi petrochemical industry compared to other locations. The next chapter presents the
empirical evidence of the importance/competitiveness of the Saudi petrochemicals industry.
Page 186
171
Chapter 6 : Empirical Evidence of the Importance/Competitiveness of
the Saudi Petrochemicals Industry
6.1 Importance/Competitiveness Analysis of the Saudi Petrochemicals Industry
6.1.1 Analysis
In this study, we have modified the original framework used by Tam, Newton, Strange and
Enright (2008) and have applied it to our study. We have done this by plotting the importance
measures of the location factors for the petrochemicals industry on the vertical axis against
their competitiveness in terms of location or performance measures on the horizontal axis.
There are two ways in which the matrix can be constructed. The simplest way is to plot the
axes at scores of 2.5: i.e. the mid-points of the five-point Likert scale. However, as Oh (2001)
has argued, a more valid and useful construction is to set the axes at the mean scores in
respect of its importance of 3.38 and for the competitiveness 3.46. The resulting matrix offers
a readily accessible tool for managers and policy makers in both private and public sectors.
Table 6.1 shows the mean and standard deviation for the importance and competitiveness of
the location factors in the Saudi petrochemicals industry. We placed each factor on the matrix
based on the crossing point between the mean of the importance and the mean of the
competitiveness of each location factor as it appears in Figure 6.1.
Page 187
172
Table 6.1 the Importance and Competitiveness of Location Factors
Competitiveness Importance Major and Sub-Location Factors
S.D. Mean S.D. Mean
1.08
1.01
0.96
0.50
0.63
0.29
3.83
2.43
3.48
4.43
4.45
4.90
0.96
1.08
0.77
0.49
0.49
0.32
3.29
2.62
4.12
4.60
4.74
4.88
A. Cost factors
1. Factory site costs (Land cost)
2. Labour costs
3. Transportation/logistic costs
4. Cost of raw materials
5. Return on investment
6. Energy costs
0.85
0.82
0.82
0.82
1.83
1.90
2.83
3.64
0.84
1.06
0.70
0.99
2.14
2.19
2.55
2.88
B. Market factors
7. Size of the host market
8. Market growth in the host country
9. Level of competition in the host market
10. Market familiarity
0.72
0.85
0.68
0.94
3.64
3.83
4.21
3.12
1.12
0.88
0.93
1.03
3.62
2.57
3.62
2.74
C. Economic factors
11. Economic stability
12. Economic growth
13. Exchange rates
14. Local financial support
0.78
0.61
1.02
0.57
0.68
0.39
0.87
3.67
4.24
2.07
4.33
3.98
4.81
3.90
0.46
0.64
0.69
0.87
0.60
0.46
0.91
4.31
3.86
2.64
4.33
4.02
4.69
3.50
D. Infrastructure and technological factors
15. Level of infrastructure (ports, roads, airports, etc.)
16. High industrial concentration (clustering)
17. Availability of well qualified workforce
18. Access to reliable and cooperative suppliers
19. Availability of factory sites (land)
20. Availability of raw materials
21. Geographical proximity
0.68
1.01
1.13
0.81
0.71
1.04
4.21
3.19
3.07
3.79
3.79
2.52
0.55
0.93
0.84
0.58
0.72
0.93
4.45
3.10
3.90
4.38
3.33
3.05
E. Political and legal factors
22. Political stability
23. International trade agreements
24. Tax reduction in the host country
25. Benign environmental legislation towards FDI
26. Diplomatic ties with the host country
27. Legal and regulatory system
1.02
0.97
0.72
0.87
2.07
2.86
3.36
2.90
0.94
1.03
1.03
0.98
2.12
2.43
2.38
1.83
F. Social & Cultural factors
28. Cultural distance
29. Attitude of the local community towards the firm
30. Local employees‘ loyalty to the firm
31. Language
Page 188
173
Figure 6.1 The Importance/Competitiveness Matrix for the Petrochemicals Industry
Source: Author
Note : 1. Factory site costs (land costs); 2. Labour costs; 3. Transportation/logistics costs; 4. Cost of raw materials; 5. Return on investment;
6. Energy costs; 7. Size of the host market; 8. Market growth in the host country; 9. Level of competition in the host market; 10. Market
familiarity; 11. Economic stability; 12. Economic growth; 13. Exchange rates; 14. Local financial support; 15. Level of infrastructure (ports,
roads, airports, etc.); 16. High industrial concentration (clustering); 17. Availability of well-qualified workforce; 18. Access to reliable and
cooperative suppliers; 19. Availability of factory sites (land); 20. Availability of raw materials; 21. Geographical proximity; 22. Political
stability; 23. International trade agreements; 24. Tax reductions in the host country; 25. Benign environmental legislation towards FDI; 26.
Diplomatic ties with the host country; 27. Legal and regulatory system; 28. Cultural distance; 29. Attitude of the local community towards
the firm; 30. Local employees‘ loyalty to the firm; 31. Language.
Figure 6.1 shows the resulting matrix for the petrochemical industry in Saudi Arabia. Cell (A)
captures the factors that are the best fit between the most critical needs of firms and the
strongest advantages of the location, showing those factors that were identified both as being
high in importance for the petrochemical industry and in which Saudi Arabia possessed
marked competitive advantages over other locations. Fourteen factors stand out: energy costs,
availability of raw materials, return on investment, cost of raw materials, access to reliable
Page 189
174
and cooperative suppliers, political stability, benign environmental legislation towards FDI,
high industrial concentration (clustering), availability of factory sites (land), level of
infrastructure (ports, roads, airports, etc.), exchange rates, transportation/ logistic costs,
geographical proximity and economic stability.
For the petrochemicals industry, 60% of production costs rely on the feedstock and Saudi
Arabia, as explained before, provides the lowest energy costs in the world that gives the
petrochemicals firms located in Saudi Arabia a competitive edge over other companies
located in other countries, and reflects on why this factor received the highest rating
compared with other factors, both for importance and for competitiveness. In terms of the
availability of raw materials, Saudi Arabia owns 25% of the world‘s oil reserves and, because
petrochemicals rely on oil basic outputs for their raw materials, this factor receives a high
priority in terms of importance and competitiveness. The low energy costs and the
availability of raw materials, the clustering of the industry, transportation costs and low
production costs all help the petrochemicals industry in Saudi Arabia by reducing their
production costs sharply, allowing them to reach their markets easily and, in turn, increases
the return on investment.
Economic stability is crucial for MNEs as it provides a stable environment in which to work.
Saudi Arabia enjoys a very stable economy as it relies on oil exports for its economy and as
oil prices are still high, Saudi Arabia provides a very stable economy for MNEs. Saudi
Arabia‘s competitive position and the importance of the exchange rate factor reinforces the
view that the long-standing 'hard' peg to the US dollar, which has also withstood the
turbulence of the recent world financial crisis, is a location-specific competitive advantage,
and a very important factor for petrochemical firms in Saudi Arabia. Infrastructure is a very
important factor for a heavy and global industry like petrochemicals as it relies on such
infrastructure to transport its products globally. Saudi Arabia, as explained in the previous
chapters, has taken very ambitious steps to modernise its infrastructure, which is reflected in
the high score for the importance and competitiveness of this factor, and gives petrochemical
companies located in Saudi Arabia a competitive advantage over other locations. The Saudi
petrochemicals industry enjoys a high degree of concentration (clustering) as the Saudi
government has built two cities (Aljubail and Yanbu) that were specifically designed for this
heavy industry, with all the supporting industries located close to each other.
Page 190
175
Clustering with regard to the petrochemicals industry in Saudi Arabia provides all the
necessary supporting industries for the petrochemicals industry, including suppliers and
logistic support, and this reflects the importance and competitiveness of this factor.
Availability of land is very crucial for a heavy industry like the petrochemicals industry, and
the Saudi government has provided land for petrochemical companies in the industrial cities
of Aljubail and Yanbu, that have all the infrastructure needed at a competitive price
compared to other locations, and this is reflected in the importance and competitiveness of
this factor. Because Saudi Arabia is the world‘s largest oil producer and because
petrochemicals rely on oil-related raw materials for their products, Saudi Arabia is the best in
terms of the necessary raw materials for the petrochemicals industry with low costs and
proximate suppliers, which may reflect why the factors low cost of and availability of raw
materials are important and competitive in the petrochemicals industry.
For a heavy industry like petrochemicals, transportation and the location of the product are
very important in terms of delivering their products on time at low cost. Saudi Arabia‘s
strategic location between the east and the west and the easy access to it by air and sea makes
Saudi Arabia the ideal location for the petrochemicals industry. This is why it received a high
importance and competitive ranking with regard to this factor. Political stability plays a very
important role for MNEs with regard to their foreign locations, as it provides the ideal
environment in which to operate, in a location that enjoys a very stable political environment.
Historically, Saudi Arabia enjoys a very stable political environment and this reflects on the
importance and competitiveness of these factors. Benign environmental legislation towards
FDI is crucial for FDI to operate successfully in an international location. The Saudi
government took strategic steps to improve its investment environment for foreign firms, and
therefore changed and improved the laws and the environment for foreign investment that, in
turn, has increased the FDI inflows to Saudi Arabia dramatically in recent years. This result
reflects the importance and competitiveness of this factor.
Cell (D) displays those factors that the respondents in the industry perceive as being
important, but with regard to which the location is not competitive. Saudi Arabia‘s most
critical competitive disadvantage, therefore, lies in the tax reductions available in Saudi
Arabia. Taxes are rated as being very important for petrochemical firms, though Saudi Arabia
is marginally below average in this factor compared to other locations in the same industry.
Therefore, Saudi policy makers should pay attention to the tax reduction factor as it is an
Page 191
176
important factor for petrochemicals FDI, but the country lacks a competitive advantage over
other locations. Saudi policy makers should improve the tax rate and tax system in Saudi
Arabia to make them more competitive in terms of other locations. However, Cell (D), it
should be stressed, shows factors that are above average in industry-specific importance and
which are therefore of primary concern to practitioners in both the private sector and the
public sector.
The two remaining cells, however, capture factors that are rated as being of below average
importance, segmenting them into those in which the location is competitive relative to other
regional locations (Cell B) and those in which the location is less competitive compared with
its rivals (Cell C).
Cell (C) therefore shows those factors in which Saudi Arabia is relatively uncompetitive, but
where the low industry-specific importance lowers the priority that should be accorded to
these factors by either public or private decision-makers. These factors are international trade
agreements, local financial support, local employees‘ loyalty to the firm, legal and regulatory
systems, the level of competition in the host market, the attitude of the local community
towards the firm, labour costs, language, the availability of a well-qualified workforce,
cultural distance, market growth in the host country and the size of the host market.
Interestingly, the factors large Saudi market and market growth in the Saudi market are
captured in this cell, suggesting that these factors may not be as salient as policy-makers may
perceive, at least in the petrochemicals industry. Thus, despite Saudi Arabia‘s relatively low
location-specific competitiveness in this factor, it is not significant for the petrochemicals
industry, which would appear to lend support to Saudi Arabia‘s neutral investment policies.
Our study‘s findings with regard to the market factors are opposite to that of many other
scholars who concluded that the market factor is one of the most important location factors.
However, as we have revealed, it is not an important factor for petrochemicals FDI in Saudi
Arabia. This supports the view that each location and industry has its own factor priorities.
The low importance accorded to the factor of support from related industries is interesting in
relation to Porter‘s model, that posits supporting and related industries as one of the four key
variables in determining competitiveness. Whilst Saudi Arabia may be less competitive than
its regional rivals in terms of this factor, and the other market-related factors, it is again a low
priority for the petrochemicals industry. The low importance and competitiveness of the
Page 192
177
factor availability of a well-qualified workforce for MNEs in such a key industry as the
petrochemicals industry may help inform the debate in Saudi Arabia about the Saudisation of
the workforce in MNEs located in Saudi Arabia. The petrochemicals industry is a highly
automated industry. Therefore, it does not require a highly intensive labour workforce. For
this reason, the labour costs factor is low in terms of importance and competitiveness.
Petrochemicals FDI production in Saudi Arabia exceeds the capacity of the local market and
therefore petrochemicals FDI export the majority of their production to foreign markets.
Therefore, the Saudi market is not a priority for the petrochemicals FDI as their productions
exceeds local demand. This is why the size of the host market and its market growth scored
low in terms of importance and competitiveness.
Because most of the production of the petrochemicals FDI is exported from Saudi Arabia to
foreign markets, local competition factors are also seen to be of low importance and
competitiveness. Most local financial firms follow a very conservative and low-risk financial
policy, which affects their lending policy for FDI, which, in turn, affects the FDI with regard
to securing the financial support they need for their operations in Saudi Arabia. Therefore,
most FDI in Saudi Arabia secure their financial needs from global firms outside Saudi
Arabia. This is why the local financial support factor scored low in terms of importance and
competitiveness.
The availability of a well-qualified workforce is very limited in Saudi Arabia and that makes
FDI in the petrochemicals industry in Saudi Arabia import their workforce and rely on
expatriates for the skilled labour needed, as there are few highly skilled and well-educated
Saudis in the petrochemicals industry. In addition, highly skilled Saudis prefer to work for the
government-owned companies such as SABIC and ARAMCO instead of for foreign
companies, as the government and the government-owned companies provide a stable and
secure job for them, and because there may be cultural conflict within foreign firms. For this
reason, the availability of a well-qualified workforce is viewed as being of low importance
and competitiveness. As we explained earlier, most petrochemicals FDI rely on expatriates
for their workforce, and because Saudis prefer to work for government-related firms, the
local employees‘ loyalty to the firm factor is low in importance and competitiveness for the
petrochemicals FDI located in Saudi Arabia.
Since petrochemicals firms are MNEs and they are located globally, trade agreements may
Page 193
178
not offer an important or competitive advantage for them, as they export basic products
globally. As this industry is a very heavy industry, it needs years of operations before it can
enjoy the benefits from technical economies of scale. In addition, since Saudi Arabia joined
the WTO in 2005, the benefits that can be gained from such an agreement need some years to
take effect, and this inadvertently reflects on the low importance and competitiveness score
for this factor.
MNEs working in Saudi Arabia usually rely on arbitration through foreign laws because
commercial law in Saudi Arabia is not well accepted by MNEs operating in Saudi Arabia, as
the Saudi commercial law has some drawbacks and needs to be improved. In addition, the
legal process and execution of the law takes a very long time. This may be reflected in the
low importance and competitiveness rating of the legal and regulatory system. However, the
Saudi government should take the necessary steps to improve Saudi commercial law in order
to make it acceptable to foreign firms, as this factor is very important in any business
environment for FDI and would make Saudi Arabia more competitive with regard to this
factor.
Petrochemicals FDI in Saudi Arabia are located in remote cities built for this specific
industry. In addition, because the petrochemicals FDI rely on exporting their products, any
interaction with the local community and cultural distance are minimal; therefore, the cultural
distance and the attitude of the local community towards such firms are not important and are
not competitive factors in the eyes of foreign firms in Saudi Arabia. The requirement to use
the local language is minimal on the part of foreign companies in the Saudi petrochemicals
industry, as most firms are MNEs and therefore use the English language or their parent
firm‘s language for their operations. In addition, language is not important because the local
market is not a priority for the petrochemicals FDI. Therefore, using the local language is not
necessary and this reflects the low importance and competitiveness of the language factor
with regard to FDI in the Saudi petrochemicals industry.
Cell (B) captures those factors that, again, are of low industry-specific importance. However,
it captures factors of high location-specific competitiveness. Four factors standout factory site
costs (land costs), diplomatic ties with the host country, market familiarity and economic
growth factors all of which are clearly located within this cell. The strong location-specific
rating given to Saudi Arabia with regard to these factors confirms the perception of Saudi
Page 194
179
Arabia‘s role as a gateway for business in the Middle East. However, its low industry-specific
importance may be a cause for some reflection on the part of policy-makers in Saudi Arabia.
Factory site cost is very competitive for the petrochemicals industry but it is not an important
factor for FDI in the Saudi petrochemicals industry. Therefore, the resources given to the site
cost factor should be shifted to more important factors related to the petrochemicals industry
in Saudi Arabia. The economic growth factor is a competitive factor for FDI in the Saudi
petrochemicals industry. However, economic growth is not an important factor for FDI in
Saudi petrochemicals. This may reflect the fact that Saudi Arabia is not the primary market
for petrochemicals FDI in Saudi Arabia as they target the global market. Furthermore, Saudi
Arabia consumes less than 20 % of the production capacity according to BMI (2009).
Therefore, the growth of the economy in Saudi Arabia is not important in terms of their FDI
operations. Many petrochemicals FDI in Saudi Arabia have operated for many years in the
country and they have built a very good business relationship and have become familiar with
the Saudi market. This makes it a familiar market for them and makes it competitive
compared with other locations. However, market familiarity is not important for FDI in the
Saudi petrochemicals industry. The Saudi government has built a very good diplomatic
relationships with other countries over many years. This is reflected in the competitiveness of
diplomatic ties with the host country factor, over other locations. However, this factor is not
an important factor for the petrochemicals FDI located in Saudi Arabia.
These findings for Cells (B) and (C) illustrate the value of the location of those factors rated
below average in industry-specific importance. Cell (B) can identify factors where there may
be a risk of wasting resources if the competitiveness of the location is due to resources being
committed to those factors. Similarly, Cell (C) can identify factors that, despite their lack of
competitiveness, have no need of improvement, at least for this industry.
Page 195
180
6.2 Testing the Location Factors
6.2.1 Introduction
There are different types of t-test (Pallant, 2007). The first is the Independent-samples t-test,
used when we want to compare the mean scores of two different groups of people or
conditions. The second is the Paired-samples t-test, used when we want to compare the mean
scores for the same group of people on two different occasions or when we have matched
pairs. In this section, we tested the importance and competitiveness of location factors for the
location decisions for FDI in the Saudi petrochemicals industry. In the first part of this
section, we tested the importance of all factors including major factors and sub-factors in the
Saudi petrochemicals industry. In the second part of this section, we tested the
competitiveness of the location factors compared to other locations in the Saudi
petrochemicals industry, including the competitiveness of the major factors and sub-factors
and the competitiveness of sub-factors under each major factor.
6.2.2 Testing the Location Factors’ Importance
Table 6.2 summarises the importance of major factors and sub-factors in terms of the mean,
standard deviation and standard errors for petrochemicals FDI in their decision to locate their
business in Saudi Arabia. Table 6.3 summarises the t-test for major factors and sub-factors
for location decisions in the Saudi petrochemicals industry. We discuss all these factors in
detail in the following section.
Page 196
181
Table 6.2 Location Factors’ Importance Means
One-Sample Statistics
Location Factors N Mean Std. Deviation Std. Error Mean
Cost factors
42 4.040 .4697 .0725
Factory site costs 42 3.29 .970 .150
Labour costs 42 2.62 1.081 .167
Transportation/logistics costs 42 4.12 .772 .119
Raw material costs 42 4.60 .497 .077
Return on Investment 42 4.74 .497 .077
Energy costs 42 4.88 .328 .051
Market factors
42 2.440 .6914 .1067
Large host market 42 2.14 .843 .130
Market growth in the host market 42 2.19 1.065 .164
Competition in the host market 42 2.55 .705 .109
Market familiarity 42 2.88 .993 .153
Economic factors
42 3.137 .7655 .1181
Economic stability 42 3.62 1.125 .174
Economic growth 42 2.57 .887 .137
Exchange rates 42 3.62 .936 .144
Local financial support 42 2.74 1.037 .160
Infrastructure and technological factors
42 3.908 .3623 .0559
Level of infrastructure 42 4.31 .468 .072
Clustering 42 3.86 .647 .100
Availability of qualified work force 42 2.64 .692 .107
Access to reliable and cooperative suppliers 42 4.33 .874 .135
Availability of factory sites 42 4.02 .604 .093
Availability of raw materials 42 4.69 .468 .072
Geographical proximity 42 3.50 .917 .142
Political and legal factors
42 3.702 .4222 .0651
Political stability 42 4.45 .550 .085
International trade agreements 42 3.10 .932 .144
Tax reductions in the host country 42 3.90 .850 .131
Benign environmental legislation toward FDI 42 4.38 .582 .090
Diplomatic ties with the host country 42 3.33 .721 .111
Legal and regulatory system 42 3.05 .936 .144
Social and cultural factors
42 2.190 .6644 .1025
Cultural distance from home country 42 2.12 .942 .145
Attitude of local community towards the firm 42 2.43 1.039 .160
Local employees' loyalty to the firm 42 2.38 1.035 .160
Language 42 1.83 .986 .152
Page 197
182
Table 6.3 Location Factors’ Importance T-Test
One-Sample Test
Test Value = 3
Location Factors
95% Confidence
Interval of the
Difference
t df Sig. (2-
tailed)
Mean
Difference Lower Upper
Cost factors
14.345 41 .000 1.0397 .893 1.186
Factory site costs 1.909 41 .063 .286 -.02 .59
Labour costs -2.284 41 .028 -.381 -.72 -.04
Transportation/logistics costs 9.400 41 .000 1.119 .88 1.36
Raw material costs 20.810 41 .000 1.595 1.44 1.75
Return on Investment 22.674 41 .000 1.738 1.58 1.89
Energy costs 37.191 41 .000 1.881 1.78 1.98
Market factors
-5.244 41 .000 -.5595 -.775 -.344
Large host market -6.589 41 .000 -.857 -1.12 -.59
Market growth in the host market -4.928 41 .000 -.810 -1.14 -.48
Competition in the host market -4.156 41 .000 -.452 -.67 -.23
Market familiarity -.777 41 .442 -.119 -.43 .19
Economic factors
1.159 41 .253 .1369 -.102 .375
Economic stability 3.566 41 .001 .619 .27 .97
Economic growth -3.130 41 .003 -.429 -.71 -.15
Exchange rates 4.287 41 .000 .619 .33 .91
Local financial support -1.636 41 .109 -.262 -.59 .06
Infrastructure and technological factors
16.247 41 .000 .9082 .795 1.021
Level of infrastructure 18.138 41 .000 1.310 1.16 1.46
Clustering 8.591 41 .000 .857 .66 1.06
Availability of qualified work force -3.344 41 .002 -.357 -.57 -.14
Access to reliable and cooperative suppliers 9.884 41 .000 1.333 1.06 1.61
Availability of factory sites 10.978 41 .000 1.024 .84 1.21
Availability of raw materials 23.414 41 .000 1.690 1.54 1.84
Geographical proximity 3.532 41 .001 .500 .21 .79
Political and legal factors
10.782 41 .000 .7024 .571 .834
Political stability 17.112 41 .000 1.452 1.28 1.62
International trade agreements .662 41 .512 .095 -.20 .39
Tax Reductions in the host country 6.899 41 .000 .905 .64 1.17
Benign environmental legislation toward FDI 15.368 41 .000 1.381 1.20 1.56
Diplomatic ties with the host country 2.995 41 .005 .333 .11 .56
Legal and regulatory system .330 41 .743 .048 -.24 .34
Social and cultural factors
-7.896 41 .000 -.8095 -1.017 -.602
Cultural distance from home country -6.059 41 .000 -.881 -1.17 -.59
Attitude of local community towards the firm -3.563 41 .001 -.571 -.90 -.25
Local employees' loyalty to the firm -3.877 41 .000 -.619 -.94 -.30
Language -7.671 41 .000 -1.167 -1.47 -.86
Page 198
183
Table 6.4 summarises the importance of the location factor means, standard deviations and
standard errors. Table 6.5 shows the t-test for the importance of location factors. From the
analysis of all the sub-factors, an average rating test value of above 3.0 was considered as an
important location factor in the petrochemicals industry. The most important location factors
identified in terms of their relative importance in location decisions for petrochemicals FDI
are listed below in decreasing order of importance based on the t-test as:
1. Energy costs
2. Return on investment
3. Availability of raw materials
4. Low cost of raw materials
5. Political stability
6. Benign environmental legislation for FDI
7. Access to reliable and cooperative suppliers
8. Level of infrastructure
9. Transportation/logistic costs
10. Availability of factory sites (land)
11. Tax reductions in the host country
12. High industrial concentration (clustering)
13. Economic stability
14. Exchange rates
15. Geographical proximity
The least important location factors among other location factors are listed below in
decreasing order of importance as:
16. Diplomatic ties with the host country
17. Production site costs (land costs)
18. International trade agreements
19. Legal and regulatory system
20. Market familiarity
21. Local financial support
22. Availability of well-qualified workforce
23. Labour costs
24. Economic growth
Page 199
184
25. Level of competition in the host market
26. Attitude of the local community towards the firm
27. Local employees‘ loyalty to the firm
28. Market growth in the host country
29. Size of host market
30. Cultural distance
31. Language
Table 6.4 Sub-Location Factors’ Importance Means
One-Sample Statistics
Location Factors N Mean Std. Deviation Std. Error Mean
Factory site costs 42 3.29 .970 .150
Labour costs 42 2.62 1.081 .167
Transportation/logistics costs 42 4.12 .772 .119
Raw material costs 42 4.60 .497 .077
Return on Investment 42 4.74 .497 .077
Energy costs 42 4.88 .328 .051
Large host market 42 2.14 .843 .130
Market growth in the host market 42 2.19 1.065 .164
Competition in the host market 42 2.55 .705 .109
Market familiarity 42 2.88 .993 .153
Economic stability 42 3.62 1.125 .174
Economic growth 42 2.57 .887 .137
Exchange rates 42 3.62 .936 .144
Local financial support 42 2.74 1.037 .160
Level of infrastructure 42 4.31 .468 .072
Clustering 42 3.86 .647 .100
Availability of qualified workforce 42 2.64 .692 .107
Access to reliable and cooperative suppliers 42 4.33 .874 .135
Availability of factory sites 42 4.02 .604 .093
Availability of raw materials 42 4.69 .468 .072
Geographical proximity 42 3.50 .917 .142
Political stability 42 4.45 .550 .085
International trade agreements 42 3.10 .932 .144
Tax reductions in the host country 42 3.90 .850 .131
Benign environmental legislation toward FDI 42 4.38 .582 .090
Diplomatic ties with the host country 42 3.33 .721 .111
Legal and regulatory system 42 3.05 .936 .144
Cultural distance from home country 42 2.12 .942 .145
Attitude of local community towards the firm 42 2.43 1.039 .160
Local employees' loyalty to the firm 42 2.38 1.035 .160
Language 42 1.83 .986 .152
Page 200
185
Table 6.5 Sub-Location Factors’ T-Test
One-Sample Test
Location Factors
Test Value = 3
95% Confidence
Interval of the
Difference
t df Sig. (2-
tailed)
Mean
Difference Lower Upper
Factory site costs 1.909 41 .063 .286 -.02 .59
Labour costs -2.284 41 .028 -.381 -.72 -.04
Transportation/logistics costs 9.400 41 .000 1.119 .88 1.36
Raw material costs 20.810 41 .000 1.595 1.44 1.75
Return on Investment 22.674 41 .000 1.738 1.58 1.89
Energy costs 37.191 41 .000 1.881 1.78 1.98
Large host market -6.589 41 .000 -.857 -1.12 -.59
Market growth in the host market -4.928 41 .000 -.810 -1.14 -.48
Competition in the host market -4.156 41 .000 -.452 -.67 -.23
Market familiarity -.777 41 .442 -.119 -.43 .19
Economic stability 3.566 41 .001 .619 .27 .97
Economic growth -3.130 41 .003 -.429 -.71 -.15
Exchange rates 4.287 41 .000 .619 .33 .91
Local financial support -1.636 41 .109 -.262 -.59 .06
Level of infrastructure 18.138 41 .000 1.310 1.16 1.46
Clustering 8.591 41 .000 .857 .66 1.06
Availability of qualified workforce -3.344 41 .002 -.357 -.57 -.14
Access to reliable and cooperative suppliers 9.884 41 .000 1.333 1.06 1.61
Availability of factory sites 10.978 41 .000 1.024 .84 1.21
Availability of raw materials 23.414 41 .000 1.690 1.54 1.84
Geographical proximity 3.532 41 .001 .500 .21 .79
Political stability 17.112 41 .000 1.452 1.28 1.62
International trade agreements .662 41 .512 .095 -.20 .39
Tax reductions in the host country 6.899 41 .000 .905 .64 1.17
Benign environmental legislation toward FDI 15.368 41 .000 1.381 1.20 1.56
Diplomatic ties with the host country 2.995 41 .005 .333 .11 .56
Legal and regulatory system .330 41 .743 .048 -.24 .34
Cultural distance from home country -6.059 41 .000 -.881 -1.17 -.59
Attitude of local community towards the firm -3.563 41 .001 -.571 -.90 -.25
Local employees' loyalty to the firm -3.877 41 .000 -.619 -.94 -.30
Language -7.671 41 .000 -1.167 -1.47 -.86
6.2.2.1 Major Factors’ Importance
Table 5.40 summarises the importance of major location factors, including the mean,
standard deviation and standard error. Table 5.42 shows the t-test for the importance of the
major location factors. After calculating the average rating of the sub-factors related to each
Page 201
186
major factor, we have the mean for each major factor. From the analysis of all the major
location factors, an average rating of above 3.0 was considered in terms of the importance of
the location factors in the petrochemical industry.
The important factors are:
1. Cost factors
2. Infrastructure and technological factors
3. Political and legal factors
The unimportant factors are:
4. Economic factors
5. Market factors
6. Social and cultural factors
Cost factors, infrastructure and technological factors, and political and legal factors, received
a mean score of greater than 3.0, and the t-test showed that they are significantly above 3.0
with regard to the other major location factors. This indicates that they are considered to be
important location factors for FDI when foreign companies are choosing their location in the
Saudi petrochemical industry. The economic factors, market factors and social and cultural
factors are significantly below 3.0. This indicates that they are considered to be unimportant
location factors for FDI location decisions with regard to the Saudi petrochemical industry.
The cost factor has a mean score of 4.039. The t-test shows that this is significantly more than
3.0 (t41 = 14.345, p = 0.000). Hence, cost factors are perceived to play an important role in
FDI location decisions. Our results support the findings of Banga (2003) and Campos and
Kinoshita (2003) in that cost factors are very important in terms of the location decisions for
efficiency seeking and resource seeking FDI, and when the FDI is export-oriented and targets
the market outside the host country. Our findings also support the findings of Abdel-Rahman
(2002) which indicate that cost factors will influence the location decision in terms of FDI in
Saudi Arabia. The results are also in line with those of Buckely, Devenney and Louvriere
(2007) who concluded that cost factors play an important role in FDI location decision
making. In a similar conclusion to our results, Gilmore, O'Donnel, Carson and Cummins
(2003) concluded that the motives for the location of FDI have been explained by the concept
of cost minimisation, which implies that MNCs will choose the least cost location for their
production activities abroad. The results are also in line with those of Kang and Lee (2007) in
Page 202
187
that a significant part of multinational activity tends to take the form of firms shifting their
production processes to low-cost locations. However, our results are different from the
findings of Nunnenkamp, (2002) who concluded that non-traditional location factors such as
cost factors have become less important with globalization.
The market factor has a mean score of less than 3.0. The t-test shows that the mean score is
significantly (p < 0.05) less than 3.0 (t41 = -5.244, p = 0.000). Thus, the market factors are not
perceived to be of importance with regard to FDI location decisions in the Saudi
petrochemical industry.Our results support the findings of Mina (2007) who studied the
factors that influenced the location decisions for FDI in Gulf State countries including Saudi
Arabia, Bahrain, Oman, Kuwait, and the United Arab Emirates It was found that market
factors in these countries was not an important factor in terms of FDI location decisions. He
concluded that, due to the small population sizes in the Gulf countries, economies of scale
may not be realized, and FDI inflows may be discouraged. Therefore, the influence of market
size on FDI inflows may be ambiguous. Our findings are also in line with those of Cleeve
(2009) who concluded that the significance of market factors on FDI location decisions is
declining, as other variables such as policy variables are becoming more important in terms
of FDI location decisions. Our result confirm the findings of Campos and Kinishita (2003) in
that efficiency seeking FDI, which target markets, are not interested in the national markets
of the host country, and targeting the export markets will be less influenced by the market
factors of the host country. This confirms the findings of Nunnenkamp (2002) which suggest
that the relative importance of FDI location factors has changed as a result of globalization.
Furthermore, the importance of traditional location factors has not diminished as a result of
globalization. However, their importance in terms of FDI location decisions has declined. For
example, the market size of the host country is one of the most important location factors in
the opinion of many scholars. However, this factor has diminished in importance in terms of
FDI location decisions. At the same time, new factors have become more important with
regard to FDI location decisions - factors such as costs factors, infrastructure factors, and a
benign business environment (UNCTAD 1996; Nunnenkamp, 2002). Our results support the
findings of Cleeve (2009) who concluded that the significance of market size and growth
rates are becoming less important in recent years in terms of FDI location. However, our
results are different from a number of empirical studies on FDI location (e.g. Cunningham,
1975; Swedenborg, 1979; Dunning, 1980; Scaperlanda et al., 1983; Papanastassiou and
Pearce, 1990; Zitta & Powers, 2003; Head and Mayer, 2004; Tahir & Larimo, 2005) who all
Page 203
188
concluded that the market potential of the host countries has a significant and positive effect
on attracting FDI, and has a major impact on the FDI decision-making process.
Economic factors have a mean score of 3.1369. However, the t-test shows that this is
statistically less than 3.0 (p > 0.05) (t41 = 1.159, p = 0.253). Hence, economic factors are not
perceived to play an important role in FDI location decisions in the Saudi petrochemical
industry. Our result support the findings of Ho & Lau (2007) who concluded that the
importance of economic factors in the host country for FDI location decisions will be greater
when the investor plans to expand its market share in the host country in which their
investment is located. Otherwise, when the target markets are outside the host country where
the investment is located, such as is the case with the petrochemical FDI in Saudi Arabia, the
economic environment of the host country will have a minimal influence and a low priority in
terms of FDI location decisions. Our results also confirm the findings of Abdel-Rahman
(2002) who indicated that economic factors influence the location decisions with regard to
FDI in Saudi Arabia. However, our results are different from those of Dunning (2004) who
pointed out that the location decisions for FDI will be influenced by the host-country‘s
economic situation, and will play a major role on shaping the FDI location motivations.
Infrastructure and technological factors have a mean score of 3.9082. The t-test shows that
this is significantly (p < 0.05) more than 3.0 (t41 = 16.247, p = 0.000). Thus, infrastructures
and technological factors play an important role in the location decisions with regard to FDI
in the Saudi petrochemical industry. Our results confirm the findings of Ho & Lau (2007)
who stressed that the importance of infrastructure and technological factors in terms of FDI
location decisions depends on the type of industry under consideration, as each industry has a
different priority with regard to infrastructure levels. For example, heavy industry such as the
petrochemical industry will require a high level of infrastructure in the host country in order
to move its products to the global markets. Consequently, the level of infrastructure in the
host country is a very important factor for that industry. Moreover, our result confirm the
result of Jones & Wern (2006) who concluded that infrastructure factors is a potential
attractor with regard to FDI inflow, as it improves the distribution of goods and services, the
ability of the company to recruit labour and their ability to communicate with suppliers and
purchasers. Furthermore, our results are in line with those of Mina (2007) who concluded that
infrastructure development is expected to facilitate oil exploration and extraction, and
therefore to have a positive influence on FDI flows.
Page 204
189
Political and legal factors have a mean score of 3.7024. The t-test shows that this is
significantly (p < 0.05) more than 3.0 (t41 = 10.782, p = 0.000). Hence, political and legal
factors are perceived to play an important role in FDI location decision in terms of the Saudi
petrochemical industry. Our results confirm the studies of researchers such as Basi, 1963;
Stevens, 1969; Weigel, 1970; Root and Ahmed, 1979; Levis, 1979; Schneider and Frey, 1985
and Wei, 1997, which have mostly focused on FDI in developing countries. These
researchers have found political factors to be critical determinants of FDI location decisions.
Our results are in line with the findings of Ho & Lau (2007) who showed that FDI is sensitive
to political factors when it comes to choosing the location for investment, and this affects the
attractiveness of a host country for FDI. FDI investment in a host country normally involves
large obligations in terms of capital that could be recovered if the investment is launched
successfully, and the payback period takes many years. A high level of political risk could
negatively extend the payback period, or even make the investment critical, as all the invested
capital could easily be lost. However our results are different from the findings of many
studies (e.g. Green and Cunningham, 1975; Mody and Wheeler, 1992) who concluded that
political factors are not important as FDI location factors, and that they rank lower than other
location factors.
Social and cultural factors have a mean score of less than 3.0 (mean = 2.190). The t-test
shows that the mean score is significantly (p < 0.05) less than 3.0 (t41 = -7.896, p = 0.000).
Thus, social factors are not perceived to be important factors with regard to FDI location
decision in the Saudi petrochemical industry.Our results confirm the findings of Johnson and
Vahlne (1977) who concluded that firms will not be affected by the cultural factors of the
host country and that cultural factors will play a limited role in the location choice for FDI.
Moreover, other studies are in line with our results such as those of Levitt (1983) and Sethi,
Guisinger, Phelan & Berg (2003) who found that globalization has a minimal effect in terms
of social and cultural factors, as consumer tastes in different countries have been unified due
to globalization. Moreover, MNEs may be forced to ignore the disadvantages of the cultural
factors with regard to the developing country, in favour of the advantages of their cost
factors, making them consider these locations to be the best locations for their operations.
However our results are different from the findings of Dunning (1998), Leung et al. (2005),
Kirkman (2006), Flores & Aguilera (2007), Bahardwaj and Dietz & Beamish (2007), all of
whom concluded that social and cultural factors will have a significant impact on FDI
Page 205
190
location.
Table 6.6 Major Factors’ Importance Means
One-Sample Statistics
Location Factors N Mean Std. Deviation Std. Error Mean
Cost factors 42 4.040 .4697 .0725
Market factors 42 2.440 .6914 .1067
Economic factors 42 3.137 .7655 .1181
Infrastructure and technological factors 42 3.908 .3623 .0559
Political and legal factors 42 3.702 .4222 .0651
Social and cultural factors 42 2.190 .6644 .1025
Table 6.7 T-Test for Major Factors’ Importance
One-Sample Test
Location Factors Test Value = 3
95% Confidence Interval of the
Difference
t df Sig. (2-tailed) Mean Difference Lower Upper
Cost factors 14.345 41 .000 1.0397 .893 1.186
Market factors -5.244 41 .000 -.5595 -.775 -.344
Economic factors 1.159 41 .253 .1369 -.102 .375
Infrastructure and technological factors 16.247 41 .000 .9082 .795 1.021
Political and legal factors 10.782 41 .000 .7024 .571 .834
Social and cultural factors -7.896 41 .000 -.8095 -1.017 -.602
6.2.2.2 Cost Factors’ Importance
Table 6.8 summarises the importance of cost factors including the mean, standard deviation
and standard error for each factor. Table 6.9 shows the t-test for the importance of the cost
factors. The importance of the cost factors based on the t-tests are listed below:
1. Energy costs
2. Return on investment
3. Cost of raw materials
4. Transportation/logistic costs
The unimportant cost factors are:
5. Production site costs (land costs)
6. Labour costs
Most of the cost factors are considered to be important factors with a mean of over 3.0,
Page 206
191
including energy costs, return on investment, the cost of raw materials and
transportation/logistic costs. However, factory site costs and labour costs received a mean of
less than 3.0, which means that they are considered to be unimportant factors with regard to
the location decisions for FDI in the Saudi petrochemical industry.
Factory site costs has a mean score above 3.0 (mean = 3.29). However, the t-test shows that
this is statistically insignificant (p > 0.05) since it is less than 3.0 (t41 = 1.909, p = 0.063).
Thus, the factory site cost factor is not perceived to be an important factor for location
decision with regards to Saudi petrochemical FDI. Our results support the findings of Deloitte
& Touche‘s (2002) study of 130 companies from around the world which concluded that
factory site cost plays a relatively less important role for FDI location decisions. However our
results are different from the findings of Dunning (1998) who suggested that the motives for
FDI location decisions are influenced by the industry involved in the investment process,
therefore manufacturing FDI would give a priory to factory site costs when choosing a host
country.
Labour costs have a mean score of less than 3.0 (mean = 2.62). The t-test shows that the
mean score is significantly (p < 0.05) less than 3.0 (t41 = -2.284, p = 0.028). Hence, labour
costs are not perceived as being an important factor for the location decision with regards to
the Saudi petrochemical FDI. Our results confirm the findings of Wheeler and Mody ( 1992)
and Hill and Munday (1994) who concluded that labour cost will play an unimportant role in
terms of FDI location, and found no connection between the cost of labour and FDI location
decisions. Our result also confirm the study by Gilmore, O'Donnel, Carson & Cummins
(2003) who studied the FDI location motivations in two countries - Northern Ireland and
Bahrain - in that they share comparable economic and political features. The study compared
the views of executives in foreign companies who had invested in the two countries. The
findings revealed that the respondents in the two countries were relatively different.
However, in both countries, low labour costs were not considered as important factors for
FDI location. Our results are different from the findings of Ho & Lau (2007) who concluded
that labour costs are a variable that could influence FDI location, and that low wage rates
could be an attractive labour force factor, especially for labour-intensive investment.
Moreover there are Kang and Lee‘s results (2007) which suggest that a significant part of
multinational activity tends to take the form of firms shifting a part of their production
process to low-cost labour locations. Our results are opposite to the findings of Banga (2003)
Page 207
192
who concluded that labour costs may significantly influence the choice of an investment
location for the resource-seeking and efficiency-seeking companies, by lowering the labour
costs of their operations in the host country.Our results are different from the findings of
many scholars eg. Servan-Schriber (1986), Austin (1990), Rolfe & White (1992), Miller
(1993), Zitta & Powers (2003), MacCarthy & Atthirawong (2003), Campos & Kinoshita
(2003) and Flores & Aguilera (2007), all of whom concluded that labour costs in the host
country will play an important role in terms of FDI location decisions, especially with regard
to developing countries.
The transportation and logistics cost factor has a mean score above 3.0 (mean = 4.12). The t-
test shows that this is significantly (p < 0.05) more than 3.0 (t41 = 9.400, p = 0.000). Hence,
the transportation and logistics cost factor is perceived to play an important role on FDI
location decisions in the Saudi petrochemical industry.Our results are in line with the findings
of many scholars such as Root and Ahmed (1978), Loree and Guisinger (1995) and Cheng
and Kwan (2000), who concluded that transportation costs influence FDI location decisions
through the expected cost of operation in a particular host country. That is, the cost of
moving raw and finished materials to and from the MNE operative centres and their target
markets. If the products are targeted for export, the costs of producing the product and the
costs and reliability of transporting them to the world market are highly crucial. Our results
confirm the findings of Gilmore, O'Donnel, Carson and Cummins (2003) who concluded that
transportation and logistics costs are considered to be key cost factors for MNCs when they
choose their investment location. Our results confirm the findings of Dunning (2004) who
concluded that MNEs in developing countries are attracted to infrastructures that will support
their investments and would help improve the FDI operations. The results also confirm the
findings of Nunnenkamp (2002) who claimed that, as a result of the globalization, new
factors have become particularly important with regard to FDI location decisions, such as
infrastructure costs in the host country.
The raw material costs factor has a mean score above 3.0 (mean = 4.60). The t-test shows that
this is significantly (p < 0.05) more than 3.0 (t41 = 20.810, p = 0.000). Hence, the raw
material costs factor is perceived to play an important role in terms of FDI location decisions
in terms of the Saudi petrochemical industry. Our results confirm the findings of Dunning
(1988) and Cleeve (1997; 2009) who concluded that the costs of raw materials in the host
country have a strong effect on the location of FDI. Our results are also in line with the
Page 208
193
UNCTAD results (2006) in that the pull factors in the host country such as the costs of raw
materials play an important role in the location of FDI. The results also confirm the results of
Deloitte & Touche (2002) who studied 130 companies from around the world on the relative
importance of location factors from the point of view of executives. Here, the cost of raw
materials was the one of the most highly rated factors among the twenty factors in the survey.
However, our results are in contrast to those of Mellahi, Gurmat, Frynas & Al-Bortmani
(2003), who studied FDI in Oman and found that low-cost inputs are not important location
factors for FDI in Oman.
The return on investment factor has a mean score above 3.0 (mean = 4.74). The t-test shows
that this is significantly (p < 0.05) more than 3.0 (t41 = 22.674, p = 0.000). Hence, the return
on investment factor is also perceived to play an important role in terms of FDI location
decisions in the Saudi petrochemical industry. Our results are line with a study by Cheng and
Kwan (2000) and by Campos and Kinoshita (2003) who believe that the expected return on
investment of a location will affect the location decision of the foreign investor. The
profitability of the investment would be influenced by the target location, the industry, and
the investment motives. Our results also confirm the study by Ng & Tuan (2003) who
concluded that FDI will identify the most profitable investment location for their foreign
investment by choosing from a variety of potential investment locations, and they would
choose the location that give them the highest return on investment. Our results confirm the
findings of Kang & Lee (2007) in that MNEs consider the return on investment factor as one
the most important location factors when choosing a location for their investment. MNEs
have shifted from direct export to local production in order to lower costs. Local production
will bring down production costs, thereby increasing profit margins and return on investment
by lowering transport and other related production costs, and avoiding trade barriers and non-
trade barriers. Our results are also in line with Horstman and Markusen (1987) and Markusen
and Venables (1999) who pointed out that in large markets there would be many local firms
that would increase the level of competition by lowering the prices which, in turn, would
affect profit margins. Therefore, MNEs start to locate their operations in local markets
instead of exporting, in order to lower production costs and therefore increase their profit
margins. Our results confirm the results of Cohen (2007) who concluded that the critical
objective for firms when expanding overseas is to find a location that gives them the highest
return on investment with the least risk, and that firms focus on the return on investment in
the foreign market, and what the profit margin will be compared to other locations. However,
Page 209
194
our results are different from the findings of Asiedu (2001) who concluded that return on
investment is not considered to be an important factor when it comes to attracting FDI in
Sub-Saharan Africa.
The energy costs factor has a mean score above 3.0 (mean = 4.88). The t-test shows that this
is significantly (p < 0.05) more than 3.0 (t41 = 37.191, p= 0.000). Hence, the energy costs
factor is perceived to play an important role in terms of FDI location decisions in the Saudi
petrochemical industry. As the energy price is rising and there is a rash a historically high
prices, the energy costs will be a critical and major factor for a heavy industry like
petrochemical, and it will play a major factor in terms of FDI location decisions. Our results
confirm the findings of the results of Deloitte & Touche (2002) and Banga (2003) who
concluded that energy costs play an important role for FDI when choosing a new location for
their investment.This result is in line with that of Cleeve (2009) who concluded that a firm‘s
decision to invest abroad will be affected by certain natural resources factors, among them
the energy costs in the host country.
Table 6.8 Cost Factors’ Importance Means
One-Sample Statistics
Location Factors N Mean Std. Deviation Std. Error Mean
Factory site costs 42 3.29 .970 .150
Labour costs 42 2.62 1.081 .167
Transportation/logistics costs 42 4.12 .772 .119
Raw material costs 42 4.60 .497 .077
Return on Investment 42 4.74 .497 .077
Energy costs 42 4.88 .328 .051
Table 6.9 Cost Factors’ Importance T-Test
One-Sample Test
Location Factors
Test Value = 3
95% Confidence Interval of
the Difference
t df Sig. (2-
tailed)
Mean
Difference Lower Upper
Factory site costs 1.909 41 .063 .286 -.02 .59
Labour costs -2.284 41 .028 -.381 -.72 -.04
Transportation/logistics costs 9.400 41 .000 1.119 .88 1.36
Raw material costs 20.810 41 .000 1.595 1.44 1.75
Return on Investment 22.674 41 .000 1.738 1.58 1.89
Energy costs 37.191 41 .000 1.881 1.78 1.98
Page 210
195
6.2.2.3 Market Factors’ Importance
Table 6.10 summarises the importance of market factors, including the mean, standard
deviation and standard error for each factor. Table 6.11 shows the t-test for the importance of
the market factors. All market factors were perceived to be unimportant. They are:
1. Large host market
2. Market growth in the host market
3. Competition in the host market
4. Market familiarity
All market factors received an average response rate of less than 3.0, which indicates that
they are considered to be unimportant factors in terms of FDI location decisions in the Saudi
petrochemical industry. These factors included market familiarity, the level of competition in
the host market, market growth in the host country and the size of the host market.
The size of the host market factor has a mean score below 3.0 (mean = 2.14). The t-test
shows that the mean score was significantly (p < 0.05) less than 3.0 (t41 = -6.589, p = 0.000).
Hence, a large host market is not perceived to be an important factor in the location decision
for FDI in the Saudi petrochemical industry. Our result support the findings of Mina (2007)
who studied the factors that influenced the location decisions for FDI in Gulf State countries
including Saudi Arabia, Bahrain, Oman, Kuwait, and the United Arab Emirates. He found
that market size in these countries was not an important factor in terms of FDI location
decisions. He concluded that, due to the small population sizes of the Gulf countries,
economies of scale may not be realized, and FDI inflows may be discouraged. Therefore, the
influence of market size on FDI inflows may be ambiguous. Similarly to our findings, Cleeve
(2009) has shown that market size has been a critical determent of FDI location in Sub-
Saharan Africa. However, our results are in contrast with those of Zhou, Delios & Yang
(2002) who showed that the market-related factors on FDI location decisions are that large
markets grant benefits such as scale economies and high revenue generation. Our results are
different from those of Chakrabarti (2001), Blonigen (2005) and Flores & Aguilera (2007),
all of whom support the influence of market size on FDI location choice. Similarly, in
contrast to our results, Moosa and Cardak (2006), using cross-section data on 138 countries
over the period 1998–2000, found evidence that supports the importance of market size for
FDI location decisions. Our result is different from the finding of Frenkel et al. (2004) who
Page 211
196
used data for the period 1992–2000 on bilateral FDI flows from G5 countries to 22 emerging
markets, including Asian, Central European, and Latin American countries, and found that
host country market size is an important factor in terms of FDI location. However, when
separating the emerging markets into regions in the form of Latin America, Asia, and Central
Europe, they found that market size matters only in Latin America and Central Europe. In
addition, Carstensen and Toubal (2004), using panel data on FDI flows from 10 OECD home
countries into 7 host CEECs in the period 1993–1999, found different result to our study in
terms of supportive evidence of the importance of market size on FDI location decisions. Our
results are different from that of Head and Mayer (2004), who found that those regions
surrounded by large markets tend to attract more FDI.
The market growth factor in the host market has a mean score of less than 3.0 (mean = 2.19).
The t-test shows that the mean score is significantly (p < 0.05) less than 3.0 (t41 = -4.928, p =
0.000). Hence, the market growth in terms of host market factors is not perceived to be an
important factor in location decisions with regard to FDI in the Saudi petrochemical industry.
Our result confirms the findings of Scaperlanda and Mauer (1969) who found that the growth
rate of the market in a hot country did not affect the FDI location decision. However, our
results are in contrast to those of Billington, (1999), Gilmore, O'Donnel, Carson & Cummins
(2003) and Jones & Wern (2006) who concluded that market growth has a positive effect on
FDI location, and that the expansion pressures into other markets to gain greater sales or
market share have influenced MNEs when it comes to entering new large markets to
overcome the maturity of home markets. Therefore, market growth may influence FDI
location, as firms will enter markets in which they can grow.
The factor of competition in terms of the host market has a mean score of less than 3.0 (mean
= 2.55). The t-test shows that the mean score is significantly (p < 0.05) less than 3.0 (t41 = -
4.156, p = 0.000). Hence, a large degree of competition in terms of the host market is not
perceived to be an important factor in the location decision for FDI in the Saudi
petrochemical industry. Our results confirm the findings of Buckley, Devinney & Louvriere
(2007) who concluded that competition in the host market is among the least important
factors for FDI location decision making. However, our results are different from the findings
of Caves (1996) and Dunning (1998) who concluded that competition in the host market will
play an important role on FDI location decisions. Our results are in contrast with those of The
Economist Intelligence Unit (2002) who studied the most important factors that affect MNE‘s
Page 212
197
executives location decisions for FDI, and found that competition in the host country is one
of the most important location factors that will influence the future location of FDI in the
coming years.
The market familiarity factor has a mean score of less than 3.0 (mean = 2.88). The t-test
shows that statistically this is not significantly (p > 0.05) less than 3.0 (t41 = -0.777, p =
0.442). Hence, the market familiarity factor is not perceived to be an important factor in
terms of the location decision for FDI in the Saudi petrochemical industry. Our results
confirm the findings of Buckley, Devinney & Louvriere (2007) who found that establishing a
relationship and market familiarity in the host country are among the least important factors
for FDI when choosing an investment location. However our results are different from the
findings of Ramady & Saee (2007) who studied FDI inflows to Saudi Arabia between 1984
and 1997, and found that the fear of foreign companies with regard to entering the Saudi
market alone or on the part of those who are unfamiliar with the Saudi market, negatively
affected FDI inflows and played an important role on FDI location in Saudi Arabia.
Similarly, our results are in contrast with those of Cleeve (2004; 2009) who found that
familiarity and knowledge of the host country are important factors in terms of location
decisions for FDI. Our results are different from those of Randoy & Dibrell (2002) who
concluded that location familiarity and market attractiveness would play an important role in
the location choice for MNEs, and if managers recognize that a particular location is
unfamiliar, they may not choose that location for their investment.
Table 6.10 Market Factors’ Importance Means
One-Sample Statistics
Location Factors N Mean Std. Deviation Std. Error Mean
Large host market 42 2.14 .843 .130
Market growth in the host market 42 2.19 1.065 .164
Competition in the host market 42 2.55 .705 .109
Market familiarity 42 2.88 .993 .153
Page 213
198
Table 6.11 Market Factors’ Importance T-Test
One-Sample Test
Location Factors
Test Value = 3
95% Confidence Interval of
the Difference
t df Sig. (2-
tailed)
Mean
Difference Lower Upper
Large host market -6.589 41 .000 -.857 -1.12 -.59
Market growth in the host market -4.928 41 .000 -.810 -1.14 -.48
Competition in the host market -4.156 41 .000 -.452 -.67 -.23
Market familiarity -.777 41 .442 -.119 -.43 .19
6.2.2.4 Economic Factors’ Importance
Table 6.12 summarises the importance of economic factors, including the mean, standard
deviation, and standard error for each factor. Table 6.13 shows the t-test for the economic
factors‘ importance. The importance of economic factors based on the t-test are listed below:
1. Economic stability
2. Exchange rates
The unimportant factors are:
3. Economic growth
4. Local financial support
Economic stability and exchange rates are considered as important factors in terms of
location decisions related to the Saudi petrochemical industry, with a mean of more than 3.0.
Economic growth and local financial support revealed a mean of less than 3.0, which means
that they are considered to be unimportant factors in terms of the location of FDI in the
petrochemical industry.
The economic stability factor has a mean score greater than 3.0 (mean = 3.62). The t-test
shows that this is significantly (p < 0.05) more than 3.0 (t41 = 3.566, p = 0.001). Hence, the
economic stability factor is perceived to play an important role in terms of FDI location
decisions in the Saudi petrochemical industry. Our results support the findings of Schneider
and Frey (1985), Wheeler and Mody (1992), Tsai (1994), Jackson and Markowski (1995),
Taylor (2000) and more recently, Banga (2003), who all support the positive effect of
Page 214
199
economic stability on the location choice with regard to FDI. Our results are also in line with
UNCTAD (1998) which shows that monetary and fiscal policies, which reflect economic
stability, will influence the location destinations for FDI. Our results confirm the results of
Tahir and Larimo (2005) who concluded that, in order to attract FDI, economic stability is an
important factor. Our results also confirm the findings of Mellahi, Gurmat, Frynas & Al-
Bortmani (2003) who studied FDI in Oman, and found that economic stability is one of the
most important FDI location factors.
The economic growth factor has a mean score of less than 3.0 (mean = 2.57). The t-test
shows that the mean score is significantly (p < 0.05) less than 3.0 (t41 = -3.130, p = 0.003).
Hence, the economic growth factor is not perceived to be an important factor in terms of FDI
location decisions in the Saudi petrochemical industry. Our results confirm the findings of Ho
& Lau (2007) who believed that the importance of economic growth in the host countries for
FDI location decisions will be greater when the investor plans to expand his market share in
the host country in which their investment is located. Otherwise, when the target markets are
outside the host country where the investment is located, the economic growth of the host
country will have a minimal influence and will have low priority in terms of FDI location
decisions. Our results also confirm the findings of Abdel-Rahman (2002) who indicated that
the economic growth factor is not a significant factor for FDI inflows into Saudi Arabia.
However, our results are different from those of Lim (2001), who argued that FDI location
decisions are positively affected by the economic growth of the host country. Our results are
also in contrast with the findings of Wheeler & Mody (1992) and Aliber (1993) who argued
that a strong macroeconomic policy is a key factor that would affect FDI location decisions,
and they believed that there is positive relationship between the rate of growth of the host
country and the FDI inflow.
The exchange rates factor has a mean score greater than 3.0 (mean = 3.62). The t-test shows
that this is significantly (p < 0.05) more than 3.0 (t41 = 4.287, p = 0.000). Hence, the
exchange rates factor is perceived to play an important role in terms of FDI location decisions
in the Saudi petrochemical industry. Our results confirm the findings of Aliber (1970), Zitta
& Powers (2003) and Gilmore, O'Donnel, Carson & Cummins (2003) who concluded that
FDI location decisions are affected by the interest rates in the host country. Our results also
support the results of Froot & Stein (1989) who believed that a devaluation of the host
country‘s currency will have a positive impact on FDI profitability, and may influence the
Page 215
200
FDI inflow. However, our results are in contrast with those of UNCTAD (1998) which
concluded that the effects of interest rates on FDI location destinations is not important.
The local financial support factor has a mean score of less than 3.0 (mean = 2.74). The t-test
shows that statistically this is not significantly (p > 0.05) less than 3.0 (t41 = -1.636, p =
0.109). Hence, the local financial support factor is not perceived to be an important factor in
terms of the FDI location decisions in the Saudi petrochemical industry. Our results confirm
the findings of UNCTAD (1998) which concluded that the effects of local financial support
on FDI location destinations are less than that those on domestic investment, because MNEs
in general have a better choice of sources of financing for their international operations, and
they are not limited to the local market. Our results support the findings of Abdel-Rahman
(2002) who indicated that the local financial support factor in Saudi Arabia is not an
important factor for FDI location. However, our results are in contrast with Zitta & Powers
(2003) who showed the need for capital support from the local market was considered to be
an important location factor for FDI in the United States.
Table 6.12 Economic Factors’ Importance Means
One-Sample Statistics
Location Factors N Mean Std. Deviation Std. Error Mean
Economic stability 42 3.62 1.125 .174
Economic growth 42 2.57 .887 .137
Exchange rates 42 3.62 .936 .144
Local financial support 42 2.74 1.037 .160
Table 6.13 Economic Factors’ Importance T-Test
One-Sample Test
Location Factors
Test Value = 3
95% Confidence Interval of the Difference
t df Sig. (2-tailed) Mean Difference Lower Upper
Economic stability 3.566 41 .001 .619 .27 .97
Economic growth -3.130 41 .003 -.429 -.71 -.15
Exchange rates 4.287 41 .000 .619 .33 .91
Local financial support -1.636 41 .109 -.262 -.59 .06
6.2.2.5 Infrastructure and Technological Factors
Table 6.14 summarises the importance of infrastructure and technological factors, including
the mean, standard deviation and standard error for each factor. Table 6.15 shows the
Page 216
201
importance of the infrastructure and technological factors. Most of the infrastructure and
technological factors, including the availability of raw materials, access to reliable and
cooperative suppliers, the level of infrastructure, the availability of factory sites (land), high
industrial concentration (clustering) and geographical proximity, are considered to be
important factors in terms of location decisions in the petrochemical industry, in that each
factor has a mean of over 3.0. However, the availability of a well-qualified workforce
received an average response rate of less than 3.0 and it is considered to be an unimportant
factor in terms of FDI location decisions in the Saudi petrochemical industry.
The level of infrastructure factor has a mean score of more than 3.0 (mean = 4.31). The t-test
shows that this is significantly (p < 0.05) more than 3.0 (t41 = 18.138, p = 0.000). Hence, the
level of infrastructure factor is perceived to play an important role in terms of FDI location
decisions in the Saudi petrochemical industry. Our results confirm the findings of Jones &
Wern (2006) and Ho & Lau (2007) who concluded that the level of infrastructure in the host
country plays an important role on FDI location decisions. Our results are in line with Biswas
(2002) who studied FDI in the US from 44 countries during the period 1983 to 1990, and
concluded that the level of infrastructure in the host country is one of the most important
factors in attracting FDI. Our results confirm the findings of Caves (1996), Dunning (1998)
and Cleeve (2009) who concluded that resources-seeking and efficiency-seeking FDI will be
influenced by the level of infrastructure in the host country. Our results also support the
findings of the Economist Intelligence Unit (2002) which studied the most important factors
that affect the location decision for FDI, and indicated that the level of infrastructure in the
host country is one of the most important location factors that will influence the location of
FDI in the coming years. Our results support the findings of UNCTAD (1996) and
Nunnenkamp (2002) who concluded that new factors have become more important with
regard to FDI location, among them the level of infrastructure in the host country. Our results
are in line with those of Mina (2007) who studied the FDI inflow to the GCC countries, and
how the location factors help attract FDI inflows, and found that the quality of the
infrastructure attracts FDI inflows. However, our results are different from those of Asiedu
(2001), who found that infrastructure quality in Africa is not considered to be important
enough to attract FDI.
The high industrial concentration (clustering) factor has a mean score of more than 3.0 (mean
= 3.86). The t-test shows that this is significantly (p < 0.05) more than 3.0 (t41 = 8.591, p =
Page 217
202
0.000). Hence, the high industrial concentration (clustering) factor is perceived to play an
important role in FDI location decisions in terms of the Saudi petrochemical industry. Our
results confirm the findings of Jones & Wern (2006) who believed that a high industrial
concentration in the host country is an important factor when it comes to attracting FDI, as
the level of industrialisation is expected to be associated with a high level of FDI, since a
country or region that is highly industrialised will have a large number of firms and a
clustering of specific industries, which potentially increases the possibility of beneficial
spillover. Similarly to our results, Wheeler and Mody (1992), Billington (1999), Wei et al.
(1999) and Campos and Kinoshita (2003) all found a significant positive effect between high
industrial concentration (clustering) and FDI location, which they attribute to agglomeration
economies. Our results confirm the study by Ng & Tuan (2003), Devereux (2003) and Jones
& Wern (2006) who also suggested that firms tend to locate near to other firms in the same
industry to benefit from the spillover of the agglomerations effect, and showed in their study
that agglomeration economies will significantly affect the FDI location decision. Our results
confirm the findings of Bensebaa (2005) who examined the determinants of FDI at a regional
level in Hungary. More particularly, he assessed the importance of agglomeration effects
among them, and found that countries with higher labour availability, market demand and
clustering of industry, tended to attract more FDI.
The availability of a well-qualified workforce factor has a mean score of less than 3.0 (mean
= 2.64). The t-test shows that the mean score is significantly (p < 0.05) less than 3.0 (t41 = -
3.344, p = 0.002). Hence, the availability of a well-qualified workforce factor is not perceived
to be an important factor in terms of the location decisions for FDI in the Saudi petrochemical
industry. Our results support the findings of Achoui (2009) who believed that most of the
Gulf countries including Bahrain, Kuwait, Oman, Qatar, Saudi Arabia and the United Arab
Emirates are very rich in natural resources such as oil and gas. However, surprisingly, all
these countries experience a shortage of skilled and unskilled workers, which has led to a
high dependence on foreign labour due to the low population size, and an insufficient
educational system in these countries. Therefore, the availability of a well-qualified
workforce in these countries is not an important factor for FDI as MNEs rely on expatriates
for their operations. Our results also support the result obtained by SAGIA (2008) which
concluded that most of the employees in the private sector in Saudi Arabia are expatriates
since they make up 88.4% of the labour force in this sector. Therefore, FDI considers the
availability of a well-qualified workforce to be not important in Saudi Arabia. Our results
Page 218
203
also confirm those of Ramadi (2005), who concluded that the private sector in Saudi Arabia
prefers to employ expatriates to Saudis nationals, and normally FDI satisfy their needs for
workers from specialists from outside the host country. However, our results are different
from those of Mina (2007) who studied the FDI location motivation in the GCC countries,
and showed that the availability and quality of labour are important with regard to FDI
location decisions. Our results are also different from those of Jones & Wern (2006) who
stated that the availability of a well-qualified work force in a host country is expected to have
a positive effect on FDI location decisions, because a host country with a higher availability
of a skilled workforce will provide foreign investors with a group of workers to choose from.
Our results are in contrast to those of Haaland &Wooton (2003) who examined the
availability of a well-qualified workforce effect on FDI location decisions and revealed that
the availability of a well-qualified workforce is a strong positive determinant of FDI
locations.
The access to reliable and cooperative suppliers factor has a mean score greater than 3.0
(mean = 4.33). The t-test shows that this is significantly (p < 0.05) more than 3.0 (t41 = 9.884,
p = 0.000). Hence, the access to reliable and cooperative suppliers‘ factor is perceived to play
an important role in terms of FDI location decisions in the Saudi petrochemical industry. Our
results confirm the findings Deloitte & Touche (2002) who concluded that access to reliable
and cooperative suppliers is one of the most important FDI location factors. Our results also
support those of Hong & Chen (2001) who concluded that access to reliable and cooperative
suppliers is one of the major FDI location factors in China. Our results confirm the findings
of Narula and Dunning, (2000), Zaheer and Manrakhan (2001), Makino et al. (2002) and
Galan, Benito & Vincente (2007) who suggested that MNEs expand into new cross-border
markets for several reasons, all of which are related to the intense competitive global market,
and that access to new suppliers is one of the most important location factors.
The availability of factory sites (land) factor has a mean score greater than 3.0 (mean = 4.02).
The t-test shows that this is significantly (p < 0.05) more than 3.0 (t41 = 10.978, p = 0.000).
Hence, the availability of the factory sites (land) factor is perceived to play an important role
in terms of FDI location decisions in the Saudi petrochemical industry. Our results confirm
the findings of Dunning (1998) who suggested that the motives for FDI location decisions are
influenced by the industry involved in the investment process, and therefore manufacturing
FDI would need large investments in fixed assets. Consequently, the availability of factory
Page 219
204
sites (land) would an important location factor for FDI in the manufacturing industry. Our
results also confirm the findings of Deloitte & Touche (2002) who studied 130 companies
from around the world and found that the availability of factory sites (land) factor is
considered to be one of the most important location factors for FDI.
The availability of raw materials factor has a mean score greater than 3.0 (mean= 4.69). The
t-test shows that this is significantly (p < 0.05) more than 3.0 (t41 = 23.414, p = 0.000).
Hence, the availability of raw materials factor is perceived to play an important role with
regard to FDI location decisions in the Saudi petrochemical industry. Our results confirm the
findings of Mmieh and Owusu-Frimpong (2004) who showed that vertical FDI or ‗raw
material-seeking‘ FDI, will locate their operations near supplies of raw materials. Our results
also confirm the findings of Gilmore et al. (2003) who stressed the importance of the
availability of resources, in particular raw materials, as these are generally recognised as
being very important location factors that strongly affect FDI location decisions. Our results
are in line with those of Cleeve (2009) who also believed that FDI location decisions in
developing countries is motivated by the availability of natural resources. Our results are
similar to those of Deloitte & Touche (2002) who found that the availability of raw materials
in the host country is one of the most important location factors in terms of FDI. However,
our results are in contrast with those of Batchler and Clement (1990) who showed different
findings, in that they believed that the availability of raw materials has had a relatively lesser
impact on FDI location decisions, because raw materials now are affected by globalisation
and therefore are widely sourced on a global basis. Our results are different from those of
Mellahi et al. (2003) who studied FDI in Oman, and found that the availability of raw
materials is not an important location factor for FDI in Oman.
The geographical proximity factor has a mean score above 3.0 (mean = 3.50). The t-test
shows that this is significantly (p < 0.05) more than 3.0 (t41 = 3.532, p = 0.001). Hence, the
geographical proximity factor is perceived to play an important role in terms of FDI location
decisions in the Saudi petrochemical industry. Our results confirm the findings of Campos
and Kinoshita (2003) who believed that proximity to the home country is an important factor
in explaining the volume of trade flows between countries. Our results also support those of
Kravis & Lipsey (1982) and Ng & Tuan (2003) who showed that geographical proximity and
the strategic location of the host country is considered to be a key factor for FDI location
decisions. Our results are in line with those of Hong & Chen (2001) who concluded that
Page 220
205
geographical location is one of the major FDI location factors in China.
Table 6.14 Infrastructure and Technological Factors’ Importance T-Test
One-Sample Statistics
Location Factors N Mean Std. Deviation Std. Error Mean
Level of infrastructure 42 4.31 .468 .072
Clustering 42 3.86 .647 .100
Availability of qualified work force 42 2.64 .692 .107
Access to reliable and cooperative suppliers 42 4.33 .874 .135
Availability of factory sites 42 4.02 .604 .093
Availability of raw materials 42 4.69 .468 .072
Geographical proximity 42 3.50 .917 .142
Table 6.15 Infrastructure and Technological Importance T-Test
One-Sample Test
Location Factors
Test Value = 3
95% Confidence Interval
of the Difference
t df Sig. (2-
tailed)
Mean
Difference Lower Upper
Level of infrastructure 18.138 41 .000 1.310 1.16 1.46
Clustering 8.591 41 .000 .857 .66 1.06
Availability of qualified work force -3.344 41 .002 -.357 -.57 -.14
Access to reliable and cooperative suppliers 9.884 41 .000 1.333 1.06 1.61
Availability of factory sites 10.978 41 .000 1.024 .84 1.21
Availability of raw materials 23.414 41 .000 1.690 1.54 1.84
Geographical proximity 3.532 41 .001 .500 .21 .79
6.2.2.6 Political and Legal Factors’ Importance
Table 6.16 summarises the importance of political and legal factors, including the mean,
standard deviation and standard error for each factor. Table 6.17 shows the importance of
these factors. Political and legal factors including political stability, tax reductions in the host
country and benign environmental legislation for FDI and are considered to be important
factors in terms of FDI location decisions in the petrochemical industry, in that they received
a mean of more than 3.0. However, despite the fact that location factors including
international trade agreements, diplomatic ties with the host country and legal and regulatory
system received an average response rate of more than 3.0, the t-test shows that they are
considered to be unimportant factors in terms of FDI location decisions in the Saudi
petrochemical industry.
Page 221
206
The political stability factor has a mean score above 3.0 (mean = 4.45). The t-test shows that
this is significantly (p < 0.05) more than 3.0 (t41 = 17.112, p = 0.000). Hence, the political
stability factor is perceived to play an important role in terms of FDI location decisions in the
Saudi petrochemical industry. Our results confirm the findings of many studies which have
mostly focused on FDI in developing countries, which have found political stability to be a
critical determinant of FDI (e.g., Basi, 1963; Stevens, 1969; Weigel, 1970; Root and Ahmed,
1979; Levis, 1979; Schneider and Frey, 1985; Wei,1997). Our results are also in line with
those of Dunning (1996) who concluded that risks in host markets, especially political
stability, is commonly cited as a cause for the restriction of FDI inflows. Our results are also
in line with those of Schneider and Frey (1985), Bollen et al. (1982) and Mellahi et al. (2003)
who noted that political instability significantly affects location decisions negatively, and
reduces the inflow of FDI. Our results also confirms the findings of Mossa (2002) who
indicated that a lack of political stability in the host country discourages inflows of FDI.
However, our results are different from those of Green and Cunningham (1975) and Mody
and Wheeler (1992) who found that political stability, which is among political factors, is not
an important FDI location factor, and they rank it lower than other location factors. Our
results are also different from those of UNCTAD (1998) which concluded that political
stability is a requirement for FDI, but is not a strong motive for inward FDI.
The international trade agreements factor has a mean score above 3.0 (mean = 3.10).
However, the t-test shows that this is statistically not significantly (p > 0.05) greater than 3.0
(t41 = 0.662, p = 0.512). Hence, the international trade agreements factor is not perceived to
be an important factor in terms of the FDI location decisions in the Saudi petrochemical
industry. However, our results are different from a number of studies (e.g. Gastanaga, Nugent
and Pashmova, 1998; Taylor, 2000; Chakrabarti, 2001 and Asiedu, 2002) who have tested the
impact of trade agreements on FDI inflows and location decisions. All confirm that trade
agreements are an important factor for FDI inflows, and will affect FDI location decisions
positively. Our results are also in contrast with those of Globerman and Shapiro (1999) who
found that the Canada-U.S. Free Trade Agreement (CUFTA) and the North American Free
Trade Agreement (NAFTA) increased both inward and outward FDI, and improved the
attractiveness of these countries. Our results are in contrast with those of Bloomstrom &
Koko (2003) who concluded that global trade liberalization through the the WTO, or
regionally, through organisations such as the EU and NAFTA and other international trade
Page 222
207
agreements, has led to an increase in market integration which makes international trade
agreements an important factor in terms of FDI location.
The tax reductions in the host country factor has a mean score greater than 3.0 (mean = 3.90).
The t-test shows that this is significantly (p < 0.05) more than 3.0 (t41 = 6.899, p = 0.000).
Hence, tax reductions in the host country factor is perceived to play an important role in
terms of FDI location decisions in the Saudi petrochemical industry. Our results confirm the
findings of many scholars such as Coughlin (1991), Hines (1996), Cassou (1997), Billington
(1999), Mossa (2002) and Jones & Wern (2006), who studies examined the effect of taxes on
FDI location decisions, and have found that high tax rates can have a negative influence on
FDI location, as they reduce the profits that can be made. Our results are also in line with
those of Cheng & Kwan (2000) who claimed that export-oriented FDI will be affected by the
taxes in the host country, but FDI targeting local market taxes will have a low effect, and
other location factors such as market policies that affect local market demand will be more
important than taxes. Our results support the findings of UNCTAD (1998) which argued that
corporate and personal tax rates will have an effect on FDI location decisions, and a location
with lower corporate tax rates will be more attractive than a location with higher rates. Our
results also confirm the findings of Tahir & Larimo (2005) who concluded the need to locate
manufacturing facilities in countries with relatively low tax rates. This serves the purpose of
the market, as well as efficiency-seeking FDI, and will play an important role in terms of FDI
location. However our results contrast with those of Ho & Lau (2007) who concluded that
while there is some agreement among scholars about the impact of non-tax factors on FDI
location decisions, the results with regard to the influence of tax factors on FDI location
decisions are contradictory and questionable. Our results are also different from those of
Cleeve (2004) who suggested that fiscal incentives such as tax incentives provided by the
host government may not be effective tools when it comes to attracting FDI inflows, and
some governments which provide tax incentives to attract FDI, especially in developing
countries, may lose tax revenue as a result of FDI when in reality the fiscal incentives do not
influence FDI inflow. Our results are also in contrast with those of Blonigen (2005) who
believe that MNEs face tax rates at a variety of levels in both the host and the parent
countries, and policies to deal with double taxation can substantially alter the effects of these
taxes on a MNE‘s incentive to invest. Therefore, a credit system to deal with foreign taxes by
an MNE makes taxation in the host country relatively unimportant.
Page 223
208
The benign environmental legislation for FDI factor has a mean score above 3.0 (mean =
3.90). The t-test shows that this is significantly (p < 0.05) more than 3.0 (t41 = 15.368, p =
0.000). Hence, the benign environmental legislation for FDI factor is perceived to play an
important role in terms of FDI location decisions in the Saudi petrochemical industry. Our
results confirm the findings of Jones & Wern (2006) and Kang & Lee (2007) who argue that
host government policies toward foreign investment play an important role in terms of FDI
inflow. Our results are also in line with those of Cheng & Kwan (2000) who showed that
government policies with regard to such processes as getting government approvals, the
environment for doing business, etc., would have a positive effect on FDI location. Our
results confirm the findings of Grubert and Mutti (1991), Loree and Guisinger (1995), Taylor
(2000) and Kumar (2002) who found a positive effect in terms of benign environmental
legislation for FDI on the part of the host governments, on inward FDI flows. Similarly,
Devereux and Griffith (1998), Hines (1996) and Banga (2003) have found that fiscal
incentives do affect location decisions, especially for export-oriented FDI, and that
government policies to attract FDI have increased in importance in the new globalized
markets. Our results are in line with those of Zhou, Delios & Yang (2002) who examined
2,933 cases of Japanese investment in China to identify the role that policy factors play on
the location decisions of Japanese FDI in China, and found that government incentives on the
part of the host country, such as the setting up of special economic zones and opening coastal
cities, were very important factors in terms of FDI inflow. Our result also supports UNCTAD
(1998) which concluded that restrictive policies on the part of host governments, such as the
widespread nationalization of foreign partners, can negatively affect FDI inflow. Our results
are in line with those of Cohen (2007) who concluded that the collective results of attitudes,
actions, and inactions by a national government, is the most decisive determinant with regard
to whether or not an investment climate attracts or repels non-extractive MNEs.
However, our results are in contrast with those of Contractor (1991), Caves (1996), and
Villela and Barreix (2002), who found that policy changes have a weak influence on location
decisions and that inflow incentives on the part of the host country are generally unimportant
compared to other classical location factors when it comes to FDI. Our results are different
from those of Hoekman and Saggi (2000) who believed that incentives may attract some
types of FDI, but it will not be an important factor when generalized to the whole economy.
Our results are different from those of Bloomstrom & Koko (2003) who concluded that
investment incentives on the part of the host government are seen as relatively minor
Page 224
209
determinants of FDI decisions, and while they might tilt the investment decision in favour of
one of several otherwise similar investment locations, the effects were considered to be only
marginal. Our results are in contrast with those of Blonigen and Feenstra (1996) and Mossa
(2002) who believed that protectionism on the part of the host government may lead to an
increased FDI inflow, and may encourage FDI inflow, and that FDI might increase the
investment level in the host country to minimize the effect of protectionism on its investment.
The diplomatic ties with the host country factor has a mean score above 3.0 (mean = 3.33).
However, the t-test shows that the mean score is significantly (p < 0.05) less than 3.0 (t41 =
2.995, p = 0.005). Hence, the diplomatic ties with the host country factor is not perceived to
be an important factor in terms of the FDI location decisions in the Saudi petrochemical
industry.
The legal and regulatory system factor has a mean score greater than 3.0 (mean = 3.05).
However, the t-test shows that this is not statistically greater than 3.0 (t41 = 0.330, p = 0.743).
Hence, the legal and regulatory system factor is not perceived to be an important factor in
terms of the location decisions for FDI in the Saudi petrochemical industry. Our results
contrast with those of the World Bank (2005) whch concluded that low confidence in the
legal system of the host country is a key factor for MNCs, especially in a country with few
political and economic reforms. As a result, the legal system in the host country will play a
major role in FDI location decisions. Our results are different from those of Altomonte and
Guagliano (2003), Globerman and Shapiro (2003), and Kahai (2004) who concluded that a
transparent and enforceable legal and institutional framework is a crucial determinant of FDI
location. Our results are also in contrast with those of Flores & Aguilera (2007) who
indicated that country-level political and legal institutions influence cross-national business
practices, and when MNEs expand around the world, the host country‘s legal system plays an
important role in their operations abroad. Our results are also different from those of Mina
(2007) who concluded that the rule of law, contract enforcement and protection of property
rights play an important role in attracting FDI in GCC countries.
Page 225
210
Table 6.16 Political and Legal Factors’ Importance Means
One-Sample Statistics
Location Factors N Mean Std. Deviation Std. Error Mean
Political stability 42 4.45 .550 .085
International trade agreements 42 3.10 .932 .144
Tax reductions in the host country 42 3.90 .850 .131
Benign environmental legislation toward FDI 42 4.38 .582 .090
Diplomatic ties with the host country 42 3.33 .721 .111
Legal and regulatory system 42 3.05 .936 .144
Table 6.17 Political and Legal Importance T-Test
One-Sample Test
Location Factors
Test Value = 3
95% Confidence Interval
of the Difference
t df Sig. (2-
tailed)
Mean
Difference Lower Upper
Political stability 17.112 41 .000 1.452 1.28 1.62
International trade agreements .662 41 .512 .095 -.20 .39
Tax reductions in the host country 6.899 41 .000 .905 .64 1.17
Benign environmental legislation toward FDI 15.368 41 .000 1.381 1.20 1.56
Diplomatic ties with the host country 2.995 41 .005 .333 .11 .56
Legal and regulatory system .330 41 .743 .048 -.24 .34
6.2.2.7 Social and Cultural Factors’ Importance
Table 6.18 summarises the importance of social and cultural factors, including the mean,
standard deviation and standard error for each factor. Table 6.19 shows the importance of
social and cultural factors. All such factors, including the attitude of the local community
towards the firm, local employees‘ loyalty to the firm, cultural distance and language, are
rated below 3.0 and are considered as unimportant factors in terms of location decisions in
the Saudi petrochemical industry.
The cultural distance from the home country factor has a mean score of less than 3.0 (mean =
2.12). The t-test found that the mean score is significantly (p < 0.05) less than 3.0 (t41 = -
6.059, p = 0.000). Hence, the cultural distance from the home country factor is not perceived
to be an important factor in terms of location decisions for FDI in the Saudi petrochemical
industry.Our results support the findings of Johnson and Vahlne (1977) who concluded that
firms will not be affected by the cultural distance between the host and the home country, and
Page 226
211
that cultural distance will play a limited factor on the location choice for FDI. Our results are
also in line with those of Guisinger, Phelan & Berg (2003) who found that globalization has a
minimal effect in terms of cultural factors, as consumer tastes in different countries have
been unified globally due to globalization. Moreover, MNEs may be forced to ignore the
disadvantages of the cultural distance from the developing country, in favour of the
advantages of their low cost labour, making them consider these locations to be the best
locations for their operations. However our results are different from those of Loree and
Guisinger (1995) who studied US FDI between 1977 and 1982, and found that FDI was
negatively affected by the cultural distance between the host countries. Our results are also in
contrast with those of Buckley and Mathew (1979) who found that British firms were
significantly affected by the expected cultural differences between the host country and
Britain. Our results are different from those of Globerman and Shapiro (2002; 2003) and
Bahardwaj, Dietz & Beamish (2007) who concluded that cultural distance from the home
country is very important for FDI, as the companies involved will deal with foreigners in the
host countries that will affect the business relationships and operations. Our result are also
different from those of Bahardwaj, Dietz & Beamish (2007) who found that cultural
similarity between the host and the home country will enable companies to establish
relationships, even with unfamiliar partners, and will enhance the speed of the establishment
of relationships between new partners in the host country.
The attitude of the local community towards the firm factor has a mean score of less than 3.0
(mean = 2.43). The t-test shows that the mean score is significantly (p < 0.05) less than 3.0
(t41 = -3.563, p = 0.001). Hence, the attitude of the local community towards the firm factor is
not perceived to be an important factor in terms of the location decisions for FDI in the Saudi
petrochemical industry. However, our results are in contrast with those of Jones and Teegen
(2001) who indicated that the attitude of the local community toward the foreign firm may
negatively affect the investment operation in the host country, and companies consider it as
an important factor in terms of their location decisions. Our results are also different from
those of Porter et al. (2000) who suggested that Japan's lower attraction for FDI, at least to
some extent resulted from the assumption that Japanese negatively welcome foreign firms
that may often deter foreign competition. Our results are also in contrast with those of
Bahardwaj, Dietz & Beamish (2007) who found that local negative attitudes toward foreign
firms may negatively affect the FDI inflow, especially in high uncertainty markets, due to the
discomfort that locals feel when dealing with foreign firms.
Page 227
212
The local employees‘ loyalty to the firm factor has a mean score of less than 3.0 (mean =
2.38). The t-test shows that the mean score is significantly (p < 0.05) less than 3.0 (t41 = -
3.877, p = 0.000). Hence, the local employees‘ loyalty to the firm factor is not perceived to be
an important factor in terms of the location decisions for FDI in the Saudi petrochemical
industry. Our results confirm the findings of Ramadi (2005) and Achoui (2009) who
concluded that the private sector in Saudi Arabia prefers to employ expatriates to Saudis
nationals as Saudis have high labour costs, have negative social and cultural views and
attitudes towards manual and low status jobs. At the same time, expatriates are more
disciplined than Saudis because Saudis will have job tenure compared to expatriates in terms
of job contracts. Also, Saudis are less qualified in the English language and have lower
technical skills, and are more reluctant to change job locations. As a result, the local
employees‘ loyalty to the firm is consider unimportant to investing companies as they rely on
expatriates for their operations. However, our results are in contrast to those of Deloitte &
Touche (2002) who studied the relative importance of location factors from the point of view
of executives, and found that the local employees‘ loyalty to the firm is one of the important
location factors that affect FDI location.
The language factor has a mean score of less than 3.0 (mean = 1.83). The t-test shows that the
mean score is significantly (p < 0.05) less than 3.0 (t41 = -7.671, p = 0.000). Hence, the
language factor is not perceived to be an important factor in terms of the location decisions
for FDI in the Saudi petrochemical industry. Our results are different from those of Fenwick,
Edwards & Buckley (2003) who concluded that psychic distance such as language between
the FDI and the host country will increase the cost of obtaining relevant information with
regard to the business environment and the conditions in the host country, and it will play an
important role in FDI location. Our results are also in contrast to those of Zhang (2001) who
studied investment patterns in Taiwan on the part of firms from Hong Kong, and found that
FDI location will be positively influenced by the language between the host country and the
home country of the foreign investor. Our results are different from those of Edwards and
Buckley (1998) who found that cultural factors with regard to investments from Australia to
Britain, such as the use of a similar language, were significant in the location decision for
FDI. Our results are different from those of Cleeve (2009) who concluded that a firm‘s
decision to invest abroad will be affected by certain geographical factors such as language
and cultural differences between home and host country.
Page 228
213
Table 6.18 Social and Cultural Factors’ Importance Means
One-Sample Statistics
Location Factors N Mean Std. Deviation Std. Error Mean
Cultural distance from home country 42 2.12 .942 .145
Attitude of local community toward the firm 42 2.43 1.039 .160
Local employees' loyalty to firm 42 2.38 1.035 .160
Language 42 1.83 .986 .152
Table 6.19 Social and Cultural Factors’ Importance T-Test
One-Sample Test
Location Factors
Test Value = 3
95% Confidence
Interval of the
Difference
t df
Sig. (2-
tailed)
Mean
Difference Lower Upper
Cultural distance from home country -6.059 41 .000 -.881 -1.17 -.59
Attitude of local community towards the firm -3.563 41 .001 -.571 -.90 -.25
Local employees' loyalty to the firm -3.877 41 .000 -.619 -.94 -.30
Language -7.671 41 .000 -1.167 -1.47 -.86
6.2.3 Testing Location Factors’ Competitiveness
Table 6.20 summarises the competitiveness of the major location factors and sub-factors with
regard to the Saudi petrochemical industry compared to other locations. Table 6.21
summarises the t-test for the competitiveness of the major and sub-location factors in the
second part of the questionnaire in which the participants were asked to rate the
competitiveness of all sub-locating factors for the Saudi petrochemical industry compared to
other locations. After calculating the mean of all sub-factors related to each major factor, the
mean of each major factor was recorded. The mean scores of these factors are discussed in
detail in the following section.
Page 229
214
Table 6.20 Location Factors’ Competitiveness Means
One-Sample Statistics
Location Factors N Mean Std. Deviation Std. Error Mean
Cost factors 42 3.921 .3882 .0599
Factory site costs
42
3.83
1.080
.167
Labour costs 42 2.43 1.016 .157
Transportation/logistics costs 42 3.48 .969 .149
Raw materials costs 42 4.43 .501 .077
Return on Investment 42 4.45 .633 .098
Energy costs 42 4.90 .297 .046
Market factors 42 2.554 .5397 .0833
Large host market
42
1.83
.853
.132
Market growth in the host market 42 1.90 .821 .127
Competition in the host market 42 2.83 .824 .127
Market familiarity 42 3.64 .821 .127
Economic factors
42 3.702 .5556 .0857
Economic stability 42 3.64 .727 .112
Economic growth 42 3.83 .853 .132
Exchange rates 42 4.21 .682 .105
Local financial support 42 3.12 .942 .145
Infrastructure and technological factors
42 3.857 .3812 .0588
Level of infrastructure 42 3.67 .786 .121
Clustering 42 4.24 .617 .095
Availability of qualified work force 42 2.07 1.022 .158
Access to reliable and cooperative suppliers 42 4.33 .570 .088
Availability of factory sites 42 3.98 .680 .105
Availability of raw materials 42 4.81 .397 .061
Geographical proximity 42 3.90 .878 .136
Political and legal factors
42 3.429 .5272 .0814
Political stability 42 4.21 .682 .105
International trade agreements 42 3.19 1.018 .157
Tax reductions in the host country 42 3.07 1.135 .175
Benign environmental legislation toward FDI 42 3.79 .813 .125
Diplomatic ties with the host country 42 3.79 .717 .111
Legal and regulatory system 42 2.52 1.042 .161
Social and cultural factors
42 2.7976 .54167 .08358
Cultural distance from home country 42 2.07 1.022 .158
Attitude of local community towards the firm 42 2.86 .977 .151
Local employees' loyalty to the firm 42 3.36 .727 .112
Language 42 2.90 .878 .136
Page 230
215
Table 6.21 Location Factors’ Competitiveness T-Test
One-Sample Test
Location Factors
Test Value = 3
95% Confidence
Interval of the
Difference
t df Sig. (2-
tailed)
Mean
Difference Lower Upper
Cost factors
15.368 41 .000 .9206 .800 1.042
Factory site costs 5.000 41 .000 .833 .50 1.17
Labour costs -3.647 41 .001 -.571 -.89 -.25
Transportation/logistics costs 3.186 41 .003 .476 .17 .78
Raw material costs 18.484 41 .000 1.429 1.27 1.58
Return on Investment 14.880 41 .000 1.452 1.26 1.65
Energy costs 41.549 41 .000 1.905 1.81 2.00
Market factors
-5.361 41 .000 -.4464 -.615 -.278
Large host market -8.864 41 .000 -1.167 -1.43 -.90
Market growth in the host market -8.648 41 .000 -1.095 -1.35 -.84
Competition in the host market -1.311 41 .197 -.167 -.42 .09
Market familiarity 5.074 41 .000 .643 .39 .90
Economic factors
8.193 41 .000 .7024 .529 .876
Economic stability 5.734 41 .000 .643 .42 .87
Economic growth 6.331 41 .000 .833 .57 1.10
Exchange rates 11.538 41 .000 1.214 1.00 1.43
Local financial support .819 41 .418 .119 -.17 .41
Infrastructure and technological factors
14.571 41 .000 .8571 .738 .976
Level of infrastructure 5.496 41 .000 .667 .42 .91
Clustering 13.000 41 .000 1.238 1.05 1.43
Availability of qualified work force -5.891 41 .000 -.929 -1.25 -.61
Access to reliable and cooperative suppliers 15.153 41 .000 1.333 1.16 1.51
Availability of factory sites 9.299 41 .000 .976 .76 1.19
Availability of raw materials 29.507 41 .000 1.810 1.69 1.93
Geographical proximity 6.677 41 .000 .905 .63 1.18
Political and legal factors
5.268 41 .000 .4286 .264 .593
Political stability 11.538 41 .000 1.214 1.00 1.43
International trade agreements 1.213 41 .232 .190 -.13 .51
Tax reduction in the host country .408 41 .685 .071 -.28 .43
Benign environmental legislation toward FDI 6.267 41 .000 .786 .53 1.04
Diplomatic ties with the host country 7.103 41 .000 .786 .56 1.01
Legal and regulatory system -2.963 41 .005 -.476 -.80 -.15
Social and cultural factors
-2.421 41 .020 -.20238 -.3712 -.0336
Cultural distance from home country -5.891 41 .000 -.929 -1.25 -.61
Attitude of local community towards the firm -.948 41 .349 -.143 -.45 .16
Local employees' loyalty to the firm 3.186 41 .003 .357 .13 .58
Language -.703 41 .486 -.095 -.37 .18
Page 231
216
Table 6.22 summarises the competitiveness of the location factors‘ means, standard
deviation, and standard errors. Table 6.23 shows the t-test for the location factors‘
competitiveness. From the analysis of all the sub-factors, an average response rating value
above 3.0 was considered to be a competitive location factor in the petrochemical industry.
The most competitive location factors were identified according to their relative
competitiveness in location decisions for petrochemical FDI. These are listed below in
decreasing order of competitiveness, based on the t-test:
1. Energy costs
2. Availability of raw materials
3. Return on investment
4. Cost of raw materials
5. Access to reliable and cooperative suppliers
6. High industrial concentration (clustering)
7. Exchange rates
8. Political stability
9. Availability of factory sites (land)
10. Geographical proximity
11. Production site costs (land costs)
12. Economic growth
13. Benign environmental legislation towards FDI
14. Diplomatic ties with the host country
15. Level of infrastructure
16. Market familiarity
17. Economic stability
18. Transportation/logistic costs
19. Local employees‘ loyalty to the firm
The least competitive location factors among other location factors based on the mean of
competitiveness are listed below in terms of their decreasing order of competitiveness:
20. International trade agreements
21. Local financial support
22. Tax reductions in the host country
23. Language
Page 232
217
24. Attitude of the local community towards the firm
25. Level of competition in the host market
26. Legal and regulatory system
27. Labour costs
28. Availability of well-qualified workforce
29. Cultural distance
30. Market growth in the host country
31. Size of the host market
Table 6.22 Sub-Location Factors’ Competitiveness Means
One-Sample Statistics
Location Factors N Mean Std. Deviation Std. Error Mean
Factory site costs 42 3.83 1.080 .167
Labour costs 42 2.43 1.016 .157
Transportation/logistics costs 42 3.48 .969 .149
Raw materials costs 42 4.43 .501 .077
Return on Investment 42 4.45 .633 .098
Energy costs 42 4.90 .297 .046
Large host market 42 1.83 .853 .132
Market growth in the host market 42 1.90 .821 .127
Competition in the host market 42 2.83 .824 .127
Market familiarity 42 3.64 .821 .127
Economic stability 42 3.64 .727 .112
Economic growth 42 3.83 .853 .132
Exchange rates 42 4.21 .682 .105
Local financial support 42 3.12 .942 .145
Level of infrastructure 42 3.67 .786 .121
Clustering 42 4.24 .617 .095
Availability of qualified work force 42 2.07 1.022 .158
Access to reliable and cooperative suppliers 42 4.33 .570 .088
Availability of factory sites 42 3.98 .680 .105
Availability of raw materials 42 4.81 .397 .061
Geographical proximity 42 3.90 .878 .136
Political stability 42 4.21 .682 .105
International trade agreements 42 3.19 1.018 .157
Tax reduction in the host country 42 3.07 1.135 .175
Benign environmental legislation toward FDI 42 3.79 .813 .125
Diplomatic ties with the host country 42 3.79 .717 .111
Legal and regulatory system 42 2.52 1.042 .161
Cultural distance from home country 42 2.07 1.022 .158
Attitude of local community towards the firm 42 2.86 .977 .151
Local employees' loyalty to the firm 42 3.36 .727 .112
Language 42 2.90 .878 .136
Page 233
218
Table 6.23 Sub-Location Factors’ Competitiveness T-Test
One-Sample Test
Location Factors
Test Value = 3
95% Confidence
Interval of the
Difference
t df Sig. (2-
tailed)
Mean
Difference Lower Upper
Factory site costs 5.000 41 .000 .833 .50 1.17
Labour costs -3.647 41 .001 -.571 -.89 -.25
Transportation/logistics costs 3.186 41 .003 .476 .17 .78
Raw materials costs 18.484 41 .000 1.429 1.27 1.58
Return on Investment 14.880 41 .000 1.452 1.26 1.65
Energy costs 41.549 41 .000 1.905 1.81 2.00
Large host market -8.864 41 .000 -1.167 -1.43 -.90
Market growth in the host market -8.648 41 .000 -1.095 -1.35 -.84
Competition in the host market -1.311 41 .197 -.167 -.42 .09
Market familiarity 5.074 41 .000 .643 .39 .90
Economic stability 5.734 41 .000 .643 .42 .87
Economic growth 6.331 41 .000 .833 .57 1.10
Exchange rates 11.538 41 .000 1.214 1.00 1.43
Local financial support .819 41 .418 .119 -.17 .41
Level of infrastructure 5.496 41 .000 .667 .42 .91
Clustering 13.000 41 .000 1.238 1.05 1.43
Availability of qualified work force -5.891 41 .000 -.929 -1.25 -.61
Access to reliable and cooperative suppliers 15.153 41 .000 1.333 1.16 1.51
Availability of factory sites 9.299 41 .000 .976 .76 1.19
Availability of raw materials 29.507 41 .000 1.810 1.69 1.93
Geographical proximity 6.677 41 .000 .905 .63 1.18
Political stability 11.538 41 .000 1.214 1.00 1.43
International trade agreements 1.213 41 .232 .190 -.13 .51
Tax reductions in the host country .408 41 .685 .071 -.28 .43
Benign environmental legislation toward FDI 6.267 41 .000 .786 .53 1.04
Diplomatic ties with the host country 7.103 41 .000 .786 .56 1.01
Legal and regulatory system -2.963 41 .005 -.476 -.80 -.15
Cultural distance from home country -5.891 41 .000 -.929 -1.25 -.61
Attitude of local community towards the firm -.948 41 .349 -.143 -.45 .16
Local employees' loyalty to the firm 3.186 41 .003 .357 .13 .58
Language -.703 41 .486 -.095 -.37 .18
Page 234
219
6.2.3.1 Major Factors’ Competitiveness
Table 6.24 summarises the competitiveness of each major location factor, including the
mean, standard deviation and standard error. Table 6.25 shows the competitiveness of each
major factor based on the t-test in relation to its mean in terms of competitiveness. After
calculating the sum of the average rating of the sub-factors under each major factor, we have
the mean for each major factor. From the analysis of all the major location factors, an average
response rating above 3.0 was considered to indicate a competitive location factor in the
petrochemical industry.
Cost factors, infrastructure and technological factors, political and legal factors and economic
factors are rated relatively highly among other major location factors, with a mean above 3.0,
indicating that they are considered to be competitive location factors for FDI compared to
other locations with regard to the Saudi petrochemical industry. The social and cultural
factors and market factors were rated relatively low among other major location factors, with
mean scores below 3.0, which indicate that they are not considered to be competitive location
factors for FDI compared to other locations with regard to the Saudi petrochemical industry.
Cost factors have a mean score above 3.0 (mean= 3.9206) in relation to its competitiveness.
The t-test shows that this is significantly (p < 0.05) more than 3.0 (t41 = 14.345, p = 0.000).
Hence, cost factors are perceived to be significantly more competitive factors for FDI in the
Saudi petrochemical industry compared to other locations. Because of the ready availability
of natural gas associated with the production of crude oil, and the Government‘s desire to
encourage the industrialization drive, Saudi Arabia has among the lowest natural gas prices in
the world. This favourable differential has clear benefits for domestic consumers of natural
gas feedstock such as the petrochemical industry, where about 60% of the integrated cash
costs are hydrocarbon-based. This compares with figures of between 30% and 40% with
regard to power generation and water desalination, and in excess of 30% for metals
processing (SAGIA, 2007). The country‘s strong infrastructure, its significant cost advantage
due to lower average variable and fixed costs, and its competitive and fixed natural gas prices
make it an attractive destination for investment in the petrochemical industry.
Market factors have a mean competitiveness score of less than 3.0 (mean = 2.5536). The t-
test shows that this is significantly (p < 0.05) less than 3.0 (t41 = -5.361, p = 0.000). Hence,
Page 235
220
the market factor is perceived to be significantly less competitive in terms of factors for FDI
in the Saudi petrochemical industry compared to other locations. From being a net importer,
the country has emerged as a leading exporter in the petrochemical sector, supplying to over
100 countries. Primary drivers for such a turnaround have been a strong infrastructure,
significant cost advantages due to lower average variable and fixed costs, competitive and
fixed natural gas prices, and market proximity, especially for East Asia. These factors have
also resulted in substantial investment inflows into the sector with large scale projects
targeting export markets such as China, America and Europe (BMI, 2009). Therefore, the
Saudi market is not the prime market for petrochemical FDI in Saudi Arabia as most of
production is for export, and the Saudi market is considered by many to be a less competitive
market compared to other large markets such as East Asia and Europe.
The economic factors have a mean competitiveness score above 3.0 (mean = 3.7024). The t-
test shows that this is significantly (p < 0.05) more than 3.0 (t41 = 8.193, p = 0.000). Hence,
economic factors are perceived to be significantly more competitive in Saudi Arabia than are
the other locations. Saudi Arabia is the largest economy in the Middle East, with a GDP in
excess of US$300 billion. This constitutes almost one third of the regional GDP. Saudi
Arabia‘s economy has experienced a boom over the last few years, driven primarily by the
strength of the demand for oil on the international oil markets, and increasing domestic oil
production capacity. The Saudi economy has maintained its achievements in terms of high
growth rates in recent years. The Saudi economy benefits from strong support from the
government, and a free market policy, both of which have contributed to the growth of the
economy (SAGIA, 2008). All of this has contributed to making the Saudi economic factors
competitive for the petrochemical industry in Saudi Arabia compared to other locations.
The infrastructure and technological factors have a mean competitiveness score of above 3.0
(mean = 3.8571). The t-test shows that this is significantly (p < 0.05) more than 3.0 (t41 =
14.571, p = 0.000). Hence, this factor is perceived to be significantly more competitive in the
country than are other locations. There have also been a number of significant infrastructure
developments in the Kingdom, which are set to improve the project enabler and logistics
facilities for investors in the energy sector. These include an expansion of the existing
industrial cities of Jubail and Yanbu, the creation of new economic cities around the
Kingdom, and the development of a number of standalone projects to improve the Kingdom‘s
transport and logistics network. SAGIA has had great success in attracting new industries to
Page 236
221
the industrial cities of Jubail on the Arabian Gulf and Yanbu on the Red Sea. Over 200
companies have invested more than $60bn in these cities, providing employment for over
85,000 workers. They also host some of the world‘s largest petrochemical facilities, and both
cities are currently being expanded to cater for increased demand (SAGIA, 2007). All of this
contributes to making Saudi Arabia infrastructure factors more competitive for petrochemical
FDI in Saudi Arabia compared to other locations.
The political and legal factors have a mean competitiveness score above 3.0 (mean = 3.4286).
The t-test shows that this is significantly (p < 0.05) more than 3.0 (t41 = 5.268, p = 0.000).
Hence, these factors are perceived to be significantly more competitive for FDI in the Saudi
petrochemical industry compared to other locations. The huge effort on the part of the Saudi
government, encompassing economic reform, improvements designed to transform the
investment environment and the opening up of more sectors to investment opportunities all
contributed to make Saudi Arabia more attractive compare to other locations. .These efforts
have been streamlined through the activities of the Saudi Arabian General Investment
Authority (SAGIA), which works in conjunction with all government agencies and
institutions to improve the investment environment (SAGIA, 2008). With a stable political
system, benign environmental legislation towards FDI and good diplomatic relations with
other countries, Saudi Arabia‘s political and legal factors are consider competitive factors for
FDI in the Saudi petrochemical industry compared to other locations.
The social and cultural factors have a mean competitiveness score below 3.0 (mean =
2.7976). The t-test shows that this is significantly (p < 0.05) less than 3.0 (t41 = -2.421, p =
0.020). Hence, these factors are perceived to be significantly less competitive for FDI in the
Saudi petrochemical industry compared to other locations. Due to the fact that Saudi society
is very conservative and not open to other cultural inputs, a low work ethic on the part of
Saudi citizens, and fewer educated people compared to other countries, the social and cultural
factors in Saudi Arabia are considered to be less competitive compared to other locations for
FDI in terms of the Saudi petrochemical industry.
Page 237
222
Table 6.24 Major Factors’ Competitiveness Means
One-Sample Statistics
Location Factors N Mean Std. Deviation Std. Error Mean
Cost factors 42 3.921 .3882 .0599
Market factors 42 2.554 .5397 .0833
Economic factors 42 3.702 .5556 .0857
Infrastructure and technological factors 42 3.857 .3812 .0588
Political and legal factors 42 3.429 .5272 .0814
Social and cultural factors 42 2.7976 .54167 .08358
Table 6.25 Location Factors’ Competitiveness T-Test
One-Sample Test
Location Factors
Test Value = 3
95% Confidence Interval of the
Difference
t df Sig. (2-tailed) Mean Difference Lower Upper
Cost factors 15.368 41 .000 .9206 .800 1.042
Market factors -5.361 41 .000 -.4464 -.615 -.278
Economic factors 8.193 41 .000 .7024 .529 .876
Infrastructure and technological factors 14.571 41 .000 .8571 .738 .976
Political and legal factors 5.268 41 .000 .4286 .264 .593
Social and cultural factors -2.421 41 .020 -.20238 -.3712 -.0336
6.2.3.2 Cost Factors’ Competitiveness
Table 6.26 summarises the competitiveness of each cost factor, including the mean, standard
deviation and standard error for each factor. Table 6.27 shows the competitiveness of each
cost factor based on the t-test for the mean of competitiveness. Most cost factors are
considered competitive factors with an average response rate of over 3.0, including energy
costs, return on investment, cost of raw materials, production site costs (land costs) and
transportation/logistic costs. However, labour costs received a mean score of less than 3.0,
which indicates that they are considered to be an uncompetitive factor among cost factors for
FDI decisions in the petrochemical industry.
The production site costs (land costs) factor has a mean competitiveness score above 3.0
(mean = 3.83). The t-test shows that this is significantly (p < 0.05) more than 3.0 (t41 = 5.000,
p = 0.000). Hence, the production site costs (land costs) factor is perceived to be a
significantly more competitive factor for FDI in the Saudi petrochemical industry compared
to other locations. Saudi Arabia provides land for new development at very low rents
Page 238
223
compared to the rest of the world. For example, in the industrial cities of Jubail and Yanbu,
land is being offered to new investors at an annual rate of $.266/m2, compared to
international rentals of around $13/m2 in Rotterdam, and $8-21/m2 in Jurong Island,
Singapore (SAGIA, 2007). All of this makes land costs more competitive for FDI in the
Saudi petrochemical industry compared to other locations.
The labour costs factor has a mean competitiveness score below 3.0 (mean = 2.43). The t-test
shows that this is significantly less than 3.0 (t41 = -3647, p = 0.001). Hence, the labour costs
factor is perceived to be a significantly less competitive factor for FDI in the Saudi
petrochemical industry compared to other locations. Manufacturing labour costs in Saudi
Arabia are low and are typically less than one quarter of comparable labour costs in Europe
and the USA. However, labour costs in developing Asian countries such as China and India
are likely to be even lower, although these costs have been escalating as these economies
have begun to suffer competitive pressure from the labour market (SAGIA, 2007). All of this
attributes to the fact that the labour costs factor is less competitive for FDI in Saudi
petrochemical industry compared to other locations.
The transportation/logistic costs factor has a mean competitiveness score above 3.0 (mean =
3.48). The t-test shows that this is significantly (p < 0.05) more than 3.0 (t41 = 3.186, p =
0.003). Hence, the transportation/logistic costs factor is perceived to be a significantly more
competitive factor for FDI in the Saudi petrochemical industry compared to other location
locations. There are a number of transport projects in development which will significantly
improve the logistics networks in the Kingdom. This is a key sector for the Government, and
is one of core areas for development outside of the Energy Sector (SAGIA, 2007). Therefore,
this reflects the competitiveness of the transportation/logistic costs factor for FDI in the Saudi
petrochemical industry compared to other locations.
The raw materials factor has a mean competitiveness score above 3.0 (mean = 4.43). The t-
test shows that this is significantly (p < 0.05) more than 3.0 (t41 = 18.484, p = 0.000). Hence,
the raw materials factor is perceived to be a significantly more competitive factor for FDI in
the Saudi petrochemical industry compared to other locations. Saudi Arabia is the 11th
largest supplier of petrochemical globally, producing 7-8% of the world supply, and the
Kingdom has ambitious plans to increase this to 13-14% by 2010 and the country enjoys the
lowest energy costs globally (SAGIA, 2007). For these reasons the raw materials for
Page 239
224
petrochemical are available at low prices compared to other countries. This gives the raw
materials cost factor a competitive edge over other locations for FDI in the Saudi
petrochemical industry.
The return on investment factor has a mean competitiveness score above 3.0 (mean = 4.45).
The t-test shows that this is significantly (p < 0.05) more than 3.0 (t41 = 14.880, p = 0.000).
Hence, the return on investment factor is perceived to be a significantly more competitive
factor for FDI in the Saudi petrochemical industry compared to other locations. Saudi
Arabia‘s low production and feedstock costs make it particularly attractive for investment in
petrochemical, where feedstock costs can account for 60% of the cost of production. As oil
prices increase, the relative feedstock cost advantage also increases, thus leading to extremely
low feedstock costs in a high oil price scenario in comparison with other nations. The country
provides feedstock at a price that provides a petrochemical producer with an incentive to
invest, while offering better value for hydrocarbon producers. This advantage in feedstock
costs translates itself into the ability to manufacture and deliver petrochemical products from
a strong competitive cost position and with high profit margin (BMI, 2009). All of these
advantages are reflected in the high competitiveness of the return on investment factor for
FDI in the Saudi petrochemical industry compared to other locations.
The energy costs factor has a mean competitiveness score above 3.0 (mean = 4.90). The t-test
shows that this is significantly (p < 0.05) more than 3.0 (t41 = 41.459, p = 0.000). Hence, the
energy costs factor is perceived to be a significantly more competitive factor for FDI in the
Saudi petrochemical industry compared to other locations. Prices for gas are currently fixed
by the Government at $0.75/mmBtu. This is significantly lower than prices elsewhere in the
world, where typical gas prices are above $6/mmBtu (SAGIA, 2007). This attractive pricing
for gas is available for any foreign or domestic investor willing to invest in the Kingdom.
During its WTO accession discussions, Saudi Arabia was successful in arguing for a
continuation of its competitive pricing formula, based on the additional costs of the
alternative of exporting the gas. Saudi Arabia has therefore secured a continued and
significant competitive advantage for any foreign or domestic investor willing to invest in the
Saudi petrochemical industry. Saudi Arabian electricity prices are structurally lower than
those in the USA, Europe and China and, critically, are stable and not open to global markets
fluctuations, and such tariffs are a reflection of the competitively priced feedstock available
to the Saudi's power generators. This is reflected in the competitiveness of energy costs factor
Page 240
225
for FDI in the Saudi petrochemical industry.
Table 6.26 Cost Factors’ Competitiveness Means
One-Sample Statistics
Location Factors N Mean Std. Deviation Std. Error Mean
Factory site cost 42 3.83 1.080 .167
Labour costs 42 2.43 1.016 .157
Transportation/logistics costs 42 3.48 .969 .149
Raw material costs 42 4.43 .501 .077
Return on Investment 42 4.45 .633 .098
Energy costs 42 4.90 .297 .046
Table 6.27 Cost Factors’ Competitiveness T-Test
6.2.3.3 Market Factors’ Competitiveness
Table 6.28 summarises the competitiveness of each market factor, including the mean,
standard deviation, and standard error for each market factor. Table 73 shows the
competitiveness of each market factor based on the t-test for the mean of competitiveness.
Market familiarity is the only factor among the market factors with a mean greater than 3.0,
and is considered to be a competitive factor. All other market factors have a mean of less than
3.0, indicating that these factors are uncompetitive in comparison to other locations in the
Saudi petrochemical industry, including the level of competition in the host market, market
growth in the host country, and the size of the host market.
The size of the host market factor has a mean competitiveness score below 3.0 (mean = 1.83).
The t-test shows that this is significantly (p < 0.05) less than 3.0 (t41 = -8.864, p = 0.000).
One-Sample Test
Location Factors
Test Value = 3
95% Confidence
Interval of the
Difference
t df Sig. (2-
tailed)
Mean
Difference Lower Upper
Factory site costs 5.000 41 .000 .833 .50 1.17
Labour costs -3.647 41 .001 -.571 -.89 -.25
Transportation/logistics costs 3.186 41 .003 .476 .17 .78
Raw material costs 18.484 41 .000 1.429 1.27 1.58
Return on Investment 14.880 41 .000 1.452 1.26 1.65
Energy costs 41.549 41 .000 1.905 1.81 2.00
Page 241
226
Hence, the size of the host market factor is perceived to be a significantly less competitive
factor for FDI in the Saudi petrochemical industry compared to other locations. Most of the
of the petrochemical projects in Saudi Arabia are mega projects and Saudi Arabia is
considered by many companies in the industry to be a small sized market compared, for
example, to China and America. Therefore, the Saudi market is not a prime market for
petrochemical FDI in Saudi Arabia, as most production is for export and the Saudi market
size factor is considered less competitive for FDI in the Saudi petrochemical industry
compared to other locations.
The market growth in the host country factor has a mean competitiveness score below 3.0
(mean = 1.90). The t-test shows that this is significantly less than 3.0 (t41 = -8.648, p = 0.000).
Hence, the market growth in the host country factor is perceived to be a significantly less
competitive factor for FDI in the Saudi petrochemical industry compared to other locations.
The petrochemical‘ FDI in Saudi Arabia are targeting large markets such as China and India.
Saudi Arabia market growth and size are limited compared to other markets such as China.
For this reason the market size factor is consider to be less competitive for FDI in the Saudi
petrochemical industry compared to other locations.
The level of competition in the host market factor has a mean competitiveness score below
3.0 (mean = 2.83). The t-test shows that this is statistically not significantly (p > 0.05) less
than 3.0 (t41 = -1.311, p = 0.197). Hence, the level of competition in the host market factor is
perceived to be a significantly less competitive factor for FDI in the Saudi petrochemical
industry compared to other locations. As the attractiveness of the business environment in
Saudi Arabia grows and is reflected in the large number of foreign firms willing to invest in
the country, and as the market size is limited in Saudi Arabia, the competition in the Saudi
petrochemical industry is high and driven by large supply, low prices, and low demand. All
of these factors have contributed to the lower degree of competitiveness in the Saudi Arabia
for FDI in the petrochemical industry compared to other locations.
The market familiarity factor has a mean competitiveness score above 3.0 (mean = 3.64). The
t-test shows that this is significantly more than 3.0 (t41 = 5.074, p = 0.000). Hence, the market
familiarity factor is perceived to be a significantly more competitive factor for FDI in the
Saudi petrochemical industry compared to other locations. The petrochemical sector in Saudi
Arabia was established in the mid-1970s (International Energy Agency (IEA), (2008). Since
Page 242
227
the establishment of the petrochemical industry, many foreign firms have become involved in
joint ventures with the Saudi government or with Saudi firms, and today the Saudi
petrochemical industry is familiar to many MNCs in the industry. For this reason the market
familiarity factor is considered to be a competitive factor for FDI in the Saudi petrochemical
industry compared to other locations.
Table 6.28 Market Factors’ Competitiveness Means
One-Sample Statistics
Location Factors N Mean Std. Deviation Std. Error Mean
Large host market 42 1.83 .853 .132
Market growth in the host market 42 1.90 .821 .127
Competition in them host market 42 2.83 .824 .127
Market familiarity 42 3.64 .821 .127
Table 6.29 Market Factors’ Competitiveness T-Test
6.2.3.4 Economic Factors’ Competitiveness
Table 6.30 summarises the competitiveness of each economic factor, including the mean,
standard deviation, and standard error for each cost factor. Table 6.31 shows the
competitiveness of each economic factor based on the t-test for the mean of competitiveness.
Most economic factors, including economic stability, economic growth, and exchange rates
received an average response rating of over 3.0 and therefore are considered to be
competitive factors compared to other locations in terms of the Saudi petrochemical industry.
Local financial support received a mean greater than 3.0. However, the t-test shows that local
financial support is significantly below the mean of 3.0, which indicates that this factor is not
a competitive factor compared to other locations for FDI in the Saudi petrochemical industry.
The economic stability factor has a mean competitiveness score above 3.0 (mean = 3.64). The
One-Sample Test
Location Factors
Test Value = 3
95% Confidence
Interval of the
Difference
t df Sig. (2-
tailed)
Mean
Difference Lower Upper
Large host market -8.864 41 .000 -1.167 -1.43 -.90
Market growth in the host market -8.648 41 .000 -1.095 -1.35 -.84
Competition in the host market -1.311 41 .197 -.167 -.42 .09
Market familiarity 5.074 41 .000 .643 .39 .90
Page 243
228
t-test shows that this is significantly (p < 0.05) more than 3.0 (t41 = 5.734, p = 0.000). Hence,
the economic stability factor is perceived to be a significantly more competitive factor for
FDI in the Saudi petrochemical industry compared to other locations. Sound macroeconomic
management and an inflection point in the world energy markets have made the Saudi's
economy stable, despite the global financial crisis. Saudi Arabia‘s economy ranks 3rd in the
world for macroeconomic stability as a result of a healthy fiscal environment, relatively low
interest rates, and inflation that has been kept under control (SAGIA, 2009). As result, the
economic stability factor is considered to be a competitive factor for FDI in the Saudi
petrochemical industry compared to other locations.
The economic growth factor has a mean competitiveness score above 3.0 (mean = 3.83). The
t-test shows that this is significantly (p < 0.05) more than 3.0 (t41 = 6.331, p = 0.000). Hence,
the economic growth factor is perceived to be a significantly more competitive factor for FDI
in the Saudi petrochemical industry compared to other locations. Saudi Arabia is one of the
world‘s 25 largest economies (24th), and No.1 in the Middle Eastern region. Saudi Arabia is
one of the fastest-growing countries in the world and is expected to continue growing as the
global financial markets turmoil has had little direct effect on the Middle East. Saudi Arabia‘s
economy has experienced a boom over the last five years, driven primarily by the strength of
the demand for oil in the international oil markets, and increasing domestic oil production
capacity (SAGIA, 2008). All of this has contributed to the economic growth factor as a
competitive factor for FDI in the Saudi petrochemical industry compared to other locations.
The exchange rate factor has a mean competitiveness score above 3.0 (mean = 4.21). The t-
test shows that this is significantly (p < 0.05) more than 3.0 (t41 = 11.538, p = 0.000). Hence,
the exchange rates factor is perceived to be a significantly more competitive factor for FDI in
the Saudi petrochemical industry compared to other locations. The Saudi Riyal is pegged to
the US Dollar, and is based on a fixed exchange-rate policy (SAGIA, 2009). Therefore, the
exchange rate in Saudi Arabia is less volatile and more stable than other locations, as the US
Dollar is used for international trade. As a result, the exchange rate factor is considered to be
a competitive factor for FDI in the Saudi petrochemical industry compared to other locations.
The local financial support factor has a mean competitiveness score above 3.0 (mean = 3.12).
However, the t-test shows that statistically this is not significantly (p > 0.05) greater than 3.0
(t41 = 0.819, p = 0.418). Hence, the local financial support factor is perceived to be a
Page 244
229
significantly less competitive factor for FDI in the Saudi petrochemical industry compared to
other locations. Saudi Arabia has advanced banking services which actively support
economic growth by financing development projects. However, Saudi financial firms are
very conservative, and lending normally takes a long time to be approved. It is also hard to
get and this may reflect the minor effect of the recent global financial crises on the Saudi
financial system. Moreover, Doing Business 2008-2009 did an overall ranking for Saudi
Arabia and its competitiveness, and found that Saudi Arabia is hindered by lower rankings in
areas such as getting credit from local financial firms (Doing Business, 2009). In addition,
Saudi Arabia‘s financial sector ranked 73rd in the Global Competitiveness Report, 2008-
2009, and continues to receive low marks for sophistication, transparency and investor
protection (Global Competitiveness Report, 2008-2009). As a result, the local financial
support is considered to be less competitive for FDI in the Saudi petrochemical industry
compared to other locations.
Table 6.30 Economic Factors’ Competitiveness Means
Table 6.31 Economic Factors’ Competitiveness T-Test
One-Sample Test
Location Factors
Test Value = 3
95% Confidence Interval of the Difference
t df Sig. (2-tailed) Mean Difference Lower Upper
Economic stability 5.734 41 .000 .643 .42 .87
Economic growth 6.331 41 .000 .833 .57 1.10
Exchange rates 11.538 41 .000 1.214 1.00 1.43
Local financial support .819 41 .418 .119 -.17 .41
6.2.3.5 Infrastructure and Technological Factors’ Competitiveness
Table 6.32 summarises the competitiveness of each kind of infrastructure and technological
factor including the mean, standard deviation and standard error for each cost factor. Table
6.33 shows the competitiveness of each kind of infrastructure and technological factor based
One-Sample Statistics
Location Factors N Mean Std. Deviation Std. Error Mean
Economic stability 42 3.64 .727 .112
Economic growth 42 3.83 .853 .132
Exchange rates 42 4.21 .682 .105
Local financial support 42 3.12 .942 .145
Page 245
230
on the t-test for the average mean of competitiveness. Most of the infrastructure and
technological factors received a mean greater than 3.0, including the level of infrastructure,
high industrial concentration (clustering), access to reliable and cooperative suppliers, the
availability of factory sites (land), the availability of raw materials and geographical
proximity, and are considered to be competitive factors for FDI compared to other locations
in the Saudi petrochemical industry. However, the availability of a well-qualified workforce
received an average mean above 3.0, but the t-test shows that it was not significantly above
the mean of 3.0, and therefore this factor is considered to be an uncompetitive factor for FDI
compared to other locations in the Saudi petrochemical industry.
The level of the infrastructure factor has a mean competitiveness score above 3.0 (mean =
3.67). The t-test shows that this is significantly (p < 0.05) more than 3.0 (t41 = 5.496, p =
0.000). Hence, the level of infrastructure factor is perceived to be a significantly more
competitive factor for FDI in the Saudi petrochemical industry compared to other locations.
Saudi Arabia has modern airports, ports, and roads that support the transfer of products
globally for heavy industries such as the petrochemical industry, and some of the
infrastructure in the special economic cities are designed specifically for the petrochemical
industry. There are a number of significant infrastructure developments in Saudi Arabia
which are set to improve the project enabler and logistics facilities for investors in the
petrochemical industry. These include expansions of the existing industrial cities of Jubail
and Yanbu, the creation of new economic cities around Saudi Arabia, and the development of
a number of standalone projects to improve Saudi Arabia's transport and logistics network
(SAGIA, 2008). As a result, the level of infrastructure factor is considered to be a competitive
factor for FDI in the Saudi petrochemical industry compared to other locations.
The high industrial concentration (clustering) factor has a mean competitiveness score greater
than 3.0 (mean = 4.24). The t-test shows that this is significantly (p < 0.05) more than 3.0 (t41
= 13.000, p = 0.000). Hence, the high industrial concentration (clustering) factor is perceived
to be a significantly more competitive factor for FDI in the Saudi petrochemical industry
compared to other locations. Saudi Arabia has had great success in attracting new industries
to the industrial cities of Jubail on the Arabian Gulf and Yanbu on the Red Sea. Over 200
companies have invested more than $60bn in these cities, providing employment for over
85,000 workers. They also host some of the world‘s largest petrochemical facilities, and both
cities are currently being expanded to cater for increased demand (SAGIA, 2007). So far,
Page 246
231
Jubail has attracted over half of the Kingdom‘s total foreign direct investment, mainly in the
petrochemical sector. It is home to 77% of Saudi Arabia‘s petrochemical production which
makes up 6-7% of the world‘s supply. In total, Jubail produces around 70% of the Kingdom‘s
non-oil exports, with 181 industries already present, and another 95 in design or construction.
In February 2005, the Financial Times Foreign Direct Investment magazine named Jubail as
the city with the best economic potential in the Middle East, reflecting its future growth
prospects. Saudi Arabia is also currently planning several new economic industrial cities and
is hoping that these will replicate the success of Jubail and Yanbu in attracting new
investment and job creation to the Kingdom. All of the economic cities will involve the
development of an excellent infrastructure and supporting facilities for industrial users
(SAGIA, 2007). As a result the high industrial concentration (clustering) factor is considered
to be more competitive for FDI in the Saudi petrochemical industry compared to other
locations.
The availability of a well-qualified workforce factor has a mean competitiveness score of less
than 3.0 (mean = 2.07). The t-test shows that this is significantly (p < 0.05) less than 3.0 (t41 =
-5.891, p = 0.000). Hence, the availability of a well-qualified workforce factor is perceived to
be a significantly less competitive factor for FDI in the Saudi petrochemical industry
compared to other locations. In the Doing Business report, 2008-2009, Saudi Arabia's overall
ranking and its competitiveness is hindered by lower rankings in areas such as employment
and especially the availability of a well-qualified workforce (Doing Business, 2009).
Furthermore, The Global Competitiveness Report, 2008-2009, undertook an executive
opinion survey in which respondents were asked to select the most problematic areas for
doing business in Saudi Arabia. The results indicate the significance of the challenges posed
by Saudi Arabia‘s labour market which ranked 63rd in the world (Global Competitiveness
Report, 2008-2009). Mina‘s (2007) study revealed that the GCC countries lag behind in terms
of human capital as far as availability and quality are concerned, which are disadvantages for
FDI location attractiveness, and which makes these countries less attractive compared to
other locations, especially for labour-intensive and efficiency-seeking FDI. According to
Achoui (2009), most of the Gulf countries experience a shortage of skilled and unskilled
workers which has led to a high dependence on foreign labour. This is due to low population
size, insufficient educational systems in these countries, and culturally related issues such as
traditions and values. These have all conspired to add to the shortage of skilled labour in the
Gulf countries. Moreover, Saudi nationals prefer to work in the government sector rather than
Page 247
232
in the private sector, because the government sector is more stable, offers higher prestige and
higher salaries (Achoui, 2009). As result, the availability of a well-qualified workforce factor
is less competitive for FDI in the Saudi petrochemical industry compared to other locations.
The access to reliable and cooperative suppliers factor has a mean competitiveness score
greater than 3.0 (mean = 4.33). The t-test shows that this is significantly (p < 0.05) more than
3.0 (t41 = 15.153, p = 0.000). Hence, the access to reliable and cooperative suppliers‘ factor is
perceived to be a significantly more competitive factor for FDI in the Saudi petrochemical
industry compared to other locations. Saudi Arabia is the 11th largest supplier of
petrochemical globally, producing 7-8% of the world supply, and the Kingdom has ambitious
plans to increase this to 13-14% by 2010 (SAGIA, 2007). As result, there are extensive and
wide-ranging aspects of the supplier and support services to the petrochemical sector.
Therefore, the access to reliable and cooperative suppliers' factor is more competitive for FDI
in the Saudi petrochemical industry compared to other locations.
The availability of factory sites (land) factor has a mean competitiveness score above 3.0
(mean=3.98). The ―t‖ test shows that this is significantly (p<0.05) more than 3.0 (t41 = 9.299,
p=.000). Hence, the availability of factory sites (land) factor is perceived to be a significantly
more competitive factor for FDI in the Saudi petrochemical industry compared to other
locations. Saudi Arabia provides land for new projects at a low competitive price. There are
also new industrial cities under development that will provide new land for new investment.
As a result, the availability of factory sites (land) factor is considered to be a more
competitive factor for FDI in the Saudi petrochemical industry compared to other locations.
The availability of raw materials factor has a mean competitiveness score above 3.0
(mean=4.81). The ―t‖ test shows that this is significantly (p<0.05) more than 3.0 (t41 29.507,
p=.000). Hence, the availability of raw materials factor is perceived to be a significantly more
competitive factor for FDI in the Saudi petrochemical industry compared to other locations.
Saudi Arabia is the 11th largest supplier of petrochemical globally, producing 7-8% of the
world‘s supply at low competitive prices (SAGIA, 2007). As a result, the raw materials for
the petrochemical industry are available to all domestic and foreign investors in Saudi Arabia
more than at any other locations. Therefore, the availability of raw materials factor is a more
competitive factor for FDI in the Saudi petrochemical industry compared to other locations.
Page 248
233
The geographical proximity factor has a mean competitiveness score above 3.0 (mean=3.90).
The ―t‖ test shows that this is significantly (p<0.05) more than 3.0 (t41= 6.677, p=.000).
Hence, the geographical proximity factor is perceived to be a significantly more competitive
factor for FDI in the Saudi petrochemical industry compared to other locations. Location-
wise, Saudi sits at the hub of the world‘s most dynamic economies. Straddling the Red Sea
and the Arabian Gulf, Saudi Arabia offers unparalleled access to a diverse portfolio of
markets. Saudi Arabia's strategic geographic location offers access to the advanced markets
of the European Union and the fast-emerging transition economies of Eastern Europe, South
Asia, and Africa. The country is strategically located for exports to Europe and Asia, and
with South East Asia having emerged as a major destination for the country‘s petrochemical
output, Saudi Arabia is well located for trading purposes (SAGIA, 2009). As a result, the
geographical proximity factor is a more competitive factor for FDI in the Saudi
petrochemical industry compared to other locations.
Table 6.32 Infrastructure and Technological Factors’ Competitiveness Means
One-Sample Statistics
Location Factors N Mean Std. Deviation Std. Error Mean
Level of infrastructure 42 3.67 .786 .121
Clustering 42 4.24 .617 .095
Availability of qualified work force 42 2.07 1.022 .158
Access to reliable and cooperative suppliers 42 4.33 .570 .088
Availability of factory sites 42 3.98 .680 .105
Availability of raw materials 42 4.81 .397 .061
Geographical proximity 42 3.90 .878 .136
Table 6.33 Infrastructure and Technological Factors’ Competitiveness T-Test
One-Sample Test
Location Factors
Test Value = 3
95% Confidence Interval of
the Difference
t df Sig. (2-
tailed)
Mean
Difference Lower Upper
Level of infrastructure 5.496 41 .000 .667 .42 .91
Clustering 13.000 41 .000 1.238 1.05 1.43
Availability of qualified work force -5.891 41 .000 -.929 -1.25 -.61
Access to reliable and cooperative suppliers 15.153 41 .000 1.333 1.16 1.51
Availability of factory sites 9.299 41 .000 .976 .76 1.19
Availability of raw materials 29.507 41 .000 1.810 1.69 1.93
Geographical proximity 6.677 41 .000 .905 .63 1.18
Page 249
234
6.2.3.6 Political and Legal Factors’ Competitiveness
Table 6.34 summarises the competitiveness of each political and legal factor, including the
mean, standard deviation, and standard error for each cost factor. Table 6.35 shows the
competitiveness of each of these factors based on the t-test for the average mean of
competitiveness. Some political and legal factors received a mean greater than 3.0, including
political stability, benign environmental legislation towards FDI, and diplomatic ties with the
host country. These factors are considered to be competitive location factors compared to
other locations in the Saudi petrochemical industry. Other factors received a mean score of
above 3.0, including international trade agreements and tax reductions in the host country.
The t-test reveals that these factors are significantly below the mean, and they are considered
to be less competitive factors compared to other location factors in the Saudi petrochemical
industry. The legal and regulatory system factor received an average response rate of below
3.0 and therefore it is considered to be an uncompetitive factor compared to locations in
Saudi petrochemical industry.
The political stability factor has a mean competitiveness score greater than 3.0 (mean = 4.21).
The t-test shows that this is significantly (p < 0.05) more than 3.0 (t41 = 11.538, p = 0.000).
Hence, the political stability factor is perceived to be a significantly more competitive factor
for FDI in the Saudi petrochemical industry compared to other locations. Saudi Arabia is
considered by many MNCs to be one of the most stable country in the region (SAGIA, 2009).
As a result, the political stability factor is considered to be a more competitive factor for FDI
in the Saudi petrochemical industry compared to other locations.
The international trade agreements factor has a mean competitiveness score above 3.0 (mean
= 3.19). However, the t-test shows that statistically this is not significantly (p > 0.05) greater
than 3.0 (t41 = 1.213, p = 0.232). Hence, the international trade agreements factor is perceived
to be a significantly less competitive factor for FDI in the Saudi petrochemical industry
compared to other locations. Saudi Arabia is a main player in commercial life around the
world. By signing agreements with many countries as part of the GCC and the WTO, Saudi
Arabia has developed powerful cooperation within the world economy. It is clear that WTO
membership will create sustainable macroeconomic benefits for Saudi Arabia, and will create
substantial opportunities for producers in the Kingdom to exploit growing export markets.
The petrochemical industry will be a major beneficiary of WTO accession, as Saudi Arabia
Page 250
235
has managed to negotiate a continuation of competitively priced natural gas liquid feedstock
(SAGIA, 2007). The Saudi petrochemical industry stands to gain from the WTO provisions,
including its extension to services, particularly relating to finance, insurance, and
transportation, the prices of which could now decrease (BMI, 2009). However, the benefits
of trade agreements such as those associated with the WTO may need some years to take
effect, as Saudi Arabia joined the WTO in 2005. Therefore, the international trade
agreements factor is considered to be less competitive for FDI in the Saudi petrochemical
industry compared to other locations.
The tax reduction in the host country factor has a mean competitiveness score above 3.0
(mean = 3.07). However, the t-test shows that statistically this is not significantly (p > 0.05)
greater than 3.0 (t41 = 0.408, p = 0.685). Hence, the tax reduction in the host country factor is
perceived to be a significantly less competitive factor for FDI in the Saudi petrochemical
industry compared to other locations. A new tax code was introduced in Saudi Arabia in
2004. This reduced the tax payable by foreign investors to 20%, a level significantly below
comparable rates in the USA and in most of Europe. The tax code also contains a provision to
allow losses to be carried forward to following years, along with allowable deductions for
R&D expenditure (SAGIA, 2007). However, FDI in Saudi Arabia may be looking for better
tax incentives, and the current tax rate does not satisfy them as other locations in the region
offer better tax rates. An example is Qatar with a 10% corporate-tax rate for foreign
investors. Therefore, the tax reduction in the host country factor is considered to be less
competitive for FDI in the Saudi petrochemical industry compared to other locations.
The benign environmental legislation towards FDI factor has a mean competitiveness score
above 3.0 (mean = 3.79). The t-test shows that this is significantly (p < 0.05) more than 3.0
(t41 = 6.267, p = 0.000). Hence, the benign environmental legislation towards FDI factor is
perceived to be a significantly more competitive factor for FDI in the Saudi petrochemical
industry compared to other locations. World attention is increasingly being drawn to the
unique investment opportunities in Saudi Arabia. There are a variety of reasons for this
situation. Amongst the most significant is the huge effort on the part of the Saudi
government, encompassing economic reform, improvements designed to transform the
investment environment and the opening up of more sectors to investment opportunities.
These efforts have been streamlined through the activities of SAGIA, which works in
conjunction with all governmental agencies and institutions, to improve the investment
Page 251
236
environment. The significant investment interest in Saudi Arabia as demonstrated by
increased FDI and the large number of on-going major capital projects, shows the success of
the Kingdom in reforming its investment environment, and in attracting new investors
(SAGIA, 2008). In the Doing Business report from the World Bank and the IFC (Doing
Business, 2009) Saudi Arabia was ranked 16th in 2008, up from 23rd in the preceding year.
The most significant improvements were in protecting investors and closing a business. The
former success was due to new rules on the disclosure and approval of related-party
transactions, as well as stronger liabilities for directors. The Kingdom‘s ranking improvement
to 16th is a strong sign of progress, and places Saudi Arabia ahead of such advanced
economies as Sweden, Germany, and Switzerland (Doing Business, 2009). Therefore, the
benign environmental legislation towards FDI factor is considered to be more competitive for
FDI in the Saudi petrochemical industry compared to other locations.
The diplomatic ties with the host country factor has a mean competitiveness score above 3.0
(mean = 3.79). The t-test shows that this is significantly (p < 0.05) more than 3.0 (t41 = 7.103,
p = 0.000). Hence, the diplomatic ties with the host country factor is perceived to be a
significantly more competitive factor for FDI in the Saudi petrochemical industry compared
to other locations. For many years, Saudi Arabia has built good and balanced diplomatic
relationships with many countries that is reflected in the wide range of countries investing in
the country. In addition, normally the Saudi government remains neutral with regard to any
conflicts in the world. Therefore, the diplomatic ties with the host country factor is consider
more competitive for FDI in the Saudi petrochemical industry compared to other locations.
The legal and regulatory system factor has a mean competitiveness score below 3.0 (mean =
2.52). The t-test shows that this is significantly (p < 0.05) less than 3.0 (t41 = -2.963, p =
0.005). Hence, the legal and regulatory system factor is perceived to be a significantly less
competitive factor for FDI in the Saudi petrochemical industry compared to other locations.
In April 2000, a new Foreign Investment Law was introduced which served to kick-start the
liberalization process to make Saudi Arabia more business friendly and receptive to FDI. The
provisions of the new law included allowing full foreign ownership of companies and
property, eliminating the requirement for joint ventures with local partners, strengthening
foreign investor rights and giving foreign investors equal treatment as domestic companies
(Al Mofleh, 2002; Ramady and Saee, 2007). However, dispute settlement in Saudi Arabia
continues to be a time-consuming and uncertain process. Even after a decision is reached in a
Page 252
237
dispute, effective enforcement of the judgment can still take years. Because of this, many
foreign firms investing in Saudi Arabia include in contracts a foreign arbitration clause (PRS,
2008). Moreover, Saudi Arabia‘s ranking in the World Bank/IFC‘s Doing Business report
(Doing Business, 2009) and its competitiveness, is hindered by lower rankings in areas such
as contract enforcement, where further reform is required to reflect international best
practices. Therefore, the legal and regulatory system factor is considered to be less
competitive for FDI in the Saudi petrochemical industry compared to other locations.
Table 6.34 Political and Legal Factors’ Competitiveness Means
One-Sample Statistics
Location Factors N Mean Std. Deviation Std. Error Mean
Political stability 42 4.21 .682 .105
International trade agreements 42 3.19 1.018 .157
Tax reductions in the host country 42 3.07 1.135 .175
Benign environmental legislation toward FDI 42 3.79 .813 .125
Diplomatic ties with the host country 42 3.79 .717 .111
Legal and regulatory system 42 2.52 1.042 .161
Table 6.35 Political and Legal Factors’ Competitiveness T-Test
One-Sample Test
Location Factors
Test Value = 3
95% Confidence Interval
of the Difference
t df Sig. (2-
tailed)
Mean
Difference Lower Upper
Political stability 11.538 41 .000 1.214 1.00 1.43
International trade agreements 1.213 41 .232 .190 -.13 .51
Tax reductions in the host country .408 41 .685 .071 -.28 .43
Benign environmental legislation toward FDI 6.267 41 .000 .786 .53 1.04
Diplomatic ties with the host country 7.103 41 .000 .786 .56 1.01
Legal and regulatory system -2.963 41 .005 -.476 -.80 -.15
6.2.3.7 Social and Cultural Factors’ Competitiveness
Table 6.36 summarises the competitiveness of each social and cultural factor, including the
mean, standard deviation, and standard error for each cost factor. Table 6.37 shows the
competitiveness of each social and cultural factor based on the t-test for the mean of
competitiveness. The local employees‘ loyalty to the firm is the only factor in the social and
cultural factors with a significant mean above 3.0 and therefore it is considered to be a
competitive factor compared to other locations in the Saudi petrochemical industry. However,
Page 253
238
all other factors related to the social and cultural factors had a mean significantly below 3.0,
including cultural distance from the home country, attitude of the local community towards
the firm and language, all of which are considered to be less competitive factors compared to
other locations in the Saudi petrochemical industry.
The cultural distance from the home country factor has a mean competitiveness score of less
than 3.0 (mean = 2.07). The t-test shows that this is significantly (p < 0.05) less than 3.0 (t41 =
-5.891, p = 0.000). Hence, the cultural distance from the home country factor is perceived to
be a significantly less competitive factor for FDI in the Saudi petrochemical industry
compared to other locations. Saudi Arabia's culture is very unique, and some foreign
investors who are unfamiliar with it may find it difficult to understand it and deal with.
According to Fenwick, Edwards & Buckley (2003), cultural distance between the host and
home country will increase the cost of obtaining the relevant information with regard to the
business environment and the conditions in the host country such as language, education,
business practices, culture, and industrial relations environment. Therefore, the cultural
distance from the home country factor is considered to be less competitive for FDI in the
Saudi petrochemical industry compared to other locations.
The attitude of the local community towards the firm factor has a mean competitiveness score
of less than 3.0 (mean = 2.86). The t-test shows that statistically this is not significantly less
(p > 0.05) than 3.0 (t41 = -0.948, p = 0.349). Hence, the attitude of the local community
towards the firm factor is perceived to be a significantly less competitive factor for FDI in the
Saudi petrochemical industry compared to other locations. Saudi Arabia people are very
conservative in their dealings with foreigners and this may negatively affect the
competiveness of the country resulting from the discomfort that locals feel when dealing with
foreign firms. Therefore, the attitude of the local community towards the firm is considered to
be a less competitive factor for FDI in the Saudi petrochemical industry compared to other
location
The local employees‘ loyalty to the firm factor has a mean competitiveness score above 3.0
(mean = 3.36). The t-test shows that this is significantly (p < 0.05) more than 3.0 (t41 = 3.186,
p = 0.003). Hence, the local employees‘ loyalty to the firm factor is perceived to be a
significantly more competitive factor for FDI in the Saudi petrochemical industry compared
to other locations. The limited number of Saudi nationals in the private sector is due to the
Page 254
239
preference on the part of Saudis to work for the government sector because there is more
stability, prestige, and higher salaries than in the private sector (Achoui, 2009). However,
now better educated Saudis are entering the private sector and gained higher positions in
many MNCs working in Saudi Arabia. As a result, Saudi loyalty to foreign firms has
increased. Therefore, the local employees‘ loyalty to the firm factor is considered to be more
competitive for FDI in the Saudi petrochemical industry compared to other locations.
The language factor has a mean competitiveness score below 3.0 (mean = 2.90). The t-test
shows that statistically this is not significantly (p > 0.05) less than 3.0 (t41 = -0.703, p =
0.486). Hence, the language factor is perceived to be a significantly less competitive factor
for FDI in the Saudi petrochemical industry compared to other locations. The Arabic
language is the dominant language in Saudi Arabia with only small numbers of the
population speaking more than their native language. MNCs may find it difficult to
communicate with some Saudi firms and with the community in a language other than
Arabic, even though the English language is widely accepted in the Saudi business
community. Therefore, the language factor is considered to be a less competitive factor for
FDI in the Saudi petrochemical industry compared to other locations.
Table 6.36 Social and Cultural Factors’ Competitiveness Means
One-Sample Statistics
Location Factors N Mean Std. Deviation Std. Error Mean
Cultural distance from home country 42 2.07 1.022 .158
Attitude of local community towards the firm 42 2.86 .977 .151
Local employees' loyalty to the firm 42 3.36 .727 .112
Language 42 2.90 .878 .136
Table 6.37 Social and Cultural Factors’ Competitiveness T-Test
One-Sample Test
Location Factors
Test Value = 3
95% Confidence
Interval of the
Difference
t df Sig. (2-
tailed)
Mean
Difference Lower Upper
Cultural distance from home country -5.891 41 .000 -.929 -1.25 -.61
Attitude of local community towards the firm -.948 41 .349 -.143 -.45 .16
Local employees' loyalty to the firm 3.186 41 .003 .357 .13 .58
Language -.703 41 .486 -.095 -.37 .18
Page 255
240
6.3 Location Factors Correlations
6.3.1 Introduction
Correlation analysis is used to describe the strength and direction of the linear relationship
between two variables (Field, 2005; Pallant, 2007). The Pearson product-moment coefficient
is designed for interval level (continuous) variables. It can also be used if we have one
continuous variable (e.g. scores on a measure of self-esteem) and one dichotomous variable
(e.g. sex: M/F) (Pallant, 2007). The coefficient will almost certainly lie between 0 (zero or no
relationship between the two variables) and 1 (a perfect relationship) – this indicates the
strength of a relationship (Field, 2005). The closer the coefficient is to 1, the stronger the
relationship; the closer it is to 0, the weaker the relationship; the coefficient will be either
positive or negative – this indicates the direction of a relationship (Bryman and Bell, 2007).
The Spearman rank correlation is designed for use with ordinal level or ranked data and is
particularly useful when the data do not meet the criteria for Pearson‘s correlation (Pallant,
2007). It is the same as Pearson‘s r in terms of its outcome, in that the computed value of rho
will be either positive or negative and will vary between 0 and 1 (Bryman and Bell, 2007).
The size of the absolute value (ignoring the sign) provides an indication of the strength of the
relationship. The size of the value of correlation can range from -1 to 1 and this value
indicates the strength of the relationship between the two variables. When we have a
correlation value of 0, this indicates no relationship at all between the variables, while when
we have a correlation value of 1, this indicates a perfect positive correlation between the
variables, and when we have a correlation value of -1, this indicates a perfect negative
correlation between the variables. The sign at the front indicates whether there is a positive
correlation (as one variable increases, so too does the other) or a negative correlation (as one
variable increases, the other decreases) (Field, 2005; Bryman and Bell, 2007; Pallant, 2007).
For example, the strength of r = 0.3 and r = -0.3 is the same correlation strength, but in
different directions. Different authors have suggested different interpretations of correlation
strength (Bryman and Bell, 2007). However, Cohen (1988) and Pallant (2007) suggest the
following guidelines for correlation strength. Small: r = 0.10 to 0.29, Medium: r = 0.30 to
0.49 and Large: r = 0.50 to 1.0.
Page 256
241
6.3.2 Correlation Analysis
Correlation is often used to explore the relationship between groups of variables instead of
two variables. Because of that, it would be inconvenient and awkward to report all the
correlation coefficients in a paragraph for each relationship between the variables; the best
way is to present them in a table (Pallant, 2007). In the preceding discussion, no
consideration was given to relationships between the various factor scores. To examine these
relationships, Table 6.38 shows the matrix of Pearson correlations between the 12 factor
scores. Pearson correlations are based on the assumption that the relationship between the
variables being correlated is a bivariate normal relationship (Sheskin, 2007, p. 1353).
Because it is possible that the relationships between the variables in Table 6.38 are not
bivariate normal, Table 6.39 shows the matrix of Spearman rank correlations, which are
appropriate for any pair of variables if the variable values reflect a meaningful ordering
(Sheskin, 2007, p. 1353). In both the Pearson matrix and the Spearman matrix, a C in front of
a variable name implies that the variable is a competitiveness score. As seen from Table 6.38
and Table 6.39, the following analysis is a selected interpretation of some factors.
The relationship between cost factors‘ importance and cost factors‘ competitiveness was
investigated using the Pearson product-moment correlation coefficient. Preliminary analyses
were performed to ensure no violation of the assumptions of normality, linearity and
homoscedasticity. The result shows that there is a medium, positive correlation between the
two variables, where r = 0.434, n = 42, and p < 0.0005, with high importance of cost factors
associated with high competitiveness of cost factors.
The relationship between cost factors‘ importance and social and cultural factors‘
competitiveness was investigated using the Pearson product-moment correlation coefficient.
Preliminary analyses were performed to ensure no violation of the assumptions of normality,
linearity and homoscedasticity. The test result shows that there is a weak, negative correlation
between the two variables, where r = -0.028, n = 42, and p > 0.0005, with the high
importance of cost factors associated with the low competitiveness of social and cultural
factors.
The relationship between cost factors‘ importance and infrastructure and technological
factors‘ importance was investigated using the Pearson product-moment correlation
Page 257
242
coefficient. Preliminary analyses were performed to ensure no violation of the assumptions of
normality, linearity and homoscedasticity. The test result shows that there is a strong, positive
correlation between the two variables, where r = 0.548, n = 42, and p < 0.0005, with high
importance of cost factors associated with high importance of infrastructures and
technological factors.
The relationship between cost factors‘ competitiveness and social and cultural factors‘
competitiveness was investigated using the Pearson product-moment correlation coefficient.
Preliminary analyses were performed to ensure no violation of the assumptions of normality,
linearity and homoscedasticity. The test shows that there is a weak, negative correlation
between the two variables, where r = -0.25, n = 42, and p > 0.0005, with the high
competitiveness of cost factors associated with the low competitiveness of social and cultural
factors.
The relationship between market factors‘ competitiveness and cost factors‘ importance was
investigated using the Pearson product-moment correlation coefficient. Preliminary analyses
were performed to ensure no violation of the assumptions of normality, linearity and
homoscedasticity. The result shows that there is a weak positive correlation between the two
variables, where r = 0.156, n = 42, and p > 0.0005.
The relationship between economic factors‘ importance and market factors‘ importance was
investigated using the Pearson product-moment correlation coefficient. Preliminary analyses
were performed to ensure no violation of the assumptions of normality, linearity and
homoscedasticity. The result shows that there is a strong, positive correlation between the
two variables, r = 0.560, n = 42, p < 0.0005, with the low importance of market factors
associated with the low importance of economic factors.
The relationship between infrastructure and technological factors‘ importance and cost
factors‘ competitiveness was investigated using the Pearson product-moment correlation
coefficient. Preliminary analyses were performed to ensure no violation of the assumptions of
normality, linearity and homoscedasticity. The result shows that there is a strong, positive
correlation between the two variables, where r = 0.504, n = 42, and p < 0.0005, with the high
importance of infrastructure and technological factors associated with the high
competitiveness of cost factors.
Page 258
243
The relationship between political and legal factors‘ importance and infrastructure and
technological factors‘ importance was investigated using Spearman‘s rank correlation
coefficient. Preliminary analyses were performed to ensure no violation of the assumptions of
normality, linearity and homoscedasticity. The result shows that there is a strong, positive
correlation between the two variables, where rho = 0.524, n = 42, and p < 0.0005, with the
high importance of political and legal factors associated with the high importance of
infrastructure and technological factors.
The relationship between economic factors‘ competitiveness and political and legal factors‘
competitiveness was investigated using Spearman‘s rank correlation coefficient. Preliminary
analyses were performed to ensure no violation of the assumptions of normality, linearity and
homoscedasticity. The result shows that there is a strong, positive correlation between the
two variables, where rho = 0.511, n = 42, and p < 0.0005, with the high competitiveness of
economic factors associated with the high competitiveness of political and legal factors.
Page 259
244
Table 6.38 Pearson Correlations between the 12 Factors’ Scores
CostMean MktMean EconMean InfraMean PolMean SocMean CCostMean CMktMean CEconMean CInfraMean CPolMean CSocMean
CostMean Correlation 1 .427** .488** .548** .396** .232 .434** .156 .346* .295 .381* -.028
Sig. (2-tailed) .005 .001 .000 .009 .139 .004 .325 .025 .058 .013 .862
N 42 42 42 42 42 42 42 42 42 42 42 42
MktMean Correlation .427** 1 .560** .531** .404** .304 .266 .144 .195 .314* .403** .175
Sig. (2-tailed) .005 .000 .000 .008 .050 .089 .364 .216 .043 .008 .269
N 42 42 42 42 42 42 42 42 42 42 42 42
EconMean Correlation .488** .560** 1 .499** .478** .364* .366* .163 .349* .119 .397** .370*
Sig. (2-tailed) .001 .000 .001 .001 .018 .017 .304 .023 .451 .009 .016
N 42 42 42 42 42 42 42 42 42 42 42 42
InfraMean Correlation .548** .531** .499** 1 .550** .310* .504** .298 .190 .461** .409** .014
Sig. (2-tailed) .000 .000 .001 .000 .046 .001 .056 .229 .002 .007 .930
N 42 42 42 42 42 42 42 42 42 42 42 42
PolMean Correlation .396** .404** .478** .550** 1 .439** .460** .393* .172 .433** .496** .317*
Sig. (2-tailed) .009 .008 .001 .000 .004 .002 .010 .276 .004 .001 .041
N 42 42 42 42 42 42 42 42 42 42 42 42
SocMean Correlation .232 .304 .364* .310* .439** 1 .383* .311* .021 .107 .257 .453**
Sig. (2-tailed) .139 .050 .018 .046 .004 .012 .045 .895 .502 .100 .003
N 42 42 42 42 42 42 42 42 42 42 42 42
CCostMean Correlation .434** .266 .366* .504** .460** .383* 1 .360* .251 .475** .415** -.025
Sig. (2-tailed) .004 .089 .017 .001 .002 .012 .019 .109 .001 .006 .875
N 42 42 42 42 42 42 42 42 42 42 42 42
CMktMean Correlation .156 .144 .163 .298 .393* .311* .360* 1 .217 .267 .271 .236
Sig. (2-tailed) .325 .364 .304 .056 .010 .045 .019 .167 .088 .083 .132
N 42 42 42 42 42 42 42 42 42 42 42 42
CEconMean Correlation .346* .195 .349* .190 .172 .021 .251 .217 1 .366* .495** .008
Sig. (2-tailed) .025 .216 .023 .229 .276 .895 .109 .167 .017 .001 .961
N 42 42 42 42 42 42 42 42 42 42 42 42
CInfraMean Correlation .295 .314* .119 .461** .433** .107 .475** .267 .366* 1 .370* -.139
Sig. (2-tailed) .058 .043 .451 .002 .004 .502 .001 .088 .017 .016 .379
N 42 42 42 42 42 42 42 42 42 42 42 42
CPolMean Correlation .381* .403** .397** .409** .496** .257 .415** .271 .495** .370* 1 .147
Sig. (2-tailed) .013 .008 .009 .007 .001 .100 .006 .083 .001 .016 .351
N 42 42 42 42 42 42 42 42 42 42 42 42
CSocMean Correlation -.028 .175 .370* .014 .317* .453** -.025 .236 .008 -.139 .147 1
Sig. (2-tailed) .862 .269 .016 .930 .041 .003 .875 .132 .961 .379 .351
N 42 42 42 42 42 42 42 42 42 42 42 42
Page 260
245
Table 6.39 Spearman Rank Correlations between the 12 Factors’ Scores
CostMean MktMean EconMean InfraMean PolMean SocMean CCostMean CMktMean CEconMean CInfraMean CPolMean CSocMean
CostMean Correlation 1.000 .418** .499** .498** .374* .208 .427** .146 .349* .210 .395** -.037
Sig. (2-tailed) . .006 .001 .001 .015 .187 .005 .356 .023 .182 .010 .818
N 42 42 42 42 42 42 42 42 42 42 42 42
MktMean Correlation .418** 1.000 .588** .569** .393* .328* .242 .111 .177 .278 .372* .192
Sig. (2-tailed) .006 . .000 .000 .010 .034 .123 .483 .262 .075 .015 .222
N 42 42 42 42 42 42 42 42 42 42 42 42
EconMean Correlation .499** .588** 1.000 .505** .428** .283 .348* .131 .396** .099 .390* .330*
Sig. (2-tailed) .001 .000 . .001 .005 .069 .024 .407 .009 .531 .011 .033
N 42 42 42 42 42 42 42 42 42 42 42 42
InfraMean Correlation .498** .569** .505** 1.000 .524** .269 .439** .294 .292 .403** .423** .028
Sig. (2-tailed) .001 .000 .001 . .000 .084 .004 .059 .060 .008 .005 .860
N 42 42 42 42 42 42 42 42 42 42 42 42
PolMean Correlation .374* .393* .428** .524** 1.000 .400** .462** .426** .247 .394** .458** .279
Sig. (2-tailed) .015 .010 .005 .000 . .009 .002 .005 .115 .010 .002 .074
N 42 42 42 42 42 42 42 42 42 42 42 42
SocMean Correlation .208 .328* .283 .269 .400** 1.000 .360* .281 .067 .073 .256 .452**
Sig. (2-tailed) .187 .034 .069 .084 .009 . .019 .072 .673 .646 .102 .003
N 42 42 42 42 42 42 42 42 42 42 42 42
CCostMean Correlation .427** .242 .348* .439** .462** .360* 1.000 .347* .346* .453** .384* -.020
Sig. (2-tailed) .005 .123 .024 .004 .002 .019 . .024 .025 .003 .012 .898
N 42 42 42 42 42 42 42 42 42 42 42 42
CMktMean Correlation .146 .111 .131 .294 .426** .281 .347* 1.000 .303 .281 .268 .214
Sig. (2-tailed) .356 .483 .407 .059 .005 .072 .024 . .051 .072 .086 .173
N 42 42 42 42 42 42 42 42 42 42 42 42
CEconMean Correlation .349* .177 .396** .292 .247 .067 .346* .303 1.000 .400** .511** .056
Sig. (2-tailed) .023 .262 .009 .060 .115 .673 .025 .051 . .009 .001 .726
N 42 42 42 42 42 42 42 42 42 42 42 42
CInfraMean Correlation .210 .278 .099 .403** .394** .073 .453** .281 .400** 1.000 .344* -.145
Sig. (2-tailed) .182 .075 .531 .008 .010 .646 .003 .072 .009 . .026 .361
N 42 42 42 42 42 42 42 42 42 42 42 42
CPolMean Correlation .395** .372* .390* .423** .458** .256 .384* .268 .511** .344* 1.000 .171
Sig. (2-tailed) .010 .015 .011 .005 .002 .102 .012 .086 .001 .026 . .279
N 42 42 42 42 42 42 42 42 42 42 42 42
CSocMean Correlation -.037 .192 .330* .028 .279 .452** -.020 .214 .056 -.145 .171 1.000
Sig. (2-tailed) .818 .222 .033 .860 .074 .003 .898 .173 .726 .361 .279 .
N 42 42 42 42 42 42 42 42 42 42 42 42
Page 261
246
6.4 Hypotheses Analysis
5.4.1 Introduction
In this section, we critically assess the validity of the main research question by testing the
hypotheses in terms of the importance and competitiveness of the FDI location factors for
FDI in the Saudi petrochemicals industry.
6.4.2 Analysis
The first research question asks about the relative importance of the six location factors
(costs, markets, economics, infrastructure and technology, political and legal, and social and
cultural) from the point of view of the senior executives. To address this question a repeated
measurements analysis of variance was performed with regard to the average responses to the
items on the questionnaire for the six location factors (Sheskin 2007, p.1021). The six
response variables were the average scores on the part of the executives for the items
pertaining to each of the six factors. The single predictor variable was the variable reflecting
the identities of the six categories.
Mauchly‘s test of sphericity revealed that the covariance matrix of the scores was not
spherical (χ2 = 36.6, df = 14, p = .001). Therefore, the Greenhouse-Geisser approach was
used to adjust the degrees of freedom, which led to a p-value that was less than .0005.
(F[3.89, 159.6]=124.6). Thus, there is strong evidence that the executives rated the different
factors as having significantly different levels of importance in terms of choosing to locate in
Saudi Arabia. Figure 6.3 shows the relative ratings in terms of the importance of the six
factors. Figure 6.3 shows the mean importance scores as a function of factor type for each of
the six factors. The upper and lower bars attached to each score indicate the standard error of
the mean. Table 6.40 summarizes the results of within-subject contrast tests to determine
which pairs of adjacent factors in Figure 6.3 are significantly different from one another.
Page 262
247
Figure 6.3 The Relative Ratings of Importance of the Six Factors
Table 6.40 Within-Subjects Contrasts of Mean Location Factors’ Scores
Source FactorType
Type III Sum
of Squares df Mean Square F p
FactorType Cost vs. Infra/Tech .726 1 .726 4.389 .042
Infra/Tech vs.
PolLegal 1.779 1 1.779 12.587 .001
PolLegal vs. Econ 13.430 1 13.430 29.508 .000
Econ vs. Mkt 20.371 1 20.371 43.236 .000
Mkt vs. Soc/Cult 2.625 1 2.625 4.100 .049
Error
(FactorType)
Cost vs. Infra/Tech 6.786 41 .166
Infra/Tech vs.
PolLegal 5.793 41 .141
PolLegal vs. Econ 18.660 41 .455
Econ vs. Mkt 19.317 41 .471
Mkt vs. Soc/Cult 26.250 41 .640
Since the p-values in the last column of Table 6.40 are all less than .05, this implies that each
of the cost factors has a significantly different mean score from the similar-mean-score cost
factor it is compared with. Note that two of the p-values are only slightly less than .05, so the
evidence in these cases is weaker.
Page 263
248
The second research question asks about the relative competitiveness of Saudi Arabia with
regard to the six factors (costs, markets, economics, infrastructure and technology, political
and legal, and social and cultural) from the point of view of the senior executives. To address
this question, the preceding analyses were repeated, except that the six competitiveness
scores were analyzed in place of the importance.
Mauchly‘s test of sphericity revealed weak evidence that the covariance matrix was not
spherical (χ2 = 24.93, df = 14, p = .04). Therefore, the Greenhouse-Geisser approach
was used to adjust the degrees of freedom, which led to a p-value that was less than
.0005. (F[4.04,165.4]=73.9). Thus, there is strong evidence that the executives rated the
different factors as having significantly different levels of the competitiveness
compared to other locations. Figure 6.4 shows the mean competitiveness scores as a
function of factor type for each of the six factors. The upper and lower bars attached to
each score indicate the standard error of the mean. Table 6.41 summarizes the results of
within-subject contrast tests to determine which pairs of adjacent factors in Figure 6.4
are significantly different from each other. The result presented in Table 6.41 shows
that there of strong evidence that the executives rated the different factors in terms of
competitiveness as having significant different levels of Saudi location factors
competitiveness compared to other locations
Figure 6.4 The Relative Ratings of the Competitiveness of Saudi Arabia on the Six Factors
Page 264
249
Table 6.41 Within-Subjects Contrasts of Mean Competitiveness Factors’ Scores
Source FactorType
Type III Sum of
Squares df Mean Square F p
FactorType Cost vs. Infra/Tech .169 1 .169 1.089 .303
Infra/Tech vs.
Econ 1.006 1 1.006 3.365 .074
Econ vs. Pol/Legal 3.149 1 3.149 10.608 .002
Pol/Legal vs.
Soc/Cult 16.720 1 16.720 34.321 .000
Soc/Cult vs. Mkt 2.501 1 2.501 5.601 .023
Error
(FactorType)
Cost vs. Infra/Tech 6.377 41 .156
Infra/Tech vs.
Econ 12.257 41 .299
Econ vs. Pol/Legal 12.171 41 .297
Pol/Legal vs.
Soc/Cult 19.974 41 .487
Soc/Cult vs. Mkt 18.311 41 .447
The first two p-values in the last column of the table are not less than .05, and therefore, in
these cases, we have no evidence of a significant difference between the associated factors in
terms of competitiveness. For example, the p-value of .303 in the first row in the table
implies that we have no evidence of a significant difference between cost considerations and
considerations of infrastructure/technology. However, we can see significant differences in
the last three rows of the table.
The preceding two analyses made comparisons between the six factors for both importance
and competitiveness. Exactly the same statistical comparisons were performed except that,
instead of comparing between the six factors, a separate comparison was done within each of
the factors. This led to 6 × 2 = 12 different analyses similar to the two analyses (for location
and competitiveness) discussed above. For example, the first of the 12 analyses was
performed using the executives‘ responses to the first six items in the questionnaire—the
items reporting the respondents‘ opinions about specific cost categories pertaining to
location. The results of these analyses are summarized in Table 6.42.
Page 265
250
Table 6.42 Analyses of the Relative Significance of Location Item Scores within Each Major Factor
Major Factors and Sub-Factors Mean Standard
Error
Cost factors
4.04
.07 Energy costs 4.88 .05 Return on investment 4.74 .08 Cost of raw materials 4.60 .08 Transportation/logistics costs 4.12** .12 Factory site costs ( land costs) 3.29** .15 Labour costs 2.62** .17
Infrastructure and technological factors 3.91* .06 Availability of raw materials 4.69 .07 Access to reliable and cooperative suppliers 4.33* .14 Level of infrastructure (ports, roads, airports, etc.) 4.31 .07 Availability of factory sites (land) 4.02* .09 High industrial concentration (clustering) 3.86 .10 Geographical proximity 3.50* .14 Availability of well qualified workforce 2.64** .11
Political and legal factors 3.70** .07 Political stability 4.45 .09 Benign environmental legislation towards FDI 4.38 .09 Tax reductions in the host country 3.90** .13 Diplomatic ties with the host country 3.33** .11 International trade agreements 3.10 .14 Legal and regulatory system 3.05 .14
Economic factors 3.14** .12 Economic stability 3.62 .17 Exchange rates 3.62 .14 Local financial support 2.74** .16 Economic growth 2.57 .14
Market factors 2.44** .11 Market familiarity 2.88 .15 Level of competition in the host market 2.55 .11 Market growth in the host country 2.19** .16 Size of host markets 2.14 .13
Social and Cultural factors 2.19* .10 Attitude of the local community towards the firm 2.43 .16 Local employees‘ loyalty to the firm 2.38 .16 Cultural distance 2.12 .15 Language 1.83 .15
Note: The main factors are ordered in decreasing importance in terms of scores. In addition, the sub-factors
within the main factors are ordered in decreasing importance in terms of scores.
* p < 0.05 in comparison with the immediately preceding mean on the same level (main or sub).
** p < 0.01 in comparison with the immediately preceding sub-factor mean on the same level.
We can see in Table 6.42 that among the cost factors there is no significant difference
between ratings of energy costs and return on investment. Similarly, there is no significant
difference between return on investment and the low cost of raw materials. However, the
rating for transportation and logistics costs is significantly lower than the rating for the low
Page 266
251
cost of raw materials (p < .01). Table 6.43 shows an analysis similar to the analysis in Table
6.42, but using the competitiveness ratings instead of the location ratings.
Table 6.43 Analyses of the Relative Significance of Competitiveness Item Scores within Each Major
Factor
Major Factors and Sub-Factors Mean Standard
Error
Cost factors 3.92 .06
Energy costs 4.90 .05
Return on investment 4.45** .10
Low cost of raw materials 4.43 .08
Factory site costs (land costs) 3.83** .17
Transportation/logistics costs 3.48 .15
Labour costs 2.43** .16
Infrastructure and technological factors 3.86 .06
Availability of raw materials 4.81 .06
Access to reliable and cooperative suppliers 4.33** .09
High industrial concentration (clustering) 4.24 .10
Availability of factory sites (land) 3.98 .11
Geographical proximity 3.90 .14
Level of infrastructure (ports, roads, airports, etc.) 3.67 .12
Availability of well qualified workforce 2.07** .16
Economic factors 3.70 .09
Exchange rates 4.21 .11
Economic growth 3.83** .13
Economic stability 3.64 .11
Local financial support 3.12** .15
Political and legal factors 3.43** .08
Political stability 4.21 .11
Benign environmental legislation towards FDI 3.79** .13
Diplomatic ties with the host country 3.79 .11
International trade agreements 3.19** .16
Tax reductions in the host country 3.07 .18
Legal and regulatory system 2.52* .16
Social and cultural factors 2.80** .08
Local employees‘ loyalty to the firm 3.36 .11
Language 2.90** .14
Attitude of the local community towards the firm 2.86 .15
Cultural distance 2.07** .16
Market factors 2.55* .08
Market familiarity 3.64 .13
Level of competition in the host market 2.83** .13
Market growth in the host country 1.90** .13
Size of host markets 1.83 .13
Note: The main factors are ordered in terms of decreasing attractiveness scores. In addition, the sub-factors
within the main factors are ordered in terms of decreasing attractiveness scores.
* p < 0.05 in comparison with the immediately preceding mean on the same level (main or sub).
** p < 0.01 in comparison with the immediately preceding sub-factor mean on the same level.
Another question of interest about the location and competitiveness factors is whether
executives rate each factor significantly above or below the ―neutral‖ or ―same‖ score on a
Page 267
252
factor of 3. To address this question, each of the 12 high-level factor scores was analyzed in a
one-sample t-test to determine whether it was significantly different from 3, as recommended
by Sheskin (2007, p.157). Table 6.44 shows the descriptive statistics for the six location
scores.
Table 6.44 Descriptive Statistics for the Six Location Scores
Location Factor N Mean
Std.
Deviation
Std. Error
of Mean
Mean of Cost Factors Scores 42 4.040 .4697 .0725
Mean of Infrastructure/Technological Factors Scores 42 3.908 .3623 .0559
Mean of Political and Legal Factors Scores 42 3.702 .4222 .0651
Mean of Economic Factors Scores 42 3.137 .7655 .1181
Mean of Market Factors Scores 42 2.440 .6914 .1067
Mean of Social and Cultural Factors Scores 42 2.190 .6644 .1025
We can see that four of the mean factor scores are above the value of 3 and two of the mean
factor scores are below this value. Table 6.45 shows the results of one-sample t-tests to
determine whether the means are significantly different from the value 3.
Table 6.45 Results of One-Sample T-Tests for Location Factors
Location Factors
Test Value = 3
t df p
(2-tailed)
Mean
Difference
95% Confidence Interval
of the Difference
Lower Upper
Cost Factors 14.345 41 <.001 1.0397 .893 1.186
Infrastructure/Technological
Factors 16.247 41 <.001 .9082 .795 1.021
Political and Legal Factors 10.782 41 <.001 .7024 .571 .834
Economic Factors 1.159 41 .253 .1369 -.102 .375
Market Factors -5.244 41 <.001 -.5595 -.775 -.344
Social and Cultural Factors -7.896 41 <.001 -.8095 -1.017 -.602
We can see that the upper three factors in the table are significantly greater than the neutral
value of 3, each with a p-value of less than .001. Similarly, the lower two factors in the table
are significantly less than the neutral value of 3, again each with a p-value that is less than
.001. The rating for the Economic factors was not significantly different from the neutral
value of 3. Table 6.46 shows the descriptive statistics for the six competitiveness scores.
Page 268
253
Table 6.46 Descriptive Statistics for the Six Competitiveness Scores
Location Factors N Mean Std.
Deviation
Std. Error
Mean
Mean of Cost Factors Scores 42 3.921 .3882 .0599
Mean of Infrastructure/Technological Factors Scores 42 3.857 .3812 .0588
Mean of Economic Factors Scores 42 3.702 .5556 .0857
Mean of Political and Legal Factors Scores 42 3.429 .5272 .0814
Mean of Social and Cultural Factors Scores 42 2.798 .54167 .08358
Mean of Market Factors Scores 42 2.554 .5397 .0833
We can see that four of the mean factor scores are above the value of 3 while two of the mean
factor scores are below this value. Table 6.47 shows the results of one-sample t-tests to
determine whether the means are significantly different from the value 3. From the fact that
all the p-values are less than .05 we can see that all of the mean factor scores are significantly
different from the value 3.
Table 6.47 Results of One-Sample T-Tests for Competitiveness Factors
Location Factor
Test Value = 3
t df p
(2-tailed)
Mean
Difference
95% Confidence Interval
of the Difference
Lower Upper
Cost Factors 15.368 41 <.001 .9206 .800 1.042
Infrastructure/Techno
logical Factors 14.571 41 <.001 .8571 .738 .976
Economic Factors 8.193 41 <.001 .7024 .529 .876
Political and Legal
Factors 5.268 41 <.001 .4286 .264 .593
Social and Cultural
Factors -2.421 41 .020 -.20238 -.3712 -.0336
Market Factors -5.361 41 <.001 -.4464 -.615 -.278
6.4.3 One-Way Between-Groups ANOVA
One-way between-groups ANOVA is used when we have one independent (grouping)
variable with three or more levels (groups) and one dependent continuous variable. The 'one-
way' part of the title indicates there is only one independent variable, and 'between-groups'
means that we have different subjects or cases in each of the groups (Pallant, 2007).
Page 269
254
6.4.4 Statistical Significance
A test of statistical significance allows the analyst to estimate how confident he or she can be
that the results deriving from a study based on a randomly selected sample is generalizable to
the population from which the sample is drawn (Bryman & Bell, 2007).
6.4.5 Testing the Hypotheses
6.4.5.1 Testing the Hypothesis for Location Factors’ Importance
One of the main hypotheses of the study is:
H1: The relative importance of FDI location factors will vary in the Saudi
petrochemicals industry.
To test this hypothesis, we use the repeated measures ANOVA procedure. The summary of
the results for this ANOVA model is given in Table 6.48, Table 6.49 and Table 6.50.
Table 6.48 Multivariate Tests for Different Factors for Importance
Effect Value F Sig. Eta Squared
factor1 Pillai's Trace 0.929 96.716a 0.000 0.929
Wilks' Lambda 0.071 96.716a 0.000 0.929
Hotelling's Trace 13.070 96.716a 0.000 0.929
Roy's Largest Root 13.070 96.716a 0.000 0.929
Table 6.49 Tests of Within-Subjects Effects for the Importance of the Factors
Measure: Factors
Source
Type III Sum of
Squares df
Mean
Square F Sig.
Eta
Squared
factor1 Sphericity
Assumed
128.143 5 25.629 124.648 0.000 0.752
Greenhouse-
Geisser
128.143 3.894 32.911 124.648 0.000 0.752
Huynh-Feldt 128.143 4.353 29.437 124.648 0.000 0.752
Lower-bound 128.143 1.000 128.143 124.648 0.000 0.752
error(factor1)
Sphericity
Assumed
42.150 205 .206
Greenhouse-
Geisser
42.150 159.637 .264
Huynh-Feldt 42.150 178.479 .236
Lower-bound 42.150 41.000 1.028
Page 270
255
Table 6.50 Tests of Between-Subjects Effects for the Importance of the Factors
Measure: Factors
Transformed Variable: Average
Source Type III Sum of Squares df Mean Square F Sig. Partial Eta Squared
Intercept 2639.434 1 2639.434 2619.558 0.000 0.985
Error 41.311 41 1.008
To validate this procedure, we need to test the null hypothesis that the error covariance matrix
of the orthonormalized transformed dependent variables is proportional to an identity matrix.
This is called the Mauchly‘s test of spericity. The analysis shows that the covariance matrix is
not proportional to the identity matrix and we reject the null hypothesis (Mauchly‘s W =
0.392, Chi-Square = 36.623 p value < 0.05).
The results of the repeated measures ANOVA clearly indicate that the mean importance score
for different factors vary (Wilk‘s lambda = 0.071, F = 96.716 p value < 0.05). The result does
not change for alternative measures (Pillai‘s Trace, Hotelling's Trace and Roy's Largest Root)
of this multivariate test statistic. Our results confirm the findings of UNCTAD (1998) which
concluded that the relative importance of location factors will change over time in particular
countries, as the economic environment in the host country, and globally, changes. At the
same time, the importance of some location factors remains stable. Similarly, our results are
in line with those of Cohen (2007) who argues that the decision to choose a cross-border
location on the part of a firm is a case-by-case decision, and cannot be generalised to other
location decisions, because the same location factors may be viewed differently by different
corporate executives, and the relative importance of these factors will vary according to the
type of investment and the objectives of the firm. Moreover, our finding confirms the study
by Mellahi, Gurmat, Frynas and Al-Bortmani (2003) who suggested that the relative
importance of location factors would be affected by the sector to which the FDI relates.
Furthermore, our results are similar to those of UNCTAD (1996) which concluded that
globalisation would have two effects on FDI location factors. First, MNEs use a wide range
of policies when evaluating the host country with regard to potential investment. Second, the
relative importance of FDI location factors has changed as a result of globalisation.
Page 271
256
Moreover, the importance of traditional location factors has not diminished as a result of
globalisation, but their importance in terms of FDI location decisions has declined. For
example, the market size of the host country is one of the most important location factors in
the opinion of many scholars. However, this factor has diminished in importance in terms of
FDI location decisions. At the same time, new factors have become more important with
regard to FDI location decisions – factors such as low costs, infrastructure quality, a benign
business environment and the availability of highly skilled workers in the host country.
Furthermore, Banga (2003) confirmed our result which showed that the effect of the location
factors will vary significantly from one nation to another, especially from developed nations
to developing nations. For example, low tax incentives is a significant factor for the attraction
of FDI in developing countries, but this is not an important factor in terms of attracting FDI
to developed countries. Many studies provide vast variations in terms of the factors that
influence FDI inflow, or, as Dunning (2008) suggested, a shopping list of factors that fail to
give the policy makers the correct and specific recommendations that identify the most
important related factors that influence FDI inflow for a specific location. In addition, Flores
and Aguilera (2007) believe that the assumptions underpinning FDI location choices have
shifted in the last 20 years, and that the change in the factors associated with choosing one
location over other locations in terms of FDI, remain uncertain and needs more study.
However, our results are in contrast with those of Nunnenkamp (2002) who made the point
that there is no strong evidence in recent empirical studies to support the view of the
influence of globalisation on competition for FDI between countries, and of the changes in
the relative importance of traditional and non-traditional location factors for FDI in
developing countries. He also concluded that there has been a surprisingly slight change in
the relative importance of location factors until now. According to Nunnenkamp (2002),
traditional market factors are still some of the most important factors for FDI location
decisions, and the large size of the host market has become more important rather than
weaker. On the other hand, non-traditional location factors such as cost factors and the
business environment have become less important with globalisation.
The sub-hypotheses formulated are as follows:
H1a: Cost factors play an important role in FDI location decisions in the Saudi
petrochemicals industry.
Page 272
257
H1b: Market factors play an important role in FDI location decisions in the Saudi
petrochemicals industry.
H1c: Economic factors play an important role in FDI location decisions in the Saudi
petrochemicals industry.
H1d: Infrastructure and technological factors play an important role in FDI location
decisions in the Saudi petrochemicals industry.
H1e: Political and legal factors play an important role in FDI location decisions in the
Saudi petrochemicals industry.
H1f: Social and cultural factors play an important role in FDI location decisions in the
Saudi petrochemicals industry.
Here we test the null hypothesis that the mean importance score is actually above 3. The t-test
results are summarised in Table 6.51.
Table 6.51 One-Sample Test for the Importance of Different Factors
Test Value = 3
Location Factor 95% Confidence Interval of the Difference
t df P value Mean Difference Lower Upper
Cost 14.345 41 0.000 1.03968 .8933 1.1860
Market -5.244 41 0.000 -0.55952 -.7750 -.3441
Economy 1.159 41 0.253 0.13690 -.1016 .3754
Infrastructure and Technology 16.247 41 0.000 0.90816 .7953 1.0211
Political & Legal 10.782 41 0.000 0.70238 .5708 .8339
Social -7.896 41 0.000 -0.80952 -1.0166 -.6025
H1a: Cost factors play an important role in FDI location decisions in the Saudi
petrochemicals industry.
Hypothesis H1a predicts that cost factors play an important role for petrochemical FDI when
a company chooses Saudi Arabia for its business. The cost factor has a mean score of 4.039.
The ―t‖ test shows that this is significantly (p<0.05) more than 3.0 (t41 = 14.345, p=.000).
Hence, cost factors are perceived to play an important role in FDI location decisions.
Therefore, hypothesis H1a is confirmed by the analysis. Our result support the findings of
Banga (2003) and Campos and Kinoshita (2003) in that cost factors are very important in
terms of the location decisions with regard to efficiency-seeking and resources-seeking FDI,
Page 273
258
and when the FDI is export-oriented and targets markets outside the host country. Our
findings also support the findings of Abdel-Rahman (2002) which indicate that cost factors
will influence the location decision for FDI in Saudi Arabia. The results are also in line with
those of Buckely, Devenney and Louvriere (2007) who conclude that cost factors play an
important role in FDI location decision making. Similarly, to our results, Gilmore et al.
(2003) conclude that the motives for the location of FDI have been explained by the concept
of cost minimisation, which implies that MNCs will choose the least cost location for its
production activities abroad. The results are also in line with those of Kang and Lee (2007) in
that a significant part of multinational activity tends to take the form of firms shifting their
production processes to low-cost locations. However, our result is different from the findings
of Nunnenkamp (2002) who concluded that non-traditional location factors such as cost
factors have become less important with globalization.
H1b: Market factors play an important role in FDI location decisions in the Saudi
petrochemicals industry.
Hypothesis H1b predicts that market factors are an important factor in terms of the location
decisions for petrochemical FDI when a company chooses Saudi Arabia as the location for its
business. Market factors have a mean score of less than 3.0. The ―t‖ test found that the mean
score is significantly (p<0.05) less than 3.0 (t41 = -5.244, p=.000). Thus, market factors are
not perceived to be important. Therefore, hypothesis H1b is not supported by the results and
the analysis. Our results support the findings of Mina (2007) who studied the factors that
influenced the location decisions for FDI in Gulf States countries including Saudi Arabia,
Bahrain, Oman, Kuwait, and the United Arab Emirates. He found that market factors in these
countries were not important in terms of FDI location decisions. He concluded that, due to
the small population sizes in the Gulf countries, economies of scale may not be realized, and
FDI inflows may be discouraged. Therefore, the influence of market size on FDI inflows may
be ambiguous. Our findings are also in line with those of Cleeve (2009) who concluded that
the significance of market factors on FDI location decision making is declining as other
variables such as policy variables are becoming more important in terms of FDI location. Our
results confirm the findings of Campos and Kinishita (2003) in that efficiency-seeking FDI
which target markets, are not interested in the national market of the host country and instead
target the export markets. Hence, the market factors of the host country will be of less
influence. This confirms the finding of Nunnenkamp (2002) that the relative importance of
Page 274
259
FDI location factors has changed as a result of globalization. Furthermore, the importance of
traditional location factors has not diminished as a result of globalization, but their
importance in terms of FDI location decisions has declined. For example, the market size of
the host country is one of the most important location factors in the opinion of many scholars.
However, this factor has diminished in importance in terms of FDI location decisions. At the
same time, new factors have become more important with regard to FDI location decision
factors, such as costs factors, infrastructure factors, and a benign business environment
(UNCTAD 1996; Nunnenkamp, 2002). Our result supports the findings of Cleeve (2009)
who conclude that the significance of market size and growth rate has become less important
in recent years with regard to FDI location. However, our results are different from those of a
number of empirical studies on FDI location (e.g. Cunningham, 1975; Swedenborg, 1979;
Dunning, 1980; Scaperlanda et al., 1983; Papanastassiou and Pearce, 1990; Zitta & Powers,
2003; Head and Mayer, 2004; Tahir & Larimo, 2005) who all conclude that the market
potential of the host country has a significant and positive effect on attracting FDI, and has a
major impact on the FDI decision-making process.
H1c: Economic factors play an important role in FDI location decisions in the Saudi
petrochemicals industry.
Hypothesis H1c predicts that economic factors are important factors for petrochemical FDI
when a company chooses Saudi Arabia for its business location. Economic factors have a
mean score of 3.1369. The ―t‖ test shows that statistically this is not significantly (p>0.05)
more than 3.0 (t41 = 1.159, p=.253). Hence, the economic factors are not perceived to play an
important role in FDI location decisions. Therefore, hypothesis H1c is not supported by the
analysis. Our result support the findings of Ho & Lau (2007) who conclude that the
importance of economic factors in the host countries for FDI location decisions will be
greater when investors plans to expand their market share in the host country in which their
investment is located. Otherwise, when the target markets are outside the host country where
the investment is located, such as is the case with the petrochemical FDI in Saudi Arabia, the
economic environment of the host country will have a minimal influence and low priority in
terms of FDI location decisions. Our results also confirm the findings of Abdel-Rahman
(2002) who indicated that economic factors influence the location decisions for FDI in Saudi
Arabia. However, our results are different from those of Dunning (2004) who pointed out that
Page 275
260
the location decisions for FDI will be influenced by the host-country‘s economic conditions,
and that these will play a major role on shaping the FDI location motivations.
H1d: Infrastructure and technological factors play an important role in FDI location
decisions in the Saudi petrochemicals industry.
Hypothesis H1d predicts that infrastructure and technological factors are important factors for
petrochemical FDI when a company chooses Saudi Arabia for its business location.
Infrastructure and technological factors have a mean score of 3.9082. The ―t‖ test shows that
this is significantly (p<0.05) more than 3.0 (t41 = 16.247, p=.000). Hence, infrastructure and
technological factors are perceived to play an important role in FDI location decisions.
Therefore, hypothesis H1d is confirmed by the analysis. Our results confirm the findings of
Ho & Lau (2007) who stressed that the importance of infrastructure and technological factors
in terms of FDI location decisions depends on the type of industry under consideration, as
each industry has a different priority with regard to infrastructure levels. For example, heavy
industries such as the petrochemical industry will require a high level of infrastructure in the
host country in order to move their products to the global markets. Consequently, the level of
infrastructure in the host country is a very important factor for that industry. Moreover, our
results confirm the result of Jones & Wern (2006) who concluded that infrastructure factors is
a potential attractor with regard to FDI inflow as it improves the distribution of goods and
services and the ability of the company to recruit labour and to communicate with suppliers
and purchasers. Furthermore, our results are in line with those of Mina (2007) who concluded
that infrastructure development is expected to facilitate oil exploration and extraction, and
therefore will have a positive influence on FDI flows.
H1e: Political and legal factors play an important role in FDI location decisions in the
Saudi petrochemicals industry.
Hypothesis H1e predicts that political & legal factors are important factors for petrochemical
FDI when a company chooses Saudi Arabia for its business location. Political & legal factors
have a mean score of 3.7024. The ―t‖ test shows that this is significantly (p<0.05) more than
3.0 (t41 = 10.782, p=.000). Hence, political and legal factors are perceived to play an
important role on FDI location decisions. Therefore, hypothesis H1e is confirmed by the
Page 276
261
analysis. Our results confirm the studies of researchers such as Basi (1963), Stevens (1969),
Weigel (1970), Root and Ahmed (1979), Levis (1979), Schneider and Frey (1985) and Wei
(1997) which have mostly focused on FDI to developing countries. These have found
political factors to be critical determinants of FDI location decisions. Our results are in line
with the findings of Ho & Lau (2007) who showed that FDI is sensitive to political factors
when companies choose the location for investment, and this affects the attractiveness of a
host country for FDI. FDI investment in a host country normally involves large obligations in
terms of capital that could be recovered if the investment had been launched successfully, and
the payback period takes many years. A high level of political risk could negatively extend
the payback period, or even make the investment critical, as all the invested capital could
easily be lost. However our results are different from the findings of a number of studies
(e.g., Green and Cunningham, 1975; Mody and Wheeler, 1992) who concluded that political
factors not to be important as an FDI location factor, and that they rank lower than other
location factors.
H1f: Social and cultural factors play an important role in FDI location decisions in the
Saudi petrochemicals industry.
Hypothesis H1f predicts that social and cultural factors are important factors for
petrochemical FDI when a company chooses Saudi Arabia for its business location. Social
and cultural factors have a mean score of less than 3.0. The ―t‖ test found that the mean score
is significantly (p<0.05) less than 3.0 (t41 = -7.896, p=.000 Thus social factors are not
perceived to be important factors. Therefore, hypotheses H1f is not supported by the results
and the analysis. Our results confirm the findings of Johnson and Vahlne (1977) who
concluded that firms will not be affected by the cultural factors of the host country and that
cultural factors will play a limited factor on the location choice for FDI. Moreover, other
studies are in line with our results such as those of Levitt (1983) and Sethi, Guisinger, Phelan
& Berg (2003) who found that globalization has a minimal effect in terms of social and
cultural factors, as consumer tastes in different countries have been unified globally due to
globalization. Moreover, MNEs may be forced to ignore the disadvantages of the cultural
factors related to developing countries, in favour of the advantages associated with their cost
factors, making them consider these locations to be the best locations for their operations.
However our results are different from the findings of Dunning (1998), Leung et al. (2005),
Page 277
262
Kirkman (2006), Flores & Aguilera (2007) and Bahardwaj, Dietz & Beamish (2007) who all
concluded that social and cultural factors will have a significant impact on FDI location.
6.4.5.2 Testing the Hypothesis for Location Factors’ Competitiveness
According to the second main research question, the following main hypothesis was
testedThe second main hypothesis of the study is:
H2: The relative competitiveness of FDI location factors will vary in the Saudi
petrochemicals industry compared to other locations.
To test this hypothesis we use the repeated measures ANOVA procedure. The summary of
the results for this ANOVA model is given in Table 6.52, Table 6.53, and Table 6.54. To
validate this procedure, we first needed to test the null hypothesis that the error covariance
matrix of the orthonormalized transformed dependent variables is proportional to an identity
matrix. This is called the Mauchly test of spericity. The analysis shows that the covariance
matrix is not proportional to the identity matrix, and consequently we reject the null
hypothesis (Mauchly‘s W = 0.529, Chi-Square = 24.934 p value < 0.05).
The results of the repeated measures ANOVA clearly indicate that the mean competitiveness
score for different factors vary (Wilk‘s lambda = 0.887, F = 57.851 p value < 0.05). The
results do not change for alternative measures (Pillai‘s Trace, Hotelling's Trace and Roy's
Largest Root) of this multivariate test statistic. Our result are in line with those of Porter
(1990) who suggested that a firm will gain a competitive advantage based on the location
they choose, and that the firm must evaluate the advantages and restrictions of potential
locations before they make the final location decision. The restrictions include the host
country‘s investment policies toward foreign investment, technology limitations and
transportation costs. Our findings confirm the result of Banga (2003) who argued that
economic factors alone may not be sufficient to induce FDI inflows due to globalisation and
the integration of global markets. Therefore, there is an urgent need for international scholars
to investigate the new factors that affect FDI location in the new global market. Moreover,
our results support those of Dunning (2004) who asserted that increased intensive
competition in the global markets has forced MNEs to re-evaluate their international location
strategies, and has also forced host governments to reconfigure their investment policies to
Page 278
263
attract new FDI, and to protect current FDI from going to more competitive countries.
Dunning (2004) also pointed out that host governments who want to attract more FDI should
understand that the location factors that FDI seek in a new location have changed in recent
years. For example, MNEs thinking of setting up in developing countries are attracted by
traditional economic factors such as cost factors and natural resources factors, while MNEs
thinking of setting up in developed countries seek a good business environment, good legal
setup, infrastructures to support the investment, supportive industries and services, and a
range of institutions and government policies that would help improve the FDI operations and
global competitiveness in the host country (Dunning, 2004). Moreover, our result confirm
those of Nunnenkamp (2002) who believed that the movement of MNEs in the direction of
globalising the marketing and production of their operations, has affected the developing
countries‘ attractiveness in terms of FDI.
Our results confirm the Doing Business report from the World Bank and the International
Finance Cooperation (IFC) (Doing Business, 2009), in that Saudi Arabia was ranked 16th in
2008, up from 23rd in the preceding year, and is the top-ranked country in the Middle East
and North Africa. Moreover, the Doing Business report was also in line with our results in
that Saudi Arabia‘s overall ranking and its competitiveness is hindered by lower rankings in
areas such as contract enforcement, getting credit, closing a business, construction permits
and employment, where further reform is required to reflect international best practices. Our
results also confirm the Global Competitiveness Report (2008-2009) in that Saudi Arabia
ranks 27th in the World Economic Forum‘s 2008 Global Competitiveness Index, where Saudi
Arabia's competitiveness score now exceeds that of Kuwait and Tunisia, making Saudi
Arabia the highest-ranked country in the region after Qatar. The report also confirms our
study with regard to the fact that Saudi Arabia has been particularly successful in reforming
the institutional framework for doing business, creating favourable economic conditions, and
upgrading the efficiency of its goods markets. Moreover, the report concluded that Saudi
Arabia faces continuing challenges with regard to its education sector, labour market, and
additional opportunities for upgrading institutions and the financial sector.
Page 279
264
Table 6.52 Multivariate Tests for Different Factors for Competitiveness
Effect Value F Hypothesis df Error df Sig.
factor1 Pillai's Trace 0.887 57.851a 5.000 37.000 .000
Wilks' Lambda 0.113 57.851a 5.000 37.000 .000
Hotelling's Trace 7.818 57.851a 5.000 37.000 .000
Roy's Largest Root 7.818 57.851a 5.000 37.000 .000
Table 6.53 Tests of Within-Subjects Effects for the Competitiveness of the Factors
Source Type III Sum of Squares df Mean Square F Sig.
factor1 Sphericity Assumed 69.230 5 13.846 73.901 .000
Greenhouse-Geisser 69.230 4.035 17.159 73.901 .000
Huynh-Feldt 69.230 4.530 15.283 73.901 .000
Lower-bound 69.230 1.000 69.230 73.901 .000
Error(factor1) Sphericity Assumed 38.408 205 .187
Greenhouse-Geisser 38.408 165.418 .232
Huynh-Feldt 38.408 185.729 .207
Lower-bound 38.408 41.000 .937
Table 6.54 Tests of Between-Subjects Effects for the Competitiveness of the Factors
Source Type III Sum of Squares df Mean Square F Sig.
Intercept 2873.251 1 2873.251 5415.267 .000
Error 21.754 41 .531
The main hypothesis is divided into sub-hypothesis as follows:
H2a: Cost factors are competitive for FDI in the Saudi petrochemicals industry compared
to other locations.
H2b: Market factors are competitive for FDI in the Saudi petrochemicals industry
compared to other locations.
H2c: Economic factors are competitive for FDI in the Saudi petrochemicals industry
compared to other locations.
H2d: Infrastructure and technological factors are competitive for FDI in the Saudi
petrochemicals industry compared to other locations.
H2e: Political and legal factors are competitive for FDI in the Saudi petrochemicals
industry compared to other locations.
Page 280
265
H2f: Social and cultural factors are competitive for FDI in the Saudi petrochemicals
industry compared to other locations.
The summary of the results of the t-test for testing whether the competitiveness of a factor is
significantly better than in other countries in the region is presented in Table 6.55.
Table 6.55 One-Sample Test for the Competitiveness of Different Factors
Location Factor
Test Value = 3
95% Confidence Interval of the Difference
t df Sig.
(2-tailed) Mean Difference Lower Upper
Cost 15.368 41 0.000 0.92063 0.7997 1.0416
Market -5.361 41 0.000 -0.44643 -0.6146 -0.2782
Economy 8.193 41 0.000 0.70238 0.5293 0.8755
Infrastructure and Technology 14.571 41 0.000 0.85714 0.7383 0.9759
Political & Legal 5.268 41 0.000 0.42857 0.2643 0.5929
Social -2.421 41 0.020 -0.20238 -0.3712 -0.0336
H2a: Cost factors are competitive for FDI in the Saudi petrochemicals industry
compared to other locations.
Hypothesis H2a predicts that cost factors are more competitive for petrochemical FDI in
Saudi Arabia compared to other locations. Cost factors have a mean competitiveness score of
3.9206. The ―t‖ test shows that this is significantly (p<0.05) more than 3.0 (t41 = 14.345,
p=.000). Hence, cost factors are perceived to be significantly more competitive in the country
than in other countries. Therefore, hypothesis H2a is confirmed by the analysis.
Because of the ready availability of natural gas associated with the production of crude oil,
and the Government‘s desire to encourage the industrialization drive, Saudi Arabia has
among the lowest natural gas prices in the world. This favourable differential has clear
benefits for domestic consumers of natural gas feedstock such as the petrochemical industry,
where about 60% of the integrated cash costs are hydrocarbon-based. This compares with
figures of between 30% and 40% with regard to power generation and water desalination, and
in excess of 30% for metals processing (SAGIA, 2007). The country‘s strong infrastructure,
significant cost advantages due to lower average variable and fixed costs, and competitive
and fixed natural gas prices, make it an attractive destination for investment in the
petrochemical industry.
Page 281
266
H2b: Market factors are competitive for FDI in the Saudi petrochemicals industry
compared to other locations.
Hypothesis H2b predicts that market factors are more competitive for petrochemical FDI in
Saudi Arabia compared to other locations. Market factors have a mean competitiveness score
of 2.5536. The ―t‖ test shows that this is significantly (p<0.05) less than 3.0 (t41 = -5.361
p=.000). Hence, the market factor is perceived to be significantly less competitive in the
country than in other countries. Therefore, hypothesis H2b is not supported by the
analysis.From being a net importer, the country has emerged as a leading exporter in the
petrochemical sector, supplying to over 100 countries. Primary drivers for such a turnaround
have been strong infrastructure, significant cost advantages due to lower average variable and
fixed costs, competitive and fixed natural gas prices, and market proximity, especially for
East Asia. These factors have also resulted in substantial investment inflows into the sector,
with large scale projects targeting export markets such as China, America and Europe (BMI,
2009). Therefore, the Saudi market is the not the prime market for petrochemical FDI in
Saudi Arabia as most production is for export, and the Saudi market are considered by many
to be a less competitive market compared to other large markets such as East Asia and
Europe.
H2c: Economic factors are competitive for FDI in the Saudi petrochemicals industry
compared to other locations.
Hypothesis H2c predicts that economic factors in Saudi Arabia are more competitive for
petrochemical FDI in Saudi Arabia compared to other locations. Economic factors have a
mean competitiveness score of 3.7024. The ―t‖ test shows that this is significantly (p<0.05)
more than 3.0 (t41 = 8.193, p=.000). Hence, economic factors are perceived to be significantly
more competitive in the country than in other countries. Therefore, hypothesis H2c is
supported by the analysis. Saudi Arabia is the largest economy in the Middle East, with a
GDP in excess of US$300 billion. This constitutes almost one third of regional GDP. Saudi
Arabia‘s economy has experienced a boom over the last few years, driven primarily by the
strength of the demand for oil in the international oil markets, and increasing domestic oil
production capacity. The Saudi economy has maintained its achievements in terms of high
growth rates in recent years. The Saudi economy benefits from strong support from the
Page 282
267
government, and a free market policy, both of which have contributed to the growth of the
economy (SAGIA, 2008). All of this has contributed to making the Saudi economic factors
competitive for the petrochemical industry in Saudi Arabia compared to other locations.
H2d: Infrastructure and technological factors are competitive for FDI in the Saudi
petrochemicals industry compared to other locations.
Hypothesis H2d predicts that infrastructure and technology factors in Saudi Arabia are more
competitive for petrochemical FDI in Saudi Arabia compared to other locations.
Infrastructure and technology factors have a mean competitiveness score of 3.8571. The ―t‖
test shows that this is significantly (p<0.05) more than 3.0 (t41 = 14.571, p=.000). Hence, this
factor is perceived to be significantly more competitive in Saudi Arabia than in other
countries. Therefore, hypothesis H2d is confirmed by the analysis. There are a number of
significant infrastructure developments in the Kingdom, which are set to improve the project
enabler and logistics facilities for investors in the energy sector. These include expansion of
the existing industrial cities of Jubail and Yanbu, the creation of new economic cities around
the Kingdom, and the development of a number of standalone projects to improve the
Kingdom‘s transport and logistics network. SAGIA has had great success in attracting new
industries to the industrial cities of Jubail on the Arabian Gulf and Yanbu on the Red Sea.
Over 200 companies have invested more than $60bn in the cities, providing employment for
over 85,000 workers. They also host some of the world‘s largest petrochemical facilities, and
both cities are currently being expanded to cater for increased demand (SAGIA, 2007). All of
this has contributed to making infrastructure factors more competitive for petrochemical FDI
in Saudi Arabia compared to other locations.
H2e: Political and legal factors are competitive for FDI in the Saudi petrochemicals
industry compared to other locations.
Hypothesis H2e predicts that political and legal factors in Saudi Arabia are more competitive
for petrochemical FDI in Saudi Arabia compared to other locations. Political and legal factors
have a mean competitiveness score of 3.4286. The ―t‖ test shows that this is significantly
(p<0.05) more than 3.0 (t41 = 5.268, p=.000). Hence, this factor is perceived to be
significantly more competitive in Saudi Arabia than in other countries. Therefore, hypothesis
Page 283
268
H2e is confirmed by the analysis. A huge effort has been made on the part of the Saudi
government encompassing economic reform, improvements designed to transform the
investment environment and the opening up of more sectors to investment opportunities.
These efforts have been streamlined through the Saudi Arabian General Investment Authority
(SAGIA), which works in conjunction with all government agencies and institutions to
improve the investment environment (SAGIA, 2008). With a stable political system, a benign
environmental legislation towards FDI and good diplomatic relations with other countries,
Saudi Arabian political and legal factors are consider competitive factors for FDI in the Saudi
petrochemical industry compared to other locations.
H2f: Social and cultural factors are competitive for FDI in the Saudi petrochemicals
industry compared to other locations.
Hypothesis H2f predicts that social and cultural factors in Saudi Arabia are more competitive
for petrochemical FDI in Saudi Arabia compared to other locations. Social and cultural
factors have a mean competitiveness score of 2.7976. The ―t‖ test shows that this is
significantly (p<0.05) less than 3.0 (t41 = -2.421, p=.020). Hence, this factor is perceived to
be significantly less competitive in the country than in other countries. Therefore, hypothesis
H2f is not supported by the analysis. Due to the fact that the Saudi society is very
conservative and not open to other cultural values, a low work ethics on the part of Saudis,
and less educated people compared to other countries, the social and cultural factors in Saudi
Arabia are considered to be less competitive compared to other locations for FDI in the Saudi
petrochemical industry.
6.4.6 Testing the Significance of the Differences between the Mean Scores of Importance
and Competitiveness
The different factors affecting the FDI location decisions and the corresponding
competitiveness of the country were compared. Using the testing of hypotheses procedure,
significant f, the difference between the importance and the competitiveness score was tested.
This is essentially a test procedure involving testing the null hypothesis that there is no
significant difference between mean scores with regard to importance and competitiveness
for each of the factors. This is tested against the alternate hypothesis that there is a significant
difference between importance and competitiveness scores. The appropriate test procedure
Page 284
269
for testing the same is a t-test for equality of two population means. Since the same set of
respondents gave both the scores, this becomes a t-test for the significance of differences in
dependent samples. The summary of the mean scores for different factors is presented in
Table 6.56. The corresponding results of the t-test for dependent samples (paired samples) is
presented in Table 6.57. Differences in mean scores were statistically significant (p<0.05)
with regard to economic, political and legal and social factors. For costs, markets,
infrastructure and technology factors, the mean score differences in terms of importance and
competitiveness is statistically not significant.
Table 6.56 Paired Samples Statistics
Factor pair Category Mean N Std. Deviation Std. Error Mean
Pair 1 Cost
(Importance) 4.0397 42 0.4697 0.0725
Cost
(Competitiveness) 3.9206 42 0.3882 0.0599
Pair 2 Market
(Importance) 2.4405 42 0.6914 0.1067
Market
(Competitiveness) 2.5536 42 0.539 0.083
Pair 3 Economy
(Importance) 3.1369 42 0.7655 0.1181
Economy (Competitiveness) 3.7024 42 0.555 0.0857
Pair 4 Infrastructure & Technology
(Importance) 3.9082 42 0.3622 0.0559
Infrastructure & Technology
(Competitiveness) 3.8571 42 0.381 0.058
Pair 5 Political & Legal
(Importance) 3.7024 42 0.4221 0.0651
Political & Legal (Competitiveness) 3.4286 42 0.527 0.081
Pair 6 Social
(Importance) 2.1905 42 0.6644 0.1025
Social
(Competitiveness) 2.7976 42 0.541 0.083
Page 285
270
Table 6.57 Paired T-Test for Different Factors
Pair t df P value
Pair 1 (Cost) 1.671 41 0.102
Pair 2 (Market) -0.901 41 0.373
Pair 35 (Economy) -4.740 41 0.000
Pair 4 (Infrastructure & Technology) -0.856 41 0.397
Pair 5 (Political & Legal) 3.656 41 0.001
Pair 6 (Social) -6.153 41 0.000
6.5 Summary
In this chapter, we analyzed the results of this research. We used the
importance/competitiveness and analysis of the 31 location factors in the Saudi petrochemical
industry. We discussed the range of correlations and relationships between factors and the
explanations behind these relationships, as well as the policy implications for each
relationship. This section also makes recommendations for policy makers in Saudi Arabia,
especially in the petrochemical industry, to identify the factors that need improvement and, at
the same time, considering the factors which are most important in terms of FDI, and other
factors which are not considered to be competitive compared to other locations. Moreover,
these findings help policy makers in Saudi Arabia to identify the factors that may be
considered risk factors (wasting resources), and also factors that are unimportant to FDI
location decisions.
In addition, we used the t-test to identify the importance and competitiveness of location
factors in the Saudi petrochemical industry. First, we identified the importance of location
factors in the industry. Second, we identified the competitiveness of the location factors in the
Saudi petrochemical industry compared to other locations. We found that the most important
location factors are cost factors, infrastructure and technological factors, and political and
legal factors. The market factors, economic factors, and social and cultural factors all are
considered to be unimportant factors for FDI location decision making in the Saudi
petrochemical industry. We also found that the competitive factors compared to other
locations are cost factors, economic factors, political and legal factors, and infrastructure and
technological factors. Market factors and social and cultural factors are all considered to be
Page 286
271
uncompetitive compared to other locations for FDI in the Saudi petrochemical industry.
Furthermore, we used Pearson correlation coefficients and Spearman‘s rank correlation
analysis to estimate the relationships between the importance and competitiveness of location
factors. We gave a brief interpretation of some of the important relationships found in the
correlation analysis. Finally, we tested the research hypotheses using different techniques.
First, we tested the importance of location factors for FDI in the Saudi petrochemical
industry. We found that the relative importance of the location factors do vary for different
factors. Furthermore, cost factors, infrastructures and technological factors, and political and
legal factors, were all perceived to be important factors for FDI location decisions in the
Saudi petrochemical industry. However, market factors, economic factors, and social and
cultural factors were all perceived to be unimportant in relation to FDI location decisions in
the Saudi petrochemical industry. Second, we tested the competitiveness of the location
factors for FDI in the Saudi petrochemical industry. We found that the competitiveness of the
location factors for FDI in the Saudi petrochemical industry does vary compared to other
locations. Furthermore, cost factors, economic factors, infrastructure and technological
factors, and political and legal factors were all perceived to be competitive factors for FDI in
the Saudi petrochemical industry compared to other locations. However, market factors, and
social and cultural factors were perceived to be less competitive for FDI in the Saudi
petrochemical industry compared to other locations. The next chapter presents the research
conclusions and implications.
Page 288
273
Chapter 7 : Conclusions and Implications
7.1 Introduction
This study explored the possibility of indentifying the relative importance of the location
factors in relation to a specific industry (Petrochemicals) and a specific country (Saudi
Arabia) and the competitive drivers that determine the location decision of FDI inflows
compared to other locations. This research has found that the most important location factors
that affect the location decisions for FDI in the Saudi Petrochemicals industry are cost
factors, followed by political and legal factors and infrastructure and technological factors.
An interesting finding of this research is that economic factors, followed by market factors
and social and cultural factors which in previous studies in the literature have been found to
be important factors for multinational enterprises‘ (MNEs) location decisions for FDI have
not been found in this study to be important for FDI location decisions in the Saudi
petrochemicals industry. Another finding of this study is that the most competitive location
factors for FDI inflows in Saudi petrochemicals industry are cost factors, political and legal
factors, followed by infrastructure and technological factors, and economic factors. This
study found that market factors and social and cultural factors are not the key competitive
drivers in attracting FDI inflows into the Saudi petrochemicals industry.
The chapter summarises the key empirical findings of this research in respect of FDI location
decision in the Saudi petrochemicals industry reported in chapter 5 and discusses the
implications of these findings below. The implications of the methodology used in this
research are also discussed. This chapter also presents the conclusion of this research
including the research problems and questions on FDI location decision in the Saudi
petrochemicals industry. Research limitations and future research implications are also
discussed in this chapter.
7.2 Conclusions of the Study
This section is organized into sub-sections based on the research results analysis presented in
chapter 6 including section 7.2.1 which deals with testing of the location factors importance
and competitiveness, and finally section 7.2.2 answers the research questions and hypotheses.
Page 289
274
7.2.1 Testing the Location Factors
In this section, we tested the importance and competitiveness of location factors in the
location decisions for FDI in the Saudi petrochemicals industry using the t-test. In the first
part of this section, we present the test of the importance of all factors including major factors
and sub-factors in the Saudi petrochemicals industry. In the second part of this section, we
present the test for the competitiveness of the location factors compared to other locations in
the Saudi petrochemicals industry, including the competitiveness of the major factors and
sub-factors and the competitiveness of sub-factors under each major factor. The most
important location factors identified in terms of their relative importance on location
decisions for petrochemicals FDI are listed below in decreasing order of importance based on
the t-test:
1. Energy costs
2. Return on investment
3. Availability of raw materials
4. Low cost of raw materials
5. Political stability
6. Benign environmental legislation for FDI
7. Access to reliable and cooperative suppliers
8. Level of infrastructure
9. Transportation/logistic costs
10. Availability of factory sites (land)
11. Tax reductions in the host country
12. High industrial concentration (clustering)
13. Economic stability
14. Exchange rates
15. Geographical proximity
The least important location factors among other location factors are listed below in
decreasing order of importance:
16. Diplomatic ties with the host country
17. Production site costs (land costs)
18. International trade agreements
19. Legal and regulatory system
Page 290
275
20. Market familiarity
21. Local financial support
22. Availability of a well-qualified workforce
23. Labour costs
24. Economic growth
25. Level of competition in the host market
26. Attitude of the local community towards the firm
27. Local employees‘ loyalty to the firm
28. Market growth in the host country
29. Size of the host market
30. Cultural distance
31. Language
Cost factors, infrastructure and technological factors, and political and legal factors received
a mean greater than 3.0, and the t-test showed that they are significantly above 3.0 with
regard to other major location factors, which indicates that they are considered to be
important location factors for FDI when choosing their location in the Saudi petrochemicals
industry. The economic factors, market factors, and social and cultural factors are
significantly below 3.0. This indicates that they are considered to be unimportant location
factors for FDI location decisions in the Saudi petrochemicals industry.
Most of the cost factors are considered as important factors with a mean of over 3.0,
including energy costs, return on investment, the cost of raw materials and
transportation/logistic costs. However, factory site costs and labour costs received a mean of
less than 3.0, which means that they are considered to be unimportant factors with regard to
the location decisions for FDI in the Saudi petrochemicals industry.
All market factors received an average mean of less than 3.0, which indicates that they are
considered to be unimportant factors in terms of location decisions in the Saudi
petrochemicals industry. These factors included market familiarity, the level of competition
in the host market, market growth in the host country and the size of the host market.
Economic stability and exchange rates are considered as important factors in the location
decision related to the Saudi petrochemicals industry with a mean of more than 3.0. However,
Page 291
276
economic growth and local financial support received a mean of less than 3.0, which means
that they are considered to be unimportant factors in terms of location decision for FDI in the
petrochemicals industry.
Most of the infrastructure and technological factors, including the availability of raw
materials, access to reliable and cooperative suppliers, the level of infrastructure, the
availability of factory sites (land), high industrial concentration (clustering) and geographical
proximity, are considered to be important factors for the location decision in the
petrochemicals industry in that each received a mean of over 3.0. However, the availability of
a well-qualified workforce received an average mean of less than 3.0 and is considered
unimportant factor in terms of location decisions in the Saudi petrochemicals industry.
Political and legal factors including political stability, tax reductions in the host country and
benign environmental legislation for FDI are considered to be important factors for location
decisions in the petrochemicals industry, in that they received a mean of more than 3.0.
However, despite the location factors, including international trade agreements, diplomatic
ties with the host country, and legal and regulatory systems, receiving an average mean of
more than 3.0, the t-test shows that they are considered to be unimportant factors in terms of
FDI location decisions in the Saudi petrochemicals industry.
All social and cultural factors, including the attitude of the local community towards the firm,
local employees‘ loyalty to the firm, cultural distance and language, are rated below 3.0 and
are considered to be unimportant factors in terms of the location decisions in the Saudi
petrochemicals industry.
The most competitive location factors were identified according to their relative
competitiveness in location decisions for petrochemicals FDI. These are listed below in
decreasing order of competitiveness based on the t-test:
1. Energy costs
2. Availability of raw materials
3. Return on investment
4. Cost of raw materials
5. Access to reliable and cooperative suppliers
6. High industrial concentration (clustering)
Page 292
277
7. Exchange rates
8. Political stability
9. Availability of factory sites (land)
10. Geographical proximity
11. Production site costs (land costs)
12. Economic growth
13. Benign environmental legislation towards FDI
14. Diplomatic ties with the host country
15. Level of infrastructure
16. Market familiarity
17. Economic stability
18. Transportation/logistic costs
19. Local employees‘ loyalty to the firm
The least competitive location factors among other location factors based on the mean of
competitiveness are listed below in terms of the decreasing order of competitiveness:
20. International trade agreements
21. Local financial support
22. Tax reductions in the host country
23. Language
24. Attitude of the local community towards the firm
25. Level of competition in the host market
26. Legal and regulatory system
27. Labour costs
28. Availability of a well-qualified workforce
29. Cultural distance
30. Market growth in the host country
31. Size of the host market
Cost factors, infrastructure and technological factors, political and legal factors, and
economic factors are rated relatively highly among other major location factors with a mean
above 3.0, which indicates that they are considered to be competitive location factors for FDI
compared to other location factors in the Saudi petrochemicals industry. The social and
cultural factors, and market factors were rated relatively low among other major location
Page 293
278
factors with mean scores below 3.0, which indicates that they are not considered to be
competitive location factors for FDI compared to other location factors in the Saudi
petrochemicals industry.
Most of the cost factors are considered to be competitive factors with an average mean of
over 3.0, including energy costs, return on investment, the cost of raw materials, production
site costs (land costs) and transportation/ costs. However, labour costs received a mean of
below 3.0, which indicates that it is considered to be an uncompetitive factor among cost
factors for the petrochemicals industry.
Market familiarity is the only factor among the market factors with a mean greater than 3.0
and is considered to be a competitive factor. All other market factors received a mean of less
than 3.0, which are considered to be uncompetitive factors in comparison to other location
factors in the Saudi petrochemicals industry, including the level of competition in the host
market, market growth in the host country and the size of the host market.
Most of the economic factors, including economic stability, economic growth and exchange
rates, received an average rating over 3.0 and therefore are considered to be competitive
factors compared to other locations in the Saudi petrochemicals industry. Local financial
support received a mean greater than 3.0. However, the t-test shows that local financial
support is significantly below the mean of 3.0, which indicates that this factor is not a
competitive factor compared to other location factors for FDI in the Saudi petrochemicals
industry.
Most of the infrastructure and technological factors received a mean greater than 3.0,
including the level of infrastructure, high industrial concentration (clustering), access to
reliable and cooperative suppliers, the availability of factory sites (land), the availability of
raw materials and geographical proximity, which are considered to be competitive factors for
FDI compared to other locations in the Saudi petrochemicals industry. However, the
availability of a well-qualified workforce received an average mean above 3.0, but the t-test
shows that it was not significantly above the mean of 3.0 and therefore is considered to be an
uncompetitive factor for FDI compared to other location factors in the Saudi petrochemicals
industry.
Page 294
279
Some political and legal factors received an a mean greater than 3.0, including political
stability, benign environmental legislation towards FDI and diplomatic ties with the host
country, and are considered to be competitive location factors compared to other locations in
the Saudi petrochemicals industry. Other factors received a score mean above 3.0, including
international trade agreements and tax reductions in the host country, but the t-test revealed
that they are significantly below the average mean and they are considered to be less
competitive factors compared to other location factors in the Saudi petrochemicals industry.
The legal and regulatory system factor received an average mean below 3.0 and therefore it is
considered to be an uncompetitive factor compared to other location factors in the Saudi
petrochemicals industry.
Local employees‘ loyalty to the firm is the only factor in the social and cultural factors with a
significant average mean over 3.0 and therefore it is considered to be a competitive factor
compared to location factors in the Saudi petrochemicals industry. However, all other factors
related to the social and cultural factors received an average mean significantly below 3.0,
including cultural distance from the home country, the attitude of the local community
towards the firm and language, all of which are considered to be less competitive factors
compared to other location factors in the Saudi petrochemicals industry.
7.2.2 The Research Questions and Hypothesis Analysis
The first research question asks about the relative importance of the six location factors
(costs, markets, economics, infrastructure and technology, political and legal, and social and
cultural) in the view of the senior executives. To address this question a repeated
measurements analysis of variance was performed with regard to the average responses to the
items on the questionnaire for the six location factors. Thus, there is a strong evidence that
the executives rated the different factors as having significantly different levels of importance
in terms of choosing to locate in Saudi Arabia.
The second research question asks about the relative competitiveness of Saudi Arabia with
regard to the six factors (costs, markets, economics, infrastructure and technology, political
and legal, and social and cultural) in the view of the senior executives. Thus, there is strong
evidence that the executives rated the different factors as having significantly different levels
of importance in terms of the competitiveness of Saudi Arabia.
Page 295
280
The results of the repeated measures ANOVA clearly indicate that the mean importance score
for different factors varies (Wilks‘ lambda = 0.071, F = 96.716 p value < 0.05). The result
does not change for alternative measures (Pillai‘s Trace, Hotelling‘s Trace and Roy‘s Largest
Root) of this multivariate test statistic.
The results of the repeated measures ANOVA clearly indicate that the mean competitiveness
score for different factors varies (Wilks‘ lambda = 0.887, F = 57.851 p value < 0.05). The
result does not change for alternative measures (Pillai‘s Trace, Hotelling‘s Trace and Roy‘s
Largest Root) of this multivariate test statistic.
We tested the null hypothesis and found that the mean importance score is actually above 3.
Hypothesis H1a predicts that cost factors play an important role for petrochemicals FDI when
a company chooses Saudi Arabia for its business. The cost factors have a mean score of
4.039. The t-test shows that this is significantly (p < 0.05) more than 3.0 (t41 = 14.345, p =
0.000). Hence, cost factors are perceived to play an important role in FDI location decisions.
Therefore, hypothesis H1a is confirmed by the analysis.
Hypothesis H1b posits that market factors are important factors for the location decision for
petrochemicals FDI when a company chooses Saudi Arabia as the location for its business.
The test shows that market factors have a mean score of less than 3.0. The t-test found that
the mean score is significantly (p < 0.05) less than 3.0 (t41 = -5.244, p = 0.000). Thus, market
factors are not perceived to be important. Therefore, hypothesis H1b is not supported by the
results and the analysis.
Hypothesis H1c posits that economic factors are important factors for petrochemicals FDI
when a company chooses Saudi Arabia for its business location. Economic factors have a
mean score of 3.1369. The t-test shows that this is statistically not significantly (p > 0.05)
more than 3.0 (t41 = 1.159, p = 0.253). Hence, the economic factors are not perceived to play
an important role in FDI location decisions. Therefore, hypothesis H1c is not supported by
the analysis.
Hypothesis H1d hypothesizes that infrastructure and technological factors are important
factors for petrochemicals FDI when a company chooses Saudi Arabia for its business
Page 296
281
location. Infrastructure and technological factors have a mean score of 3.9082. The t-test
shows that this is significantly (p < 0.05) more than 3.0 (t41 = 16.247, p = 0.000). Hence,
infrastructure and technological factors are perceived to play an important role in FDI
location decisions. Therefore, hypothesis H1d is confirmed by the analysis.
Hypothesis H1e hypothesizes that political and legal factors are important factors for
petrochemicals FDI when a company chooses Saudi Arabia for its business location. Political
and legal factors have a mean score of 3.7024. The t-test shows that this is significantly (p <
0.05) more than 3.0 (t41 = 10.782, p = 0.000). Hence, political and legal factors are perceived
to play an important role in FDI location decisions. Therefore, hypothesis H1e is confirmed
by the result.
Hypothesis H1f posits that social and cultural factors are important factors for petrochemicals
FDI when a company chooses Saudi Arabia for its business location. Social and cultural
factors have a mean score of less than 3.0. The t-test found that the mean score is
significantly (p < 0.05) less than 3.0 (t41 = -7.896, p = 0.000). Thus, social factors are not
perceived to be important factors. Therefore, hypothesis H1f is not supported by the result.
The second part of the results of the t-test is for testing whether the competitiveness of FDI
location factors is significantly better than other countries.
Hypothesis H2a hypothesizes that cost factors in Saudi Arabia are more competitive for
petrochemicals FDI in Saudi Arabia compared to other locations. Cost factors have a mean
competitiveness score of 3.9206. The t-test shows that this is significantly (p < 0.05) more
than 3.0 (t41 = 14.345, p = 0.000). Hence, cost factors are perceived to be significantly more
competitive in the country than in other countries in the region. Therefore, hypothesis H2a is
confirmed by the result.
Hypothesis H2b posits that market factors in Saudi Arabia are more competitive for
petrochemicals FDI in Saudi Arabia compared to other locations. Market factors have a mean
competitiveness score of 2.5536. The t-test shows that this is significantly (p < 0.05) less than
3.0 (t41 = -5.361 p = 0.000). Hence, the market factors are perceived to be significantly less
competitive in the country than in other countries in the region. Therefore, hypothesis H2b is
not supported by the analysis.
Page 297
282
Hypothesis H2c posits that economic factors in Saudi Arabia are more competitive for
petrochemicals FDI in Saudi Arabia compared to other locations. Economic factors have a
mean competitiveness score of 3.7024. The t-test shows that this is significantly (p < 0.05)
more than 3.0 (t41 = 8.193, p = 0.000). Hence, economic factors are perceived to be
significantly more competitive in the country than in other countries in the region. Therefore,
hypothesis H2c is supported by the analysis.
Hypothesis H2d hypothesizes that infrastructure and technological factors in Saudi Arabia are
more competitive for petrochemicals FDI in Saudi Arabia compared to other locations.
Infrastructure and technological factors have a mean competitiveness score of 3.8571. The t-
test shows that this is significantly (p < 0.05) more than 3.0 (t41 = 14.571, p = 0.000). Hence,
these factors are perceived to be significantly more competitive in the country than in other
countries in the region. Therefore, hypothesis H2d is confirmed by the analysis.
Hypothesis H2e posits that political and legal factors in Saudi Arabia are more competitive
for petrochemicals FDI in Saudi Arabia compared to other locations. Political and legal
factors have a mean competitiveness score of 3.4286. The t-test shows that this is
significantly (p < 0.05) more than 3.0 (t41 = 5.268, p = 0.000). Hence, these factors are
perceived to be significantly more competitive in the country than in other countries in the
region. Therefore, hypothesis H2e is confirmed by the analysis.
Hypothesis H2f hypothesizes that social and cultural factors in Saudi Arabia are more
competitive for petrochemicals FDI in Saudi Arabia compared to other locations. Social and
cultural factors have a mean competitiveness score of 2.7976. The t-test shows that this is
significantly (p < 0.05) less than 3.0 (t41 = -2.421, p = 0.020). Hence, these factors are
perceived to be significantly less competitive in the country than in other countries in the
region. Therefore, hypothesis H2f is not supported by the findings of this study.
Finally, this research identified the importance of location factors on FDI location decision in
the Saudi petrochemicals industry. The result shows that cost factors, infrastructures and
technological factors, and political and legal factors all play an important role in relation to
FDI location decision in the Saudi petrochemicals industry. However, market factors,
economic factors, and social and cultural factors are all considered unimportant factors for
Page 298
283
FDI location decision in the Saudi petrochemicals industry. The results of this research also
identified the competitiveness of location factors for FDI in the Saudi petrochemicals
industry. The results show that the cost factors, economic factors, infrastructures and
technological factors, and political and legal factors are competitive factors for FDI compared
to other location in the Saudi petrochemicals industry. However, market factors, and social
and cultural factors are all considered as uncompetitive factors for FDI in the Saudi
petrochemicals industry.
7.3 Research Limitations
The research has identified some important findings of the importance and competitiveness of
FDI location factors in the Saudi petrochemicals industry. However, there are some
limitations of this research. First, the Saudi government has very recently embarked on
investment reforms in different sectors of the economy in order to attract significant FDI
inflows into the country. Thus, this research should have looked at other sectors of the
economy instead of heavily concentrating only on FDI flows to the Saudi Petrochemicals
industry. Second, this study was based on a specific period of time and only gives critical
perspective of FDI flows into the Saudi petrochemicals industry. Therefore, to enhance the
robustness of this work and to validate it, it would be appropriate that a future research of
FDI location factors in Saudi Arabia should take into consideration the changing environment
and location factors that best fit the situation at the time. Third, the research variables for this
study are too large in number and the sample size is relatively small in size. Therefore, it was
difficult to apply a more sophisticated conventional statistical analysis. Fourth, the research
has limited geographical focus as it focuses only on FDI located in Saudi Arabia. Thus, the
generalisation of these results to other countries remains to be established. Finally, the
research has a limited sectoral focus as the population of this research is only from the
petrochemicals industry. Therefore, the findings of this research can only be used to explain
the location factors‘ importance and competitiveness for FDI in the petrochemicals industry
and may not be representative of other sectors in Saudi Arabia, as well as other sectors in
other countries.
7.4 Future Research Implications
Given that this research area has not been covered extensively in the past, the results and
conclusions of this study therefore constitute a significant platform for future work in this
area. It thus gives the opportunity for scholars to further extend this work by examining the
Page 299
284
relative importance of the location factors and the competitive drivers that determine FDI
location decisions in other industries and in other countries. Hence, this research opens up
several avenues for future research on FDI location decisions as follows. First, a comparison
between the findings of this research on FDI location factors‘ importance and
competitiveness for FDI in the Saudi petrochemicals industry to other sectors in Saudi Arabia
as well as petrochemicals industry and other sectors in other countries would be useful and
significant. Second, a future research study could extend this study to other industries rather
than only the petrochemicals industry in Saudi Arabia. However, the researcher should take
into account the need for modifying and adding some location factors to fit a specific
industry. Third, it would be interesting to study the same location factors in terms of their
importance and competitiveness from a dynamic perspective in order to verify the degree to
which the location factors vary over time. Finally, it would be useful if future research and
analysis of FDI location factors is done utilizing the same framework used in this study but
with a much larger sample size and apply a more sophisticated statistical analysis to validate
the findings of this research.
7.5 Research Contributions
The study derives its importance from its coverage of an area in which there are relatively
few studies in the context of developing countries. We notice that developing countries in
general, and Saudi Arabia in particular, have a great need for this kind of study. As far as the
researcher is aware, this study is the first of its kind in Saudi Arabia. We therefore hope that it
will be the starting point for subsequent studies and will provide some useful insights, policy
implications and recommendations for the Saudi Arabian government, international firms and
the international business community.
Reviewing the Kingdom of Saudi Arabia‘s economic reform policies and private sector-led
investment initiatives, its legal, monetary, political and social issues and business procedures
that enhance or delay FDI inflows, this study has found that there are important steps for
local and foreign investors, as well as for the Saudi government to understand in terms of the
major obstacles that investors face in Saudi Arabia. It also provides the Saudi government
with a clear picture of the strategic steps that should be taken to attract more FDI into the
country.
As the global demand for FDI grows, and the supply of FDI contracts, there is an
Page 300
285
overwhelming need to understand better the effect of location factors in respect of FDI
location decisions and how these factors shape the final location destination for FDI. The
findings of this study are critical to the international development community and the
business community alike, in order to understand better the complexity of MNEs‘ location
decisions.
This research builds on the existing literature and makes the following contributions in
understanding FDI location factors in the Saudi petrochemicals industry. This study
contributes to the literature on FDI location decisions by advancing a new methodology that
gives an in-depth analysis and a clear approach to overcome the general classifications of
Dunning‘s OLI paradigm and Porter‘s determinants of competitive advantages. This research
also overcomes general approaches used in literature when analysing the competitiveness of a
location without paying attention to the different needs of different industries. This research
helps to develop and improve the understanding of why Saudi Arabia attracts significant FDI
in the petrochemicals industry, what location factors are important to the industry and in
which Saudi Arabia is competitive. The findings of this study are important not only to the
policy makers in Saudi Arabia, but also to the policy makers in other locations wishing to
attract FDI in this industry.
Finally, this study has advanced the knowledge of the character and variety of FDI location
factors, their role in FDI location decisions and their function in developing the
competitiveness of locations. It has refined a robust method for the measurement of location
factors for a specific industry that can be easily applied to other locations and industries. It
has provided a quantitative, theoretical, informed empirical analysis that offers a basis for
strategy development and policy formulations.
7.6 Summary
In this chapter, we introduced the conclusions of the study, the results of the descriptive
research, the ranking of the location factors, the importance/competitiveness analysis of the
Saudi petrochemical industry, the testing of the location factors, the correlation analysis of
the research questions, and hypothesis analysis, research limitations and future research
implications. We found that the most important factors that affect the location decisions for
FDI in the Saudi petrochemical industry are cost factors, followed by political and legal
factors and infrastructure and technological factors. An interesting finding of this research is
Page 301
286
that economic factors, followed by market factors and social and cultural factors, which in
previous studies in the literature have been found to be important factors for multinational
enterprises‘ (MNEs) location decisions for FDI, have not been found in this study to be
important for FDI location decisions with regard to the Saudi petrochemical industry.
Another finding of this study is that the most competitive location factors for FDI inflows in
terms of the Saudi petrochemical industry are cost factors, political and legal factors,
followed by infrastructure and technological factors, and economic factors. This study found
that market factors and social and cultural factors are not the key competitive drivers in
attracting FDI inflows into the Saudi petrochemical industry. Our results conclude that the
relative importance of location factors will change over time in particular countries, as the
economic environment in the host country, and globally, changes. Finally, our result also
conclude that globalization would have effects on FDI location factors, as MNEs tend to use
a wide range of policies when evaluating the host country with regard to potential investment,
and the relative importance of FDI location factors has changed as a result of globalization.
Moreover, the importance of traditional location factors has not diminished due to
globalization, but their importance in terms of FDI location decisions has declined. For
example, the market size of the host country is one of the most important location factors in
the opinion of many scholars. However, this factor has diminished in importance in terms of
FDI location decisions, and new factors such as cost factors have become more important as a
result of globalization.
Page 302
287
References
Abdel-Rahman, A.-M. (2002), ‗Determinants of Foreign Direct Investment in the Kingdom
of Saudi Arabia‘, ERF Working Paper, King Saud University.
Abdulwahab Al-Sa'doun. (2006). Five strategies drive Saudi Arabia's petchem industry
growth. Oil & Gas Journal, 104(2), 48-52.
Achoui, M. (2009). Human resource development in Gulf countries: an analysis of the trends
and challenges facing Saudi Arabia. Human Resource Development International,
12(1), 35-46.
Agarwal, Jamuna P. (1980). Determinants of Foreign Direct Investment: A Survey.
Weltwirtschaftliches Archiv 116: 739–773.
Agarwal, S. and Ramaswami, S. (1992) ‗Choice of foreign market entry mode: impact of
ownership, location and internalization factors‘, Journal of International Business
Studies 23(1): 1–27.
Agarwal, S., Socio-Cultural Distance and the Choice of Joint Ventures: A Contingency
Perspective, Journal of International Marketing, 2, 2, 1994, pp. 63-80.
Agmon, T. (1979) ―Direct investment and intra-industry trade: substitutes or complements?‖
in Giersch, H. (ed.) On the Economics of Intra-Industry Trade, JCB PLACE OF
PUBLICATION?
Agodo, O. (1978) ‗The determinants of US private manufacturing investments in Africa‘,
Journal of International Business Studies 9(3): 95–107.
Aharoni, Y. (1966). The Foreign Investment Decision Process, Harvard University Press:
Boston, MA.
Al-Amri, Mohamed (2002). Doing Business in Saudi Arabia. Baker Tilly International, Saudi
Arabia.
Alfaro, L., (2003). Foreign Direct Investment and Growth: Does the Sector Matter?
HarvardBusiness School, Boston. http://www.people.hbs.edu/lalfaro/fdisectorial.pdf
Aliber, A.R. (1970). A theory of direct foreign investment. In C.P. Kindleberger (Ed.), The
International Corporation: a symposium (pp. 17–34). Cambridge, MA: MIT Press.
Aliber, R. Z. (1993). The Multinational Paradigm. Cambridge, MA: MIT Press.
Aliber, R.Z. (1971) ‗The Multinational Enterprise in a Multiple Currency World‘, in J.H.
Dunning (ed.) The Multinational Enterprise, Allen & Unwin: London, pp: 49–56.
Al-Masnad, L. (1999). The role of national labor in industrial development in GCC: The
present and the future. Paper presented at the Seventh Industrial Conference in the GCC
countries organized by The Gulf Organization for Industrial Consultations, in Doha.
Altomonte, C., Guagliano, C., 2003. Comparative study of FDI in Central and Eastern Europe
and the Mediterranean. Economic Systems 27, 223–246.
Anand, J. and Kogut, B. (1997) ‗Technological capabilities of countries, firm rivalry and
foreign direct investments‘, Journal of International Business Studies 28(3): 445–465.
Anderson, E. and Coughlan, A. T., (1987) International Market Entry and Expansion Via
Independent or Integrated Channels of Distribution, Journal of Marketing, 51, January
pp. 71- 82.
Anderson, E. and Gatignon, H., (1986) Modes of Foreign Entry: A Transaction Cost Analysis
and Propositions, Journal of International Business Studies, 17 (Fall), pp. 1-26.
Antal-Mokos, Z. (1998). Privatisation, Politics and Economic Performance in Hungary.
Cambridge: Cambridge University Press.
Asiedu, E. (2002). On Determinants of Foreign Direct Investments to Developing Countries:
Is Africa Different? World Development, 30 (11), 107- 119.
Audretsch, D. B. (1998). Agglomeration and the location of economic activity. Oxford
Page 303
288
Review of Economic Policy, 14 (2), 18–29.
Aulakh, P. S., Kotabe, M. and Sahay, A., (1996) Trust and Performance in Cross-Border
Marketing Partnerships: A Behavioral Approach, Journal of International Business
Studies, 27, 5, pp. 1005–1032.
Austin, J. (1990). Managing in Developing Countries. New York: Free Press.
Baldwin, R. and Krugman, P. (1989) ‗Persistent trade effects of large exchange rate shocks‘,
Quarterly Journal of Economics 104(4): 635–655.
Bandelj, N. (2002). Embedded economies: Social relations as determinants of foreign direct
investment in Central and Eastern Europe. Social Forces, 81(2), 411–444.
Bandera, V. N., & White, J. T. (1968). US direct investments and domestic markets in
Europe. Economia Internazionale, (21), 117–233.
Banga, R. (2003). Impact of Government Policies and Investment Agreements on FDI
Inflows. New Delhi: Indian Council for Research on International Economic Relations
Working Paper No. 116, November 2003.
Barrell, R. and Pain, N., (1997) The Growth of Foreign Direct lnvestment in Europe,
National Institute Economic Review, 60: 63-75.
Barrell, R., and N. Pain, (1999) Domestic Institutions, Agglomerations, and Foreign Direct
Investment in Europe, European Economic Review, Vol. 43, pp. 925–34.
Bartik, T.J. (1985). Business Location Decision in the United States: Estimates of the Effect
of Unionization, Taxes and other Characteristics of States. Journal of Business and
Economics Statistics 3, 14–22
Basi, R. S., (1963).Determinants of United States Private Direct Investment in Foreign
Countries, Kent State University, Bureau of Economic and Business Research.
Basile, R., Castellani, D., & Zanfei, A. (2008). Location choices of multinational firms in
Europe: The role of EU cohesion policy. Journal of International Economics, 74(2),
328-340.
Bass, B. M., McGregor, D. W., & Walters, J. L. (1977). Selecting foreign plant sites:
Economic, social and political considerations. Academy of Management Journal, 20(4),
535–551.
Batchler, J. and Clement, K. (1990), The Impact of the Single European Market in the United
Kingdom, DTI, HMSO, London.
Baumgartner, H. and Steenkamp, J. (2001) Response styles in marketing research: a cross-
national investigation, Journal of Marketing Research 38(2): 143–156.
Beamish, P., Morrison, A., Rosenzweig, P. and Inkpen, A. (2000) International Management.
Taxes and Cases, Boston: Irwin McGraw-Hill.
Beeson, P.E. and Husted, S. (1989), Patterns and determinants of productive efficiency in
state manufacturing, Journal of Regional Science, Vol. 29 No. 1, pp. 15-28.
Bende-Nabende, A. & Ford, J.L. & Sen, S. & Slater, J. (2000), FDI locational determinants
and the linkage between FDI and other macro-economic factors: Long-run dynamics in
Pacific Asia, Discussion paper, 00-11, Department of Economics, University of
Birmingham
Benito, G.R. and Gripsrud, G. (1992), The expansion of foreign direct investments: discrete
rational location choices or a cultural learning process?, Journal of International
Business Studies, Vol. 23 No. 3, pp. 461-76.
Bevan, A. A., & Estrin, S. (2004). The determinants of foreign direct investment into
European transition economies. Journal of Comparative Economics, 32(4), 775–787.
Bevan, A., Estrin, S., & Meyer, K. (2004). Foreign investment location and institutional
development in transition economies. International Business Review, 13(1), 43–64.
Bhardwaj, A., Dietz, J., & Beamish, P. (2007). Host country cultural influences on foreign
direct investment. Management International Review, 47(1), 29-50.
Page 304
289
Billington, N. (1999). The location of foreign direct investment: An empirical analysis.
Applied Economics, 31(1), 65–76.
Biswas, R. (2002) Determinants of Foreign Direct Investment, Review of Development
Economics, 6(3): 492-504.
Blomstrom, M. and A. Kokko (1997) Regional Integration and Foreign Direct Investment A
Conceptual Framework and Three Cases, policy research working paper 1750, The
World Bank, International Economics Department, International Trade Division.
Blomström, M. and A. Kokko (2002). The Economics of Foreign Direct Investment
Incentives, Working Paper 9489, NBER Working Paper Series.
Blomström, M. and Kokko, A. (2003) The economics of foreign direct investment incentives.
National Bureau for Economic Research. NBER working paper 9489, Cambridge, MA.
Blonigen, B., (2005). A review of the empirical literature on FDI determinants. Atlantic
Economic Journal 33, 383–403
Blonigen, B.A. (1997) Firm-specific assets and the link between exchange rates and foreign
direct investment, American Economic Review 87(3): 447–465.
Blonigen, B.A., Davis, R.B., Waddell, G.R., Naughton, H.T., (2004). FDI in space: spatial
autoregressive relationships in foreign direct investment. NBER WP 10939.
Blonigen, Bruce A. (1997).Firm-Specific Assets and the Link Between Exchange Rates and
Foreign Direct Investment, American Economic Review, 87, 3, pp. 447Y65.
BMI (2009) The Saudi Arabia Petrochemicals Report Q1 2009. Business Monitor
International February , 2009.
BMI (2009) The Saudi Arabia Petrochemicals Report Q2 2009. Business Monitor
International April 2009.
BMI (2009) The Saudi Arabia Petrochemicals Report Q3 2009. Business Monitor
International June 2009.
BMI (2009) The Saudi Arabia Petrochemicals Report Q4 2008. Business Monitor
International September 2008.
Boateng A., & Glaister K. W. (1999). Foreign direct investment in Ghana: Patterns of
activity, distribution and the role of government policy. Journal of Euromarketing,
8(4), 51–74.
Bollen, K. A., & Scott, T. J. (1982). Political instability and foreign direct investment: the
motor vehicle industry, 1948–65. Social Forces, 60(4), 1070–1088.
Boudier-Bensebaa, F. (2005). Agglomeration economies and location choice: Foreign direct
investment in Hungary. Economics of Transition, 13(4), 605-628.
Braunerhjelm, P. and Svensson, R., (1996) Host Country Characteristics and Agglomeration
in Foreign Direct Investment, Applied Economics, 28 833-40.
Brewer, T. L. (1993). Government policies, market imperfections, and foreign direct
investment. Journal of International Business Studies, 24(1), 101–121.
Bridge, J. (1998). ―Supply-chain-dynamics: a case study of the automotive sector‖. Paper
presented at the International Workshop on Global Production and Local Jobs: New
Perspectives on Enterprise Networks, Employment and Local Development Policy,
Geneva, ILO, 9-10 March, mimeo.
Bryman, A., & Bell, E. (2007). Business Research Methods (2nd
edition). Oxford, UK:
Oxford University Press.
Buckley, P. and Casson, M. (1976) The Future of the Multinational Enterprise, Macmillan:
London.
Buckley, P. and Mathew, A., (1979) The motivation for recent first time direct investments in
Australia by UK firms. Management International Review 19 1, pp. 57–67.
Buckley, P. J. & Casson M. C., (1976) The Future of the Multinational Enterprise, London:
Macmillan
Page 305
290
Buckley, P. J. & Casson M. C., (1985) The Economic Theory of the Multinational Enterprise:
Selected Papers, London: Macmillan.
Buckley, P. J. & Mathew, A. M., (1980). Dimensions of Market Entry Behavior of Recent
U.K. First Time Direct Investors in Australia, Management International Review, 20, 2,
pp. 35-51.
Buckley, P. J. and Casson, M. C. (2000). 'Models of the multinational enterprise', in Buckley,
P. J. (ed.), Multinational Firms, Cooperation and Competition in the World Economy,
London: Macmillan, pp. 9-43.
Buckley, P. J., & Casson, M. C. (1998). Analyzing foreign market entry strategies; extending
the internalization approach. Journal of International Business Studies, 29 (3), 539–
562.
Buckley, P. J., & Casson, M., 1981. The optimal timing of foreign direct investment.
Economic Journal 91,75-87.
Buckley, P. J., & Ghauri, P. N. (2004). Globalisation, economic geography and the strategy
of multinational enterprises. Journal of International Business Studies, 35(2),81-98.
Buckley, P. J., (1988) The Limits of Explanation: Testing the Internalization Theory of the
Multinational Enterprise, Journal of International Business Studies, 19, 2, pp. 181-193.
Buckley, P.J. (2002). Is the international business research agenda running out of
steam? Journal of International Business Studies, 33(2), 365-373.
Buckley, P., Devinney, T., & Louviere, J. (2007). Do managers behave the way theory
suggests? A choice-theoretic examination of foreign direct investment location
decision-making. Journal of International Business Studies: Part Focused Issue:
Internationalization - Positions, 38(7), 1069.
Busse, L., Ishikawa, N., Mitra, M., Primmer, D., Surjadinata, K., & Yaveroglu, T. (1996).
The perception of corruption: A market discipline approach, Working Paper. Atlanta:
Emory University.
Butler, K.C. and Joaquin, D.C. (1998), ―A note on political risk and the required return on
foreign direct investment‖, Journal of International Business Studies, Vol. 29 No. 3,
pp. 599-608.
Campa, Jose M. (1993) ―Entry by Foreign Firms in the U.S. Under Exchange Rate
Uncertainty,‖ Review of Economics and Statistics, 75, 4, pp. 614Y22.
Campos, N. and Kinoshita, Y. (2003). 'Why Does FDI Go Where it Goes? New Evidence
from the Transitional Economies'. CEPR Discussion Paper no. 3984. London, Centre
for Economic Policy Research.
Campos, N.F., 2000, and F. Coricelli, (2002), ―Growth in Transition: What We Know, What
We Don‘t, and What We Should,‖ Journal of Economic Literature, Vol. XL (3): pp.
793–836.
Carlton, D.W., (1983). The location and employment choices of new firms: An econometric
model with discrete and continuous endogenous variables. Review of Economics and
Statistics 65, pp. 440–449.
Carstensen, K., Toubal, F., (2004). Foreign direct investment in Central and Eastern
European countries: a dynamic panel analysis. Journal of Comparative Economics 32,
3–22.
Cartwright, W. R. (1993). Multiple linked diamonds and the international competitiveness of
export-dependent industries: The New Zealand experience. Management International
Review, 33(2), 55-70.
Casson, M. (1987) The Firm and the Market Cambridge: MIT Press.
Casson, M. C., (1982) Transaction Costs and the Theory of the Multinational Enterprise, in
Rugman, A (ed.), New Theories of the Multinational Enterprise, London: Croom Helm.
Cassou, S. P., (1997): 'The Link Between Tax Rates and Foreign Direct Investment', Applied
Page 306
291
Economics, 29 1 295-301.
Caves, R. E. (1976). Trade and Economic Structure. Cambridge, MA: Harvard University
Press.
Caves, R. E. (1996) Multinational Enterprise and Economic Analysis, Second Edition,
Cambridge: Cambridge University Press.
Caves, R. E., (1971) 'Industrial Corporations: The Industrial Economics o( Foreign
Investment', Economica, 38 1-27.
Chakrabarti, A. (2001a) Determinants of FDI: A Comment on Globalization-Induced
Changes and the Role of FDI Policies, PUBLISHER? PLACE OF PUBLICATION?
Chakrabarti, A., (2001b). The determinants of foreign direct investment: sensitivity analyses
of cross-country regressions.Kyklos 54, 89–113.
Changhui, Z., Delios, A., & Jing Yu, Y. (2002). Locational Determinants of Japanese Foreign
Direct Investment in China. Asia Pacific Journal of Management, 19(1), 63.
Chen, C., (1996) Regional determinants of foreign direct investment in Mainland China.
Journal of Economic Studies 23, 18–30.
Chen, C., Lee, S. and Stevenson, H. (1995) Response styles and cross-cultural comparisons
of rating scales among East Asian and North American students, Psychological Science
6(3): 170–175
Chen, H. and Chen, T. (1998) Network linkages and location choice in foreign direct
investment, Journal of International Business Studies 29(3): 445–467.
Chen, Z. and Mohsin K. (1997) Patterns of Capital Flows to Emerging Markets: A
Theoretical Perspective, IMF Working Paper WP/97/13. International Monetary Fund,
Washington DC.
Cheng, L.K. and Kwan, Y.K. (2000) What are the determinants of the location of foreign
direct investment? The Chinese experience, Journal of International Economics 51(2):
379–400.
Cho, D.-S. (1994). A dynamic approach to international competitiveness: The case of Korea.
In: R. Fitzgerald (Ed.), The competitive advantages of far eastern business (pp. 17-36).
Chudnovsky, D. and A. López (1999), "Globalization and developing countries: foreign
direct investment and growth and Sustainable Human Development", Geneva,
unpublished. http://www.fund-cenit.org.ar/eng/Descargas/globalization.pdf
Clague, C., Keefer, P., Knack, S., and Olson, M. (1999). ―Contract- Intensive Money:
Contract Enforcement, Property Rights, and Economic Performance.‖ Journal of
Economic Growth, 4:185-211.
Cleeve, E. (1997) ‗The Motives for Joint Ventures: A Transaction Costs Analysis of Japanese
MNE‘s in the UK‘, Scottish Journal of Political Economy, 44(1), 31–43.
Cleeve, E. (2005) ―The Role of Human Capital in the Inflow of FDI to Sub-Saharan Africa.‖
IAABD 2005 Conference Proceeding
Cleeve, E. (2006) ―Institutional Impediments to FDI Inflows to Sub-Saharan Africa‖ IAABD
2006 Conference Proceeding
Cleeve, E. (2007) 'Japanese Foreign Direct Investment in the UK Electronic Industry: The
Eclectic Approach', Asia Pacific Business Review, 13: 2, 183 — 200
Cleeve, E. (2008) ―How Effective are Fiscal Incentives to Attract FDI to Sub-Saharan
Africa?‖ The Journal of Developing Areas, 42(1)
Cleeve, E. (2009) ―The Eclectic Paradigm and Foreign Direct Investment in Sub- Saharan
Africa‖ Proceedings of the 10th Annual Conference of International Academy of
African Business and Development (IAABD), May, 2009, Kampala, Uganda.
Clegg, J. (1998), The determinants of intra-European foreign direct investment flows: market
integration and policy issues, Journal of Transnational Management Development,
Vol. 3 No. 3/4, pp. 89-129.
Page 307
292
CMAI (2007). ―Petrochemical Complex Market Study‖. Chemical Market Associates
(CMAI) , Inc. Houston, U.S.A.
Cohen, B.I., & Rugman, A.M. (1976). Risk reduction by international diversification.
Journal of International Business Studies, 75–80. Fall/Winter
Cohen, S. (2003) Maximum Difference Scaling: Improved Measures of Importance and
Preference for Segmentation, Sawtooth Software: Sequim, WA.
Cohen, S. (2007). Multinational corporations and foreign direct investment: avoiding
simplicity, embracing complexity. New York: Oxford University Press.
Contractor, F. (1991) ‗Government policies toward foreign investment: an empirical
investigation of the link between national policies and FDI flows‘, Paper presented at
Annual Meeting of the Academy of International Business, Miami, FL.
Contractor, F. (1991) Do government policies towards foreign direct investment matter? An
empirical investigation of the link between national policies and FDI flows, UNCTC
Current Series A (21), United Nations: New York.
Coughlin, C., Joseph, V.T. and Arromdee, V. (1991). State Characteristics and the Location
of Foreign Direct Investment within the United States. The Review of Economics and
Statistics 73, 675–683.
Country Conditions (2008). Political Risk Yearbook: Saudi Arabia Country Report, 1-21. The
PRS Group, April.
Culem, C. G., (1988). The locational determinants of direct investments among industrialized
countries. European Economic Review 32, 885-904.
Cunningham, W. (1975) Localisation of industry, Economic Journal 12: 501–506.
Cushman, D. O. (1985). Real exchange rate risk, expectations and the level of direct
investment. Review of Economics and Statistics, 67, 297–308.
Czaja, R. & Blair, J. (2005). Designing Surveys: A Guide to Decisions and Procedures. ( 2nd
Edn).Thousand Oaks, CA: Sage Publications.
Daly, D. J. (1993). Porter's diamond and exchange rates. Management International Review,
33(2), 119-134.
David, P. and Rosenbloom, J., (1990). Marshallian factor market externalities and the
dynamics of industrial location. Journal of Urban Economics 28, pp. 349–370.
Davidson, W. H. (1980) The Location of Foreign Direct Investment Activity: Country
Characteristics and Experience Effects, Journal of International Business Studies, I , 2,,
pp. 9-22.
Davidson, W. H., & McFetridge, D. G. (1985). Key characteristics in the choice of
international technology transfer mode. Journal of International Business Studies, 2, 5–
21.
Davidson, W.H. (1990). The location of foreign direct investment activity. Journal of
International Business, Fall, 14–29.
De Mooij, Ruud A.; Ederveen, Sjef. (2003) Taxation and Foreign Direct Investment: A
Synthesis of Empirical Research, International Tax and Public Finance, 10, 6, pp.
673Y93.
Delios, A. and Henisz, W.J. (2003) Political hazards, experience, and sequential entry
strategies: the international expansion of Japanese firms, 1980–1998, Strategic
Management Journal 24(11): 1153–1164.
Deloitte & Touche Llp (2002) ―Foreign Direct Investment Survey‖ A Study Conducted By
The Multilateral Investment Guarantee Agency, The World Bank Group, With The
Assistance Of Deloitte & Touche Llp, January.
Desai, M. A.; Foley, F.C.; Forbes, & Kristin J. (2004) ―Financial Constraints and Growth:
Multinational and Local Firm Responses to Currency Crises,‖ NBER Working Paper
No. 10545,.
Page 308
293
Devereux, M. and Griffith, P. (1998) Taxes and Location of Production: Evidence from a
Panel of U.S. Multinationals, Journal of Public Economics, 68 (3), 335-67
Devereux, M. P., Griffith, R. and Simpson, H., (2003) 'Agglomeration, Regional Grants and
Firm Location', The Institute for Fiscal Studies Working Paper WP04106 (London: The
Institute of Fiscal Studies).
Devinney, T., Midgley, D. and Venaik, S. (2003) ‗Managerial Beliefs, Market Contestability
and Dominant Strategic Orientation in the Eclectic Paradigm‘, in R. Narula and J.
Cantwell (eds.) International Business and The Eclectic Paradigm, Routledge: London,
pp: 152–173.
Dewit, G., Gorg, H. and Montagna, C., (2003) 'Employment Protection and Globalisation in
Dynamic Oligopoly', CEPR Discussion Paper No. 3871 (London: Centre for Economic
Policy Research).
Dicken, P. and Tickell, A. (1992) Competitors or collaborators? The structure of inward
investment promotion in Northern England, Regional Studies 26(1): 99–106.
Doing Business (2008a). Doing Business 2008 Saudi Arabia. The International Bank for
Reconstruction and Development, The World Bank, Washington, DC 2007.
Doing Business (2009b). Country Profile for Saudi Arabia. The International Bank for
Reconstruction and Development, The World Bank, Washington, DC 2008.
Doing Business (2010). Doing Business 2010 Saudi Arabia. The International Bank for
Reconstruction and Development, The World Bank, Washington, DC 2009.
Doney, P. M., Cannon, J. P. & Mullen, M. R., (1998) Understanding the Influence of
National Culture on the Development of Trust, Academy of Management Review, 23, 3,
pp. 601–620.
Dow, D. and Karunaratna, A. (2006) ‗Developing a multidimensional instrument to measure
psychic distance stimuli‘, Journal of International Business Studies 37(5): 578–602.
Drabek, Z., & Payne, W. (1999). The impact of transparency on foreign direct investment,
Staff Working Paper ERAD-99-02. Geneva: World Trade Organization.
Dunning, J. H. (1973). The determinants of international production. Oxford Economic
Paper, Number 25 (November), 289–336.
Dunning, J. H. (1979). Explaining patterns of international production: In defence of the
eclectic theory. Oxford Bulletin of Economics and Statistics, 41(4), 269–295.
Dunning, J. H. (1980) Towards an eclectic theory of international production: some empirical
tests, Journal of International Business Studies 11(1): 9–31.
Dunning, J. H. (1981) International Production and the Multinational Enterprises. London :
George Allen and Unwin.
Dunning, J. H. (1988). The eclectic paradigm of international production: A restatement and
some possible extensions. Journal of International Business Studies, 19(1), 1–31.
Dunning, J. H. (1991). The eclectic paradigm of international production: A personal
perspective. In C. N. Pitelis & R. Sugden (Eds.), The nature of the transnational firm
(pp. 117–136). London: Routledge.
Dunning, J. H. (1993). Internationalizing Porter's diamond. Management International
Review, 33(2), 7-15.
Dunning, J. H. (1993). Multinational enterprises and the global economy. Workingham:
Addison-Wesley.
Dunning, J. H. (1993). The Globalization of Business: the Challenge of the 1990s. New York.
Dunning, J. H. (1995). Reappraising the eclectic paradigm in an age of alliance capital.
Journal of International Business Studies, 26, 461–491.
Dunning, J. H. (1996) ‗Explaining FDI in Japan: Some Theoretical Insights‘, in M.
Yoshitomo and E Graham (eds.) FDI in Japan, Cheltenham: Edward Elgar, pp. 8–63.
Dunning, J. H. (1998). Location and the multinational enterprise: a neglected factor?. Journal
Page 309
294
of International Business Studies, 29(1), 45-66.
Dunning, J. H. (1999). Globalization and the Theory of MNE Activity. University of
Reading, Discussion Papers in International Investment and Management 264. Reading.
Dunning, J. H. (2000). Regions, globalization, and the knowledge economy: The issues
stated. In: J. H. Dunning (Ed.), Globalization, regions, and the knowledge-based
economy (pp. 7-41). Oxford: Oxford University Press.
Dunning, J. H. (2001). Chapter 2: The Key Literature On Ib Activities: 1960-2000. Oxford
Handbook of International Business, 36-68.
Dunning, J. H. (2001). The eclectic (OLI) paradigm of international production: Past, present
and future. International Journal of the Economics of Business, 8(2), 173–190.
Dunning, J. H. (2002) Determinants of foreign direct investment: globalisation induced
changes and the role of FDI policies. Background paper for the Annual Bank
Conference on Development economics held in Oslo (Washington, DC: World Bank).
Dunning, J. H. and Kundu, S. K., (1995) The Internationalization of the Hotel Industry -
Some New Findings from a Field Study, Management International Review, 35, 2, , pp.
101-133.
Dunning, J. H. and Rugman, A.M. (1985), The Influence of Hymer's Dissertation on the
Theory of Foreign Direct Investment, American Economic Review, 75: 228-32.
Dunning, J. H., & Lundan, S. M. (1998). The geographical sources of competitiveness of
multinational enterprises: An econometric analysis. International Business Review,
7(2), 115-133.
Dunning, J. H., (1977) 'Trade, Location of Economic Activity and the MNE: A Search for an
Eclectic Approach', in B. Ohlin, P. Hesselborn, and P. Wijkman., The International
Allocation of Economic Activity: Proceedings of a Nobel Symposium (London:
Macmillan Press,), pp. 395-418.
Dunning, J. H., (1983) 'Changes in the Level and Structure of International Production: The
Last One Hundred Years', in M. Casson, The Growth of International Business
(London: George Allen and Unwin), pp. 84-139.
Dunning, J., 1994. Re-evaluating the Benefits of Foreign Direct Investment, Transnational
Corporations, 3: 23-51.
Dunning, J.H. (1997) Alliance Capitalism and Global Business, Routledge: New York.
Dunning, J.H. (2000) The eclectic paradigm as an envelope for economic and business
theories of MNE activity, International Business Review 9(2): 163–190.
Dunning, J.H. (2006) Towards a new paradigm of development: implications for the
determinants of international business activity, Transnational Corporations 15 (1):
173-227.
Dunning, J.H., and Gugler, P. eds. (2008) Foreign direct investment, location and
competitiveness. Amsterdam: Elsevier.
Dunning, J.H., and Lundan, S.M. (2008) Multinational Enterprises and the Global Economy,
2nd ed. Cheltenham: Edward Elgar.
Easson, A. (2001) Tax Incentives for Foreign Direct Investment Part 1: Recent Trends and
Countertrends., Bulletin for International Fiscal Documentation, Vol. 55, 266-274.
Economist Intelligence Unit (2002). World Investment Prospects. London.
Economy Watch (2010) Benefits of Foreign direct Investment, Economy, Investment &
Finance Reports. http://www.economywatch.com/foreign-direct-
investment/benefits.html
Edwards, R. and Buckley, P., (1998). Choice of location and mode: the case of Australian
investors in the UK. International Business Review 7, pp. 503–520.
Ekrem Tatoglu, & Keith W Glaister. (1998). Western MNCs' FDI in Turkey: an analysis of
location specific factors. Management International Review, 38(2), 133-159
Page 310
295
Ennew, C. T., Reed, G. V., & Binks, M. R. (1993). Importance-performance analysis and the
measurement of service quality. European Journal of Marketing, 27(3), 59-70.
Enright, M. J. (1991). Geographic concentration and industrial organization. Ph.D.
dissertation, Harvard, Cambridge, Mass.
Enright, M. J. (1998). Regional clusters and firm strategy. In A. D. Chandler Jr., Hagstro¨m,
P. & So¨lvell, O., The Dynamic Firm (pp. 315–343). Oxford: Oxford University Press.
Enright, M. J. (2000a). Globalization, regionalization, and the knowledge-based economy in
Hong Kong. In: J. H. Dunning (Ed.), Globalization, regions, and the knowledge-based
economy (pp. 381-406). Oxford: Oxford University Press.
Enright, M. J. (2000b). Regional clusters and multinational enterprise: Independence,
dependence, or interdependence? International Studies of Management and
Organization, 30(2), 114-138.
Enright, M. J. (2003). Regional clusters: What we know and what we should know. In: J.
Brocker, D. Dohse & R. Soltwedel (Eds), Innovation Clusters and Interregional
Competition (pp. 99-129). Berlin: Springer Verlag.
Enright, M. J., & Newton, J. (2004). Tourism destination competitiveness: a quantitative
approach. Tourism Management, 25(6),777-788.
Enright, M. J., Scott, E. E., & Dodwell, D. (1997). The Hong Kong advantage. Hong Kong:
Oxford University Press.
Erdal, F. and Tatoglu, E. (2002) Locational Determinants of Foreign Direct Investment in an
Emerging Market Economy: Evidence from Turkey, Multinational Business Review,
Vol.10, No.1, p.21.
Ermisch, J. and Huff, W. (1999) Hypergrowth in an East Asian NIC: public policy and
capital accumulation in Singapore, World Development 27(1): 21.
Erramilli, M.K., Agarwal, S. and Kim, S. (1997), Are firm-specific advantages location-
specific too?, Journal of International Business Studies, Vol. 28 No. 4, pp. 8-28.
Esanov, A., M. Raiser, and W. Buiter, (2001) ―Nature‘s Blessing or Nature‘s Curse: The
Political Economy of Transition in Resource-Based Economies,‖ EBRD WP No. 65,
(London: European Bank for Reconstruction and Development).
Faeth, I. (2009). Determinants Of Foreign Direct Investment – A Tale Of Nine Theoretical
Models. Journal of Economic Surveys, 23(1), 165-196.
Fatehi, K., & Safizadeh, M. H. (1994). The effect of sociopolitical instability on the flow of
different types of foreign direct investment. Journal of Business Research, 31, 65–73.
Feenstra, R. C., & Hansen G. H. (1997). Foreign direct investment and relative wages:
Evidence from Mexico‘s maquiladoras. Journal of International Economics, 42, 371–
393.
Fenwick, M., Edwards, R. and Buckley, P.. (2003) Is cultural similarity misleading? The
experience of Australian manufacturers in Britain. International Business Review 12:
297–309.
Field, A.P. (2005). Discovering Statistics Using SPSS (2nd edition). London: Sage.
Flores, R.G. and Aguilera, R.V. (2007) Globalization and location choice: an analysis of US
multinational firms in 1980 and 2000, Journal of International Business Studies 38 (7):
1187-1210.
Foundlay, R. (1978). Relative backwardness, direct investment and the transfer of
technology: A simple dynamic model. Quarterly Journal of Economics, 92, 1–16.
Frenkel, M., Funke, K., Stadtmann, G., (2004). A panel analysis of bilateral FDI flows to
emerging economies. Economic Systems 28, 281–300.
Friedman, J., Gerlowskim D. and J. Silberman. (1992). What Attracts Foreign Multinational
Corporations: Evidence from Branch Plant Location in the United States. Journal of
Regional Science 32, 403–418.
Page 311
296
Frobel, F., Heinrichs, J. and Kreye, O. (1980) The New International Division of Labour,
Cambridge: Cambridge University Press.
Froot, H.A., & Stein, J.C. (1989). Exchange rates and foreign direct investment: An imperfect
capital market approaches. National Bureau of Economic Research, #2914. Cambridge:
NBER Working Paper Series, March
Froot, K. A., & Stein, J. C. (1991). Exchange rates and foreign direct investment: an
imperfect market‘s approach. Quarterly Journal of Economics, 106, 1191–1217.
Fujita, M., Krugman, P., Venables, A.J. (1999). The Spatial Economy: Cities, Regions and
International Trade. The MIT Press, Cambridge, MA.
Fukuyama, F., (1995) Trust: Social Virtues and the Creation of Prosperity, London: Hamish
Hamilton.
Fukuyama, F., (1997) The End of Order, London: Centre for Post-Collectivist Studies.
Galan, J. I., Gonzalez-Benito J. (2001) Determinant Factors of Foreign Direct Investment:
Some Empirical Evidence, European Business Review , 13: 269-278.
Galan, J., González-Benito, J., & Zuñiga-Vincente, J. (2007). Factors determining the
location decisions of Spanish MNEs: an analysis based on the investment development
path. Journal of International Business Studies, 38(6), 975-997.
Gastanaga, V.M., Nugent, J. B. and Pashmova, B. (1998) Host Country Reforms and Foreign
Direct investment Inflows: How much Difference do they Make?, World Development,
26(7): 1299-1314.
Gerlowski, D., Fung, H. and Ford, D. (1994) The location of FDI for US real estate, Land
Economics 70(3): 286–294.
Ghauri, P. and Gronberg, K. (2005) Research Methods in Business Studies, A Practical Guide
3rd
edition. London: Prentice Hall.
Ghertman, M., and Allen, M.,(1984) An Introduction to the Multinationals London:
Macmillan Press
Giickman, N. J. and Woodward, D. P., (1989) The New Competitors: How Foreign Investors
are Changing the US Economy New York: Basic Books.
Gilmore, A., O'Donnell, A., Carson, D., & Cummis, D. (2003). Factors influencing foreign
direct investment and international joint ventures. International Marketing Review,
20(2), 195.
Glaeser, E., Kallal, H., Scheinkman, J. and Schleifer, A., (1992). Growth in cities. Journal of
Political Economy 100, pp. 1126–1152.
Globerman, S. & Shapiro, D., (2002).Global Foreign Direct Investment Flows: The Role of
Governance Infrastructure, World Development, 30, 11, pp. 1899–1919.
Globerman, S. and Shapiro, D. (1999) The Impact of Government Policies on Foreign Direct
Investment: The Canadian Experience, Journal of International Business Studies, Vol.
30 (3), 513-532.
Globerman, S. and Shapiro, D. (2003) ‗Governance infrastructure and US foreign direct
investment‘, Journal of International Business Studies 34(1): 19–39.
Goerzen, A. and Beamish, P. (2003) ‗Geographic scope and multinational enterprise
performance‘, Strategic Management Journal 24(13): 1289–1306.
Goldberg, Linda S.; Kolstad, Charles D. (1995) Foreign Direct Investment, Exchange Rate
Variability and Demand Uncertainty, International Economic Review, 36, 4, 1995, pp.
855Y73.
Goldberg, M. (1971). ―The Determinants of US Direct Investment in the EEC: Comment.‖
American Economic Review 62, 692–699.
Goodnow, J. D., & Hansz, J. E. (1972). Environmental determinants of overseas market entry
strategies. Journal of International Business Studies, 3, 33–50.
Goodnow, J. D., (1985) Development in International Mode of Entry Analysis International
Page 312
297
Marketing Review, Autumn pp. 17-30.
Gorg, H. and Strob1, E., (2001) Multinational Companies and Productivity Spillovers: A
Meta-Analysis' The Economic Journal, 111,475: 723-39.
Gorg, H. and Strob1, E., (2002) Multinational Companies and Indigenous Development: An
Empirical Analysis, European Economic Review, 46: 1305-22.
Gorg, H. and Wakelin, K. (2001) The Impact of Exchange Rate Variability on US Direct
Investment Leverhulme Centre for Research on Globalisation and Economic Policy:
University of Nottingham.
Green, R. T. and Cunningham, W. H. (1975). The Determinants of US Foreign Investment:
an Empirical Examination, Management International Review 15 (1975):113–20.
Grosse, R., & Trevino, L. (1996). Foreign direct investment in the United States: an analysis
by country of origin. Journal of International Business Studies, 27(1), 139-156.
Grubert, H. and J. Mutti. (1991). Taxes, Tariffs and Transfer Pricing in Multinational
Corporate Decision Making. The Review of Economics and Statistics 73, 285–293.
Guimaraes, P., Figueiredo, O. and Woodward, D. (2000) 'Agglomeration and the Location of
Foreign Direct Investment in Portugal', Journal of Urban Economics, 47, 1 115-35.
Guisinger, S. (1985). Investment Incentives and Performance Requirements (New York:
Praeger).
Guisinger, S. (1989). Total protection: a new measure of the impact of government
intervention on investment profitability, Journal of International Business Studies, 20,
pp. 280-295.
Guisinger, S. (1995) From OLI to OLMA: incorporating higher levels of environmental and
structural complexity into the eclectic paradigm International Journal of the
Economics of Business 8(2): 257–272.
Guisinger, S. (2001) From OLI to OLMA: Incorporating higher levels of environmental and
structural complexity into the eclectic paradigm. International Journal of the
Economics of Business, 8(2), 257–272.
Guisinger, Stephen, and Associates (1992). ―Rhetoric and reality in international business: a
note on the effectiveness of incentives‖, Transnational Corporations, 1, 2 (August), pp.
111-123.
Haaland, J. I. and Wooton, I., (2003) 'Domestic Labour Markets and Foreign Direct
Investment', CEPR Discussion Paper No. 3989 (London: Centre for Economic Policy
Research).
Habib, M., & Zurawicki, L. (2001). Country-level investments and the effect of corruption--
some empirical evidence. International Business Review, 10(6), 687.
Harrigan, K. R., (1985a) Vertical Integration and Corporate Strategy, Academy of
Management Journal, 28, 2, , pp. 397425.
Harrigan, K. R., (1985b) Strategies for Intrafirm Transfers and Outside Sourcing, Academy of
Management Journal, 28, 4, , pp. 914-925.
Hartman, D. (1981) Tax Policy and FDI NBER Working Paper 689. Cambridge, MA:
National Bureau of Economic Research.
Hartman, David G. (1985). Tax Policy and Foreign Direct Investment, Journal of Public
Economics, 26, 1, pp. 107Y121.
Hartman, David G. B (1984) Tax Policy and Foreign Direct Investment in the United States,
National Tax Journal, 37, 4, 1984, pp. 475Y87.
Head, K., and Mayer, T., (2004). (2004). Market Potential and the Location of Japanese
Investment in the European Union. Review of Economics and Statistics, 86(4), 959-72.
Head, K., Ries, J., & Swenson, D. (1995). Agglomeration benefits and location choice:
evidence from Japanese manufacturing investments in the United States. Journal of
International Economics, 38(3-4), 223-248.
Page 313
298
Helpman, E., (1984). A simple theory of international trade with multinational corporations.
Journal of Political Economy 92, 451–471.
Helpman, E., (1985) Multinational corporation and international trade: evidence from 14
industrial countries. Journal of the Japanese and International Economics 1, 62–81.
Helpman, E., and Krugman, P., (1985) Market structure and Foreign Trade. MIT Press,
Cambridge.
Henderson, J.V., (1986) Efficiency of resource usage and city size. Journal of Urban
Economics 19, pp. 47–70.
Henisz, W.J. and Delios, A. (2001) ‗Uncertainty, imitation and plant location: Japanese
multinational corporations, 1990– 1996‘, Administrative Science Quarterly 46(3): 443–
475.
Hennart, I.-F,. (1994). International Financial Capital Transfers: A Transaction Cost
Framework, Business History, 36, 1, pp. 51-70.
Hennart, J. F., (1982) A Theory of Multinational Enterprise, Ann Arbor: University of
Michigan Press.
Hill, C. W. and Kim, W. C., (1988) Searching for a Dynamic Theory of the Multinational
Enterprise: a Transaction Cost Model Strategic Management Journal, 9, , pp. 93-104.
Hill, C. W. L., (1990) Cooperation, Opportunism, and the Invisible Hand: Implications for
Transaction Cost Theory, Academy of Management Review, 15, 3, 1990, pp. 500–513.
Hill, S. and M. Munday. (1992). The UK Regional Distribution of Foreign Direct Investment:
Analysis and Determinants. Regional Studies 26, 535–544.
Hill, S. and Munday, M. (1994), ―Regional distribution of foreign manufacturing investment
in the UK‖, in Christodoulou, P. (Ed.), Inward Investment: An Overview and Guide to
the Literature, The British Library, London.
Hilmi N., Ketata I., & Safa A.. (2007). Multinational Firms' Foreign Direct Investment. The
Business Review, Cambridge, 7(2), 242-250.
Hines, J.R. (1995). Forbidden payment: Foreign bribery and American business after 1977.
NBER working papers, National Bureau of Economic Research, Inc. 5266.
Hines, J.R. (1996) Altered States: Taxes and the Location of Foreign Direct Investment in
America, American Economic Review, Vol. 86, 1076-1094.
Hirsch, S. (1976) An international trade and investment theory of the firm, Oxford Economics
Papers 28(2): 258–270.
Hoekman B. and K. Saggi (2000) Assessing the Case for Extending WTO Disciplines on
Investment Related Policies, World Bank Working Paper, Washington, D.C.
Hofstede, G. (1980) Culture‘s Consequences: International Differences in Work-Related
Values, Beverly Hills: Sage.
Hofstede, G. (1983) The cultural relativity of organizational practices and theories, Journal of
International Business Studies 14(2): 75–89.
Hofstede, G. (1997) Cultures and Organizations: Software of the Mind, McGraw-Hill:
London.
Hofstede, G., (1999) Problems Remain, But Theories Will Change: The Universal and the
Specific in 21st- Century Global Management, Organizational Dynamics, 28, 1, pp.
34–44.
Hofstede, G., (2001) Cultural Consequences: Comparing Values, Behaviors, Institutions and
Organizations across Nations, Beverly Hills, California: Sage Publications.
Hoi Ki Ho, D., & Tze Yiu Lau, P. (2007). Perspectives on Foreign Direct Investment
Location Decisions: What Do We Know and Where Do We Go from Here?
International Tax Journal, 33(3), 39-48.
Hong, M., & Chen, L. (2001). Quantitative and Dynamic Analysis of the Oli Variables
Determining Fdi in China. Review of Urban & Regional Development Studies, 13(2),
Page 314
299
163.
Hood, N. and Young, S., (1999) The Globalisation of Multinational Enterprise Activity and
Economic Development \Basingstoke: Macmillan.
Horstman, I.,and Markusen, J.R., (1987) Strategic investments and the development of
multinationals. International Economic Review 28 (1), 109–121.
Hosseini, H. (2005) An economic theory of FDI: a behavioural economics and historical
approach, Journal of Socio-Economics 34(4): 528–541.
Hufbauer, G.C. (1975). The multinational corporation and direct investment. In P.B. Kenen
(Ed.), International Trade and Finance (pp. 253–319). London: Cambridge University
Press.
Hymer, S. (1960). The International Operations of National Firms: A Study of Direct Foreign
Investment, MIT Press: Cambridge, MA
Hymer, S. (1970). The efficiency (contradiction) of multinational corporations. National
Institute Economic Review, 60, 92–97.
Hymer, S. H. (1976). The international operations of national firms: a study of direct foreign
investment. Cambridge: MIT Press
IMF (2001) International Financial Statistics Yearbook 2001, International Monetary Fund.
‗How beneficial is foreign direct investment for developing countries?‘ Finance and
Development, 38(2). http://www.imf.org/external/pubs/ft/fandd/2001/06/loungani.htm
Itagaki, T. (1989). The multinational enterprise under the threats of restrictions on profit
repatriation and exchange control. Journal of Development Economics, 31, 369–377.
Jackson, S. and Markowski, S. (1995). The Attractiveness of Countries to Foreign Direct
Investment: Implications for the Asia-Pacific Region. Journal of World Trade 29 (5):
159–179.
Jeon, Y. D. (1992) The Determinants of Korean Foreign Direct Investment in Manufacturing
Industries, WeltwiTtschaftliches Archiv, vol. 128: 527-41.
Johanson, J. and Vahlne, J. (1977) The internationalization process of the firm: a model of
knowledge development and increasing foreign market commitments, Journal of
International Business Studies 8(1): 23–32.
Johanson, J. and Vahlne, J. (1990) The mechanism of internationalization, International
Marketing Review 7(4): 11–24.
John, R., Letto-Gillies, G., & Grimwade, N. (1997). Global Business Strategy. London:
International Thomson Business Press.
Jones, G. K. and Teegen, H. J., (2001) Global R&D Activity of U.S. MNCS: Does National
Culture Affect Investment Decisions?, Multinational Business Review, 9, 2, 2001, pp.
1–7.
Jones, G., (1995) The Evolution of International Business: An Introduction London:
Routledge.
Jones, J. and Wren, C. (2006). Foreign Direct Investment and the Regional Economy,
Aldershot: Ashgate.
Kahai, S. K., (2004) Traditional and non-traditional determinants of foreign direct
investment in developing countries. Journal of Applied Business Research 20, 43-50.
Kang, S. J. and Lee, H. S. (2007), The Determinants of Location Choice of South Korean
FDI in China, Japan and the World Economy, 19, pp.441–460.
Kaufmann, D., (1997). The missing pillar of a growth strategy for Ukraine. In: Cornelius, P.
and Lemain, P., Editors, 1997. Ukraine: Accelerating the transition to market,
International Monetary Fund, Washington.
Kaufmann, D., Kraay, A., Zoido-Lobaton, P., (2000). Governance matters: from
measurement to action. Finance and Development 37, 10–13.
Kedia, B.L. and Mukherji, A. (1999) Global managers: developing a mindset for global
Page 315
300
competitiveness, Journal of World Business 34(3): 230–251.
Keefer, P. and S. Knack, (1995) Institutions and Economic Performance: Cross-Country
Tests Using Alternative Institutional Measures Economics and Politics 7 :207–27.
Kindleberger, C. P. (1969) American Business Abroad: Six Lectures on Direct Investment
(New Haven, CT: Yale University Press).
Kindleberger, C. P. (1970). The International Corporation: a symposium. Cambridge: MIT
Press.
Kinoshita, Y., and A. Mody, (2001) Private Information for Foreign Investment Decisions in
Emerging Markets, Canadian Journal of Economics, Vol. 34, pp. 448–64.
Kirkman, B.L., Lowe, K.B. and Gibson, C.B. (2006) A quarter century of Culture‘s
Consequences: a review of empirical research incorporating Hofstede‘s cultural values
framework, Journal of International Business Studies 37(3): 285–320.
Klein, Michael W.; Rosengren, Eric S. (1994) The Real Exchange Rate and Foreign Direct
Investment in the United States: Relative Wealth vs. Relative Wage Effects, Journal of
International Economics, 36, 3Y4, pp. 373Y89.
Knickerbocker, F. T. (1973). Oligopolistic reaction and the multinational enterprise.
Cambridge (MA): Harvard University Press.
Kobrin, S. J. (1978). When does political instability result in increased investment risk? The
Columbia Journal of World Business, 13, 113–122.
Kobrin, S. J., (1976) Environmental Determinants of Foreign Manufacturing Investment: An
Ex Post Emprical Analysis, Journal of International Business Studies, Fall/Winter, pp.
29-42.
Kobrin, S.J. (1979), ―Political risks: a review and reconsideration‖, Journal of International
Business Studies, Vol. 10, Spring/Summer, pp. 67-80.
Kogut, B. and Singh, A., (1988) The Effect of National Culture on the Choice of Entry Mode,
Journal of International Business Studies, 19, Fall, pp. 411-32.
Kokko, Ari (2002). Globalization and FDI Incentives. Paper presented at the Annual Bank
Conference on Development Economics in Europe, Oslo, mimeo.
Kravis, I.B. and Lipsey, R.E. (1982), The location of overseas production and production for
exports by US multinational firms, Journal of International Economics, Vol. 25, pp.
201-223.
Krugman, P. (1993) On the relationship between trade theory and location theory, Review of
International Economics 1(2): 110–122.
Krugman, P. (1994). Competitiveness: A dangerous obsession. Foreign Affairs, 73(2), 28-44.
Krugman, P. R. (1991). Geography and trade. Cambridge (MA): MIT Press.
Krugman, P., (1991), ―Increasing Returns and Economic Geography,‖ Journal of Political
Economy, Vol. 99, pp. 483–99.
Kuemmerle, W. (1997) ‗Building effective R&D capabilities abroad‘, Harvard Business
Review 75(2): 61–71.
Kumar, A. (2007). ―Does Foreign Direct Investment Help Emerging Economies?‖ 2(2)
Federal Reserve Bank of Dallas, online: Federal Reserve Bank of Dallas.
http://www.dallasfed.org/research/eclett/2007/d070/.html/
Kumar, N. (2002) Globalisation and the Quality of Foreign Direct Investment, New Delhi:
Oxford University Press, 2002. Pp. 257
Kwon, Y. and Konopa, L. (1993) Impact of host country market characteristics on the choice
of foreign market entry mode, International Marketing Review 10(2): 60–74.
La Porta, R., F. Lopez-de-Silanes, A. Shleifer and R. Vishny, (1998) Law and Finance,
Journal of Political Economy, Vol. 106 (6), pp. 1113–55.
La Porta, R., Lopez-de-Silanes, F, Shleifer, A. and Vishny, R. W. (1997) Trust in Large
Organizations, American Economic Review, 87, 2, 1997, pp. 333–338.
Page 316
301
Leahy, D. and Montagna, C.,(2004) Union Bargaining Power, Labour Standards and Foreign
Direct Investment, University of Nottingham Research Paper Series, No. 2004/19.
Lecraw, D.J. (1993) Outward direct investment by Indonesian firms: motivation and effects,
Journal of International Business Studies 24(3): 589–600.
Lee, J.Y. and E. Mansfield, (1996) Intellectual Property Protection and US Foreign Direct
Investment, Review of Economics and Statistics 78:181–6.
Leung, K., Bhagat, R.S., Buchan, N.R., Erez, M. and Gibson, C.B. (2005) Culture and
international business: recent advances and their implications for future research,
Journal of International Business Studies 36(4): 357–378
Levis, M., (1979) Does Political Instability in Developing Countries Affect Foreign
Investment Flow? An Empirical Examination Management International Review
19:59–68.
Levitt, T. (1983) The globalization of markets, Harvard Business Review 61: 92–102.
Li, J. and Guisinger, S.E. (1992) The globalization of service multinationals in the ‗‗Triad‘‘
regions: Japan, Western Europe and North America‘, Journal of International Business
Studies 23(4): 675–696.
Lipsey, R. E. (1999) 'The Role of FDI in International Capital Flows', in M. Feldstein (ed.),
International Capital Flows Chicago: University of Chicago Press.
Liquori, T (2009) FDI and Developing Countries- How Beneficial is FDI for Developing
Countries? http://thomasliquori.me/Word%20Files/FDI_and_developing_countries.pdf
Liu, S. X., (1998) Foreign Direct Investment and the Multinational Enterprise: A
Reexamination Using Signaling Theory, Westport, Connecticut: Greenwood
Publishing.
London, B. and Ross, R. (1995) The political sociology of FDI: global capitalism and capital
mobility, 1965–1980, International Journal of Comparative Sociology 36(3): 98–119.
Loree, D. and Guisinger, S.E. (1995) Policy and non-policy determinants of US equity
foreign direct investment, Journal of International Business Studies 26(2): 281–299.
Luger, M. and Shetty, S. (1985). Determinants of Foreign Plant Start-ups in the United
States: Lessons for Policy Makers in the Southeast. Vanderbilt Journal of
Transnational Law 18, 223–245.
Lunn, J. (1980). Determinants of US Direct Investment in the EEC: Further Evidence.
European Economic Review 13, 93–101.
MacCarthy, B., and Atthirawong, W. (2003). Factors affecting location decisions in
international operations-a Delphi study. International Journal of Operations &
Production Management, 23(7), 794-818.
Maclayton, D., Smith, M., and Hair, J., (1980) Determinants of Foreign Market Entry: A
Multivariate Analysis of Corporate Behavior, Management International Review, 20, 3,
pp. 40-52.
Makino, S., Lau, C. and Yeh, R. (2002) ‗Asset-exploitation versus asset-seeking: implications
for location choice of foreign direct investment from newly industrialized economies‘,
Journal of International Business Studies 33(3): 403–421.
Mallampally, P. & Sauvant, K. (1999). Foreign direct investment in developing countries.
Finance and Development, 34-37.
http://204.180.229.21/external/pubs/ft/fandd/1999/03/pdf/mallampa.pdf
Markusen, J. R., (1984) Multinationals, multi-plant economies, and the gains from trade.
Journal of International Economics 16, 205-226.
Markusen, J.R., and Venables, A.J., (1999) Foreign direct investment as a catalyst for
industrial development. European Economic Review 43 (2), 335–356.
Marley, A.A.J. and Louviere, J.J. (2005). Some probabilistic models of best, worse, and best–
worst choices. Journal of Mathematical Psychology. DETAILS??
Page 317
302
Marshall, A. (1920). Principles of Economics, 8th ed. London: Macmillan.
Martilla, J. A., & James, J. C. (1977). Importance-performance analysis. Journal of
Marketing, 41(1), 77-79.
Mauro, P., (1995) Corruption and Growth Quarterly Journal of Economics, Vol. 110 (3), pp.
681–712.
Mbekeani, K. K (1997), Foreign Direct Investment and Economic Growth, NIEPO
Occasional Paper Series, September
McCann, P. & Mudambi, R. (2004). The Location Behavior of the Multinational Enterprise:
Some Analytical Issues. Growth & Change, 35(4), 491-524.
McKinsey & Company (2003) Multinational Company Investment: Impact on Developing
Economies. McKinsey Global Institute.
http://www.mckinsey.com/mgi/reports/pdfs/newhorizons/Newhorizons.pdf
Meier, G., (1995) Leading Issues in Economic Development. Oxford University Press,
Oxford.
Mellahi, K., Guermat, C., Frynas, G. and Al Bortamani, H. ( 2003). Motives for Foreign
Direct Investment in Gulf Cooperation Countries: The Case of Oman. Conference
Paper. http://www.erf.org.eg/cms.php?id=publication_details&publication_id=657
Mellahi, K., Guermat, C., Frynas, J. & Al-Bortmani, H. (2003). Motives for Foreign Direct
Investment in Oman. Thunderbird International Business Review, 45(4), 431-446.
Meyer, H-D. (1993) The cultural gap in long-term international work groups: a German-
American case study. European Management Journal 11 1, pp. 93–101.
Meyer, K. (2005), Foreign Direct Investment in Emerging Economies. Templeton College,
Oxford. http://klausmeyer.co.uk/publications/2005_meyer_EMF_Templeton.pdf
Meyer, K. and Estrin, S. (1998) 'Entry Mode Choice in Emerging Markets: Greenfield,
Acquisition and Brownfield', Center for East European Studies, Copenhagen Business
School, Working Paper No. 18, February.
Meyer, K. E. (2001). Institutions, transaction costs, and entry mode choice in Eastern Europe.
Journal of International Business Studies, 32(2), 357–367.
Meyer, K.E. (2004) Perspectives on multinational enterprises in emerging economies,
Journal of International Business Studies 35(4): 259–276.
Micklethwait, J. and Woo1dridge, A., (2003) The Company: A Short History of a Modern
Idea Westminster: Modem Library,.
Mikalak, W. (1992) FDI and joint ventures in East-Central Europe: a geographical
perspective, Environment and Planning 25(11): 1573–1582.
Miller, K. D. (1993). Industry and country effects on managers‘ perceptions of environmental
uncertainties. Journal of International Business Studies, 24(4), 693–714.
Miller, S. R. and Parkhe, A., (2002) Is There a Liability of Foreignness in Global Banking?
An Empirical Test of Banks‘ X-Efficiency, Strategic Management Journal, 23, 1, pp.
55–75.
Mina, W. (2007). Are the GCC FDI location determinants favorable? Economics Discussion
Papers 2007–23
Mina, W. (2007). The location determinants of FDI in the GCC countries. Journal of
Multinational Financial Management, 17(4), 336-348.
Ministry of Trade (2009), The Industrial Database. Riyadh, Saudi Arabia.
Mmieh, F., and Owusu-Frimpong, N. (2002). Estimating and testing of the efficiency
hypothesis: A statistical analysis of the Ghana foreign exchange market. In Proceedings
of the International Academy of African Business and Development (IAABD) (pp. 85–
93). Conference, University of Port Elizabeth, Port Elizabeth, South Africa.
Mmieh, F., and Owusu-Frimpong, N. (2004). State Policies and the Challenges in Attracting
Foreign Direct Investment: A Review of the Ghana Experience. Thunderbird
Page 318
303
International Business Review, 46(5), 575-599.
Mody, A. and Srinivasan, K., (1998) Japanese and U.S. Firms as Foreign Investors: Do They
March to the Same Tune?, The Canadian Journal of Economics, 31, 4, pp. 778–799.
Mody, A. and Wheeler, D. (1992) International Investment Location Decisions: The Case of
US Firms, Journal of International Economics 33:57–76.
Molle, W. and Wever, E., (1984). Oil Refineries and Petrochemical Industries in Western
Europe, Geo Journal 9.4 421-430.
Montiel, P.J. and Sharma, S., (1996) Private Capital Flows to Sub- Saharan Africa: An
Overview of Trends and Determinants, Unpublished Paper, World Bank, Washington
DC.
Moore, M. O. (1993) Determinants of German Manufacturing Direct Investment in
Manufacturing Industries, Weltwirtschaftliches Archiv, vol. 129:120-37.
Moosa, I. A. & Cardak, B. A. (2006) The determinants of foreign direct investment: an
extreme bounds analysis, Journal of Multinational Financial Management, 16, pp.
199–211.
Moosa, I. A. (2002). Foreign Direct Investment: Theory, Evidence and Practice. New York:
Palgrave.
Moosa, I. A. and Bollen, B. E. (2002) A Benchmark for Measuring Bias in Estimated Daily
Value at Risk, International Review of Financial Analysis (forthcoming).
Morgan, R. E., & Katsikeas, C. S..(1997). Theories of international trade, foreign direct
investment and firm internationalization: a critique. Management Decision, 35(1), 68-
78.
Morisset, J. and Neso, O.L. (2002). Administrative barriers to foreign investment in
developing countries Transnational Corporations, 11 (2), pp. 99-120.
Moxon, R.W. (1975), The motivation for investment in offshore plants: the case of the US
electronics industry, Journal of International Business Studies, Vol. 6, Spring, pp. 51-
66.
Mudambi, R. (1999) ‗Multinational investment attraction: principal-agent considerations‘,
International Journal of the Economics of Business 6(1): 65–79.
Mudambi, R. and Navarra, P. (2003) Political tradition, political risk and foreign direct
investment in Italy, Management International Review 43(3): 247–265.
Mudambi, R., & Navarra, P. (2002). Institutions and international business: A theoretical
overview. International Business Review, 11(6), 635–646.
Mudambi, R., (1995) The Multinational Investment Location Decision: Some Empirical
Evidence, Managerial and Decision Economics, 16 (1995): 249-57.
Mundell, R. (1957), International Trade and Factor Mobility, American Economic Review 47:
321-35.
Mytelka, L. K. (1987). ―Knowledge-intensive production and the changing
internationalization strategies of multinational firms‖, in James A. Caporaso, ed., A
Changing International Division of Labour London: Francis Pinter Publishers), pp. 44-
70.
Nachum, L. (2000). Economic geography and the location of TNCs: Financial and
professional service FDI to the USA , Journal of International Business Studies, 31 (3),
pp.367-85.
Narula, R. & Dunning, J. H. (2000). Industrial development, globalisation and multinational
enterprises: New realities for developing countries. Oxford Development Studies, 28(2),
141–167.
Narula, R. (1993). Technology, international business and Porter's 'diamond': Synthesizing a
dynamic competitive development model. Management International Review, 33(2),
85-107.
Page 319
304
National Institute Economic Review, (1997) Domestic Institutions, Agglomerations and
Foreign Direct Investment in Europe European Economic Review, 43, 925-34.
NCBC (National Commercial Bank Capital) (2010) GCC 'begins to see benefits' of foreign
capital. http://www.emirates247.com/business/economy-finance/gcc-begins-to-see-
benefits-of-foreign-capital-2010-08-07-1.275828
Ng, L. & Tuan, C. (2003). Location decisions of manufacturing FDI in China: implications of
China‘s WTO accession. Journal of Asian Economics, 14(1), 51. doi:10.1016/S1049-
0078(02)00241-5.
Nigh, D. (1985) The effect of political events on US direct foreign investment: a pooled time-
series cross-sectional analysis, Journal of International Business Studies 16(1).
Noorbakhsh, F., Paloni, A., and Youssef, A., (2001) Human capital and FDI inflows to
developing countries: new empirical evidence. World Development 29, 1593–1610.
North, D. C. (1990). Institutions, Institutional Change and Economic Performance.
Cambridge: Cambridge University Press.
North, D. C. (2005). Understanding the Process of Economic Change. Princeton: Princeton
University Press.
North, D.C. (1991) Institutions, Institutional Change and Economic Performance, Cambridge
University Press: Cambridge.
Nunnenkamp P. (2002) Determinants of Foreign Direct Investment Inflows: How
Globalisation Changed the Rules of the Game? Kiel Institute for World Economics,
Working Paper No. 1122, Kiel.
Nunnenkamp, P. and Spatz, J. (2002). Determinants of FDI in developing countries: has
globalization changed the rules of the game?, Transnational Corporations, 11(2), pp. 1-
34.
Nunnenkamp, Peter (2001). Foreign Direct Investment in Developing Countries: What
Policymakers Should Not Do and What Economists Don't Know. Kiel Institute for
World Economics, Discussion Papers 380. Kiel.
http://www.econstor.eu/bitstream/10419/2616/1/kd380.pdf
OECD (1994). Assessing investment opportunities in economies in transition. Paris:
Organisation for Economic Co-operation and Development.
OECD (1995), Benchmark Definition Of Foreign Direct Investment, 3rd
Edition, Paris:
OECD (Organisation for Economic Co-operation and Development), 1996.
OECD (2002) Foreign Direct Investment For Development, Maximising Benefits,.
Minimising Costs. Overview. Organisation For Economic Co-Operation And
Development. Paris : OECD, c2002. http://www.oecd.org/dataoecd/47/51/1959815.pdf
OECD (2003) (Organisation for Economic Co-operation and Development) Economic
Outlook: 2003 ―Trends in foreign direct investment in OECD countries‖. OECD, Paris.
OECD (2008), Benchmark Definition Of Foreign Direct Investment, 4th
Edition, Paris:
OECD (Organisation for Economic Co-operation and Development), 2008.
Oh, H. (2001). Revisiting importance-performance analysis. Tourism Management, 22 (6),
617-627.
Ohlin, B. (1933). Interregional and International Trade. Cambridge, MA: Harvard University
Press.
Olibe, K.O. and Crumbley, C. (1997) Determinants of US private foreign direct investments
in OPEC nations: from public and non-public policy perspectives, Journal of Public
Budgeting, Accounting and Financial Management 9(2): 331– 355.
Oxford Business Group (2008) The Report, Saudi Arabia. Oxford Business Group.
Oxford Business Group (2009) The Report, Saudi Arabia Oxford Business Group.
Pallant, J., (2007), SPSS Survival Manual: A step-by-step guide to data analysis using SPSS
version 15, (3rd edition), Milton Keynes: Open University Press.
Page 320
305
Papanastassiou, M. and Pearce, R. (1990) Host-country Characteristics and Sourcing
Behaviour of UK Manufacturing Industry. Reading: University of Reading Dept. of
Economics, Paper Series B, 7: 140.
Paulhus, D. (1991) ‗Measurement and Control of Response Bias‘, in J.P. Robinson, P.R.
Shaver and L.S. Wrightsman (eds.) Measures of Personality and Social Psychological
Attitudes, Vol. 1, Academic Press: New York, pp: 17–59.
Pauly, L. W. & Reich, S. (1997). National structures and multinational corporate behavior:
Enduring differences in the age of globalization. International Organization, 51, 1–30.
Pelegrin, A. & Bolance, C. (2008). Regional foreign direct investment in manufacturing. Do
agglomeration economies matter? Regional Studies, 42(4), 505-522.
Phelps, N. A., J. Lovering and K. Morgan (1998). Tying the firm to the region or tying the
region to the firm? Early observations on the case of LG in South Wales, European
Union and Regional Studies, 5, 2, pp. 119-137.
Porter, M. E. (1990). The competitive advantage of nations. New York: The Free Press.
Porter, M. E. (1994). The role of location in competition. Journal of Economics of Business,
1 (1), 35–39.
Porter, M. E. (1996). Competitive advantage, agglomerative economies and regional policy.
International Regional Science Review, 19 (1/2), 85–94.
Potter, J., Moore, B. and Spires, R., (2002). The Wider Effects of Inward Foreign Direct
Investment in Manufacturing on UK Industry, Journal of Economic Geography, 2: pp.
311-41.
Pournarakis, M., & Varsakelis, N. C. (2004). Institutions, internationalization and FDI: The
case of economies in transition. Transnational Corporations, 13, 77–94.
Punnett, B.J. and Shenkar, O. (eds). (2004). Handbook for International Management
Research. 2nd edition, Univeristy of Michigan Press, Ann Arbor.
Pusterla, F., & Resmini, L. (2007). Where do foreign firms locate in transition countries? An
empirical investigation. Annals of Regional Science, 41(4), 835-856.
Radulesco, R. and Robson, M.T., (2003).'Does Stricter Employment Protection Legislation
Deter FDI?' University of Newcastle Seminar Series
Ramady, M (2006) Foreign Direct Investment: A Saudi Score Sheet. Arab News 11/09/2006.
http://www.menafn.com/qn_news_story_s.asp?StoryId=1093126736
Ramady, M. A. (2005). The Saudi Arabian economy: Policies, achievements and challenges.
New York: Springer.
Ramady, M., & Saee, J. (2007). Foreign direct investment: A strategic move toward
sustainable free enterprise and economic development in Saudi Arabia. Thunderbird
International Business Review, 49(1), 37-56.
Randøy, T., & Dibrell, C. (2002). How and Why Norwegian MNCs Commit Resources
Abroad: Beyond Choice of Entry Mode. Management International Review (MIR),
42(2), 119-140.
Rangan, S. (1998). Do multinationals operate flexibly? Theory and evidence. Journal of
International Business Studies, 29 (2), 217–238.
Resmini, L., (2000) The determinants of foreign direct investment in the CEECs. Economics
of Transition 8, 665–689.
Reuber, G.L., Crookell, H., Emerson, M., & Gallais-Hamonno, G. (1973). Private Foreign
Investment in Development. Oxford: Clarendon Press.
Ricardo, D. (1951). Principles of political economy and taxation. In P. Straffa (Ed.), The
Works and Correspondence of David Ricardo (separate volume). London: Cambridge
University Press. (Original work published in 1817)
Ricart, J. E., Enright, M. J., Ghemawat, P., Hart, S. L., & Khanna, T. (2004). New frontiers in
international strategy. Journal of International Business Studies, 35(3), 175-200.
Page 321
306
Riedel, J. (1975) The nature and determinants of export-oriented direct foreign investment in
a developing country: a case study of Taiwan, Weltwirtschaftliches Archiv 11(3): 505–
523.
Robock, S. H. (1971). Political risk: Identification and assessment. Columbia Journal of
World Business, 6(4), 6–20.
Rolfe, R., & White, R. (1992). The influence of tax incentives in determining the location of
foreign direct investment in developing counties. Journal of the American Taxation
Association, 13(2), 39–57.
Root, F. R., & Ahmed, A. A. (1979). Empirical determinants of manufacturing direct foreign
investment in developing countries. Economic Development and Cultural Change,
4(27), 751–767.
Root, F. R., (1987) Entry Strategies of International Markets, Lexington, MA: Lexington
Books 1987.
Root, F.R. and Ahmed, A. (1978) The influence of policy instruments on manufacturing
direct foreign investment in developing countries, Journal of International Business
Studies 9(3): 81–93.
Rotemberg, J. and Saloner, G., (1990) Competition and Human Capital Accumulation: a
theory of interregional specialization and trade. NBER Working Paper 3228.
Rugman, A. and Verbeke, A. (2001). Chapter6: Location, competitiveness and the
multinational enterprise. In The Oxford Handbook of International Business, eds A.
Rugman and T. Brewer, pp. 150–180. Oxford University Press, Oxford.
Rugman, A. M. (1979). International Diversification and the Multinational Enterprise.
Lexington (MA): Lexington Books.
Rugman, A. M., & d'Cruz, J. R. (1993). The 'double diamond' model of international
competitiveness: The Canadian experience. Management International Review, 33(2),
17-40.
Rugman, A. M., & Verbeke, A. (1993). Foreign subsidiaries and multinational strategic
management: an extension and correction of Porter's single diamond framework.
Management International Review, 33(2), 71-84.
Rugman, A. M., & Verbeke, A. (2001). Subsidiary-specific advantages in multinational
enterprises. Strategic Management Journal, 22(3), 237–250.
Rugman, A. M., (1981) Inside the Multinationals: The Economics of Internal Markets,
London: Croom Helm.
Rugman, A., (1982) Internalization and Non-equity Forms of International Involvement, in
Rugman, A. (ed.), New Theories of the Multinational Enterprise, London: Croom Helm
Rugman, A.M. (1979) International Diversification and the Multinational Enterprise,
Lexington Books: Lexington, MA
Rugman, A.M. (1979). Risk reduction by international diversification. Journal of
International Business Studies, 2 (Fall/Winter), 75.
Rugman, A.M. and Brewer, T.L. (2001), (Eds) The Oxford Handbook of International
Business, Oxford University Press, Oxford.
Sabi, M. (1988) An application of the theory of foreign direct investment to multinational
banking in LDCs, Journal of International Business Studies 19(3): 433–448.
SABIC (2000) SABIC Story. http://kaznak.web.infoseek.co.jp/big/sabic-story.htm
SABIC (2009). SABIC Annual Report, 2009.
http://www.sabic.com/corporate/en/binaries/SABIC%20Report%202009%20English_t
cm4-5203.pdf
SAGIA (2007) Kingdom of Energy (Saudi Arabia Energy Review Report 2007). Saudi
General Investment Authority, Saudi Arabia.
SAGIA (2009). ―The Competitiveness Review 2009 - An Update on Saudi Arabia‘s 10x10
Page 322
307
Program‖. National Competitiveness Center. Saudi General Investment Authority
(SAGIA) January
SAMBA (2006), ―Saudi Arabia and the WTO‖ Produced by the Office of the Chief
Economist, Samba Financial Group, Saudi Arabia.
Saunders, M., Lewis, P. & Thornhill, A. (2007). Research Methods for Business Students ( 4th
edition). Harlow: Prentice Hall.
Sayek, S. (2000) Inflation and FDI: Theory and evidence. Paper presented at the Royal
Economic Society 2000 Annual Conference, University of St. Andrews, UK.
Scaperlanda, A. E., & Mauer, L. J. (1969). The determinants of US direct investment in the
EEC. European Economic Review, 59, 558–568
Scaperlanda, A., Balough, R. and Lunn, J. (1983) Determinants of US direct investment in
the EEC Revisited, European Economic Review 21(3): 381–390.
Scaperlanda, A.E. (1967). The EEC and US Foreign Investment: Some Empirical Evidence.
Economic Journal 77, 22–46.
Schmenner, R., Huber, J. and Cook, R., (1987) Geographic differences and the location of
new manufacturing facilities. Journal of Urban Economics 21, pp. 83–104.
Schmitz, A. (1970). The Impact of Trade Blocs on Foreign Direct Investment. Economics
Journal 80, 724–731.
Schneider, F. and Frey, B. S. (1985). Economic and Political Determinants of Foreign Direct
Investment. World Development 13 (2): 161–175.
Scholes, M. and Wolfson, M. (1990) "The Effects of Changes in Tax Laws on Corporate
Reorganization Activity,‖ Journal of Business 63, 141-164 Schwab, K. (2009). "The
Competitiveness Report 2009-2010". World Economic Forum, Geneva, Switzerland.
Scott, A. J. (1996). Regional motors of the global economy. Futures, 28 (5), 391–411.
Servan-Schreiber, J.J. (1986). The American Challenge. New York: Atheneum.
Sethi, D., Guisinger, S., Phelan, S. & Berg, D. (2003). Trends in foreign direct investment
flows: a theoretical and empirical analysis. Journal of International Business Studies,
34(4), 315-326.
Shapiro, D. and Globerman, S. (2001) National Infrastructure and Foreign Direct Investment,
Mimeo, Simon Fraser University (February).
Sheskin, D. J. (2007). Handbook of Parametric and Nonparametric Statistical Procedures (4th
ed.). Boca Raton, FL: Chapman & Hall/CRC.
Singh, H., Kwang W. J. (1995). Some New Evidence on Determinants of Foreign Direct
Investment in Developing Countries. World Bank, Policy Research Working Papers
1531. Washington, D.C.
Smith, D. and Florida, R., (1994) Agglomeration and industry location: An econometric
analysis of Japanese-affiliated manufacturing establishments in automative-related
industries. Journal of Urban Economics 36, pp. 23–41.
Spar, D. L. (2001). National policies and domestic politics. In T. Brewer, & A. Rugman
(Eds.), Oxford Handbook of International Business. Oxford: Oxford University Press.
Steenkamp, J. and Baumgartner, H. (1998) Assessing measurement invariance in cross–
national consumer research, Journal of Consumer Research 25(1): 78–90
Steenkamp, J. and Hofstede, F. (2002) ‗International market segmentation: issues and
perspectives‘, International Journal of Research in Marketing 19(3): 185–213.
Stevens, G. V. G., (1969). US Direct Manufacturing Investment to Latin America: Some
Economic and Political Determinants, AID research paper
Stevens, Guy V. G. (1998). Exchange Rates and Foreign Direct Investment: A Note, Journal
of Policy Modeling, 20, 3, pp. 393Y401.
Stoian, C., & Filippaios, F. (2008). Dunning's Eclectic Paradigm: A Holistic, Yet Context
Specific Framework For Analysing The Determinants Of Outward FDI: Evidence from
Page 323
308
international Greek investments. International Business Review, 17(3), 349-367.
Stopford, J.M., & Wells, L.T. (1972). Managing the multinational enterprise: organization of
the firm and ownership of the subsidiaries. New York: Basic Books.
Storper, M. (1995). The resurgence of region economies: ten years later: the region as a nexus
of untraded interdependencies. European Urban and Regional Studies, 2 (3), 191–221.
Storper, M., & Scott, A. J. (1995). The Wealth of Regions. Futures, 27 (5), 505–526.
Summary, R. and Summary, L. (1995) ‗The political economy of United States FDI in
developing countries: an empirical analysis‘, Quarterly Journal of Business and
Economics 34(3): 80–93.
Swamidass, P.M. (1990) A comparison of the plant location strategies of foreign and
domestic manufacturers in the US, Journal of International Business Studies 21(2):
301–317.
Swedenborg, B. (1979) The multinational operations of Swedish firms: an analysis of
determinants and effects, Stockholm: Industriens Utredningsinstitut.
Swenson, D. L. (1994) The Impact of U.S. Tax Reform on Foreign Direct Investment in the
United States, Journal of Public Economics, 54, 2, pp. 243Y66.
Tahir, R. and Larimo, J. (2004) Understanding the location strategies of the European firms
in Asian countries, Journal of American Academy of Business 5(1/2): 102–109.
Tahir, R., & Larimo, J. (2005). Understanding the Strategic Motivations of Finnish
Manufacturing FDIs in Emerging Asian Economies. Asian Business & Management,
4(3), 293-313.
Tam, K., Newton, J., Strange, R. and Enright, M. (2008) Location-specific advantages and
regional competitiveness: a study of financial services MNCs in Hong Kong. In J.H.
Dunning and P. Gugler (eds) FDI, Location and Competitiveness, pp.159-174.
Amsterdam: Elsevier.
Tan, B. and Vertinsky, I. (1996) ‗Foreign direct investment by Japanese electronics firms in
the United States and Canada: modelling the timing of entry‘, Journal of International
Business Studies 27(4): 655–681.
Tanzi, V. (1998). Corruption around the world: Causes, consequences, scope, and cures, IMF
Working Paper WP/98/63. International Monetary Fund.
Tanzi, V., & Davoodi, H. (1997). Corruption, public investment and growth, IMF Working
Paper 97/139. Washington: International Monetary Fund.
Tatoglu, E. and Glaister, K.W. (1998) ‗Western MNCs‘ FDI in Turkey: an analysis of
location specific factors‘, Management International Review 38(2): 133–159.
Taylor, C.T. (2000) The Impact of Host Country Government Policy on US Multinational
Investment Decisions, World Economy, Vol. 23, 635-648.
Taylor, J., (1993) An Analysis of the Factors Determining the Geographical Distribution of
Japanese Manufacturing Investment in the UK, 1948-91, Urban Studies, 30, 7, 1209-
24.
Teece, D. J., (1986) Transaction Cost Economics and the Multinational Enterprise, Journal of
Economic Behavior and Organization, 7, pp. 21-45
Thomas, D.E. and Grosse, R. (2001) Country-of-origin determinants of foreign direct
investment in an emerging market: the case of Mexico, Journal of International
Management 7 (1) : 59-79.
Tong, S. Y., and A. Y. Hu (2003): ―Do Domestic Firms Benefit from Foreign Direct
Investment? Initial Evidence from Chinese Manufacturing,‖ mimeo, The University of
Hong Kong. http://www.hiebs.hku.hk/events_updates/pdf/tongyueting.pdf
Trevino, L.J., J.D. Daniels and H. Arbelaez (2002), Market Reform and FDI in Latin
America: An Empirical Investigation, Transnational Corporations, Vol. 11, No 1,.
Tsai, P. L., (1994). Determinants of Foreign Direct Investment and Its Impact on Economic
Page 324
309
Growth. Journal of Economic Development 19 (1): 137–163.
Turnball, P.W. (1987), ―A challenge to the stages theory of the internationalisation process‖,
in Rosoon, P.J. and Reid, S.D. (Eds), Managing Export Entry and Expansion, Praeger
Publishers, New York, NY.
Ulgado, F.M. (1996) ‗Location characteristics of manufacturing investments in the US: a
comparison of American and foreign-based firms‘, Management International Review
36(1):7–26.
UNCTAD (1996) Incentives and Foreign Direct Investment. Current Studies, Series A, No.
30. New York and Geneva: United Nations
UNCTAD (1996). World Investment Report 1996. United Nations, New York.
UNCTAD (1998). World Investment Report 1998. United Nations: New York and Geneva,
1998.
UNCTAD (1999) World Investment Report: Foreign Direct Investment and the Challenge of
Development (New York: United Nations).
UNCTAD (2000) World Investment Report: Cross-border Mergers and Acquisitions and
Development (New York: United Nations).
UNCTAD (2002). World Investment Report 2002: Transnational Corporations and Export
Competitiveness (New York: United Nations, 2002).
UNCTAD (2003). World Investment Report 2003. FDI Policies for Development: National
and International Perspectives (New York: United Nations, 2003).
UNCTAD (2004). World Investment Report 2004. United Nations: New York and Geneva.
UNCTAD (2006). World Investment Report 2006. United Nations: New York and Geneva,
2006.
UNCTAD (2007) World Investment Prospects Survey 2007–2009 United Nations
Conference On Trade And Development, United Nations New York And Geneva,
2007.
UNCTAD (2007). World Investment Report 2007. United Nations: New York and Geneva,
2007.
UNCTAD (2008). World Investment Report 2008. United Nations: New York and Geneva,
2008.
UNCTAD (2009). World Investment Report 2009. United Nations: New York and Geneva,
2009.
UNCTC (1992) The Determinants of Foreign Direct Investment, A Survey of the Evidence,
Division of Transnational Corporations and Investment, New York. Bhattacharya, A.
United States Department of Commerce. (1993). International direct investment.
Survey of Current Buying Power, 30.
Vahlne, J.E. and Johanson, J. (2002) ‗New Technology, New Companies, New Business
Environments and New Internationalisation Processes?‘, in V. Havila, M. Forsgren and
H. DETAILS??
Venables, A. J. (1998). The assessment: trade and location. Oxford Review of Economic
Policy, 14 (2),1–6.
Vernon, R. (1966). International investment and international trade in the product cycle.
Quarterly Journal of Economics, 80, 190–207.
Vernon, R. (1973) Sovereignty at Bay, Penguin: Harmondsworth.
Vernon, R. (1979) The product cycle hypothesis in a new international environment, Oxford
Bulletin of Economics and Statistics 41(4): 255–267.
Villela L. and A. Barreix (2002) Taxation and Investment promotion, Background Note for
Global Economic Prospects 2003, Washington: Inter American Development Bank.
Wadeea, M.A. (2000) Tanmiyat Almwaarid albashariya wa al ihlah fi aldowal al khalijiya al
arabia [Developing human resources and localization in Arab Gulf countries]. Kuwait:
Page 325
310
Arab Planning Institute.
Wei, S. (1997). Why is corruption so much more taxing than tax? Arbitrariness kills, NBER
Working Paper 6255. Cambridge, MA: National Bureau of Economic Research.
Wei, S. J. (2000a). How taxing is corruption on international investors? Review of Economics
and Statistics, 8, 1–11.
Wei, Shang-Jin, (1997) ―How Taxing is Corruption on International Investors,‖ NBER
working paper 6030.
Wei, Shang-Jin. (2000b) ―Local Corruption and Global Capital Flows‖ Brookings Papers on
Economic Activity, 0, 2, pp. 303Y46.
Wei, Y., Liu, X., Parker, D. and Vaidya, K., (1999). 'The Regional Distribution of Foreign
Direct Investment in China', Regional Studies, 33, 9, pp. 857-67.
Weigel, Dale, (1970). ―Restrictions on Dividend Repatriations and the Flow of Direct
Investment to Brazil,‖ Journal of International Business Studies 1(2), pp.35–50.
Welfens, P. J. J. (1993). The growth of the private sector: Privatization and foreign direct
investment in Eastern Europe (pp. 119–166). In H. Seibert, Tuebingen (Eds.),
Overcoming the Transformation Crisis. Germany: J.C.B. Mohr.
Wheeler, D., & Mody, A. (1992). International investment location decisions: The case of US
firms. Journal of International Economics, 33, 57–76.
Widmier, S., Brouthers, L., & Beamish, P. (2008). Expatriate or local? Predicting Japanese,
subsidiary expatriate staffing strategies. International Journal of Human Resource
Management, 19(9), 1607-1621.
Wilkins, M. (1977) Modem European Economic History and the Multinationals, The Journal
of European Economic History, 6: 575-95.
Wilkins, M. (1986) The History of European Multinationals: A New Look, The Journal of
European Economic History, 15 (1986): 483-510.
Wilkins, M. (1998) European and North American Multinationals, Business History, 30: 8-
45.
Williamson, O.E. (1985) The Economic Institutions of Capitalism, Free Press: New York.
Wint, A. G. (1992). Liberalizing foreign direct investment regimes: the vestigial screen.
World Development, 20(10), 1515–1529.
Woodward, D.P. and Rolfe, R.J. (1993) ‗The location of export-oriented foreign direct
investment in the Caribbean Basin‘, Journal of International Business Studies 24(1):
121–144.
Woodward, D.P., (1992) Locational determinants of Japanese manufacturing start-ups in the
United States. Southern Economic Journal 58, pp. 690–708.
World Bank (1999) World Development Report 1999: Knowledge for Development. Oxford
University Press, New York.
World Bank (2005) Investment climate surveys. World Bank, Washington DC, 2005.
World Bank (2007) Economic developments and prospects: job creation in an era of high
growth. PLACE OF PUBLICATION?
Yamada, T. and Yamada, T. (1996) Country integration and Japanese FDI in the EC,
Contemporary Economics Policy 14(1): 48–58.
Yamawakai, H. (1993), ―Location decisions of Japanese multinational firms in European
manufacturing industries‖, in Hughes, K. (Ed.), European Competitiveness, Cambridge
University Press, Cambridge, MA.
Yamawaki, H., J. Thiran and L. Barbarito. (1996). ―Regional and Country Determinants of
Location Decisions: Japanese Multinationals in European Manufacturing.‖ Paper
Presented at the Academy of International Business Conference, Banff, Canada.
York: Routledge.
Young, S., Hamill, J., Wheeler, C. and Davies, J. R. (1989) International Market Entry and
Page 326
311
Development, Prentice Hall: Harvester Wheatsheaf.
Zaheer, S. (1995) Overcoming the Liability of Foreignness, Academy of Management
Journal, 38, 2, 1995, pp. 341–363.
Zhang, K. (2001). What attracts foreign multinational corporations to China? Contemporary
Economic Policy, 19(3), 336-346.
Zhao, H. and G. Zhu. (2000). Location Factors and Country of Origin Differences: An
Empirical Analysis of FDI in China. Multinational Business Review 8(1), 60–73.
Zhou, C., Delios, A. and Yang, J.Y. (2002) Locational determinants of Japanese foreign
direct investment in China, Asia Pacific Journal of Management 19(1): 63–86.
Zitta, S.J. & Powers, T. L. (2003) Motives for foreign direct investment in the United States.
Thunderbird International Business Review, 45(3): 275-288.
Page 327
312
Appendices
The survey
Page 335
320
Saudi General Investment Authority (SAGIA) Letter