DISCUSSION PAPER SERIES Forschungsinstitut zur Zukunft der Arbeit Institute for the Study of Labor Locus of Control and Job Search Strategies IZA DP No. 4750 February 2010 Marco Caliendo Deborah Cobb-Clark Arne Uhlendorff
Transcript
DI
SC
US
SI
ON
P
AP
ER
S
ER
IE
S
Forschungsinstitut zur Zukunft der ArbeitInstitute for the Study of Labor
Any opinions expressed here are those of the author(s) and not those of IZA. Research published in this series may include views on policy, but the institute itself takes no institutional policy positions. The Institute for the Study of Labor (IZA) in Bonn is a local and virtual international research center and a place of communication between science, politics and business. IZA is an independent nonprofit organization supported by Deutsche Post Foundation. The center is associated with the University of Bonn and offers a stimulating research environment through its international network, workshops and conferences, data service, project support, research visits and doctoral program. IZA engages in (i) original and internationally competitive research in all fields of labor economics, (ii) development of policy concepts, and (iii) dissemination of research results and concepts to the interested public. IZA Discussion Papers often represent preliminary work and are circulated to encourage discussion. Citation of such a paper should account for its provisional character. A revised version may be available directly from the author.
IZA Discussion Paper No. 4750 February 2010
ABSTRACT
Locus of Control and Job Search Strategies* Standard job search theory assumes that unemployed individuals have perfect information about the effect of their search effort on the job offer arrival rate. In this paper, we present an alternative model which assumes instead that each individual has a subjective belief about the impact of his or her search effort on the rate at which job offers arrive. These beliefs depend in part on an individual’s locus of control, i.e., the extent to which a person believes that future outcomes are determined by his or her own actions as opposed to external factors. We estimate the impact of locus of control on job search behavior using a novel panel data set of newly-unemployed individuals in Germany. Consistent with our theoretical predictions, we find evidence that individuals with an internal locus of control search more and that individuals who believe that their future outcomes are determined by external factors have lower reservation wages. JEL Classification: J64 Keywords: job search behavior, search effort, reservation wage, locus of control,
unemployment duration Corresponding author: Marco Caliendo IZA P.O. Box 7240 53072 Bonn Germany E-mail: [email protected]
* The authors thank Silke Anger, Lex Borghans, Dirk Hofmann, Pia Pinger, Stefanie Schurer, Thomas Siedler and Gerard van den Berg for helpful comments and suggestions. We also thank the participants in seminars and conferences at the Australian National University, the 2009 Labour Econometrics Workshop (Brisbane), EEA 2009 (Barcelona), University of Maastricht and AEA 2010 (Atlanta) for valuable comments. The IAB (Nuremberg) kindly gave us permission to use the data. Marco Caliendo and Arne Uhlendorff thank the German Research Foundation (DFG) for financial support of the project CA 829/1-1.
1 Introduction
Standard job search theory assumes that unemployed individuals have perfect informationabout the effect of their search effort on the job offer arrival rate. In this paper, we presentan alternative model which assumes instead that each individual has a subjective beliefabout the impact of his or her search effort on the rate at which job offers arrive. Thissubjective belief depends in part on individuals’ ‘locus of control’, which is defined as ageneralized expectation about the internal versus external control of reinforcement (Rotter,1966). A person whose external locus of control dominates tends to believe that much ofwhat happens is beyond his or her control. Life’s outcomes are instead attributed toother forces, like fate or luck, rather than to ones own actions. In contrast, a person withan internal locus of control sees future outcomes as being contingent on his or her owndecisions and behavior.
It is quite intuitive that people who believe that success in life largely depends ontheir own actions and efforts rather than on luck or other “external” forces in turn expectdifferent returns to their own behavior—particularly with respect to investment decisionslike educational choices—than individuals with a more external locus of control. Giventhis, it seems sensible to expect that locus of control will have an important effect onmany economic outcomes and in particular, that internality will be positively correlatedwith economic success.
In fact, several empirical studies do conclude that locus of control is correlated withlabor market success, in particular wages. An early example is Andrisani (1977, 1981) whoexamines National Longitudinal Survey data and finds that individuals with an internallocus of control in 1968 had significantly higher hourly wages two years later. Similarly,Osborne Groves (2005) analyzes data from the National Longitudinal Survey of YoungWomen and concludes that women with an internal locus of control earn more than womenwith an external locus of control. Semykina and Linz (2007) also find a positive associationbetween the locus of control and wages for Russian women, though not for Russian men.The evidence from studies based on the Panel Study of Income Dynamics (PSID) is moremixed. For example Duncan and Morgan’s (1981) replication study of Andrisani (1977)fails to produce evidence of a strong link between locus of control and wage rates1, thoughDuncan and Dunifon (1998) find that an internal locus of control is positively related towages some 20-25 years later. Using German data Anger and Heineck (2009) find a wagepenalty for individuals with a highly external locus of control.
Investment decisions also appear to be linked to individuals’ locus of control. In partic-ular, Coleman and Deleire (2003) conclude that locus of control affects education decisionsprimarily by influencing teenagers’ expectations regarding the return to human capital in-vestments.2 Cebi (2007), however, is not able to replicate these results using a differentdata set once cognitive ability is controlled for. Still, the potential link between individu-als’ locus of control and their human capital investments raises questions about the extent
1In a reply to this article Andrisani (1981) argues that Duncan and Morgan actually failed to disprovehis results and cites several other studies that confirm his findings.
2Hansemark (2003) finds evidence for a positive impact of internal locus of control on the probabilityof starting a new business for men, but not for women.
2
to which locus of control affects wages directly via productivity versus indirectly throughskills acquisition. Piatek and Pinger (2009), for example, conclude that locus of controlaffects wages only indirectly through the schooling decision. Heckman et al. (2006) useindicators of self-esteem and locus of control to construct a one-dimensional, latent factorrepresenting noncognitive skills. They find that noncognitive skills have both a direct wageeffect (via productivity) and an indirect wage effect (via schooling and work experience).
To our knowledge, there exist only three previous studies that assess the effect of locusof control on transitions from unemployment to employment.3 Gallo et al. (2004) andUhlendorff (2004) analyze the German Socio Economic Panel (SOEP) and conclude thata higher sense of internal control is associated with a higher probability of reemploymentand with shorter spells of unemployment, respectively.4 Neither study, however, is ableto distinguish between the effect that locus of control as a form of unobserved abilityhas in directly affecting the probability of receiving a job offer and the role that locus ofcontrol might play in shaping expectations about the return to investments in job search.In independent work, McGee (2010) takes a similar approach to ours to investigate jobsearch among respondents in the 1979 National Longitudinal Survey of Youth (NLSY)and finds that young unemployed men with an internal locus of control search more andhave higher reservation wages. Although he lacks a direct measure of individuals’ beliefsabout the payoffs to job search, McGee estimates models of the propensity to receive ajob offer conditional on having made contact with an employer and finds results that areconsistent with his assumption that locus of control influences search behavior throughbeliefs about the efficacy of job search rather than productivity per se.
Our paper advances this previous literature in two important ways. First, unlike McGee(2010), we directly examine the link between individuals’ locus of control and their beliefsabout the payoffs to job search. Second, we develop a job search model which incorporatesindividuals’ subjective beliefs about the effect of their search effort on the job offer arrivalrate. Specifically, individuals with an internal locus of control believe that job search isassociated with a relatively large increase in the probability of finding a job, while thosewith an external locus of control believe that search has little effect on the job offer arrivalrate. Unemployed individuals who believe that labor market success depends on their ownefforts are consequently expected to search more and have higher reservation wages. LikeColeman and Deleire (2003), we contrast these predictions to those from an alternativemodel in which locus of control is viewed as a form of ability that has a direct impact onthe productivity of the worker. In this alternative model, individuals with a more internallocus of control have a higher job arrival rate, independent of their search effort, becausethey are more able. They are expected to have higher reservation wages, but to search less.Thus, we are able to use our theoretical model to generate empirically testable predictionsand to formally distinguish between alternative explanations of the link between locus ofcontrol and job search.
We test the implications of our model by estimating the impact of an individual’s locus3Job search strategies have been linked to workers’ impatience, however, see DellaVigna and Paserman
(2005).4Uhlendorff (2004) finds this effect only for West Germany.
3
of control on his or her search intensity and reservation wage using a novel panel data setof newly unemployed individuals in Germany. Specifically, our data are from the first waveof the IZA Evaluation Data Set (see Caliendo et al., 2009, for details). This data set isbased on approximately 17,000 individuals who became unemployed between late 2007 andearly 2008. This large number of observations allows us to apply non-parametric matchingmethods in addition to standard regression techniques. This is an advantage comparedto data sources like the SOEP or the NLSY which usually contain a relatively smallnumber of unemployment spells per year. The data are unique in providing us with detailedinformation about search behavior, reservation wages and different psychological traitsincluding locus of control. Moreover, our survey data can be linked to administrative datacontaining detailed information about previous employment histories including previouswages and time spent in unemployment. This is important in our context because thisinformation goes a long way towards capturing unobserved individual characteristics whichmight be correlated with both locus of control and current job search behavior.
The interviews were conducted approximately two months after individuals enteredunemployment. The data allow us to observe the impact of the locus of control on jobsearch behavior directly and thereby to discriminate between alternative models of themechanism through which locus of control affects job search. Additionally, all individualsare interviewed at the same point in time during their unemployment spell. Thus concernsabout potential reverse causality which is a particular challenge in studies of the relation-ship between noncognitive skills and labor market outcomes are reduced substantially. Incontrast, in surveys like the SOEP and the NLSY the timing of the measurement of thelocus of control and the beginning of unemployment spells typically varies substantiallyacross individuals.
We find that the marginal effect of an additional job application on individuals’ propen-sity to report that they are very likely to get a job in the next period is higher among thosejob seekers with an internal locus of control. Moreover, individuals with a more externallocus of control have lower reservation wages and search less intensively. These results areconsistent with locus of control affecting search behavior through individuals’ subjectivebeliefs about the payoff to job search rather than simply through individuals’ unobservedability.
The outline of this paper is as follows. Section 2 presents the theoretical model, whileSection 3 describes the data in detail. In Section 4 we present our estimation strategy andthe results before Section 5 concludes.
2 Theoretical Framework
We begin by assuming that each unemployed individual searches sequentially for a job in astationary environment. Job offers arrive for a given search effort s with arrival rate λ(s).This arrival rate depends positively on individuals’ search effort and the marginal return tosearch effort is decreasing (i.e. λ′ > 0 and λ′′ < 0). Job offers represent independent drawsfrom a wage distribution F (w) which is known by the unemployed. Each unemployedindividual receives unemployment benefits b and and faces search costs c(s) which are
4
increasing in search effort (i.e. c′ > 0 and c′′ > 0).Each time a job offer arrives, individuals must decide whether to accept the offer or to
reject it and to search further. The optimal search strategy will rest in part on choosing areservation wage, i.e., the wage at which the benefits of continued search are just equal tothe additional search costs.5 Any wage offer above the reservation wage is accepted, whileany offer below the reservation wage is rejected.
2.1 Locus of Control and the Return to Search Effort
Unlike the standard search model, we assume that individuals do not know the exactrelationship between their own search effort s and the job offer arrival rate λ(s). Instead,we assume that each individual has a subjective belief—given by (λ∗(s, loc))—about theeffect of s on λ which depends on the extent to which an individual has an internallocus of control (loc).6 Individuals with an internal locus of control believe that increasedsearch effort results in a relatively large increase in the job offer arrival rate. In contrast,individuals who feel that their own behavior does not influence future outcomes believethat additional search effort has little effect on the rate at which job offers arrive. In otherwords, ∂λ∗(s,loc)
∂s is assumed to be higher for those with a more internal locus of control
than for those with a more external locus of control, i.e., ∂2λ∗(s,loc)∂s∂loc > 0. Our objective is to
adopt a straightforward, parsimonious specification of the relationship between individuals’beliefs about the job arrival rate and the degree to which they have an internal locus ofcontrol which is consistent with this assumption. Consequently, we model individuals’subjective beliefs about arrival rates as λ∗(s, loc) = λ(s)f(loc), with f ′(loc) > 0.
If a job-seeker receives no job offer at time t, he or she continues searching. If, however,a job offer with wage w is received, he or she accepts that job offer so long as the cor-responding discounted expected utility associated with being hired at that wage (Ve(w))exceeds the discounted expected utility (Vu) of remaining unemployed and continuing tosearch. The reservation wage φ defines the stopping rule and corresponds to the wage offerfor which Vu = Ve(φ) implying that every wage offer above φ will be accepted while everywage offer below φ will be rejected.
More specifically, the utilities associated with accepting a job offer and with continuedsearch are given by the following:
Ve(w) =1
1 + rdt[wdt + (1− qdt)Ve(w) + qdtVu] (1)
Vu =1
1 + rdt[(b− c(s))dt + λ(s)f(loc)dt(
∫ φ
0VudF (w) +
∫ ∞
φVe(w)dF (w))
+(1− λ(s)f(loc)dt)Vu] (2)5For a description of job search models see for example Mortensen and Pissarides (1999) or Cahuc and
Zylberberg (2004). An overview of the empirical research is given by Eckstein and van den Berg (2007).6In other words, we measure locus of control such that higher values of loc are associated with a more
internal locus of control.
5
where r is the real instantaneous rate of interest, dt describes a short interval of time t,and the job separation rate is q. The discounted expected utility of being hired is equalto the income received in the period (wdt) plus the discounted expected future incomestream. With probability (1 − qdt) this is Ve(w) and with probability qdt this is Vu. Thediscounted expected utility of continuing to search is the net income ((b−c(s))dt) receivedin the period plus the discounted expected utility of receiving a future job offer. Takentogether the discounted expected utilities associated with being unemployed (Vu) and withbeing hired at wage w (Ve(w)) implicitly define the reservation wage for a given searcheffort s. In particular, using equations (1) and (2) we can show that the reservation wageoffer φ at which Vu = Ve(φ) is given by
φ = b− c(s) +λ(s)f(loc)
r + q
∫ ∞
φ(w − φ)dF (w). (3)
Unemployed individuals choose both their search effort s and reservation wage φ so asto maximize their discounted expected utility Vu over an infinite horizon. Substituting theconstraint that Vu − Ve(φ) = 0 into this optimization problem, we can show that optimalsearch behavior is determined by the maximization of Vu = φ/r with respect to s. Thisimplies that we can solve for the optimal search effort s∗ by differentiating the relation(3) with respect to s and solving for s∗ such that ∂φ/∂s = 0. Specifically,
c′(s∗) =λ′(s∗)f(loc)
r + q
∫ ∞
φ(w − φ)dF (w). (4)
Equation (4) implies that individuals choose their optimal search effort by equating themarginal cost of job search with the marginal benefits associated with additional search,i.e., an increased probability of receiving a job offer paying more than their reservationwage.
Combining equations (3) and (4) we can solve for individuals’ reservation wage at theoptimal level of search s∗ as follows:
φ = b− c(s∗) +λ(s∗)λ′(s∗)
c′(s∗). (5)
Reservation wages are increasing in unemployment benefits and the job offer arrival rate,but decreasing in the costs of job search. Finally, higher marginal search costs raise reser-vation wages, while reservation wages are lower the greater is the marginal effect of jobsearch on the job offer arrival rate.
We now consider the effect that individuals’ beliefs about the offer arrival rate haveon their optimal search behavior. In particular, we are interested in the effect of a changein individuals’ locus of control on φ and s∗. It can be shown that individuals who have amore internal locus of control, i.e., those who believe that their own efforts have relativelylarge effects on future outcomes, have higher reservation wages and search more intensivelythan those with a more external locus of control. Specifically, we find that
∂φ
∂loc> 0 and
∂s∗
∂loc> 0. (6)
6
See Appendix B for details.7 The implications are quite intuitive. Conditional on searchintensity, individuals with a highly internal locus of control expect more future job offers.For them remaining unemployed and waiting for new job offers has a higher expectedutility, which leads to a higher reservation wage. For a given amount of search and aspecific reservation wage, the subjective marginal returns of search are also higher forindividuals with a highly internal locus of control. So, in order to equalize marginal returnsand marginal costs of search, they search more.
For simplicity, the model is based on the assumption that the locus of control is stableover time, i.e., that the unemployment duration itself does not have any impact on f(loc)and that individuals do not update their beliefs about the impact of their search effort onthe probability of receiving a job offer. This simplifying assumption allows us to maintaintractability and focus attention on the key relationships of interest. In the empirical anal-ysis, we analyze the effect of locus of control on job search behavior by comparing onlyindividuals who are at the same point in the unemployment spell. Thus, our estimatesare unaffected by any subsequent updating of beliefs as individuals’ unemployment spellsprogress.
2.2 Locus of Control as a Measure of Ability
Thus far we have assumed that locus of control affects individuals’ search behavior throughtheir perceptions of the effect of job search on the probability of finding a job. Specifically,we have assumed that ∂λ∗(s∗,loc)
∂s∗ is higher for those with a more internal locus of controlthan for those with a more external locus of control. In short, individuals with an internallocus of control have a higher subjective probability of receiving a job offer at any givenlevel of search intensity because they believe the payoff to search is higher.
The predictions of this model can be compared to an alternative model in which locus ofcontrol is a component of overall ability. Individuals with an internal locus of control maysimply be more productive and therefore have a higher expected probability of receivinga job offer, perhaps because they believe that potential employers can observe their locusof control by interviewing them.8 We consider this possibility by specifying an alternativemodel in which the relationship between job offer arrivals and an individual’s locus ofcontrol is given by λa(s, loc) = λ(s) + f(loc) with f ′(loc) > 0. In this case, individualswith an internal locus of control have a higher probability of receiving a job offer for anygiven search intensity because they are more productive.9
In contrast to the above model, the expected effect of search on the probability of7These implications correspond to the theoretical results given by van den Berg and van der Klaauw
(2006). They show in the context of a job search model with multiple search channels that an increase insearch productivity—which corresponds to an increase in the subjective returns to search in our model—leads to a higher reservation wage and an increase in search effort.
8The implications are the same for a model in which individuals with an internal locus of control aremore able to generate a wage offer above their reservation wage because they search more effectively.
9Note that the probability of receiving a job offer above the reservation wage is given by: (λ(s) +
f(loc))R ∞
φVe(w)dF (w) = λ(s)
R ∞φ
(1 + f(loc)λ(s)
)Ve(w)dF (w). Consequently, our model in which an internallocus of control increases the offer arrival rate is equivalent to a model in which individuals who have aninternal locus of control receive higher wage offers.
7
receiving a job offer is independent of an individuals’ locus of control, i.e., ∂λa(s,loc)∂s = ∂λ(s)
∂s .
Solving for the optimal search effort implies that
c′(s∗) =λ′(s∗)r + q
∫ ∞
φ(w − φ)dF (w). (7)
Reservation wages are given by:
φ = b− c(s∗) +λ(s∗)λ(s∗)′
c′(s∗) +f(loc)r + q
∫ ∞
φ(w − φ)dF (w). (8)
Unlike the case when locus of control operates through beliefs about the payoff to ad-ditional search effort (see equation (4)), here an individual’s locus of control affects hisor her optimal search level only through the effect that it has on his or her reservationwage φ. Reservation wages are higher the more internal an individual’s locus of control isbecause, for a given search effort s∗, the probability of receiving an acceptable job offeris higher. Given this framework, it can be shown that, in contrast to the previous model,when an internal locus of control results in a higher job offer arrival rate independent ofthe search effort, individuals with a more internal locus of control are expected to searchless. Specifically, we find that
∂φ
∂loc> 0 and
∂s∗
∂loc< 0. (9)
See Appendix B for details. The intuition behind the reservation wage result is the same asbefore. For a given search effort, remaining unemployed and waiting for new job offers hasa higher expected utility for individuals with a highly internal locus of control leading themto have a higher reservation wage. In contrast to the previous model, here the marginalreturns to search are independent of the locus of control. Instead, as a result of the higherreservation wage, the expected marginal returns to search evaluated at a given searchintensity are lower for individuals with a highly internal locus of control. This leads to alower optimal search intensity for them.10
Having a more internal locus of control has an ambiguous effect on the length of timean individual spends being unemployed irrespective of the model considered. In particu-lar, the expected unemployment duration is given by Tu = 1/[λ(s∗)(1 − F (φ)]. Having amore internal locus of control increases the reservation wage in both models which tendsto increase the duration of unemployment. When locus of control is related to subjectivebeliefs about the payoff to search, individuals with a highly internal locus of control searchmore, which leads to a higher job arrival rate and decreases the time spent in unemploy-ment. In the simple ability model, those with an internal locus of control search less, buthave a higher probability of receiving a job offer. Neither model implies a clear predictionon the impact of the locus of control on unemployment duration. This underscores theimportance of observing job search behavior directly.
10The ability model and its implications are similar to the one presented by Fougere, Pradel, and Roger(2009). In their study the unemployed workers receive job offers via own search and via public employmentservice (PES), the latter is costless and independent of own search effort. They show that search effort isa decreasing function of the exogenous PES rate of job contacts, similar to our results with search beinga decreasing function of the locus of control.
8
3 The IZA Evaluation Data Set
The data come from the IZA Evaluation Data Set which targets a sample of individualsentering unemployment between June 2007 and May 2008. In particular, from the monthlyunemployment inflows of approximately 206,000 individuals identified in the administra-tive records, a nine percent random sample is selected for interview. These individualsconstitute the gross sample from which representative samples of approximately 1,450 in-dividuals are interviewed each month, so that after one year twelve monthly cohorts aregathered. These survey data are then matched to administrative employment records ofthe Public Employment Services.11 The IZA Evaluation Data Set is ideal for our purposesbecause individuals are interviewed shortly after they become unemployed and are askeda variety of non-standard questions about attitudes, expectations, and different person-ality traits including locus of control (see Caliendo et al., 2009, for details). Unlike otherresearchers, we are able to compare a large number of individuals with similar, short un-employment durations which reduces concerns about the potential for reverse causalityto affect the analysis. Moreover, access to administrative data on employment historiesincluding previous wages and time spent in employment allows us to carefully control fordifferences in human capital endowments which affect individuals’ reservation wages andthe likelihood of receiving a job offer.
We restrict our sample to individuals who are 16 to 54 years old, and who receive or areeligible to receive unemployment benefits.12 In wave 1, 17,396 interviews were completedwith individuals each of whom had begun an unemployment spell approximately twomonths earlier. We restrict our analysis to individuals who were still unemployed andactively searching for a job at the time of interview. That is, we exclude individuals whohad already found a job or were not searching for other reasons. We further exclude thoseindividuals whose reported hourly reservation wages and benefit levels were in the lowestor highest percentile of the distribution and who had missing values in key variables. Thisleaves us with an estimation sample of roughly 7,900 individuals.
3.1 Measuring Locus of Control
We measure an individual’s locus of control using his or her responses to ten separate itemsfrom the Rotter (1966) scale. Locus of control refers to a general expectation about internalversus external control of reinforcement (Rotter, 1966). People with a more external locusof control believe that much of what happens in life is beyond their control, while peoplewith an internal locus of control see life’s outcomes as dependent on their own decisions andbehavior. Psychologists argue that these beliefs are central to understanding a person’smotivation and the way that he or she makes decisions and sets goals. Those with anexternal locus of control are more likely to avoid situations in which they feel unable to
11For those individuals who gave us their permission we are able to link the survey data with adminis-trative records based on the ‘Integrated Labour Market Biographies’ of the Public Employment Services,containing relevant register data from four sources: employment history, unemployment support recipience,participation in active labor market programs, and job seeker history.
12To generate a claim for unemployment benefits workers have to be employed for at least 12 months inthe last three years before entering unemployment.
9
cope, while those with an internal locus of control tend to set higher goals, persevere inchallenging situations, and be more likely to achieve successful outcomes (Strauser, Ketz,and Keim, 2002).
The ten separate items underlying the Rotter scale are summarized in Table 1. Foreach item respondents were asked to answer on a scale from ‘1: I do not agree at all’ to‘7: I fully agree’. As a first step in creating a measure of individuals’ locus of control,we used factor analysis to identify the number of common factors underlying our tenitems. Our factor analysis (see upper part of Figure 1) indicated that items 1, 6 and 9load onto one factor (interpretable as ‘internal’), while items 2, 3, 5, 7, 8, and 10 loadonto another factor (interpretable as ‘external’). Item 4 did not load on to either factorand was discarded. We conducted a parallel factor analysis for a representative sampleof respondents in the German Socio-Economic Panel (SOEP, see lower part of Figure 1).We found that these ten items load onto two factors in exactly the same way in the twosamples indicating that our distinction between internal and external control is not specificto unemployed individuals, but rather is representative of the German population moregenerally. Consequently, we use this factorization to create separate indexes of internaland external locus of control. At the same time, our theoretical model is consistent withthe early psychological literature in conceptualizing internal and external locus of controlas being opposite ends of the same spectrum (see Rotter, 1966). Moreover, Rotter (1975)argues that factor analysis in and of itself is not useful in identifying whether the truestructure of locus of control is uni- or multi-dimensional. Therefore, we also construct asingle index of locus of control which combines both the internal and external indexes.13
In the first step we standardize each item by subtracting the mean and dividing by thestandard deviation. In a second step we construct the corresponding average of the items.This gives us indexes with a mean 0 and a variance 1.
The distribution of each of these measures is given in Figure 2. In later analysis, we alsouse these indexes to distinguish people with an internal as opposed to an external locus ofcontrol. In each case, the threshold is set at approximately 50 percent of the distribution.
Insert Table 1 about here
Insert Figures 1, 2 about here
Table 2 compares the demographic, human capital, and personality characteristics ofindividuals with an internal as opposed to external locus of control based on the jointindex. Women, immigrants, married individuals, and older workers are significantly morelikely than others to believe that much of what happens in life is outside their control.Having higher educational attainment on the other hand is associated with a more internallocus of control. Interestingly, there also appears to be a relationship between personalitytraits and locus of control. Those with an internal locus of control report significantlyhigher levels of openness, conscientiousness, extraversion, and significantly lower levelsof neuroticism. These differences imply that it will be important to carefully control for
13Piatek and Pinger (2009) also extract a single factor when measuring locus of control in the SEOPdata.
10
individual characteristics when evaluating the effects of locus of control on job searchoutcomes.
Insert Tables 2 about here
One of the advantages of the IZA Evaluation Data Set is that we have detailed in-formation about individuals’ previous labor market experiences making it apparent thatthose with an internal locus of control have somewhat more favorable employment his-tories. Those with an internal locus of control, for example, are significantly less likelyto have entered unemployment from employment (or subsidized employment) and aresignificantly more likely to have entered from education or other pathways. Since turn-ing 18, those with an internal locus of control have spent on average 0.71 months peryear in unemployment, while those with an external locus of control have spend 0.85months per year being unemployed. Moreover, an internal locus of control is associatedwith significantly higher months in employment in the years before entering unemploy-ment, higher pre-unemployment wages and therefore also higher unemployment benefits.These relationships are consistent with previous evidence that having an internal locus ofcontrol is correlated with labor market success (Andrisani, 1977, 1981; Osborne Groves,2005; Semykina and Linz, 2007; Duncan and Dunifon, 1998). In terms of intergenerationaltransmission we see that having a father with A-level qualifications or an employed fatherat age 15 is associated with a more internal locus of control. Finally, individuals with aninternal locus of control are also significantly more likely to have access to a number ofcommunication modes including mobile phones, computers, the internet, and e-mail. This,along with their advantaged employment history, is expected to facilitate job search.
Importantly, there are no significant differences across the two groups in either themonth of entry into the sample or in the period between entry and first interview whichis consistent with random sample selection.
3.2 Locus of Control and Job Search Behavior
Table 3 provides information about the reservation wages and search strategies for individ-uals in our sample. The results indicate that people with an internal locus of control havehigher reservation wages and send out more job applications. In particular, those with aninternal locus of control report a reservation wage of e7.72/hour on average, while thosewith an external locus of control have a reservation wage that is on average e0.39 lower.Individuals with an internal locus of control use slightly more search channels on average,but this difference is not significant.14 Finally, individuals who believe that much of whathappens in life is under their own control search more intensively sending out nearly two(11 percent) additional applications on average than individuals who think that events areoutside their control. The corresponding distributions of the reservation wage and and thesearch intensity are reported in Figure A.1 in the Appendix.
Insert Table 3 about here14McGee (2010) argues that the number of search channels might be an inadequate measure of search
intensity since this does not capture the search intensity within each channel.
11
Interestingly, individuals with an internal locus of control are more optimistic abouttheir chances of finding a job in the next period despite having higher reservation wages.Fully, 56 percent of those with an internal locus of control report that it is very likelythat they will take up a job within the next six months, while only 42 percent of thosewith an external locus of control report the same. This degree of optimism is perhapsnot surprising given that those with an internal locus of control also have more favorablejob histories and are less likely to be in a disadvantaged labor market group (i.e. women,migrants, low educated).
4 Estimation Approach and Results
Our interest is in understanding whether individuals’ beliefs about the extent to whichthey control life’s outcomes affect the way they search for jobs. We are particularly inter-ested in understanding whether any effect of locus of control operates through individuals’perceptions of the return to their own search efforts or solely as a dimension of ability.Our strategy to discriminate between these two alternative explanations is twofold: First,we directly analyze the effect of locus of control on individuals’ beliefs about the proba-bility of receiving an acceptable job offer. This allows us to assess whether those with aninternal locus of control do in fact perceive a higher return to their job search investments.Second, we formally test the empirical predictions of the two competing models discussedin Sections 2.2 and 2.3 using both OLS and propensity score matching methods.
4.1 The Probability of Finding a Job
Coleman and Deleire (2003) conclude that locus of control affects individuals’ educationdecisions primarily by altering their expectations regarding the return to investments inhuman capital. If a similar process operates here, we should expect to see a relationshipbetween a person’s locus of control and the return that he or she expects from greatersearch effort. We test this by using probit regression to estimate the effect of searchintensity (as measured by the number of applications submitted) on the likelihood thatan individual believes the probability that he or she will receive an acceptable job offeris ‘very high’.15 Our model includes controls for the number of applications submitted,one of two different indicators for whether or not the individual has an internal locus ofcontrol, and the interaction between them.16 This interaction term allows the relationshipbetween search intensity and the perceived pay off of job search (i.e. the probability offinding a job) to differ between those with an internal locus of control and those without.We then estimate the model separately with and without controls for other personality
15Probit estimation on the probability that an individual believes getting a job is ‘likely’ or ‘very likely’and OLS estimation on all four response categories lead to very similar results.
16Specifically, we use two indicator variables to identify those with an internal locus of control using 1)the full index and 2) the internal index. Individuals are coded as having an internal locus of control onthese measures if they score higher than average on the corresponding standardized index. The full index isused in models 1 and 2, while models 3 and 4 control for internal and external locus of control separately.
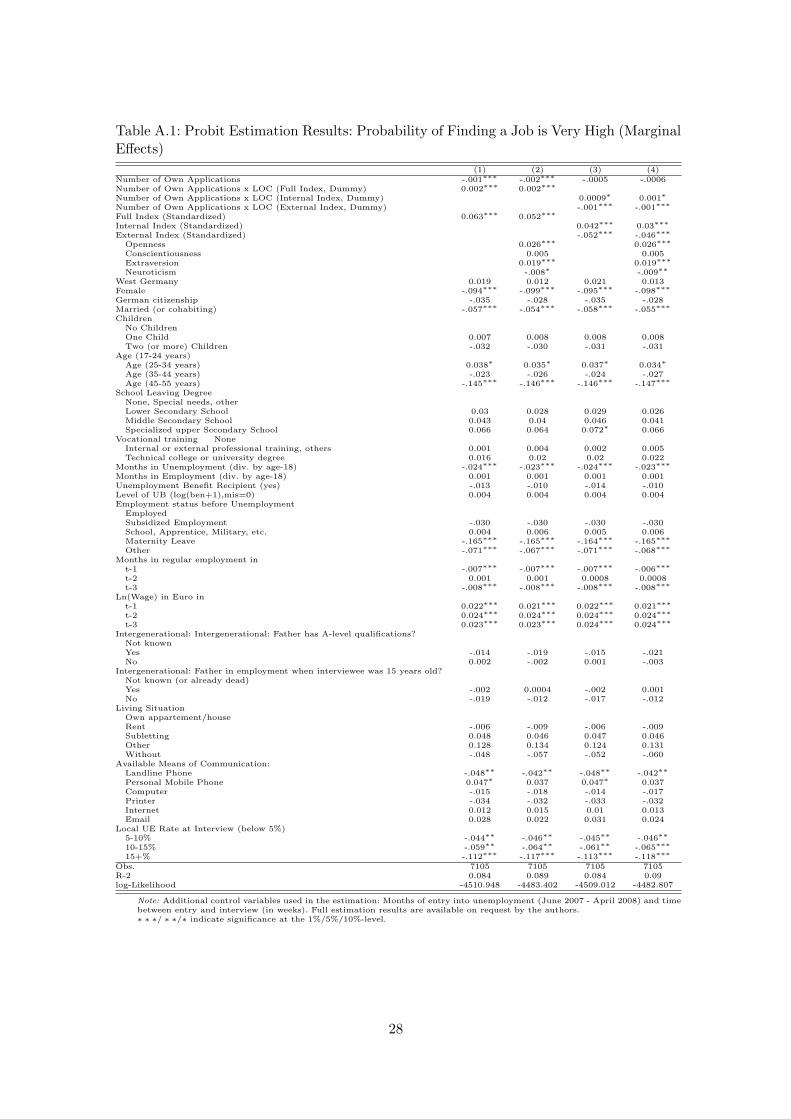
The main results in Table 418 show that the effect of an additional application on thebelief that one is ‘very likely’ to receive a job offer is significantly higher amongst thosewith an internal locus of control. In particular, the marginal effect of search intensity interms of one additional application is 0.2 (columns 1 and 2) percentage points higher forthose individuals with an internal locus of control. These results are based on our full indexwhich treats internal and external locus of control as opposite ends of the same spectrum.When we control for individuals’ internal and external locus of control separately (seecolumns 3 and 4), we find that the marginal effect of additional search on the expectedprobability of getting a job continues to be 0.01 percentage points higher for those with ahighly internal locus of control. Moreover, the marginal effect of additional search on thereemployment probability is 0.1 percentage points lower for those with a highly externallocus of control. Having an internal locus of control therefore appears to be associatedwith the belief that there is a higher return (in terms of reemployment probabilities) toinvestments in job search. This suggests that locus of control may influence economicdecisions by affecting the perceived returns to various sorts of investments. Individuals,however, simultaneously choose their search effort and their reservation wage both of whichaffect the expected probability of finding an acceptable job. Consequently, this analysis—while suggestive—does not allow us to test the different implications of the two modelsdirectly. We turn to this issue below.19
4.2 Reservation Wages and Search Intensity
4.2.1 OLS Estimation
We begin by using OLS regression to estimate the effect of locus of control on bothreservation wages and the number of applications that each individual has submitted.Using OLS allows us to include our internal and external indexes separately, but restrictsus to controlling for differences in other characteristics in a linear, parametric way. Weconsider two specifications: one without and one with controls for other personality traits.Table 5 summarizes the main OLS results, full estimation results are available in TablesA.2 and A.3 in the Appendix.
Insert Table 5 about here
We find that reservation wages increase as individuals’ locus of control becomes moreinternal everything else equal (see upper part of Table 5). Specifically, a one standard
17The model also includes controls for demographic characteristics, human capital endowments, andprevious employment histories.
18Full estimation results are available in Table A.1 in the Appendix.19It is also interesting that, in models 1 and 2, the overall number of applications submitted is negatively
related to the probability that an individual believes finding a job is very likely. This seems to point tosome reverse causality highlighting the correlational nature of the estimates. Full results are available uponrequest.
13
deviation increase in the extent to which an individual has an internal locus of control isassociated with a 1.3-1.9 percent increase in his or her reservation wage. The magnitudeof these effects are consistent with McGee (2010) who finds that a one standard deviationincrease in internality is associated with a 2.0 percent increase in young unemployed men’sfirst reported reservation wage and with a 1.3 percent increase in reservation wages overall. It is important to note that this effect is highly significant and is net of a number ofother variables (e.g. human capital characteristics, employment history, etc.) which serve tocontrol for disparity in individuals’ ability. Moreover, inclusion of the external and internalindexes separately makes it clear that this overall effect is mainly driven by the degree towhich one believes that he or she is unable to control future outcomes (i.e. has a relativelystrong external locus of control). Specifically, a standard deviation increase in the extentto which one has an external locus of control is associated with a 2.4 percent decrease inreservation wages. This effect becomes becomes somewhat smaller (2.0 percent) once wecontrol for an individual’s personality traits, but remains strongly significant. Contraryto expectations, the extent to which an individual has an internal locus of control is alsoassociated with a small, but significant, reduction in reservation wages once we control forpersonality traits and external locus of control (see column 4).
Individuals with a more internal locus of control also search for jobs more intensively(see lower part of Table 5). Each standard deviation increase in the degree to which anindividual sees life’s events as under his or her own control results in the submission of0.8 (approximately 5.3 percent) additional job applications. Unlike the case of reservationwages, this effect is driven by the degree to which one has an internal locus of control.When both the internal and external indexes are included as separate factors (ratherthan opposite ends of the same scale) we find that a one standard deviation increase inthe internal index is associated with the submission of an additional 1.5 (approximately9.4 percent) applications. In comparison, McGee (2010) estimates that a one standarddeviation increase in internality increases the hours of job search by more than 19 percent,but has no significant effect on the number of search methods utilized. This diversity ofresults across alternative measures of search intensity indicates that individuals’ locus ofcontrol may affect not only how intensively they search for new jobs, but also the waythey go about finding them. Finally, as before, the magnitude of our locus of control effectfalls once we control for personality traits indicating a correlation between an individual’slocus of control and dimensions of his or her personality. Although the full index remainspositive, it is no longer significant. The internal index, however, continues to have a large,positive effect on the number of job applications submitted.
4.2.2 Propensity Score Matching
In order to improve the efficiency and precision of our estimates we also use propensityscore matching (PSM) to assess the impact of the locus of control on job search behavior.The primary motivation for applying PSM in this context is to make internal and externalindividuals as comparable as possible in all other characteristics so that we can more
14
directly compare differences in their search behavior.20
To this end, we use the three locus of control indexes defined above to create binaryindicator variables to categorize individuals into two groups based on their locus of control.Specifically, individuals are coded as having a highly internal locus of control (internal =1) if they have a higher than average score on the full index and are coded as not having aninternal locus of control (internal = 0) otherwise. We then use our internal index to createa second indicator of internality to separate individuals who score above average versusbelow average on this scale. Finally, we use our external index to distinguish betweenindividuals who have a higher than average degree of externality (external = 1) fromthose who do not (external = 0). This leaves us with two groups (‘high’ vs ‘low’) foreach index. We then use these three indicator variables to estimate three separate logitmodels of the probability of being classified as either ‘internal’ or ‘external’ (see TableA.4 in Appendix A). As before we consider two specifications; one with (columns 4-6in Table A.4) and one without (columns 1-3) other personality traits. In order to focuson the effect of locus of control we need to include as many relevant variables in ourmodel as possible. In addition to socio-demographic information, we also include humancapital, personality characteristics and intergenerational variables (analogous to our OLSestimation in Tables A.2 and A.3). Based on these estimations we predict the propensityscores (e.g. the probability of having an internal locus of control) and use these scores in thesubsequent matching process. Figure A.2 shows the distribution of the propensity scoresin the different groups. For example, the first row shows the propensity score distributionbased on the full index. Individuals who are more internal are depicted in the upper halfof each graph, individuals who are more external are depicted in the lower half. Lookingat the specification without other personality traits on the left hand side shows thatthe distribution in both groups is quite similar. However, if we include other personalitytraits the distribution becomes more unequal (see right hand side). This highlights theimportance of respecting the common support region, i.e., comparing only ‘comparable’individuals.
Insert Table 6 about here
Propensity score matching results are presented in Table 6.21 Concentrating first onthe internal-external distinction based on the full index, we find that people who are moreinternal have much higher reservation wages. If we do not control for the other personalitytraits the marginal effect of being internal is 3.2 percent; controlling for personality traitsreduces the effect slightly to 2.7 percent. These effects are both strongly significant andeconomically important. Moreover, the matching statistics show that the matching proce-dure was very successful in balancing the distribution of covariates in both groups. To bemore specific, the mean and median standardized differences (biasaft and mdbaft) in thecovariates after matching are reduced to below 1.5 (and even 1.0 in most of the cases).
20See Caliendo and Kopeinig (2008) or Imbens and Wooldridge (2009) for more details on the method.21Results presented here a based on a kernel matching algorithm with an epanechnikov kernel function,
a bandwidth of 0.06 and common support; standard errors are based on 100 bootstrap replications. Resultsare not sensitive to the choice of the matching algorithm. Sensitivity analysis are available on request fromthe authors.
15
Consideration of our internal and external locus of control indexes makes it clear thatour results are driven by the effect of an external locus of control in reducing reservationwages rather than an internal locus of control in increasing them. Consistent with theOLS results, we find a strong negative impact of being external (ranging from 4.4 to 2.7percent) on reservation wages, whereas there is no significant difference in the reservationwages of those who do and do not score higher than average on the internal index. Thissuggests that previous studies which use a one-dimensional locus of control measure tolink self-efficacy to human capital investments generally (Coleman and Deleire, 2003; Cebi,2007) and job search in particular (McGee, 2010) may be somewhat misleading.
Individuals with a more internal locus of control also submit more applications ev-erything else equal. In this case, the effect stems from a positive effect of an internallocus of control on the submission of applications rather than from a negative effect of anexternal locus of control. When we do not control for personality, people who are moreinternal (based on the full index) submit an additional 1.1 applications. Once we accountfor differences in individuals’ personality traits the effects remains positive but becomesinsignificant. Separating our joint index into its two specific components indicates that—unlike the case for reservation wages—it is the extent to which one has an internal locusof control that is most closely related to search intensity. People who are more internal(based on the internal index) submit between 2.4 and 3.0 more applications.
Overall, the propensity score matching results confirm our OLS results and internallocus of control does not have a significant negative effect on reservation wages any longer.This is reassuring, since we allow here for non-linearities in the outcome equation and moreimportantly assign different weights to each individual. Whereas OLS assigns all individ-uals the same weight in the estimation, the matching procedure allows a finer comparisonbetween individuals in different categories by adjusting for differences in the distributionof covariates in a more efficient way (see, e.g., Abadie, Diamond, and Hainmueller, 2007).
5 Conclusions
Designing sensible public policy to assist unemployed individuals requires that we knowmore about their own job search decisions. In particular, why do some unemployed in-dividuals invest more than others in finding new employment? Does believing that life’sevents are outside one’s control lead to a relative lack of search effort? If so, can we designpolicies to promote self-efficacy among the unemployed?
This paper analyzes the link between individuals’ locus of control and their decisions toinvest in job search. We advance standard job search theory by developing a search modelwhich incorporates individuals’ subjective beliefs about the effect of their job search efforton the job offer arrival rate. This subjective belief depends on individuals’ locus of control,i.e., the extent to which one believes that his or her actions affect future outcomes. Weempirically estimate the impact of locus of control on job search behavior using novel linkedsurvey and administrative data for a large sample of newly-unemployed Germans. We findthat having an internal locus of control is associated with the belief that investments injob search have a higher payoff in terms of reemployment probabilities. Moreover, those
16
who believe that they have control over what happens in their lives set higher reservationwages and search more intensively than those who feel little control over their lives. Takentogether, these results are consistent with a model of job search in which locus of controlaffects individuals’ subjective beliefs about the offer arrival rate, but is inconsistent witha job search model in which locus of control is a dimension of ability.
These results advance our understanding of the role that individuals’ self-efficacy playsin human capital investments generally, and job search in particular. At the same time,there are a number of challenges yet to be resolved. In particular, there is considerabledivergence of results across uni- versus multi-dimensional notions of locus of control andalternative measures of search intensity (see McGee, 2010). It is important, therefore, tocontinue to refine our economic models of investment behavior to take these complexitiesinto account. Moreover, there is a need for additional empirical research which estimatesthese key relationships for different labor market groups across a number of countries sothat we can begin to understand how the institutional arrangements underpinning theunemployment benefits system might interact with individuals’ sense of self-efficacy indriving job search. Finally, it would be useful to incorporate locus of control into dynamicmodels of the job search process. This would allow us to begin to understand the way thatindividuals’ self-efficacy evolves over time in response to labor market events.
17
References
Abadie, A., A. Diamond, and J. Hainmueller (2007): “Synthetic Control Methodsfor Comparative Case Studies: Estimating the Effect of California’s Tobacco ControlProgram,” Working Paper, Harvard University.
Andrisani, P. J. (1977): “Inter-External Attitudes, Personal Initiative, and the LaborMarket Experience of Black and White Men,” Journal of Human Resources, 12, 308–328.
(1981): “Internal-External Attitudes, Personal Initiative, And The Labor MarketExperience: A Reply To Duncan and Morgan,” Journal of Human Resources, 16, 658–666.
Anger, S., and G. Heineck (2009): “The returns to cognitive abilities and personalitytraits in Germany,” forthcoming in: Labour Economics.
Cahuc, P., and A. Zylberberg (2004): Labor Economics. MIT Press, Cambridge, Lon-don.
Caliendo, M., A. Falk, L. Kaiser, H. Schneider, A. Uhlendorff, G. Van denBerg, and K.F. Zimmermann (2009): “The IZA Evaluation Dataset,” Working Paper,IZA, Bonn.
Caliendo, M., and S. Kopeinig (2008): “Some Practical Guidance for the Implemen-tation of Propensity Score Matching,” Journal of Economic Surveys, 22(1), 31–72.
Cebi, M. (2007): “Locus of Control and Human Capital Investment Revisited,” Journalof Human Resources, 42, 919–932.
Coleman, M., and T. Deleire (2003): “An Economic Model of Locus of Control andthe Human Capital Investment Decision,” Journal of Human Resources, 38, 701–721.
DellaVigna, S., and M. D. Paserman (2005): “Job Search and Impatience,” Journalof Labor Economics, 23(1), 527–588.
Duncan, G. J., and R. Dunifon (1998): “”Soft-Skills” and Long-Run Labor MarketSuccess,” Research in Labor Economics, 17, 123–149.
Duncan, G. J., and J. N. Morgan (1981): “Sense of Efficacy and Subsequent Changein Earnings - A Replication,” Journal of Human Resources, 16, 649–657.
Eckstein, Z., and G. J. van den Berg (2007): “Empirical labor search: A survey,”Journal of Econometrics, 136, 531–564.
Fougere, D., J. Pradel, and M. Roger (2009): “Does the public employment serviceaffect search effort and outcomes?,” European Economic Review, 53, 846–869.
Gallo, W. T., J. Endrass, E. H. Bradley, D. Hell, and S. V. Kasl (2003):“The Influence of Internal Control on the Employment Status of German Workers,”Schmollers Jahrbuch, 123, 71–82.
Hansemark, O. C. (2003): “Need for Achievement, Locus of Control and the Predictionof Business Start-Ups: A Longitudinal Study,” Journal of Economic Psychology, 24,301–319.
Heckman, J. J., J. Stixrud, and S. Urzua (2006): “The Effects of Cognitive andNoncognitive Abilities on Labor Market Outcomes and Social Behavior,” Journal ofLabor Economics, 24, 411–482.
18
Imbens, G., and J. M. Wooldridge (2009): “Recent Developments in the Econometricsof Program Evaluation,” Journal of Economic Literature, 47(1), 5–86.
McGee, A. (2010): “How the Perception of Control Influences Unemployed Job Search,”Working Paper.
Mortensen, D. T., and C. A. Pissarides (1999): “New develpoments in models ofsearch in the labor market,” in Handbook of Labor Economics, Vol. 3b, ed. by O. Ashen-felter, and D. Card, pp. 2567–2627. Elsevier, Amsterdam.
Osborne Groves, M. (2005): “How important is your personality? Labor market returnsto personality for women in the US and UK,” Journal of Economic Psychology, 26, 827–841.
Piatek, R., and P. Pinger (2009): “Maintaining (locus of) Control? Assessing thestability and impact of noncognitive skills over the life-cycle,” Working Paper.
Rotter, J. (1966): “Generalized Expectancies for Internal Versus External Control ofReinforcement,” Psychological Monographs, 80.
(1975): “Some problems and Misconceptions Related to the Construct of In-ternal Versus External Control of Reinforcement,” Journal of Consulting and ClinicalPsychology, 43(1), 56–67.
Semykina, A., and S. J. Linz (2007): “Gender Differences in Personality and Earnings:Evidence from Russia,” Journal of Economic Psychology, 28, 387–410.
Strauser, D., K. Ketz, and J. Keim (2002): “The relationship between self-efficacy,locus of control and work personality,” Journal of Rehabilitation, 68(1), 20–26.
Uhlendorff, A. (2004): “Der Einfluss von Personlichkeitseigenschaften und sozialenRessourcen auf die Arbeitslosigkeitsdauer,” Kolner Zeitschrift fur Soziologie undSozialpsychologie, 56, 279–303.
van den Berg, G. J., and B. van der Klaauw (2006): “Counseling and Monitoringof Unemployed Workers: Theory and Evidence form a controlled Social Experiment,”International Economic Review, 47(3), 895–936.
19
Tables
Table 1: Components of Locus of Control
Variable Mean SD Median
N 7896
Components of Locus of Control (1: I do not agree at all, 7: I agree fully)(a)
Q1. How my life takes course is entirely dependent on me 6.08 (1.27) [7.00]Q2. Compared to others, I have not achieved what I deserved 3.63 (1.94) [4.00]Q3. What one achieves is, in the first instance, a question of destiny and luck 3.45 (1.93) [3.00]Q4. When one is socially or politically committed, one can influence social
circumstances(b)3.85 (1.92) [4.00]
Q5. I often experience that others make decisions about my life 2.82 (1.86) [2.00]Q6. Success is gained through hard work 6.26 (1.15) [7.00]Q7. When I encounter difficulties in life, I often doubt my abilities 3.37 (1.86) [3.00]Q8. The possibilities I have in life are dependent on social circumstances 4.49 (1.66) [5.00]Q9. More important than all efforts is to exercise one’s own abilities 5.24 (1.40) [5.00]Q10. I have little control over things which happen in my life 2.67 (1.78) [2.00]
Source: IZA Evaluation Data Set, own calculations.(a) Individuals were asked the following question: “The following statements characterize different attitudes towards life
and the future. To what extent do you personally agree with these statements? Please answer on the basis of a scaleof 1 to 7.”
(b) This item is observed for only 7,858 individuals.All numbers are shares unless stated otherwise; p-value refers to a two-sided t-test of mean equality between bothgroups.
20
Table 2: Selected Descriptive Statistics by Locus of Control
Variable Full Index(a) t-testExternal Internal p-value
One Child 0.19 0.19 0.82Two (or more) Children 0.15 0.14 0.23
School Leaving DegreeNone, Special needs, other 0.03 0.02 0.02Lower Secondary School 0.32 0.26 0.00Middle Secondary School 0.42 0.44 0.05Specialized upper Secondary School 0.23 0.28 0.00
Employment History
Months in Unemployment (div. by age-18) 0.85 0.71 0.00Months in Employment (div. by age-18) 8.20 8.16 0.80Unemployment Benefit Recipient (yes) 0.79 0.80 0.34Level of Unemployment Benefit in e/month (missings=0) 503.15 548.86 0.00Employment status before Unemployment
Intergenerational: Father has A-Level qualifications?Not known 0.06 0.06 0.54Yes 0.14 0.16 0.03No 0.80 0.79 0.12
Intergenerational: Father in employment when interviewee was 15 years old?Not known (or already dead) 0.11 0.10 0.24Yes 0.84 0.85 0.07No 0.06 0.05 0.19
Other Variables
Available Means of communication:Landline Phone 0.86 0.85 0.86Mobile 0.91 0.95 0.00Computer 0.83 0.87 0.00Printer 0.75 0.79 0.00Internet 0.73 0.78 0.00Email 0.70 0.77 0.00
Source: IZA Evaluation Data Set, own calculations.Note: All numbers are shares unless stated otherwise; p-value refers to a two-sided t-test of mean equality betweenboth groups. Descriptive statistics for all variables are available on request from the authors.
(a) The ‘Full Index’ aggregates all standardized answers in the following way: “Q1 + Q6 + Q9 - (Q2 + Q3 + Q5 + Q7+ Q8 + Q10)” (see also Figure 1). Individuals are coded as having an internal (external) locus of control if they scorehigher (lower) than average on the standardized index.
(b) The fifth BIG-5 item “agreeableness” is not observed for all of the individuals.
Table 3: Job Search Behavior by Locus of Control
Variable Full Index t-testExternal Internal p-value
N 3940 3956Hourly Reservation Wage (in Euro) 7.33 7.72 0.00Log(Reservation Wage) 1.94 1.99 0.00Number of Search Channels (Mean) 5.10 5.11 0.72Number of Own Applications (Mean) 14.96 16.68 0.00
Source: IZA Evaluation Data Set, own calculations.Note: All numbers are shares unless stated otherwise; p-value refers to a two-sided t-test of meanequality between both groups.
(a) This information is observed for 3,539 individuals with external locus of control and 3,566 indi-viduals with internal locus of control.
Table 4: Probit Estimation Results: Probability of Finding a Job is Very High (Marginal Effects)
(1) (2) (3) (4)
Number of Own Applications -.001∗∗∗ -.002∗∗∗ -.0005 -.0006Number of Own Applications x LOC (Full Index, Dummy) 0.002∗∗∗ 0.002∗∗∗
Number of Own Applications x LOC (Internal Index, Dummy) 0.0009∗ 0.001∗
Number of Own Applications x LOC (External Index, Dummy) -.001∗∗∗ -.001∗∗∗
Full Index (Standardized) 0.063∗∗∗ 0.052∗∗∗
Internal Index (Standardized) 0.042∗∗∗ 0.03∗∗∗
External Index (Standardized) -.052∗∗∗ -.046∗∗∗
Including Control Variables(a) Yes Yes Yes Yes
Including Other Personality Traits(b) No Yes No Yes
Note: ∗ ∗ ∗/ ∗ ∗/∗ indicate significance at the 1%/5%/10%-level. Indices are standardized in the following way: Indexsti =
(Indexi − Mean(Index))/SD(Index).(a) Full estimation results are available in Table A.1 in the Appendix.(b) Openness, Conscientiousness, Extraversion, Neuroticism.
22
Table 5: OLS Estimation Results: Log(Reservation Wage and Search Intensity (Num-ber of Own Applications)
Including Other Personality Traits(b) No Yes No Yes
Note: ∗ ∗ ∗/ ∗ ∗/∗ indicate significance at the 1%/5%/10%-level. Indices are standardized in the followingway: Indexst
i = (Indexi − Mean(Index))/SD(Index).(a) Full estimation results are available in Tables A.2 and A.3 in the Appendix.(b) Openness, Conscientiousness, Extraversion, Neuroticism.
Table 6: Propensity Score Matching Results
Index PT1 Effect s.e. t TN2 NT2 Off2 biasaft2 mdbaft2
Note: Results presented here a based on a kernel matching algorithm with an epanechnikov kernelfunction, a bandwidth of 0.06 and imposition of common support; standard errors are based on 100bootstrap replications.
(a,b,c) Individuals are coded as having an internal locus of control if they score higher than averageon the standardized ‘Full Index’ and ‘Internal Index’. Individuals are coded as having an externallocus of control if they score higher than average on the standardized ‘External Index’. We comparethe ‘high’ and the ‘low’ groups within each index.
(1) The first specification does not include other personality traits as explanatory variables in thepropensity score estimation; the second specification does (see Table A.4 for details and Figure A.2for score distributions).
(2) TN and NT indicate the number of individuals in the ‘high’ and ‘low’ group; Off counts the numberof individuals outside the common support region. biasaft and mdbaft summarize the mean andmedian standardized bias after matching.
23
Figures
Figure 1: Factor Loadings of the LOC Variables
Our Sample
Representative Population Sample (SOEP)
Note: Factor 1 is interpreted as ‘External Locus of Control’;Factor 2 as ‘Internal Locus of Control’.
(a) The ‘Internal Index’ aggregates the standardized answers inthe following way: “Q1 + Q6 + Q9”.
(b) The ‘External Index’ aggregates the standardized answers inthe following way: “Q2 + Q3 + Q5 + Q7 + Q8 + Q10”.
(c) Finally, the ‘Full Index’ aggregates all standardized answersin the following way: “Q1 + Q6 + Q9 - (Q2 + Q3 + Q5 + Q7+ Q8 + Q10)”.The variable Q.4:“Social/Political engagement can changethings” loads on a third factor and is not used.
24
Figure 2: Distribution of Alternate Locus of Control Indices
Note: See Figure 1 for a definition of the different indices. In-dices are standardized in the following way: Indexst
i = (Indexi −Mean(Index))/SD(Index).
25
A Supplementary Tables and Figures
Figure A.1: Distribution of Reservation Wages and Numberof Applications by Locus of Control
Reservation Wage (Euro per Hour)
Search Intensity (Number of Applications)
Source: IZA Evaluation Dataset, own calculations.People with internal (external) locus of control based on the ‘Full Index’are depicted on the right (left) hand side.
Without Other Personality Traits With Other Personality TraitsFull Index (High vs. Low)
Internal Index (High vs. Low)
External Index (High vs. Low)
Note: The specification on the right hand side includes other personality traits (openness, conscien-tiousness, extraversion, neuroticism), in the propensity score estimation whereas the specificationon the left hand side does not. See Table A.4 for detailed estimation results.
27
Table A.1: Probit Estimation Results: Probability of Finding a Job is Very High (MarginalEffects)
(1) (2) (3) (4)Number of Own Applications -.001∗∗∗ -.002∗∗∗ -.0005 -.0006Number of Own Applications x LOC (Full Index, Dummy) 0.002∗∗∗ 0.002∗∗∗
Number of Own Applications x LOC (Internal Index, Dummy) 0.0009∗ 0.001∗
Number of Own Applications x LOC (External Index, Dummy) -.001∗∗∗ -.001∗∗∗
School Leaving DegreeNone, Special needs, otherLower Secondary School 0.03 0.028 0.029 0.026Middle Secondary School 0.043 0.04 0.046 0.041Specialized upper Secondary School 0.066 0.064 0.072∗ 0.066
Vocational training NoneInternal or external professional training, others 0.001 0.004 0.002 0.005Technical college or university degree 0.016 0.02 0.02 0.022
Months in Unemployment (div. by age-18) -.024∗∗∗ -.023∗∗∗ -.024∗∗∗ -.023∗∗∗
Months in Employment (div. by age-18) 0.001 0.001 0.001 0.001Unemployment Benefit Recipient (yes) -.013 -.010 -.014 -.010Level of UB (log(ben+1),mis=0) 0.004 0.004 0.004 0.004Employment status before Unemployment
Ln(Wage) in Euro int-1 0.022∗∗∗ 0.021∗∗∗ 0.022∗∗∗ 0.021∗∗∗
t-2 0.024∗∗∗ 0.024∗∗∗ 0.024∗∗∗ 0.024∗∗∗
t-3 0.023∗∗∗ 0.023∗∗∗ 0.024∗∗∗ 0.024∗∗∗
Intergenerational: Intergenerational: Father has A-level qualifications?Not knownYes -.014 -.019 -.015 -.021No 0.002 -.002 0.001 -.003
Intergenerational: Father in employment when interviewee was 15 years old?Not known (or already dead)Yes -.002 0.0004 -.002 0.001No -.019 -.012 -.017 -.012
Note: Additional control variables used in the estimation: Months of entry into unemployment (June 2007 - April 2008) and timebetween entry and interview (in weeks). Full estimation results are available on request by the authors.∗ ∗ ∗/ ∗ ∗/∗ indicate significance at the 1%/5%/10%-level.
Note: Additional control variables used: Month of entry into unemployment (June 2007-May2008) and time between unemploy-ment entry and interview (7-14 weeks). Full estimation results are available on request by the authors.∗ ∗ ∗/ ∗ ∗/∗ indicate significance at the 1%/5%/10%-level.
(a) Indices are standardized in the following way: Indexsti = (Indexi − Mean(Index))/SD(Index).
29
Table A.3: OLS Estimation Results: Search Intensity (Number of Own Applications)(1) (2) (3) (4)
Full Index (Standardized) 0.84∗∗∗ 0.304Internal Index (Standardized) 1.482∗∗∗ 1.031∗∗∗
External Index (Standardized) -.160 0.241Personality Traits
Female -.415 -.727 -.612 -.735German citizenship -.891 -.704 -1.001 -.814Married (or cohabiting) -.898 -.842 -.932 -.857Children No Children (Reference cat.)
One Child -.901 -.935 -.890 -.922Two (or more) Children -1.577∗ -1.576∗ -1.460 -1.502∗
Age (17-24 years)Age (25-34 years) -3.011∗∗∗ -3.138∗∗∗ -3.068∗∗∗ -3.159∗∗∗
Age (35-44 years) -3.971∗∗∗ -4.143∗∗∗ -4.016∗∗∗ -4.180∗∗∗
Age (45-55 years) -4.162∗∗∗ -4.304∗∗∗ -4.286∗∗∗ -4.400∗∗∗
School Leaving Degree:None, Special needs, other (ref.)Lower Secondary School 0.029 -.009 0.144 0.101Middle Secondary School -.397 -.563 -.009 -.242Specialized upper Secondary School -1.202 -1.252 -.433 -.655
Vocational trainingNone (ref.)Internal or external professional training, others -.030 -.037 0.074 0.067Technical college or university degree 1.590 1.610 1.915 1.860
Months in Unemployment (div. by age-18) 0.29 0.328 0.277 0.316Months in Employment (div. by age-18) 0.051 0.042 0.049 0.042Unemployment Benefit Recipient (yes) -1.491 -1.422 -1.531 -1.472Level of UB (log(ben+1),mis=0) 0.258 0.249 0.265 0.258Seeking Self-Employment 0.215 0.11 0.107 0.043Employment status before UE (Employed)
Ln(Wage) in Euro in t-1 0.502∗ 0.461 0.504∗ 0.465t-2 0.272 0.272 0.269 0.27t-3 -.170 -.173 -.167 -.170
Intergenerational: Father has A-level qualifications?Not knownYes 1.169 1.200 1.256 1.252No 0.307 0.298 0.314 0.296
Intergenerational: Father in employment when interviewee was 15 years old?Not known (or already dead)Yes 0.43 0.473 0.465 0.495No 1.221 1.434 1.348 1.500
Living SituationOwn appartement/houseRent 1.094∗ 1.021∗ 1.088∗ 1.020∗
Note: Additional control variables used: Month of entry into unemployment (June 2007-May2008) and time between unemploy-ment entry and interview (7-14 weeks). Full estimation results are available on request by the authors.∗ ∗ ∗/ ∗ ∗/∗ indicate significance at the 1%/5%/10%-level.
(a) Indices are standardized in the following way: Indexsti = (Indexi − Mean(Index))/SD(Index).
30
Table A.4: Propensity Score Estimation ResultsWithout Other Personality Traits With Other Personality Traits
Index: Full Internal External Full Internal External(1) (2) (3) (4) (5) (6)
West Germany 0.053 -.325∗∗∗ -.216∗∗ -.010 -.378∗∗∗ -.180∗∗
Note: The propensity score is estimated using a logit model. The groups are defined according to having a high (treated) orlow (control) index value. See Figure 2 for the relevant thresholds. Columns 4-6 include other personality traits as explanatoryvariables; columns 1-3 do not.Additional control variables used in the estimation: Months of entry into unemployment (June 2007 - April 2008) and timebetween entry and interview (in weeks). Full estimation results are available on request by the authors.∗ ∗ ∗/ ∗ ∗/∗ indicate significance at the 1%/5%/10%-level.
31
B Notes on Theoretical Framework
Proposition 1. Individuals with a more internal locus of control have higher reservationwages and search more intensively than those with a more external locus of control, i.e.,∂s∗
∂loc > 0 and ∂φ∂loc > 0.
Proof. Equation (5) gives the relationship between the reservation wage φ and the optimallevel of search effort s∗. Differentiating equation (5) with respect to loc gives:
∂φ
∂loc=
∂
∂loc
[λ(s∗)λ′(s∗)
c′(s)]− c′(s∗)
∂s∗
∂loc
=λ(s∗)λ′(s∗)
c′′(s∗)∂s
∂loc+
λ′(s∗)2 ∂s∗
∂loc − λ(s∗)λ′′(s) ∂s∗
∂loc
λ′(s∗)2c′(s∗)− c′(s∗)
∂s∗
∂loc
=[
λ(s∗)λ′(s∗)
c′′(s∗)− λ(s∗)λ′′(s∗)c′(s∗)λ′(s∗)2
]∂s∗
∂loc(10)
The job arrival rate depends positively on an individual’s search effort, but at a decreasingrate, i.e., λ′ > 0 and λ′′ < 0, while search costs are increasing in search effort, i.e., c′ > 0and c′′ > 0. Thus, the expression in square brackets is positive which implies that ∂φ/∂locand ∂s∗/∂loc have the same sign.Equation (4) shows that individuals choose their optimal search effort by equating themarginal cost of job search with the marginal benefits of additional search. Differentiating(4) with respect to loc gives:
c′′(s∗)∂s∗
∂loc=
λ′(s∗)f ′(loc)r + q
∫ ∞
φ(w − φ)dF (w) +
λ′′(s∗)f(loc)r + q
∂s∗
∂loc
∫ ∞
φ(w − φ)dF (w)
+λ′(s∗)f(loc)
r + q
∂
∂loc
∫ ∞
φ(w − φ)dF (w)
=λ′(s∗)f ′(loc)
r + q
∫ ∞
φ(w − φ)dF (w) +
λ′′(s∗)f(loc)r + q
∂s∗
∂loc
∫ ∞
φ(w − φ)dF (w)
−λ′(s∗)f(loc)r + q
[1− F (φ)]∂φ
∂loc(11)
Rearranging the above expression yields:
∂s∗
∂loc
[c′′(s∗)− λ′′(s∗)f(loc)
r + q
∫ ∞
φ(w − φ)dF (w)
]= −λ′(s∗)f(loc)
r + q[1− F (φ)]
∂φ
∂loc
+λ′(s∗)f ′(loc)
r + q
∫ ∞
φ(w − φ)dF (w) (12)
The right-hand-side term in square brackets is positive. This implies that in order forequation (12) to hold ∂s∗
∂loc and ∂φ∂loc must both be positive. If they were both negative,
the left-hand side of equation (12) would be negative while the right-hand side would bepositive.
32
B.1 Alternative Model
We now consider an alternative model, in which a function of the locus of control con-tributes to the job arrival rate additively: λa(s, loc) = λ(s)+f(loc). As before, we continueto assume that f ′(loc) > 0, c′ > 0, c′′ > 0, λ′ > 0 and λ′′ < 0.
In this case, the utilities of accepting a job offer at wage w, Ve(w) and of continuingjob search, Vu, are given by:
Ve(w) =1
1 + rdt[wdt + (1− qdt)Ve(w) + qdtVu] (13)
Vu =1
1 + rdt[(b− c(s))dt + (λ(s) + f(loc))dt(
∫ φ
0VudF (w) +
∫ ∞
φVe(w)dF (w))
+(1− (λ(s) + f(loc))dt)Vu] (14)
The reservation wage is given by:
φ = b− c(s) +λ(s) + f(loc)
r + q
∫ ∞
φ(w − φ)dF (w)
= b− c(s) +λ(s)r + q
∫ ∞
φ(w − φ)dF (w) +
f(loc)r + q
∫ ∞
φ(w − φ)dF (w) (15)
Unemployed individuals choose their search effort and reservation wage so as to max-imize Vu over an infinite horizon. The reservation wage defines the search stopping ruleand thus satisfies the condition that Vu = Ve(w). Substituting this constraint into theoptimization problem, we can show that the optimal search behavior is determined by themaximization of Vu = φ/r with resoect to s. This implies that we can solve for the optimalsearch effort s∗ by differentiating the previous equation with respect to (s) and solving forthe s∗ such that ∂φ/∂s = 0. Specifically, we find that
c′(s) =λ′(s)r + q
∫ ∞
φ(w − φ)dF (w) (16)
Substituting this expression into equation 15 we get:
φ = b− c(s) +λ(s)λ′(s)
c′(s) +f(loc)r + q
∫ ∞
φ(w − φ)dF (w) (17)
Proposition 2. In this alternative model, individuals with a more internal locus ofcontrol have higher reservation wages, but search less intensively than those with a moreexternal locus of control, i.e., ∂s∗
∂loc < 0 and ∂φ∂loc > 0.
Proof. Differentiating 16 with respect to loc gives:
c′′(s)∂s
∂loc=
λ′′(s)r + q
∂s
∂loc
∫ ∞
φ(w − φ)dF (w) +
λ′(s)r + q
∂
∂loc
∫ ∞
φ(w − φ)dF (w)
=λ′′(s)r + q
∂s
∂loc
∫ ∞
φ(w − φ)dF (w)− λ′(s)
r + q[1− F (φ)]
∂φ
∂loc(18)
Rearranging the above expression yields:
33
∂s
∂loc
[c′′(s)− λ′′(s)
r + q
∫ ∞
φ(w − φ)dF (w)
]= [−λ′(s)
r + q[1− F (φ)]]
∂φ
∂loc(19)
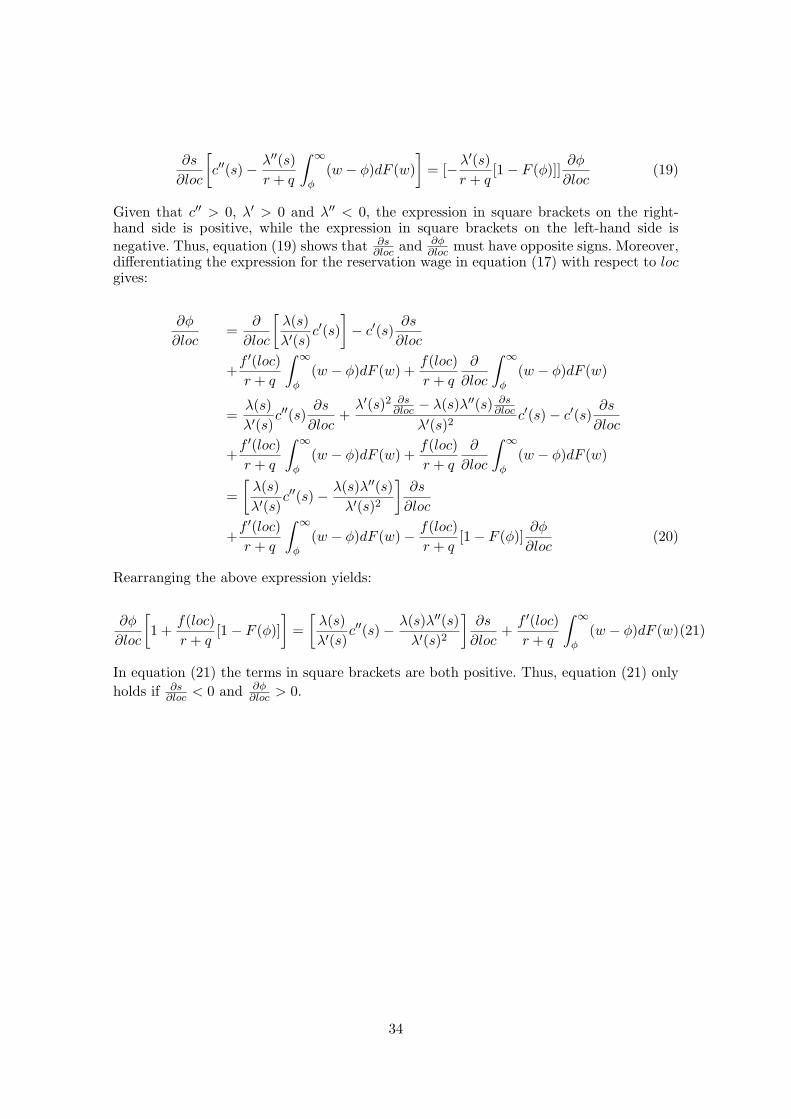
Given that c′′ > 0, λ′ > 0 and λ′′ < 0, the expression in square brackets on the right-hand side is positive, while the expression in square brackets on the left-hand side isnegative. Thus, equation (19) shows that ∂s
∂loc and ∂φ∂loc must have opposite signs. Moreover,
differentiating the expression for the reservation wage in equation (17) with respect to locgives:
∂φ
∂loc=
∂
∂loc
[λ(s)λ′(s)
c′(s)]− c′(s)
∂s
∂loc
+f ′(loc)r + q
∫ ∞
φ(w − φ)dF (w) +
f(loc)r + q
∂
∂loc
∫ ∞
φ(w − φ)dF (w)
=λ(s)λ′(s)
c′′(s)∂s
∂loc+
λ′(s)2 ∂s∂loc − λ(s)λ′′(s) ∂s
∂loc
λ′(s)2c′(s)− c′(s)
∂s
∂loc
+f ′(loc)r + q
∫ ∞
φ(w − φ)dF (w) +
f(loc)r + q
∂
∂loc
∫ ∞
φ(w − φ)dF (w)
=[
λ(s)λ′(s)
c′′(s)− λ(s)λ′′(s)λ′(s)2
]∂s
∂loc
+f ′(loc)r + q
∫ ∞
φ(w − φ)dF (w)− f(loc)
r + q[1− F (φ)]
∂φ
∂loc(20)
Rearranging the above expression yields:
∂φ
∂loc
[1 +
f(loc)r + q
[1− F (φ)]]
=[
λ(s)λ′(s)
c′′(s)− λ(s)λ′′(s)λ′(s)2
]∂s
∂loc+
f ′(loc)r + q
∫ ∞
φ(w − φ)dF (w)(21)
In equation (21) the terms in square brackets are both positive. Thus, equation (21) onlyholds if ∂s