Send Orders for Reprints to [email protected]350 The Open Petroleum Engineering Journal, 2015, 8, (Suppl 1: M13) 350-353 1874-8341/15 2015 Bentham Open Open Access Logging Evaluation Method for Pore Pressure of Shale Gas ReservoirsTaking Fuling Area, Sichuan Basin as an Example Hao Shibo and Jin Wujun * Petroleum Exploration and Development Research Institute, SINOPEC, Beijing 100083, China Abstract: Unconventional oil and gas resources, especially shale gas resources have great potential for exploration and development in China. In Shale gas exploration and development process, reservoir pore pressure is a very important pa- rameter, and the pore pressure prediction can improve the appraisal accuracy of project dessert. This paper analyzes sev- eral formation pore pressure calculation methods based on logging data, and optimized the “Equivalent depth method”. The preliminary results show that this method can carry out the accurate evaluation on the abnormal high pressure of the shale gas reservoirs of Fuling area with high calculation precision and application potential. Keywords: Equivalent depth method, logging evaluation, normal compaction trend, pore pressure. 1. INTRODUCTION AND BACKGROUND Evaluation of formation pore pressure by using well- logging data has the characteristics of continuous analysis data, low cost, and reliable precision [1-4]. However, most of the existing methods are widely used in conventional res- ervoirs that have source beds, reservoirs and cap rocks. Yet to see examples of using these methods for the shale gas reservoirs that have the characteristics of generating itself, storaging itself and enveloping itself. And according to the current development speed of shale gas, to understand the gas production reasons from the aspects of gas pore pressure, is what we need to do. Shale gas is natural gas extracted from shale, and mainly exists in the dark mud shale or high carbon mud shale. Shale has changeable mineral composition and complex pore struc- ture, therefore it mainly exists in surfaces of kerogen or clay particles in the adsorbed state, and exists in the cracks, pores and other storage space in the free-state, and also a very small amount of shale gas is present in dissolved state in kerogen or asphalt. The study area of this paper lies in the Fuling area of Sichuan basin, and its good potential of organ- ic rich shale mainly developed in the Longmaxi formation of Silurian to the Wufeng formation of Ordovician. The shale thickness is generally 40-210 m, the TOC content is from 1.0% to 5.0%, porosity ranges from 2% to 7.2%, and the buried depth is in the 2000 m to 3000 m range. The Longmaxi formation of Silurian is a set of black shale with gray green muddy siltstone. And the lithology of the Wufeng formation of Ordovician is gray dark silty mudstone that contain graptolite fossils. The mudstone and silty mudstone of the Xiaoheba for- mation and Hanjiadian formation of the Silurian and the limestone and dolomitic limestone of the Carboniferous *Address correspondence to this author at the Petroleum Exploration and development Research Institute, SINOPEC, Beijing 100083, China; E-mail: [email protected]covering the Longmaxi formation and Wufeng formation in Fuling area form a very good closed environment. Due to the abundant source in the sedimentary period of Wufeng and Longmaxi formation, the subsidence and accumulation of the sediments was relatively rapid to make the deposition of particles irregular and the drainage capacity weak. With the overlying sedimentary loading continued to increase, this part load was undertaken by the pore fluid and formed an under-compaction. At the same time, the organic matter in- creased in the sediments with the increasing buried depth and generated hydrocarbon under certain temperature and pressure condition. This part of hydrocarbon then sharply increased the pore fluid volume and formed abnormal high pressure. Therefore, the under-compaction combining with the hydrocarbon expansion is likely to make shale gas reser- voir of the Longmaxi formation form the abnormal high pressure characteristics. 2. PRINCIPLE AND METHOD OF PORE PRESSURE ANALYSIS In the buried environment of reservoirs, we believe that the overburden pressure at a certain depth point should be borne together by the reservoir pore pressure and the frame- work supporting stress. This is based on effective stress theo- rem proposed by Terzaghi, that is: (1) In the Equation (1), is the overburden pressure, is the vertical effective stress, is the formation pore pressure. 2.1. The Principle and Calculation Method of Compre- hensive Interpretation After the in-depth study of the principles of comprehen- sive interpretation, the writer realized that by the integral of the density logging data overburden pressure can be obtain the [5]. Just try to obtain the vertical effective stress, and then pore pressure can be obtained. More calculation meth-
Evaluation of formation pore pressure by using well-logging data has the characteristics of continuous analysis data, low cost, and reliable precision [1-4]. However, most of the existing methods are widely used in conventional res-ervoirs that have source beds, reservoirs and cap rocks. Yet to see examples of using these methods for the shale gas reservoirs that have the characteristics of generating itself, storaging itself and enveloping itself. And according to the current development speed of shale gas, to understand the gas production reasons from the aspects of gas pore pressure, is what we need to do.
Shale gas is natural gas extracted from shale, and mainly exists in the dark mud shale or high carbon mud shale. Shale has changeable mineral composition and complex pore struc-ture, therefore it mainly exists in surfaces of kerogen or clay particles in the adsorbed state, and exists in the cracks, pores and other storage space in the free-state, and also a very small amount of shale gas is present in dissolved state in kerogen or asphalt. The study area of this paper lies in the Fuling area of Sichuan basin, and its good potential of organ-ic rich shale mainly developed in the Longmaxi formation of Silurian to the Wufeng formation of Ordovician. The shale thickness is generally 40-210 m, the TOC content is from 1.0% to 5.0%, porosity ranges from 2% to 7.2%, and the buried depth is in the 2000 m to 3000 m range. The Longmaxi formation of Silurian is a set of black shale with gray green muddy siltstone. And the lithology of the Wufeng formation of Ordovician is gray dark silty mudstone that contain graptolite fossils.
The mudstone and silty mudstone of the Xiaoheba for-mation and Hanjiadian formation of the Silurian and the limestone and dolomitic limestone of the Carboniferous
*Address correspondence to this author at the Petroleum Exploration and
development Research Institute, SINOPEC, Beijing 100083, China;
covering the Longmaxi formation and Wufeng formation in Fuling area form a very good closed environment. Due to the abundant source in the sedimentary period of Wufeng and Longmaxi formation, the subsidence and accumulation of the sediments was relatively rapid to make the deposition of particles irregular and the drainage capacity weak. With the overlying sedimentary loading continued to increase, this part load was undertaken by the pore fluid and formed an under-compaction. At the same time, the organic matter in-creased in the sediments with the increasing buried depth and generated hydrocarbon under certain temperature and pressure condition. This part of hydrocarbon then sharply increased the pore fluid volume and formed abnormal high pressure. Therefore, the under-compaction combining with the hydrocarbon expansion is likely to make shale gas reser-voir of the Longmaxi formation form the abnormal high pressure characteristics.
2. PRINCIPLE AND METHOD OF PORE PRESSURE ANALYSIS
In the buried environment of reservoirs, we believe that the overburden pressure at a certain depth point should be borne together by the reservoir pore pressure and the frame-work supporting stress. This is based on effective stress theo-rem proposed by Terzaghi, that is:
(1)
In the Equation (1), is the overburden pressure, is the vertical effective stress, is the formation pore pressure.
2.1. The Principle and Calculation Method of Compre-hensive Interpretation
After the in-depth study of the principles of comprehen-sive interpretation, the writer realized that by the integral of the density logging data overburden pressure can be obtain the [5]. Just try to obtain the vertical effective stress, and then pore pressure can be obtained. More calculation meth-
Logging Evaluation Method for Pore Pressure The Open Petroleum Engineering Journal, 2015, Volume 8 351
ods of vertical effective stress are all backward-reasoned from the acoustic velocity model of experience that was pro-posed by Eberhart Phillips when he was studying the acous-tic velocity model. That is:
(2)
In the formula, is acoustic velocity, are model coefficients, is porosity, is clay content, is vertical effective stress. Therefore, the sound velocity in the strata which has normal compaction conditions is related to the factors of lithology, buried depth, and the degree of com-paction [6].
The factors affecting the acoustic velocity can be well de-termined by this model, so the porosity, clay content and vertical effective stress in the study area need to be measured to determine the model coefficients by the optimal method. Then by using the continuous porosity, clay content and the acoustic velocity curve, the overlying formation pressure data can be calculated, and by inserting the data into the for-mula (1), the continuous formation pore pressure can be ob-tained. However, in this study, the measured work of vertical effective stress has not been done in Fuling area, which makes this method lacks certain applicability in the local area.
2.2. The Principle and Calculation Method of “the Eaton Method”
In 1972, Eaton established the exponential relationship between formation pore pressure and logging parameters (interval transit time, resistivity) [7]. According to the expe-rience of the Gulf of Mexico and the research on the rock physical experiment data. This relationship does not change with the variation of lithology or depth, its basic expressional form is:
(3)
In the formula, is formation pore pressure, the , is respectively the overburden pressure, hydrostatic pressure,
is interval transit time at arbitrarily measured depth, is interval transit time value under normal compaction condi-tion at the same depth and E is the Eaton power index. The formula (3) shows that the calculation accuracy of formation pore pressure is closely related to the Eaton power index E. According to the existed measured values of the formation pore pressure, the Eaton power index E of formation pres-sure testing depth of each well in the study area can be in-duced. However, in this study, there is no effective measured pore pressure data in Fuling area which makes this method not applicable in the local area.
2.3. The Principle and Calculation Method of “Equiva-lent Depth Method”
The researchers found that, after digging into the acoustic logging data, two points of formation that had same acoustic velocity were encountered in the process of acoustic logging test to a set of more stable mudstone formation. In this way, the physical properties are the same, which means that the effective stress that is borne by these two mudstone skeleton is the same too. However, the larger part of overburden pres-sure is borne by pore pressure at the deeper point; which is the overpressure point [8-11]. The formula is:
(4)
In the formula, is overburden pressure, is the pore fluid pressure.
In the normal circumstances, the porosity of mudstone will increase as exponential function with depth, that is:
(5)
In the formula, and are respectively the porosi-ty of mudstone of the surface and the arbitrary depth. C is the coefficient of compaction, is the altitude location of A. Due to the linear relationship between the porosity of mudstone and the interval transit time, the porosity in formu-la (5) can be replaced by the data of interval transit time. And the following formula can be obtained by taking the natural logarithm on both sides of formula (5):
(6)
Or:
(7)
After fitting with the acoustic logging data that measured in actual mudstone formation, the , C and the normal compaction trend equation can be obtained [12-14].
After choosing the good normal compaction section and obtaining the normal compaction curve, we can come back to the formula (4). Assuming that the point A is in the nor-mal compaction zone and point B in the overpressure zone, then the pore pressure of point A is equal to the hydrostatic pressure. Furthermoe, if we consider the density of the over-lying strata of both points equal, the hydrostatic pressure and the overburden pressure are:
(8)
(9)
In the formula, is pore fluid density, g/cm3, is the overlying formation density, g/cm3, H is depth, m.
Feeding formula (8) and (9) into formula (4) to obtain the general formula:
(10)
And feeding formula (7) into formula (10) to obtain the general formula:
(11)
The formula (11) is for the pore pressure. Therefore, after knowing the coefficient of compaction C and the fitted value of surface interval transit time , the formation pore pressure can be calculated from this equation.
3. ANALYSIS OF APPLICATION IN FULING AREA
Based on the theory and method described above, this paper conducted the logging evaluation of the pore pressure for a number of parameter wells of Fuling area, also pro-cessed and valued the data of interval transit time of Well A according to the above method to establish a normal com-paction trend. In the process of valuing, the main principles are: 1) Select the pure mudstone section on the basis of natu-
352 The Open Petroleum Engineering Journal, 2015, Volume 8 Shibo and Wujun
ral gamma ray logging, spontaneous potential logging data and geological well log data, and remove the limestone of the Huanglong formation to reserve the thin mudstone layer which is considered to be the normal compaction section; 2) Take the stable layer section of the caliper log and remove the part that has obvious diameter shrinkage or extension to avoid the influence of drilling fluid on the acoustic transit time data; 3) Pick the average value of the interval transit time curve of mudstone strata rather than the peak value and the frequency hopping value when you are reading the value. And pay attention to the trend of the values of the acoustic logging curve of mudstone in case of reading some isolated high or low values. For the mudstone section that has high thickness and in the principle of taking less and essence, do pick the representative data points and avoid too much data gathering at the same depth. According to this principle, the normal compaction trend equation of Well A can be estab-lished (see Fig 1):
Fig. (1). “The normal compaction trend” line of well A.
The general equation between acoustic transit time
and depth H can be obtained by fitting this curve.
(12)
(13)
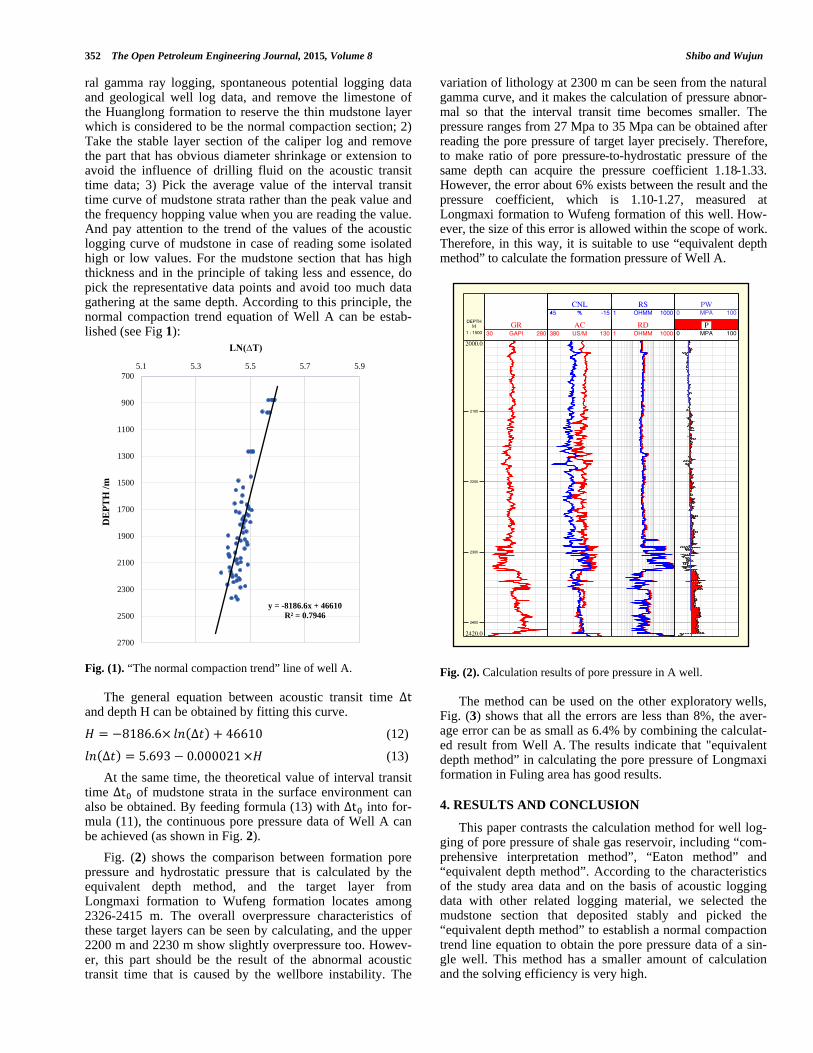
At the same time, the theoretical value of interval transit time of mudstone strata in the surface environment can also be obtained. By feeding formula (13) with into for-mula (11), the continuous pore pressure data of Well A can be achieved (as shown in Fig. 2).
Fig. (2) shows the comparison between formation pore pressure and hydrostatic pressure that is calculated by the equivalent depth method, and the target layer from Longmaxi formation to Wufeng formation locates among 2326-2415 m. The overall overpressure characteristics of these target layers can be seen by calculating, and the upper 2200 m and 2230 m show slightly overpressure too. Howev-er, this part should be the result of the abnormal acoustic transit time that is caused by the wellbore instability. The
variation of lithology at 2300 m can be seen from the natural gamma curve, and it makes the calculation of pressure abnor-mal so that the interval transit time becomes smaller. The pressure ranges from 27 Mpa to 35 Mpa can be obtained after reading the pore pressure of target layer precisely. Therefore, to make ratio of pore pressure-to-hydrostatic pressure of the same depth can acquire the pressure coefficient 1.18-1.33. However, the error about 6% exists between the result and the pressure coefficient, which is 1.10-1.27, measured at Longmaxi formation to Wufeng formation of this well. How-ever, the size of this error is allowed within the scope of work. Therefore, in this way, it is suitable to use “equivalent depth method” to calculate the formation pressure of Well A.
Fig. (2). Calculation results of pore pressure in A well.
The method can be used on the other exploratory wells,
Fig. (3) shows that all the errors are less than 8%, the aver-age error can be as small as 6.4% by combining the calculat-ed result from Well A. The results indicate that "equivalent depth method” in calculating the pore pressure of Longmaxi formation in Fuling area has good results.
4. RESULTS AND CONCLUSION
This paper contrasts the calculation method for well log-ging of pore pressure of shale gas reservoir, including “com-prehensive interpretation method”, “Eaton method” and “equivalent depth method”. According to the characteristics of the study area data and on the basis of acoustic logging data with other related logging material, we selected the mudstone section that deposited stably and picked the “equivalent depth method” to establish a normal compaction trend line equation to obtain the pore pressure data of a sin-gle well. This method has a smaller amount of calculation and the solving efficiency is very high.
y = -8186.6x + 46610
R² = 0.7946
700
900
1100
1300
1500
1700
1900
2100
2300
2500
2700
5.1 5.3 5.5 5.7 5.9
DE
PT
H /
m
LN(∆T)
Logging Evaluation Method for Pore Pressure The Open Petroleum Engineering Journal, 2015, Volume 8 353
Well Depth Pressure Coefficient
Error Calculated values Measured values
B 2475-2575 1.15-1.37 1.26-1.47 7.85%
C 2317-2418 1.2-1.47 1.28-1.50 4.48%
D 2512-2596 1.22-1.57 1.34-1.52 6.12%
Fig. (3). Comparison chart of calculated and measured formation pressure coefficient in Fuling area.
The results calculated on shale gas reservoir of Longmaxi
formation of Fuling area show: The pore pressure calculation method proposed by this paper achieved good results in four wells and the calculation precision is relatively high. There-fore, it is applicable to the evaluation and interpretation of logging data of shale gas reservoir in Fuling area.
CONFLICT OF INTEREST
The authors confirm that this article content has no con-flict of interest.
ACKNOWLEDGEMENTS
Declared none.
REFERENCES
[1] F. Honghai, A new integrated pore pressure evaluation method for shale-sand formations, Petroleum Exploration and Development, vol. 29, no. 1, pp. 90-92, 2002.
[2] D.H. Eberhart, M.D. Zoback, Empirical relationships among seis-mic velocity, effective pressure, porosity, and clay content in sand-stone, Geophysics, vol. 54, no. 1, pp. 82, 1989.
[4] G.Y. feng, J.X. Jian, Accurate prediction of formation pore pres-sure and its application, China Offshore Oil and Gas, vol. 16, no. 1, p. 36422, 2004.
[5] C.Q. Zhong, Research Review on the abnormal pressure formation mechanism, Natural Gas Exploration and Development, vol. 24, no. 4, pp. 38-46, 2001.
[6] D. Ciqian, Mine Geophysical. China University of Petroleum Press: China, 2002, pp. 93-9.
[7] B.A. Eaton, Graphical Method Predicts Geopressure worldwide, World Oil, 1972, pp. 51-56.
[8] F. Honghai, Determination and regression of overburden pressure gradient, Petroleum Drilling Technique, vol. 30, no. 6, pp. 6-8, 2002.
[9] Z. Chuanjin, Prediction of formation pore pressure in wild cat wells, Petroleum Drilling Techniques, 2002, vol. 30, no. 3, p. 1314.
[10] W. Maoan, C. Chao, New approach for pore pressure prediction, Oil & Gas Geology, 2007, vol. 28, no. 3, pp. 395-400.
[11] Y Rong, Quantitative evaluation of abnormal formation pressure, Fault Blockoil & Gasfield, vol. 8, no. 3, pp. 25-28, 2001.
[12] L. Shansheng, Log evaluation about formation pore pressure of boxing subsag, Well Logging Technology, vol. 37, no. 2, pp. 169-172, 2013.
[13] Z. Xing, H. Shiming, Prediction method of shale formation pore pressure, Fault-Block Oil & Gas Field, vol. 14, no. 1, pp. 24-26. 2007.
[14] S. Bo, A new method of formation pore pressure prediction in Northeast Sichuan area, Journal of Oil and Gas Technology, vol. 33, no. 8, pp. 96-98, 2011.
Received: November 05, 2014 Revised: January 03, 2015 Accepted: June 23, 2015