Logistics and Transport Management Master Thesis No 2005:62 Deciding a Distribution Network Design: Varying from Centralized to Decentralized Pattern - The case of Mölnlycke Health Care AB towards east European market - Nouf Al-Iryani & Thomas Gassin - i -
Transcript
Logistics and Transport Management
Master Thesis No 2005:62
Deciding a Distribution Network Design: Varying from Centralized to Decentralized Pattern
- The case of Mölnlycke Health Care AB towards east European market -
Nouf Al-Iryani & Thomas Gassin
- i -
Graduate Business School School of Economics and Commercial Law Göteborg University ISSN 1403-851X Printed by Elanders Novum
- ii -
ABSTRACT On May1, 2004, the EU welcomed 10 new members including among these states: Hungary and Czech Republic. Customs duties are abolished with those new countries, while trading barriers are facilitated. Mölnlycke Health Care, a Swedish company, distributes to Europe via a main warehouse in Belgium. The recent changes in the European business environment appear, to this company, as an opportunity to gain new market share towards East European countries, particularly Hungary and the Czech Republic. The purpose of this research was to study what could be the optimal design of a distribution structure towards the markets in Hungary, the Czech Republic and one particular area in East Germany. We decide to look at the design of the current distribution network, and to compare two alternative distribution network designs. While analyzing the business case, we suggest solutions and improvements according to the following perspective: cost, flexibility, location of warehouses, and the risks of reduced customer service level. In a first part we review the theory used in the thesis. Then we present the gathered data, on an organized approach that support a further analysis, concerning the current situation. In a third part we analyze the results obtained from gathering the empirical data. This part includes also a cost simulation of the two alternatives; therefore a discussion about the soft factors is added. The results showed the centralized alternative much cheaper than any other distribution network design. The solution with the merged local warehouse in East Europe located in Prague is more able to adapt itself to further change in the market. Keeping the current situation is the solution that includes the least amount of risk for a reduced customer service level.
- iii -
In the conclusion we tried to relativize the cost comparison we got, and make the reader aware of the uncertainties in the thesis. In the conclusion we also gave possible implementations to improve the business of Mölnlycke Health Care. Some suggestions, such as implementing Vendor Managed Inventory, may be a topic for further research. Key words: Network design, distribution, East Europe, health care products, gravity point, centralization, decentralization, logistics.
- iv -
AKNOWLEDGEMENTS By this acknowledgement we would like to express our deepest gratitude to all the people that have been very helpful and available, giving their time and energy for our study. First of all we would like to thank our tutor at the department of logistics and transport management, Graduate Business School, Leif Enarsson, for having shared his experience with us. His enlightened advices and his jovial mood helped us throughout the thesis. As this thesis is a case study at Mölnlycke Health Care, we would like to thank them for helping to form us as master thesis students. In particular we would like to express our extreme gratitude to Jan Månsson for trusting us with the task we were to accomplish. His professionalism, dynamism and enthusiasm will be a model to strive to follow in our further working life. We are also grateful for Pauline Johnnyson who has continuously helped us along this project. Additionally, we also express thanks to the local contacts in the Czech Republic, Hungary and Mölnlycke Health Care East Germany. We were delighted by their efficient and friendly cooperation. Generally, we would like to express our thanks to all the employees of Mölnlycke we met during our work for their willingness to help us. The affability of all of them was appreciated. Without their useful support this thesis won’t have been possible. Finally, we would like to thank Professor Kenth Lumsden and Ola Hultkrantz for their availability and their sharp judgment. Göteborg 2005-01-07 Nouf Al-Iryani Thomas Gassin
- v -
TABLE OF CONTENTS: 1. Introduction ............................................................................................................................1
1.1 General Background.......................................................................................................1 1.2 Problem Discussion........................................................................................................3 1.3 Research Question..........................................................................................................6 1.4 Purpose ...........................................................................................................................7 1.5 Studied Distribution Structures ......................................................................................7 1.6 Limitations .....................................................................................................................8
2. Methodology ........................................................................................................................11 2.1 What is Research Design?............................................................................................11 2.2 Type of Research Design – Quantitative or Qualitative ..............................................12 2.3 Elements of the Research Process................................................................................13
2.3.1 Research question.................................................................................................13 2.3.2 Methodological strategy.......................................................................................15 2.3.3 Theoretical perspective ........................................................................................17
2.3.3.1 Inductive versus deductive approach ...............................................................17 2.3.4 Data collection approach......................................................................................18
2.3.4.1 Primary data .....................................................................................................19 2.3.4.2 Secondary data .................................................................................................20 2.3.4.3 Collecting data in a case study .........................................................................20
2.3.5 Data analysis and interpreting..............................................................................21 2.3.5.1 Uncertainties in our study ................................................................................22
2.3.6 Conclusions ..........................................................................................................22 2.4 Research Evaluation.....................................................................................................23
3. Theory ..................................................................................................................................27 3.1 Introduction to Business Logistics ...............................................................................27
3.1.1 Hub glossary.........................................................................................................28 3.1.2 Transport glossary................................................................................................31
3.2 The Background of Logistics Service ..........................................................................33 3.2.1 What is logistics service quality? .........................................................................33 3.2.2 Logistics service indicators ..................................................................................33 3.2.3 Managing logistics service internationally...........................................................34 3.2.4 How to apply a customer service driven logistics system....................................35
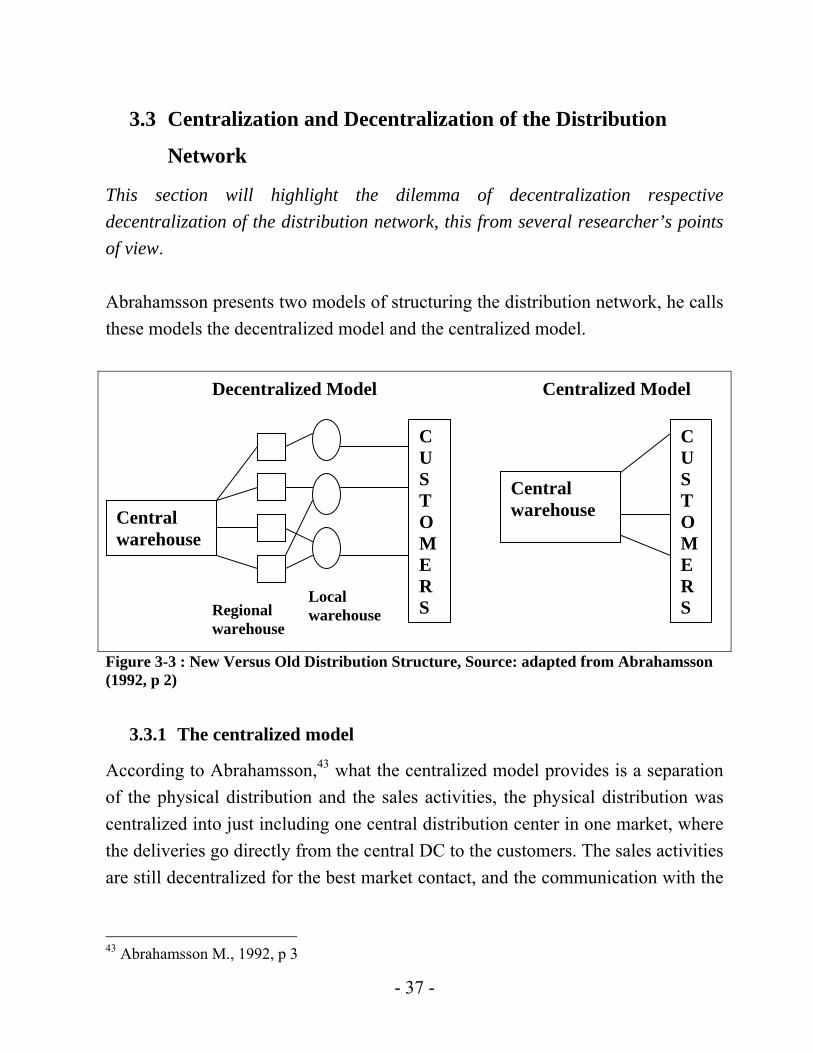
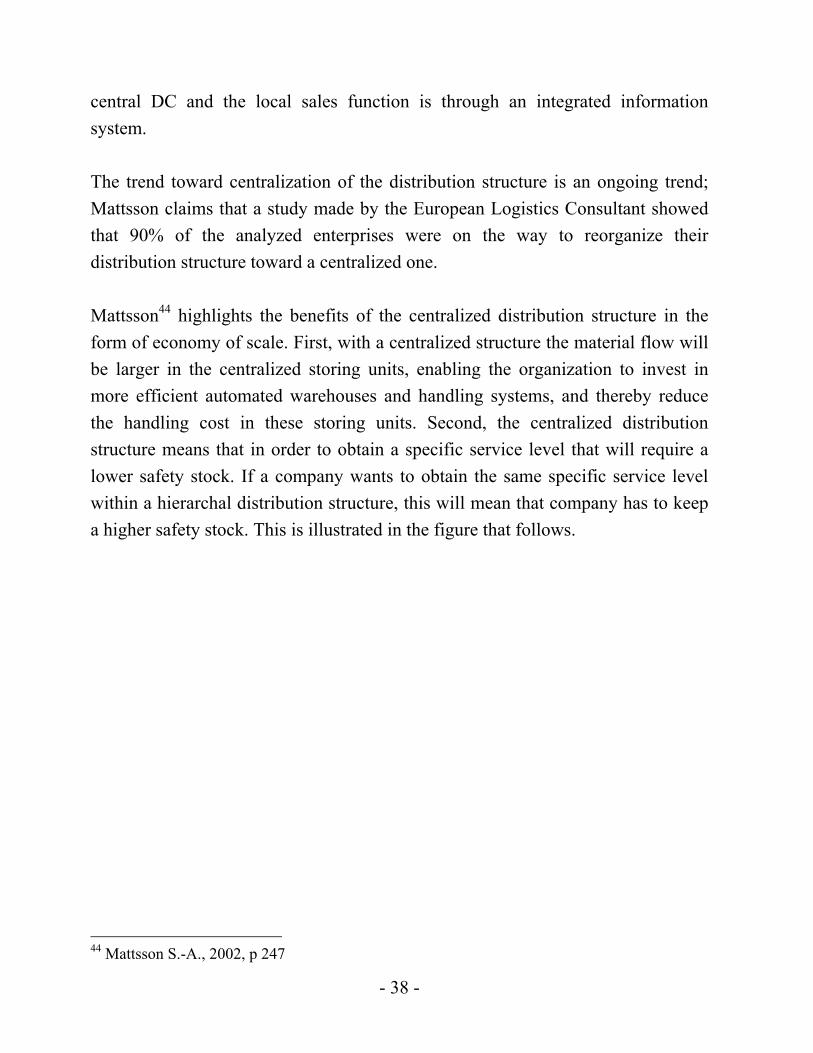
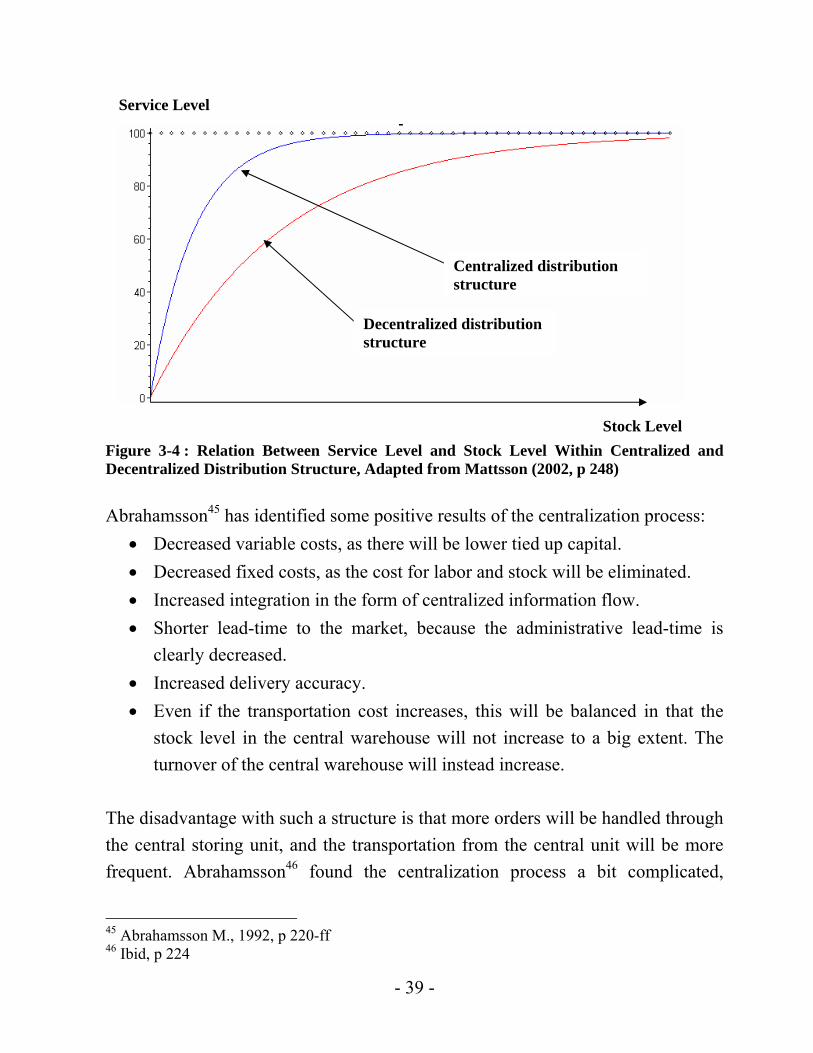
3.3 Centralization and Decentralization of the Distribution Network ...............................37 3.3.1 The centralized model ..........................................................................................37 3.3.2 The decentralized model ......................................................................................40
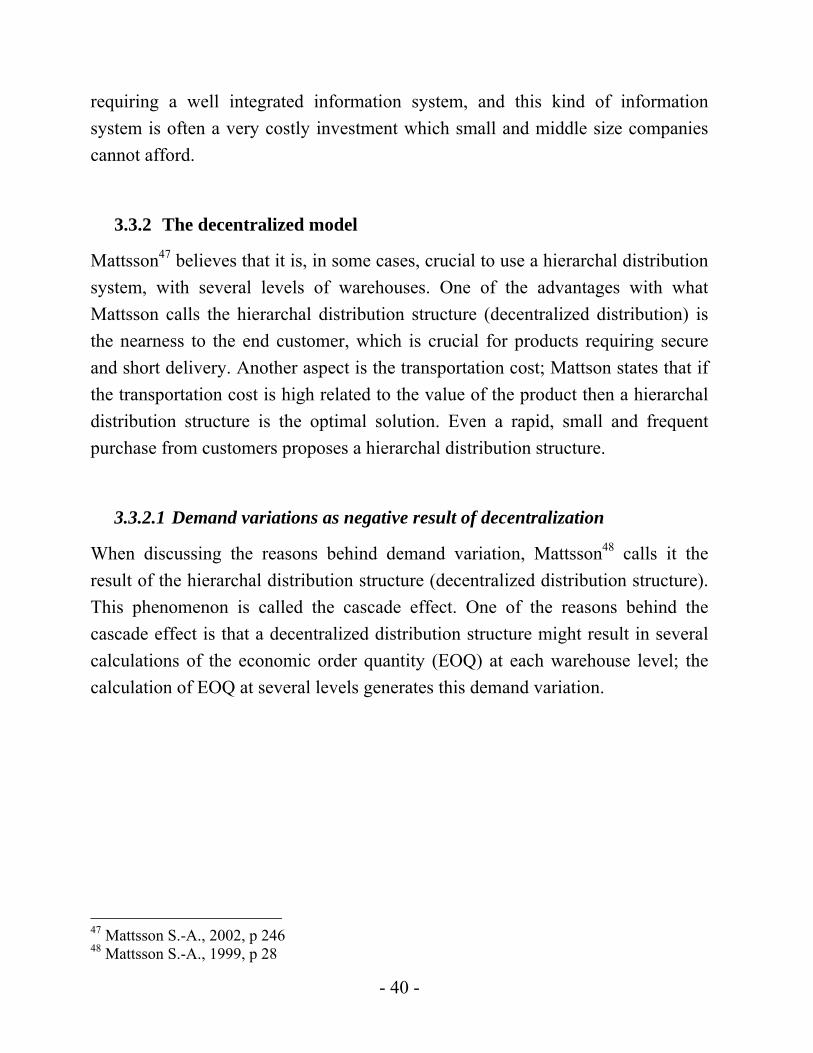
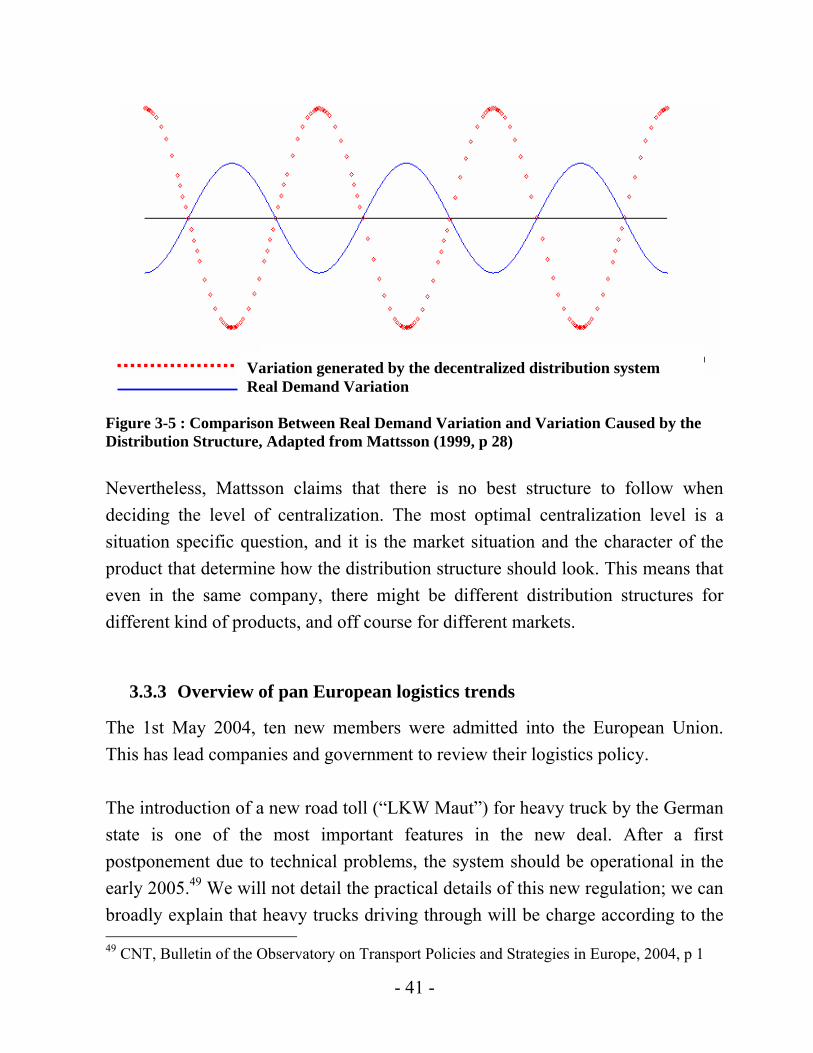
3.3.2.1 Demand variations as negative result of decentralization................................40 3.3.3 Overview of pan European logistics trends..........................................................41
3.5.5.1 Average inventory value: .................................................................................51 3.5.6 Total cost integration............................................................................................52
3.6 Localization of Logistics Facility.................................................................................54 3.6.1 Gravity point methodology...................................................................................54
3.6.1.1 What is the gravity point methodology? ..........................................................54 3.6.1.2 Transportation work: ........................................................................................55 3.6.1.3 Transportation costs: ........................................................................................56
3.6.2 Soft factors while deciding location facilities ......................................................57 3.6.2.1 Integration of the soft factors in the location decisions....................................57 3.6.2.2 Soft factors import while choosing a location..................................................58
4. Empirical Findings ...............................................................................................................63 4.1 Description of the Company MHC...............................................................................63
4.1.1 Historical background ..........................................................................................64 4.1.2 Production units....................................................................................................64 4.1.3 Material assortment ..............................................................................................65 4.1.4 Distribution strategy .............................................................................................65
4.2 Description of the Material Flow .................................................................................68 4.2.1 Czech Republic activities .....................................................................................68 4.2.2 Hungary activities.................................................................................................74 4.2.3 East Germany-DERI activities .............................................................................79
4.3 Value of the Current Flow............................................................................................83 4.3.1 Transportation cost: ..............................................................................................83
4.3.2 Warehousing handling costs:................................................................................86 4.3.2.1 The Czech Republic warehouse cost................................................................86 4.3.2.2 Hungary warehouse cost...................................................................................86 4.3.2.3 East Germany-DERI warehouse cost ...............................................................86
4.3.3 Carrying expense:.................................................................................................88 4.3.3.1 The Czech Republic carrying expense .............................................................88 4.3.3.2 Hungary carrying expense................................................................................88 4.3.3.3 East Germany-DERI carrying expense ............................................................89
4.3.4 The total cost of the current distribution flow......................................................90 4.4 Logistics Customer Service..........................................................................................91
4.4.1 Definition of order completeness .........................................................................91 4.4.2 Case of shutting down the Nordic warehouse ......................................................92
5. Analysis................................................................................................................................97 5.1 General Trade-off Between Centralization and Decentralization of the Distribution Network....................................................................................................................................97
5.1.1 Introduction ..........................................................................................................98 5.1.2 The current distribution network for MHC east European market ......................98 5.1.3 The global supply strategy of MHC: step toward centralization?......................100
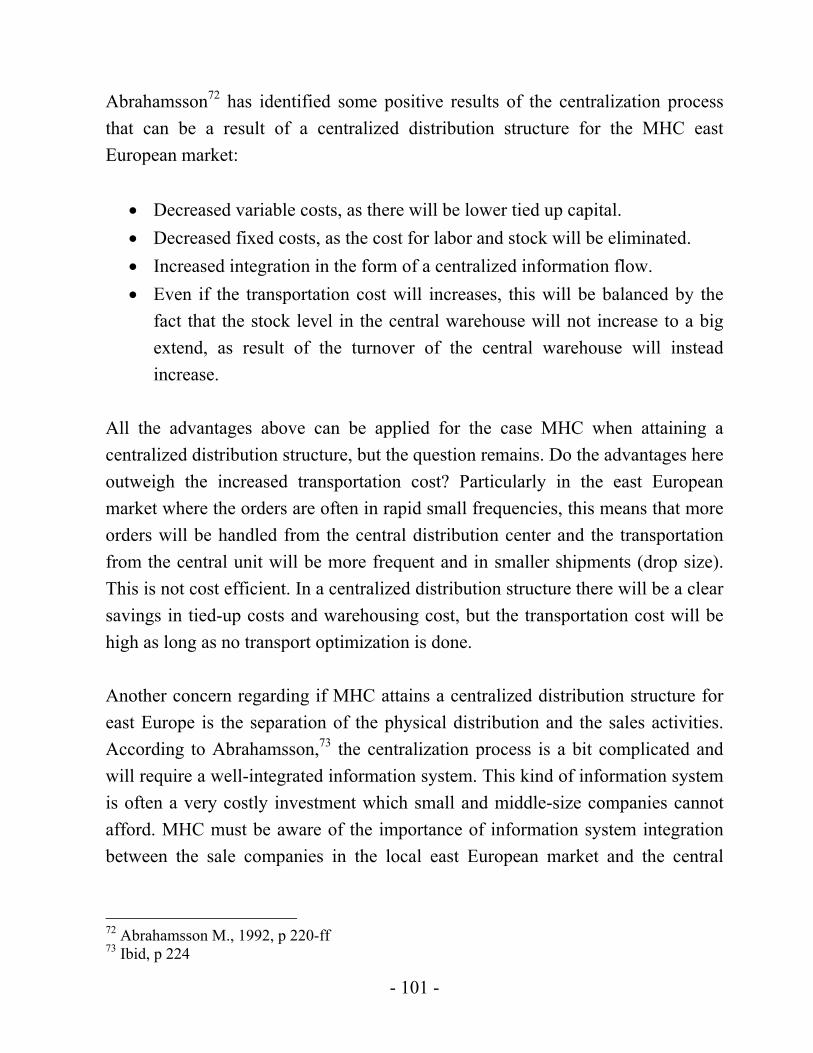
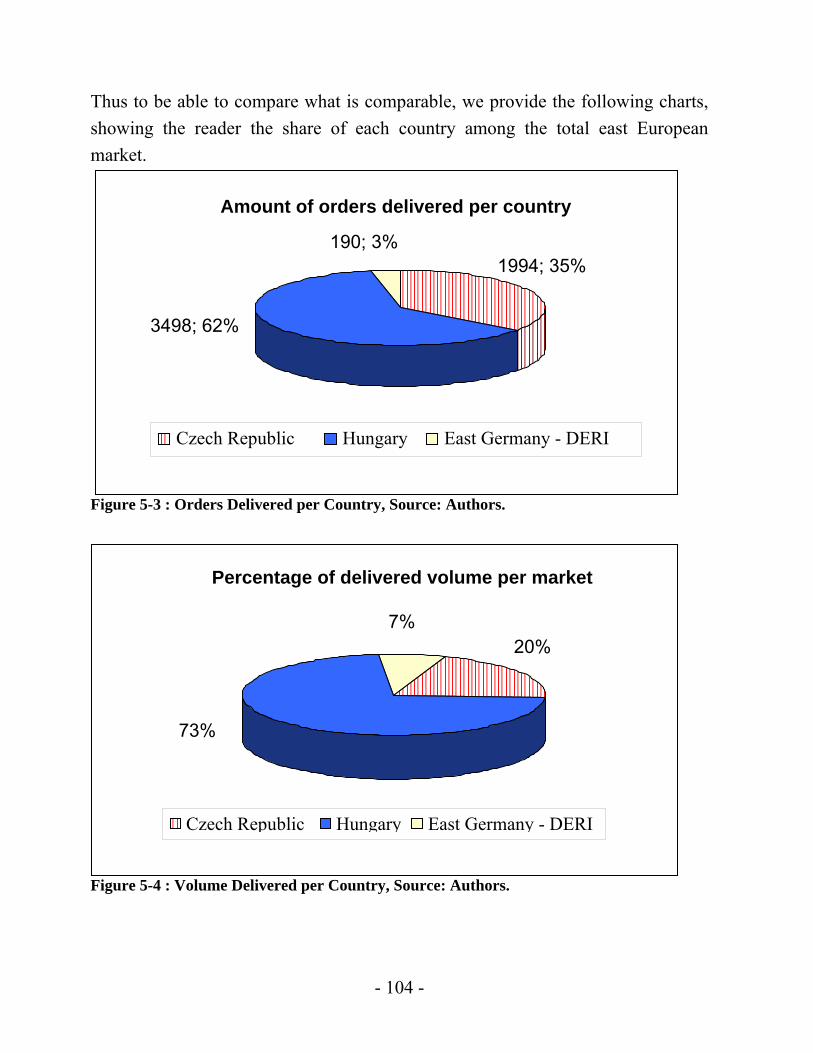
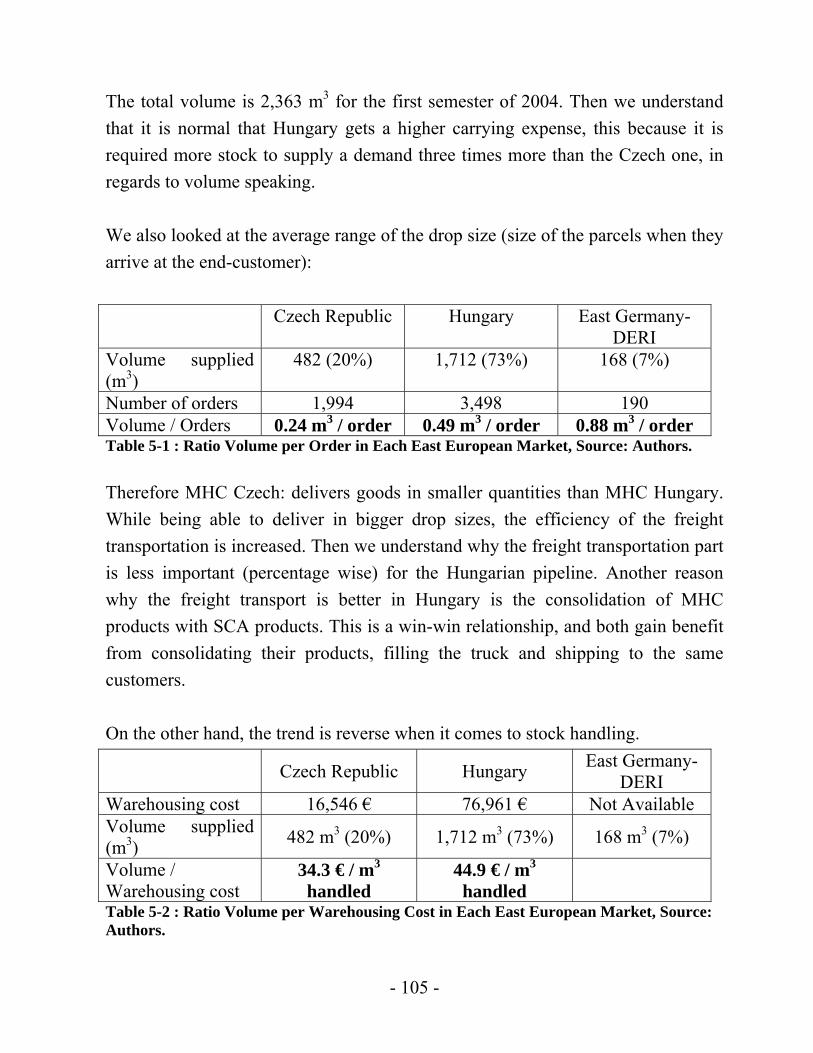
5.2 Analysis of the current situation.................................................................................103 5.2.1 Analysis of the cost structure linked to activities...............................................103
5.3 Analysis of the alternative one: Satellite Unit............................................................107 5.3.1 Description of the alternative “Satellite Unit” ...................................................107 5.3.2 Computation of the location of the satellite unit, according to the Gravity Point Methodology ......................................................................................................................109
5.3.2.1 Simple gravity formula: .................................................................................109 5.3.2.2 Gravity formula including transportation cost: ..............................................111
5.3.3 Discussion on the SATELLITE UNIT location including soft factors..............115 5.3.3.1 Exclusion of the result from the Gravity Point calculation............................115 5.3.3.2 The soft factors that affect the decision of location .......................................117
5.3.4 Cost simulation alternative satellite unit: ...........................................................130 5.3.4.1 Simulation Model...........................................................................................130 5.3.4.2 Alternative PRAGUE.....................................................................................131 5.3.4.3 Alternative BRATISLAVA ...........................................................................134 5.3.4.4 Alternative BUDAPEST ................................................................................135
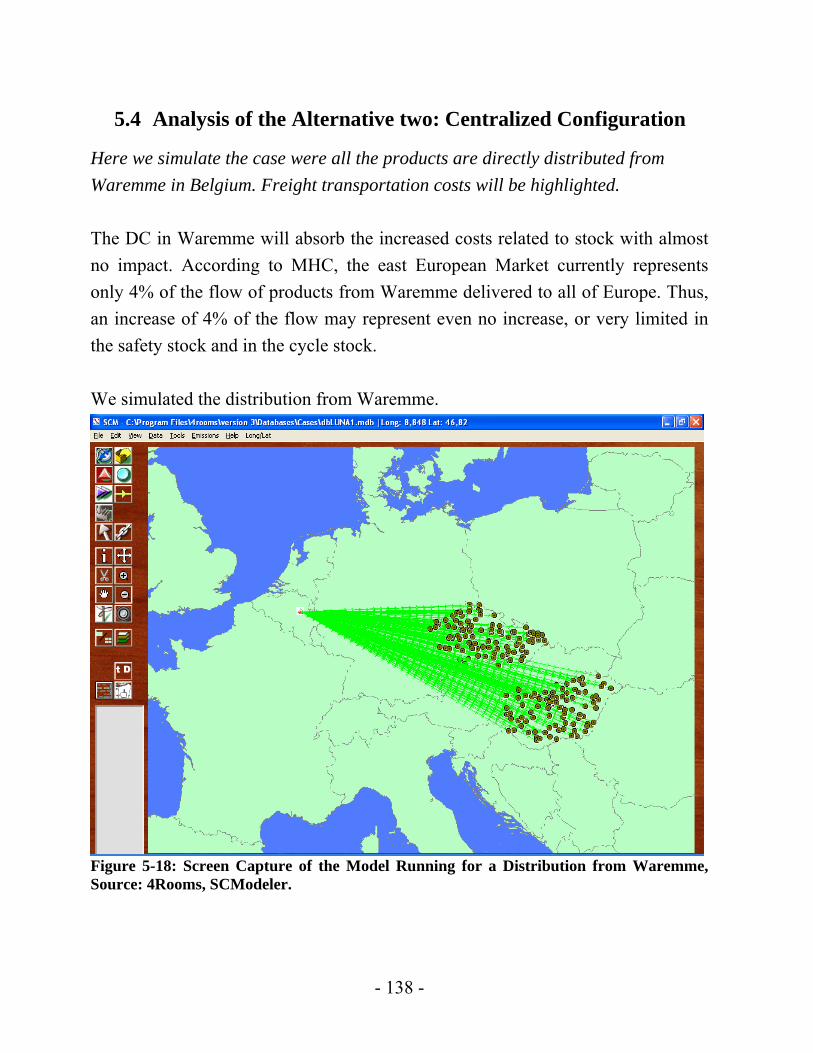
5.3.5 Costs structure for the SATELLITE UNIT network:.........................................137 5.4 Analysis of the Alternative two: Centralized Configuration......................................138
5.4.1 Strength and weakness of the centralized case...................................................139 5.4.1.1 Customer service ............................................................................................139 5.4.1.2 Flexibility .......................................................................................................140 5.4.1.3 Concealed cost................................................................................................140
5.5 Sum up of the results from different alternatives.......................................................142 5.6 Risk Analysis of Logistics Customer Service ............................................................143
5.6.1 Why a risk analysis of logistics customer service? ............................................143 5.6.2 The case MHC nordic market ............................................................................144
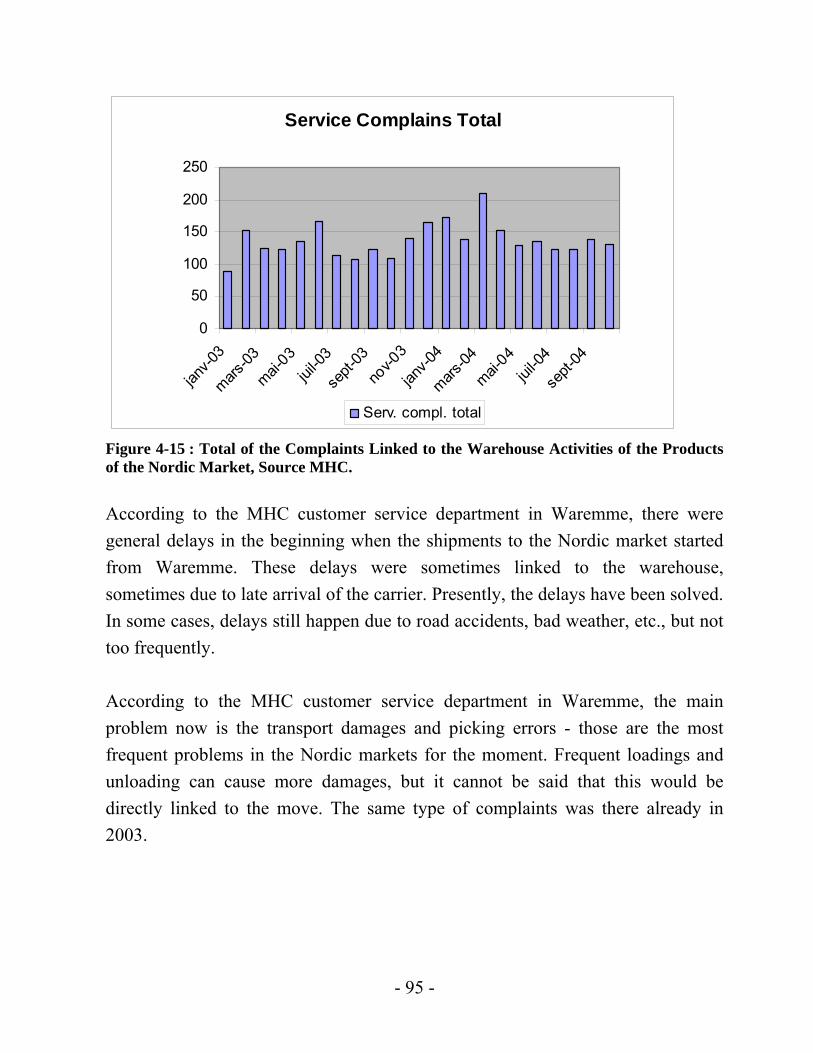
5.6.2.1 The transport complaints................................................................................144 5.6.2.2 The Warehouse complaints ............................................................................145 5.6.2.3 The order completeness..................................................................................146
5.6.3 The Possible risks affecting the logistics customer service ...............................147 5.6.4 Results ................................................................................................................148
6. Conclusion..........................................................................................................................151 6.1 Uncertainties in our study ..........................................................................................151 6.2 General Recommendations to MHC east European Market ......................................152
6.2.1 On the service measurement ..............................................................................152 6.2.2 Educating the customers: ...................................................................................152 6.2.3 Time dependency ...............................................................................................152
7. Suggestions for Further Research ......................................................................................155 7.1 Logistics Service Quality Analysis ............................................................................155 7.2 Vendor Managed Inventory (VMI):...........................................................................155
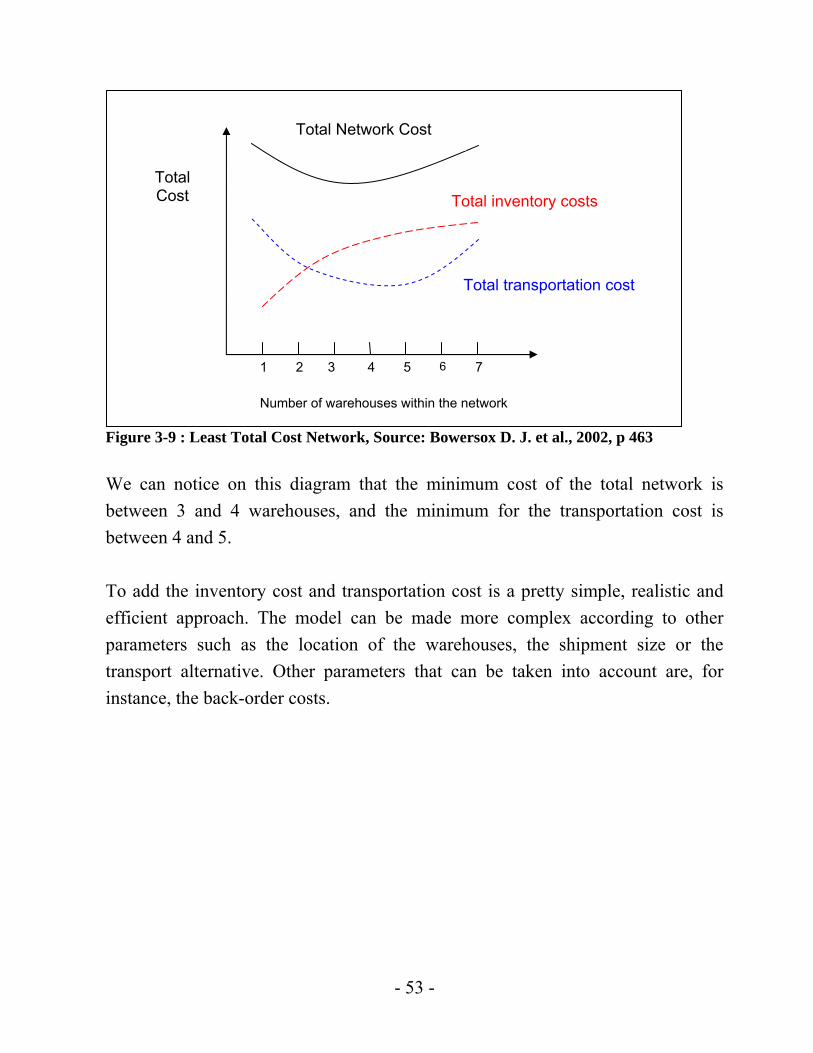
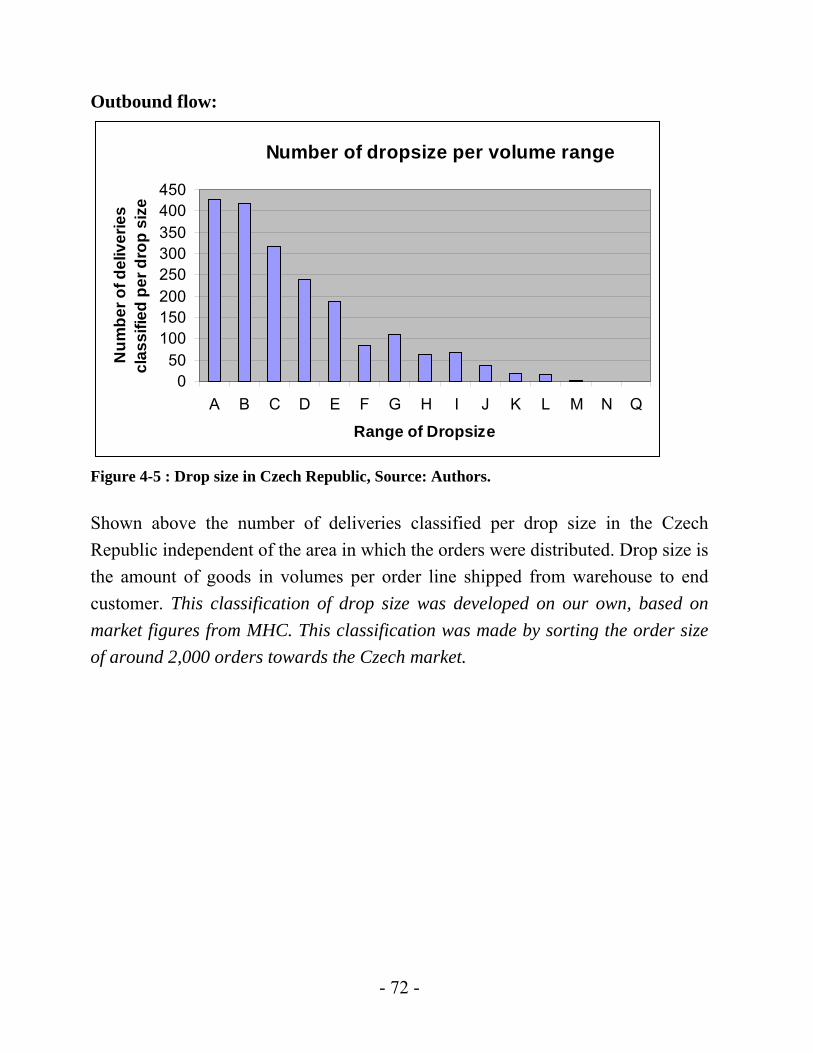
TABLE OF FIGURES: Figure 2-1 : The Research Process...............................................................................................23 Figure 3-1 : Split Point and Co-loading Point..............................................................................30 Figure 3-2 : Process of Designing a Logistics System.................................................................35 Figure 3-3 : New Versus Old Distribution Structure ...................................................................37 Figure 3-4 : Relation Between Service Level and Stock Level Within Centralized and Decentralized Distribution Structure............................................................................................39 Figure 3-5 : Comparison Between Real Demand Variation and Variation Caused by the Distribution Structure...................................................................................................................41 Figure 3-6 : The Total Cost Cube.................................................................................................45 Figure 3-7 : Ordering Quantity and Safety Stock ........................................................................49 Figure 3-8 : Average Inventory as a Function of Warehouse Locations .....................................52 Figure 3-9 : Least Total Cost Network.........................................................................................53 Figure 4-1 : Long Term Distribution Strategy for Europe ...........................................................67 Figure 4-2: Pattern of the current distribution network of MHC towards East Europe ...............68 Figure 4-3 : Line-haul from Waremme to Prague........................................................................70 Figure 4-4 : Inbound Flow in Number of Pallets Arrived First Semester of 2004 ......................71 Figure 4-5 : Drop size in Czech Republic ....................................................................................72 Figure 4-6 : Inbound Volume (m3) Per Arrival from Waremme.................................................75 Figure 4-7 : Line-haul from Waremme to Budapest ....................................................................76 Figure 4-8 : Drop Size in Hungary...............................................................................................77 Figure 4-9 : Flow from the DC in Waremme to Erftstadt in Germany........................................81 Figure 4-10 : Inbound Flow from Erftstadt to DERI (MTR Riesa) .............................................81 Figure 4-11 : Transportation Cost Related to Each Pipeline........................................................83 Figure 4-12 : Different Costs in Each Distribution Pipelines Towards East Europe...................90 Figure 4-13 : Complains Linked to the Warehouse Activities of the Products of the Nordic Market ..........................................................................................................................................93 Figure 4-14 : Complains linked to the Transport of the products for the Nordic market ............94 Figure 4-15 : Total of the Complaints Linked to the Warehouse Activities of the Products of the Nordic Market ..............................................................................................................................95 Figure 4-16 : Order Completeness for the Nordic Market ...........................................................96 Figure 5-1 : Grade of Decentralization in the Current Distribution Network for MHC East European Market ..........................................................................................................................99 Figure 5-2 : Pipeline Cost Structure in East Europe ..................................................................103 Figure 5-3 : Orders Delivered per Country ................................................................................104 Figure 5-4 : Volume Delivered per Country ..............................................................................104 Figure 5-5 : Design of the Distribution Network Towards East Europe, While Using a Satellite Unit.............................................................................................................................................108 Figure 5-6 : Result of the Gravity Point Calculation .................................................................110 Figure 5-7 : Gravity Point Calculation While Freight Transportation is 1.5 more costly Than the Line Haul....................................................................................................................................113 Figure 5-8 : Gravity Point Calculation While Freight Transportation is 2 Times More Costly Than the Line Haul.....................................................................................................................114 Figure 5-9 : Gravity Point Calculation While Freight Transportation is 3 Times More Costly Than the Line Haul.....................................................................................................................114 Figure 5-10: Location of MHC Factory in the Czech Republic.................................................122
- x -
Figure 5-11 : Possibility in Using Bratislava as Location for Warehouse Which Can Support Return Flow to Karvina and Further to Waremme.....................................................................124 Figure 5-12 : Future Market Areas in East Europe ....................................................................125 Figure 5-13 : Volume Delivered per Country ............................................................................126 Figure 5-14 : Screen Capture of the Model Running for a Distribution from Prague................133 Figure 5-15 : Screen Capture of the Model Running for a Distribution from Bratislava ..........134 Figure 5-16 : Screen Capture of the Model Running for a Distribution from Budapest............136 Figure 5-17 : Total Cost Comparison for the Three Locations ..................................................137 Figure 5-18: Screen Capture of the Model Running for a Distribution from Waremme...........138 Figure 5-19 : Comparison of Cost Structure for the Whole Pipeline. ........................................142 Figure 5-20 : Percentage of Total Service Complaints ..............................................................146
- xi -
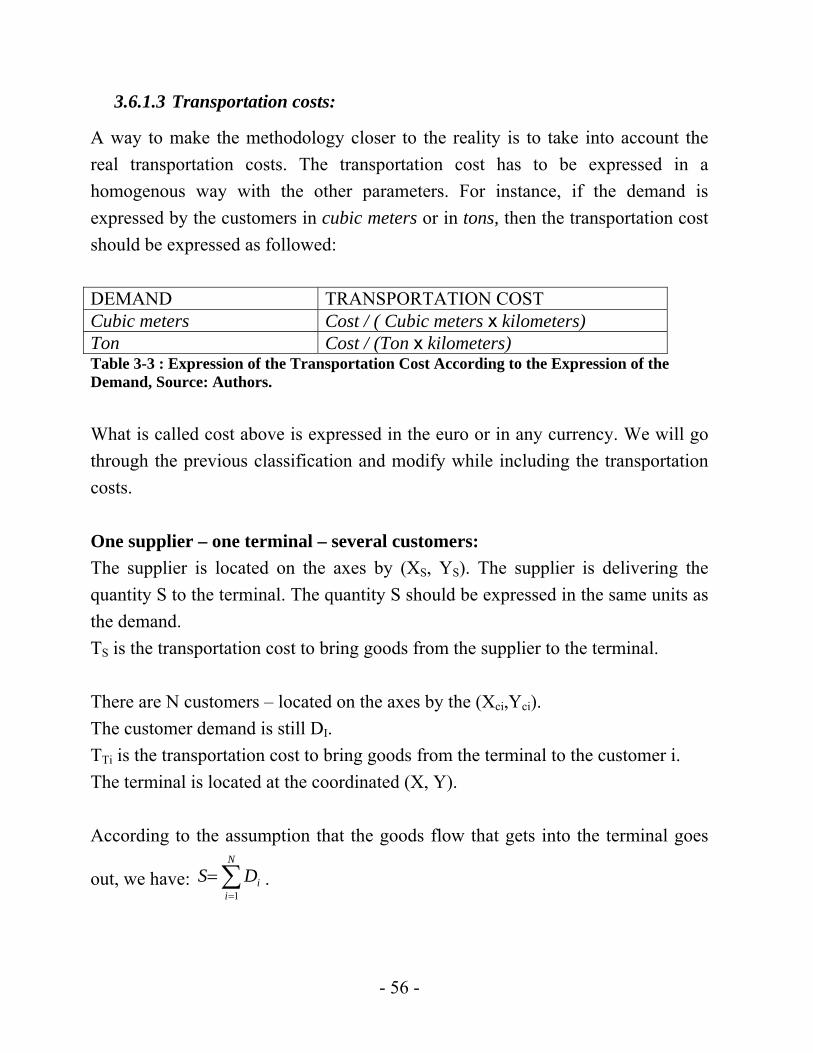
LIST OF TABLES: Table 3-1 : The Six General Activities in Warehouses................................................................47 Table 3-2 : Summary of Sales in One Combined and Three Separate Markets...........................50 Table 3-3 : Expression of the Transportation Cost According to the Expression of the Demand......................................................................................................................................................56 Table 3-4 : Main Determinants considered in classic theories of location ..................................58 Table 3-5 : Rating of Soft Factors................................................................................................61 Table 4-1 : Clarification of the Corresponding Letters ................................................................73 Table 4-2 : Clarification of the Corresponding Letters ................................................................78 Table 4-3 : Components of Transportation Cost Towards the Czech market..............................84 Table 4-4 : Components of Transportation Cost Towards the Hungarian Market.......................84 Table 4-5 : Components of transportation cost towards DERI market ........................................85 Table 4-6 : Value of stock in DERI..............................................................................................89 Table 4-7 : Example of Order Completeness. ..............................................................................92 Table 5-1 : Ratio Volume per Order in Each East European Market ........................................105 Table 5-2 : Ratio Volume per Warehousing Cost in Each East European Market. ...................105 Table 5-3 : Ratio Stock Value per Activities Expressed in Orders and Volume .......................106 Table 5-4 : Example of the Efficiency in Transportation When Consolidating Goods .............112 Table 5-5 : Parameters Used to Express T (transportation cost)................................................112 Table 5-6 : Infrastructure Factors...............................................................................................118 Table 5-7 : Economic Development, Figures as Quality of Life Measurement ........................121 Table 5-8 : Locations Supporting the Theoretical Factors.........................................................121 Table 5-9 : Locations Supporting Own Developed Soft Factors. ..............................................127 Table 5-10 : Ranking Locations Correlated to the Importance of Soft Factors .........................129 Table 5-11 : Comparison Between Simulation Model and Real Case.......................................131 Table 5-12 : Costs Structure of the Analyzed Locations for Alternative 1................................137 Table 9-1 : Pricing Rate of DHL for Line-haul Transportation .................................................163 Table 12-1 : Freight Transportation Pricing Rate in the Czech Market.....................................169 Table 13-1 : Freight Transportation Pricing Rate in the Hungarian Market..............................171 Table 14-1 : Cost Structure of the Warehouse DERI Outsourced to MTR Riesa......................173 Table 15-1 : Detail of the Handling Costs in the Prague Warehouse ........................................175
- xii -
LIST OF SHORT TERMS: DC Distribution Center DERI Deutsch Entitet Riesa, German Consignment Warehouse in Riesa HTC Home Taking Cost (line haul cost) MHC Mölnlycke Health Care Pipeline Line Haul + Warehousing Activities + Freight Transportation TRP Transport Box
- xiii -
1. Introduction The aim of this chapter is to give an introduction background to the research and problem area, and out from this background the research question(s) will be initiated. Further in this chapter we present the purpose of the research, the limitations, and in which manners we carried out our study.
1.1 General Background
Companies today have to deal with new economic parameters. Political and economical moves occur faster than before. Trading zones are built up all over the world. Globalization became a generalized phenomenon that has more or less abolished some borders. Thanks to technical improvements the distances have also shrunk, and the world can be seen as a village. In such an environment, logistics activities can no more be seen as traditional transportation activities. The logistics task has to support economic growth of companies as well as the marketing and manufacturing activities as a result of increased international competition and international corporate mergers. Suppliers, customers and manufacturing plants are split over a wide geographical area; this means that there is a more complicated information flows than if those parameters were localized. According to Bowersox et al.1, during decades it has been thought in business that a firm must have production and warehousing facilities in local markets to carry out the business successfully. There was doubt that a firm could keep a consistent delivery time if the firm’s facilities were located far from the customers, even the customers felt that unless suppliers maintained inventory locally it would be difficult to provide consistent delivery. The advances in transportation infrastructure as well as new IT tools –Internet, Business Information Systems (ERP-system), and EDI (Electronic Data Interchange) – reduced distances: the new information system is not limited to any geographical distances. Nowadays it is possible to achieve good service performance while having manufacturing plants and final market areas at the antipode of each other.
1 Bowersox D.J. et al., 2002, p 450
- 1 -
Nevertheless, the material flow; despite some technological improvement, cannot be simplified. And even more, according to the globalization trend, material flow had suffered an evident intricacy. Hence the globalization phenomenon puts an extremely challenging task on distribution performance. To face this challenge, a company’s supply chain network has to be as efficient as possible. To make it efficient the logistics network has to be well designed, this includes the design of production as well as warehouse localization strategies. When companies are striving to re-examine their supply chain network, there are two areas that can be improved. The first is the localization of production sites, and the second is the warehouse localization strategy. According to Harrison and Remko,2 in the same way that the consolidation of production can deliver cost benefits, so can the consolidation of inventory. But on the other hand it is cheaper for companies to restructure their warehouse network than the production network, and therefore when companies usually want to make the supply chain network more efficient they firstly re-examine the warehouses network. Solving a localization issue is one of the widest and most complex tasks in the logistics fields. It is an even trickier task when it is taken into a dynamic environment, with evolutionary and growing parameters: as with demand for instance. Acting in a growing market contains a lot of revenue opportunities, but in order to gain this revenue companies have to perform the logistics function efficiently. One of the fastest growing markets in the current business world is the east European market. The well being of east European countries’ economies resulted in the recent entrance of these countries into the European Union. These changes in the east European market will facilitate trade and generate a more competitive business environment. This market will likely attract new competitors, both from Europe and abroad. Firms already acting in this market has to reorganize their 2 Harrison and Remko, 2002 , p 89
- 2 -
logistics function in order to survive the increasing competition and to gain more market share in such a fast growing market. Building an efficient distribution network requires consideration of several parameters: transportation facilities, warehouse localization, customer’s demands and requirements, etc.
1.2 Problem Discussion
Mölnlycke Health Care AB, mentioned as MHC in this report, one of the market leaders in single-use products for surgery and health care products and is already acting in the east European market. Since some eastern European countries entered the European Union (May 1, 2004), new changes in the market meant new opportunities for the company, but also new threats. Example of opportunities is in the easier trade between west and east Europe, and one of the threats can be the risk of increasing competition. MHC has to rethink about their logistics network design in this market, this in order to cope with the new changes. The global supply mission of MHC is: “Based on a cost-effective structure, ensure excellent supplies, surpassing our competitors in achieving full customer satisfaction with a low level of tied up capital throughout the entire supply chain.” From this statement we can understand that the warehouse strategy in MHC is striving toward a consolidation of inventory sites. The vision of MHC´s distribution strategy is to “With excellent service serve our customers with the right product, at the right time, and with the right costs.” According to MHC, one of the keys to success for obtaining this vision is to have a limited number of stock points. MHC is using a central warehouse in Waremme (Belgium) as a global distribution center for all of Europe. Their products are manufactured in several different places in the world: Asia and east Europe for instance, all the products are centralized in Waremme before being distributed to local warehouses or to end customers around Europe. A crucial issue in the logistic functions is the characteristics of the distribution network (structure), how centralized, respective decentralized, is the distribution
- 3 -
to the market. For a long time a decentralized model was considered more efficient as it results in a close geographical relationship to the local customers, but this decentralized model resulted in increased logistics cost. Discussions turned to the centralized distribution structure, which would reduce the overall logistics cost, though the transportation cost could increase. The case study of MHC could be seen as a tradeoff between a decentralized distribution structure, the current situation, and a centralized distribution structure as a result of the company’s distribution strategy. Each distribution design contains cost benefits and as well as customer service benefits. The aim is to find the most optimal distribution structure that gives the most optimal service level at the lowest possible cost for the company. In our work, the reorganization of a distribution network will be linked to the industrial case MHC. According to Finn Johnsson the CEO of MHC3 "Unexpectedly severe implementation problems with the installation of the new warehouse management system in Waremme led to very extensive supply disruptions, mainly in the Surgical business area, which affected many of our customers in Europe in the spring. The consequence was that we lost substantial supply volumes. The measures to rectify this entailed major costs. The aim of the entire organization is to create conditions for profitable growth. The intention is to create stable growth that exceeds that of the market." From this announcement we understand that in MHC there have known some distribution disrupts, due to restructurings of the central distribution centre, though this might not be the greatest problem for the east European market, as the warehouse structure stayed localized. The challenges in the east European market is regarding the market growth, Hungary growth will be with existing customers to about 80%, in Czech Republic it will be with new customers to about 80%. Hungary spread out over the country, concentrated to major cities. Czech Republic: A certain concentration around Prague, even distribution around the rest of the small to middle size cities. These 3 Johnsson F., 2003.
- 4 -
forecasts are adapted from market research done by MHC. This means that the growth is expected to be rather uniform between the two countries, which put challenge on the current distribution structure in how able it is in handling this growth. To sum up we can say that the biggest concerns (problems) in the East European market for MHC, which owns these problems, are:
• In the current distribution network, goods volumes are rather small and each delivery generally involves broken bulk orders. This is not efficient from the transport point of view.
• When talking about centralizing the distribution network, the aim with such
act is to reduce logistics cost. But this may create new problems related to customer service.
• The new EU member countries implication on the market, opportunities and
threats, and how the current distribution structure is able or not to meet the market changes. These generate several sub-problems as:
o Development of the transportation and warehousing cost, there are
expected cost parameters that will increase in the future. This cost development requires a distribution network that is efficient enough to handle this change.
o Increasing competition as the trade is facilitated in the eastern part of
Europe, which requires good logistics solutions that make the company stay competitive in the market and keep its customers, as well as winning new customers.
- 5 -
o The expected market growth will bring increasing demand and sales, again this put challenge on the current distribution network and how it is able to handle this growth
1.3 Research Question
The problem discussion leads us to the following research question: How could an optimal distribution structure be designed? To solve such a wide research question, the first step is to break it down into several sub-issues.
1. What is the cost associated with any distribution network design?
COST STRUCTURE: The first major sub-problem or task is to analyze the cost parameters. The cost analysis will mainly include the transportation costs as well as the warehousing costs. In the warehousing cost, the computation of such costs is also about carrying costs of the products, ordering costs, handling costs, picking shipping costs, etc.
2. In re-designing the logistics network, where is the ideal location of the
logistics facility?
LOCATION OF LOGISTICS FACILITY: to improve the efficiency of a distribution network, deciding the location of the facilities is a commonly used way. When deciding location, several techniques exist. Most of them regard only the transportation cost. But others factors may be included to decide a location as: political factors, resources, business environment and existing facilities, etc.
- 6 -
3. How flexible could, or must, an optimal distribution network design be?
FLEXIBILITY: When defining an ideal network, the problem has to be seen from a long-term perspective. The evolution of the market has to be taken into consideration as well as the further strategic market moves that MHC foresees.
4. What are the risks associated with any modifications of the distribution
network in terms of logistics customer service?
RISKS OF REDUCED LOGISTICS CUSTOMER SERVICE: by seeing the problem in this way, we have to keep in mind that the customer service is a very dependant value - where it is thorny to be measured in tangible terms. Hence we decided to carry a qualitative risk analysis regarding this concern in order to highlights theses risks.
1.4 Purpose
The purpose of our thesis is to ANALYZE, and after collection and analyzing the required data try to IMPROVE the distribution network efficiency of a growing company, and SUGGEST how to make the material flow smoother more cost efficient. Another requirement is to make it EVOLUTIONARY for the future as much as can be foreseen with regard to potential growth of the market. The company that we will apply our research purpose to is Mölnlycke Health Care AB, and the focus will be on their East European distribution network
1.5 Studied Distribution Structures
We have decided firstly to direct our study into some specific distribution network alternatives. The research we conducted was focused on the distribution network of MHC in east Europe. MHC distributes products through Hungary and the Czech Republic via two warehouses located in Budapest and in Prague. The distribution to seven specific customers in eastern Germany, named DERI, is done
- 7 -
by using a local warehouse with close proximity to the warehouses in Czech and Hungary. In this research we will verify the efficiency of their current network, in term of cost figures, and compare it to other alternatives that could be implemented instead. The structures that we are going to analyze are: The current network: could be seen as the decentralized configuration. Alternative 1: Merge the warehouses in Hungary, the Czech Republic and East Germany and decide the location of the new logistics facility. Alternative 2: Distributing all products from Waremme directly to the end customers in east Europe. This is the centralized alternative.
1.6 Limitations
Regarding the analysis of logistics customer service, we will not perform a detailed logistics customer service level analysis related to the east European market. We will only highlight the risks associated with any modification of the distribution structure from a customer service point of view and by highlighting a case about an earlier project similar to our case. The reason why we limit the service analysis to just highlighting risks is that such detailed customer service analyses require well established communication between three parts: researchers, case study company (MHC), and customers of MHC, which is not possible in current state of affairs. Another reason is that our study is already quite wide-ranging, and adding such wide analysis will result in qualitative diminution of the research in whole, as such detailed customer service analysis requires time and effort, which will affect the other parts of the study. Further limitation includes the method we are going to use when deciding the location of the new logistics facility; this could be done by using different techniques. We will mainly take into consideration the transportation costs when deciding the location. The Gravity Point method is the most accurate model, as it
- 8 -
just takes into account those kinds of costs. Therefore, it will be the methodology we will use when calculating the location of the logistics facility. The result will be, of course, completed by a discussion including other factors that the model does not take into account. Since our study is linked between different currencies such as the Hungarian Forint, Czech Crown, Swedish Crown and Euro, we decided to present all our results in Euro. As during our study period there was no big fluctuation between euro and local currencies, common daily rate change does not affect our final result.
- 9 -
2. Methodology In this chapter we will present the course of actions undertaken during the data
collection part and under the time we carry out our investigation. Additionally we
present alternative methods and motivate the reasons for the research design we
have chosen.
2.1 What is Research Design?
Research design is the methodology that the researcher is going to carry out when performing a specific study. According to Bergqvist and Esping,4 research design refers to the procedural framework within which the research is conducted. “It describes an approach to a problem that can be put into practice in a research program or process, which could be formally defined as an operational framework within which the facts are placed, so that their meaning may be seen more clearly. In other words, the method is a tool used to retrieve new knowledge, i.e., the research plan is the basic plan that guides the data collection and analysis phases of the research project. The framework specifies the type of information to be collected, the sources of data and the data collection procedure.” According to Gill and Johnson,5 there is no best approach, but the most effective approach for the resolution of a given problem depends on a large number of variables, among these variables the nature of the research problem itself. The research design and methodology is a compromise between options that are determined by the availability of resources.
4 Bergqvist R. and Esping P, 2002, p 107 5 Gill J. and Johnson P., 1997, p 1
- 11 -
2.2 Type of Research Design – Quantitative or Qualitative
The research design can be either qualitative or quantitative. It is the research problem that decides if the research will be a qualitative or quantitative research method. And according to Neuman,6 sometimes researchers examining qualitative data can involve quantitative examination in the qualitative data, and vice versa. The quantitative research type has some special characteristics:
• It measures objective facts • Focuses on variables • Independent of context • Involves many cases • Statistical analysis
The variable is a central idea in quantitative research. A variable, according to Neuman,7 is a concept that varies, and the language of quantitative research language of variables and relationships among variables. The analysis in the quantitative research proceeds by using statistics, table, or charts. The characteristics of qualitative data, according to Neuman, are:
• Focus on interactive processes, events • Construct social reality, cultural meaning • Authenticity is key • Values are present and explicit • Few cases, subjects • Thematic analyses
According to Neuman,8 in qualitative research the data is usually to be in form of words, sentences, and paragraphs rather than numbers. Researchers use different research strategies and data collection techniques. The theory in qualitative
6 Neuman W.L., 1997, p 14 7 Ibid, p 107-ff 8 Ibid., p 329
- 12 -
research is often inductive. And the analysis proceeds by extracting themes or generalization from evidence and organizing data to present a coherent, consistent picture. In our research we discussed hard and soft factors; the hard factors are associated with cost variables, which means that the hard factors discussed can be regarded as quantitative research type. The soft factors discussed are regarded as qualitative research and are planted to balance the research against the hard factors. The soft factors are flexibility, customer service risks, and other soft factors while deciding the localization problem.
2.3 Elements of the Research Process
The research process we are going to carry out consists of the following elements:
2.3.1 Research question
The research problem is the starting point of all research, and usually the researcher faces challenges already in this stage. Brannick and Roche9 claim that the research question can relate to:
1. Existing practical business problems where the researchers are looking for improvement of a specific area, or:
2. Theoretical problems that need conceptual clarity for better theory development.
As mentioned earlier, it is the nature of the research question that determines whether the study should be categorized as:
• Exploratory: This type of research used to answer WHAT type questions and is undertaken when one is seeking insight into the general nature of a problem. Here, there is little prior knowledge on which to build, and research hypotheses are either vague or do not exist at all.
9 Brannick T. and Roch W. K., 1997, p 6-ff
- 13 -
• Descriptive: Descriptive research embraces a large proportion of business research and is in use when the questions WHO, WHERE, and WHEN need to be answered. Its purpose is to provide an accurate picture of some aspect of the business environment, here hypothesis will exist but it may be tentative in nature and the relationships studied will not be causal in nature.
• Explanatory/Causal: This type of research answers both HOW and WHY
questions. In causal research it is necessary to show that variables cause or determine the values of other variables. Research hypotheses, which are designed to develop, extend or refute an already established body of knowledge, are integral to this approach. Well formulated research problems usually contain some elements as WHY or HOW. Yin10 states that this types of questions deal with operational links needing to be traced over time, rather than frequencies or incidences.
Our research can be related to an existing practical business problem where we are looking for improvement of a specific area. Our study has an implication of both descriptive and explanatory/causal. It is descriptive this because we are investigating and thereafter clarifying about what is the ideal distribution structure, and this structure could be one that we don’t have prior knowledge and experience about. Before investigating the ideal distribution structure, we have to give a description about the current situation, and from this description build our distribution structure alternatives. The research is explanatory/causal because as we don’t have prior experience about some variables and how they might change, we have to identify the cause and effect of each variable and how they interplay.
10 Yin R. K., 1994, p 6
- 14 -
2.3.2 Methodological strategy
Brannick and Roche11 claim that the majority of business related research projects adopt one of three methodological strategies:
• Experiment: The purpose of such research is usually to detect or confirm causal relationship and to quantify them.
• Survey: A survey approach can be used to carry out exploratory,
descriptive and analytical investigation. Survey information is gathered from individual respondents with some version of a questionnaire.
• Case Based Research (case study): According to Yin,12 a case study forms
the research question with HOW and WHY, it doesn’t requires control over behavioral events, and it focuses on contemporary events.
This type of research is referred to by Brannick and Roche13 as “an empirical enquiry which investigates a contemporary phenomenon within its real life context when boundaries between phenomenon and context are not clearly understood. Multiple sources of evidence are used, allowing for attitudinal, statistical and documentary information to be analyzed and understood within context.” Brannick and Roche claim that case-based research is divided into:
• ethnography, • action research and • case study - hypothetico-deductive approach.
The ethnographic case based research is a naturalistic, inductive mode of inquiry which allows the researcher to use the socially acquired and shared knowledge available to the participants to account for observed patterns of human activity. In the action research, the client chooses the researcher and the study is undertaken to solve specific managerial problems and at same time to contribute to the theory. 11 Brannick T. and Roche W.K., 1997, p 13 12 Yin R.K., 1994, p 6 13 Brannick T. and Roche W.K., 1997, p 13
- 15 -
Both parts identify the problem and agree on goals. The hypothetico-deductive case study can be used to carry out exploratory, descriptive and explanatory investigations. Here the researcher starts with developing a conceptual framework relating to the focus of the research and builds on existing knowledge and theory. The purpose of using case studies in research is to collect and analyze data in the context of some wider theoretical concern, according to Brannick and Roche.14 The empirical data generated by the case study is therefore used with a view to exploring theory and refining theory. Yin15 states that a case study is preferred in examining contemporary events, when the relevant behaviors cannot be manipulated. The case study relies on many of the same techniques as a historical study, but it adds two unique sources of evidence: direct observation and systematic interviewing. The strength of a case study is its ability to deal with a full variety of evidence such as documents, air facts, interviews and observation. Further, Yin also explains why case studies have been viewed as a less desirable form of inquiry than either experiments or surveys that perhaps the greatest concern has been over lack of rigor case study research. Many times the case study investigator has been sloppy and allowed vague evidence or biased views to influence the direction of the findings and conclusions. Another concern about a case study is that it proved little basis for scientific generalization, it is not possible to generalize from a single case. Our aim is to re-examine a distribution structure and highlight improvement examinations by gaining knowledge from selecting theoretical perspective. In order to obtain this goal we use a case study as a methodological strategy, even as a method to obtain more knowledge about this specific field. We are not looking to make a scientific generalization; therefore the generalization issue does not
14 Brannick T. and Roche W. K., 1997, p 99 15 Yin R. K., 1994, pp 8-10
- 16 -
concern the finding of our research. But we are aware of that it is also possible to make some general statements from result of a case study research. And we tried to find generalization pattern in our results.
2.3.3 Theoretical perspective
According to Neuman,16 theory is a system of interconnected abstractions that condenses and organizes knowledge about the social world. Theory is understanding and explanation; this according to Brannick and Roche17 who state that theory is a statement of relations among concepts, within a set of assumptions. The research question begins with a problem definition and theory is a linguistic device used to organize ideas and help to explain or understand the issue under investigation. Theory consists of three components:
• Concepts • Proposition linking these concepts together • Rules for connecting concepts with empirical world (measurement)
2.3.3.1 Inductive versus deductive approach
Neuman18claims that theory can be classified by the direction of reasoning. Researchers approach the building and testing of a theory from two directions. Either abstract thinking, where a researcher logically connects the ideas in the theory to concrete evidence and then tests the ideas against the evidence. Or, beginnings with specific observation of empirical evidence, and on the basis of the evidence generalize and build toward increasingly abstract ideas. In the real world researchers can use both approaches at various points in a study. The deductive (explanation) approach involves the development of a theoretical structure or framework prior to its testing through empirical evidence, according 16 Neuman W. L., 1997, p 37 17 Brannick, T. and Roche W. K., 1997, p 5 18 Neuman W. L., 1997, p 46
- 17 -
to Brannick and Roche,19 Neuman20 says that in a deductive approach, the researcher begins with an abstract, logical relationship among concepts, then move toward concrete empirical evidence. Brannick and Roche state that in the inductive theory, the researcher ideally enters the research site with few or no theoretical preconceptions. According to Neuman, in the inductive approach the researcher begins with detailed observations of the world and moves toward more abstract generalizations and ideas. Initially the researcher has a topic and a few vague concepts, and as the researchers conduct observation they refine the concepts and develop empirical generalization, as well as identify preliminary relationships. Basically, the researcher builds the theory from the ground up. In our research, we lean more toward the deductive approach. When we entered the research we already had theoretical preconceptions, and we did not do any pre-study. Therefore, an inductive approach is not of interest to us.
2.3.4 Data collection approach
The choice of the data collection method is a critical issue in the research process, and according to Brannick and Roch,21 the nature of the research question, the methodological strategy and the theoretical approach all influence the researcher’s choice of data collection methods. The source of data can be categorized as primary or secondary. Thus we highlight the implications of both sources and the different data collection methods for each data category.
19 Brannick T. and Roch W. K., 1997, p 5-f 20 Neuman W. L., 1997, p 46 21 Brannick T. and Roch W. K., 1997, pp 16-26, used for whole section
- 18 -
2.3.4.1 Primary data
Primary data collection methods are devised and controlled by the researcher, individual respondents and focus groups whose views are required either in a structured or unstructured manner. Primary data can be collected through two methods:
• Questionnaires: Questionnaires can be sent or asked during a personal interview when the researcher knows exactly what information is required and how to measure the variable of interest.
• Observation: It is possible to collect primary data by observing people in their natural environment or in a laboratory setting.
There are two types of questionnaires, a structured questionnaire and unstructured questionnaire. The structured questionnaire has three types of response formats:
• Open-ended format: here the respondent is free to give any reply that seems appropriate within the limits of the question.
• Multiple-choice response: Here the respondent must select from among three or more pre-specified responses.
• Dichotomous response: Is a type of multiple choice response and allow yes or no answers.
In the unstructured questionnaires interviews can be conducted with individuals or group. There are two types of unstructured interviews:
• The individual in-depth interviews: This type of interview is very demanding and its quality depends on the skill of the interviewer. Here, there is no group interaction and the stimulation for new ideas comes from the interviewer. The respondent’s idea is less likely to be challenged, but there is more time to obtain detailed information.
• Focus group interviews: Here the emphasis is on the result of group
interaction when specific topics are introduced by a group facilitator. Here,
- 19 -
the respondent’s ideas are likely to be challenged, and there is less time to obtain detailed information.
In the research we carried out, we used both primary and secondary data collection methods. In the primary data collection methods, we use an unstructured interview questionnaire, so-called individual in-depth interviews. We do not perform any kind of observation.
2.3.4.2 Secondary data
Data that is already collected and not devised or controlled by the researcher, such as company records, government statistics or previous surveys, are examples of secondary data. This type of data was developed for some purpose other than helping to solve the research question at hand. This data must be evaluated on the basis of relevance to the research question. Secondary data can be gathered from data banks, written materials, documents, and reports. The secondary data we use includes hard figures already gathered by the case study company and is used for a purpose other than our research. The primary and secondary data that have been collected do not occur as direct references; they have basically served to help us to form a general picture of the topic and the problem.
2.3.4.3 Collecting data in a case study
Data collection for case studies cans rely on many sources of evidence. As Yin22 claims, there are six important ones: documentation, archival records, interviews, direct observation, participant observation, and physical airfacts. Below we present more detailed information about each source of evidence that is related to our research:
22 Yin R. K., 1994, pp 78-90
- 20 -
1. Documentation: The strength with this source of evidence is that it can be reviewed repeatedly and have broad coverage. For case studies, the most important use of a document is to corroborate and augment evidence from other sources.
2. Archival records: For many case studies, archival records are often in computerized form; the strength of it is that it is often precise and quantitative. It can appear in service records, organizational records, map and charts, and survey data.
3. Interviews: The interviews may take several forms. Most commonly, case study interviews are open-ended-nature, in which the researcher can ask the respondents for the facts of a matter as well as for the respondent’s opinions.
2.3.5 Data analysis and interpreting
The purpose of data analysis is to describe and explain the inner working of some phenomenon and according to Brannick and Roche,23 theory should guide the analyses because some level of theory is embedded in both the process of description and explanation. In the analyses, it is important to differentiate between description and explanation, as the distinction between these concepts is unclear. Neuman24 claims that it is best to make theories and concepts explicit, because without an analytic interpretation or theory provided by the researcher the readers of qualitative research may use their own everyday taken-for-granted ideas. In our analysis stage, we try to present an explanation by relating theory to a practical case. The analysis is built on the collected and interpreted data, and generates a result that might contain uncertainty; as such a study requires assumptions when collected data is not sufficient evidence.
23 Brannick T. and Roch W.K., 1997, p 25 24 Neuman W. L., 1997, p 421
- 21 -
2.3.5.1 Uncertainties in our study
Our study is based on cost measurements. In any measurements result an error. Due to the tools used to measure or to quantify and due to the measurement itself. To make our work with a scientific exactness, we used modern engineered statistics methods. Those techniques were mostly applied during the work we did on computer while analyzing data we get from the companies; work that is not explained in detail in the thesis manuscript. This because of the space it may take to detail all operation. But for more information about statistics laws, we advice the reader to refer a very good book: “Modern Engineering Statistics”25. Uncertainties can also be carried on while doing computations on figures that are uncertain themselves. While adding or multiplying figures uncertainties of figures have to be taken into account. One common mistake is name the error of the Stadium. For instance, an announced said there was 30,000 spectators in a stadium viewing a football match. A “statistic novice” may say: “30,000 spectators plus the two teams of 11 players, then there was 30,022 persons that night in the stadium.” This is wrong, because the population is announced with an uncertainty –about 1,000 or 5,000– superior of 22. Hence it is non-sense to add those 22 players to the previous population. More or less it becomes sensible to write 30,000 + 22 = 30,000! This short example tries to make the reader aware of the common mistake done in science. We had taken care of this kind of errors all our study long.
2.3.6 Conclusions
This part is the end of the research, the quality of the conclusion will depend on approaches discussed earlier in this chapter, from identifying research question to analysis of collected data related to the theoretical perspective. To summarize, all stages discussed above can be presented in the following figure: 25 Lapin L., 1997.
- 22 -
Figure 2-1 : The Research Process, Source: authors
-Identify the research problem: Descriptive research
Explanatory/causal research
Selecting methodological approach: Case Study
2.4 Research Evaluation
It is important when collecting data and when interpreting the collected data to argue for trustworthiness in the data transformed to information. The researcher has to prove that the information is not built on preconceived assumptions. Reliability and validity are central issues when discussing the credibility of a study. The validity of any research, according to Davidson and Patel,26 means that the researcher wants to prove that the investigation in progress is what is obtained to be investigated. Neuman27 says that validity is the degree of fit between a construct and indicators of it. It refers to how well the conceptual and operational definitions mesh with each other, and the better the fit the greater the measurement validity.
26 Davidson B. and Patel R., 2003, p 98 27 Neuman W. L., 1997, p 141
-Conclusion and suggestions of improvements
-Highlight the theoretical -Data collection approach Perspective: -Transforming data into structured
information Deductive approach Primary data from interviews
-Analyzing the current situation and alternative solutions
Secondary data from documents and company reports
- 23 -
According to Gill and Johnson,28 when it comes to the validity of any research findings, it is possible to distil four criteria that might be used in evaluation.
1. Internal validity: The criterion refers to whether or not what is identified as the causes or stimuli actually produced what have been interpreted as the effect or responses.
2. External validity: Generally this criterion refers to the extent to which any research findings can be generalized or extrapolated beyond the immediate research sample or setting in which the research took place. The matter of external validity often subdivided into the following: a) Population validity b) Ecological c) Reliability
On the other hand, reliability means that the researcher tries to prove that the investigation is done in a dependable way. Neuman29 claims that reliability means that the information provided by indicators (example questionnaire) does not vary as a result of characteristics of the indicator, instrument, or measurement device itself. It deals with the indicator’s dependability. Gill and Johnson claim30 that reliability refers to the consistency of results obtained in research. To satisfy this criterion, it should be possible for another researcher to replicate the original research using the same subjects and the same research design under the same conditions. There are four principles to increase the reliability:
• Clearly conceptualize all construct: This means developing unmistakable clear theoretical definitions.
• Use a precise level of measurement: This means be more specific with the measurement.
28 Gill J. and Johnson P., 1997, p 128 29 Neuman W. L., 1997, pp 138-140 30 Gill J. and Johnson P., 1997, p 128
- 24 -
• Use multiple indicators: Two or more indicators of the same construct are better than one.
• Use pilot tests: Pre-testing takes time and effort but is likely to produce reliable measures.
In order to improve the reliability in our research, we interviewed respondents with different tasks and positions in the case study company, but in order to control the reliability we interviewed persons who have similar tasks to make sure that the information doesn’t affects by personal perceptions or attitudes. As our research relies on information from the interviews, it is important to investigate the validity in the interview answers; this is done by comparing the information gathered from personal interviews with the information collected from documents and reports, and also by double checking the information with different personal sources. In the qualitative part of our research, the validity and reliability of the data might be affected negatively if the respondents do not have enough time for answering questions and answer under a time pressure. Therefore, we focus on well-structured interview sessions where the respondents have received the questions a good time in advance.
- 25 -
3. Theory This chapter will give the reader a broad preface to the theories, terms, and concepts that are discussed in this thesis. This chapter starts with a general background about business logistics and related glossary. Then comes the part describing the logistics customer service, followed by discussion related to centralization and decentralization issues. Next are described logistics cost drivers in warehousing and transportation, and thereafter are detailed inventory cost constituents. The last part of the theory chapter is dedicated to the localization of the logistics facilities.
3.1 Introduction to Business Logistics
Business logistics is the broad concept that all terms discussed in this theoretical framework can be linked to. Below we give the reader a short overall view of what this concept means and why it is related to our research. According to Vogt et al.,31 logistics in the business world have developed fast in the last twenty years, the logistics managers have a much wider and more complex position in the business world than before. The business logistics is, as mentioned previously, is a wide subject that might include the following functions:
• Information System • Customer (marketing) • Raw material acquirement • Transportation: air, rail, road, sea • Warehousing • Packaging • Purchasing
31 Vogt J. J. et al., 2002, p 4
- 27 -
There are several definitions of what business logistics are. Vogt et al.32 gives a definition applied from the Council of Logistics Management: “Logistics is the process of planning, implementing and controlling the efficient, effective flow and storage of goods, services, and related information from the point-of-origin to point-of-consumption for the purpose of conforming to customer requirements.” Christopher33 gives the following definition of business logistics: “Logistics is the process of strategically managing the procurement, movement and storage of materials, part and finished inventory (and the related information flows) through the organization and its marketing channels in such a way that the current and future profitability are maximized through the cost-effective fulfillment of orders.” From the definitions above, business logistics can be seen as a process of planning purchasing, storing, and managing the flow of material to the market. There are tools that are used in order to fulfill this process in an optimal way in order to maximize the profit. An example of these tools is the information system. The definitions above concur to what Vogt et al. call the functions in business logistics; most of these functions are mentioned in the different definitions of business logistics.
3.1.1 Hub glossary
There are many different types of storing facilities ranging from a terminal in a harbor to a large distribution center where finished goods are accumulated and sent to a store or customer. This part will present definitions of different hub terminologies starting with the different type of inventories. There are several opinions as to why companies should keep inventory, Lumsden34 says that the existence of warehouses can be a sign that a function is not stable enough. An inventory is created to give internal security to the company 32 Vogt J. J. et al., 2002, p 6 33 Christopher M., 1998, p 4 34 Lumsden K. R., 2003, p 167-ff
- 28 -
headed for disturbance in the material flow. Lumsden states building an inventory in the need for high functional guarantee and that the customers should have access to articles whenever they need them. As Lumsden suggests, a good way to define the different types of inventories is to start from its function within the company. Below, we present several functions of inventory. Cycle stock: Is used to weight the set-up costs of manufacturing against the costs on interest related to keeping an inventory for manufacturing in batches. Safety stock: Is used to make sure that disruptions and variations in demand and deliveries do not cause shortages, delivery readiness is required in uncertain surroundings. Market stock: As a company performs any activity in connection to marketing or introduction of new products, the demand increases temporarily. The inventory created will supply this demand. Speculation stock: In cases when it is difficult to predict the market in term of supply and demand elements, pricing and supply variation, companies create storage to face this. Cross-Docking terminals Cross-docking means that a large incoming goods consignment is split up into a number of outgoing consignments. This process involves scheduling of the corresponding incoming and outgoing transport in a maximum time of 24 hours. This means that the goods are never put into storage, but pass directly through the terminal. A requirement for a cross-docking system to function is that the information system must be well developed.
- 29 -
Split point and co-loading point terminals A co-loading point is a point where goods arrive from a number of different points, and the goods are coordinated in a transport relation with one direction. A split point is the opposite of a gathering point, but follows the same logical sequence. In this case, goods arrive from one transport relation, which is then split up to a number of relations.
Co-loading point Split point
Figure 3-1 : Split Point and Co-loading Point, Source: Lumsden, p 402. Hub and spoke terminals This concept originates from the discharger’s need of frequent deliveries. The idea behind this terminal system is not to differentiate between producer and consumers but treat all in the same way. This means that each point in the distribution area has demands on the incoming as well as the outgoing deliveries. Goods arrive from all the different distribution points to the central unit and can in principle arrive at any time, but no consignment can leave the terminal until all the incoming consignments have arrived. Here the goods are unloaded, sorted and possibly stored in order to be further processes, after which it is again loaded with other goods for final transport to the consignee. The advantage with this system is the fact that it results in frequent transports for the discharger and in high filling rate for the forwarder. This is due
- 30 -
to the reduced number of necessary transport relations and the consolidation with other goods in the hub. Satellite units-distributing terminals A satellite unit is a type of hub network, these points or units are formed as terminals, either for co-loading goods or for split load-carrying units (split point). This system gives the customer frequent deliveries to a number of final destinations. The advantage for the transporter is that he can create co-loading early in the transport chain without the transport buyer seeing any disadvantage.
3.1.2 Transport glossary
When it comes to transport activities, it is not rare to see different terms pointing at the same concept. On the other hand, a reader may see a term pointing differently. Hence, we think it is important to explain to the reader the transportation terms we will use during this thesis, this in order to avoid any misunderstanding. The following definitions are adapted from Coyle:35
Transportation: Transportation can be defined as the act of moving goods or people from an origin to a required destination. It also includes the creation of time and place utilities. Lead Time: This is the time taken from receipt of customer order through to delivery.36
Freight flows It is the geographic direction in which freight flows or moves from producing locations to areas of consumption.
35 Coyle J. J., et al., pp 486-493 36 Christopher M., 1998, p 157
- 31 -
Freight transport: Represents the movement of goods or products from the producer or manufacturer to the user or customer. Head haul: Is the first half of a round-trip move from origin to destination: The opposite is “back haul”, which is the return of the equipment to its origin point. Line-haul: The line-haul is defined as the segment of the trip that happens after a consolidation stage, while the trucks are filled as much as possible. Less-than-truckload (LTL): On the opposite when a truck cannot be fully loaded, the devoted term for that phenomenon is Less-Than-Truckload. Less-Than-Truckload carriers provide service to shippers who tender shipments lower than the minimum truckload quantities. Truckload TL According to Coyle et al.,37 “The truckload carrier provides service to shippers who tender sufficient volume to meet the minimum weights required for a truckload shipment and truckload rate or will pay the required amount.” Third-party logistics provider (3PL): Third party logistics providers are commonly classified as being either asset- or non-asset-based, the distinction being that asset-based firms own and operate transportation equipment and warehousing buildings. In contrast, non-asset service firms specialize in providing comprehensive information services that facilitate supply chain arrangement.
37 Coyle J. J., et al., p 99
- 32 -
3.2 The Background of Logistics Service
The distribution service is the essence of customer service, Christopher38 states that if the role of customer service is to provide time and place utility, then this value is created through the transportation of goods, or precisely when the transportation ends at the customer. This means that the logistics function contains several value added activities.
3.2.1 What is logistics service quality?
Coyle et al.39 define a good logistics service quality as the moment when value is created for the logistics customer, the creation of value means that the customer has perceived that the supplier has met the expectations and achieved quality. The customer perception acts as a filter to the output of logistics services. In many cases, the provided logistics service is affected by the perceptions of the service provider, for example a logistics manager will deliver those services in agreement with what they think the customer wants. On the other hand if the logistics service provider’s perceptions differ from the customer’s perceptions, then a quality gap is created.
3.2.2 Logistics service indicators
In order to measure the logistics customer service, there are several indicators that are widely used in companies. The most common indicators are as follows: -Order Cycle Time The elapsed time from customer order to delivery.
38 Christopher M., 1998, p 49-ff 39 Coyle J. J. et al., 2000, p 14
- 33 -
-Stock Availability The percentage of demand for a given line item that can be met from available inventory. -Frequency of Delivery How many deliveries within a specific time-window. -Delivery Reliability Proportion of total orders is delivered on time; this indicator is not just reflecting the delivery performance but also the stock availability and order processing performance. -Order Completeness What proportion of orders do the company deliver complete, this means no backorders or part shipments?
3.2.3 Managing logistics service internationally
Giving the definition of logistics service is even a harder task when it is a question of a cross border customers, different requirements due to different national cultures means that a standard definition of logistics service is not possible. Mentzer et al.40 state that the logistics service offering of a company will differ depending on the characteristics of the market. They claims that logistics offerings are subject to culturally influenced preferences, which are widespread internationally. The logistics service is more likely to be different for different market segments, since service expectations differ across national and cultural boundaries.
40 Mentzer J.T. et al., 2004, p 15-ff
- 34 -
3.2.4 How to apply a customer service driven logistics system
Christopher41 suggests that the market place is the most effective starting point for logistics system design, meaning that the companies must understand the service needs of the various markets that they address and then seek to develop low cost logistics solutions. After understanding the requirements from the market, the logistics service level can be identified. It is known that logistics service quality is a wide concept. No company can apply all elements in the concept and therefore the definition of what logistics service quality is will differ from one case to another. Christopher created a structured working process for designing the logistics strategies, which are customer focused.
1 - Identify Customers’ service needs
2 - Define customer service objectives
3 - Design the logistics system
Figure 3-2 : Process of Designing a Logistics System, Source: adapted from Christopher (1998, p 48). Korpela et al.42 claim that when companies are creating or restructuring an international distribution network design, a customer service based approach is usually not proposed. The more widely used approaches for logistics network design are the minimization of cost and maximization of profit. Korpela et al.
41 Christopher M., 1998, pp 47-60 42 Korpela J. et al., 2001, p 195
- 35 -
present a process for logistics network design that is driven by customer service parameters, with five basics steps:
1. Defining the problem: Defining the decision problem by, for example, stating the objectives, and determining the scope of the problem in terms such as alternative transportation modes and routes.
2. Determining the strategic importance of the customers: This involves
analyzing the strategic importance of the customers affected by the logistics network design process. As the design of the network is based on the customer service preferences of the customers, the strategic importance of the customers is an important input to the design process.
3. Analyzing the customers’ preferences for customer service: Each customer
evaluates separately the importance of the different service elements, from their point of view.
4. Evaluating the alternative nodes and links in the logistics network: The
network includes the transportation routes, warehouse operators and haulers. The evaluation is based on the preferences defined in the previous phase for the different customer service elements. The preferences are weighted by the strategic importance of the customers in the combination process to take into account the differences in the strategic importance of the customers.
5. Optimization: The final phase in the proposed approach involves optimizing
the logistics network based on the priorities defined in the previous phase. As the priority that is defined for each alternative link and node represents the evaluated capability of fulfilling the customer service requirements, the objective function for the optimization is to maximize the overall priority of the logistics network, subject to relevant constraints and restrictions.
- 36 -
3.3 Centralization and Decentralization of the Distribution
Network
This section will highlight the dilemma of decentralization respective decentralization of the distribution network, this from several researcher’s points of view. Abrahamsson presents two models of structuring the distribution network, he calls these models the decentralized model and the centralized model.
Decentralized Model Centralized Model
Central warehouse
C U S T OME R S
Central warehou
Central warehouse
Local warehouse Regional
warehouse
C U S T OME R S
Figure 3-3 : New Versus Old Distribution Structure, Source: adapted from Abrahamsson (1992, p 2)
3.3.1 The centralized model
According to Abrahamsson,43 what the centralized model provides is a separation of the physical distribution and the sales activities, the physical distribution was centralized into just including one central distribution center in one market, where the deliveries go directly from the central DC to the customers. The sales activities are still decentralized for the best market contact, and the communication with the
43 Abrahamsson M., 1992, p 3
- 37 -
central DC and the local sales function is through an integrated information system. The trend toward centralization of the distribution structure is an ongoing trend; Mattsson claims that a study made by the European Logistics Consultant showed that 90% of the analyzed enterprises were on the way to reorganize their distribution structure toward a centralized one. Mattsson44 highlights the benefits of the centralized distribution structure in the form of economy of scale. First, with a centralized structure the material flow will be larger in the centralized storing units, enabling the organization to invest in more efficient automated warehouses and handling systems, and thereby reduce the handling cost in these storing units. Second, the centralized distribution structure means that in order to obtain a specific service level that will require a lower safety stock. If a company wants to obtain the same specific service level within a hierarchal distribution structure, this will mean that company has to keep a higher safety stock. This is illustrated in the figure that follows.
44 Mattsson S.-A., 2002, p 247
- 38 -
Service level Service Level
Centralized distribution structure
Decentralized distribution structure
Figure 3-4 : Relation Between Service Level and Stock Level Within Centralized and Decentralized Distribution Structure, Adapted from Mattsson (2002, p 248)
Stock levelStock Level
Abrahamsson45 has identified some positive results of the centralization process:
• Decreased variable costs, as there will be lower tied up capital. • Decreased fixed costs, as the cost for labor and stock will be eliminated. • Increased integration in the form of centralized information flow. • Shorter lead-time to the market, because the administrative lead-time is
clearly decreased. • Increased delivery accuracy. • Even if the transportation cost increases, this will be balanced in that the
stock level in the central warehouse will not increase to a big extent. The turnover of the central warehouse will instead increase.
The disadvantage with such a structure is that more orders will be handled through the central storing unit, and the transportation from the central unit will be more frequent. Abrahamsson46 found the centralization process a bit complicated,
45 Abrahamsson M., 1992, p 220-ff 46 Ibid, p 224
- 39 -
requiring a well integrated information system, and this kind of information system is often a very costly investment which small and middle size companies cannot afford.
3.3.2 The decentralized model
Mattsson47 believes that it is, in some cases, crucial to use a hierarchal distribution system, with several levels of warehouses. One of the advantages with what Mattsson calls the hierarchal distribution structure (decentralized distribution) is the nearness to the end customer, which is crucial for products requiring secure and short delivery. Another aspect is the transportation cost; Mattson states that if the transportation cost is high related to the value of the product then a hierarchal distribution structure is the optimal solution. Even a rapid, small and frequent purchase from customers proposes a hierarchal distribution structure.
3.3.2.1 Demand variations as negative result of decentralization
When discussing the reasons behind demand variation, Mattsson48 calls it the result of the hierarchal distribution structure (decentralized distribution structure). This phenomenon is called the cascade effect. One of the reasons behind the cascade effect is that a decentralized distribution structure might result in several calculations of the economic order quantity (EOQ) at each warehouse level; the calculation of EOQ at several levels generates this demand variation.
47 Mattsson S.-A., 2002, p 246 48 Mattsson S.-A., 1999, p 28
- 40 -
Variation generated by the decentralized distribution system Real Demand Variation
Figure 3-5 : Comparison Between Real Demand Variation and Variation Caused by the Distribution Structure, Adapted from Mattsson (1999, p 28) Nevertheless, Mattsson claims that there is no best structure to follow when deciding the level of centralization. The most optimal centralization level is a situation specific question, and it is the market situation and the character of the product that determine how the distribution structure should look. This means that even in the same company, there might be different distribution structures for different kind of products, and off course for different markets.
3.3.3 Overview of pan European logistics trends
The 1st May 2004, ten new members were admitted into the European Union. This has lead companies and government to review their logistics policy. The introduction of a new road toll (“LKW Maut”) for heavy truck by the German state is one of the most important features in the new deal. After a first postponement due to technical problems, the system should be operational in the early 2005.49 We will not detail the practical details of this new regulation; we can broadly explain that heavy trucks driving through will be charge according to the 49 CNT, Bulletin of the Observatory on Transport Policies and Strategies in Europe, 2004, p 1
- 41 -
distance they had done within the country. And globally fees are expected to be more expensive than what they are currently. Those actions had been taken by the government in order to tackle the nuisances occurred by heavy truck traffic. Indeed Germany is located and a central point of Europe, between eastern (Hungary Czech Republic) and western (France, UK) Europe, and between northern (Scandinavia, Holland) and southern (Italy) Europe. The intensification of material flow between those areas intensifies the traffic and then the nuisance within Germany. Even if we do not know how the market will adapt itself to the new regulations,
he European Commission in its White Paper52 stressed also the fact that global
he previous discussion explaining the balance between centralization and decentralization has to be seen with new parameters of the European Business, as road toll in Germany.
some forecasts exist. One interesting and comprehensive study on this topic has been done by Prologis50. “The vast majority of the European “pioneers” have opened country specific distribution centers to handle their Central European operations. Although many 3PLs, if given the choice, would have preferred to accommodate those operations from an existing DC in Western Europe, the lengthy travel times caused by Central Europe’s inadequate motorway networks usually rule this out as an option. However, with the elimination of borders within Central Europe, many 3PLs are exploring the possibility of setting up distribution centers in strategic locations where they could serve the entire region.”51 This is the general trend expected by the experts. But any logistics strategic decision is a question of trade-off (volume, profitability, etc.) and may vary from business to business. Tpolicy should be undertaken to unblock the transport bottlenecks in Europe, as Germany for instance. T
50 Prologis, Impact of EU Expansion on Europe’s Warehouse Markets, 2004 51 Ibid, p 11 52 European Commission, White Paper, 2001, p 50
- 42 -
3.4 Logistics Cost Drivers
According to how the problem was broken down into several sub-issues, it is clear that cost will be one of the most important decision criteria to evaluate to compare the different alternatives of logistic network design
t cost will be given. We try to ive examples related to the logistics field.
When it comes to costs in general, and logistics costs in our case, it is possible to
hey are the costs that will not change according to the volume of the activity, or that will not change according to the volume of activity within a given range (should be pretty large).
ts
e warehouse will not change depending on the volume of
irect costs are the costs that can be allocated to a particular product.
3.4.1 Costs glossary
First, a description of the different ways of looking ag
classify the costs into different methods according to Harrison and Remko:53
3.4.1.1 Fixed/variable
Fixed Costs T
Variable CosThey are the costs that change according to the volume of activity. For instance the rent of a warehouse is a fixed cost. Except if a company needed a bigger warehouse, the rent of ththe goods it can handle. The fuel expense, for example, is a variable cost. It is directly related to the number of kilometers travelled.
3.4.1.2 Direct/indirect
Direct Costs D
53 Harrison and Remko, 2002, pp 56-65
- 43 -
Indare everything that is left after having allocated the direct costs.
Let’s say a ompany produces mousse equipment for computers; the amount of plastic used
sing is precisely known. Then it is very easy to allocate the cost of the
eeded. Some common pitfalls could be to think that indirect osts are fixed, and that variable costs are direct. But it is not true. There is no
ngineered costs have a clear input-output relationship. If it takes one day for a company to produce a container, the input-output relationship is clear. The input is on container.
ar, but the benefit is difficult to
irect Indirect costs With an example, given by Harrison and Remko, it will be clearer.cfor the caplastic needed to produce a mouse. On the other hand, the rent of a warehouse will be an indirect cost. The aim of this approach is to know which costs can be allocated to a given product. Directness of the costs helps firms to understand the full cost of a product when one more is ncevident relationship.
3.4.1.3 Engineered/discretionary
Engineered Costs E
e-day of work and the output is oneDiscretionary Discretionary costs are costs that don’t have any clear input-output relationship. According to Harrison and Remko,54 one example could be the cost of a contract cleaner. The cost to make the factory clean is clequantify. And we can see how it is possible to cut the total cost cube.
54 Harrison and Remko, 2002, p 63
- 44 -
Figure 3-6 : The Total Cost Cube. Source : Harrison and Remko, 2002, p 57
Direct Indirect
Engineered
Discretionary
Variable
Fixed
3.4.2 Cost drivers
efinition:D Costs drivers could be seen as any FACTOR or ACTIVITY that
hile looking at the cost structure of a business, it is very important to know
sually cost drivers can be split into two different categories: n, or caused, by the
• s are not directly related to
causes costs to be incurred.55
Wthose factors or activities in order to understand the cost structure, but also in order to be able to forecast the business. U
• Volume-based cost drivers: Assumes all costs are drivevolume of production (or sales). This category is pretty close to the variable costs, defined in the glossary of the costs. Non-volume-based cost drivers: Costproduction volume.
55 Graham P, 1999.
- 45 -
The Activity-Based Costing methodology, according to Cooper,56 classifies costs into four categories:
1) Unit level: Related to activities performed each time a unit is produced; 2) Batch level: Related to activities performed for a group of product units,
such as batch or a delivery load. 3) Product level: Related to activities performed as needed to support the
production of each different type of product. 4) Facility level: Costs incurred to support the whole business.
According to Hicks,57 since a cost driver is “a factor used to measure how a cost is incurred and/or how best to charge the cost to activities or products,” cost drivers change from case to case, from business to business. Thus there is no list available that can tell us what the cost drivers within a logistics scope are. Only using common sense is useful to analyze the cost drivers.
3.4.2.1 Cost drivers in transport activities:
Once the definition is given, we can give some examples of cost drivers in the transport industry. They are here to give an idea to the reader about what cost driver could be, but the pricing in transportation business will be detailed in a separate part (see below). Examples of cost drivers related to transportation activities are:
• Volume of goods carried • Weight of goods carried • Distance over which the goods are carried • Number of deliveries • Labor hours
56 Cooper, R., 1990, p 6 57 Hicks D. T., 1992, p 37
- 46 -
3.4.2.2 Cost drivers in warehousing activities:
Cost drivers in warehousing activities can be detailed in six general activities that studies have identified as occurrences in a warehouse. ACTIVITY Description RECEIVING Unload the vehicle.
Check that products are not damaged. PUT-AWAY Location for product is identified and inventory
records are updated. STORAGE Products are physically stored. ORDER PICKING Products are retrieved from storage. Inventory records
are updated. PACKING, MAKING AND STAGING
Products are appropriately packaged, labeled, and placed on loading docks for shipment.
SHIPPING Load vehicle. Bill of lading and notification of shipment prepared.
Table 3-1 : The Six General Activities in Warehouses, Source: Adapted Ernst and Whinney, 1985, p29 One example can be given when it comes to analyze the cost drivers of the storage activity. From a case study by Roth et al.,58 the rent for the storage activity may be based on costs incurred for the warehouse. According to the hierarchy given by Cooper,59 it belongs to the facility level. For example to determine the monthly fee for a particular customer, the criteria that came naturally in mind is the volume used in the warehouse by this customer. In that case it may be the number of pallets stored.
58 Roth H. P. et al., 1991, p 43 59 Cooper R., 1990, p 6
- 47 -
3.5 Inventory Cost Constituents
Inventories cost computation is an important part of the logistics network design. Thus, we present a broad background about inventory cost aspects.
3.5.1 Base inventory
Base inventory relates to inventory of the raw material needed to manufacture products. The base inventory does not change because it only depends on the amount of products pulled by the customer need, the logistics network design.60
3.5.2 Transit inventory
Transit inventory is inventory that is captive in transportation vehicles. This is directly dependent on the design of the logistics network. As the base inventory will not change according to the logistics network, in order to compute the average in-transit inventory we use the following formula:61
( ) ( ) ( ) l==
×2InventoryTransit
2Sales Average ForecastedDuration Cycle ePerformanc
l : Average in-transit inventory. In the computation, we divide the transit inventory by two because we assume that most of the trucks are empty for half of the time: they go full one-way and are empty the other part of the time. And even if there are trucks used for reverse logistics, they don’t carry any inventory. Then, the average inventory value in warehouses is given by the following formula:
60 Bowersox D. J. et al., 2002, p 458 61 Ibid, p 459
- 48 -
StockSafetyQStockSafetyQTime
AverageI 2
+=+= ∫
The first term of the addition is the cycle inventory; the second one is the safety stock.
3.5.3 Cycle inventory
The cycle stock is the average value that you handle in your inventory while excluding the safety stock. If a company orders Q, for a period T, during that time the average value is the half of the quantity ordered divided by two, as shown in the following figure:
Figure 3-7 : Ordering Quantity and Safety Stock, Sources: Authors
Order Quantity (Q)
Safety stock
Days 10 30 20
The average cycle stock (stock held without the safety stock) is the area under the upper line, which is give by the following formula: Q*T/2, where T is the time period, here 10 days.
- 49 -
3.5.4 Safety stock inventory
The safety stock is a way to set the customer service. The more companies want their product availability to increase, the higher they maintain their safety stock. The safety stock is a buffer to avoid a shortage of products. One main rule when it comes to network design is that the more warehouses companies have in their network, the more safety stock they handle. The justification can be shown with the following table: Unit Sales per Market
Table 3-2 : Summary of Sales in One Combined and Three Separate Markets, Source: Bowersox, D. J., et al., 2002, pp 460-461
And then we understand that the safety stock has to be buffer a for a variation of 8 in the case of the central warehouse, and has to buffer a potential variation of 4+3+4=11 in the decentralized alternative. This is a proof of what theory claims: the more decentralized the network is; the more safety stock is handled.
- 50 -
3.5.5 Carrying expense
According to Bowersox,62 the “inventory carrying cost is the expense associated with maintaining inventory. Inventory expense is calculated by multiplying annual inventory carrying cost percent by average inventory value. Standard accounting practice is to value inventory at purchase or standard manufacturing cost rather than at selling price.” Inventory expense = (Annual inventory carrying costing in %) x (average inventory value) This is a very simple and basic way to determine the inventory carrying cost. The main difficulty is to determine the correct carrying cost percentage. To determine it, the investigation should consider all the costs related to the inventory. Bowersox63 gives a list of criteria that has to be detailed while determining the inventory carrying cost percentage:
To compute the average inventory value, we should first look at the kind of inventory that is in the distribution pipeline. All types of inventory that a company could handle include the four inventories we detailed in the previous points (base inventory, transit inventory, cycle inventory, and safety stock). To compute the carrying expense, all inventory has to be summed up. When it comes to comparing the way of summing up the inventory 62 Bowersox D. J. et al., 2002, p 289 63 Ibid, pp 289-291
- 51 -
we could say that it varies from case to case. But one general statement that we would like to outline is that in most of the cases, the safety stock is predominant on the inventory in-transit. A chart of the characteristic is shown below.
Figure 3-8 : Average Inventory as a Function of Warehouse Locations, Source: Bowersox D. J. et al., 2002, p 462
Average inventory
Average Inventory
Average safety stock
Average transit inventory
Network Location (Number of warehouses increasing)
3.5.6 Total cost integration
After having detailed the costs, the second move is to synthesize the analysis. The step is commonly named the TOTAL COST INTEGRATION. In logistics, economic forces determine the most appropriate network for a firm. The cost integration has to include both transportation costs and inventory costs. A simple approach can be seen in the following two dimensions chart below.
- 52 -
Figure 3-9 : Least Total Cost Network, Source: Bowersox D. J. et al., 2002, p 463
Total Network Cost
Total Cost Total inventory costs
Total transportation cost
1 2 3 4 5 76
Number of warehouses within the network
We can notice on this diagram that the minimum cost of the total network is between 3 and 4 warehouses, and the minimum for the transportation cost is between 4 and 5. To add the inventory cost and transportation cost is a pretty simple, realistic and efficient approach. The model can be made more complex according to other parameters such as the location of the warehouses, the shipment size or the transport alternative. Other parameters that can be taken into account are, for instance, the back-order costs.
- 53 -
3.6 Localization of Logistics Facility
Facility location is a critical aspect of the strategic planning of network design whether it is about positioning a manufacturing site or warehouse facility; decision-makers are often challenged by difficult spatial resource allocation decisions. In this part we will highlight the localization issue; we present a method called gravity point calculation, which helps to decide location of logistics facilities. Further we discuss the aspects that the gravity method does not take into account, so-called soft factors.
3.6.1 Gravity point methodology
3.6.1.1 What is the gravity point methodology?
The “gravity point” is a methodology that aims to find a location of a warehouse while minimizing the transportation or transportation cost. This is a pure analytical analysis. The simplest case could be defined with the following assumptions: • The aim is to find the localization of a warehouse that will distribute to N
customers. • The demand of the customers is Dci. The demand is expressed in volume or in
kilograms, or in other units. • The customers should be localized on a coordinated system (Xci,Yci). These are the minimum requirements to start the computation to find a warehouse. But according to the assumptions of the study, several cases can be described. Among the Lumsden64 classification, we detailed below only the cases that are adapted to our case.
64 Lumsden K., 2003, p 337
- 54 -
First, distinction is made between what you take into account, the transportation work or the transportation cost. The transportation work is expressed in tonkm (ton x kilometers) or in m3km (cubic meter kilometer). This is the simplest case. Integrated, the transport cost is a more complex case. The transportation cost is expressed in currency unit per ton and per kilometers, or in currency unit per cubic meter and per kilometers. The fact that the transportation cost is expressed per ton or per cubic meter depends on how the demand of customers is expressed. It could be per boxes, for instance, if the demand and the transportation cost are homogenous.
3.6.1.2 Transportation work:
One supplier – one terminal – several customers: The supplier is located on the axes by (XS, YS). The supplier is delivering the quantity S to the terminal. The quantity S should be expressed in the same units as the demand. There are N customers – located on the axes by the (Xci,Yci). The customer demand is still DI. The terminal is located at the coordinated (X, Y). According to the assumption that the goods flow that gets into the terminal goes
out, we have: ∑=
=N
iiDS
1
Then the localization of the terminal that minimizes the transportation work is given by the following formula:
)(1
1
∑
∑
=
=
+
×+×= N
ici
N
iciciS
DS
DXSXX and
)(1
1
∑
∑
=
=
+
×+×= N
ici
N
iciciS
DS
DYSYY
- 55 -
3.6.1.3 Transportation costs:
A way to make the methodology closer to the reality is to take into account the real transportation costs. The transportation cost has to be expressed in a homogenous way with the other parameters. For instance, if the demand is expressed by the customers in cubic meters or in tons, then the transportation cost should be expressed as followed: DEMAND TRANSPORTATION COST Cubic meters Cost / ( Cubic meters x kilometers) Ton Cost / (Ton x kilometers) Table 3-3 : Expression of the Transportation Cost According to the Expression of the Demand, Source: Authors.
What is called cost above is expressed in the euro or in any currency. We will go through the previous classification and modify while including the transportation costs. One supplier – one terminal – several customers: The supplier is located on the axes by (XS, YS). The supplier is delivering the quantity S to the terminal. The quantity S should be expressed in the same units as the demand. TS is the transportation cost to bring goods from the supplier to the terminal. There are N customers – located on the axes by the (Xci,Yci). The customer demand is still DI. TTi is the transportation cost to bring goods from the terminal to the customer i. The terminal is located at the coordinated (X, Y). According to the assumption that the goods flow that gets into the terminal goes
out, we have: . ∑=
=N
iiDS
1
- 56 -
Then the localization of the terminal that minimizes the transportation cost is given by the following formula:
)(1
1
∑
∑
=
=
×+×
××+××= N
iciTiS
N
iciTiciSS
DTST
DTXSTXX and
)(1
1
∑
∑
=
=
×+×
××+××= N
iciTiS
N
iciTiciSS
DTST
DTYSTYY
3.6.2 Soft factors while deciding location facilities
When we reviewed the theory, we noticed that the problem of locating warehousing (or manufacturing) facilities has been mainly concerned with the determination of the optimal number, size and geographic configuration of those facilities in such a way as to minimize the total cost associated with supply-chain operations. This, while satisfying customer demand requirements, is not often taken into account. We want the reader to know that we are aware of this deficit in the theory review. Thus, in our research we will also highlight factors that are not of cost character, such as customer service and environmental aspects.
3.6.2.1 Integration of the soft factors in the location decisions
While speaking about soft factors, here we mean any factors for which costs are not included in the transportation cost or factors for which cost is difficult to evaluate. The following table gives the history of factors that are included in classic theories of locations:
- 57 -
Determinants Von Thunen
(1875) (Gravity point method)
Weber (1929)
Hoover (1948)
Greenhut (1956)
Transportation X X X X Production cost X X X Institutional factors
X
Demand X Purely personal X Table 3-4 : Main Determinants considered in classic theories of location, adapted from Li Li (2004). From the table given above, the approximately years of the theory were added. We understand that the soft factors are more and more integrated while deciding logistics facilities location. This happens for several reasons. The first one may be that the competitive environments within companies evolve. This means that the competition leads companies to integrate any factors that may impact their business. Another reason may be that the price of the transportation had become less and less important through the years. Thus, factors other than the transportation cost become more and more important.
3.6.2.2 Soft factors import while choosing a location
Li Li (2004)65, questions “What determinants affect multinational corporations’ logistics decisions?” While studying this research question some 57 factors were examined by companies as to whether of not they are factors included when deciding a location. After answering the research questionnaire, a correlation link between factors was studied in order to group different factors with each other. The following table shows the 13 groups of factors that are used to choose logistics facility locations as well as another 13 original variables that couldn’t be associated with any other group of variables.
65 Li Li, 2004, p 128
- 58 -
GROUP OF VARIABLES
VARIABLES (INCLUDED IN THE GROUP, OR GROUP-LESS
VARIABLES)
MEAN RATING (LEVEL OF IMPORTANCE WHILE CHOOSING A LOCATION)
Logistics and transportation ↵
5.03
Good logistics services Good logistics infrastructure Efficient transport links Quality of carriers Proximity to major highway Variety of carriers Labor productivity
↵ 4.94
Labor productivity Labor attitudes to productivity Business attitudes ↵
4.72
Local attitudes to business Regional attitudes to business Labor qualification
↵ 4.61
Availability of transfer of qualified technical personnel
Work ethics Availability of skilled labor Availability of transfer of managerial
personnel
Region regulatory Environment Security ↵
4.21
Security Integrity of corporate books Quality of life ↵
4.14
Quality of life Social and cultural climate Availability of medical services Availability of recreational facilities Educational level of locals Cost of import and ↵
4.05
- 59 -
export Customs duty Exchange rates Synergy
↵ 4.00
Access to supplier base Synergy effects Air transport connection ↵
3.90
Availability of local airport Proximity to major national airport Cost of construction and land ↵
3.75
Construction of prices Availability of low-cost land Availability of industrial zoned land Cost of housing Industrial cluster in the company’s industry
sector
Financial climate ↵ 3.69
Availability of capital financing Banking services Regional investment incentives Insurance services Local investment incentives Role of investment agencies Real estate tax Personal preferences ↵
3.61
CEO’s preferences Owners preferences Proximity to competitors ↵
3.09
Proximity to locations of competitors Availability of competing business The following variables weren’t including in any group. Good telecommunication services 5.25 Proximity to markets 4.86 Related to the existing production plants 4.54 Commuting distances 4.36 Presence of distributors 4.11 Labor rate 3.92 Availability of existing buildings for 3.67
- 60 -
business Proximity to major seaport 3.65 Exit Strategy 3.55 Proximity to major railway 3.54 Availability of industrial parks 3.43 Population density 3.41 Geographical climates 3.26 Table 3-5 : Rating of Soft Factors, Source: Li Li, 2004, p 125 Other researches do not differ between so-called hard (as cost) and soft factors. Alberto66 has categorized major criteria that are analyzed when selecting the location of a logistics facility. Similar to other researchers, Alberto regards cost as a major factor affecting the decision of location. The total costs, in this case, are related to infrastructure issues, named here as start-up and operating costs. Transportation costs represent a small part of the overall costs that will be analyzed. Other important factors that Alberto mentions are:
• Environmental aspects: Environmental aspects are becoming increasingly central in location decisions. Alberto mentions three elements: Regulations, proximity to disposal plants, and local taxation.
• Logistics service criteria: Such as time reliability, flexibility and
integration with customers.
Time reliability consists of the abilities of the company to deliver exactly the right ordered quantities of the products to the customers in the right time according to the target schedule. Flexibility refers to the ability of the division to arrange urgent deliveries when needed and to conform to any special request or changes concerning the product, the delivery or the routing. Three location-related sub-elements were thus considered as potentially affecting this attribute: the closeness to
66 Alberto P., 2000, pp 279-281
- 61 -
customers; the closeness to suppliers; and the closeness to the group complementary facilities to expedite more effectively a special order. The integration with customers means that the ideal site should favor the integration of logistic operations/processes and should facilitate the possibility of personal contacts in the design stage.
• Quality of living: Local climate, crime rate, living expense and traffic
congestion should be taken into account in the relocation decision. According to Alberto, these criteria may affect both the turnover rate and the productivity of workers. Also, unions in a relocation decision where current employees are asked to move to a new location may critically evaluate quality of life.
• Local incentives: Such as labor quality, tax breaks and loans.
- 62 -
4. Empirical Findings The empirical data needed to undertake the analysis is sorted according to the market areas: the Czech Republic, Hungary and the seven customers in East Germany delivered from DERI. This chapter is divided into three main parts. The first part is a description of the company MHC, in terms of how the company was created, geographical presence, and distribution strategy. The second part is the description of the material flow in terms of a physical description and monetary description of the network. The third part is the logistics service part where we present figures from an earlier project that are used as examples of what can happen with the logistics service when redesigning the distribution network.
4.1 Description of the Company MHC
This is a description of the company, Mölnlycke Health Care AB. The information presented here is taken from the internet web site of MHC.67
MHC is a manufacturer of single-use surgical products – patient drapes, instrument drapes and surgical gowns, caps and masks for the operating staff. The group also operates in the professional wound care sector, with a wide range of products for the treatment of surgical wounds, chronic wounds and burns. MHC’s fundamental business concept is to be a world leader in the manufacturing, marketing and sales of single-use products for surgical interventions and wound care. Today, MHC is comprised of business areas: the surgical area and the wound care. It also focuses on four market areas (Europe/Middle East/Africa, North America, Latin America and Asia/Pacific) including one central organization for Global Supply, including customer service and distribution.
67 http://www.molnlycke.net, 2004-09-15.
- 63 -
4.1.1 Historical background
The company, named Mölnlycke, was first established in 1849. Initially the operations comprised of spinning, weaving, bleaching and later also of dyeing cotton textiles. After two bankruptcies in the early 20th century, 1930 was the start of the new company Mölnlycke AB. The business was divided into seven lines, one being the dressing line, the business idea of which was delivering gauze to Sahlgrenska Hospital in Göteborg Sweden. In 1975, the Swedish company SCA, acquired Mölnlycke AB. MHC established as an independent company in late 1997 through an acquisition and merger of the respective clinical divisions of the Swedish SCA and Tamro in Finland. At the time, the company had eleven factories and a number of subcontractors. The business was organized in two divisions, surgical products with the brand name Klinidrape® and wound management products with the brand name Tendra®. In June 2001, MHC took a major step, the acquisition of the Johnson & Johnson single-use surgical product line. The range included the BARRIER® Brand, and the acquisition almost doubled the size of the company since the new business had a yearly turnover of approximately MEUR 220. Mölnlycke Health Care's sales operations are divided into four geographical market areas and cover both the surgical and wound care business; Europe/Middle East/Africa, North America, Asia/Pacific and Latin America, altogether covering over 70 countries.
4.1.2 Production units
MHC has production units in many different parts of the world for the surgical products and wound care products.
- 64 -
Surgical products are manufactured at four factories, two in Europe, one in Thailand and one in Mexico.
• Waremme, Belgium • Karvina, Czech Republic • Bangkok, Thailand • Juárez, Mexico • Mikkeli, Finland: Wound care production
4.1.3 Material assortment
MHC distributes their products through 4 different brands: • BARRIER® products. • KLINIDRAPE® products. • PROCEDUREPAK™ products: • TENDRA ® Gentle Care™
4.1.4 Distribution strategy
It is clear in the distribution strategy of MHC that one key aspect of success is to reduce stock points; below we present the global supply vision, mission, and the key elements that must be obtained to achieve the goals of the distribution strategy
• Vision “To be recognized as the best supplier in the health care business within our area of operations as a result of our level of customer service.”
• Global supply mission statement Based on a cost-effective structure, ensure excellent supplies, surpassing our competitors in achieving full customer satisfaction with a low level of tied-up capital throughout the entire supply chain.
- 65 -
• Key elements to success:
- Limited number of stock points - Structured deliveries - Information through the supply chain - Quality and customer focus
• Steps for future work: The goal is to have as few warehouses as possible in order to:
- Reduce costs linked to double-warehousing - Increase service level - Release tied-up capital (TUC) - Continuous work is required to decrease number of transportation
partners in Europe. The elements mentioned above will possibly leads to the long-term distribution network design that MHC is applying. This strategy is reflected in the figure below. From the figure it is clear that the goal is to reduce numbers of stock points in Europe.
- 66 -
Distribution centres Local warehouses Factories
Figure 4-1 : Long Term Distribution Strategy for Europe, MHC. Source: MHC.
- 67 -
4.2 Description of the Material Flow
The aim of this section is to define in a more accurate way the logistics activities of MHC, this in order to answer the different questions.
Figure 4-2: Pattern of the current distribution network of MHC towards East Europe, Source: Authors Here with follows a brief description of the physical material flow in term of facts about warehouses used in each country, about inbound flow, and outbound flow.
4.2.1 Czech Republic activities
Below follows a description of the physical material flow from the Central Warehouse in Waremme Belgium to the end customers in Czech Republic. All the figures are related to the first semester of the year 2004 (01-01-2004 to 31-06-2004). The source of information in this part is Emilja Huntejova, MHC Czech Republic. For more information about the Czech Republic activities see appendix 1.
Waremme DC Local Warehouse Final customer
Line-haul Freight to customers
- 68 -
Background: In the Czech Republic, the activities of MHC are split into the sales force as well as the accounting staff. The logistics activities are supported via a 3PL, DHL. The warehouse is owned by DHL, which operates all the logistics activities and charges MHC according to special criteria that is detailed later on in this chapter. Type of cost pricing: The cost structure includes the fixed costs as well as the variable costs. DHL charged MHC according to the space they rent in their warehouse as well as for the logistics activities performed for MHC. The total warehousing cost was equal to the fixed plus the variable costs that occurred in the warehouse. Fixed costs: As we already mentioned, 200 pallet places were rented in the warehouse. Another fixed cost is the labeling, which is independent of the volume labeled during the first six months of 2004. Variable costs: The variable costs are given by the in-handling costs, warehousing activities operated into the warehouse – packaging, extra services, extra pallets places rents and out-handling costs. Space rent (incremental cost): In case of a higher space demand over the 200, MHC has the possibility to rent extra pallet places as needed per day. This is a real value added in term of flexibility, which is not possible to obtain if the warehouse wasn’t outsourced.
- 69 -
Inbound flow: The description of the inbound flow will start from Waremme to the Czech end-customers according to the figure below.
Figure 4-3 : Line-haul from Waremme to Prague, Source: Authors. After leaving the distribution center in Waremme, Belgium, the goods are shipped and moved to Prague, Czech Republic. All inbound flow is coming from Waremme to Prague.
- 70 -
Inbound flow
02468
101214161820
04-0
1-05
04-0
1-19
04-0
2-02
04-0
2-16
04-0
3-01
04-0
3-15
04-0
3-29
04-0
4-12
04-0
4-26
04-0
5-10
04-0
5-24
04-0
6-07
04-0
6-21
num
ber
of p
alle
ts
Figure 4-4 : Inbound Flow in Number of Pallets Arrived First Semester of 2004, Source: MHC. Inbound lead time: Lead time schedule Waremme - Prague: Wednesday: Prague creates a purchase order and sends it to Waremme via SAP Thursday: Order is handled in Waremme and confirmed to Prague + DHL (volume, pallets) Friday: Shipment is loaded by DHL in Waremme at 15:00 Monday: Shipment arrives to Prague - Ricany Warehouse and is in-handled Tuesday: Incoming goods are ready for delivery to customers.
- 71 -
Outbound flow:
Number of dropsize per volume range
050
100150200250300350400450
A B C D E F G H I J K L M N Q
Range of Dropsize
Num
ber o
f del
iver
ies
clas
sifie
d pe
r dro
p si
ze
Figure 4-5 : Drop size in Czech Republic, Source: Authors. Shown above the number of deliveries classified per drop size in the Czech Republic independent of the area in which the orders were distributed. Drop size is the amount of goods in volumes per order line shipped from warehouse to end customer. This classification of drop size was developed on our own, based on market figures from MHC. This classification was made by sorting the order size of around 2,000 orders towards the Czech market.
- 72 -
The correspondence between letter and volume range is given below.
Volume (m3) Letter corresponding to a From: To: A 0.004 0.023 B 0.024 0.063 C 0.064 0.123 D 0.124 0.203 E 0.204 0.303 F 0.304 0.403 G 0.404 0.603 H 0.604 0.803 I 0.804 1.203 J 1.204 1.603 K 1.604 2.003 L 2.004 2.803 M 2.804 4.003 N 4.004 6.003
Table 4-1 : Clarification of the Corresponding Letters, Source: Authors adapted from the distribution tariff, applied to MHC by DHL. Outbound lead time The administrative lead-time is around 1.5 days and the delivery lead-time will depend on which industry area the customer is located in. The areas of industry, areas 0-2, should be (according to the contract with the DHL) delivered on Day 2. The industry areas 3-5 are delivered on Day 3. MHC-Czech Republic thoughts on restructuring the distribution network: Some activities are performed locally. According to MHC-Czech, these activities might generate problems in case another distribution network design is chosen. For the Czech Republic, some particular procedures that need to be specified when it comes to the distribution activities can be detailed in three different steps.
1. Labeling of all delivered units (TRPs which is transport boxes, retailer or consumer): Labels have the Company name and address, identification number, and environmental symbol.
- 73 -
2. Repackaging for one distributor: Special customers want MHC to give a special nylon package to all consumer delivered units. MHC has to open the boxes, repackage and then put back into the boxes.
3. Some customers require express delivery within 24 hours.
While getting into the European Union, the advantage is to avoid paying the customs duties. The advantage to cross the border in shorter time is clearly an important time advantage.
4.2.2 Hungary activities
Below follows a description of the physical material flow from the central warehouse in Waremme Belgium to the end customers in Hungary. All the figures are related to the first semester of the year 2004 (01-01-2004 to 31-06-2004). The source of information in this part is Nandor Toth, MHC Hungary. For more information about the Hungary activities see appendix 2. Background: The local logistics partner of MHC in Hungary is SCA. According to MHC-Hungary this is a very important cooperation for MHC, since both companies were one company in the past, which means that SCA knows about MHC products, customers, their habits, etc. MHC-Hungary claims that the relationship with SCA is very good. Type of cost pricing: No fixed costs are charged by SCA and all logistics activities are handled by SCA. There is a variable cost per m3, which is based on the outbound volume leaving the warehouse in the particular month. This rate includes everything regarding costs related to inbound and outbound deliveries as well as the real warehousing cost.
- 74 -
Inbound flow: Two suppliers:
- Waremme delivering the general Mölnlycke assortment - Rauscher from Austria delivering wound management products (Ortmann
assortment) Waremme to the warehouse in Budapest (Hungary): The volume of goods received from Waremme during the first semester of the year is shown in the figure below, per arrival, and no time scale was available.
Coming Inbound
0
10
20
30
40
50
60
4 7 10 13 16 19 22 25 28 31 34 37 40 43 46
Vom
lum
e (c
ubic
met
ers)
Figu Whtructhe Bud
1Arrivals
re 4-6 : Inbound Volume (m3) Per Arrival from Waremme, Source: Authors.
en it comes to the routines of trucks shipped from Waremme, if it is not a full k then it goes to Heijen, Netherlands, where there is an SCA warehouse to fill truck for cost saving reasons. About half of the deliveries from Waremme to apest are a full truck. The other half can vary between 15-50m3.
- 75 -
If truck full-loaded
SCA-Heijen If truck not full loaded
Figure 4-7 : Line-haul from Waremme to Budapest, Source: Authors Inbound lead-time: From the Waremme warehouse it takes about 5 days to get goods on stock in SAP. This time frame is from order to Waremme until goods are received and handled in the Budapest warehouse. From Rauscher Austria it is 2 days.
- 76 -
Outbound flow
Number of dropsize per volume range
0200400600800
10001200140016001800
α β γ δ ε ζ η θ ι κ λ
Range of Dropsize
Num
ber o
f Del
iver
ies
Clas
sifie
d pe
r Dro
psiz
e
Figure 4-8 : Drop Size in Hungary, Source: Authors. Above are shown the number of deliveries classified per drop size in Hungary, independent of the area in which the orders were distributed. This classification of drop size was developed on our own, based on market figures from MHC. This classification was established by sorting the order size of around 3,500 orders towards Hungary.
- 77 -
The correspondence between letter and volume range is given below. Volume (m3) Letter corresponding
to a From: To: α 0.00 0.09 β 0.10 0.24 γ 0.25 0.49 δ 0.50 0.74 ε 0.75 0.99 ζ 1.00 2.49 η 2.50 4.99 θ 5.00 9.99 ι 10.00 19.99 J 20.00 29.99 λ 30.00 49.99
Table 4-2 : Clarification of the Corresponding Letters, Source: Authors adapted from the distribution tariff, applied to MHC by SCA. The Hungarian market is divided into ten transportation zones for SCA. These transportation zones are based on the distance from the warehouse. The thought with the transportation zones is to differ between the charge of the transport but not the lead-time. The transportation lead-time is always 2 days, except when customers request urgent delivery. The MHC-Hungary transport to customers is combined with SCA goods. According to MHC-Hungary, this is very good since the charges are calculated this way making the transport much cheaper. The fill-rate is 80% together with the SCA goods. From this 80% around 2% is MHC goods. Outbound Lead-time: Day 1: order is entered in SAP. Day 2: picking and loading onto the trucks Day 3: trucks go to customers It takes two days from entering the customer order in SAP to reach the customers with the products. And when it comes to urgent deliveries required by customers, they often want to get the products on day 2, sometimes even day 1.
- 78 -
MHC-Hungary thoughts on restructuring the distribution network: On May 1, 2004, Hungary became a member of the European Union. According to MHC-Hungary, nothing changed for their business except the fact that MHC-Hungary does not have to pay duty so the customs handling has disappeared. MHC-Hungary does not like the idea to merge the warehouses, they also do not believe merging warehouse can handle the specific demands the customers require such as: • lots of really small deliveries • the most frequent drop size of MHC-Hungary deliveries is between 0.1-1 m3 • urgent deliveries ( next day or even the same day as the order comes ) • MHC- Hungary does not have that many deliveries per day, often it does not
fill one small truck • sometimes local labeling is needed • sometimes customers do not accept the SAP delivery note, and but the
warehouse needs to issue one manually
4.2.3 East Germany-DERI activities
Below is a description of the physical material flow from the central warehouse in Waremme, Belgium, to the end customers in east Germany. All the figures are related to the first semester of the year 2004 (01-01-2004 to 31-06-2004). The source of information in this part is Robert Horn, MHC East Germany-DERI. For more information about the East Germany-DERI activities see appendix 3. Background: The company that operates the logistics function for MHC in this part of the East German market is MTR Riesa, a company that is selling multiple-use products to the same customers as MHC´s customers. This warehouse, named DERI at MHC, is not used for the whole East-German area; it is just used as a consignment depot
- 79 -
for seven different customers. MTR Riesa is the distributor of MHC products to these seven customers; but MHC is still the owner of the stock. Type of cost pricing: MHC pays MTR Riesa for the logistics function provided by given rebate on net sale to the customers. After MTR has delivered the goods to the seven customers, MHC Germany receives information about the delivered goods and the quantities. MHC Germany enters the orders for this delivery in SAP on the customer level at Plant DERI, and creates invoices on customer-level where the receiver and payer of the invoice is MTR-Riesa with a rebate of 3.07% ( average ) of the value. MTR Riesa is invoicing the customer ( 100% ). This rebate of 3.07% ( average ) is covering the costs in warehousing, administration, freight to customers and other services such as return flow that are provided by MTR Riesa. MTR Riesa is not a classic warehouse, and their way of working is not according to a traditional warehouse. MHC uses it as a consignment stock for these seven customers only with a lead-time between 12 and 24 hrs. Inbound flow The inbound flow from Waremme to the DERI (MTR Riesa) takes place in two stages, the first flow is from Waremme to Erftstadt in Germany, the second flow is from Erftstadt to DERI (MTR Riesa) via a platform in Zwickau ( which belongs to Thiel Logistics). Thiel-Logistics in Erftstadt is the transport company that delivers the goods to all end customers except seven customers in East Germany (the seven customers will be handled by DERI). The replenishment to MTR Riesa (DERI) will be also handled by Thiel Logistics in Erftstadt. Thiel Logistics in Erftstadt is used as a platform for Germany, receiving the goods for Germany from Waremme and delivering the goods to 10 different platforms
- 80 -
within Germany. Each platform delivers the goods to the end customers (where Riesa is considered as an end customer). Waremme Erftstadt platform Zwickau MTR Riesa end-customer:
Waremme Erftstadt
Figure 4-9 : Flow from the DC in Waremme to Erftstadt in Germany, Source: Authors.
Erftstadt
Zwickau
MTR Riesa
Figure 4-10 : Inbound Flow from Erftstadt to DERI (MTR Riesa), Source: Authors.
- 81 -
The incoming flow differs between 5m3 to 7m3 per week, and the total incoming flow in the period of 2004-01-01 to 2004-06-30 was 147.61 m3 which gives an average of 5.68 m3 per week. It is not possible to have full trucks in the incoming flow. If MHC has backorders they will also deliver with parcel service to MTR-Riesa. Inbound lead-time: Three days lead-time (put on Tuesday – delivered on Thursday). Outbound flow: MTR Riesa is the transportation carrier to the seven end customers, the freight transportation is consolidated with MTR Riesa own goods (multiple use products), MHC is using MTR flow. Outbound Lead-time: The seven customers are buying TRP (Transport Boxes) on a daily base; this means daily orders, daily deliveries and daily invoices. Customer – Invoices (created by MHC on a weekly basis) will be sent to MTR-Riesa (payer of the customer invoice) with a rebate of the invoice amount. MTR is invoices the customer with 100 %. The lead-time is 12-24 hrs with extra service handled by MTR Riesa as Rack-service, and return of empty packaging. MHC-DERI thoughts on restructuring the distribution network The opinion of MHC-DERI of merging warehouses in the east European market into a single large one was that this is not a good solution for them, because this warehouse is used for the seven customers only in the area Riesa. This means that a fast transportation time, 12-24 hrs, is a fundamental requirement that cannot be obtained if the customers were supplied from a centralized unit.
- 82 -
4.3 Value of the Current Flow
According to the previous description of the material flow, we understand that the same pattern can be used to characterize the costs for each distribution pipeline. First, the transportation costs are detailed, then the handling cost and finally the carrying expenses computed on the capital tied-up in each channel. In the three cases (Czech, Hungary and East Germany) end customers do not pays the transportation directly, it is included in the sales price. Distribution to east European market is looked successively for Czech Republic, Hungary, and DERI-east Germany. All the figures are related to the first semester 2004 (01-01-2004 to 31-06-2004). We would like to make the reader aware that in some cases we get costs information already organized by MHC. In other cases, MHC provides us with data that we used as inputs to a calculation that is needed in order to organize the cost information. We tried to specify how the cost information was obtained.
4.3.1 Transportation cost:
Transportation Cost In East Europe
0 20 000 40 000 60 000 80 000
DERI
HG
CZH
Pipe
line
Euro €
Line HaulFreight Transportation
Figure 4-11 : Transportation Cost Related to Each Pipeline, Source: Authors.
- 83 -
According to how MHC pays the distribution in East Germany it is impossible to split warehousing fees and freight transportation fees. The following chart gives a summary up of the transportation costs.
4.3.1.1 Czech Republic transportation cost
Waremme Prague Czech end-customers: The total transportation cost for this market is = Line haul transportation cost + Freight transportation cost Line Haul 519,628 CZK 15,820 €Freight Transportation 593,764 CZK 18,077 € Total Transportation cost 1,113,392 CZK 33,897 €Table 4-3 : Components of Transportation Cost Towards the Czech market, Source: Authors. Description how this total cost was congregated is given in Appendix 4.
4.3.1.2 Hungary transportation cost
Waremme Budapest Hungarian end-customers: Line Haul 46,553 €Freight Transportation 26,054 € Total Transportation cost 72,607 €Table 4-4 : Components of Transportation Cost Towards the Hungarian Market, Source: Authors Description how this total cost was congregated is given in Appendix 5.
- 84 -
4.3.1.3 East Germany-DERI transportation cost
For all the computations that follow, the final transportation cost was organized and obtained on our own by using data provided by Robert Horn, MHC, as input to our calculations. Waremme Erftstadt MTR-Riesa DERI East German end-customers: For this distribution channel, the way MHC pays the distribution in East Germany makes impossible to split warehousing fees and freight transportation fees, then: Line Haul 6,395.858 €Freight Transportation Not Available: Included in the rebateTotal Transportation cost Not availableTable 4-5 : Components of transportation cost towards DERI market, Source: Authors Description how this total cost was congregated is given in Appendix 6.
- 85 -
4.3.2 Warehousing handling costs:
4.3.2.1 The Czech Republic warehouse cost
The final warehouse handling costs were organized and obtained on our own; this by using data provided by Emilja Huntejova as input to our computation. The total warehouse cost is equal to the fixed +variable cost, costs that occurred in the warehouse. 360,000 + 183,473 = 543,473 CZK. Around 16,546.30 € Description how this warehousing cost was congregated is given in Appendix 7.
4.3.2.2 Hungary warehouse cost
The final warehouse handling costs were organized and obtained on our own, by using data provided by Nandor Toth as input for our computation. The total warehousing cost is equal to the fixed +variable cost costs that occurred in the warehouse. Total warehouse cost is 76,961€ Description how this warehousing cost was congregated is given in Appendix 8.
4.3.2.3 East Germany-DERI warehouse cost
MTR-Riesa DERI East Germany: In the case of DERI, as it does not work as a regular warehouse, there will not be any variable or fixed cost. The rebate is provided by MHC to MTR Riesa include the warehousing, administration, freight to customer, and other related service as a cost of return flow. The average rebate given by MHC to MTR Riesa is 3.07% of the net sale, during the first semester of the year the net sale to MTR Riesa was 238,932.02 €
- 86 -
(excluded the customer that will be delivered from Waremme and the exceptional customer). The cost will be 3.07 % of the net sale, which is 7,335.20€ For more details see Appendix 6.
- 87 -
4.3.3 Carrying expense:
The carrying expense was calculated on the value of the stock (Safety stock+ Cycle stock), and on Stock in Transit (tied up during the freight to customers). The final carrying expense for the three different markets was organized and obtained on our own, by using data provided by the local contacts as input for our computation.
4.3.3.1 The Czech Republic carrying expense
The value of the stock in Prague is 2,750,000 CZK, which includes the average safety stock and cycle stock. The annual carrying expense of the goods tied up is 11% of the average stock value divided by two, as our time scope is half of the year. This gives a carrying expense of 151,250 CZK around 4,605 €
4.3.3.2 Hungary carrying expense
“It is hard to judge the value of the stock. The transfer prices68 for Hungary have changed two times this year. At the beginning of the year the stock value was around 570 000 EUR, but now it is half of that due to the standard price change”69
An average of that is a 428 000 € stock value for the first semester of 2004. The annual carrying expense of the goods tied up is 11% of the average stock value divided by two, as our time scope is half of the year. 428,000*11%/2 = It gives a carrying expense of 23,540 €.
68 The Transfer Price named the price used for accounting measurement inside MHC. 69 Nandor Toth, E-mail Interview.
- 88 -
4.3.3.3 East Germany-DERI carrying expense
Stock belongs to MHC – Germany. opening stock at DERI 01.01.2004 € 51,623.91 stock at the end of January € 53,140.34stock at the end of February € 52,645.48stock at the end of March €54,221.80stock at the end of April € 54,816.55stock at the end of May € 54,611.78stock at the end of June € 52,339.52Table 4-6 : Value of stock in DERI, Source : MHC. - The average stock value is then around 53 342 EUR. - The annual carrying expense is 11%. - The tied up cost for the first semester of the year is 5,868 EUR/2 = 2,934EUR.
- 89 -
4.3.4 The total cost of the current distribution flow
We can sum up the costs among the different pipelines with the following chart.
Transportation Cost In East Europe
0 50 000 100 000 150 000 200 000
DERI
HG
CZH
Pipe
line
Euro €
Line Haul
Freight Transportation
Warehousing Cost
Carrying Expense
Freight Transportation+ Warehousing
Figure 4-12 : Different Costs in Each Distribution Pipelines Towards East Europe, Source: Authors. The total cost is the sum of the transportation cost + the warehousing cost+ the tied up cost (carrying expense). Total transportation cost for the three market areas =33,898 € + 72,607+6,396 € = 112,900 € The total warehousing cost = 16,546€ + 76,961 €+7,335 €= 100,842 € The tied up cost (carrying expense): 4,605 €+ 23,540+2,934= 31,079 € 112,900 €+100,842 €+31,079 € The total cost of the current distribution flow= 244,821 €
- 90 -
4.4 Logistics Customer Service
Here we provide a definition of the main indicator of logistics service level in MHC, Order Completeness. As we are not going to make a detailed customer service analysis and how the logistics customer service will be affected as a result of espousing any alternative of the distribution structure, thus we do not discuss other indicators. We apply logistics customer service as a risk analysis and the reason why we do such analysis is presented in the analysis section 5.6.1. In order to present an exemplar, this chapter presents figures related to an earlier project similar to ours. These figures will be discussed in the analysis, and the earlier project that will be presented as a case in point is the closure of the MHC Nordic warehouse.
4.4.1 Definition of order completeness
The order completeness is defined as the proportion of orders that the company delivers complete, with no backorders or partial shipments. This service level indicator is widely used in MHC to verify their performance of customer deliveries. MHC has set a standard level on this indicator; the goal is that 97% of the order line should be completed.
- 91 -
The order completeness criteria set by the company is pretty strict. To understand this term, the following table gives an example:
Types of product
Order entry day
Material arrival day(theoretically)
Material arrival day(reality)
A 1 3 1 B 1 3 3 C 1 3 3 D 1 3 3 E 1 3 4
Table 4-7 : Example of Order Completeness, Source: Authors. In such a case, the arrival for product A is 2 days earlier, and the material is 1 day late for product E. Thus, the order completeness is: (3/5)*100 %. Let us say that the customer required 30 products of C, and that only 25 had been delivered. Then according how the criterion has been defined internally, the order completeness is down to: (2/5)*100 %, this means that the order line completeness will be 40%. The order completeness is 0, as there is one type of products or more of the whole order line that was not delivered as promised.
4.4.2 Case of shutting down the Nordic warehouse
4.4.2.1 Background
The Nordic warehouse previously located outside Gothenburg Sweden, was closed down in October 2003. Tamro (pharmaceutical wholesaler in Northern Europe) was taking care of this flow. This restructure of the distribution network for the Nordic market meant that the Nordic customers, after November, 2003, were served from the central DC of MHC in Waremme. This case is unrelated to our study, but it is presented here to show an implication of how can logistics customer service is affected by any restructuring in the distribution network.
- 92 -
The figures that are going to be presented are: • Customer complaints from the Nordic market. The complaints represent
complaints of warehouse activities and transportation activities, and are representing a period before and after closing the warehouse.
• The total logistics service complaint, including warehouse activities, transport activities, and customer service errors and pricing errors, etc.
• Order KPI, in form of order completeness (OC) figures and order line completeness (OCL). Also representing a time period before and after closing down the warehouse.
4.4.2.2 Customer complaints
The following chart presents an overview of the customer complaints on warehouse activities to end customers.
Complains linked to the Warehouse Activies
0
20
40
60
80
100
120
janv-0
3
mars-03
mai-03
juil-0
3
sept-
03no
v-03
janv-0
4
mars-04
mai-04
juil-0
4
sept-
04
Num
ber
of C
ompl
ains
code 200 whs
Figure 4-13 : Complains Linked to the Warehouse Activities of the Products of the Nordic Market, Source: MHC. The service complaints until October 2003 for the warehouse (code 200, Tamro) include both transport and warehouse complaints, as Tamro took care of both.
- 93 -
The following chart presents an overview of the customer complains on transport activities to end customers.
Complains linked to the Transport of the Products
0102030405060708090
janv-0
3
mars-03
mai-03
juil-0
3
sept-
03no
v-03
janv-0
4
mars-04
mai-04
juil-0
4
sept-
04
Num
ber o
f Com
plai
ns
code 100 transport
Figure 4-14 : Complains linked to the Transport of the products for the Nordic market: Source MHC. The move from Tamro to Waremme was made during November 2003. In the year 2004 figures, the complaints for transport are registered with code 100 and warehouse complaints towards the Waremme DC with code 200. One important thing to know about the 2003 figures is that the damages and complaints linked to the line haul transport (Waremme-Tamro) are not shown in the figures, as it was not the customer service department who took care of these. The following chart presents an overall measurement on total customer complaints in the Nordic market in terms of transport activities and warehouse activities. The chart also shows the total number of complaints (including customer service errors, pricing errors, etc.).
- 94 -
Service Complains Total
0
50
100
150
200
250
janv-0
3
mars-03
mai-03
juil-0
3
sept-
03no
v-03
janv-0
4
mars-04
mai-04
juil-0
4
sept-
04
Serv. compl. total
Figure 4-15 : Total of the Complaints Linked to the Warehouse Activities of the Products of the Nordic Market, Source MHC. According to the MHC customer service department in Waremme, there were general delays in the beginning when the shipments to the Nordic market started from Waremme. These delays were sometimes linked to the warehouse, sometimes due to late arrival of the carrier. Presently, the delays have been solved. In some cases, delays still happen due to road accidents, bad weather, etc., but not too frequently. According to the MHC customer service department in Waremme, the main problem now is the transport damages and picking errors - those are the most frequent problems in the Nordic markets for the moment. Frequent loadings and unloading can cause more damages, but it cannot be said that this would be directly linked to the move. The same type of complaints was there already in 2003.
- 95 -
4.4.2.3 Order completeness
The following charts presents the order completeness figures in a time period before closing down the Nordic warehouse and after.
Order Completeness
0102030405060708090
100
janv-0
3
mars-03
mai-03
juil-0
3
sept-
03
nov-0
3
janv-0
4
mars-04
mai-04
juil-0
4
sept-
04
O.C.
Figure 4-16 : Order Completeness for the Nordic Market, Source MHC. The MHC customer service department in Waremme sees the order line completeness as a positive part of the move: in the replenishment warehouse (the older Nordic warehouse), customers had to wait for the goods for a longer time, and in Waremme, the stock is easier to access. But, on the other hand, there are more markets to "fight" over the goods in Waremme.
- 96 -
5. Analysis First we would like to remind the reader about the studied configurations. These are: The current network: Could be seen as the decentralized configuration. Alternative 1: Merge the warehouses in Hungary, the Czech Republic and East Germany and decide the location of the new logistics facility. Alternative 2: Distributing all the products from Waremme directly to the end customers in east Europe. This is the centralized alternative. This chapter starts with an introduction analysis with the facts of a centralized strategy and decentralized distribution strategy, linking the theory review with the qualitative information gathered from MHC. Then follows a discussion of the current situation by highlighting strengths and weakness through analyzing general results from the cost calculation of the current flow. The third part includes the cost simulation of Alternative 1, the result from gravity point calculation, and analysis of soft factors related to the localization issue. The forth part is the cost simulation of Alternative 2; this part even includes a qualitative discussion about the implication of this structure.
5.1 General Trade-off Between Centralization and
Decentralization of the Distribution Network
In this part we will discuss the implication of the distribution network strategy of MHC, and relate it to what the theory suggests. The current distribution network design will be analyzed from the grade of centralization; the MHC distribution strategy for Europe developed in 2003 will also be highlighted.
- 97 -
5.1.1 Introduction
In general, when companies are looking for improvements of their logistics operations, one of the fields the company will analyze is the characteristics of the distribution network (structure); how centralized respective decentralized is the distribution to the market. The grade of centralization is an aspect that has to be in coordination with the dynamic requirements of the market. Generally, the decentralized model includes greater risk for backlog, delays in the chain, and risk for a cascade effect, as the information and distribution pipeline is more complicated and contain several performers. The communication in the centralized model is easier, even the development of IT systems promoted the development of this model, and the distribution is more efficient, though the transportation cost might increase. Nevertheless, there is no best structure to follow. The optimal centralization level is a situation-specific question, and it is the market situation and the characters of the product that determine how the distribution structure should look like. In the same company there might be different distribution structures for different kind of products. But in the case of MHC, the different brands do not require different logistics.
5.1.2 The current distribution network for MHC east European market
First, we would like to link the current distribution network for MHC´s east European market to the two distribution structure models presented by Abrahamsson. Abrahamsson70 presented two models that we can sort in two levels; decentralized case and centralized case (see Figure 3-3). When analyzing the figure, it is obvious that the current distribution network for MHC´s east European market is not reflected in either one of the models presented by Abrahamsson. Even if the current distribution network for MHC´s east 70 Abrahamsson M., 1992, p 2
- 98 -
European market can be regarded as a decentralized distribution structure, it cannot be classified according to the Abrahamsson model.
Figure 5-1 : Grade of Decentralization in the Current Distribution Network for MHC East European Market, Source: Authors.
Local Warehouse: east Germany, Czech and, Hungary
Central warehouse
Regional Platforms Germany
C U S T O M E R S
According to MHC the current distribution network is a result of being owned by SCA previously, MHC did not choose the current structure, they are using the flow of SCA. As the cooperation with SCA is going well this meant that there is no need to change the current situation. When looking at the advantages with the current situation we can relate it to what Mattsson71 claims about the advantages of the decentralized distribution network; it is in some cases crucial to use a hierarchal distribution system, with several levels of warehouses. One of the advantages with that is the nearness to the end customer, which is crucial for products requiring secure and short delivery. In the case MHC the nearness to the end customer, as result of the current network, is an advantage. This gave the local MHC companies flexible ability in handling
71 Mattsson S.-A., 2002, p 246
- 99 -
specific customer orders, in term of packaging or transportation requirements, which is difficult to obtain in centralized cases. Another aspect is the transportation cost. Mattson states that if the transportation cost is highly related to the value of the product, then a hierarchal distribution structure, such as the current distribution network for MHC´s east European market, is the optimal solution. Even a rapid, small-frequented purchase from the customers benefits from a hierarchal distribution structure. This is the case MHC, the orders is often in rapid small frequencies (see Figures 4-4 and 4-8), especially in Hungary where the sales frequency is quite hectic. If these rapid small frequencies orders are transported from a centralized storing unit, the transportation cost will be very high.
5.1.3 The global supply strategy of MHC: step toward centralization?
The distribution strategy of MHC Europe highlights the importance of reducing tied up capital in the logistics pipelines. Reducing tied up capital can be obtained by designing a more centralized distribution network, and thereby reduce the levels of stock points. In the long-term distribution strategy for Europe, MHC is striving to create an extremely centralized distribution structure for all of Europe (see figure 4-1). Figure 4-1 demonstrates a very clear centralized distribution structure, MHC strives to shut down all small warehouses in Europe and keep one distribution center and two local warehouses in Spain and Italy. For the east European market, this distribution strategy will mean a total centralization, which will reduce cost in several areas. Whether the long-term distribution strategy presented is rational for the east European market or not, this structure contains several advantages that can be verified.
- 100 -
Abrahamsson72 has identified some positive results of the centralization process that can be a result of a centralized distribution structure for the MHC east European market:
• Decreased variable costs, as there will be lower tied up capital. • Decreased fixed costs, as the cost for labor and stock will be eliminated. • Increased integration in the form of a centralized information flow. • Even if the transportation cost will increases, this will be balanced by the
fact that the stock level in the central warehouse will not increase to a big extend, as result of the turnover of the central warehouse will instead increase.
All the advantages above can be applied for the case MHC when attaining a centralized distribution structure, but the question remains. Do the advantages here outweigh the increased transportation cost? Particularly in the east European market where the orders are often in rapid small frequencies, this means that more orders will be handled from the central distribution center and the transportation from the central unit will be more frequent and in smaller shipments (drop size). This is not cost efficient. In a centralized distribution structure there will be a clear savings in tied-up costs and warehousing cost, but the transportation cost will be high as long as no transport optimization is done. Another concern regarding if MHC attains a centralized distribution structure for east Europe is the separation of the physical distribution and the sales activities. According to Abrahamsson,73 the centralization process is a bit complicated and will require a well-integrated information system. This kind of information system is often a very costly investment which small and middle-size companies cannot afford. MHC must be aware of the importance of information system integration between the sale companies in the local east European market and the central
72 Abrahamsson M., 1992, p 220-ff 73 Ibid, p 224
- 101 -
storing unit. Without such integration the centralization process will be, as Abrahamsson claims, “complicated”. Nevertheless, without a deep investigation it is not easy to propose which is the best structure to follow while deciding the level of centralization. The aim of this discussion was not to provide in a solution. The thought was to give different viewpoints regarding the distribution network of MHC, and relate it to the suggestions of the theory.
- 102 -
5.2 Analysis of the current situation
5.2.1 Analysis of the cost structure linked to activities
We already presented the cost analysis of the three different pipelines of East Europe. It may be difficult to compare from pipeline to pipeline the percentage of each activity. The following chart represents the different cost structure for each pipeline.
Figure 5-2 : Pipeline Cost Structure in East Europe, Source: Authors. Here what particularly attracts our attention is that the cost structures are sensibly different for each of the three distribution pipelines. We could have expected to find an identical structure in the three hubs. But some costs are directly linked to the activities. For instance to supply larger volume, you need more volume in your stock, even if you are as efficient as other warehouse while handling stock. We particularly think about the carrying expense for this point.
- 103 -
Thus to be able to compare what is comparable, we provide the following charts, showing the reader the share of each country among the total east European market.
Amount of orders delivered per country
190; 3% 1994; 35%
3498; 62%
Czech Republic Hungary East Germany - DERI
Figure 5-3 : Orders Delivered per Country, Source: Authors.
Figure 5-4 : Volume Delivered per Country, Source: Authors.
Percentage of delivered volume per market
7% 20%
73%
Czech Republic Hungary East Germany - DERI
- 104 -
The total volume is 2,363 m3 for the first semester of 2004. Then we understand that it is normal that Hungary gets a higher carrying expense, this because it is required more stock to supply a demand three times more than the Czech one, in regards to volume speaking. We also looked at the average range of the drop size (size of the parcels when they arrive at the end-customer): Czech Republic Hungary East Germany-
DERI Volume supplied (m3)
482 (20%) 1,712 (73%) 168 (7%)
Number of orders 1,994 3,498 190 Volume / Orders 0.24 m3 / order 0.49 m3 / order 0.88 m3 / order Table 5-1 : Ratio Volume per Order in Each East European Market, Source: Authors. Therefore MHC Czech: delivers goods in smaller quantities than MHC Hungary. While being able to deliver in bigger drop sizes, the efficiency of the freight transportation is increased. Then we understand why the freight transportation part is less important (percentage wise) for the Hungarian pipeline. Another reason why the freight transport is better in Hungary is the consolidation of MHC products with SCA products. This is a win-win relationship, and both gain benefit from consolidating their products, filling the truck and shipping to the same customers. On the other hand, the trend is reverse when it comes to stock handling. Czech Republic Hungary East Germany-
DERI Warehousing cost 16,546 € 76,961 € Not Available Volume supplied (m3) 482 m3 (20%) 1,712 m3 (73%) 168 m3 (7%)
Volume / Warehousing cost
34.3 € / m3 handled
44.9 € / m3 handled
Table 5-2 : Ratio Volume per Warehousing Cost in Each East European Market, Source: Authors.
- 105 -
According to the table above, we see that the Czech warehouse is less costly than the Hungarian one when it comes to evaluating the cost according to the flow that goes through the warehouses. Another point that we can look at is the level of the stock according to the activities supported by the different warehouse. But this point may not be so relevant since MHC used different prices (transfer price, operational and logical, and standard price) linked to their accounting and financial strategy.
Czech Republic Hungary East Germany-DERI
Stock ( in €) 85,000 € 428,000 € 53,000 € Activities (either in orders or in Volume)
482 m3 1,994 orders
1,712 m3 3,498 orders
168 m3 190 orders
Ratio: Stock / activities (orders)
42 € tied up in stock per order
122 € tied up in stock per order
278 € tied up in stock per order.
Ratio: Stock / activities (m3)
176 € per m3 supplied.
250 € per m3 supplied.
315 € tied up in stock per m3 supplied.
Table 5-3 : Ratio Stock Value per Activities Expressed in Orders and Volume, Source: Authors. MHC Czech seems much more able to keep the stock level low according to the demand they have to supply. The reason my be surprising. The one we think about is that the stock is handled by a 3PL, for whom handling stock is their core business and will be naturally better than SCA in Hungary.
- 106 -
5.3 Analysis of the alternative one: Satellite Unit
In order to establish a cost comparison between different alternatives, we need obviously to first build up those analyses. As a first point while studying a distribution network with a SATELLITE UNIT delivering the whole east European market, we plan to:
• Compute the location for this SATELLITE UNIT, according to the Gravity Point Methodology.
• Discuss, according to soft factors, where such a SATELLITE UNIT is likely to be.
• Analyze the costs occurred for this particular distribution network.
5.3.1 Description of the alternative “Satellite Unit”
As we define it, the Satellite Unit is a logistic hub (warehouse, distribution center, etc.) from which will come delivery to customers included in the following markets. The Czech Republic, Hungary and East Germany so called DERI. The goods will be directly delivered from Waremme via a Full Load Truck. Then, the deliveries will be operated from this hub to the end-customers. The concept is depicted in the picture below:
- 107 -
Figure 5-5 : Design of the Distribution Network Towards East Europe, While Using a Satellite Unit, Source: Authors.
Line haul transportation
SATELLITE UNIT Location : to be decided?
Deliveries to the end-customers
Main Distribution Center Waremme (Belgium)
If we agree that any logistics facility location decision is a trade-off between different parameters, we decide to focus first on the cost of the distribution system from Waremme to the end-customer, and then to integrate parameters of the overall distribution network as well as the return flow consideration or any other soft factors. The following paragraph will explain how we find a hypothetical location of the satellite unit.
- 108 -
5.3.2 Computation of the location of the satellite unit, according to the
Gravity Point Methodology
5.3.2.1 Simple gravity formula:
Method used: 1. We locate an (0, X, Y) reference axes on the map in order to be able to
locate customer’s cities on this map. 2. We went through all the commands spent by customers during the first
semester 2004. We referenced 5682 orders (shipments); those shipments were related to 231 different towns: 124 in the Czech Republic, 97 in Hungary, 10 in East Germany-DERI. We referenced those 231 towns manually according to the coordinated we set on the map.
3. We linked the volume delivered in those towns during the first semester 2004 with their geographical location.
Then it was enough information to use the formula that we already quoted in the theory review in the particular case of one supplier, one warehouse and several customers.
)(1
1
∑
∑
=
=
+
×+×= n
ici
n
iciciS
DS
DXSXX and
)(1
1
∑
∑
=
=
+
×+×= n
ici
n
iciciS
DS
DYSYY
We invite the reader to refer to the theory part, Section 3.6.1.2, to understand the meaning of each term. The previous formula does not integrate the transportation cost to determine the location of the warehouse. The location that this computation gives will minimize
- 109 -
the total transportation work defined as the product of ton x km that has been operated with the warehouse. The formal computation gives the location of the warehouse: X= - 0,19cm, Y=5,7cm. When we refer to the axes system we made as a reference, it is a small town located in the area of Nuremberg (Germany) called Freihung. The town of Freihung is represented by the hatched triangle.
Figure 5-6 : Result of the Gravity Point Calculation, Source: Authors. But the location of the warehouse does not take into account the transportation cost. According to the data we gathered and our own experience, we know that transporting goods on a full load truck is less costly than to deliver to the end-customers. The optimization of the trucks with route planning is less obvious on parcel deliveries than on a line haul.
- 110 -
5.3.2.2 Gravity formula including transportation cost:
To include the transportation costs in our calculation, we go back to the formula.
)(1
1
∑
∑
=
=
×+×
××+××= n
iciTiS
n
iciTiciSS
DTST
DTXSTXX and
)(1
1
∑
∑
=
=
×+×
××+××= n
iciTiS
n
iciTiciSS
DTST
DTYSTYY
Again we invite the reader to refer to our theory review chapter, Section 3.6.1.3, in order to fully understand the formulas above. But just be aware that the T is linked to a transportation cost, in our case expressed as €/m3, since the demand is expressed in m3.
• How T (transportation cost) is expressed? If we look at the expression to the transportation cost the problem may become complex. Assuming it is possible to express the transportation costs in €/m3 (which is a realistic assumption in most of the case, even if it is discrete), the transportation cost are not expressed in the same way from the line haul case as for the freight transportation case. What is remarkable is that for the line haul the expression of the price in €/m3 only depends on the distance; but for freight deliveries the transportation cost also depends of the size of the shipment (drop size). Basically, since the price is often charged per pallet on a line haul, to carry twice more volume will double the price. And it will be the same price to carry it in one shipment or in two. The cost incurred can be considered as proportional of the volume. This is not the case for the freight transportation! If we go back to the pricing matrix that is applied in Hungary (see Table 13-1 in the appendix 5), we can take the example of goods moved from 40 to 75 km from the warehouse, zone HUZ02.
- 111 -
Case 1: 0,55m3 moved twice Case 2: 1,1 m3 moved once
Transportation cost (HUF/m3):
3,194 HUF/m3 1,927 HUF/m3
Cost of one delivery
0.55 m3 x 3,194 HUF/m3 = 1,757 HUF
1,1 m3 x 1,927HUF/m3 =2,119 HUF
Total Cost 3,514 HUF 2,119 HUF Table 5-4 : Example of the Efficiency in Transportation When Consolidating Goods, Source: Authors. This is about 65% more for delivering the same amount of goods! Here we are clearly aware the reader of the reality of freight transportation. We will summarize the previous explanation in the following table:
Kind of transportation Parameters on which the transportation costs
Variables on which the transportation costs
Line Haul T = f (distance) T = f (X, Y).
Freight transportation T = f (distance, Drop
size and order frequency)
T = f (X,Y, Drop size and order frequency)
Table 5-5 : Parameters Used to Express T (transportation cost), Source: Authors. Thus we understand the extreme difficulties about resolving the formula of gravity with the transportation cost. The parameters depend on themselves, according to a mathematical function that we do not know (since we don’t know yet where the warehouse is).
• Sensitive analysis, possible assumptions, hypothesis: According to how the data is expressed, we will not be able to compute the gravity formula with the transportation costs. But we know that the freight transportation cost is much more costly than line haul transportation. This is logical, since the freight transportation, even with good route planning, is obliged to run empty part of the time (for instance: the truck drivers need to stop for deliveries which is costly).
- 112 -
It is very difficult to estimate how much more expensive freight transportation is compared to line haul transportation because we do not compare the same things. We decided to re-compute the gravity point while considering that the freight is more costly than the line haul, from 1.5 times, 2 times, 3 times. Here are the results:
Figure 5-7 : Gravity Point Calculation While Freight Transportation is 1.5 more costly Than the Line Haul, Source: Authors.
- 113 -
Figure 5-8 : Gravity Point Calculation While Freight Transportation is 2 Times More Costly Than the Line Haul, Source: Authors.
Figure 5-9 : Gravity Point Calculation While Freight Transportation is 3 Times More Costly Than the Line Haul, Source: Authors.
- 114 -
What we see is a general trend. The more costly the freight transportation compared to the line haul, the more the location of the warehouse is moving towards the southeast direction, in between Prague and Budapest.
5.3.3 Discussion on the SATELLITE UNIT location including soft factors
We will analyze the formal result from the basic gravity calculation according to a soft factors discussion. In addition to this result we also analyze three other locations as possibilities for locating the warehouse (satellite unit). The other three possible locations are Prague, Budapest and Bratislava. We decide to analyze Prague and Budapest, as possible location for locating the logistics hub, because at these two locations there are already existing logistics hubs for MHC. While looking at the motion of the location of the warehouse according to the previous gravity point calculation, we decide to even analyze the possibilities of locating the logistics hub in Bratislava, Slovakia. And while looking at the map, Bratislava appears as an ideally geographically located position in the distribution area included in this study.
5.3.3.1 Exclusion of the result from the Gravity Point calculation
The simple gravity point calculation, without including the transport cost, gave a location point in a small town located in the area of Nuremberg (Germany) called Freihung. This town is located close the Czech border, 231 km from Prague. It is difficult to apply this result in the real practical case, as there are several other factors that affect the decision of choosing location of the satellite unit than the result of the gravity point calculation. The result of the gravity point calculation does not mean a complete result that can be implemented in a real and practical case, the gravity point calculation lacks supporting parameters that could make the result of the method fully complete.
- 115 -
There are several parameters that are not taken into consideration in the gravity method, some of these will be discussed in this part, and after this discussion we will suggest the location of the satellite unit out from a balanced weight between the result of the gravity point calculation, and the consideration we take to the soft parameters. While analyzing the locations related to the soft parameters, we decided to exclude the result generated from the gravity point calculation (Freihung) for the following reasons:
• As the strategy of MHC is to not build warehouses in Germany, locating the warehouse in Germany would crack with the long-term distribution strategy of MHC
• Freihung point is far from the Hungarian market, 745 km to Budapest, • This location does not support the flexibility in extending the distribution
area to other east European countries and the Baltic States. • No transport cost was included in the Gravity, making this result more
limited It is vital to understand that the importance of the criteria, soft factors, is a situation specific question and might differ from case to case. Which factors will be highlighted depends on what the reason is to restructure the distribution network. For example, if the company wants to realize cost savings, it is important to look at the overall cost and not just at savings in the transportation cost. In the theoretical chapter we highlighted several soft parameters that can be related to the case of MHC. We understand that not all the soft factors are important while deciding where to locate the central warehouse in East Europe. Therefore, we will choose those factors or parameters that are most related to the reasons as to why to restructure the distribution network for MHC´s East European market, from our own opinion.
- 116 -
5.3.3.2 The soft factors that affect the decision of location
If we apply the fact that factors that are going to be highlighted depending on what the reason to restructure the distribution network, then in the MHC case we are looking for cost efficiencies by restructuring the distribution network. This means that the soft parameters that are going to be discussed will have the implication of supporting cost efficiency in the logistics pipeline. Thus, we know the importance of other parameters such as environmental aspects and customer service aspects. It is also important to note that cost efficiencies as a reason for restructuring the distribution network is just applied in our study. In the real practical case, if MHC decides to restructure the distribution network there will surely be other reasons.
• Theoretical soft factors The soft factors that we are going to analyze here are already developed factors adapted from the theoretical research, we choose the factors that we think are related to the case MHC. Cost of export and import: The first parameter that can be highlighted is adapted from Li Li,74 this is the ability of the location to reduce costs for export and import. In the case of MHC, all possible locations for the satellite unit are located in member countries of the EU. This means that the tariff, customs duty, and exchange rate will be equal for all possible locations. Logistics and transportation infrastructure: Other factors mentioned by Li Li are the Logistics and transportation parameters as:
• Good logistics services • Good logistics infrastructure • Efficient transport links • Quality of carrier proximity to major highway
74 Li Li, 2004, p 128
- 117 -
In the case of MHC, the location that might best support these parameters is Prague. In our analysis of the current situation, we noticed that the logistics handling efficiency in Prague was quite good in comparison with Hungary. As the tied-up capital in the Czech Republic was much less, however, what we noticed freight transportation inefficiency in the form of small shipped orders. In other words, Prague delivers to customer in small quantities, so Budapest is better in freight transportation as they deliver larger drop size shipments than Prague (see Section 5.2). If the satellite unit is located in an area where logistics activities for MHC were not exist before, as in Bratislava, then it would be difficult to measure the logistics efficiency already in this stage. In this case it is important to evaluate the quality of different 3PL providers there. What is important to be aware of is that the efficiency of logistics handling in the warehouse of MHC in the Czech Republic is not just because of a good 3PL provider, it also benefits from well-integrated logistics planning from the local MHC. To evaluate which country is most favored in this factor, there are also transportation infrastructure parameters that can be highlighted:
Country Czech Republic Hungary Slovakia Transport
infrastructure measurement
Area of Country 78,866 sq km 93,030 sq km 48,845 sq km Railways 9,520 km (2003) 7,937 km (2003) 3,661 km (2003) Highways 55,408 km (2000)
Paved: 55,408 km (including 499 km of expressways) Unpaved: 0 km (2000)
188,203 km (1999)Paved: 81,680 km (including 438 km of expressways) unpaved: 106,523 km
42,717 km (2000) Paved: 37,036 km (including 296 km of expressways) Unpaved: 5,681 km (2000)
The infrastructure parameter does not vary greatly. Looking only at the highways, Hungary seems to be the country with the most developed infrastructure with its 81,680 km of paved highway. But to compare the Czech republic with its smaller size; 55,408km of paved highway is a conventional figure. The Czech Republic can be regarded as a most favored nation when looking at the general infrastructure including railway, highway, and airports, with regard to the size of the country. Though, there are similar conditions in all three countries regarding the transportation infrastructure. Start-up and operating cost: The third factor is what Alberto75 calls the costs that are related to infrastructure issues, the start-up and operating cost. Li Li points out these kinds of costs in the factors called cost of construction and land, and financial climate in terms of investment opportunities and threats. It is well known that it is costly to close down a warehouse and open a new one; it is even more costly, as in the MHC case, when it is two warehouses and one small local storing unit (DERI). The sensible act would be to merge the two warehouses into one, and keep DERI or merge it into the new warehouse. This scenario means that no new warehouse investment is needed. In order to obtain this goal, the satellite unit could be placed in one of the existing larger warehouses in Budapest or Prague. This means that in this case, no start-up cost is required and if Prague is chosen, as the warehouse cost in Hungary is more than Prague, the operating cost will be low. Again Prague is favored In the event that the satellite unit is placed in Bratislava, there will be a large start up cost. Regarding the operating cost, it is not possible to judge before contacting a 3PL provider and compare warehouses prices. The operating cost is even depending on the quality of the operating handling capability of the 3PL provider. 75 Alberto P., 2000, pp 279-281
- 119 -
Labor qualification: This criteria or soft factor, in our opinion, directly affects the logistics operating performance, and thereby the cost of the pipeline in general. Here the parameters such as availability of skilled labor, availability of transfer of managerial personnel, and work ethics will help to choose the location of the warehouse. Skilled labor is possible to find in the region even if the qualities will differ from country to another, but the definition of skilled labor in this case will be the skills in handling MHC products. If the satellite unit is located in one of the already existing warehouses, the access to skilled labor in handling MHC goods is favorable. In the event that the satellite unit is placed in Bratislava, it is possible to have availability to skilled labor, but the question is if these laborers are skilled in MHC products. As MHC didn’t have any direct logistics activities, the skilled labor in handling MHC goods is not available. The labor has to be educated in handling these goods in term of administration operations, logistics operations, and customer contacts. Quality of life: The quality of life will be measured from the economic situation of the countries that the warehouse might be located in. Bellows are some general measurements adapted from the world fact book76.
Table 5-7 : Economic Development, Figures as Quality of Life Measurement, Adapted from www.cia.gov/cia/publications/factbook Looking at the economic figures in order to evaluate the quality of life in each country, the figures do not differ a lot; all three countries are in a growing economy. The three countries represent an almost similar quality of life level, hence the noticeably high unemployment in Slovakia. In the following table, the soft factors discussed earlier are presented in relation to which location best supports the theoretically based soft factors.
Prague Budapest Bratislava (Slovakia)
Cost of import and export
Cost of import and export
Cost of import and export
Logistics and transportation infrastructure
Transportation infrastructure
Start up and operating cost Start up cost
Labor qualification Labor qualification
Soft factors
Quality of Life Table 5-8 : Locations Supporting the Theoretical Factors, Source: Authors.
- 121 -
• Own developed soft factors related to the research question To increase the validity of our analysis, we will complement the previous analysis (done by using theoretical soft factors), with other soft factors (developed on our own). We have developed a number of soft factors that are specifically related to the case study company, MHC, and to our research question. Supporting logistics flow from Karvina: In Karvina, Czech Republic, a new factory was inaugurated in 2002. The main products manufactured at this factory are the “Custom Procedure Trays” for the European market. Semi-automated drapes are also produced here since summer of 2003.
Karvina
Figure 5-10: Location of MHC Factory in the Czech Republic, Source: Authors. When analyzing any restructuring in the logistics distribution network, it is a crucial to look at the east European market from a wider perspective, including the manufacturing sites and not just end customer demand. This means that the new warehouse or satellite unit should be favorable for the flow of manufactured goods coming from Karvina in the Czech Republic, going to the central distribution center for Europe in Waremme, or directly to customers.
- 122 -
The product called PROCEDURE PACKAGE, produced in Karvina, is a package including several products needed by a clinic for a special intervention or surgery. The package may include products from other companies. The package is consolidated in the factory. Then the package is sent to Waremme where it is sterilized. From the process explained, it is clear that the creation of the product PROCEDURE PACKAGE products is consisting of purely logistics activities that could be handled more efficiently in a warehouse, as the labor is more skilled in handling such activities than in a factory. In the future, there are some suggestions for MHC to invest in a new sterilization site; this will mean that there will be no necessity to send the PROCEDURE PACKAGE to Waremme for sterilization. The PROCEDURE PACKAGE will be sterilized in Karvina, and this means that this product can be shipped to customers from the Czech Republic. Having a warehouse, in the Czech Republic (Prague) that is able to handle this process would increase the efficiency in the pipeline. Having the warehouse in Prague will make it possible to transport the PROCEDURE PACKAGE to end customers in east Europe and even in Germany, with regard to the nearness to Czech Republic. In the event that the satellite unit is placed in Bratislava, this is a good location that can be used to link the return flow of empty trucks from end-customers in Hungary, up to customers in the Czech Republic and after distributing to end-customer.
- 123 -
Figure 5-11 : Possibility in Using Bratislava as Location for Warehouse Which Can Support Return Flow to Karvina and Further to Waremme, Source: Authors.
Return empty trucks from end customers in Hungary
Karvina
To summarize up, both Prague and Bratislava have equal chances to support this factor; however the general thought would favor Prague. Distribution flexibility to tackle other east European countries: In our research question, one sub issue was to highlight how flexible could be a new distribution network design could be. What is meant with flexibility in the distribution network is the ability to extend the distribution area from the new warehouse (satellite unit) to include other countries. Basically, as mentioned in the research questions, the evolution of the market has to be taken into consideration as well as further strategic moves that MHC foresees, and the expected market growth in the East European market.
- 124 -
Figure 5-12 : Future Market Areas in East Europe, Source: Authors While being flexible, the optimal logistics network should also be able to adapt to emerging markets. According to interviews we had, the markets that may be likely to be supported from warehouses in East Europe are Greece, Slovakia, the Baltic States, and the current countries of the Czech Republic and Hungary. Looking at the three analyzed cases of location, and speaking from a geographical point of view, Bratislava could be an interesting location as it is situated in between of Czech Republic and Hungary and has a good starting-point to either Poland or the Baltic states as well as down to Greece and Turkey.
- 125 -
Although there is a good geographical position with Bratislava, the better infrastructure in the Czech Republic makes Prague more favored again. But the geographical position of Bratislava is very strategic, and Slovakia’s accession to the EU is promising development in the logistics and transportation infrastructure as well as other fields. This make the two positions rather equally rated. Supporting weight of volume demand: This factor means how efficiently the chosen location will support the area of the market with the highest volume demand. From the data gathered, it is clear that the volume demand is more weighted on the Hungarian market, is shown in the picture below:
Figure 5-13 : Volume Delivered per Country, Source: Authors.
Percentage of delivered volume per market
7% 20%
73%
Czech Republic Hungary East Germany - DERI
This means that the chosen location should support the logistics activities directed to the area of the market that has the greatest demand in terms of volume, which is the Hungarian market. But what is not highlighted on this chart is the monetary value related to the volume; an aspect that is important to be aware of. High volume is not necessarily equal to high profit.
- 126 -
Nevertheless, this factor only highlights the volume demand, not the value of the volume demand. Looking at the Hungarian market from the volume point of view makes it appear more significant than the Czech market and DERI. The locations that can support this factor best are Bratislava and Budapest. In the event of placing the warehouse in Bratislava, it is a middle point close to the Czech Republic, and even to Hungary. Here, it is possible to prioritize Hungarian market but still maintain good performance for the Czech market, as the distance to the Czech Republic is not far. If choosing to locate the satellite unit in Budapest, due to the higher weight of Hungarian customers in volume demand, then there is a risk that the Czech market and DERI’s customers will be less prioritized. Even with this risk, if it is possible to keep the same efficiency the entire east European distribution market, locating the warehouse in Budapest is a good decision. In the following table, the author developed soft factors are presented in relation to which location support the factors.
Prague Budapest Bratislava (Slovakia)
Supporting logistics Flow from Karvina Supporting logistics
Flow from Karvina Distribution flexibility Distribution flexibility
Soft factors
Supporting Volume Demand
Supporting Volume Demand
Table 5-9 : Locations Supporting Own Developed Soft Factors, Source: Authors. Finally, it is important to point out that the choosing of criteria, the decision of which criteria is supported by which location, and the suggestion of where to locate the satellite unit is based on our opinion, experience from the case study company MHC, and the reflection of our specific research question. If same kind of analysis were done by MHC it self, then they might get other results as they have more experience on how to run their own business and how to improve it.
- 127 -
• Is Prague the optimal location while merging the warehouses? In the previous soft factor discussion, the analysis was built on subjective judgment derived from our limited experience and knowledge of the case study company, MHC. This analysis, according to our opinion, did not generate a clear measurable result. Therefore, we decided to perform a measurable estimation to decide which location is the most optimal. In the following table we summarize the soft factors analysis. According to the thoughts that we developed while working on the project, we ranked each soft factor on a scale from 0 to 10 for each country. Then, because not all soft factors have the same importance, we attribute a weight to each soft factor. According to the different weight linked to all the soft factors, we multiply the rank we gave by the weight. The rank we give each location will vary as follows:
• From 1-5, the location poorly supports the factor • From 6-7, the location supports the factor on a moderate level • From 8-10, the location supports the factor on an advanced level
- 128 -
Factors Czech, Prague Hungary, Budapest Slovakia, Bratislava Description Wei
ght Evalua–tion
Evalua–tion weighted
Evalua–tion
Evalua–tion weighted
Evalua–tion
Evaluation weighted
Cost of export and import 1 10/10 10/10 10/10 10/10 10/10 10/10
Logistics infrastructure 3 8/10 24/30 5/10 15/30 NR NR
Start up cost 4 8/10 32/40 8/10 32/40 0/10 0/40 Operating cost 2 9/10 18/20 6/10 12/20 NR NR Labor qualification 2 8/10 16/20 8/10 16/20 5/10 10/20
Quality of life 2 6/10 12/20 6/10 12/20 4/10 8/20 Supporting logistics flow from Karvina
4 9/10 36/40 5/10 20/40 8/10 32/40
Distribution flexibility 6 8/10 48/60 6/10 36/60 8/10 48/60
Supporting weight of volume demand
3 5/10 15/30 9/10 27/30 7/10 21/30
235 / 300 201 / 300 147 / 250 TOTAL 78.3 % 67 % 58.8 % Table 5-10 : Ranking Locations Correlated to the Importance of Soft Factors, Source: Authors. Note : NR stands for not ranked, due to lack of data to evaluate the soft factors. According to the result we obtain in the above enquiry, Prague appears clearly as the convincible location.
- 129 -
5.3.4 Cost simulation alternative satellite unit:
After having looked at the soft factors, we decided to elaborate on a cost simulation. In this cost simulation the parameters are numerous as well as the uncertainties. The tools are limited. But we always detailed the assumptions we made and we advise the reader of the uncertainties they may create. While regarding the market and possible changes that may occur, we decided to not include the distribution of the East Germany in our simulation. It appears that while merging the Czech and Hungarian market, it is not realistic to plan to distribute DERI from the satellite unit. This is from a geographically point of view. It is obvious that it wont be efficient from transportation point of view to, from any location, go back to the German regions and distribute the seven end customers in east Germany. We tried to estimate a cost structure when coming to the three cases already discussed in the previous part related to soft factors. Note: Operatively speaking, we assume that the warehouse won’t be changed.
5.3.4.1 Simulation Model
To have an idea of what could be the freight transportation cost, we used a simulation model developed by Schenker. We simulated it in the Logistics Department of Chalmers University. In order to increase the reliability of the simulation model we wanted to test the result of the simulation model comparatively with a real case. Hence we simulated the freight distribution of the current situation. We got the following result:
- 130 -
Simulation Model Real Case Freight Transportation: Czech Republic € 15,800 € 18,077 Freight Transportation: Hungary € 25,400 € 26,045 Freight Transportation: Total of both € 41,200 € 44,122 Table 5-11 : Comparison Between Simulation Model and Real Case, Source: Authors. We observe that the result of the simulation model is reliable –only 6.6% deviation from the real case. After this preliminary checking we decide that the simulation model was applicable and usable for our case study.
5.3.4.2 Alternative PRAGUE
Line haul costs: Currently 16 508 € for 470 m3. With a proportional rule: 470m3 + 1,712 m3 ≅ 2,200 m3 may be delivered with 77,300 €. Warehousing cost: The total warehousing cost would still be equal to the fixed + variable costs that occurred in the warehouse. Fixed costs: 200 pallet places were rented in a warehouse. We think the place needed will not be proportional to the increase of volume (volume of Czech market + Hungarian market). The volume of the Hungarian market is around 3.5 times the Czech one (1,712 m3 / 470 m3 ). We think the place needed will not be 200 x 4.5 as we may think as first idea, but 200 x 3 = 600. The fixed cost related to this rent is: 60 000 Czech Crowns per 200 pallets places. Therefore it will be 60,000 CZK x 3 = 180,000 CZK ≅ 5,500 € per month. Therefore: 5,500 x 6 months = 33,000 € for 6 months
- 131 -
Variable costs: On the other hand, the variable cost will increase more or less proportionally with the volume. Since some activities are based on the order it is not strictly true. But we take the increase of the variable cost according to an increase in the volume as a hypothesis. The variable was 183,473 CZK ≅ 5,600 € for 6 months and the Hungarian market. There will be 4.5 ( = 1 + 3.5 ) times more, if the handling of Hungary is operated out of Prague: 25,200 €. According to our simulation, the warehousing cost will be: 58,200 € = 33,000 € + 25,200€.
- 132 -
Freight transportation cost: Here is a screen capture of the model running for a distribution from Prague to the Czech and Hungarian markets.
Figure 5-14 : Screen Capture of the Model Running for a Distribution from Prague, Source: 4Rooms, SCModeler. The result we obtain via this simulation was: 563 002 SEK ≅ 61 700€. The freight transportation cost provided above is just one example and would be difficult to apply in a real case. We assume MHC-Czech Republic will keep the 3PL contract with DHL for warehousing and also for freight transportation. While simulating a case on any logistic software, what is relevant and accurate is without doubt the difference between the cases simulated. As an absolute result, it may include a lot of uncertainties. But without having any other method to have a costs structure we decided to work with this cost.
- 133 -
Carrying expense: Unfortunately, we are not able to provide the reader a reasonable simulation on how the evolution of the total stock will be in the satellite unit while merging the warehouses. This is because the simulation needs several input parameters that are still have a high uncertainty.
5.3.4.3 Alternative BRATISLAVA
In our simulation, we assume the line haul cost and warehousing cost will be the same as they were for Prague. Only the freight transportation is changing in our case.
Figure 5-15 : Screen Capture of the Model Running for a Distribution from Bratislava, Source: 4Rooms, SCModeler. The model gave us the following result: 467,096 SEK ≅ 51,200 €
- 134 -
5.3.4.4 Alternative BUDAPEST
We assume the consolidation on the line haul with SCA, as well as the combined warehousing activities. Line haul costs: Currently 17,309 € for 1,712 m3. With a proportional rule: 470m3 + 1,712 m3 ≅ 2,200 m3 may be delivered for 22,242 €. Warehousing cost: Total warehouse cost 76,961€. As MHC is charged for their current warehouse in Budapest, there are no fixed costs. Then if we assume the increase of the variable cost is correlated with the volume, we can apply a proportional rule: Variable costs: In the current situation, the cost is 76,961€ for a total volume transiting via this warehouse 1,712 m3. For a new volume around 2,200 m3 transiting via this warehouse our estimation is: 76,961 x (2,200 / 1,712) ≅ 100,000€.
- 135 -
Freight transportation: Again we used the simulation model:
Figure 5-16 : Screen Capture of the Model Running for a Distribution from Budapest, Source: 4Rooms, SCModeler. The model gives a cost of: 395,104 SEK ≅ 43,500 €.
- 136 -
5.3.5 Costs structure for the SATELLITE UNIT network:
Bratislava 186,700 € 77,300€ 58,200 € 51,200 € Budapest 220,461 € 76,961 € 100,000 € 43,500 €
Table 5-12 : Costs Structure of the Analyzed Locations for Alternative 1, Source: Authors.
Comparaison of cost for Each location
0
50000
100000
150000
200000
250000
Prague Bratislava Budapest
Euro
(€)
Line Haul Cost Warehousing Freight Transportation
Figure 5-17 : Total Cost Comparison for the Three Locations, Source: Authors. We see the cheapest case is Bratislava. The cost difference between Bratislava and Prague is not large. And with regard to the soft factors analysis, Prague is still a good compromise. Budapest is resulting as an expensive pipeline cost mainly caused by the warehousing cost. But as this is a simulated case, in real practical case warehousing activities in Budapest might be improved by implementing effectiveness program.
- 137 -
5.4 Analysis of the Alternative two: Centralized Configuration
Here we simulate the case were all the products are directly distributed from Waremme in Belgium. Freight transportation costs will be highlighted. The DC in Waremme will absorb the increased costs related to stock with almost no impact. According to MHC, the east European Market currently represents only 4% of the flow of products from Waremme delivered to all of Europe. Thus, an increase of 4% of the flow may represent even no increase, or very limited in the safety stock and in the cycle stock. We simulated the distribution from Waremme.
Figure 5-18: Screen Capture of the Model Running for a Distribution from Waremme, Source: 4Rooms, SCModeler.
- 138 -
The simulation model generated a cost related to the freight delivery of: 1,000,340 SEK ≅ 109,742€.
5.4.1 Strength and weakness of the centralized case
The first impression from this result is that it generates high transport costs and low overall pipeline costs. This result, low overall cost, was expected as the theory pointed out in several sessions that the main advantage of a centralized distribution is the tremendous overall pipeline cost reduction, though transportation costs increase. Abrahamsson77 claims that even if the transportation cost increases this will be balanced by the stock level in the central warehouse which will not increase to a big extent. As a result of the turnover of the central warehouse will instead increase. Mattsson78 highlights the benefits of the centralized distribution structure in the form of economy of scale. The centralized case has several benefits but it is often difficult to implement, this is also pointed out in the theory. Abrahamsson79 found the centralization process a bit complicated requiring a well integrated information system, and this kind of information system is often a very costly investment which small and middle size companies cannot afford. For the case of MHC, there are several drawbacks with such a distribution structure; below follows a discussion about these drawbacks.
5.4.1.1 Customer service
There are risks related to customer service if applying this structure. In the east European market there are customers that require delivery within 24 hours. The question is if this requirement can be satisfied if delivering from Waremme as the
77 Abrahamsson M., 1992, p 220-ff 78 Mattsson S.-A., 2002, p 247 79 Abrahamsson M., 1992, p 224
- 139 -
transport time will increase in such a distribution structure. Express delivery is costly. Another customer service aspect is that this structure does not support the area of the market that has the highest volume demand. Hungary has a geographically long distance from Waremme, which means that customers with great demand will be supplied with a longer lead-time. Finally, the experience of the Nordic case shows that there will be a lot of disruption in the outbound flow, at least in beginning. There might also be delays in the transportation lead-time caused by the fact that it is not possible to drive heavy trucks through Germany during the weekends; this is a serious vulnerable aspect when the outbound flow is in high frequency.
5.4.1.2 Flexibility
Regarding the flexibility aspects, this structure might not be able to support the market growth in east Europe as it is expected to increase by about 80%, in the Czech Republic and 80% in Hungary. It also does not support extending the distribution area to include other countries such as Greece, Slovakia, and the Baltic states.
5.4.1.3 Concealed cost
The reliability of the simulation model is an important factor that should be taken into consideration: the transportation cost generated from the simulation model is based on price parameters that were developed when the software model was created. This means that the price structure may have changed in reality, and the resulting cost is not very accurate.
- 140 -
Another aspect is the tied-up capital in transit, which should not be neglected, as there will be high outbound frequency and large volume transported over a long distance. The environmental cost is also an important factor to consider. Generally, if the strategy is too centralized, this will mean more frequent deliveries over a longer distance, and since the transportation environment costs are expected to increase, this structure is not as cheap as it appears to be. We also point out in the theory part 3.3.3, “Overview of Pan European Logistics Trends”, that future transportation trends will not the make the centralized alternative as efficient as it might appear from now. This is due to the transportation cost that will increase while crossing Germany for instance.
- 141 -
5.5 Sum up of the results from different alternatives
First we summarize, the costs related to the current situation, but we exclude DERI since we do not take DERI into consideration when we look at merging the warehouse, or distributing directly from Waremme.
Figure 5-19 : Comparison of Cost Structure for the Whole Pipeline, Source : Authors.
- 142 -
5.6 Risk Analysis of Logistics Customer Service
In this part we will carry out a limited logistics service analysis. This analysis presents as a risk analysis associated with how the logistics customer service can be affected by any re-design of the distribution network. The case discussed here is merely an example that we use in order to make the reader aware of that any distribution network redesign will one way or another affect the logistics customer service. We use a real case from the case study company MHC; an earlier distribution network design project carried out on the Nordic market in November 2003.
5.6.1 Why a risk analysis of logistics customer service?
It is conventional that when companies are carrying out a distribution network study, the cost aspects gain the most attention. Usually, such projects are driven by cost reduction goals. In the theory we could find statements that are in agreement with this thought, according to Korpela et al.,80 when companies are creating or restructuring an international distribution network design, a customer service based approach is usually not proposed. The more widely used approaches for logistics network design are the minimization of cost and maximization of profit. Even in our study, the cost driven distribution network design analysis is prioritized. This is because the aim of this study is to illustrate cost improvement possibilities when re-designing the distribution network. But what we are aware of is that any logistics network structure, even the one that is regarded as the most optimal in term of a cost point of view, will have an influence on the logistics service level toward the end customer.
80 Korpela J. et al., 2001, p 195
- 143 -
5.6.2 The case MHC nordic market
The aim of this part of the analysis is to provide the reader with the risk associated with a distribution network change, by highlighting the case of the MHC Nordic market. This case has no correlation with the east European case that is highlighted in our study in terms of market parameters, except that both cases are about restructuring a distribution network. We are aware that different requirements due to different national cultures means that a standard definition of logistics service is not possible and MHC cannot apply the same kind of service to all its customers. In the theory, we could find statements supporting our thoughts. Mentzer et al.81 means that the logistics service offering of a company will differ depending on the characteristics of the market. They claim that logistics offerings are subject to culturally influenced preferences, which are widespread internationally. The logistics service is more likely to be different for different market segments, since service expectations differ across national and cultural boundaries. What has been mentioned above confirms that the customer service figures generated from the distribution network restructuring in the Nordic market will not necessarily be in same manner for the east European market.
5.6.2.1 The transport complaints
For example, looking first at the transport complaints in the Nordic market, it is clear that the customer complaints on transportation activities, mainly on shipment delays, increased dramatically after closing down the Nordic warehouse. According to MHC this was because the incapability of the central DC to handle the Nordic market at the beginning. The transport complains decreased in time as the central DC in Waremme improved its capability in handling the Nordic market. 81 Mentzer J. T. et al., 2004, p 15
- 144 -
For the east European case, we expect the same scenario to happen, whether east European customers will be served from Waremme or from the merged warehouse, as it is always difficult to adapt quickly to an increased amount of customers. Then, delays as with the Nordic case might happen. But we do not expect that the amount of customer complaints will be as high as for the Nordic market because the Nordic customers are known to be keen to evaluate its supplier’s service quality. On the other hand, the east European customers are not educated to evaluate the logistics service level of the suppliers, and according to MHC there are very few customers in the east European market that habitually evaluate the service of MHC.
5.6.2.2 The Warehouse complaints
This figure is not very clear as the service complaints from 2003 for the warehouse include both transport and warehouse complaints, as Tamro took care of both. But the general increase of damaged goods after closing down the warehouse was the reason for increased customer complaints about the warehouse activities for the Nordic market. On the other hand, according to MHC, after serving the customers from Waremme it was easier to identify the source of damage. The next chart shows a clearer picture linking the complains to the number of orders, it is obvious that there were always trends of increased complaints, but the biggest effect was after closing down the warehouse even if this effect did not occur immediately.
- 145 -
Percentage of Total Service Complaints/Number of Order
0,00%2,00%4,00%6,00%8,00%
10,00%
janv-0
3
mars-03
mai-03
juil-0
3
sept-
03
nov-0
3
janv-0
4
mars-04
mai-04
juil-0
4
sept-
04
Figure 5-20 : Percentage of Total Service Complaints, Source : MHC. For the east European case, it is not sure that the same will happen. Generally, as mentioned earlier, the restructured warehouse that will supply the market will not have the capacity in the beginning to serve the market optimally. This will mean that there are risks for increased damaged goods related to human errors and other factors, but on the other hand as there will be fewer performers toward the outbound flow and it will be easier to identify the source of damage and eliminate it.
5.6.2.3 The order completeness
According to MHC, the order completeness is a positive part of the move toward centralization of the distribution for the Nordic market. The better order completeness figures after closing down the Nordic warehouse are a result of different reason. According to MHC, one reason is that in Waremme, the stock is easier to access, which makes it easier to fulfill the whole order. We see that the improved order completeness is also a result of centralizing the information flow. For the east European case, a similar restructuring of the distribution network dose not need to lead to the same result. But, even in the east European case there will be a centralized information system flow, which may
- 146 -
lead to a better order completeness ratio. But, on the other hand, there are more markets to that can be prioritize to be shipped from the central DC in Waremme and this will affect the order completeness negatively for smaller markets, as these will be less prioritized.
5.6.3 The Possible risks affecting the logistics customer service
Finally, to sum up what have been discussed above, and drawing a conclusion from the Nordic case, the risks affecting the logistics customer service associated with any modification of the distribution structure are:
• INCREASED CUSTOMER COMPLAINTS ON THE TRANSPORT SERVICE as a result of:
o Increased lead-time generated from DELAYED SHIPMENTS due to incapability of the centralized warehouse unit to handle increased market area. This risk is expected to decrease by adapting to new market conditions
• INCREASED CUSTOMER COMPLAINTS ON THE WAREHOUSE
SERVICE as a result of: o INCREASED DAMAGED GOODS
• RISK THAT ORDER COMPLETENESS WILL BE AFFECTED
NEGATIVELY, as there will be markets that are prioritized, the OC will affects negatively on mainly smaller markets.
• There is also POSSIBILITY THAT THE ORDER COMPLETENESS
WILL BE IMPROVED by centralization, as in the Nordic example, this due to better information flow and easier access in the warehouse.
- 147 -
5.6.4 Results
First we would like to remind the reader of our research question: How could an optimal distribution structure be designed?
1. COST STRUCTURE (What is the cost associated with any distribution network design?)
2. LOCATION OF LOGISTICS FACILITY (In case the of re-designing the logistics network, where is the ideal location of the logistics facility?)
3. FLEXIBILITY (How flexible could be and has to be a new distribution network design?)
4. RISKS FOR REDUCTION OF THE LOGISTICS CUSTOMER SERVICE (What are the risks associated with any modifications of the distribution network in terms of the logistics customer service level?)
Result of the analysis: 1. The result from the cost analysis for the different distribution alternatives
generated the previous figures. Connecting this result to the research questions, the optimal distribution structure (from a cost perspective) is obviously: Waremme east European end-customers, Centralized Case.
2. The location of the logistics facility in the case of merging the warehouse was
described previously. According to the trade-off between the cost analysis and the soft factors discussion, we found that Prague, even if it is more costly than Bratislava, remains a better solution.
3. Regarding the flexibility, the previous analysis points out that merging the
warehouses and locating one in Prague, is the best solution to support further evolutions of the east European market (growth) as well as extending the distribution area (Baltic states, Slovakia, Greece, etc.)
- 148 -
4. The analysis concludes the centralized case includes high risks of providing a
poorer customer service because of lead-time and handling goods problems. Merging warehouses includes a risk of depleting the service level due to handling operations in the beginning. On the other hand, the current situation does not include risk to inferior service to customers.
- 149 -
6. Conclusion Our first conclusion is that there is obviously no distribution structure that is optimal simultaneously from the perspectives we looked at: cost, flexibility and service. We tried to present a logical and rational study applied to deciding a network design. Since our study is based on a real business case, it cannot be an ideal solution. In business, any situation includes risks, choices and options. In light of the previous results, we recommend that in the case of the MHC East European market, the company should adjust their distribution structure by merging the Czech and Hungarian warehouses into a main one located in Prague, and exclude the DERI market from the future distribution network for east Europe. DERI can either be supplied directly from Waremme or keep the current structure. The reasons for our recommendation are as follows:
• Uncertainties in our result (discuss below). • A good adaptability to further moves in the east European market. • After having balanced the pipeline cost with the risks that include the
centralized solution, we think the pipeline costs for a satellite unit in Prague are still reasonable.
• This solution facilitates further implementation of VMI (see suggestion for further research) in east Europe, particularly in Hungary where the highest volume demand is.
6.1 Uncertainties in our study
As our study is based on cost analysis where the inputs are gathered from a case study company statistics data, in some cases it was possible to get access to reliable data, and in other cases we made own assumptions. Additionally, as this
- 151 -
study contains cost simulation of virtual distribution alternatives, the cost –generated from this simulation– is not a hundred percent reliable. This leads us to the conclusion that the centralized alternative (distributing directly the customers from Waremme) is the most cost efficient alternative, but as it is simulation-based, it has to be taken with extreme cautious consideration.
6.2 General Recommendations to MHC east European Market
While studying the case of MHC, we would like to add general thoughts on possible improvement for the business.
6.2.1 On the service measurement
It is remarkable that MHC does not measure their efficiency through their customers. Perhaps East European market is not a big enough volume, but we think as, Bill Gates said, “Your most unhappy customers are your greatest source of learning.” We are deeply convinced that MHC should install service customer efficiency. In other word you cannot improve what you do not measure!
6.2.2 Educating the customers:
MHC is able to supply a timely hectic demand: customers are not submitted to any constraints as to when to order MHC products. This capacity of MHC is one of their main service advantages. But it is where the efficiency of the distribution pipeline is the most deteriorated. We think that educating customers to order on regular time bases will lead to tremendous cost improvement in the freight transportation area.
6.2.3 Time dependency
The value of our analysis is time dependent. As we built it, it is a tool to help MHC to decide. There are some generalities that will remain true for a time period
- 152 -
mid term, but some inputs may be suffer from dramatic changes (for instance due to a re-organization I the company). Hence our results might not be reliable any more. Then this is very important for MHC to be aware of. On the other hand the structure of the model we created may be seen as a reusable pattern. To re-use the model, it is essential to change the inputs as well as for the cost analysis as for the soft factors discussion. Then other conclusions may be drawn according to the new outputs of the model. As recommending this, we are aware that changing and restructuring any current structure may be worrying, but we could end up by the following quote of John D. Rockefeller “Don't be afraid to give up the good to go for the great.”
- 153 -
7. Suggestions for Further Research
7.1 Logistics Service Quality Analysis
As mentioned in the theoretical section and in the risk analysis of the logistics service, it is not possible to implement a distribution network to achieve purely internal requirements such as cost reduction without a detailed understanding of customer needs. In our study, we do not evaluate in detail how customers are going to be affected by changing the distribution network structure. Therefore, we consider this type of study of high importance to perform in case MHC decides to restructure its east European distribution network. As a starting point, we suggest the model of Korpela82 et al., that presents a process for logistics distribution network design that is driven by customer service parameters. The process has five basic steps, and is presented in detail in the theoretical chapter:
1. Defining the problem. 2. Determining the strategic importance of the customers. 3. Analyzing the customers’ preferences for customer service. 4. Evaluating the alternative nodes and links in the logistics network. 5. Optimization: The final phase in the proposed approach involves optimizing
the logistics network based on the priorities defined in the previous phase.
7.2 Vendor Managed Inventory (VMI):
Basically VMI is logistics cooperation where suppliers take full responsibility for the inventory for the customers, both for its size and for the availability of the stock.
82 Korpela J. et al., 2001, p 195
- 155 -
We see customers that order hectically and customers that order in big quantities. In order to stabilize the nature of the outbound flow (consumption, information, freight motions, and express deliveries), we suggest that MHC to implement VMI with the biggest customers in East Europe markets. In this way, every big customer can act as a potential stock point in the distribution network. This will give a better covering of the markets, while minimizing the freight transportation cost. The study of potential benefits from such implementation could be the topic for a further research.
- 156 -
8. References Published Sources Books: Abrahamsson, M., 1992, Tidstyrd Direktdistribution: Drivkrafter och logistiska konkurrensfördelar med Centrallagring av producentvaror, Sweden, Studentlitteratur Lund. Bowersox, D.J., et al, 2002, Supply Chain Logistics Management, International Edition, USA, The McGraw-Hill Companies Inc. Brannick, T. & Roche, W.K., 1997, Business Research Methods: Strategies, Techniques and Sources, Irland, Oak Tree Press Dublin. Coyle, J.J., Bardi, E.J., & Langley, C.J..Jr., 1992, The Management of Business Logistics, 5th edition, USA, West Publishing Company. Coyle, J.J., Bardi, E.J. & Novack, R.A., 2000, Transportation, Fifth edition, USA, South Western College Publishing. Christopher, M., 1998, Logistics and Supply Chain Management: Strategies for Reducing Cost and Improving Service, Second Edition, England, Pearson Education. Davidson, B. & Patel, R., 2003, Forsknings Metodikens Grunder: Att planera, genomföra och rapportera en undersökning, Third Edition, Sweden, Studentlitteratur.
- 157 -
Gill, J. & Johnson, P., 1997, Research Methods for Managers, second edition, London, Paul Chapman Publishing Ltd. Harrison, A., Remko H., 2002, Logistics Management and Strategy, England, Prentice Hall. Hicks, D. T., 1992, Activity-Based Costing for Small and Mid-Sized Businesses, Published in the United States of America. Lapin, L., L., 1997, Modern Engineering Statistics, Published in the United States of America. Mattsson, S-A., 2001, Effektivisering av Materialflöden i Supply Chains, Sweden, Växjö universitet. Mattsson, S-A., 2002, Logistik i Försörjningskedjor, Sweden, Studentlitteratur Lund. Neuman, W.L, 1997, Social Research Methods: Qualitative and Quantitative Approaches, Third Edition, USA, Allyn and Bacon. Persson, G. & Virum, H., Logistik för Konkurrenskraft, Sweden, Liber Ekonomi. Vogt, J.J., et al, 2002, Business Logistics Management: Theory and Practice, South Africa, Ckyson Printers. Yin, R.K., 1994, Case Study Research: Design and Methods, Second edition, Volume 5, USA, SAGE Publications.
- 158 -
Articles: Alberto, P., 2000, “The Logistics of Industrial Location Decisions: An Application of the Analytic Hierarchy Process Methodology”, International Journal of Logistics: Research and Applications, Vol. 3, No. 3, pp 273-289 Bulletin of the Observatory on Transport Policies and Strategies in Europe, September 2004, Issue No.12, Paris, France, CNT - Observatory on Transport Policies and Strategies in Europe. Ernst and Whinney, Warehousing Accounting and Control: Guidelines for Distribution and Financial Management, National Council of Physical Distribution Management, Oak Book, IL, and Institute of Management Accountants (formerly National Association of Accountants), Montvale, NJ, 1985, p29. Impact of EU Expansion on Europe’s Warehouse Markets, August 2004, Amsterdam, Netherlands, Prologis. Korpela, J., Lehmusvaara, A. & Tuominen, M., 2001, “Customer service based design of the supply chain”, International journal of production economics, 69, pp 193-204' Mentzer, J.T, Matthew, B.M. & Cheung, M-S., 2004, “Global Market Segmentation for Logistics Services”, Industrial Marketing Management, 33, pp 15-20. Roth, H. P. Sims, L. T., “Costing for Warehousing and Distribution”, Management Accounting, Aug. 1991, 73,2, ABI/INFORM Global pp42-45. WHITE PAPER European transport policy for 2010: time to decide, 2001, Luxembourg, European Commission.
- 159 -
Unpublished Sources: Bergqvist, R. & Esping, P., 2003, The Potential of West European Sea-Based Intermodal Systems, Gothenburg Sweden, Elanders Novum. Johnsson, F., Managing Director/CEO, Mölnlycke Health Care AB., Annual Report 2003. Lumsden, K. R., Fundamentals of Logistics, Chalmers University of Technology, Department of Transportation and Logistics, June 2003. Internet sources Graham, P., “Cost Drivers, Cost Behaviour and Cost Estimation”, University of Canberra, 1999-08-02, Australia, <http://www.canberra.edu.au/uc/lectures/mantech/accounting/unit3880/Lecture_3A.html>, downloaded 2004-09-25. Company Information, < www.molnlycke.net>, Continuously. Interview Sources Clemensson, Anders, Supply Chain Manager, Mölnlycke Health Care AB., Headquarter Gothenburg, 2004-09-27, 10:00 to 11:00. Enarsson, Leif, Assistant Professor, Department of Logistics and Transport Management, Gothenburg School of Business and commercial Law, Continuously Hultkrantz, Ola, Programme Coordinator Chalmers International Masters Programme in Management of Logistics and Transportation, 2004-11-29, from 16:00 to 16:45.
- 160 -
Huntejova, Emilja, Local logistic and business responsible for Mölnlycke Health Care AB. Czech Republic, placed in Prague, Continuously via e-mails and phone conversations. Horn, Robert, Local logistic and business responsible for Mölnlycke Health Care AB. East Germany DERI, continuously via e-mails. Jansson, Hans, Distribution General Manager Europe, Middle East, Africa, Mölnlycke Health Care AB., Headquarter Gothenburg, 2004-09-27, from 11:00 to 12:00. Johnnyson, Pauline, Global Supply Manager, Mölnlycke Health Care AB., Headquarter Gothenburg, Continuously Lumsden, Kenth, Professor, Logistics Department, Chalmers University, 2004-11-26 from 16:00 to 16:30. Mooren, Roderik, Business Controller, Mölnlycke Health Care AB., Headquarter Gothenburg, 2004-09-22, from 10:00 to 11:15. Månsson, Jan, Distribution Manager Europe, Middle East, Africa, Mölnlycke Health Care AB., Head Quarter Gothenburg, Continuously Nilsson, Sven, Supply Chain Manager – Procedure Pack – Global Supply, Mölnlycke Health Care AB., Head Quarter Gothenburg, 2004-10-19, from 16:00 to 16:30. Toth, Nandor, Local logistic and business responsible Mölnlycke Health Care AB. Hungary, placed in Budapest, continuously via e-mails.
- 161 -
9. Appendix 1: Czech Republic Activities Location of the warehouse DHL Logistics (Czech Republic) Zdebradska 69, hala C (BOSCH) 251 01 RICANY Czech Republic Size: MHC just rents agreed space to DHL into the main warehouse. During the first semester 2004, it was 200 pallet places every month. Line haul carrier: The company responsible to move those goods is DHL. The transport structure is charged per pallet, according to the following pricing rate:
Table 9-1 : Pricing Rate of DHL for Line-haul Transportation, Source : MHC
- 163 -
Market: The end customers in the Czech Republic are allocated around the market areas below, and the industry areas are market segments that have been segmented according to location from the DHL warehouse: Industry area 0: 1-20 km Industry area 1: 21-100 Industry area 2: 101-200 km Industry area 3: 201-300 km Industry area 4: 301 – 400 km Industry area 5: 401-500 km
- 164 -
10. Appendix 2: Hungary Activities Location of the Warehouse Mölnlycke Health Care Kft. BILK SCA Warehouse Ócsai út 7. 1239 Budapest Hungary Size: It is a big warehouse. Part of it is rented by SCA. It is 6,500 m2, and out of this 200m2 is for MHC. The total goods are about 12,000 m3; out of this MHC has 300m3. Line haul carrier: The Line haul carrier for this line is Hungarocamion: 1239 Budapest, Nagykőrösi út 351 Hungary SCA negotiates the prices for line haul shipments with Hungarocamion, but they need to negotiate good prices since it is their own contract, this price is Euro/m3. Rauscher to the warehouse in Budapest (Hungary): In this line, 4-5 trucks per year are received in the Budapest Warehouse depending on the demands, In the period 01.01.2004.-30.06.2004, two trucks came from Rauscher Austria:
• The first truck, valued at 9,000 €, net weight: 1,187 kg, gross weight: 1,640 kg, 12 pallets
• Second truck, value at 10,800 €, net weight: 1,570 kg, gross weight 2,000 kg, 14 pallets
Transport price for both trucks was 270 €.
- 165 -
Market: MHC-Hungary has around 500 customers around Hungary:
cs
stributors Th iffers. Hospitals sometimes buy once per months, but
• Hospitals • Small clini• Wholesalers • Pharmacies • And other dieir purchasing frequency d
a lot of times they order smaller quantities afterwards.
- 166 -
11. Appendix 3: East Germany-DERI Activities The Warehouse This warehouse does not cover all customers in East Germany, just seven particular customers. Location: Mittelsächsiche Textilreinigungs GmbH (MTR) Wasserweg 5 01591 Riesa Size: A space of 5-7 m3 for MHC assortment. Line haul carrier:
It is Thiel Logistics that operates the transportation from Waremme to Erftstadt and then from Erftstadt to DERI (MTR Riesa). The cost for line haul is charged according to Euro per m3, which can be found in the matrix defined in section value of current flow. Market: The seven end customers in East Germany supplied by DERI are segmented into transportation zone and industry code, used only for analyzing different target groups for marketing purposes.
- 167 -
12. Appendix 4: Czech Republic
Transportation Cost. Line haul: Waremme Prague The line haul costs were given already organized by Emilja Huntejova.
• Volume moved during the first semester 2004 was 330 pallets received from Waremme in 6 months, 470m3, for a Home Taking Costs of 519,628 Czech Crowns.
• 519 628 Czech Crown ≅ 16,508.26 € • The transportation price per m3 will be the total Home Taking Cost
519,628 CZK divided per volume (330 pallets or 470.497m3). Which is: 1,104.42 CZK per m3 and 1,574.6CZK per pallet. Freight transportation: Prague Czech end-customers The freight transportation cost was organized and obtained on our own by using data provided by Emilja Huntejova, MHC, as input to our computation. The 3PL that takes care of the freight transportation is DHL. The carrier charges MHC according to a price rate that is depends both on the distance and of the volume: Price = f (Distances, Volume).
• The distances are discretely divided into 6 areas ranging as follow: Industry area 0: 1-20 km Industry area 1:21-100 Industry area 2: 101-200 km Industry area 3: 201-300 km Industry area 4: 301 – 400 km Industry area 5: 401-500 km The distances are calculated from the DHL warehouse.
• The volumes are discretely divided into different drop size already described in Table 4-2.
- 168 -
Therefore, the following pricing rates are applied to move the goods into the Czech Republic. Distribution tariffMölnlycke Health CareAll prices exclude VAT
km from 1 21 101 201 301 401to 20 100 200 300 400 500
Table 12-1 : Freight Transportation Pricing Rate in the Czech Market, Source: MHC, internal document. Note: the table above is written according to the European way of writing figure. We sort the number of orders per delivery zone and relate it to the volume brackets set in the distribution tariff table, according to pricing rate set by DHL Czech Republic. This gave a total cost of freight transportation equal to 593,764 CZK.
- 169 -
13. Appendix 5: Hungary Transportation Cost. Line haul: Waremme Budapest The line-haul transportation cost was organized and obtained on our own by using data provided by Nandor Toth as input to our computation. The hauler, HungaroCamion, charges MHC as follow:
• 46,553.47 € for 1,662.624 m3. • The tariff is 28 € per cubic meter. • A volume of 1,662.624 m3 was moved on the line haul during the first
semester, 2004. Freight transportation: Budapest Hungarian end-customers The freight operates in collaboration with SCA. 4,130 (16 euro) per m3 from January to April where the price was fixed. This 4,130 HUF / m3 was calculated by SCA and approved by MHC, and was independent from the drop size and the distance. The freight transportation cost was organized and obtained on our own by using data provided by Nandor Toth as input to our computation. 1,084.061055 m3 x 4,130 HUF / m3 = 4,477,172.157 HUF Which is about: 17,309.16 € The freight transportation in May and June depends on a special price rate that is set by SCA. The price rate is given according to a two dimensions matrix, depending on drop size and distance. Those costs were provided and already organized by Nandor Toth. 1,074,061 Ft (for May) + 1,188,080.61 Ft (for June) = 2,262,141 Ft About 8,745 €. Total freight transportation cost in Hungary during the first semester of 2004 was 26,054 €.
- 170 -
Table 13-1 : Freight Transportation Pricing Rate in the Hungarian Market, Source: Staffel Pricing Rate. MHC, internal document.
- 171 -
14. Appendix 6: East Germany-DERI
Transportation Cost. Waremme Erftstadt: The carrier, Thiel, charges MHC to move the goods according to a price rate of € 4.9 per m3. With the assumption that all the goods delivered to customers were moved in this way, we know that between 01-01-2004 and 31-06-2004, the volume moved was according to the volume that Robert Horn gave to us, minus the exceptions and the customer that will be delivered from Waremme. Full Truck from Waremme to Erftstadt = 55 m³ = 270 € = 4.9 € per m³ 147.37 m³ x 4.9 € / m³ = 722.113 € Erftstadt MTR-Riesa DERI: The price rate applied by the carrier, Thiel Erftstadt, is outlined in the following matrix. It gives us the price to move goods from Erftstadt to MTR-Riesa warehouse, according to the volume of the shipment. 0.1 - 0.5 m³ = 59.30€ per m³ 0.6 - 1.6 m³ = 47.40€ per m³ 1.7 - 4.8 m³ = 40.40€ per m³ 4.9 - = 38.50€ per m³ We have to link this table according to the volume of the goods that moved from Erftstadt to MTR-Riesa warehouse. According to the data we gathered, the goods are always moved in quantities above 4.9€, on average 6m3, thus we apply the following formula: 147.37 m3 x 38.5€ = 5,686.45 €. Hence 5,686.45 € + 722.113 € = 6,395.858 € For the whole transportation line-haul (from Waremme to Riesa-DERI).
- 172 -
MTR-Riesa DERI East German end-customers 01.01.2004 - 30.06.2004 Volume (m³)
20.80 Krankenhaus Apotheke Glauchau will be delivered now via SEWA
20.46 Malteser Krankenhaus Kamenz 6 1.50% 24.28 Elblandkliniken GmbH u.
CO- Apothek Meissen 7 3.50%
0.07 Krankenhaus Olbernhau Olbernhau exception Total 168.45 m³
av. Per week 6.48 m³
net value 272792.00€
costs 8385.43€
average 3.07%
costs 49.78€
per m³
incl. warehousing administration freight to customer service Table 14-1 : Cost Structure of the Warehouse DERI Outsourced to MTR Riesa, Source: MHC. We want the reader to be aware of some details. First, the previous table includes customers that will be served from SEWA (Waremme); we exclude them from our calculation. Second, the rebate differs from one order to another, and in some cases there is even no rebate and therefore we have an average of a 3.07% rebate, which will represent the warehousing cost and freight transportation together.
- 173 -
15. Appendix 7: Czech Republic Warehouse
Costs Fixed costs: 200 pallet places are rented in a warehouse. The fixed cost related to this rent is: 60 000 Czech Crowns per month 60,000 x 6 months = 360,000 CZK for 6 months (Note: this cost is not a real fixed cost, since an increase of the activities could create an incremental need of the space needed. But this is for the next simulation where the business increases.) Variable costs: The variable costs are given by the in-handling cost + the total monthly variable cost. 162,353 + 21,120 = 183,473 CZK The computation of the in-handling cost can be found below. The element of the monthly variable cost can be found in the table below. Space rent: In case there is demand for space for more than 200 pallet places, DHL will charge MHC Prague with a cost of 9,68 CZK per pallet and day. These results were calculated by dividing the monthly fixed cost with the 200 pallets places already booked by the contract and 31 days. 60,000 / 31 / 200 = 9.68 CZK. In handling flow:
• 64 Czech Crowns per in-handled pallet. • From 01-01-2004 to 31-06-2004, 330 pallets were received. • Therefore the in handling cost were: 330 pallets x 64 CZK/pallets =
21,120 CZK. • 21,120 CZK ≅ 639.11 €
- 174 -
Month Outg TRPs
Out-handling Fees (CZK)
Labeling (CZK)
Packaging material (CZK)
Extra pallets warehousing (CZK)
Other extra services (CZK)
Total monthly warehousing variable costs (CZK)
Distribution to final customers (CZK)
Jan 2004 2,944 11,776 3,515 4,329 3,788 0 23,408 73,747 Feb 2,776 11,104 3,515 3,243 2,650 0 20,512 83,030 March 2,843 11,372 3,515 3,812 2,316 3,038 24,053 120,903 April 3,212 12,848 3,515 6,230 3,238 3,646 29,477 76,396 May 3,139 12,556 3,515 7,690 4,941 2,126 30,828 96,863 June 3,987 15,948 3,515 7,916 2,291 4,405 34,075 107,963 Total 18,901 75,604 21,090 33,220 19,224 13,215 162,353 558,902 Table 15-1 : Detail of the Handling Costs in the Prague Warehouse, Source: MHC, internal document.
- 175 -
16. Appendix 8: Hungary Warehouse Costs The total warehousing cost is equal to the fixed +variable cost costs that occurred in the warehouse. Fixed costs: No fixed costs in Hungary Variable costs: 76,961€ MCH Hungary pays only after the outbound m3 which is 11,800 HUF / m3. (45 € / m3) Since the outbound flow is approximately: 1,710.250 m3. 1,710.250 m3 x 45 € / m3 = 76,961 €