31
London Cultural Profile: Economic Impact of the City of London’s Cultural Sector JANUARY 2013 Sierra Planning and Management
London Cultural Profile:
Economic Impact of
the City of London’s
Cultural Sector
JA
NU
AR
Y 2
013
Sierra Planning and Management

1. Introductions
2. Project Objectives & Approach
3. Methodology & Overview of Scope
4. Culture: Range and Scope of Analysis
5. Results
6. Interpretation
Agenda

Sierra Planning and Management
Objectives &
Approach

Objective: To conduct an economic contribution analysis of
the cultural sector, for the primary purpose of generating a
dollar value of the direct economic contribution of the
defined cultural sector for the City of London;
Approach:
Engage City staff and other stakeholders in a ‘drill
down’ of culture industry economic ‘throughput’;
To develop an appropriate Economic Impact Model;
Analysis focuses on operational activity. We are generally not addressing capital – should do as a
forward exercise.
Objectives & Approach

Sierra Planning and Management
Methodology
& Overview
of Scope

Overview of Scope of Analysis: This assessment of the direct/local impact of culture,
addressed:
Workforce, employment and income in the City’s
cultural sector;
Revenues and expenditures generated by cultural
businesses and organizations;
Public spending and investment in cultural programs,
services and facilities;
Operational spending in cultural education; and
Cultural tourism.
Methodology & Overview of Scope

Sierra Planning and Management
Culture:
Range & Scope
of Analysis

Culture: Range & Scope of Analysis
Statistics Canada 2006 Census Data:
Place of Work by National Occupational Classification (NOC-S);
Place of Residence by NOC-S.

Culture: Labour Force
POR data indicates city residents with cultural occupations
generated around $309,137,952 in income.
9,030
7,445
Cultural Occupations
for London CMA
Cultural Occupations
for the City of London
Number of London Residents
in Cultural Labour Force
(POR 2006)
Total Occupations for
the City of London 96.1%
Cultural Occupations for
the City of London:
3.9%
Labour Force in the City
based on 2006 POR Data
Culture: Range & Scope of Analysis
Source: Statistics Canada 2006 Census
Culture: Range & Scope of Analysis
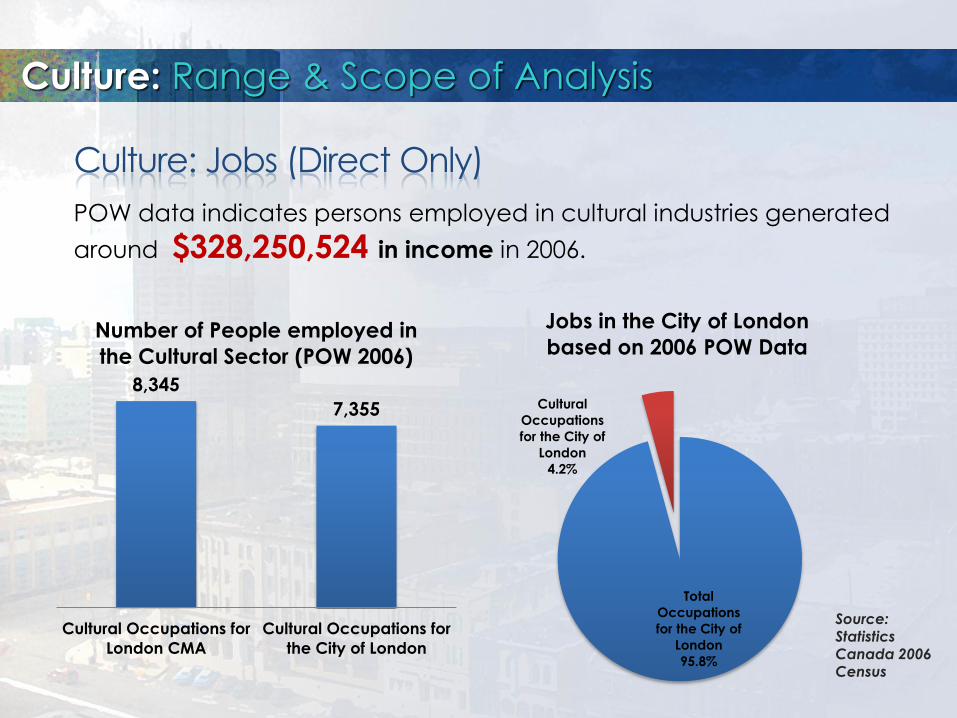
POW data indicates persons employed in cultural industries generated
around $328,250,524 in income in 2006.
Culture: Jobs (Direct Only)
8,345
7,355
Cultural Occupations for
London CMA
Cultural Occupations for
the City of London
Number of People employed in
the Cultural Sector (POW 2006)
Total
Occupations
for the City of
London
95.8%
Cultural
Occupations
for the City of
London
4.2%
Jobs in the City of London
based on 2006 POW Data
Source:
Statistics Canada 2006 Census

Culture: Jobs (Direct Only)
Culture: Range & Scope of Analysis
0
500
1000
1500
2000
2500
Libraries Heritage Heritage
and Libraries
Unallocated
Live
Performance
Visual and
Applied Arts
Written and
Published
Works
Audio-
visual and
Interactive
Media
No
. o
f Jo
bs
Place of Work 2006: Total Jobs by Cultural Occupation (NOC-S)
Category in the City of London
Comparison of the 2006 POR and POW data shows the number of
cultural jobs in the City was at parity with its cultural labour force.

Inclusion of Western Fair
and the LCC increase this
figure to over $80 million;
5 of London’s popular
performance spaces (out
of 13) generated almost
$25 million in revenues in
2011;
Figures reflect operating
revenues only; and
Figures reflect a subset of
buildings in the City.
BUILDINGS
Public Private
Culture: Key Buildings (including Performance
Spaces) (non-exhaustive)
Culture: Range & Scope of Analysis
Private and public buildings
generated around $60 million in 2011.

BUSINESS, GOVERNMENT AND EDUCATION
Private Business in Cultural Industries
Gov’t (Municipal) Providers of Cultural Services/Funding/
Employment
Educational Institutions and
Other Organizations
Culture: Private and Public
Culture: Range & Scope of Analysis

CBP shows there were over 1200 arts and culture businesses in the City of London in 2011.
Only 562 had determinable employment numbers;
Total employment was estimated at 7,703 in 2011;
Estimated total of
$329,705,349 in wages and salaries in 2011.
Culture: Establishments
Culture: Range & Scope of Analysis
0
500
1000
1500
2000
2500
3000
Nu
mb
er
of
Em
plo
ye
es
Total Employment by Cultural Industry
Category (CBP 2011)
Source: Statistics Canada 2011 Canadian Business Patterns Data
Architecture
Graphic Design
Interior Design
Newspaper Publishing
Periodical Publishing
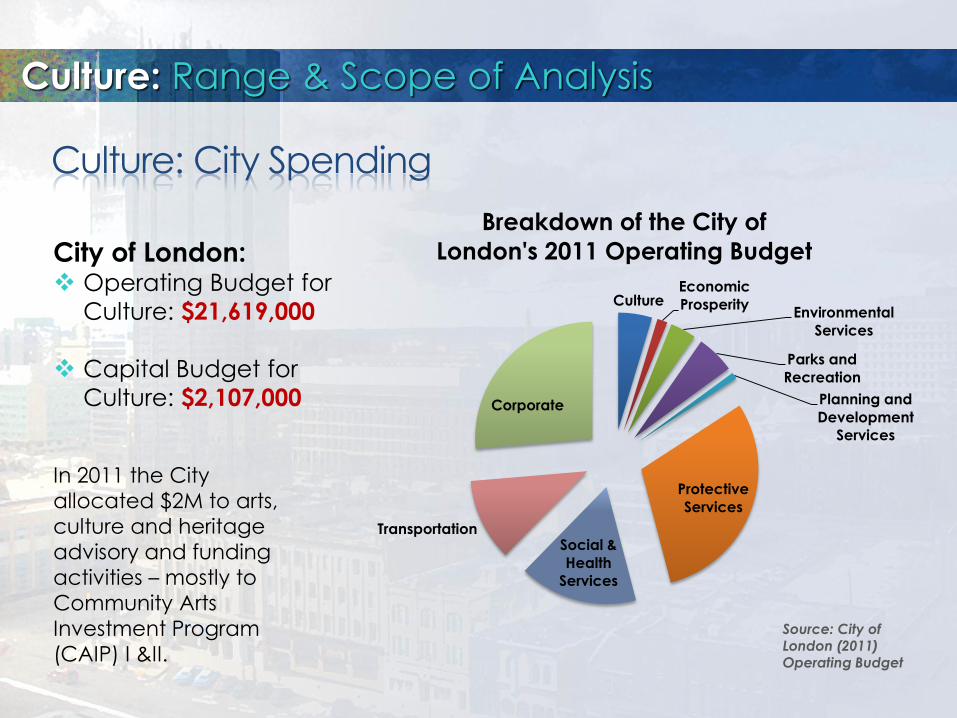
Culture: City Spending
City of London: Operating Budget for
Culture: $21,619,000
Capital Budget for
Culture: $2,107,000
Culture: Range & Scope of Analysis
Culture Economic
Prosperity Environmental
Services
Parks and
Recreation
Planning and
Development
Services
Protective
Services
Social &
Health
Services
Transportation
Corporate
Breakdown of the City of
London's 2011 Operating Budget
Source: City of London (2011) Operating Budget
In 2011 the City
allocated $2M to arts,
culture and heritage
advisory and funding
activities – mostly to
Community Arts
Investment Program
(CAIP) I &II.

In 2010, the London Arts Council
(LAC) disbursed $200,000 CAIP II
grants to support 46 arts
organizations/projects which
collectively had $4 million in
revenues; and
In 2010, the London Heritage Council
(LHC) disbursed $75,000 in
Community Heritage Investment
Program (CHIP) grants to 15
organizations/projects which
collectively had $240,000 in
revenues.
Volunteerism:
Estimated LAC and LHC
supported organizations which
had 3,500 volunteers working a
total 108,000 volunteer hours in
2010;
Volunteers estimated to have
contributed in-kind work valued
at around $1.2 million.
Culture: Range & Scope of Analysis
Cultural Advisory and Funding

University of Western Ontario (UWO) and Fanshawe College offer an extensive range of arts and culture
programs;
UWO and Fanshawe generated some $60 million in
revenue from arts programming in 2011;
Over 6,000 students enrolled in art and cultural
programming (multi-media design, broadcast television
etc.) across these institutions.
Culture: Post Secondary Education
Culture: Range & Scope of Analysis
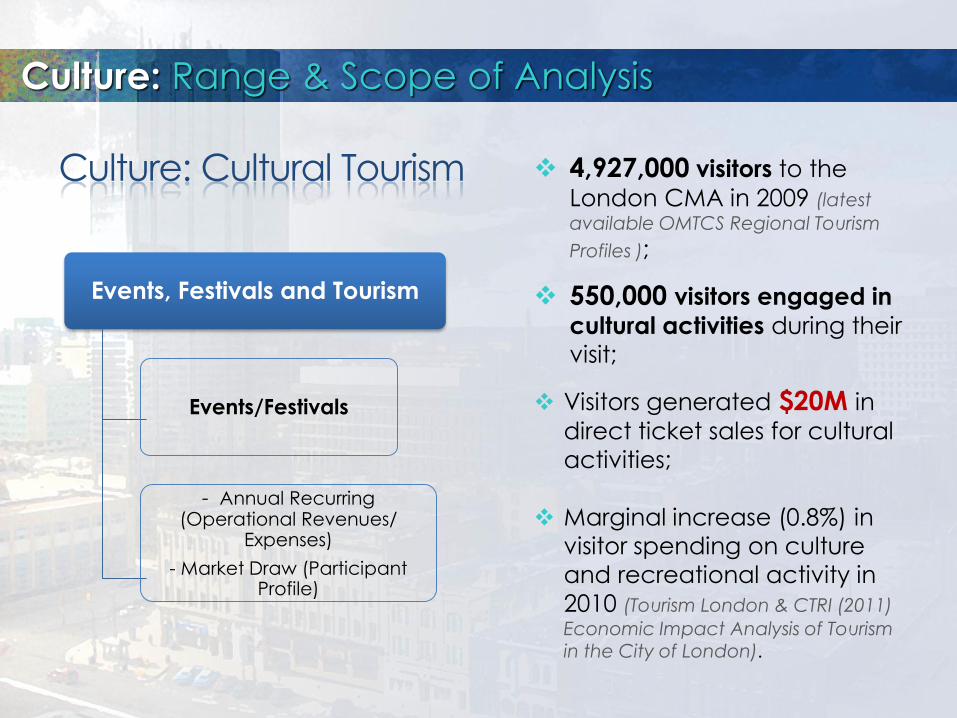
Events, Festivals and Tourism
Events/Festivals
- Annual Recurring (Operational Revenues/
Expenses)
- Market Draw (Participant Profile)
4,927,000 visitors to the
London CMA in 2009 (latest
available OMTCS Regional Tourism
Profiles );
550,000 visitors engaged in
cultural activities during their
visit;
Visitors generated $20M in
direct ticket sales for cultural
activities;
Marginal increase (0.8%) in
visitor spending on culture
and recreational activity in
2010 (Tourism London & CTRI (2011)
Economic Impact Analysis of Tourism in the City of London).
Culture: Cultural Tourism
Culture: Range & Scope of Analysis

Culture: Tourism
Culture: Range & Scope of Analysis
Any
Outdoor/S
ports
Activity
Sports
Events
Natl/Prov
Nature
Parks
Cultural
Perform.
Historic
Sites
Festivals/F
airs
Museums/
Art
Galleries
CasinosTheme
Parks
Zoos/Aqu
ariums
Cultural
Activities
(Total)
Sporting
Activities
(Total)
Total Visits (000) 456 228 152 131 102 72 92 43 37 27 550 684
0
100
200
300
400
500
600
700
800
Tota
l V
isits
(00
0)
Trip Activities of Visitors to the London CMA in 2009
Source: 2009 OMTCS Regional Tourism Profiles

Sierra Planning and Management
Results
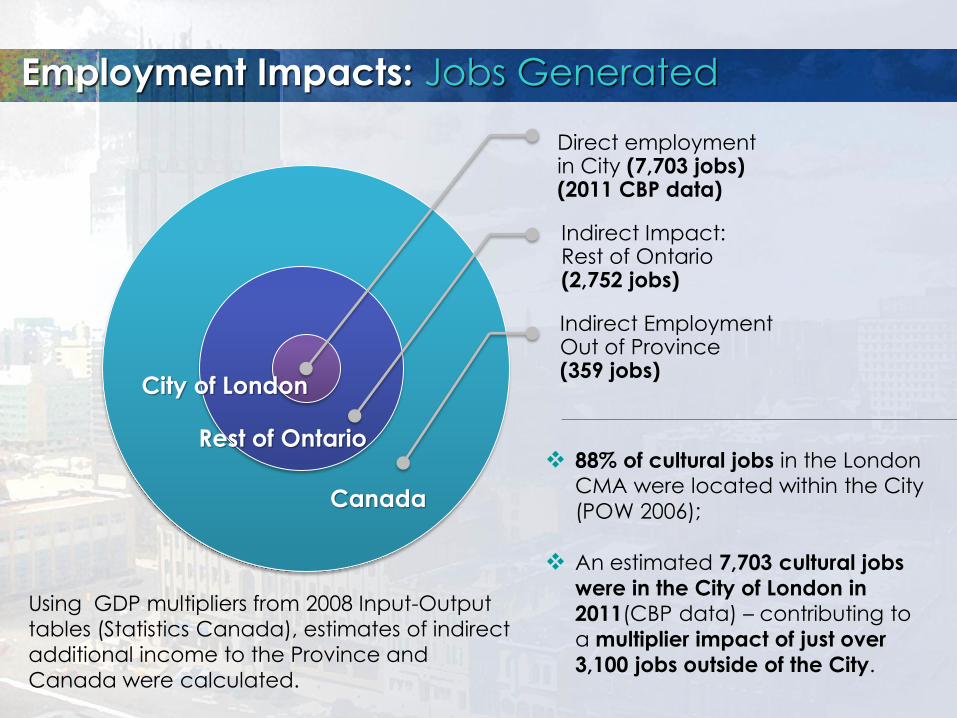
Direct employment in City (7,703 jobs) (2011 CBP data)
Indirect Impact: Rest of Ontario (2,752 jobs)
Indirect Employment Out of Province (359 jobs)
88% of cultural jobs in the London CMA were located within the City
(POW 2006);
An estimated 7,703 cultural jobs
were in the City of London in
2011(CBP data) – contributing to
a multiplier impact of just over
3,100 jobs outside of the City.
Employment Impacts: Jobs Generated
City of London
Rest of Ontario
Canada
Using GDP multipliers from 2008 Input-Output
tables (Statistics Canada), estimates of indirect
additional income to the Province and
Canada were calculated.

Direct in GDP: City ($329,705,349)
Indirect Impact: Rest of Ontario ($196,345,026)
Indirect Impact: Out of Province ($29,500,544)
Income
generation can
provide a
measure of
Gross Domestic
Product (GDP).
Employment Impacts: Gross Domestic Product (GDP)
Total GDP Impacts from identified
cultural sectors
was an estimated
$555,550,920
(based on 2011
CBP data).
City of London
Rest of Ontario
Canada
Cultural
establishments
estimated to
have
contributed
$329,705,349 in wages and
salaries in 2011 (CBP data).

Performance and Event Spaces: GDP Impact
Contributions from
cross-section of
performance and
event spaces and
other select
venues generated
$57,825,926 in
direct contribution
to the City’s
economy in 2011.
Direct GDP Impact: City ($29,731,548)
Indirect Impact: Rest of Ontario ($17,705,632)
Indirect Impact: Out of Province ($2,660,245)
This excludes the
wider impact of this
spending e.g.
food and beverage,
accommodations
and transportation.
City of London
Rest of Ontario
Canada

Cultural Tourism: GDP Impact
Visitors generated
$20 million in ticket
sales for the London CMA in
2009.
Beyond direct
spending on
cultural activities, the broader
estimate of direct
spending in the
London economy
(including
transportation,
accommodations
etc.) is estimated to
be $70+ million.
Total GDP Impact in
Province was an
estimated $57,424,115 in 2011.
Direct GDP Impact: City ($35,990,921)
Indirect GDP Impact: Rest of Ontario ($21,433,193)
Indirect GDP Impact: Out of Province ($3,220,305)
City of London
Rest of Ontario
Canada

Post Secondary Contributions: GDP Impact
UWO and
Fanshawe
generated some
$60 million in
revenue from arts
programming in
2011;
Total GDP Impact
in Province was an
estimated
$47,627,007 in 2011.
Direct GDP Impact: City ($29,850,523)
Indirect GDP Impact: Rest of Ontario ($17,776,484)
Indirect GDP Impact: Out of Province ($2,670,890)
City of London
Rest of Ontario
Canada

Sierra Planning and Management
Interpretation

Direct Contributions
Business (Estimated
Income) (2011)
$330 million (London CMA: $370-$400+
million)
Cultural Tourism $70 million+
Selected Venues $60 million
Education $58 million
City (Operating
Budget as of 2011) $22 million
Total: $540 million (DIRECT)
Interpretation of Results
Direct Contribution of the Cultural Sector (Excluding Capital)

The implications of the estimate in comparative terms are as follows:
The direct contribution of the cultural sector in the City is
$1,475 Per Capita;
The direct contribution of the cultural sector in the London CMA is potentially $1,222 to $1,285 Per Capita; and
The City of London spent $60 Per Capita on culture in 2011.
While this figure varies significantly between municipalities,
the estimate is not inconsistent with a number of other
jurisdictions.
Interpretation of Results

City of London
(2011)
London CMA (2011)
City of Toronto (2006)
Ottawa (2006)
$540 Million
(Direct
contribution)
$580 Million (Direct
contribution)
$9 Billion (GDP
estimate)
$1.98 Billion (GDP
estimate)
$1,475 Per Capita $1,222 Per Capita $3,595 per capita $1,751 per capita
Sources: Sierra Planning and Management (2012) (London Estimate); City of Toronto (2011) From the Ground
Up: Growing Toronto’s Cultural Sector; and City of Ottawa (2012) A Renewed Action Plan for Arts, Heritage
and Culture In Ottawa (2013-2018).
Comparison of Economic Contributions for Cultural Sectors in the City of
London (Present Study) and Select Areas of Ontario
Interpretation of Results
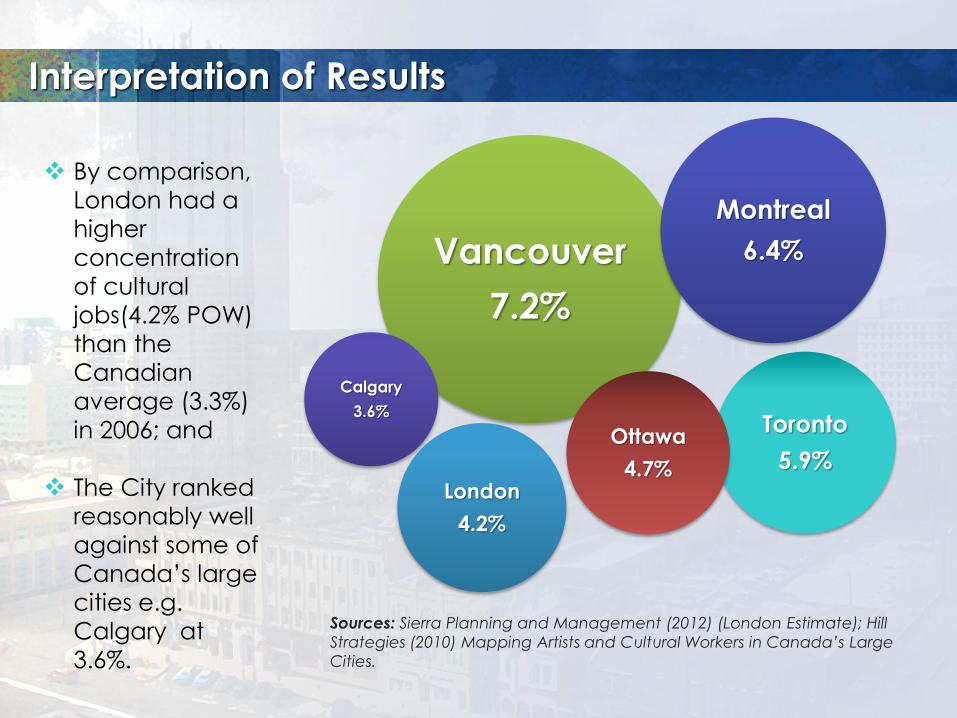
Vancouver
7.2%
Calgary
3.6%
Montreal
6.4%
Toronto
5.9% Ottawa
4.7% London
4.2%
By comparison,
London had a
higher
concentration
of cultural
jobs(4.2% POW)
than the
Canadian
average (3.3%)
in 2006; and
The City ranked
reasonably well
against some of
Canada’s large
cities e.g.
Calgary at
3.6%.
Sources: Sierra Planning and Management (2012) (London Estimate); Hill
Strategies (2010) Mapping Artists and Cultural Workers in Canada’s Large
Cities.
Interpretation of Results

Interpretation of Results
The estimate is a general statement of contribution
based on available information;
The estimated income of the defined businesses is only
part of the direct economic contribution of cultural
activities to the City; and
This analysis focuses on operational activity and does
not assess the impact of capital investment/costs.


