Page 1
JOURNAL OF GEOPHYSICAL RESEARCH, VOL. ???, XXXX, DOI:10.1029/,
Long-duration gamma-ray emissions from 2007 and1
2008 winter thunderstorms2
H. Tsuchiya,1T. Enoto,
2S. Yamada,
3T. Yuasa,
3K. Nakazawa,
3T.
Kitaguchi,4M. Kawaharada,
5M. Kokubun,
5H. Kato,
1M. Okano,
1and K.
Makishima3
D R A F T February 22, 2011, 1:50am D R A F T
SLAC-PUB-15536
Work supported in part by US Department of Energy under contract DE-AC02-76SF00515.
SLAC National Accelerator Laboratory, Menlo Park, CA 94025
Published in J.Geophys.Res.Atmos.116:D09113,2011 arXiv:1102.4024.
Page 2
X - 2 TSUCHIYA ET AL.: GAMMA RAYS FROM WINTER THUNDERCLOUDS
Abstract. The Gamma-Ray Observation of Winter THunderclouds (GROWTH)3
experiment, consisting of two radiation-detection subsystems, has been op-4
H. Tsuchiya, High-energy Astrophysics Laboratory, Riken, 2-1, Hirosawa, Wako, Saitama 351-
0198, Japan. ([email protected] )
T. Enoto, Kavli Institute for Particle Astrophysics and Cosmology, Department of Physics
and SLAC National Accelerator Laboratory, Stanford University, Stanford, CA 94305, USA
([email protected] )
S. Yamada, Department of Physics, University of Tokyo, 7-3-1, Hongo, Bunkyo-ku, Tokyo
113-0033, Japan. ([email protected] )
T. Yuasa, Department of Physics, University of Tokyo, 7-3-1, Hongo, Bunkyo-ku, Tokyo 113-
0033, Japan. ([email protected] )
K. Nakazawa, Department of Physics, University of Tokyo, 7-3-1, Hongo, Bunkyo-ku, Tokyo
113-0033, Japan. ([email protected] )
T. Kitaguchi, Division of Physics, Mathematics, and Astronomy, California Institute of Tech-
nology, 1200 East California Boulevard, Pasadena, CA 91125, USA ([email protected] )
M. Kawaharada, Department of High Energy Astrophysics, Institute of Space and Astro-
nautical Science, JAXA, 3-1-1, Chuo-ku, Sagamihara, Kanagawa 252-5210, Japan. (kawa-
[email protected] )
M. Kokubun, Department of High Energy Astrophysics, Institute of Space and As-
tronautical Science, JAXA, 3-1-1, Chuo-ku, Sagamihara, Kanagawa 252-5210, Japan.
([email protected] )
H. Kato, High-energy Astrophysics Laboratory, Riken, 2-1, Hirosawa, Wako, Saitama 351-0198,
D R A F T February 22, 2011, 1:50am D R A F T
Page 3
TSUCHIYA ET AL.: GAMMA RAYS FROM WINTER THUNDERCLOUDS X - 3
erating since 2006 on the premises of Kashiwazaki-Kariwa nuclear power plant5
located at the coastal area of Japan Sea. By 2010 February, GROWTH de-6
tected 7 long-duration γ-rays emissions associated with winter thunderstorms.7
Of them, two events, obtained on 2007 December 13 and 2008 December 25,8
are reported. On both occasions, all inorganic scintillators (NaI, CsI, and BGO)9
of the two subsystems detected significant γ-ray signals lasting for >1 minute.10
Neither of these two events were associated with any lightning. In both cases,11
the γ-ray energy spectra extend to 10 MeV, suggesting that the detected γ-12
rays are produced by relativistic electrons via bremsstrahlung. Assuming that13
the initial photon spectrum at the source is expressed by a power-law func-14
tion, the observed photons can be interpreted as being radiated from a source15
located at a distance of 290 − 560 m for the 2007 event and 110 − 690 m16
for the 2008 one, both at 90% confidence level. Employing these photon spec-17
tra, the number of relativistic electrons is estimated as 109− 1011. The es-18
timation generally agrees with those calculated based on the relativistic run-19
away electron avalanche model. A GROWTH photon spectrum, summed over20
3 individual events including the present two events and another reported21
Japan. ([email protected] )
M. Okano, High-energy Astrophysics Laboratory, Riken, 2-1, Hirosawa, Wako, Saitama 351-
0198, Japan. ([email protected] )
K. Makishima, Department of Physics, University of Tokyo, 7-3-1, Hongo, Bunkyo-ku, Tokyo
113-0033, Japan. ([email protected] )
D R A F T February 22, 2011, 1:50am D R A F T
Page 4
X - 4 TSUCHIYA ET AL.: GAMMA RAYS FROM WINTER THUNDERCLOUDS
previously, has similar features including a cut-off energy, to an averaged spec-22
trum of terrestrial gamma-ray flashes.23
D R A F T February 22, 2011, 1:50am D R A F T
Page 5
TSUCHIYA ET AL.: GAMMA RAYS FROM WINTER THUNDERCLOUDS X - 5
1. Introduction
Nonthermal X-ray and γ ray emission, typically lasting for a few seconds to ∼ 1024
minutes, has been observed from thunderstorm activity, with detectors on board an air-25
plane [McCarthy and Parks , 1985] and a ballon [Eack et al., 1996, 2000], high-mountain26
detectors [Suszcynsky et al., 1996; Brunetti et al., 2000; Chubenko et al., 2000; Alexeenko27
et al., 2002;Muraki et al., 2004; Torii et al., 2009; Tsuchiya et al., 2009; Chilingarian et al.,28
2010], and ground-based ones [Torii et al., 2002; Tsuchiya et al., 2007]. Interestingly, they29
do not appear to clearly coincide with lightning processes such as stepped leaders or re-30
turn strokes. In contrast, much shorter energetic radiation bursts, lasting only for tens31
of milliseconds or less, are often associated with lightning discharges. Though not neces-32
sarily homogeneous, they include terrestrial gamma-ray flashes (TGFs) [Fishman et al.,33
1994; Smith et al., 2005; Grefenstette et al., 2009; Briggs et al., 2010; Connaughton et al.,34
2010; Marisaldi et al., 2010a, b], natural lightning [Moore et al., 2001; Dwyer et al., 2005;35
Howard et al., 2008; Yoshida et al., 2008; Chubenko et al., 2009], and rocket-trigerred36
ones [Dwyer et al., 2003, 2004a, b].37
In this way, it has recently become clear that apparently two types of radiation bursts38
with distinct duration are associated with thunderstorm activity. Although it is uncertain39
whether or not these two types have a common source mechanism, recent observations40
as well as theoretical works generally suggest that these bursts, especially short-duration41
ones, are produced by processes involving acceleration and multiplication of a background42
population of electrons.43
D R A F T February 22, 2011, 1:50am D R A F T
Page 6
X - 6 TSUCHIYA ET AL.: GAMMA RAYS FROM WINTER THUNDERCLOUDS
Various numerical kinetic calculations [Gurevich et al., 1992; Roussel-Dupre et al., 1994;44
Bell et al., 1995; Lehtinen et al., 1996;Gurebich et al., 1997;Milikh and Valdia, 1999;Gure-45
vich et al., 2007; Roussel-Dupre et al., 2008] and Monte Carlo simulations [Lehtinen et al.,46
1999; Dwyer , 2003; Babich et al., 2005, 2007] commonly indicate that most of prompt non-47
thermal photons from lightning discharges are radiated, via bremsstrahlung, by relativistic48
electrons, which in turn are produced through mechanism involving relativistic runaway49
electron avalanche (RREA): some seed electrons, produced by e.g. cosmic rays, can be50
accelerated into relativistic regime if they can gain energies from the high electric fields in51
thunderclouds fast enough to overcome their total energy losses, due mainly to ionization.52
Then, they collide with air molecules and ionize them. Some of the faster newborn sec-53
ondary electrons are also accelerated to higher energies, hence increasing in their number.54
Finally, they will emit a detectable flux of nonthermal photons via bremsstrahlung.55
Early observations of long-duration bursts, though limited in number, measured X-ray56
fluxes in a few keV to a few hundred keV range, or γ-ray fluxes in MeV regions, suggesting57
that these prolonged emissions are also due to relativistic electrons [McCarthy and Parks ,58
1985; Eack et al., 1996, 2000; Brunetti et al., 2000; Chubenko et al., 2000]. Several recent59
observations [Tsuchiya et al., 2007; Torii et al., 2009; Tsuchiya et al., 2009; Chilingarian60
et al., 2010] have reinforced the suggestion, by detecting photon spectra extending clearly61
to 10 MeV or higher, and have given evidence that those long-duration γ rays are also62
produced via bremsstrahlung. These results naturally lead to a view that long-duration63
events are also caused by relativistic runaway electrons. However, compared with short-64
duration ones, the nature of long-duration bursts have remained less understood, due65
primary to the lack of a sufficiently large sample. For example, it is still unclear how the66
D R A F T February 22, 2011, 1:50am D R A F T
Page 7
TSUCHIYA ET AL.: GAMMA RAYS FROM WINTER THUNDERCLOUDS X - 7
electron acceleration process keeps operating for such long durations. In addition, the67
relation between short-duration bursts and long-duration ones is unknown.68
Aiming at detections of radiation bursts from thunderstorm activity, we have been op-69
erating the Gamma-Ray Observations of Winter THunderclouds (GROWTH) experiment70
since 2006 December 20. In this paper, we report on successful GROWTH detections71
of two long-duration γ-ray bursts extending to 10 MeV. Using the acquired γ-ray data,72
the source distance, its spatial extent, and the number of relativistic electrons involved73
therein are estimated. Then, a γ-ray spectrum which sums up 3 GROWTH detections is74
compared with cumulative TGF spectra obtained by two independent space observations.75
Based on these results, we quantitatively discuss the production mechanism of prolonged76
γ-ray bursts from winter thunderclouds.77
2. The GROWTH Experiment
The GROWTH experiment, comprising two independent subsystems, has been oper-78
ating successfully at a roof of a building of Kashiwazaki-Kariwa nuclear power plant in79
Niigata Prefecture, Japan. Figure 1 shows the location of the plant, facing the Japan Sea,80
and the GROWTH experimental site therein. The geographical longitude, latitude, and81
altitude of the experimental site are 138◦36′
E, 37◦26′
N, and 40 m above sea level, respec-82
tively. This coastal area is frequently struck by strong thunderstorms in winter seasons.83
Actually, before the GROWTH experiment started working, radiation monitors (filled84
circles in Fig. 1), which are arranged at around 300 m − 400 m intervals in the plant,85
occasionally observed > 3 MeV intense radiation enhancements in winter seasons, which86
are difficult to ascribe to so-called radon washouts because these rainfall-related episodes87
would mainly cause increases at < 3 MeV energies [e.g. Yoshioka, 1992; Yamazaki et al.,88
D R A F T February 22, 2011, 1:50am D R A F T
Page 8
X - 8 TSUCHIYA ET AL.: GAMMA RAYS FROM WINTER THUNDERCLOUDS
2002]. Each radiation monitor consists of a φ5.1 cm×5.1 cm NaI (Tl) scintillation counter,89
and a spherical ion chamber with a volume of ∼ 14 L that contains Ar gas. The former90
covers the 50 keV − 3 MeV energy range, while the later operates in > 50 keV. However,91
the radiation monitors have too poor a time resolution of 30 sec, together with the too92
limited energy bands, to understand the nature of those phenomena. The GROWTH93
experiment is expected to provide much improved knowledge on these sporadic events.94
The pictures and drawings of the two subsystems are given in Enoto et al. [2007] and95
Tsuchiya et al. [2007]. One of them (Detector-A) uses two cylindrical NaI (Tl) scin-96
tillators (density = 3.67 gcm−3), having a diameter and a height of both 7.62 cm. In97
order to actively shield them from natural low-energy (< 3 MeV) environmental radiation98
(e.g. from 40K), the NaI scintillators are individually surrounded by well-shaped BGO99
(Bi4Ge3O12; density = 7.1 gcm−3) scintillators, with the thickness on the side and bottom100
being 1.27 cm and 2.54 cm, respectively. The BGO scintillators geometrically shield the101
central NaI up to a solid angle of 2.4π str, or 0.6 × 4π. Thus, the NaI scintillators have102
a higher sensitivity toward the sky direction. The two central NaI scintillators and the103
BGO shields are operated over an energy range of 40 keV − 10 MeV. Output signals from104
photomultiplier tubes, attached to the NaI and BGO, are fed individually to a 12 bit 8ch105
VME-analog-to-digital converter [ADC (CP 1113A)] with a time resolution of 10 µsec,106
and is recorded on event-by-event basis.107
As another feature of Detector-A, a 0.5 cm thick plastic scintillator with an area of108
30.5 cm× 15.2 cm = 464 cm2 is placed above the two NaI scintillators, and operated with109
a threshold energy of > 1 MeV. It has a high detection efficiency for charged particles,110
while it is almost transparent to photons due to its thinness and higher threshold. Utiliz-111
D R A F T February 22, 2011, 1:50am D R A F T
Page 9
TSUCHIYA ET AL.: GAMMA RAYS FROM WINTER THUNDERCLOUDS X - 9
ing this feature, we can separate charged particles from photons, and efficiently exclude112
background cosmic-ray muons, which typically deposit > 1 MeV energies, from events in113
the two NaI scintillators. Specifically, an event in either of the two NaI scintillators is114
judged as a charged particle if it give a simultaneous hit (with 10 µ sec) in the plastic115
scintillator. Thus, utilizing signals of the BGO and plastic scintillators both in anticoin-116
cidence, the central NaI scintillators effectively detect photons, generally arriving from a117
sky direction.118
Aiming at an independent radiation measurement, another subsystem (Detector-B) was119
installed ∼ 10 m apart from Detector-A. It consists of spherical NaI (Tl) and CsI (Tl)120
scintillators (density = 4.51 gcm−3), both with a diameter of 7.62 cm. The former op-121
erates in 40 keV −10 MeV, while the latter covers a higher energy range of 300 keV −122
80 MeV. Unlike Detector-A, these scintillators have omni-directional sensitivity because123
they have no shields such as the BGO or plastic scintillators. Output signals of two pho-124
tomultiplier tubes, attached to the NaI and CsI crystals, are sampled by a self-triggering125
electronics system with a 12 bit ADC (AD 574). These events are accumulated into an126
ADC histogram, which is recorded every 6 sec.127
Energy calibrations of Detector-A and Detector-B were carried out, using natural envi-128
ronmental γ-ray lines of 214Pb (0.352 MeV), 214Bi (0.609 MeV), 40K (1.46 MeV), and 208Tl129
(2.61 MeV). Then, especially for the CsI of Detector-B, cosmic-ray muons, giving energy130
deposits with its peak of around 35 MeV, were also utilized. Basically, these calibrations131
are performed and checked by an offline analysis.132
In addition to those radiation detectors, the GROWTH system utilizes three optical133
sensors and an electric-field mill as environmental monitors. Each optical sensor consists134
D R A F T February 22, 2011, 1:50am D R A F T
Page 10
X - 10 TSUCHIYA ET AL.: GAMMA RAYS FROM WINTER THUNDERCLOUDS
of a hand-made analog circuit, and a silicon photodiode (HAMAMATSU S1226-8BK)135
which is sensitive over a wavelength range of 320 nm − 1000 nm (with its peak at 750136
nm). They measure environmental visible light in coarsely different directions; sea side,137
zenith direction, and anti-sea side. The output signals are fed to a 12 bit VME-ADC, and138
recorded every 0.1 sec. The electric field mill is a commercial product (BOLTEK EFM-139
100). Its analog output is fed to a 12 bit ADC (AD 7892), and recored as electric-field140
strength between ±100 kVm−1, with a resolution of 50 Vm−1.141
3. Results
3.1. Count histories of the inorganic scintillators
Figure 2 shows count histories of the 4 inorganic scintillators of Detector-A and B,142
obtained over 15:00 − 17:00 UT on 2007 December 13 which corresponds to local midnight143
(0:00 − 2:00 JST on 2007 December 14). For reference, typical background rates per 20144
sec, corresponding to the panels (a), (b), (c), and (d) of Fig. 2, are 22000, 1700, 2100, and145
1500, respectively. Similarly, Figure 3 gives those over 8:30 − 10:30 UT on 2008 December146
25 (17:30 − 19:30 JST on the same day, or local evening). On both these days, a strong147
low pressure system (with ∼ 990 hPa on the ground) developed over Japan, causing148
thunderstorms at the coastal area of Japan Sea. A gradual count increase, followed by a149
gradual count decrease, generally shows that they are due mainly to radioactive radon and150
its decay products in rain,with their half-lives being 20 − 30 min. These effects originating151
from radionuclides are closely investigated by Suszcynsky et al. [1996] and Yamazaki et al.152
[2002].153
Superimposed on such gradual count increases, a sharp count enhancement is found in all154
the inorganic scintillators at around 16:00 UT in Fig. 2, and at around 9:30 UT in Fig. 3.155
D R A F T February 22, 2011, 1:50am D R A F T
Page 11
TSUCHIYA ET AL.: GAMMA RAYS FROM WINTER THUNDERCLOUDS X - 11
Hereafter, we call the former and the latter events 071213 and 081225, respectively. These156
enhancements, both lasting for 70− 80 sec, are quite different from the radon effects and157
from short radiation bursts associated with lightning discharges. Among those inorganic158
scintillators, BGO of Detector-A gave statistically the most significant burst detection on159
both occasions; 30σ for 071213 and 19σ for 081225. This is because it has a higher density160
and a larger effective atomic number, and hence a higher stopping power, especially for161
X/γ rays, than the other inorganic scintillators used in our system.162
Figure 4 shows NaI count histories of 071213 in 3 energy bands from Detector-A and163
B, while Figure 5 represents those of 081225. For comparison with Detector-B, the data164
of Detector-A [panels (a), (b) and (c) of Fig. 4 and Fig. 5] are presented without the165
BGO or plastic anticoincidence. With a criterion that both the NaI and CsI scintillators166
of Detector-B simultaneously record 10 or higher counts per 12 sec in the 3 − 10 MeV167
energy band, we define burst periods of 071213 and 081225 as 84 sec, 15:59:29 − 16:00:53168
UT, and 72 sec, 9:28:29 − 9:29:37 UT, respectively. For reference, this energy band of169
either scintillator typically records ∼ 4 − 5 events per 12 sec in quiescent periods; so the170
above criterion (again, not either but both scintillators have 10 or higher counts) means171
approximately ≥ 3.2− 4.0σ above the background.172
In order to estimate background levels of individual energy bands of Detector-A and B,173
we excluded data over the burst period (as defined above) and the adjacent 12-sec periods.174
The remaining data in the two lower-energy bands were fitted by a quadratic function175
(via χ2 evaluation), while those in the highest-energy band with a constant. Table 1176
summarizes the net count increases, obtained by subtracting interpolated background177
(dashed curves of Fig. 4 and Fig. 5) from the total counts in the burst period. Thus,178
D R A F T February 22, 2011, 1:50am D R A F T
Page 12
X - 12 TSUCHIYA ET AL.: GAMMA RAYS FROM WINTER THUNDERCLOUDS
the burst detection is statistically significant in each of the three energy bands on both179
occasions. Table 1 also gives the observed photon number fluxes above the detectors180
using power-law spectra obtained later (Sec.3.5) and the detector responses of Detector181
B derived from a Monte Carlo simulation based on GEANT4 [Agostinelli et al., 2003].182
Here, the MC simulation was evaluated with radionuclide sources of 60Co and 137Cs.183
3.2. Arrival directions
Shown in Fig. 4 and Fig. 5 are the NaI count rates of Detector A at > 3 MeV energies184
of 071213 and 081225, respectively, with [panel (d) in both figures] and without [panel185
(c)] anticoincidence. In both figures, the anticoincidence, which utilizes BGO and plastic186
signals in logical ”OR”, is seen to reduce the NaI background level (solid curves) to187
∼ 0.05 times that without anticoincidence. In contrast, the NaI-detected burst signal rate188
decreases due to the anticoincidence only to 0.25±0.03 and 0.31±0.06 times the raw rates,189
for 071213 and 081225, respectively. Thus, the burst photons survive the anti-coincidence190
with 5 − 6 times higher efficiency than the background events. Similarly, the ratio of the191
> 40 keV NaI [Fig. 2 (b) and Fig. 3 (b)] to the > 40 keV BGO count rates [Fig. 2 (a) and192
Fig. 3 (a)], which is normally ∼ 0.08 due mostly to environmental radioactivity coming193
from omni-directions, increased to 0.18± 0.02 for 071213 and 0.14± 0.02 for 081225.194
The above properties revealed by applying the anticoincidence are thought to reflect195
arrival directions of the burst signals. If they came mainly from horizontal or ground196
directions, the anticoincidence on/off ratio and the NaI/BGO ratio would both fall below197
their normal values, because, e.g., 40 keV or 3 MeV γ rays horizontally entering Detector-198
A would be almost fully or partially (at least 30%) absorbed/scattered by BGO via199
photoelectric absorption and Compton scattering. Accordingly, we conclude that the200
D R A F T February 22, 2011, 1:50am D R A F T
Page 13
TSUCHIYA ET AL.: GAMMA RAYS FROM WINTER THUNDERCLOUDS X - 13
burst signals arrived from sky directions, not from horizontal or ground directions. A201
more quantitative study of arrival directions, employing Monte Carlo simulations, will be202
reported elsewhere.203
3.3. Burst components
Figure 6 shows count histories of the plastic scintillator (> 1 MeV) and the envi-204
ronmental sensors. In coincidence with the apparent signals detected by the inorganic205
scintillators, the 0.5 cm thick plastic scintillator gave count increases in individual burst206
periods by Npl = 160 ± 30 (5.3σ) for 071213 and 72 ± 18 (4σ) for 081225 [top panels of207
Fig. 6]. Presumably these plastic signals are composed of γ rays and charged particles,208
most likely electrons, which are either accelerated primaries or secondary ones produced209
by high-energy photons via Compton scattering. Below, we estimate how γ rays and210
electrons contribute to Npl, and estimate the electron flux above 1 MeV.211
First, a Monte Carlo simulation using GEANT4 predicts that the plastic scintillator has212
a low detection efficiency, 0.5−1%, for > 1 MeV γ rays, while that for > 1 MeV electrons213
reaches 75−90%. Next, using power-law spectra obtained later (Sec.3.5) and the effective214
area of the NaI scintillator of Detector B yield 1−10 MeV photon number fluxes above the215
GROWTH system as (17.9±1.8)×10−2 cm−2s−1 for 071213, and (9.2±1.8)×10−2 cm−2s−1216
for 081213. Then, multiplying these fluxes by the GEANT4-derived detection efficiency217
for γ rays of the plastic scintillator and the area of the plastic scintillator, 464 cm2, γ-ray218
produced counts contributing to Npl are estimated as Nγ = 70± 7 for 071213, and 31± 6219
for 081225. Finally, subtracting Nγ from Npl, the contribution of electrons is obtained as220
90± 30 for 071213, and 41± 19 for 081225. Although these numbers, when taken at their221
face values, imply a significant electron contribution to Npl, here we conservatively regard222
D R A F T February 22, 2011, 1:50am D R A F T
Page 14
X - 14 TSUCHIYA ET AL.: GAMMA RAYS FROM WINTER THUNDERCLOUDS
them as upper limits. Then, a 95% confidence level upper limit on the electron flux above223
1 MeV of 071213 and 081225 is computed as 0.5× 10⁻² cm−2s−1 and 0.3× 10⁻² cm−2s−1,224
respectively. These upper limits are more than an order of magnitude lower than the225
1− 10 MeV γ-ray fluxes. Therefore, the observed burst signals arriving at the GROWTH226
system are inferred to be dominated by photons, rather than electrons.227
3.4. Comparison with signals from environmental sensors
The visible-light sensor (middle panels of Fig. 6) recorded an extremely intense signal,228
lasting ≤ 1 sec, at 15:57:50 UT and 9:25:09 UT, for 071213 and 081225, respectively. In229
coincidence with the recorded optical flashes, the electric field rapidly changed its polarity230
from positive to negative (bottom panels of Fig. 6). These indicate that a lightning231
discharge occurred. However, their occurrence is well separated from the γ-ray bursts232
themselves, namely, 100 sec and 180 sec prior to the 071213 and 082125 commencements,233
respectively. Thus, we conclude that neither of the present two γ-ray bursts coincided234
with lightning discharges.235
Prior to the present work, Tsuchiya et al. [2007, 2009] have reported similar lack of236
coincidence between prolonged γ-ray bursts and lightning discharges. In Tsuchiya et al.237
[2007], a long-duration burst, lasting 40 sec, was detected by the GROWHT system 70 sec238
prior to lightning, while in Tsuchiya et al. [2009], no lightning discharges were measured239
over 5 minutes before or after a prolonged (∼ 90 sec) burst detected at a high-mountain240
detector. These previously reported events, observed during thunderstorms, have also241
been considered to be associated with thunderclouds.242
In the same manner, we associate the present bursts with the thunderclouds, rather243
than to lightning discharges. Actually, rainfall-thunder observation data1, provided by244
D R A F T February 22, 2011, 1:50am D R A F T
Page 15
TSUCHIYA ET AL.: GAMMA RAYS FROM WINTER THUNDERCLOUDS X - 15
a laser observation system operated by Tokyo Electric Power Company, showed that245
thunderclouds approached the Kashiwazaki-Kariwa nuclear plant from the sea side on246
both occasions, and passed over it during the 10 minutes.247
3.5. Energy spectra
Figure 7 and Figure 8 show background-subtracted GROWTH spectra, obtained in the248
burst periods of 071213 and 081225, respectively. In either case, we accumulated the data249
over the burst period, and subtracted background spectra which were averaged over 10250
minutes before and after the burst, although thunderstorms were ongoing during these251
time periods. This is to remove < 3 MeV line-γ rays induced mainly by radon decays,252
which increase the background level by up to twice. To examine how the background253
selection affects the final spectra (Figure 7 and Figure 8), we subtracted an alternative254
background spectrum averaged over 5 minutes before and after the burst. However, the255
background-subtracted spectra did not change by more than ±10% at < 1 MeV, or ±5%256
at > 1 MeV. These are almost negligible compared with the statistical errors.257
In both events, the background-subtracted spectra of Detector-A and Detector-B exhibit258
very hard continuum spectra, which clearly extend to 10 MeV. As shown in another259
GROWTH event 070106 reported previously [Tsuchiya et al., 2007], and in high-mountain260
observations [Torii et al., 2009; Tsuchiya et al., 2009; Chilingarian et al., 2010], similar261
prolonged γ-ray emissions, extending to 10 MeV or higher, were observed, and have been262
thought to be produced via bremsstrahlung. Thus, the present high-energy γ rays must263
also be produced via bremsstrahlung by electrons accelerated beyond 10 MeV. Given these264
results, the present two events, together with the previous ones, may be understood as265
manifestations of a common type of high-energy activity in thunderstorms.266
D R A F T February 22, 2011, 1:50am D R A F T
Page 16
X - 16 TSUCHIYA ET AL.: GAMMA RAYS FROM WINTER THUNDERCLOUDS
As easily seen in Fig. 7 and Fig. 8, the obtained spectra, in particular those of Detector-267
B, flatten in 0.8 − 3 MeV, even though they are not corrected for the detector responses.268
One of the causes of this flat is the Compton scattering: since the Compton scattering cross269
section in the atmosphere increases as photon energy decreases toward 0.1 MeV, photons270
at low energies would experience stronger Compton degradation than higher-energy ones.271
3.6. Model fits
Supposing that the burst γ rays were produced in a source located at a certain distance
and propagated through atmosphere to reach our detectors, we may deduce the initial
photon spectrum at the source, and estimate the source distance, from the background-
subtracted spectra. Since the Detector-A spectra are complicated due to the passive
and active shielding effects by the BGO well, below we analyze the Detector-B spectra.
According to numerical calculations [Roussel-Dupre et al., 1994; Roussel-Dupre and Gure-
vich, 1996; Lehtinen et al., 1999; Babich et al., 2007], an energy distribution function of
runaway electrons, generated under the RREA mechanism, is expressed by a power-law
function, or more precisely, an exponentially cut-off power-law. Consequently, we assume
an initial photon number spectrum as
f(ǫp) = αǫ−βp exp (−ǫp/ǫc) (MeV−1sr−1). (1)
Here, α and β are a normalization factor and a photon index, respectively, while ǫp and272
ǫc describe the emitted photon energy and a cut-off energy in MeV, respectively. While273
this equation represents an exponentially cut-off power law, it can also express a pure274
power-law by requiring ǫc → ∞.275
D R A F T February 22, 2011, 1:50am D R A F T
Page 17
TSUCHIYA ET AL.: GAMMA RAYS FROM WINTER THUNDERCLOUDS X - 17
Below, let us estimate the source distance d from our Detector-B data, as well as α,276
β, and ǫc. In order to simulate the photon propagation in the atmosphere, we utilize277
EGS4 [Nelson et al., 1985] embedded in CORSIKA 6.500 [Heck et al., 1998]. In the278
CORSIKA simulation, the atmosphere consists of N2, O2, and Ar with the mole ratios279
of 78.1%, 21.0%, and 0.9%, respectively. The density of the atmosphere, divided into 5280
layers, depends exponentially on the altitude h, with a form of A + B exp (−h/C), with281
A,B,C being model parameters. For example, at h < 4 km, the model is specified as282
A = −186.6 g cm−2, B = 1222.7 g cm−2, and C = 9.94 km [Heck and Pierog , 2009].283
In addition, EGS4 can adequately treat electromagnetic processes in the relevant energy284
range of a few tens of keV to a few tens of MeV.285
Mono-energetic photon simulations were carried out for 33 incident energies from 50286
keV to 100 MeV. The energy interval is set to 10 keV for 50 keV − 90 keV, 100 keV for287
100 keV − 1 MeV, 1 MeV for 1 MeV − 10 MeV, and 10 MeV for 10 MeV − 100 MeV.288
For one mono-energetic photon simulation, one million photons were vertically injected289
to the atmosphere from a fixed source distance. In reality, 20 source distances from 20 m290
to 2000 m were applied for one mono-energetic simulation. Then, we saved the energy,291
angle, and species of all of photons and particles that arrive at the observatory level (40292
m above sea level).293
Figure 9 indicates three representative sets of simulated photon spectra, propagating294
over d = 300 m (36 g cm−2), 1000 m (120 g cm−2), and 2000 m (220 g cm−2), with the295
numbers in parentheses giving air mass calculated by the above exponential formula.296
Punch-through photons, which suffer no interactions with air molecules, appear as a297
strong peak at the highest end of each photon spectrum, while scattered ones form a298
D R A F T February 22, 2011, 1:50am D R A F T
Page 18
X - 18 TSUCHIYA ET AL.: GAMMA RAYS FROM WINTER THUNDERCLOUDS
continuum toward lower energies. As the distance increases, the punch-through photons299
and the scattered continuum are both strongly attenuated, in particular toward lower300
energies, due primarily to Compton scattering. For instance, the survival probability for301
10 (1) MeV punch-through photons to propagate over d = 2000 m is only 0.02 (10−5)302
times that over d = 300 m. Note that as discussed later in Sec. 4.3, a long-duration303
burst probably changes in the burst period its viewing angle relative to a beam axis of304
electrons accelerated in thunderclouds. Thus, the calculated photon spectra here would305
vary according to the changes, and hence they will be treated in this work as ones averaged306
over different viewing angles.307
Convolving the simulated photon spectra with the detector responses, we can obtain308
a model-predicted spectrum to be observed by the NaI and CsI scintillators. Finally,309
we convolve these model predictions with the assumed source photon spectrum, eq.(1),310
and fit the predictions simultaneously to the background-subtracted NaI and CsI spectra311
(right panels of Fig. 7 and Fig. 8). Then, the model parameters, such as α, β and ǫc, can312
be determined so as to minimize the fit χ2.313
Shown in Figure 10 are three representative model fits to the spectra of 071213 and314
081225, assuming a power-law model. The choice of d of 300, 1000, and 2000 m in315
Fig. 10, respectively gave χ2 values as 48.4, 77.5, and 116 for 071213, and 40.9, 46.7, and316
51.4 for 081225. By changing d and repeating the fitting, we obtained χ2 curves as shown317
in Figure 11, together with the χ2 minima as 46.5 at d = 400 m for 071213, and 40.9 at318
d = 300 m for 081225. From these figure, we can constrain source distance. Table 2 and319
Table 3 summarize the best-fit parameters for 071213 and 081225, respectively, together320
with the constrained source distance. Also, low-energy parts (< 300 keV) of the two321
D R A F T February 22, 2011, 1:50am D R A F T
Page 19
TSUCHIYA ET AL.: GAMMA RAYS FROM WINTER THUNDERCLOUDS X - 19
spectra are found to play an important role to determine d. If we use the background322
averaged over the 5 min intervals (instead of 10 min), the source distances become 350 m323
for 071213, and 300 m for 081225. Thus, the distance is not affected significantly by the324
systematic background uncertainty.325
The NaI and CsI spectra have been explained, in either event, by a common set of model326
parameters, although the fits are not necessarily good enough. The cut-off energy Ec was327
constrained to be rather high with relatively large errors. Thus, our data do not provide328
evidence for spectral cut-off in either event. In agreement with this, the two spectral329
models, a power law and an exponentially cut-off power law, gave similar goodness of fits330
in both events. Importantly, the source distance have been constrained with a reasonable331
accuracy.332
As another attempt, we tentatively fixed Ec at 7 MeV, which is the expected average333
kinetic energy of runaway electrons (not of bremsstrahlung photons), and repeated the334
model fitting. Then, the fit became worse in both events (4th column of Table 2 and335
Table 3). Therefore, the initial photon spectrum is again inferred to extend beyond ∼ 7336
MeV.337
4. Discussion
4.1. Source heights
Assuming a power-law function at the source, the γ-ray spectra of 071213 and 081225338
suggest that the sources are located at 290 − 560 m (35 − 67 g cm−2) and 120 − 690 m339
(14 − 82 g cm−2) above our system, respectively, both at 90% confidence level. In fact,340
these constraints are in good agreement with the known heights of winter thunderclouds in341
this area. Winter thunderclouds and winter lighting observed at the coastal area of Japan342
D R A F T February 22, 2011, 1:50am D R A F T
Page 20
X - 20 TSUCHIYA ET AL.: GAMMA RAYS FROM WINTER THUNDERCLOUDS
Sea exhibit many features that have hardly been found from those in summer seasons343
and/or in other areas (e.g. Rakov and Uman [2005] and references therein). These include344
rather low altitudes of the development of these thunderclouds. Actually, Goto and Narita345
[1992] conducted video observations of winter lightning at the same Niigata Prefecture346
as our experimental site, and reported that the visible bases of winter thunderclouds are347
typically located at 200 m − 800 m above sea level. Also, a recent numerical calculation348
done by Babich et al. [2010] shows that another GROWTH event [Tsuchiya et al., 2007]349
may be produced at a source height of 0.5 − 2 km, and hence generally agrees with the350
present results.351
These height estimations provide an additional clue to the possible electron contribu-352
tions to the detected plastic signals (Sec. 3.3). As argued so far, electrons are considered353
to be accelerated in these thunderclouds to at least 10 MeV, probably a few tens of MeV.354
Since such electrons have a range of < 100 m at near the sea level, they would hardly reach355
our system, even if a range straggling is taken into account. Therefore, it is reasonable356
that the electron flux incident on our system, if any, was much lower than that of photons.357
Unlike the present sea-level observations, some high-mountain experiments, conducted358
at Mt. Norikura (2770 m) in Japan [Tsuchiya et al., 2009] and Mt. Aragatz (3250 m)359
in Armenia [Chilingarian et al., 2010], have detected primary electrons in long duration360
events (numbers in parentheses indicate altitudes of observatories). Tsuchiya et al. [2009]361
estimated the source height as 60 − 130 m (90% confidence level), while Chilingarian et al.362
[2010] evaluated it as 100 − 150 m. These low source heights, which are comparable to or363
shorter than the expected electron range, can naturally explain their electron detections.364
4.2. Extent and motion of the γ-ray beams
D R A F T February 22, 2011, 1:50am D R A F T
Page 21
TSUCHIYA ET AL.: GAMMA RAYS FROM WINTER THUNDERCLOUDS X - 21
Measuring electric-field structure of winter thunderclouds, Kitagawa and Michimoto365
[1994] revealed that tripole electrical structures, which consist of positive, negative and366
positive layers from top to bottom, appear at mature stages of winter thunderclouds.367
Then, they observed the tripole structures to last for < 10 minutes in early or late winter,368
while less than several minutes in midwinter. Since the present two events were observed369
in midwinter, the measured burst periods of 84 sec of 071213 and 72 sec of 081225 are370
consistent with their observations, if the burst durations represent the lifetime of electric371
fields.372
Figure 12 shows dose variations on 2007 December 13, measured by the nearest and the373
second nearest radiation monitors of the power plant (5 and 6 in Fig. 1, black and red lines374
in Fig. 12, respectively). The two monitors gave moderate dose increases for ∼ 1 minute375
or less around the GROWTH event. By examining the GROWTH data of 071213 burst376
(crosses in Fig. 12), as well as dose rates of the second nearest monitor (red line) obtained377
for 15:59:30 − 16:01:00 UT and that of the nearest one (black line) obtained over 16:00:00378
− 16:01:30 UT, peak times of their enhancement can be evaluated as 15:59:48 (±6 sec)379
UT, 15:59:58 (±15 sec) UT, and 16:00:27 (±15 sec) UT. Thus, referring to the GROWTH380
data, the second nearest monitor increased in its dose rates with a small delay of 10± 16381
sec (or almost simultaneously), while the nearest one with a larger delay by 39 ± 16 sec.382
The two monitors are located at a distance of 500 − 600 m from the GROWTH system.383
For reference, data of the other two radiation monitors (4 and 7 in Fig. 1) exhibited no384
apparent increases (green and blue lines in Fig. 12). As for 081225, data of those radiation385
monitors were unavailable due to some data-storage problem.386
D R A F T February 22, 2011, 1:50am D R A F T
Page 22
X - 22 TSUCHIYA ET AL.: GAMMA RAYS FROM WINTER THUNDERCLOUDS
These simultaneous and delayed detections by the two radiation monitors have two387
important implications. One is that the γ-ray emission from thunderclouds is likely to388
have illuminated a rather limited area, spreading over ∼ 600 m on the ground. This kind389
of effect was also suggested by five radiation monitors (1−5 in Fig. 1), on the occasion390
of the other GROWTH event [Tsuchiya et al., 2007], and another experiment conducted391
on the same coastal area [Torii et al., 2002]. The other is that the γ-ray emitting region392
moved, presumably together with the thunderclouds.393
From data of Japan Meteorological Agency, it is found that south-west wind was blowing394
during 10 minutes including the burst period of 071213. Thus, the south-west direction395
can naturally explain the delay of the nearest monitor, if the γ-ray emitting region moved396
together with the thunderclouds. Then, the wind velocity was on average 360mmin−1,397
with the maximum of 720mmin−1. Projecting, to south-west axis, the distance between398
the GROWTH system and the nearest monitor, ∼ 500 m, and dividing the projected399
distance, ∼ 350 m, by its delay, 39± 16 sec, we obtain an average moving velocity of the400
emitting region as 540 ± 220 mmin−1. Thus, the estimated moving velocity is generally401
consistent with the wind velocity.402
Given above discussions, we may assume that the winter thunderclouds moved from the403
Japan sea in south-west side to the inland in north-east side. Then, a short-lived tripole404
structure appeared in a thundercloud, and accelerated ambient fast electrons toward the405
bottom positive layer. The accelerated electrons emitted γ rays toward the ground, which406
the GROWTH system and the two radiation monitors detected when the beam passed over407
them. The differences in the statistical significance of detections between the GROWTH408
system and the radiation monitors may be due to different positions and effective viewing409
D R A F T February 22, 2011, 1:50am D R A F T
Page 23
TSUCHIYA ET AL.: GAMMA RAYS FROM WINTER THUNDERCLOUDS X - 23
angles relative to the accelerated electron beam axis in the thundercloud, and to the410
differences in their sensitivity. The 081225 event is considered to have occurred under411
similar conditions, because west winds, with almost the same velocity as in the 071213412
case, were blowing at that time. However, it is presently unclear whether the γ-ray413
emission ceased when the tripole structure disappeared, or when the γ-ray beam moved414
away from the GRWOTH system as the thunderclouds moved.415
4.3. The number of relativistic electrons in thunderclouds
Using the initial photon energy spectrum f(ǫp) of Eq. (1) as quantified in Table 2
and Table 3, we can estimate the number of relativistic electrons radiating the observed
1− 10MeV γ rays via bremsstrahlung, as
Ne ∼2π
H
∫ 10
1dKe
∫ Ke
1dǫp
∫ θmax
0
f(ǫp)
η(Ke, ǫp, θ)sin θdθ. (2)
Here, η(Ke, ǫp, θ) is the probability per 1 g cm−2 with which an electron with a kinetic416
energy Ke emits a bremsstrahlung photon with an energy ǫp at an angle θ with respect417
to the electron-beam axis [Koch and Motz , 1959], and H denotes the vertical length of418
the acceleration region. Since this H is unavailable from the present observations like in419
Tsuchiya et al. [2009], we assume either H = 300 m or 1000 m, corresponding to 35 g cm−2420
and 110 g cm−2, respectively. These assumptions are based on intracloud observations of421
X rays using a ballon-born detector, which showed that a high electric field region, to422
produce a significant flux in 3− 120 keV energy range, has a vertical extent of ∼ 500 m,423
at altitudes of 3.7 − 4.2 km [Eack et al., 1996].424
We further assumed that the electric-filed strength in the acceleration region is 300425
kVm−1, which is slightly higher than the threshold (at 1 atm) to cause the runaway elec-426
D R A F T February 22, 2011, 1:50am D R A F T
Page 24
X - 24 TSUCHIYA ET AL.: GAMMA RAYS FROM WINTER THUNDERCLOUDS
tron avalanches. When 1 MeV electrons are accelerated from the top of this acceleration427
region to the bottom, they will gain energies of 15 MeV for H = 300 m, and 19 MeV for428
H = 1000 m. Therefore, the assumed electric-field strength, together with the assumed429
vertical length, is sufficient to produce 10 MeV photons via bremsstrahlung.430
To calculate eg.(2), we further need to specify θ; this is suggested to be relatively small,431
from the obtained photon spectra. In practice, the angle of prolonged γ-ray event may432
vary according to the motion of thunderclouds. Thus, we adopt 15◦ or 30◦ as θmax. As433
listed in Table 4, these assumptions, together with eq. (1), give Ne = 109 − 1011. Similar434
estimations for other long-duration γ-ray bursts have given Ne = 108 − 1012 [Tsuchiya435
et al., 2007, 2009; Chilingarian et al., 2010]. Thus, long-duration γ-ray bursts appear to436
be emitted by a similar number of relativistic electrons.437
4.4. Relation between the bursts and the RREA mechanism
A possible source of energetic seed electrons to cause the RREA can be attributable to
secondary cosmic rays [Gurevich et al., 1992]. The cosmic-ray flux above 1 MeV, at the
presently relevant altitudes of <1 km, is I0 ∼ 200m−2s−1 [Grieder , 2001]. Considering the
measured burst periods of 70− 80 sec and the 30 − 40 sec delay of one radiation monitor
from the 071213 event, we presume that the acceleration region has a horizontal length
of L ∼ 600 m at most, as judged from the extent of the γ-ray beam of 071213. Possibly,
an actual extent of the acceleration region in thunderclouds would be shorter than this
600 m, because the γ-ray beam would diverge due to multiple scatterings of the emitting
electrons and Compton scatterings of the emitted γ rays. We may also consider that an
acceleration region is sustained in thunderclouds at least for 100 sec. Accordingly, the
D R A F T February 22, 2011, 1:50am D R A F T
Page 25
TSUCHIYA ET AL.: GAMMA RAYS FROM WINTER THUNDERCLOUDS X - 25
number of cosmic rays S0, entering the acceleration region, is described as
S0 = 7.2× 10⁹ × (L/600 m)2 ×∆t/100 sec. (3)
Based on the RREA mechanism, the total number of relativistic electrons at the end of
an acceleration region, NRREA, is estimated as
NRREA = S0 exp(δ), δ =∫ H
0
dz
λ. (4)
The length parameter λ is given as
λ =7300 kV
E − (276 kVm−1)nm, (5)
where E is the electric-field strength in kVm−1 and n denotes the air density relative to
that at 1 atm. This formula is valid for 300 − 3000 kVm−1 [Dwyer , 2003]. Assuming
E = 300 kVm−1 gives λ ∼ 300m at P = 1 atm. In practice, E may be somewhat lower
than 300 kVm−1, because P during thunderstorms would be usually lower than 1 atm
due to lower pressure system, and hence gives n < 1. Since a uniform field, δ = H/λ,
gives NRREA = S0 exp (H/λ), the factor η = exp (H/λ) is regarded as the avalanche
multiplication factor, and becomes 3 and 30 for H = 300 m and 1000 m, respectively. As
a result, we obtain
NRREA = 2.2× 10¹¹ × (L/600 m)2 ×∆t/100 sec× η/30. (6)
We thus obtain NRREA = 1010 − 1011, which agrees generally with the derived Ne =438
109 − 1011. Thus, the standard RREA process can explain at least the present two439
prolonged bursts.440
In the above estimation, we assumed an electric field is slightly higher than the RREA441
threshold. However, a weaker field below this threshold might suffice to produce prolonged442
D R A F T February 22, 2011, 1:50am D R A F T
Page 26
X - 26 TSUCHIYA ET AL.: GAMMA RAYS FROM WINTER THUNDERCLOUDS
γ-ray emission. In reality, a 30 − 120 keV x-ray flux continuously increased while an443
electric field is lower by 30% − 60% than the RREA threshold [Eack et al., 1996]. This444
quasi-static moderate-level field might be accomplished by e.g. a charging mechanism of445
thunderclouds.446
4.5. Comparisons with TGFs
The derived Ne (sec.4.4) is more than five orders of magnitude lower than the number of447
relativistic electrons expected from TGF observations, e.g. 1016−1017 [Dwyer and Smith,448
2005]. This huge number of relativistic electrons in TGFs may be generated by relativistic449
feedback mechanism, involving positrons and X rays propagating in the opposite direction450
to runaway electrons [Dwyer , 2007, 2008]. Since the estimated Ne of the present bursts451
is in generally agreement with NRREA expected from the simple RREA mechanism, we452
conclude that at least the present two events do not require an intense feedback process.453
In order to better characterize γ-ray spectra of long-duration events, we stacked count454
spectra over three bursts, namely, the present two ones and 070106 [Tsuchiya et al.,455
2007]. Figure 13 compares the summed GROWTH spectrum with averaged TGF ones456
obtained by two independent satellites; one sums 289 events measured by Reuven Ramaty457
High Energy Solar Spectroscopic Imager (RHESSI) [Dwyer and Smith, 2005], while the458
other averages over 34 events observed by the Astrorivelatore Gamma a Immagini Leggero459
(AGILE) satellite [Marisaldi et al., 2010a]. Thus, the composite GROWTH spectrum is460
rather similar in shape to those from TGFs, although three spectra all include detector461
responses. This resemblance is consistent with our basic standpoint [Tsuchiya et al.,462
2007, 2009] that the long-duration γ rays are emitted by the same bremsstrahlung process463
as TGFs.464
D R A F T February 22, 2011, 1:50am D R A F T
Page 27
TSUCHIYA ET AL.: GAMMA RAYS FROM WINTER THUNDERCLOUDS X - 27
On a close comparison, the TGF spectra, especially the AGILE one, appear to have465
a higher cut-off energy than the GROWTH spectrum. This may be attributable to a466
difference in the electric potential operating in an acceleration region [Dwyer and Smith,467
2005]. Thus, electrons accelerated in a much lower atmospheric density at the production468
sites of TGFs, 15− 40 km [Dwyer and Smith, 2005; Carlson et al., 2007; Østgaard et al.,469
2008], would propagate through a longer distance, which gives a higher electric potential,470
and gain higher energies because of a smaller ionization loss per unit length.471
5. Summary
The GROWTH experiment observed two long-duration γ-ray emissions from winter472
thunderstorms on 2007 December 13 and 2008 December 25. The photon spectra ob-473
tained in both events clearly extends to 10 MeV, and are consistent with a scenario474
that accelerated electrons produce, via bremsstrahlung, the observed γ rays. Adopting a475
power-law function as the initial photon spectrum at the source, we have constrained the476
source distance as 290 − 560 m for 071213 and 110 − 690 m for 081225, both at 90% con-477
fidence level. These constraints agree with visible-light observations, which show that the478
bottom of winter thunderclouds is usually located at 200 − 800 m above sea level [Goto479
and Narita, 1992]. We have shown a possibility that the observed γ-ray beams move with480
winter thunderclouds, and spread over ∼ 600 m.481
We estimated the number of relativistic electrons to cause the present prolonged γ-ray482
emissions as 109−1011. These are in general agreement with those expected from the stan-483
dard RREA mechanism triggered by secondary cosmic rays. The cumulative GROWTH484
spectrum, summed over the present two ones and another GROWTH event [Tsuchiya485
D R A F T February 22, 2011, 1:50am D R A F T
Page 28
X - 28 TSUCHIYA ET AL.: GAMMA RAYS FROM WINTER THUNDERCLOUDS
et al., 2007], was found to be similar in basic spectral features with the averaged TGF486
spectra [Dwyer and Smith, 2005; Marisaldi et al., 2010a].487
Acknowledgments. We thank members of radiation safety group at Kashiwazaki-488
Kariwa power station, Tokyo Electric Power Company, for supporting our experiment.489
This work is supported in part by the Special Research Project for Basic Science at490
RIKEN, titled “Investigation of Spontaneously Evolving Systems”, and the Special Podoc-491
toral Research Project for Basic Science at RIKEN. The work is also supported in part492
by Grant-in-Aid for Scientific Research (S), No.18104004, and Grant-in-Aid for Young493
Scientists (B), No. 19740167.494
Notes
1. raifall-thunder observation data are available from http://thunder.tepco.co.jp/495
References
Agostinelli, S., et al., (2003), Geant4a simulation toolkit, Nucl. Inst. Meth. A 506, 250,496
doi:10.1016/S0168-9002(03)01368-8.497
Alexeenko, V. V., N. S. Khaerdinov, A. S. Lidvansky, and V. B. Petkov (2002), Tran-498
sient variations of secondary cosmic rays due to atmospheric electric field and evidence499
for pre-lightning particle acceleration, Phys. Lett. A 301, 299, doi:10.1016/S0375-500
9601(02)00981-7.501
Babich, L. P., E. N. Donskoi, R. I. Ilkaev, I. M. Kutsyk, and R. A. Roussel-Dupre (2004),502
Fundamental parameters of a relativistic runaway electron avalanche in air, Plasm.503
Phys. Rep. 30, 616, doi:10.1134/1.1778437.504
D R A F T February 22, 2011, 1:50am D R A F T
Page 29
TSUCHIYA ET AL.: GAMMA RAYS FROM WINTER THUNDERCLOUDS X - 29
Babich, L. P., E. N. Donskoi, I. M. Kutsyk, and R. A. Roussel-Dupre (2005), The505
feedback mechanism of runaway air breakdown, Geophys. Res. Lett. 32, L09809,506
doi:10.1029/2004GL021744.507
Babich, L. P., E. N. Donskoy, and R. A. Roussel-Dupre (2007), Study of relativistic508
electron avalanche enhancement in the atmosphere at low overvoltages due to avalanche509
bremsstrahlung, Geomag. and Aeron. 47, 515, doi:10.1134/S0016793207040135.510
Babich, L. P., E. I. Bochkov, E. N. Donskoi, and I. M. Kutsyk (2010), Source of prolonged511
bursts of high-energy gamma rays detected in thunderstorm atmosphere in Japan at512
the coastal area of the Sea of Japan and on high mountaintop, J. Geophys. Res., 115,513
A09317, doi:10.1029/2009JA015017.514
Bell, T. F., V. P. Pasko, and U. S. Inan (1995), Runaway electrons as a source of Red515
sprites in the mesosphere, Geophys. Res. Lett. 22, 2127, doi:10.1029/95GL02239.516
Briggs, M. S., et al. (2010), First results on terrestrial gamma ray flashes from the Fermi517
Gammaray Burst Monitor, J. Geophys. Res., 115, A07323, doi:10.1029/2009JA015242.518
Brunetti, M., S. Cecchini, M. Galli, G. Giovannini, and A. Pagliarin (2000), Gamma-ray519
bursts of atmospheric origin in the MeV energy range, Geophys. Res. Lett. 27, 1599,520
doi:10.1029/2000GL003750.521
Carlson, B. E., N. G. Lehtinen, and U. S. Inan (2007), Constraints on terrestrial522
gamma ray flash production from satellite observation, Geophys. Res. Lett. 34, L08809,523
doi:10.1029/2006GL029229.524
Chilingarian, A., A. Daryan, K. Arakelyan, A. Hovhannisyan, B. Mailyan, L. Melkumyan,525
G. Hovsepyan, S. Chilingaryan, A. Reymers, and L. Vanyan (2010), Ground-based526
observations of thunderstorm-correlated fluxes of high-energy electrons, gamma rays,527
D R A F T February 22, 2011, 1:50am D R A F T
Page 30
X - 30 TSUCHIYA ET AL.: GAMMA RAYS FROM WINTER THUNDERCLOUDS
and neutrons, Phys. Rev. D 82, 043009, doi:10.1103/PhysRevD.82.043009.528
Chubenko, A. P. et al. (2000), Intensive X-ray emission bursts during thunderstorms,529
Phys. Lett. A 275, 90, doi:10.1016/S0375-9601(00)00502-8.530
Chubenko, A. P. et al. (2009), Energy spectrum of lightning gamma emission, Phys. Lett.531
A 373, 2953, doi:10.1016/j.physleta.2009.06.031.532
Connaughton, V. et al. (2010), Associations between Fermi Gamma-ray Burst Monitor533
terrestrial gamma ray flashes and sferics from the World Wide Lightning Location Net-534
work, J. Geophys. Res. 115, A12307, doi:10.1029/2010JA015681.535
Dwyer, J. R. (2003), A fundamental limit on electric fields in air, Geophys. Res. Lett. 30,536
2055, doi:10.1029/2003GL017781.537
Dwyer, J. R. et al. (2003), Energetic radiation produced during rocket-triggered lightning,538
Science 299, 694, doi:10.1126/science.1078940.539
Dwyer, J. R et al. (2004a), Measurements of x-ray emission from rocket-triggered light-540
ning, Geophys. Res. Lett. 31, L05118, doi:10.1029/2003GL018770.541
Dwyer, J. R. et al. (2004b), A ground level gamma-ray burst observed in association with542
rocket-triggered lightning, Geophys. Res. Lett. 31, L05119, doi:10.1029/2003GL018771.543
Dwyer, J. R. (2004c), Implications of x-ray emission from lightning, Geophys. Res. Lett.,544
31, L12102, doi:10.1029/2004GL019795.545
Dwyer, J. R. et al. (2005), X-ray bursts associated with leader steps in cloud-to-ground546
lightning, Geophys. Res. Lett. 32, L01803, doi:10.1029/2004GL021782.547
Dwyer, J. R., and D. M. Smith (2005), A comparison between Monte Carlo simulations of548
runaway breakdown and terrestrial gamma-ray flash observations, Geophys. Res. Lett.549
32, L22804, doi:10.1029/2005GL023848.550
D R A F T February 22, 2011, 1:50am D R A F T
Page 31
TSUCHIYA ET AL.: GAMMA RAYS FROM WINTER THUNDERCLOUDS X - 31
Dwyer, J. R. (2007), Relativistic breakdown in planetary atmosphere, Phys. Plasm. 14,551
04290, doi:10.1063/1.2709652.552
Dwyer, J. R. (2008), Source mechanisms of terrestrial gamma-ray flashes, J. Geophys.553
Res. 113, D10103, doi:10.1029/2007JD009248.554
Eack, K. B., W. H. Beasley, R. W. David, T. C. Marshall, and M. Stolzenburg (1996),555
Initial results from simultaneous observation of X rays and electric fields in a thunder-556
storms, J. Geophys. Res. D23, 29637, doi:10.1029/96JD01705.557
Eack, K. B., D. M. Suszcynsky, W. H. Beasley, R. Roussel-Dupre, and E. Symbalisty558
(2000), Gamma-ray emissions observed in a thunderstorm anvil, Geophys. Res. Lett.559
27, 185, doi:10.1029/1999GL010849.560
Enoto, T., H. Tsuchiya, S. Yamada, T. Yuasa, M. Kawaharada, T. Kitaguchi, M.561
Kokubun, H. Kato, M. Okano, S. Nakamura, and K. Makishima (2007), Detection562
of gamma-rays from winter thunderclouds along the coast of Japan Sea, Proc. 30th Int.563
Cosmic Ray. Conf. .564
Fishman, G. J. et al. (1994), Discovery of intense gamma-ray flashes of atmospheric origin,565
Science 264, 1313, doi:10.1126/science.264.5163.1313.566
Goto, Y., and K. Narita, (1992), Observations of winter lightning to an isolate tower, Res.567
Lett. Atmos. Electr. 12, 57.568
Grefenstette, B. W., D. M. Smith, B. J. Hazelton, and L. I. Lopez (2009),569
First RHESSI terrestrial gamma ray flash catalog, J. Geophys. Res 114, A02314,570
doi:10.1029/2008JA013721.571
Grieder, P. K. F. (2001), Cosmic rays at earth pp. 198−230, Elsevier Science B. V.,572
Amsterdam.573
D R A F T February 22, 2011, 1:50am D R A F T
Page 32
X - 32 TSUCHIYA ET AL.: GAMMA RAYS FROM WINTER THUNDERCLOUDS
Gurevich, A. V., G. M. Milikh, and R. A. Roussel-Dupre (1992), Runaway electron mech-574
anism of air breakdown and preconditioning during a thunderstorm, Phys. Lett. A 165,575
463, doi:10.1016/0375-9601(92)90348-P.576
Gurevich, A. V., G. M. Milikh, and J. A. Valdivia (1997), Model of X-ray emission and577
fast preconditioning during a thunderstorm, Phys. Lett. A 231, 402, doi:10.1016/S0375-578
9601(97)00354-X.579
Gurevich, A. V., K. P. Zybin, and Yu. V. Medvedev (2007), Runaway breakdown in strong580
electric field as a source of terrestrial gamma flashes and gamma bursts in lightning581
leader steps, Phys. Lett. A 361, 119, doi:10.1016/j.physleta.2006.05.063.582
Heck, D. et al., (1998), Report FZKA 6019, Forschungszentrum Karlsruhe.583
Heck, D., and T. Pierog, (2009), Extensive Air Shower Simulation with CORSIKA: A584
User’s Guide, p.114, Forschungszentrum Karlsruhe,585
Howard, J., M. A. Uman, J. R. Dwyer, D. Hill, C. Biagi, Z. Saleh, J. Jerauld, H. K.586
Rassoul (2008) Co-location of lightning leader x-ray and electric field change sources,587
Geophys. Res. Lett. 35, L13817, doi:10.1029/2008GL034134.588
Kitagawa, N., and K. Michimoto (1994), Meteorological and electrial aspects of winter589
thunderclouds, J. Geophys. Res. 99, 10713, doi:10.1029/94JD00288.590
Koch, H. W., and J. W. Motz (1959), Bremsstrahlung cross-section formulas and related591
data, Rev. Mod. Phys. 31, 920, doi:10.1103/RevModPhys.31.920.592
Lehtinen, N. G., M. Walt, U. S. Inan, T. F. Bell, and V. P. Pasko (1996), γ-ray emission593
produced by a relativistic beam of runaway electrons accelerated by quasi-electrostatic594
thundercloud fields, Geophys. Res. Lett. 23, 2645, doi: 10.1029/96GL02573.595
D R A F T February 22, 2011, 1:50am D R A F T
Page 33
TSUCHIYA ET AL.: GAMMA RAYS FROM WINTER THUNDERCLOUDS X - 33
Lehtinen, N. G., T. F. Bell, and U. S. Inan (1999), Monte Carlo simulation of runaway596
MeV electron breakdown with application to red sprites and terrestrial gamma ray597
flashes, J. Geophys. Res. 104, 24699, doi:10.1029/1999JA900335.598
Marisaldi, M., et al., (2010a), Detection of terrestrial gamma ray flashes up to 40 MeV599
by the AGILE satellite, J. Geophys. Res. 115, A00E13, doi:10.1029/2009JA014502.600
Marisaldi, M., et al., (2010b), Gamma-Ray Localization of Terrestrial Gamma-Ray601
Flashes, Phys. Rev. Lett. 105, 128501, 10.1103/PhysRevLett.105.128501.602
McCarthy, M. P., and G. K. Parks (1985), Further observations of x-rays inside thunder-603
storms, Geophys. Res. Lett. 12, 393, doi:10.1029/GL012i006p00393.604
Milikh, G., and J. A. Valdivia (1999), Model of gamma ray flashes due to fractal lightning,605
Geophys. Res. Lett. 26, 525, doi:10.1029/1999GL900001.606
Moore, C. B., K. B. Eack, G. D. Aulich, and W. Rison (2001), Energetic ra-607
diation associated with lightning stepped-leaders, Geophys. Res. Lett. 28, 2141,608
doi:10.1029/2001GL013140.609
Muraki, Y. et al. (2004), Effects of atmospheric electric fields on cosmic rays, Phys. Rev.610
D 69, 123010, doi:10.1103/PhysRevD.69.123010.611
Nelson, W. R., H. Hirayama, and D. W. O Rogers, Report SLAC 265 (1985).612
Østgaard, N., T. Gjesteland, J. Stadsnes, P. H. Connell, and B. Carlson (2008), Pro-613
duction altitude and time delays of the terrestrial gamma flashes: Revisiting the614
Burst and Transient Source Experiment spectra, J. Geophys. Res. 113, A02307,615
doi:10.1029/2007JA012618.616
Rakov, V. A., and M. A. Uman (2005), Winter lightning in Japan in Lightning Physics617
and Effects, 3rd ed., pp. 308 - 320., Cambridge Univ. Press.618
D R A F T February 22, 2011, 1:50am D R A F T
Page 34
X - 34 TSUCHIYA ET AL.: GAMMA RAYS FROM WINTER THUNDERCLOUDS
Roussel-Dupre, R. A., A. V. Gurevich, T. Tunnell, and G. M. Milikh (1994), Kinetic theory619
of runaway air breakdown, Phys. Rev. E 49, 2257, doi:10.1103/PhysRevE.49.2257.620
Roussel-Dupre, R. A., and A. V. Gurevich (1996), On runaway breakdown and upward621
propagating discharges, J. Geophys. Res. 101, 2297, doi:10.1029/95JA03278.622
Roussel-Dupre, R., J. J. Colman, E. Symbalisty, D. Sentman, and V. P. Pasko (2008),623
Physical Processes Related to Discharges in Planetary Atmosheres, Space Sci. Rev. 137,624
51, doi:10.1007/s11214-008-9385-5.625
Smith, D. M., L. I. Lopez, R. P. Lin, and C. P. Barrington-Leigh (2005),626
Terrestrial gamma-ray flashes observed up to 20 MeV, Science 307, 1085,627
doi:10.1126/science.1107466.628
Suszcynsky, D. M., R., Roussel-Dupre, and C., Shaw (1996), Ground-based search629
for X rays generated by thunderstorms and lightning, J. Geophys. Res. 101, 23505,630
doi:10.1029/96JD02134.631
Torii, T., M. Takeishi, and T. Hosono (2002), Observation of gamma-ray dose increase632
associated with winter thunderstorm and lightning activity, J. Geophys. Res. 107, 4324,633
doi:10.1029/2001JD000938.634
Torii T.,T. Sugita, S. Tanabe, Y. Kimura, M. Kamogawa, K. Yajima, and H. Yasuda635
(2009), Gradual increase of energetic radiation associated with thunderstorm activity636
at the top of Mt. Fuji, Geophys. Res. Lett. 36, L13804, doi:10.1029/2008GL037105.637
Tsuchiya, H. et al. (2007), Detection of high-energy gamma rays from winter thunder-638
clouds, Phys. Rev. Lett. 99, 165002, doi:10.1103/PhysRevLett.99.165002639
Tsuchiya, H. et al. (2009), Observation of an energetic radiation burst from mountain-top640
thunderclouds, Phys. Rev. Lett. 102, 255003, doi:10.1103/PhysRevLett.102.255003.641
D R A F T February 22, 2011, 1:50am D R A F T
Page 35
TSUCHIYA ET AL.: GAMMA RAYS FROM WINTER THUNDERCLOUDS X - 35
Yamazaki, K., S. Tonouchi, and T. Hashimoto (2002), Factors associated with the varia-642
tions in environmental gamma-ray spectra in Kashiwazaki Kariwa area J. Radio. Nucl.643
Chem. 252, 359, doi:10.1023/A:1015734810119644
Yoshida, S., T. Morimoto, T. Ushio, Z.-I Kawasaki, T. Torii, D. Wang, N. Takagi, and645
T. Watanabe (2008), High energy photon and electron bursts associated with upward646
lightning strokes, Geophys. Res. Lett. 35, L10804, doi:10.1029/2007GL032438.647
Yoshioka, K. (1992), The seasonal variation of rainout activity of short-lived radon daugh-648
ters, Rad. Prot. Dosim. 45, 395, doi:649
D R A F T February 22, 2011, 1:50am D R A F T
Page 36
X - 36 TSUCHIYA ET AL.: GAMMA RAYS FROM WINTER THUNDERCLOUDS
Japa
n Sea
Japan S
ea
900 m
3000 m
1
2
3
4
5
6
8 79
Figure 1. The location of the Kashiwazaki-Kariwa nuclear power plant (left) and its bird
view (right). A filled square in the right panel represents the GROWTH experimental site, while
9 filled circles show locations of radiation monitors. Each original image is taken from Google
Map.
D R A F T February 22, 2011, 1:50am D R A F T
Page 37
TSUCHIYA ET AL.: GAMMA RAYS FROM WINTER THUNDERCLOUDS X - 37
15:00 15:15 15:30 15:45 16:00 16:15 16:30 16:45 17:00
)-1
Cou
nts
(20
sec
30000
35000
(a)
15:00 15:15 15:30 15:45 16:00 16:15 16:30 16:45 17:00
)-1
Cou
nts
(20
sec
2500
3000
3500 (b)
15:15 15:30 15:45 16:00 16:15 16:30 16:45
)-1
Cou
nts
(20
sec
3000
3500
4000(c)
UT15:15 15:30 15:45 16:00 16:15 16:30 16:45
)-1
Cou
nts
(20
sec
2000
2500
(d)
Figure 2. Count rates per 20 sec of the 4 inorganic scintillators over 15:00 − 17:00 UT on
2007 December 13. Panels (a) and (b) show the > 40 keV count rates from the BGO and NaI
scintillators without the anticoincidence of Detector-A, respectively, while panels (c) and (d)
represent those of NaI (> 40 keV) and CsI (> 300 keV) scintillators of Detector-B, respectively.
Horizontal axis shows universal time. Error bars are statistical 1σ. The gaps in panels (a) and
(b) are due to regular interruptions of data acquisition of Detector-A every hour.
D R A F T February 22, 2011, 1:50am D R A F T
Page 38
X - 38 TSUCHIYA ET AL.: GAMMA RAYS FROM WINTER THUNDERCLOUDS
08:30 08:45 09:00 09:15 09:30 09:45 10:00 10:15 10:30
)-1
Cou
nts
(20
sec
24000
26000
28000 (a)
08:30 08:45 09:00 09:15 09:30 09:45 10:00 10:15 10:30
)-1
Cou
nts
(20
sec
1800
2000
2200
2400
2600 (b)
UT08:30 08:45 09:00 09:15 09:30 09:45 10:00 10:15
)-1
Cou
nts
(20
sec
2400
2600
2800
3000 (c)
UT08:30 08:45 09:00 09:15 09:30 09:45 10:00 10:15
)-1
Cou
nts
(20
sec
1400
1600
1800
2000 (d)
Figure 3. The same as Fig. 2, but over 8:30 − 10:30 UT on 2008 December 25.
D R A F T February 22, 2011, 1:50am D R A F T
Page 39
TSUCHIYA ET AL.: GAMMA RAYS FROM WINTER THUNDERCLOUDS X - 39
Co
un
ts/1
2 s
ec
600
650
700
750
800
850(a)
Co
un
ts/1
2 s
ec
650700750800850900950
1000 (b)
Co
un
ts/1
2 s
ec
40
60
80
100
120
140
160
(c)
Universal Time15:55 15:56 15:57 15:58 15:59 16:00 16:01 16:02 16:03 16:04 16:05
Co
un
ts/1
2 s
ec
0
5
10
1520
25
30(d)
Co
un
ts/1
2 s
ec
1400
1500
1600
1700
1800
1900(e)
Co
un
ts/1
2 s
ec
700
750
800
850
900
950 (f)
Universal Time15:56 15:57 15:58 15:59 16:00 16:01 16:02 16:03 16:04
Co
un
ts/1
2 s
ec
0
10
20
30
40
50(g)
Figure 4. Count histories per 12 sec of 071213 in three energy bands from Detector-A (left;
summed over the two NaI) and Detector-B (right; NaI), obtained for 15:55 − 16:05 UT. Panels
(a), (b) and (c) correspond to 0.04− 0.3 MeV, 0.3− 3 MeV and > 3 MeV energy bands without
anticoincidence, respectively. Panel (d) indicates the > 3 MeV energy band of the NaI with
anticoincidence. Panels (e), (f) and (g) are the same as Panels (a), (b) and (c), respectively,
but for Detector-B. Solid curves outside the burst period show the estimated background level
(see text), while dashed ones denote the interpolated background level over the burst period.
Abscissa represents universal time. Each error bar is statistical 1σ.
D R A F T February 22, 2011, 1:50am D R A F T
Page 40
X - 40 TSUCHIYA ET AL.: GAMMA RAYS FROM WINTER THUNDERCLOUDS
Co
un
ts/1
2 s
ec
450
500
550
600
650
700(a)
Co
un
ts/1
2 s
ec
550
600
650
700
750 (b)
Co
un
ts/1
2 s
ec
30405060708090
100110
(c)
Universal Time09:24 09:25 09:26 09:27 09:28 09:29 09:30 09:31 09:32 09:33 09:34
Co
un
ts/1
2 s
ec
0
5
10
15
20
25 (d)
Co
un
ts/1
2 s
ec
1100
1150
1200
1250
1300
1350
1400(e)
Co
un
ts/1
2 s
ec
460480500520540560580600620640
(f)
Universal Time09:25 09:26 09:27 09:28 09:29 09:30 09:31 09:32 09:33
Co
un
ts/1
2 s
ec
05
101520253035
(g)
Figure 5. The same as Fig. 4, but for 081225, obtained over 9:24 − 9:34 UT.
D R A F T February 22, 2011, 1:50am D R A F T
Page 41
TSUCHIYA ET AL.: GAMMA RAYS FROM WINTER THUNDERCLOUDS X - 41
15:54:3615:55:3715:56:3815:57:3915:58:4015:59:4216:00:4316:01:4416:02:4516:03:4616:04:48
Cou
nts/
12 s
ec
5060708090
100110120
15:54:5215:55:5115:56:5115:57:5115:58:5115:59:5116:00:5116:01:5116:02:5116:03:5116:04:51
AD
C
0
200
400
600
800
1000
1200
UT15:55 15:56 15:57 15:58 15:59 16:00 16:01 16:02 16:03 16:04 16:05
)-1
E (
kVm
-40
-20
0
20
40
60
80
09:24:0009:25:0109:26:0209:27:0309:28:0409:29:0609:30:0709:31:0809:32:0909:33:1009:34:12
Cou
nts/
12 s
ec
20
30
40
50
60
70
09:24:2209:25:2109:26:2109:27:2109:28:2109:29:2109:30:2109:31:2109:32:2109:33:2109:34:21
AD
C
1000150020002500300035004000
UT09:24 09:25 09:26 09:27 09:28 09:29 09:30 09:3109:32 09:33 09:34
)-1
E (
kVm
-15
-10
-5
0
5
Figure 6. The count-rate histories of the plastic scintillator of Detector A and the environmen-
tal sensors. Left panels show 071213, obtained over 15:55 − 16:05 UT, while right ones represent
081225, obtained for 9:24 − 9:34 UT. Top, middle and bottom panels in both sides represent
a > 1 MeV counts every 12 sec from the plastic scintillator, 1-sec optical data variations, and
1-sec electric field ones, respectively. All abscissa are universal time. Vertical lines in top panels
represent the burst periods.
D R A F T February 22, 2011, 1:50am D R A F T
Page 42
X - 42 TSUCHIYA ET AL.: GAMMA RAYS FROM WINTER THUNDERCLOUDS
Energy (MeV)-110 1 10
)-1
Cou
nts
(MeV
-110
1
10
210
310
410
Energy (MeV)-110 1 10
-1
1
10
210
310
410
Figure 7. Background-subtracted spectra of Detector-A (left) and B (right) of 071213. Black
and gray points in the left panel indicate the NaI data without and with anticoincidence, respec-
tively, while those in the right panel show the NaI and CsI scintillators, respectively. All error
bars quoted are statistical 1σ. Arrows, showing 95% confidence level upper limits, are draw-
ing when statistical significance of a data point is lower than 1σ. The horizontal and vertical
axes show the photon energy in MeV and count per unit energy interval, respectively. Detector
responses have not been removed.
Energy (MeV)-110 1 10
)-1
Cou
nts
(MeV
-110
1
10
210
310
Energy (MeV)-110 1 10
-1
1
10
210
310
Figure 8. The same as Fig. 7, but for the 081225 event.
D R A F T February 22, 2011, 1:50am D R A F T
Page 43
TSUCHIYA ET AL.: GAMMA RAYS FROM WINTER THUNDERCLOUDS X - 43
Energy (MeV)-110 1 10
)-1
, E)
(MeV
0P
(E
-410
-310
-210
-110
1
10
210
Energy (MeV)-110 1 10
)-1
, E)
(MeV
0P
(E
-410
-310
-210
-110
1
10
210
Energy (MeV)-110 1 10
)-1
, E)
(MeV
0P
(E
-410
-310
-210
-110
1
10
210
Figure 9. Photon spectra at the observatory derived from Monte Carlo simulations. Three
panels correspond to d = 300 m (left), 1000 m (middle), and 2000 m (right). Different colors
denote incident photon energies, E0 = 0.3 (blue), 1 (green), 3 (red), and 10 MeV (black) in
all panels. Abscissa shows the photon energy at the observatory, while ordinate represents
probability density function.
Energy (MeV)-110 1 10
)-1
Cou
nts
(MeV
-110
1
10
210
310
410
300 m
1000 m
2000 m
Energy (MeV)-110 1 10
-1
1
10
210
310
410
Figure 10. The photon spectra observed by the NaI (filled circles) and CsI (open circles)
scintillators of Detector-B, compared with calculations for assumed source distances of 300 m
(black), 1000 m (red), and 2000 m (green). Left panel shows 071213, while right one indicates
081225. For clarity, the CsI data and the corresponding model spectra are multiplied by 0.1. The
horizontal and vertical axes show the photon energy in MeV and counts in each bin, respectively.
D R A F T February 22, 2011, 1:50am D R A F T
Page 44
X - 44 TSUCHIYA ET AL.: GAMMA RAYS FROM WINTER THUNDERCLOUDS
Source distance (m)210 310
2 χ ∆
0
5
10
15
20
25
30
Source distance (m)210 310
0
5
10
15
20
25
30
Figure 11. The values of ∆χ2 = χ2 − χ2min, plotted as a function of the assumed source
distances (black circles). Left and right panels show 071213 and 081225, respectively. Black
curves show smoothing lines. Horizontal dashed lines from bottom to top correspond to 68%,
90%, and 99% confidence level.
Universal Time15:55 15:56 15:57 15:58 15:59 16:00 16:01 16:02 16:03 16:04do
se r
ate
(nG
y/hr
)
80859095
100105110115120
2200230024002500260027002800
Figure 12. Radiation dose rates per 30 sec (left ordinate) obtained by ion chambers of
radiation monitors over 15:55 − 16:05 UT on 2007 December 13. Different colors specify the
radiation monitors numbered as 4 (green), 5 (black), 6 (red), and 7 (blue) in Fig. 1. Superposed
on them, crosses show the > 40 keV count history per 12 sec of the NaI detector of Detector-B
(right ordinate). Vertical dashed lines represent the defined start and end time of the 071213
event.
D R A F T February 22, 2011, 1:50am D R A F T
Page 45
TSUCHIYA ET AL.: GAMMA RAYS FROM WINTER THUNDERCLOUDS X - 45
Photon energy (MeV)-110 1 10
)-1 s
-1C
ount
s (M
eV
-510
-410
-310
-210
-110
1
10
210
This work
AGILE
RHESSI
Figure 13. Cumulative spectra of the three GROWTH events from Detector-B [NaI and
CsI (filled and open circles, respectively)], compared with summed TGF spectra by RHESSI
and AGILE. The latter two spectra are adopted from Fig.2 of Dwyer and Smith [2005] and
Fig.5 of Marisaldi et al. [2010a]. For clarity, the RHESSI and AGILE spectra are multiplied
by 1 × 10⁻⁵ and 1 × 10⁻⁴, respectively. The vertical and horizontal axes represent counts in
MeV−1s−1 and photon energy in MeV, respectively. Errors assigned to the GROWTH and AGILE
data are statistical ones, while those for RHESSI include systematic uncertainty of background
estimation [Dwyer and Smith, 2005].
D R A F T February 22, 2011, 1:50am D R A F T
Page 46
X - 46 TSUCHIYA ET AL.: GAMMA RAYS FROM WINTER THUNDERCLOUDS
Table 1. The count enhancements and the corresponding photon number flux of 071213 and
081225.071213 081225
∆E (MeV) Det. Aa Det. Bb fluxc(×10−2cm−2s−1) Det.Aa Det. Bb fluxc(×10−2cm−2s−1)0.04− 0.3 530± 70 1120± 110 20.2± 1.9 300± 60 390± 90 6.1± 1.70.3− 3 900± 80 1660± 140 22.2± 2.3 400± 60 920± 110 7.6± 2.13− 10 410± 30 370± 20 10.5± 1.0 180± 20 178± 16 6.8± 0.9a Sum of the two NaI detectors.
b The 0.04 − 0.3 MeV count correspond to the NaI detector, while the others a sum of the
NaI and CsI detectors.c The flux is calculated by the data of Detector-B.
Table 2. The obtained spectral parameters and χ2/d.o.f. of the 071213.
P. L. a Exp. P.L. b Exp. P.L. (fix) c
α (MeV−1sr−1) (1.25± 0.03)× 1011 (7.19± 0.02)× 1010 (4.9± 0.6)× 109
β 2.03± 0.02 1.88± 0.01 1.2± 0.1ǫc (MeV) − 50± 20 7χ2min/d.o.f.
d 46.5/28 (1.6%) 46.0/27 (1.3%) 49.6/28 (0.72%)d (m) e 400+160
−110 350+210−240 150+60
−70a Power law model.
b Exponentially cut-off power law model.
c Exponentially cut-off power law with ǫc being fixed at 7 MeV.
d Values in parentheses represent the probability with the given χ2min and d.o.f..
e Quoted errors of d are 90% confidence values, while other errors are 68% ones.
Table 3. The obtained spectral parameters and χ2/d.o.f. of 081225.
P. L. Exp. P.L. Exp. P.L. (fix)α (MeV−1sr−1) (1.21± 0.09)× 109 (6.4± 1.0)× 109 (5.1± 0.4)× 108
β 1.61± 0.03 1.48± 0.09 0.87± 0.02ǫc (MeV) − 70± 80 7χ2min/d.o.f. 40.9/20 (0.38%) 40.6/19 (0.25%) 43.8/20 (0.16%)
d (m) 300+390−180 250+430
−210 100+280 a
a The lower value were unable to be determined.
Table 4. The Ne estimated for 071213 and 081225.
071213 081225θmax(deg.) H = 300 m H = 1000 m H = 300 m H = 1000 m
15 1.9× 10¹⁰ 6.2× 10⁹ 3.7× 10⁹ 1.2× 10⁹
30 4.7× 10¹¹ 1.5× 10¹¹ 9.3× 10¹⁰ 3.0× 10¹⁰
D R A F T February 22, 2011, 1:50am D R A F T


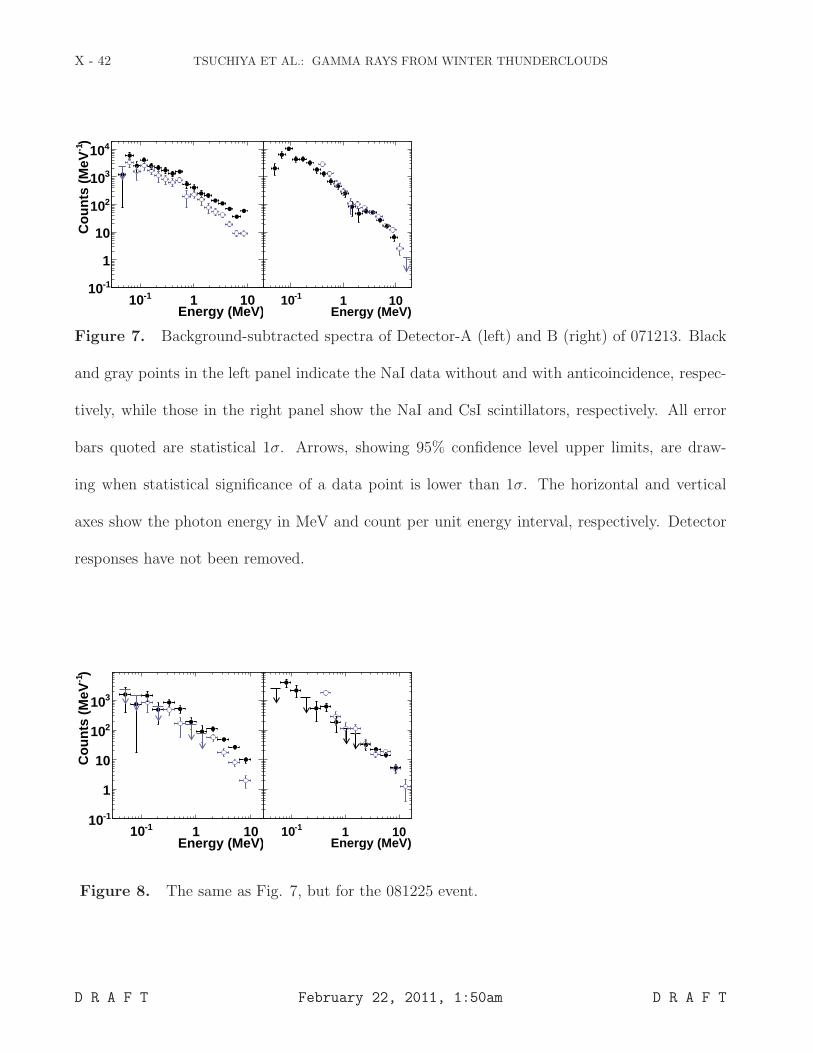


![OpenResearchOnlinelibeprints.open.ac.uk/20626/1/Hall - Space radiation... · 2020. 12. 17. · X-ray and gamma-ray emissions from Gamma Ray Bursts (GRBs) and their afterglows [9].](https://static.documents.pub/doc/80x56/60fa0cd389c2cc23c84f0a6a/openrese-space-radiation-2020-12-17-x-ray-and-gamma-ray-emissions-from.jpg)

