41
RESEARCH NOTE 2008-1 Long-Term Outlook for Timber Prices in the US South, Pacific Northwest and New Zealand (Peter A. Cardellichio and Clark S. Binkley - 9 June 2008)

RESEARCH NOTE 2008-1
Long-Term Outlook for Timber Prices in the US South, Pacific Northwest and New Zealand(Peter A. Cardellichio and Clark S. Binkley - 9 June 2008)

GreenWood Resources
Research Note 2008-1
Long-Term Outlook for Timber Prices in the US South, Pacific Northwest and New Zealand
Peter A. Cardellichio and Clark S. Binkley
9 June 2008
DISCLAIMER. This report is based on information and analysis that the authors believe to be reliable, but the data, results and conclusions are based on numerous assumptions about the future, all of which may be material to the results and any one of which may be inconsistent with future conditions. Estimates of returns based on these projections are not guarantees and the possibility of loss, as well as the opportunity for gain, exists.
CONFIDENTIAL REPORT DO NOT CIRCULATE WITHOUT WRITTEN PERMISSION OF GWR

I. INTRODUCTION Forward-looking expected returns from timberland investments depend on numerous factors, including acquisition cost (or appraised value, for those properties already owned), timber growth rates, management and production costs, and timber prices. Of these, the most difficult to predict has historically been timber prices. For the most part, timber prices, either at the log or stumpage level, are set in competitive markets through the interaction of supply and demand. This report provides an overview of key supply and demand factors that influence prices, with a special emphasis on softwood or coniferous species. We focus on softwoods because of their overwhelming importance to the world timber markets, but note that over the long term, there are opportunities for non-coniferous species to substitute for softwoods.
The plan of this report is as follows. First we provide an overview of global softwood timber markets. We then turn to some of the key factors affecting these markets, including
• US housing, both the current slump and expected long-term demand • Other sources of US demand • The outlook for US timber supply • Possible constraints on Canadian supply • The growth of timber demand in China • Likely restrictions on Russian supply
Following this review of what we regard as the conventional historic factors in determining timber prices, we turn to three emerging issues: the use of wood as a fuel, the impact of climate change and climate-change policies on future supply, and the rising cost of ocean freight and its relationship to fuel charges.
The future is necessarily murky, and perhaps in no sector more so than in timber. We are dealing with complex, interlocking ecological, economic, social and political systems. With such complexity, forecasts are inherently uncertain. We provide our best estimate of the future: a recovery from the current slump to back to trend prices that are constant in real terms for the foreseeable future. We believe that, in the medium term, timber supply and demand are roughly in balance. Growth in demand, especially in Asia, will be accommodated by increases in supplies from existing forests due to past investments in improved management, and from new plantations. Harvests from natural forests are likely to decline in some places due to economic and physical depletion and to increased environmental constraints. But, these reductions are likely to be offset by more heavy exploitation of boreal forests in Russia and tropical forests in such places as central Africa, PNG and Amazonia.
We fully recognize that future developments are likely to be far less smooth and certain than the charts we have included imply. We also discuss some of the
CONFIDENTIAL REPORT DO NOT CIRCULATE WITHOUT WRITTEN PERMISSION FROM GWR
2

risks to the forecast, especially those that might affect trend levels. Because future price development is so uncertain, the portfolio assessment includes a detailed analysis of the impact of future price uncertainty on investment returns.
II. OVERVIEW OF GLOBAL TIMBER MARKETS
In 2005, the world consumed 1.7 billion m3 of industrial roundwood (all roundwood used for commercial products except fuel), of which 65% (or 1.1 billion m3 were coniferous species). Chart 1 provides the regional breakdown of removals and consumption for 2005. North America accounted for over 40% of world coniferous industrial roundwood consumption in 2005 and demand is expected to continue to climb over the long term. Asian demand is substantially less (only 11% of the wood total), but Asia lacks softwood resources and has critical wood deficits (as measured by net import volumes). Historically, Japan and South Korea have topped the list of importers, but recently they have been surpassed by China, where timber deficits are sure to continue to increase. The biggest net exporters of coniferous industrial roundwood are Russia and New Zealand.
CONFIDENTIAL REPORT DO NOT CIRCULATE WITHOUT WRITTEN PERMISSION FROM GWR
3

Chart 1 Regional Timber Removals, Consumption, and Trade, 2005
(Millions of Cubic Meters)
Industrial Roundwood
Removals
Industrial Roundwood
Consumption
Coniferous
share
Coniferous Industrial
Roundwood Consumption
Softwood Timber
(Deficit) Surplus
World
1,711
1,715
65%
1,112
(2)
Asia
237
285
44%
126
(36) China 95 125 64% 80 (19) Japan 16 27 85% 23 (9) Korea 2 9 84% 7 (6) India 23 28 12% 3 (0) Other 101 97 13% 12 (2)
N & C America
635
630
74%
467
5 US 428 422 71% 300 4 Canada 196 197 81% 160 1 Other 11 11 61% 7 (0)
Oceania
49
40
69%
28
6 Australia 27 27 52% 14 1 New Zealand 19 14 98% 14 5 Other 3 0 0 (0)
Russia
140
92
78%
72
34
Europe
404
429
77%
331
(11)
South America
175
173
44%
77
0
Africa
69
66
18%
12
(0)
Source: FAO Yearbook of Forest Products 2005. World industrial roundwood consumption is projected to show steady growth over the next several decades. Driven by residential construction (new and remodeling), nonresidential construction, furniture, industrial uses, and other markets, wood products demand will continue rise. In the US, growth will rebound strongly from current low levels and, of course, Chinese consumption will continue to surge.
Will timber supplies remain plentiful or become more scarce? Will timber market conditions become tighter and drive prices higher? There are several key issues
CONFIDENTIAL REPORT DO NOT CIRCULATE WITHOUT WRITTEN PERMISSION FROM GWR
4

relating to: 1) the sustainability of existing supplies from Canada; 2) the economic availability of wood from Russia; and; 3) the growth and expansion of timber plantations.
In addition to the more conventional important issues that affect timber demand and supply, several other issues have recently become critical. One is wood bioenergy demand as more attention is given to renewable sources of energy. Another is the development of policies to address climate change, some of which can lead to an expansion of the timber resource, while others can lead to a reduction in the resource base. Finally, the cost of ocean shipping has increased sharply over the past two years and the future course of freight rates will have an important effect on timber and timberland valuations around the globe.
A. U.S. Timber Demand: Housing
The future of residential construction will be the most critical factor in determining the outlook for solid wood products demand in the U.S. This sector is the largest consumer of wood and the most cyclical. Other sectors—particularly industrial— will tend to rise with overall economic trends.
The U.S. is the world’s largest market for timber products and therefore a critical region for all suppliers. In recent years, new housing construction in the U.S. has accounted for about 45% of softwood lumber demand and 55% of structural panel demand. U.S. housing construction is currently at very depressed levels and questions have been raised about its long-term trend and housing affordability.
CONFIDENTIAL REPORT DO NOT CIRCULATE WITHOUT WRITTEN PERMISSION FROM GWR
5
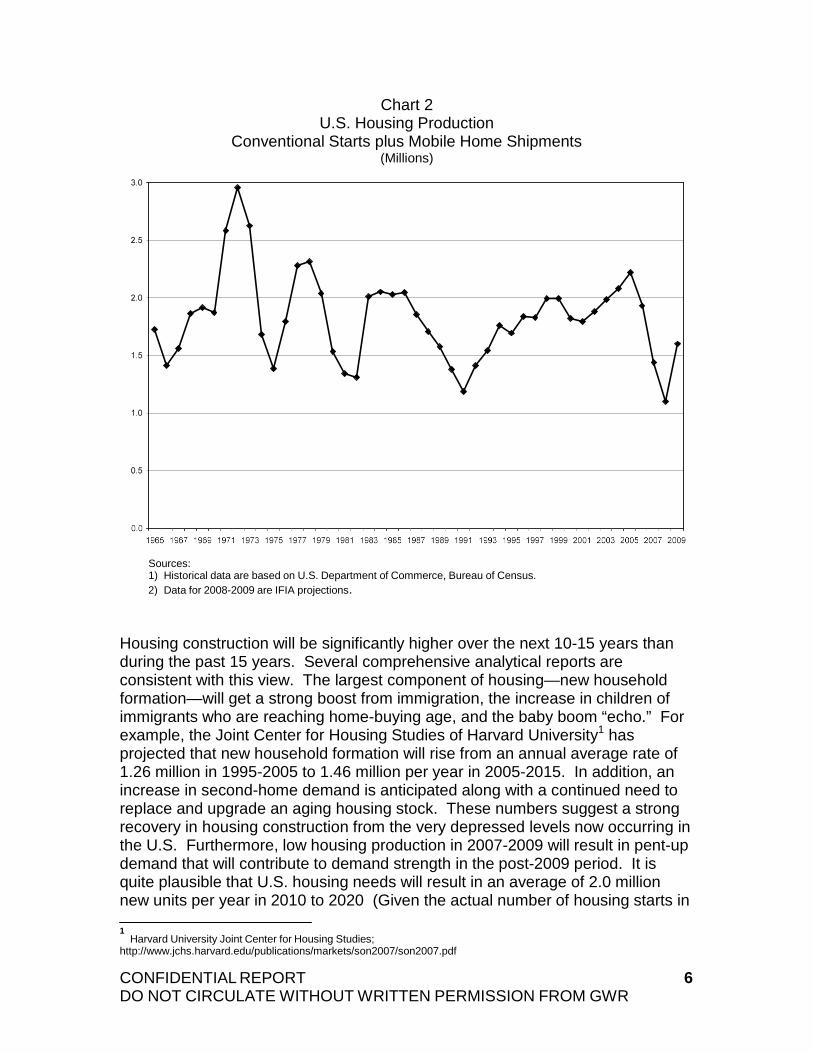
Chart 2 U.S. Housing Production
Conventional Starts plus Mobile Home Shipments (Millions)
Sources: 1) Historical data are based on U.S. Department of Commerce, Bureau of Census. 2) Data for 2008-2009 are IFIA projections.
Housing construction will be significantly higher over the next 10-15 years than during the past 15 years. Several comprehensive analytical reports are consistent with this view. The largest component of housing—new household formation—will get a strong boost from immigration, the increase in children of immigrants who are reaching home-buying age, and the baby boom “echo.” For example, the Joint Center for Housing Studies of Harvard University1 has projected that new household formation will rise from an annual average rate of 1.26 million in 1995-2005 to 1.46 million per year in 2005-2015. In addition, an increase in second-home demand is anticipated along with a continued need to replace and upgrade an aging housing stock. These numbers suggest a strong recovery in housing construction from the very depressed levels now occurring in the U.S. Furthermore, low housing production in 2007-2009 will result in pent-up demand that will contribute to demand strength in the post-2009 period. It is quite plausible that U.S. housing needs will result in an average of 2.0 million new units per year in 2010 to 2020 (Given the actual number of housing starts in
1
Harvard University Joint Center for Housing Studies; http://www.jchs.harvard.edu/publications/markets/son2007/son2007.pdf
CONFIDENTIAL REPORT DO NOT CIRCULATE WITHOUT WRITTEN PERMISSION FROM GWR
6

2005-2008, to meet the demand levels suggested by the Harvard Study for 2005- 2015, 2.25 million new units would be required annually in 2010-2015.)
In addition to new housing demand, the Harvard study expects real expenditures on repairs and remodeling to increase at 4% per year.
B. U.S. Softwood Timber Demand: Products
Solid wood products demand in the U.S. has risen rapidly over the past three decades. As shown below, softwood lumber consumption has climbed from around 60 mm m3 in the mid-1970s to over 100 mm m3 in 2004-2006 (Chart 3), while the demand for structural panels has risen from around 15 mm m3 to over 35 mm m3 over the same period (Chart 4)2.
The outlook for housing construction—in combination with growth in repairs and alterations and industrial production—suggest that the demand for both lumber and structural panels will bounce back sharply over the next few years and climb to much higher levels over the next 10-15 years. Historical trends and exogenous factors suggest that annual increases near 2% for lumber and 3% for structural panels would be reasonable expectations.
2 Where it was necessary to convert North American product volumes to a metric basis, the following conversion factors
were used: 1,000 board feet softwood lumber in N. American market = 1.70 cubic meters 1,000 board feet softwood lumber for offshore trade = 2.36 cubic meters 1,000 square feet, 3/8 inch basis of panels = 0.885 cubic meters 1,000 cubic feet = 28.3 cubic meters 1,000 short tons = 907 metric tons
CONFIDENTIAL REPORT DO NOT CIRCULATE WITHOUT WRITTEN PERMISSION FROM GWR
7

Chart 3 U.S. Softwood Lumber Consumption, Production & Trade
(Millions of Cubic Meters)
Sources: 1) Production, Consumption, and Prices of Softwood Products in North America: Regional Time Series Data, 1950-
1985; USFS, PNW-RB-151 2) U.S. Timber Production, Trade, Consumption, and Price Statistics, 1965 to 2005; USFS, FPL-RB-637 3) Production, Prices, Employment and Trade in Northwest Forest Industries, All Quarters 2006; USFS, PNW-RB-
255 4) Lumber Production and Mill Stocks-2007; US Census Bureau, MA321T(07)
CONFIDENTIAL REPORT DO NOT CIRCULATE WITHOUT WRITTEN PERMISSION FROM GWR
8

Chart 4 Structural Panels, Softwood Plywood, & Oriented Strandboard (OSB)
Consumption and OSB Supplies (Millions of Cubic Meters)
Note: Data for OSB includes waferboard. Sources: 1) U.S. Timber Production, Trade, Consumption, and Price Statistics, 1965 to 2005; USFS, FPL-RB-637 2) Production, Prices, Employment and Trade in Northwest Forest Industries, All Quarters 2006; USFS, PNW-RB-
255 3) Forest Products Statistics, 2002-2006; UNECE, Timber Bulletin, 2007
The future of U.S. paper and paperboard demand is a much different story. From 1965 to 1999, demand rose on an almost uninterrupted trajectory, at a rate of about 2.5% per year (Chart 5). While many observers predicted the advent of the paperless office and the demise of the newspapers during this time, graphic paper demand continue on its upward track. (Graphic papers include both newsprint and printing and writing papers.) Graphic paper usage slipped in 2000 and this finally marked an important shift in paper consumption due to internet use, electronics, and paper conservation. Improvements in computer technology and greater acceptance of electronic communication are likely to keep growth rates in overall paper and board consumption at very modest levels over the next 10-15 years. U.S. paper and board production closely tracks consumption as net imports have remained relatively steady at around 8% of demand.
U.S. wood pulp consumption has grown much more slowly than paper and board production. While there are some complex issues involved in furnish use among
CONFIDENTIAL REPORT DO NOT CIRCULATE WITHOUT WRITTEN PERMISSION FROM GWR
9
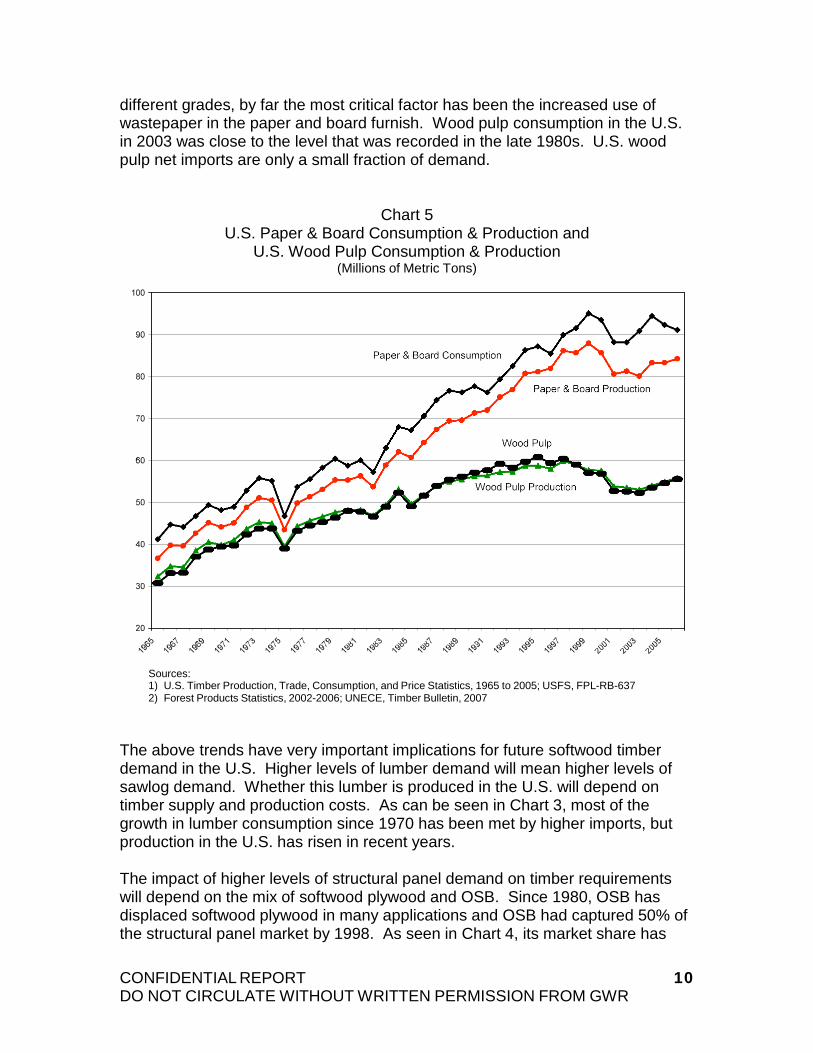
different grades, by far the most critical factor has been the increased use of wastepaper in the paper and board furnish. Wood pulp consumption in the U.S. in 2003 was close to the level that was recorded in the late 1980s. U.S. wood pulp net imports are only a small fraction of demand.
Chart 5 U.S. Paper & Board Consumption & Production and
U.S. Wood Pulp Consumption & Production (Millions of Metric Tons)
Sources: 1) U.S. Timber Production, Trade, Consumption, and Price Statistics, 1965 to 2005; USFS, FPL-RB-637 2) Forest Products Statistics, 2002-2006; UNECE, Timber Bulletin, 2007
The above trends have very important implications for future softwood timber demand in the U.S. Higher levels of lumber demand will mean higher levels of sawlog demand. Whether this lumber is produced in the U.S. will depend on timber supply and production costs. As can be seen in Chart 3, most of the growth in lumber consumption since 1970 has been met by higher imports, but production in the U.S. has risen in recent years.
The impact of higher levels of structural panel demand on timber requirements will depend on the mix of softwood plywood and OSB. Since 1980, OSB has displaced softwood plywood in many applications and OSB had captured 50% of the structural panel market by 1998. As seen in Chart 4, its market share has
CONFIDENTIAL REPORT DO NOT CIRCULATE WITHOUT WRITTEN PERMISSION FROM GWR
10

continued to grow since that time and we expect to see further gains in the future. Thus, although structural panel demand will continue to show strong growth, the anticipated change in the mix of OSB and plywood will likely translate to flat-to-declining demand for sawlogs, and rising demand for smaller pulpwood logs to produce OSB.
We expect wood pulp production will decline over the next 10-15 years. The decreases result from three main trends: 1) slow growth in paper and board production; 2) rising wastepaper furnish shares; and 3) rising imports of wood pulp from new low-cost mills in the southern hemisphere. This will mean that the demand for pulpwood for wood pulp will also decline. Part of this decline will be offset by an expansion of OSB production, while the use of wood for bioenergy will also play a role in increasing the demand for pulpwood.
C. North American Softwood Timber Supply: Timber Availability in the U.S.
The two major supply regions for softwood timber in the U.S. are the South and the Pacific Northwest Westside (PNWW; this region is defined as Western Oregon and Western Washington). They have been particularly important as suppliers of sawlogs for lumber and plywood manufacturing, as well as for log exports. For example, in 2005, the two regions accounted for 75% of U.S. softwood lumber production.
With U.S. lumber demand projected to rise over the next 10-15 years, what is the likely contribution from these regions? Are softwood timber supplies in these regions rising or falling? Are these regions in a competitive position to increase lumber production to keep pace with lumber demand, or even to increase their share of this market?
Softwood lumber production has risen substantially in both regions over the past 15 years. As shown in Chart 6, production in the U.S. South has been on a fairly steady upward path since the early 1980s. However, production in the PNWW declined dramatically from the mid-1980s to the mid-1990s, and has since rebounded sharply.
CONFIDENTIAL REPORT DO NOT CIRCULATE WITHOUT WRITTEN PERMISSION FROM GWR
11
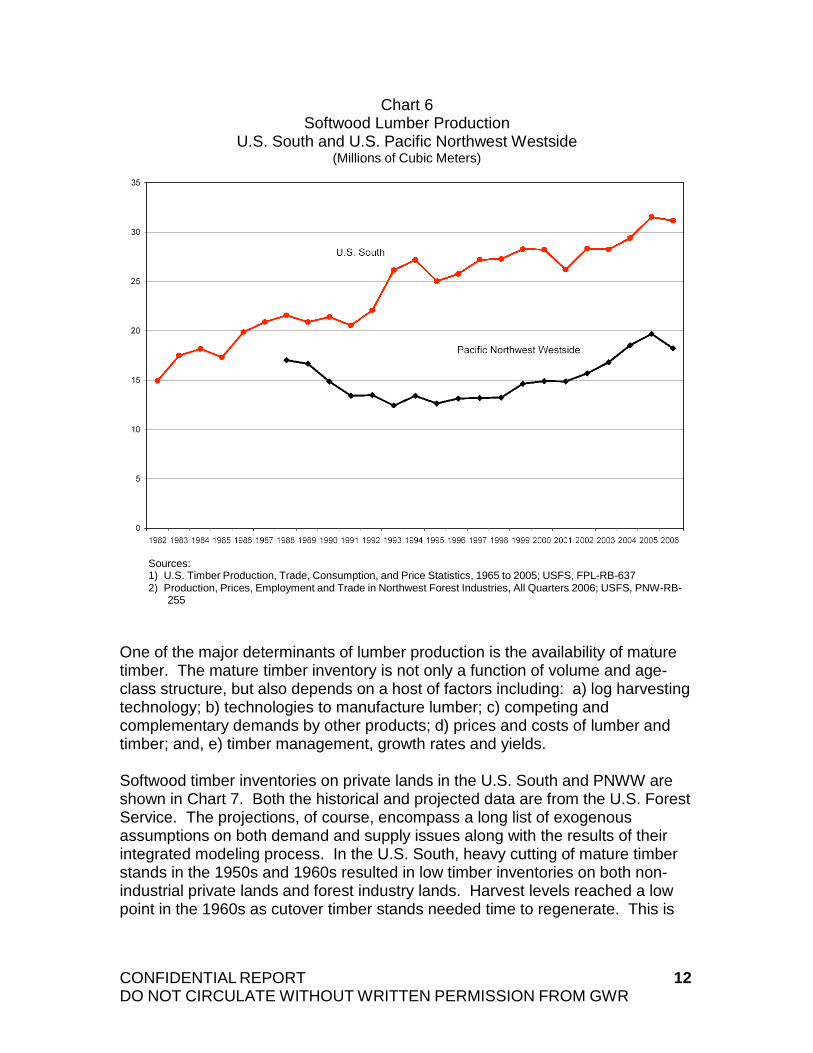
Chart 6 Softwood Lumber Production
U.S. South and U.S. Pacific Northwest Westside (Millions of Cubic Meters)
Sources: 1) U.S. Timber Production, Trade, Consumption, and Price Statistics, 1965 to 2005; USFS, FPL-RB-637 2) Production, Prices, Employment and Trade in Northwest Forest Industries, All Quarters 2006; USFS, PNW-RB-
255 One of the major determinants of lumber production is the availability of mature timber. The mature timber inventory is not only a function of volume and age- class structure, but also depends on a host of factors including: a) log harvesting technology; b) technologies to manufacture lumber; c) competing and complementary demands by other products; d) prices and costs of lumber and timber; and, e) timber management, growth rates and yields.
Softwood timber inventories on private lands in the U.S. South and PNWW are shown in Chart 7. Both the historical and projected data are from the U.S. Forest Service. The projections, of course, encompass a long list of exogenous assumptions on both demand and supply issues along with the results of their integrated modeling process. In the U.S. South, heavy cutting of mature timber stands in the 1950s and 1960s resulted in low timber inventories on both non- industrial private lands and forest industry lands. Harvest levels reached a low point in the 1960s as cutover timber stands needed time to regenerate. This is
CONFIDENTIAL REPORT DO NOT CIRCULATE WITHOUT WRITTEN PERMISSION FROM GWR
12

evident in both the rapid climb in timber inventory, as well as the very high growth-to-harvest ratios shown in Chart 83.
In the PNWW, sales of timber from U.S. Forest Service lands were critical in determining the management and evolution of timber inventories on private lands. From 1952 through the present time, softwood inventories on private lands have declined. Much of this was due to harvesting of large volumes of old- growth timber (and old second-growth timber stands) and this is reflected in very low growth-to-harvest ratios over most of the period. Sales from Forest Service lands were slashed after 1990 which led to a large decline in lumber production and increased pressure to harvest private timber. A rebuilding of private timber inventories in harvest-eligible age classes over the past two decades, increasing timber management effort, substantial reductions in rotation ages, and changes in lumber milling technology have allowed lumber production to rebound sharply over the past 10 years. At the same time, growth-to-harvest ratios have stabilized near 1.0 on private lands and timber inventories have leveled off.
3 The ratio of timber growth to timber harvest is a useful, if aggregate measure of timber scarcity. If the ratio is greater
than 1.0, then, by definition, the timber inventory is increasing and vice versa. Due to changes in the age-class structure of a forest, it is possible to have a growth-to-harvest ratio less than 1.0 and still have the timber inventory increase in the long run.
CONFIDENTIAL REPORT DO NOT CIRCULATE WITHOUT WRITTEN PERMISSION FROM GWR
13
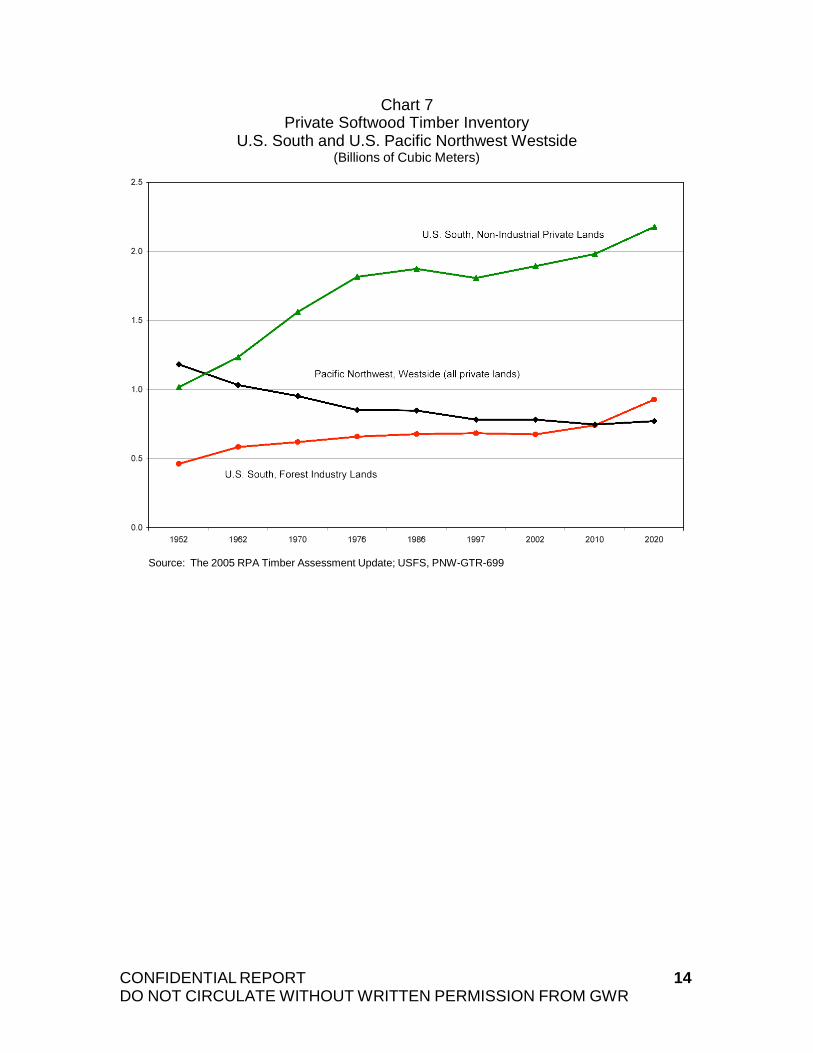
Chart 7 Private Softwood Timber Inventory
U.S. South and U.S. Pacific Northwest Westside (Billions of Cubic Meters)
Source: The 2005 RPA Timber Assessment Update; USFS, PNW-GTR-699
CONFIDENTIAL REPORT DO NOT CIRCULATE WITHOUT WRITTEN PERMISSION FROM GWR
14

Chart 8 Softwood Timber Growth/Harvest Ratios on Private Lands
U.S. South and U.S. Pacific Northwest Westside
Source: The 2005 RPA Timber Assessment Update; USFS, PNW-GTR-699 Looking forward, our view is that the U.S. South and PNWW are well-positioned to increase softwood lumber production over the next 10-15 years and thus help meet growing demand in the U.S. market. Softwood timber inventory levels seem to be at reasonable healthy levels and forests are being harvested in a more regulated manner. In addition, the use of sawlogs for plywood is likely to continue to decline as softwood plywood continues to lose market share to OSB. While some analysts have pointed out that the increased supply of wood from B.C. could cause reductions in lumber output from these two regions over the near term, our contention is that this is unlikely due primarily to rising U.S. demand for softwood lumber, a weak U.S. dollar that will affect both Canadian and offshore imports, and more vulnerable supply sources in other regions (including those of the U.S. West outside of the PNWW). If increased supply from B.C. does displace harvests from U.S. forests, then the domestic timber inventory will simply be better positioned to supply domestic needs once the Canadian supply declines.
CONFIDENTIAL REPORT DO NOT CIRCULATE WITHOUT WRITTEN PERMISSION FROM GWR
15

D. North American Softwood Timber Supply: Canadian Supply Constraints?
A large share of the U.S. demand for softwood lumber is supplied by imports from Canada. In 1985, Canada shipped about 25 mm m3 of softwood lumber to the U.S. (accounting for 33% of U.S. demand). From 2004 to 2006, the average volume arriving from Canada was about 35 mm m3, still representing about 1/3 of U.S. apparent consumption. Significant increases or decreases in lumber supplies from Canada will have a large effect on the demand-supply balances in the U.S. These will, in turn, be very important in determining whether product and timber prices will move lower or higher over the time horizon in question.
Will Canada be able to continue to increase its shipments to the U.S. and maintain its share of that market? A Mountain Pine Beetle (“MPB”) infestation is currently devastating lodgepole pine stands in B.C. and a key issue is how the widespread mortality will alter supplies from that province over the next 10-15 years. A second question concerns the rapid expansion of lumber production in Ontario and Quebec and whether it feasible to continue to look to these provinces for increasing volumes of softwood lumber.
Considerable information has been published on the extent of MPB mortality in B.C. The B.C. government has run simulations on timber availability and potential harvest levels. We have analyzed these data and believe: 1) there will be a sharp increase in lumber shipments to the U.S. in the near term (we have not seen much of this yet because of the weak demand in the U.S., resulting low prices, countervailing duties, and the strong Canadian dollar); 2) over the medium term, harvest will decline, but the decline will be gradual due to much longer shelf-life than generally presumed due to technology and more favorable prices (hence improved economics of lumber recovery)—see Chart 9. Lumber recovery may fall as more MPB-killed wood is processed, so lumber production may fall more rapidly than harvest levels. Nevertheless, it could be a decade or more before production falls below pre-MPB levels.
CONFIDENTIAL REPORT DO NOT CIRCULATE WITHOUT WRITTEN PERMISSION FROM GWR
16

Chart 9 B.C. Interior Sawlog Harvest and Mountain Pine Beetle Mortality
(Millions of Cubic Meters)
Notes: The dashed line is the projected harvest level for the B.C. Interior region adopting the analysis from the BC model (Forest Analysis and Inventory Branch) that includes an assumption of a 2.5-year shelf life for beetle-killed timber. The projected harvest level shown by the solid line shows our adjustment of the BC results to reflect an assumed shelf-life of 7.5 years. Sources: 1) Timber Supply and Mountain Pine Beetle Infestation in British Columbia, 2007 Update; BC Ministry of Forests
and Range, 2007 2) Production, Prices, Employment and Trade in Northwest Forest Industries, All Quarters 2006; USFS, PNW-RB-
255 3) BC Council of Forest Industries 4) IFIA estimates
As for eastern Canada, the softwood timber annual allowable cut (AAC) in both Ontario and Quebec has declined significantly during the past 15 years. In Ontario, the provincial-wide softwood timber AAC decreased from 27.4 mm m3 in 1992 to 25.0 in 1995, and was further reduced to 20.2 in 1997. Since that time, the AAC has fluctuated in the 20.0-21.0 mm m3 range (see Chart 10). However, softwood harvest levels in Ontario have been substantially below this potential, averaging only 16 mm m3 per year from 1991 to 2005 so reductions in the AAC my have little impact on the softwood lumber supply/demand balance in North America.
Importantly, the situation in Quebec is evolving differently. Reductions in the allowable cut have been much more recent. The provincial-wide softwood timber AAC in Quebec remained close to 36.3 mm m3 from 1990 to 2004 and was
CONFIDENTIAL REPORT DO NOT CIRCULATE WITHOUT WRITTEN PERMISSION FROM GWR
17

reduced to about 30 mm m3 for 2005-2007 pending further review by the Ministry of Forestry. In September 2007, the chief forester announced further reductions for the period 2008-2013, thus bringing the softwood timber AAC for all lands down to the 28-29 mm m3 range. Thus, the decline from 2004 to 2008 was about 21%.
Chart 10 Quebec and Ontario AAC
(Millions of Cubic Meters)
Sources: 1) Canadian National Forestry Database 2) Resultats Provinciaux; Quebec, Bureau du Forestier en chef 3) IFIA estimates
For Crown lands in Quebec, the softwood timber AAC was 30.5 mm m3 in 2004 (and had averaged 31.3 mm m3 for 1991-2004). In 2005, the AAC was reduced 20% to 24.3 mm m3. For the period 2008-2013, the AAC was reduced another 5% to 23.0 mm m3 bringing the total reduction on Crown lands to 25% from 2004 to 2008. The average harvest of softwood timber on Crown lands averaged 24.7 mm m3 in 1991-2000, well below the AAC. Average harvest levels did not change much in 2001-2005, registering 25.2 mm m3. But it is clear from the data (and Chart 11) that softwood harvests on Crown lands will need to be reduced over the next five years.
CONFIDENTIAL REPORT DO NOT CIRCULATE WITHOUT WRITTEN PERMISSION FROM GWR
18

Thus, it appears that harvest levels in Quebec and Ontario will be reduced from recent historical averages (though they will rise from the depressed conditions of 2008). However, it is more difficult to assess the conditions on private provincial lands (where cut has tracked below the AAC numbers) and in some of the smaller eastern Canadian provinces. Another factor to consider is that there could be a modest shift from pulp to lumber, as high-cost pulp mills close or shift to a greater reliance on hardwood resources.
Overall, our view is that eastern Canada will not be able to increase their export of lumber volumes to the growing U.S. market. Shipment volumes could decline over the next 10-15 years; however, even with the situation in Quebec, it is possible that the region as a whole could maintain exports near recent levels.
Chart 11 Quebec AAC and Harvest Levels, Crown Lands Only
(Millions of Cubic Meters)
Sources: 1) Canadian National Forestry Database 2) Resultats Provinciaux; Quebec, Bureau du Forestier en chef
E. Chinese Timber Demand and Need for Imports
Chinese economic growth has resulted in massive increases in timber consumption across the full range of wood and paper products. In addition,
CONFIDENTIAL REPORT DO NOT CIRCULATE WITHOUT WRITTEN PERMISSION FROM GWR
19
China has become a large exporter of furniture, plywood, and some grades of paper. At the same time, China lacks domestic wood resources so this growth in demand has been met by huge increases in timber imports. Large investments in plantations have been taking place throughout China to improve their ability to support future growth.
There is little doubt that China’s rapid economic development will continue to drive timber demand sharply higher over the next 10-15 years. One key issue is how fast will demand increase. The second key question concerns the source of supplies to meet this future growth. Some forecasts by the Chinese government suggest that large investments in timber plantations will make China self- sufficient over the medium-term horizon. Will domestic timber sources help alleviate some of the shortages in China? Or will much higher import volumes be necessary to meet the growth in demand?
In 2007, China imported 47 mm m3 of logs and sawnwood (on a roundwood equivalent basis—RWE is the amount of roundwood needed to produce a given product), which compares to imports of 32 mm m3 in 2002 and only 6 mm m3 in 1997. In a situation that is somewhat analogous to its demand for oil, iron ore, and other natural resources, China has reached around the globe to satisfy its growing appetite for raw materials.
CONFIDENTIAL REPORT DO NOT CIRCULATE WITHOUT WRITTEN PERMISSION FROM GWR
20

Chart 12 Chinese Imports of Logs and Sawnwood
(Millions of Cubic Meters, RWE)
Note: RWE for sawnwood calculated assuming 1.5 m3 of logs are required to produce 1.0 m3 of sawnwood. Sources: 1) Log Imports: A Long-term Solution to Meeting China’s Fiber Needs? Presentation by Nilsson and Sun, 2006. 2) ITTO, various reports 3) IFIA estimates
The rate of growth in Chinese imports of timber will have an important bearing on the balance of world timber demand and supplies. A continued surge in growth over the near term has the ability to stretch global supplies and tighten markets worldwide.
There are many unknowns about the Chinese market due to a combination of poor data, lack of reliable information, industry fragmentation, and lack of transparency. In addition, the political agenda and political posturing make it more difficult to assess developments in markets, particularly where resources are concerned. The situation is further clouded by illegal forest practices, logging, and trade both within China and throughout the region.
With this in mind, it is safe to say that Chinese demand will continue to grow rapidly. The actual rate of growth will depend on supply factors and prices. We believe it is likely that Chinese supplies will fall far short of their targets and official projections (one reason is the historical record for these projections, including over-optimism of growth and yield projections; a second is competing
CONFIDENTIAL REPORT DO NOT CIRCULATE WITHOUT WRITTEN PERMISSION FROM GWR
21

demands for land for agriculture and wood for fuel). While there are a wide range of estimates for future demand for imports, we believe that any reasonable scenario will show sharply higher levels of timber imports over the next 10-15 years.
Chart 13 Chinese Imports of Logs and Sawnwood by Source Country
(Millions of Cubic Meters, RWE)
Logs 2002 2007
Russia 14.81 25.40 PNG 1.13 2.34 Malaysia 2.12 1.33 New Zealand 1.27 Gabon 1.15 Solomon Islands 1.05 Other 6.27 4.56 TOTAL 24.33 37.10
Sawnwood
Russia 0.55 2.38 USA 1.61 Canada 1.01 Malaysia 0.69 0.47 Brazil 0.42 Myanmar 0.32 0.39 Indonesia 2.03 0.39 New Zealand 0.38 Other 4.50 2.79 TOTAL 8.09 9.83
Note: See Chart 12 for RWE conversion. Sources: 1) ITTO, various reports 2) IFIA estimates
F. Russian Timber Supplies in Jeopardy?
Russia has a huge softwood timber resource that has held great promise as the wood basket for the world. Recently, this resource has been significantly tapped to supply large volume of logs to China. But there have always been questions concerning the economic availability of wood from the Russian Far East and Siberia because of the remoteness of these regions, the long haul distances, and the lack of infrastructure. Furthermore, a significant percentage of the wood now being exported is generally thought to come from illegal sources.
CONFIDENTIAL REPORT DO NOT CIRCULATE WITHOUT WRITTEN PERMISSION FROM GWR
22

In 2006, Russia implemented an export duty of 6.5% on softwood log exports. The duty was increased to 20% in 2007, and to 25% in April 2008, and is scheduled to jump to 80% in January 2009. Given the situation in Russia—not only regarding timber supply, but also political and economic considerations— how will this high export tax affect the supply and cost of wood shipped to other countries?
Russia has played a critical role in meeting the rising global demand for timber over the past decade (particularly in East Asia and Europe). Any disruptions to current flows, or limitations to expanded wood flows, will have a substantial impact on the supply-demand balance of wood in the Pacific Rim and in Europe. Russia is one of the few countries that have adequate physical supplies of timber to keep pace with the growth in demand in China.
The rapid growth in Russian wood supplies is likely to come to an end due to raw material constraints. The most accessible Russian forests have been high- graded and logged illegally, and fires have taken their toll as well. Rising costs of fuel and infrastructure development will also make it difficult to extend harvests into more remote areas. Furthermore, better governance and forest management is likely to play a role in more judicious harvesting.
Rising export taxes on Russian log exports will shift the mix of exports so that the lumber share rises. Russian statistics already show a sharp increase in lumber exports relative to logs, but most of this has occurred in European Russia where lumber mill utilization was very low and new investment has taken place (Chart 14). In the Far East and Siberia, we believe that it will be much more difficult to attract capital at the speed envisioned by the Russian government for both economic and political reasons (including extensive corruption). As a result, a large share of export logs will likely go around the “gate” to avoid the taxes. Others are likely to be imported at “negotiated” rates (effectively manipulating the border prices to reduce the tax consequences). Finally, there is a good chance that the Russian government will recognize that the exorbitant 80% tax increase planned for 2009 is too much too soon, and will reduce planned rates significantly. (There has been tremendous pressure from Swedish and Finnish governments to make this happen and the implementation of this tax has had important consequences in delaying Russia’s WTO accession).
CONFIDENTIAL REPORT DO NOT CIRCULATE WITHOUT WRITTEN PERMISSION FROM GWR
23
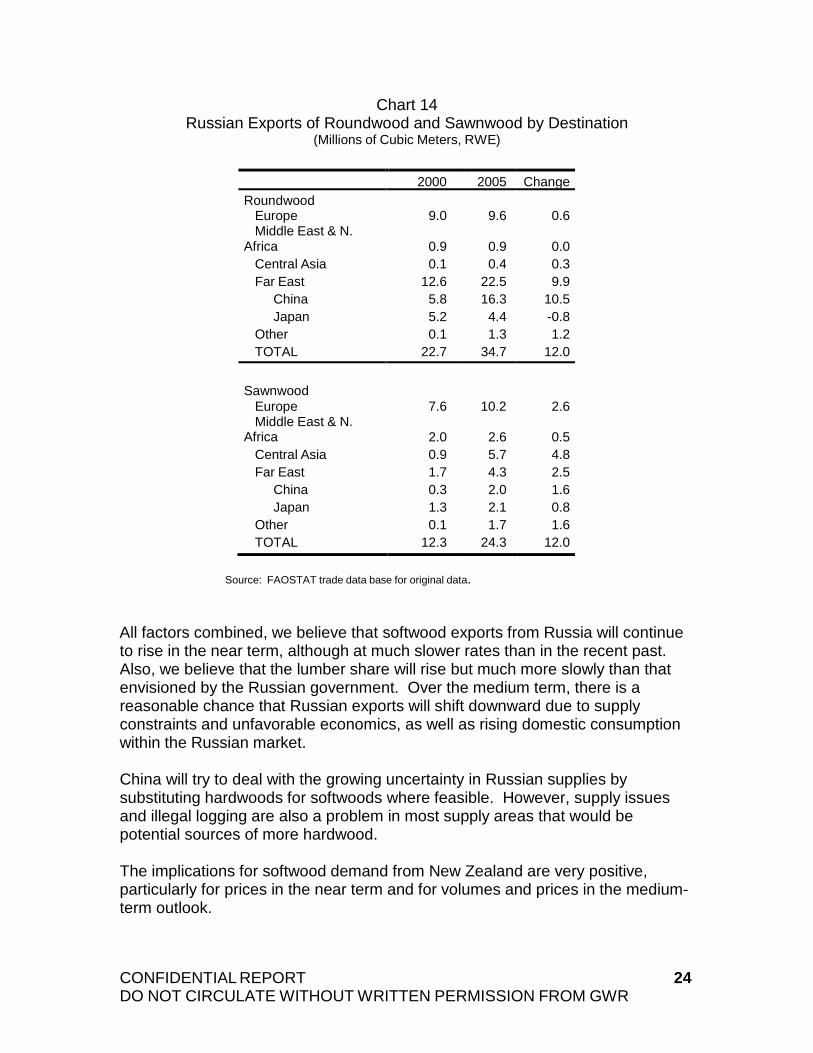
Chart 14 Russian Exports of Roundwood and Sawnwood by Destination
(Millions of Cubic Meters, RWE)
2000 2005 Change Roundwood
Europe Middle East & N.
Africa
9.0
0.9
9.6
0.9
0.6
0.0 Central Asia 0.1 0.4 0.3 Far East 12.6 22.5 9.9
China 5.8 16.3 10.5 Japan 5.2 4.4 -0.8
Other 0.1 1.3 1.2 TOTAL 22.7 34.7 12.0
Sawnwood
Europe Middle East & N.
Africa
7.6
2.0
10.2
2.6
2.6
0.5 Central Asia 0.9 5.7 4.8 Far East 1.7 4.3 2.5
China 0.3 2.0 1.6 Japan 1.3 2.1 0.8
Other 0.1 1.7 1.6 TOTAL 12.3 24.3 12.0
Source: FAOSTAT trade data base for original data. All factors combined, we believe that softwood exports from Russia will continue to rise in the near term, although at much slower rates than in the recent past. Also, we believe that the lumber share will rise but much more slowly than that envisioned by the Russian government. Over the medium term, there is a reasonable chance that Russian exports will shift downward due to supply constraints and unfavorable economics, as well as rising domestic consumption within the Russian market.
China will try to deal with the growing uncertainty in Russian supplies by substituting hardwoods for softwoods where feasible. However, supply issues and illegal logging are also a problem in most supply areas that would be potential sources of more hardwood.
The implications for softwood demand from New Zealand are very positive, particularly for prices in the near term and for volumes and prices in the medium- term outlook.
CONFIDENTIAL REPORT DO NOT CIRCULATE WITHOUT WRITTEN PERMISSION FROM GWR
24

G. Plantation Area Expansion The boom in timber plantations in the 1990s led some analysts to conclude that the entire global demand for wood could be met by only a small percentage of the world’s forest area. Rapid expansion of timber plantation areas has indeed occurred and estimates suggest that about 30% of current industrial roundwood needs are sourced from planted forests. According to the latest FAO data, the world’s forest area was 3.95 billion hectares, of which 150 million were plantations. Plantation areas are further divided into 110 million hectares of productive forests and 40 million hectares of protection forests. Softwood plantations represent the larger share of the productive lands.
Investment in timber plantations is continuing around the world, but the growth rate in plantation areas has been slowing. For softwoods, plantations areas increased at an average annual rate of 5.5% in 1991-2003, but the rate of increase has dropped to only 2.0% per year in 2003-2010 (and is expected to decline further in the subsequent decade). However, it is still the case that the increase in actual plantation areas has been climbing.
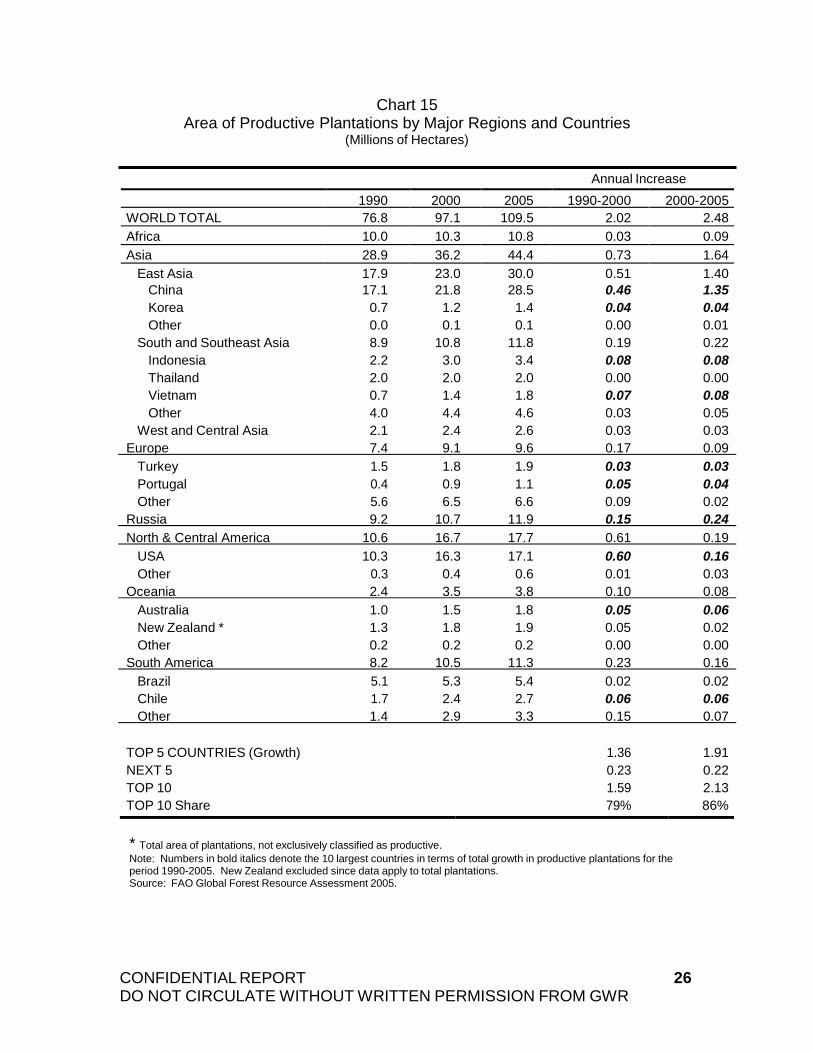
A more difficult, but critical component of this discussion is the quality and growth parameters of new plantations. For example, Chart 15 indicates that China had 28.5 million hectares of productive plantations in 2005 (26% of the world’s total). But most experts claim that China now has only 5-6 million hectares of high- yielding industrial plantations although this figure appears to be expanding rapidly as agriculture intensifies and moves off marginal hilly lands.
For our analysis, the key issue is whether high-yielding plantations will comprise a significant part of future supply and contribute enough volume to offset increases in demand?
Plantation wood already provides a large share of the world’s needs for industrial wood. Because of high growth rates on some plantations, large increases in these areas could yield substantial volumes of wood for harvest that could cause an important shift in global demand-supply balances.
CONFIDENTIAL REPORT DO NOT CIRCULATE WITHOUT WRITTEN PERMISSION FROM GWR
25
Turkey 1.5 1.8 1.9 0.03 0.03 Portugal 0.4 0.9 1.1 0.05 0.04 Other 5.6 6.5 6.6 0.09 0.02
USA 10.3 16.3 17.1 0.60 0.16 Other 0.3 0.4 0.6 0.01 0.03 Australia 1.0 1.5 1.8 0.05 0.06 New Zealand * 1.3 1.8 1.9 0.05 0.02 Other 0.2 0.2 0.2 0.00 0.00 Brazil 5.1 5.3 5.4 0.02 0.02 Chile 1.7 2.4 2.7 0.06 0.06
Chart 15 Area of Productive Plantations by Major Regions and Countries
(Millions of Hectares)
Annual Increase
1990 2000 2005 1990-2000 2000-2005 WORLD TOTAL 76.8 97.1 109.5 2.02 2.48 Africa 10.0 10.3 10.8 0.03 0.09 Asia 28.9 36.2 44.4 0.73 1.64
East Asia 17.9 23.0 30.0 0.51 1.40 China 17.1 21.8 28.5 0.46 1.35 Korea 0.7 1.2 1.4 0.04 0.04 Other 0.0 0.1 0.1 0.00 0.01
South and Southeast Asia 8.9 10.8 11.8 0.19 0.22 Indonesia 2.2 3.0 3.4 0.08 0.08 Thailand 2.0 2.0 2.0 0.00 0.00 Vietnam 0.7 1.4 1.8 0.07 0.08 Other 4.0 4.4 4.6 0.03 0.05
West and Central Asia 2.1 2.4 2.6 0.03 0.03 Europe 7.4 9.1 9.6 0.17 0.09
Russia 9.2 10.7 11.9 0.15 0.24 North & Central America 10.6 16.7 17.7 0.61 0.19
Oceania 2.4 3.5 3.8 0.10 0.08
South America 8.2 10.5 11.3 0.23 0.16
Other 1.4 2.9 3.3 0.15 0.07
TOP 5 COUNTRIES (Growth) 1.36 1.91 NEXT 5 0.23 0.22 TOP 10 1.59 2.13 TOP 10 Share 79% 86%
* Total area of plantations, not exclusively classified as productive. Note: Numbers in bold italics denote the 10 largest countries in terms of total growth in productive plantations for the period 1990-2005. New Zealand excluded since data apply to total plantations. Source: FAO Global Forest Resource Assessment 2005.
CONFIDENTIAL REPORT DO NOT CIRCULATE WITHOUT WRITTEN PERMISSION FROM GWR
26
Projections of timber yields from plantations differ widely. Some causes of the uncertainty are different estimates of plantation establishment, different estimates of yields, and different notions of end-use markets, particularly if plantations are located in areas of high fuelwood needs. A review of extant projections suggests that an increase in timber plantation supplies of about 300-400 mm m3/year over the next 20 years would be reasonable.
This growth roughly corresponds to the growth in world timber demand; thus, our view is that increases in plantation wood will be at about the level that will be adequate to offset the growth in timber demand. Plantations will help alleviate potential wood shortages in the future by reducing some of the pressure on dwindling natural forests. Natural forest areas have declined significantly over the past several decades due to deforestation, conversion of land to agricultural land, conversion of land for development, and protection of lands for their public or environmental values.
As a result, the increasing contribution of plantation forests is not likely to depress timber prices in the near- or medium term. However, it is likely that their rapid expansion will keep a lid on the real price appreciation of timber resources.
One major uncertainty in this equation is the growth in world timber demand due to the rising importance of biofuels. We address the use of wood as a future source of energy in the following section.
IV. EMERGING ISSUES FOR GLOBAL TIMBER SUPPLY AND DEMAND
A. Emergence and Growth of Bioenergy Demand
Rising energy prices, increasing attention to national security issues (and hence the reduction of dependence on imported petroleum), increasing focus on renewable resources and environmental stewardship, and concerns about climate change have generated tremendous interest in producing energy from renewable organic materials (wood and agricultural products).
This interest has genuinely arisen from the private sector, but has been thrust forward by government policies which have established renewable energy targets and offered substantial subsidies to encourage investment in these areas.
The key issue is whether there is enough wood and land to support these initiatives without disrupting markets for wood and timber. Are the subsidies well- placed, or will this effort be similar to the corn-based ethanol debacle? Will a significant increase in the use of wood as a source of energy have a substantial impact on the overall demand for timber resources and is it important in understanding future wood prices?
CONFIDENTIAL REPORT DO NOT CIRCULATE WITHOUT WRITTEN PERMISSION FROM GWR
27

Wood plays only a minor role in the overall energy balance in most developed economies. According to the U.S. Energy Information Administration, renewable energy accounted for only 6% of U.S. energy consumption in 2003, and only about half of this amount was from biomass sources. (Hydroelectric sources accounted for 45%, while geothermal, wind, and solar accounted for less than 10%). The 3% of U.S. energy that is derived from biomass includes not only wood residues and fuelwood harvests, but also pulping liquors, urban wastewood, and agricultural residues.
However, when one looks at wood consumption, fuel is an important end use market; furthermore, the amount of wood that is actually consumed is often understated. For example, recent survey work for 12 countries in Europe revealed that 185 mm m3 of wood were used for energy generation, of which 83 mm m3 were taken directly from the forest (45%) while 90 mm m3 were residues from wood manufacturing operations. Contrast this with FAO data for 2005 which indicates that total wood removals in these same countries were 307 mm m3, of which only 30 million were for fuelwood. There is ample anecdotal evidence in Europe that the demand for wood as fuel has created substantial competition with forest products producers, with complaints first voiced by particleboard and MDF producers and later by pulp producers. In some areas, wood shortages have developed, resulting in rising prices.
Similar pressures have not yet reached the U.S. FAO data (2005) for North America show total roundwood removals of 670 mm m3 and only 47 million of fuelwood removals. (Detailed survey data—similar to that collected for the European study—show that wood used for energy generation was 260 mm m3, but only 49 million were from direct forest harvesting while 208 million were from residues.) However, given recent political and economic incentives, it may not take long for the U.S. situation to more closely resemble that in Europe.
As of March 2008, there were about 40 wood pellet plants operating in the U.S., with total wood consumption of 1.5-to-2.0 million green tons of wood. But recent developments have been dramatic: bioenergy projects that would consume nearly 20 million green tons of wood have been announced in the U.S., with wood pellet plants accounting for more than 7 million tons and cogeneration/biomass projects accounting for more than 10 million (there are also several cellulosic ethanol plants). However, 20 million green tons (or about 20 mm m3) is not that much wood relative to overall U.S. consumption.
But with the policy initiatives now in place and oil prices well over $100 per barrel, the number of potential projects is likely to skyrocket. Based on the European experience, it is easy to imagine the number of scheduled wood bioenergy projects doubling in the next 3-to-5 years. This suggests that wood consumption for bioenergy projects could rise by as much as 40 mm m3 over the next five years.
CONFIDENTIAL REPORT DO NOT CIRCULATE WITHOUT WRITTEN PERMISSION FROM GWR
28

To add some perspective to this figure, total industrial roundwood harvest in the U.S. was 428 mm m3 in 2005, while the roundwood harvest for fuelwood was 45 mm m3. Total wood pulp production was about 60 million tons, using 170 mm m3
of wood. Total OSB production was 15 billion square feet (3/8” basis), using 27 mm m3 of wood.
So is 40 mm m3 of wood a lot or a little? At the margin, we believe it is a lot of wood. In a study by the U.S. Forest Service to identify potential sources of new biomass, the greatest promise is considered to come from “fuel treatments” (thinnings to reduce fire hazards). Many OSB mills prefer roundwood because of their demanding fiber requirements and this has created difficult competition for pulp mills in numerous cases. Many OSB mills that will be built in the future will also look for roundwood and thinnings as a fiber source.
Chart 16 Wood Consumption in Wood Pulp, OSB, and Fuel in the U.S.
(Millions of Cubic Meters)
Sources: 1) U.S. Timber Production, Trade, Consumption, and Price Statistics, 1965 to 2005; USFS, FPL-RB-637 2) Production, Prices, Employment and Trade in Northwest Forest Industries, All Quarters 2006; USFS, PNW-RB-
255 3) Forest Products Statistics, 2002-2006; UNECE, Timber Bulletin, 2007
While wood biomass projects are often touted due to their ability to consume wastewood, they generally consume mill residues when possible due to better
CONFIDENTIAL REPORT DO NOT CIRCULATE WITHOUT WRITTEN PERMISSION FROM GWR
29

economics. Furthermore, wood pellet mills that produce for household use need to be concerned with quality and thus avoid bark to keep ash content low. In some areas, where pulp mills are no longer competitive and are closing, it can be a win-win situation when a wood bioenergy mill is established to utilize the same resource base.
One key area of concern is the size and scale of the new generation of wood bioenergy plants. At least four new wood pellet projects that have been announced have wood requirements of at least one million green tons of wood per year, and the same is true for at least four new cogeneration/biomass plants. These mills will need to draw wood from a relatively small woodbasket to keep haul distances economical. As a result, in their sphere of operation they are likely to compete for residues with existing pulp and panel mills, and are also likely to compete for small-diameter roundwood and thinnings.
Thus, our view is that the expansion of the wood bioenergy in the U.S. and Europe will have a significant influence on the price of pulpwood, helping to drive prices higher and lifting the price floor for small-diameter wood and residues. The increase in bio-fuels demand will help offset the reduction in demand for wood pulp.
Finally, developments in wood bioenergy use in Asia, particularly in China and India will become increasingly important. This will certainly affect the demand for wood and the price of wood in these regions and it is safe to say that they will eventually be an important consumer of wood from new plantations.
B. Climate Change and Related Policies
Anthropogenic sources of carbon dioxide and other so-called greenhouse gases likely are altering the Earth’s climate. The relationship between climate change and forests is complex, with forests simultaneously being a source of carbon dioxide via deforestation, a sink via afforestation and enhanced forest growth, an affected party though changes in precipitation, temperature and weather patterns, and a recipient of a great deal of attention by climate-change policy makers.
Climatic change will have ambiguous impacts on forests: warmer temperatures, greater rainfall and higher atmospheric levels of CO2 tend to increase forest growth. Drier conditions tend to retard growth and increase the risks from fire, insects and diseases. Unfortunately, predictions on a scale useful for forest management or investment decisions currently are unreliable, even in comparison with the notoriously controversial global climate models.
Climate-change policy is likely to affect the forest sector. The single most important policy relates to carbon pricing. This has already been initiated in
CONFIDENTIAL REPORT DO NOT CIRCULATE WITHOUT WRITTEN PERMISSION FROM GWR
30

Europe and the process is underway to enact similar market mechanisms in North America. Simply put, the generator of carbon is required to pay a price for that output, and the reducer of carbon (the owner or planter of new trees, for example) gets paid for that service.
The impact of such a policy heavily depends on the rules that are created to implement it. For example, if credits are permitted for afforestation projects, planting rates will increase, timber supply will increase in the mid term (10-20 years) and timber prices will suffer. In contrast, credits for “avoided deforestation” or longer rotations will decrease timber supply. Recognition of the carbon embodied in products will favor wood in most construction and in many industrial uses. As we mentioned above, subsidies for bio-fuels are likely to increase the value of timber.
At the moment, forest-related policies are too uncertain make reliable predictions possible. For example, afforestation is not recognized in the European trading system; only one or two forestry projects have been approved by the UN’s Clean Development Mechanism secretariat; wood from forest thinnings was explicitly omitted from the recent US cellulosic bio-fuels subsidies. Despite all of this uncertainty, we suspect the net effect will be positive to investment returns or at worst neutral.
C. Shipping Costs: Will Ocean Freight Rates Continue to Rise?
While all transportation costs have increased significantly over the last two years, increases in the cost of ocean freight have been particularly large. For example, the cost of shipping softwood logs from the U.S. West Coast to Japan jumped from about US$50/m3 in the first quarter of 2006 to about US$90/m3 in the first quarter of 2008 (Chart 17). (These data are estimated from Customs data on U.S. unit export values and Japanese unit import values.) It has also been reported that the cost of shipping eucalyptus pulp logs from Uruguay to Europe increased from US$40-45/m3 in mid-2006 to US$90-100/m3 in late 2007.
One key reason for these sharp increases has been the rising cost of crude oil over this time period, which has affected all modes of transportation. A second key reason has been a shortage of dry bulk carriers to move logs which has caused a scarcity premium for ocean freighters. Large increases in shipments of dry bulk goods around the globe have caused many carriers to be diverted to carrying grain and other goods. The severity of the situation has led to the shipment of logs in containers in many cases. Even in the case of container shipments, severe equipment shortages are now being reported at some ports on the West Coast and containers are on allocation. Shippers can charge scarcity rents for capacity to transport logs.
This issue is of great importance to timber prices because international trade in timber and timber products is critical in determining price levels, and because
CONFIDENTIAL REPORT DO NOT CIRCULATE WITHOUT WRITTEN PERMISSION FROM GWR
31

ocean freight is a high percentage of the delivered cost of wood. Using the data cited above, ocean freight jumped from 25% of the cost of logs delivered to Japan from the U.S. in Q1:2006 to 36% of the cost in Q1:2008. Of course, the changes are even greater when viewed from the source side with ocean freight adding 34% to the originating price at the U.S. West Coast in Q1:2006 and 54% to the price in Q1:2008.
The impact of higher freight rates is complex. As a first approximation, because Pacific Rim customers have multiple sources of supply, the first effect of higher freight costs is to reduce realizations to timberland owners in supplying regions. Since the demand for timber and timber products is not perfectly inelastic, higher ocean freight costs will reduce the volume of wood demanded along with its price, net of freight charges. Changes in relative ocean freight rates are also important in that they can change the supply-demand balance in a way that may favor or penalize a region. Finally, if a region has an alternative mode of delivery (such as log shipments by rail from Russia), then increases in ocean freight rates can be damaging to the region dependent on ocean transport (and beneficial to those who can rely on land transport).
Chart 17 Ocean Freight Costs for Sawlogs
U.S. West Coast to Japan (US$/Cubic Meter, Monthly Basis)
Source: IFIA calculations based on U.S. and Japanese Customs statistics.
CONFIDENTIAL REPORT DO NOT CIRCULATE WITHOUT WRITTEN PERMISSION FROM GWR
32

We anticipate that real ocean freight rates will decline over the next 10-15 years, with the greater proportion of decreases occurring during the next five years. The main reason for the reduction in rates is that the shortage of ships to move bulk freight will be alleviated by the increasing production of these ships. The balance in the supply-demand of ships is a cyclical phenomenon, and the current shortage and high prices are likely to lead to an overbuilding of capacity.
How important is the price of oil? In order to address the relative importance of equipment shortages and fuel costs, we conducted the following exercise. First we obtained the rates for shipping lumber from the U.S. West Coast to Asia in Q2:2008 (as quoted by Maersk Line). Rates depend heavily on the positioning of containers so key determinants are the volume of traffic on a particular route along with the balance between headhauls and backhauls. Thus, in the U.S. West Coast lumber trade, base rates can vary from as much as US$1250 per 40’ container to Tokyo to only US$850 per 40’ container nearby in Yokohama. Base rates are in the US$800-900 range to Chinese ports and are around US$1000 to Southeast Asia. For this example, we use US$1000 as the base rate. In the Q2:2008, the bunker fuel surcharge is US$110 for 40’ container shipments from the U.S. West Coast to Asia. Adding these fees together, we establish a base rate of US$1110 per 40’ container.
The next step is to determine the cost on a per cubic meter of lumber basis. For the purposes of this example, we assume that 24 metric tons of lumber are shipped in a container, which is equivalent to about 42-46 m3 (kiln-dried full dimension Douglas-Fir would be 42 m3, while Western Hemlock would be 46 m3). Using 44 m3 as an average, the cost to ship lumber from the U.S. West Coast to Asia by container in Q2:2008 is about US$25/m3.
We then use the Maersk Bunker Fuel Simulator to analyze the impact of a fuel price increase. From Q1:2007 to Q1:2008, bunker C prices have risen about US$190 per metric ton (reported by Neptune Orient Lines). Using the Maersk Simulator, this would translate to an increase of US$135 per 40’ container on the U.S. West Coast to Asia route. Using the conversion of 44 m3 per container, this is equivalent to an increase of US$3.1/m3. To put this in perspective, we called a rate desk and found that the ocean shipping rate for lumber about doubled over this time period. Thus, dividing $3.1 by $12.50 suggests that fuel increases would have accounted for about 25% of the total rate hike over the past year.
Returning to our sawlog example (Chart 17), shipping costs from the U.S. West Coast to Japan rose from about US$50/m3 in Q1:2006 to about US$90/m3 in Q1:2008. Over this same time period, bunker C costs rose about US$160 per metric ton, which implies a fuel-related increase of about US$110 per 40’ container. The volume of logs that will fit into a container is only about half that of lumber because they are round and they are much heavier due to moisture content. Assuming 22 m3 are shipped in a 40’ container, the increased cost due
CONFIDENTIAL REPORT DO NOT CIRCULATE WITHOUT WRITTEN PERMISSION FROM GWR
33

to higher fuel prices would have been US$5/m3, or about 15% of the total rate increase from Q1:2006 to Q1:2008.
Finally, we consider the future of oil prices. Three factors have driven crude oil prices over US$120/barrel: the supply-demand balance for oil; the weak U.S. dollar; and oil speculation and the hedge against inflation. What would happen to ocean freight rates if crude oil prices were to climb to US$200/barrel? Based on Chart 18, we see that crude oil prices and bunker C fuel prices track very closely, with bunker C costing about 70% of the price of crude oil on a comparable volume basis. Thus, if we use US$120/barrel crude oil as a starting point, a US$80/barrel increase would translate to a US$56/barrel increase in bunker C fuel. This increase would, in turn, lead to a bunker fuel rate adjustment of US$280 per 40’ container (for lumber shipments from the U.S. West Coast to Asia), or an increase of about US$6-7/m3 for lumber and about US$13/m3 for logs.
We conclude that skyrocketing oil costs have been important in driving ocean freight costs higher over the past two years, but they have not been the primary reason for the large increases. Our analysis suggests that only about 15-25% of the increases in ocean freight rates are due to higher fuel charges. As we indicated at the outset, capacity shortages have been a much more important factor in driving rates higher. Thus, we expect the future cost of shipping will be mainly determined by the supply-demand balance of ships and containers. Conditions in the worldwide oil market suggest to us that oil prices will fall from their current levels over the next few years. However, even if they continue to rise, the gradual erosion of the large scarcity premium for equipment can bring ocean freight rates well below where they are today.
CONFIDENTIAL REPORT DO NOT CIRCULATE WITHOUT WRITTEN PERMISSION FROM GWR
34

Chart 18 Crude Oil and Bunker C Fuel Costs
(Quarterly, US$/barrel)
Sources: 1) Crude oil prices are from Statistics Norway. 2) Bunker C prices are from Platts, and are reported by Neptune Orient Lines.
CONFIDENTIAL REPORT DO NOT CIRCULATE WITHOUT WRITTEN PERMISSION FROM GWR
35

V. CONCLUSIONS: OUTLOOK FOR TIMBER PRICES AND RISKS TO THE FORECAST
From time to time in the past, various organizations have conducted detailed, quantitative analysis of global forest products supply, demand and prices. Past efforts include those of
• the UN’s Food and Agriculture Organization (FAO) • the International Institute for Applied Systems Analysis (IIASA) in
Vienna • universities (e.g. the Center for International Trade in Forest Products
at the University of Washington), • research institutions (e.g. Resources for the Future) and • private research organizations (e.g. Resource Information Systems,
Inc) In conducting this analysis, we reviewed the literature and found that no such quantitative study had been recently prepared. As a result, our outlook for prices is more judgmental, based on our own heuristic balancing of the supply and demand factors discussed above.
A. Outlook for Timber Prices
We start from the premise that world consumption of wood is currently about 1.7 billion m3/yr. Past studies have found that demand is increasing at 2-3%/year due to a combination of population growth, increases in income and changes in the technical efficiency of wood use. The high end of this range suggests that incremental demand will be about 50 mm m3/yr. We believe that this incremental demand can be readily met from the world’s forests. The area of plantations is currently expanding at about 2.5 mm ha/year, and if these plantations achieve growth rates of 20 m3/ha/yr (a modest objective for a modern forest plantation) then there will be ample supply from that source alone. As we have discussed, there will be a pulse of increased supply from Western Canada for the next decade or so, and the US forest inventory is rising and will be able to sustain higher harvest levels in the future. Plantations already in the ground in New Zealand likely could accommodate an additional 10-20 mm m3/yr of harvest. Large areas of natural forest in such places as Papua New Guinea and central Africa remain, and, perhaps regrettably, are likely to be exploited. In short, at least for the next 10-20 years, we believe that there are sufficient supplies of timber to meet the traditional demands for wood products.
As a result, we think that prices will recover substantially from the sharp drop that is currently underway. While prices will continue to be volatile in response to the
CONFIDENTIAL REPORT DO NOT CIRCULATE WITHOUT WRITTEN PERMISSION FROM GWR
36

cyclicality of wood and paper demand, we anticipate they will fluctuate around a level that is close to the average of the first half of this decade.
Chart 19 US, PNW Domestic Sawlog and Stumpage Prices
(2007US$ per MBF, Scribner)
Notes: Historical USFS data are for stumpage prices. Forecasts are for Douglas-Fir sawlogs. For the forecast data series, historical prices are from Log Lines. For the dotted forecast line, prices for 2008-2010 are from a private industry source, and prices for 2011-2022 are IFIA projections.
CONFIDENTIAL REPORT DO NOT CIRCULATE WITHOUT WRITTEN PERMISSION FROM GWR
37
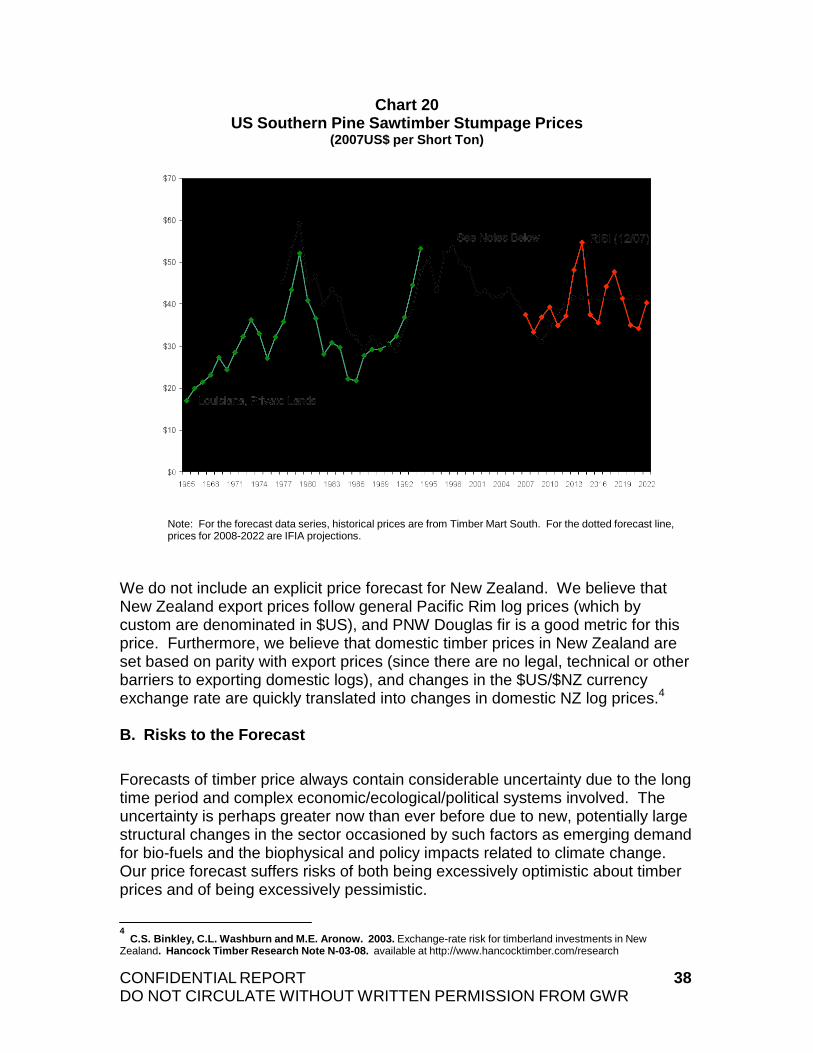
Chart 20 US Southern Pine Sawtimber Stumpage Prices
(2007US$ per Short Ton)
Note: For the forecast data series, historical prices are from Timber Mart South. For the dotted forecast line, prices for 2008-2022 are IFIA projections.
We do not include an explicit price forecast for New Zealand. We believe that New Zealand export prices follow general Pacific Rim log prices (which by custom are denominated in $US), and PNW Douglas fir is a good metric for this price. Furthermore, we believe that domestic timber prices in New Zealand are set based on parity with export prices (since there are no legal, technical or other barriers to exporting domestic logs), and changes in the $US/$NZ currency exchange rate are quickly translated into changes in domestic NZ log prices.4
B. Risks to the Forecast
Forecasts of timber price always contain considerable uncertainty due to the long time period and complex economic/ecological/political systems involved. The uncertainty is perhaps greater now than ever before due to new, potentially large structural changes in the sector occasioned by such factors as emerging demand for bio-fuels and the biophysical and policy impacts related to climate change. Our price forecast suffers risks of both being excessively optimistic about timber prices and of being excessively pessimistic.
4 C.S. Binkley, C.L. Washburn and M.E. Aronow. 2003. Exchange-rate risk for timberland investments in New
Zealand. Hancock Timber Research Note N-03-08. available at http://www.hancocktimber.com/research
CONFIDENTIAL REPORT DO NOT CIRCULATE WITHOUT WRITTEN PERMISSION FROM GWR
38
Several factors could drive prices higher than what we have imagined. For example,
• A strong increase in biofuels demand would put pressure on the lowest quality timber, but that pressure would be felt, with dissipating effect, up the value spectrum.
• While most global models of climatic change suggest that forests in some areas of the world will benefit and others will be damaged (interesting, with a net positive impact on forest growth), this outlook could be too optimistic and we could see a widespread collapse of forests due to climatic change. In the short run some of the dead trees would likely be salvaged, but in the longer run timber supply might be reduced.
• Much of our optimism about future timber supply relates the expansion of forest plantations. While there are large areas of marginal agricultural land suitable for very productive tree plantations, some of this land might be converted to agriculture. Indeed, it is widely believed that, in the US, much of the land planted in southern pines by farmers under the US government’s Conservation Reserve Program as a means to take agricultural land out of production will be converted back to agricultural as the program constraints terminate.
There are countervailing factors as well that could result in lower timber prices:
• A prolonged economic weakness in the US or globally, would reduce demand. Growth in post-Olympic China may weaken. The impact on timber prices is exacerbated to the extent that forest owners refrain from harvesting in times of price weakness (as they should) because there is a build-up of merchantable inventory ready to come onto the market as demand strengthens. This tends to dampen price recovery.
• The utilization of MPB killed timber in Western Canada may be more prolonged than anticipated. There is an enormous physical inventory of standing dead trees, and the main questions relate to the economics and technology of using that wood as it physically deteriorates. Companies are investing in new manufacturing technologies to better utilize this wood (e.g. video imaging of log ends to orient the splits in the logs in such a way as to maximize lumber recovery). Even as this wood deteriorates, it will remain suitable for bio-fuels; indeed, as it dries out ii will make a preferred input for wood pellet plants.
• Oil prices could collapse, rendering bio-fuels uneconomic and lowering shipping costs. Shipping costs may also fall due to capacity expansion. In the short run, lower shipping costs are likely to increase timber and timberland values. In the longer run, the impact is more ambiguous, because lower shipping costs mean that wood can be transported longer distances which helps relieve timber scarcity and high timber prices.
CONFIDENTIAL REPORT DO NOT CIRCULATE WITHOUT WRITTEN PERMISSION FROM GWR
39

• Climate-change policies could induce substantial new plantings. Carbon prices in the range of $US 20-50/ tonne of CO2-e have an enormous, positive impact on the returns for afforestation projects. As a rough measure, one m3 of green wood is about equal to one tonne of CO2-e. Reasonable industrial tree plantations grow at least 20 m3/ha/year. In a fully developed sustained-yield plantation, carbon credits could therefore provide an additional income stream of $400-$1,000/ha/year. Those investors who have access to this income stream will be non-negatively affected by the new afforestation projects. However, if the “rules” for carbon credits exclude existing forests (as they currently do), the owners of existing forests would be adversely impacted by the new supply and the lower prices.
Regardless of the trends in timber prices, we believe that the historic volatility in timber prices is likely to continue. Short-term supply and demand shocks will move prices from whatever equilibrium level they might have achieved.
CONFIDENTIAL REPORT DO NOT CIRCULATE WITHOUT WRITTEN PERMISSION FROM GWR
40


