52
Long Run Puzzles in Head Start Research Doug Miller War on Poverty conference Center for Poverty Research UC Davis, January 10, 2014
| Date post: | 18-Dec-2015 |
| Category: |
Documents |
| Upload: | griselda-gregory |
| View: | 215 times |
| Download: | 0 times |

Long Run Puzzlesin Head Start Research
Doug MillerWar on Poverty conferenceCenter for Poverty ResearchUC Davis, January 10, 2014

Long run Head Start Puzzles:This talk
• Brief history of Head Start, and history of related research debates
• What we know, and why we know so little, about long run impacts
• Advertisement / preview of ongoing work here at UC Davis

Long run Head Start Puzzles:History
• We all know and love Head Start• Not part of LBJ’s war on poverty speech!• Housed in Office of Economic Opportunity • Serendipitous alignment of:• Excess CAP funds in first year – bad local politics – led to
targeting children• Personal history (Eunice Kennedy Shriver, Rosemary
Kennedy, president’s panel on mental retardation)• Legislative (Republican) & Administrative (HEW, Office of
Ed) competition
• “Project Rush-Rush” (eg, $180/kid)• Local (not state!) agencies applied directly to OEO

Long run Head Start Puzzles:History
• 1965-1972: wild West (wild South?)• 1973-1988:
relative stability• 1989-2001:
massive expansion• 2002-2010:
relative stability
• 1965-today• Perceived success!

Head Start’s attraction: Fairness and Efficiency
• Fairness: What a great target demographic!

Head Start’s attraction: Fairness and Efficiency
• Fairness: What a great target demographic!
Head Start’s attraction: Fairness and Efficiency
• Efficiency: long-run impacts from investment in early childhood.• “Neuroplasticity”; “Dynamic complementarities in
learning”• Ludwig & Phillips 2008: “The best available
evidence suggests that Head Start probably passes a benefit–cost test.”
Long run Head Start Puzzles, part 1: Recurring debates 1965-2014
1. Does it work? And the question of “fade out” …2. More vs. Less3. And if more, “quantity” vs. “quality”4. Academic vs “Whole Child”
Long run Head Start Puzzles, part 2: What is the long-run impact?
• This is the key question. But it’s hard!• Short-run impact is hard to measure• Perennial challenge of identifying causal effects from
nonexperimental settings:• Those who don’t sign up for HS are bad comparisons to those
who do

Long run Head Start Puzzles, part 2: What is the long-run impact?
• Short-run impact is hard to measure• Economists’ approach: quasi-experiments• Many of the confounding variables are correlated
with “demand for Head Start,” so …• Identify a “supply shock”• Ideally one that’s not correlated with other
determinants of long-run outcomes

Long run Head Start Puzzles, part 2: What is the long-run impact?
• Short-run impact is hard to measure• Long-run impact is even harder!
• Same problems as SR. AND …• Difficult to find data that links “LR outcomes” to “Head Start
Exposure”• … and also enables quasi-experimental variation!
• Also, “external validity” issues• Any valid estimate speaks only to
• The (population / program / alternatives) of the time

Long run Head Start Puzzles, part 2: What is the long-run impact?
• Ideal situation• Identify LR impact from earlier cohorts
• AND impacts on SR outcomes for those cohorts• Like “Intermediate Clinical Endpoints” and “Ultimate Clinical
Endpoints” in medicine• Find stable relationship between SR and LR outcomes• Examine SR outcomes in today’s cohorts

Long run Head Start Puzzles, part 2: What is the long-run impact?
• Two types of “best available” direct measures of LR impacts:
• Within-family sibling comparisons• Currie & Thomas (1995, NLSY)
• Deming (2009)• Garces, Thomas, & Currie (2002, PSID)
• Early implementation grant-writing assistance• Ludwig & Miller (2007)

Long run Head Start Puzzles, part 2: What is the long-run impact?
• Garces, Thomas, & Currie (2002)
ALL AFRICAN-AMERICAN
WHITE
High School Grad 0.037 -0.025 0.203**(0.053) (0.065) (0.098)
Some college 0.092 0.023 0.281**(0.056) (0.066) (0.108)
Booked/Charged w/ Crime -0.053 -0.116** 0.122(0.039) (0.045) (0.077)
N 1,742 706 1,036
Long run Head Start Puzzles, part 2: What is the long-run impact?
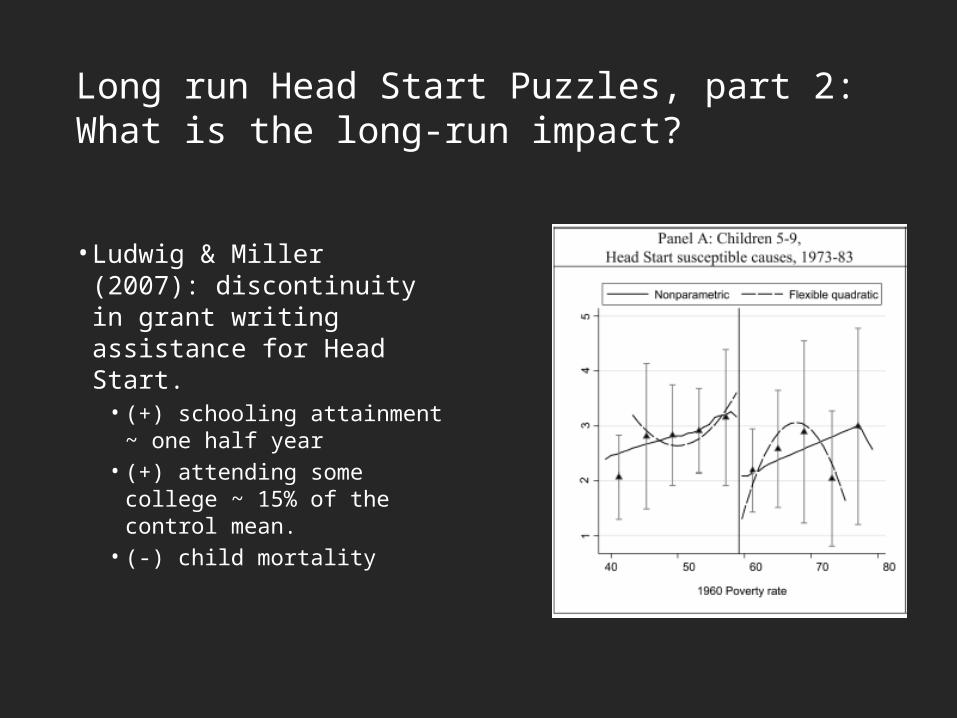
• Ludwig & Miller (2007): discontinuity in grant writing assistance for Head Start.• (+) schooling attainment
~ one half year • (+) attending some
college ~ 15% of the control mean.
• (-) child mortality

Long run Head Start Puzzles, part 2: What is the long-run impact?
• Promising, in-progress: Johnson (2013)• PSID geo-coded to county-year funding data• Panel FE design• Beneficial impacts on Schooling, Wages, Incarceration, Health
• The Optimistic take on LR impacts• Johnson (2013): “Estimated long-term benefits for previous
cohorts … From 3 separate research designs, three independent datasets (sibling difference, regression discontinuity, diff-in-diff)”
Long run Head Start Puzzles, part 2: What is the long-run impact?
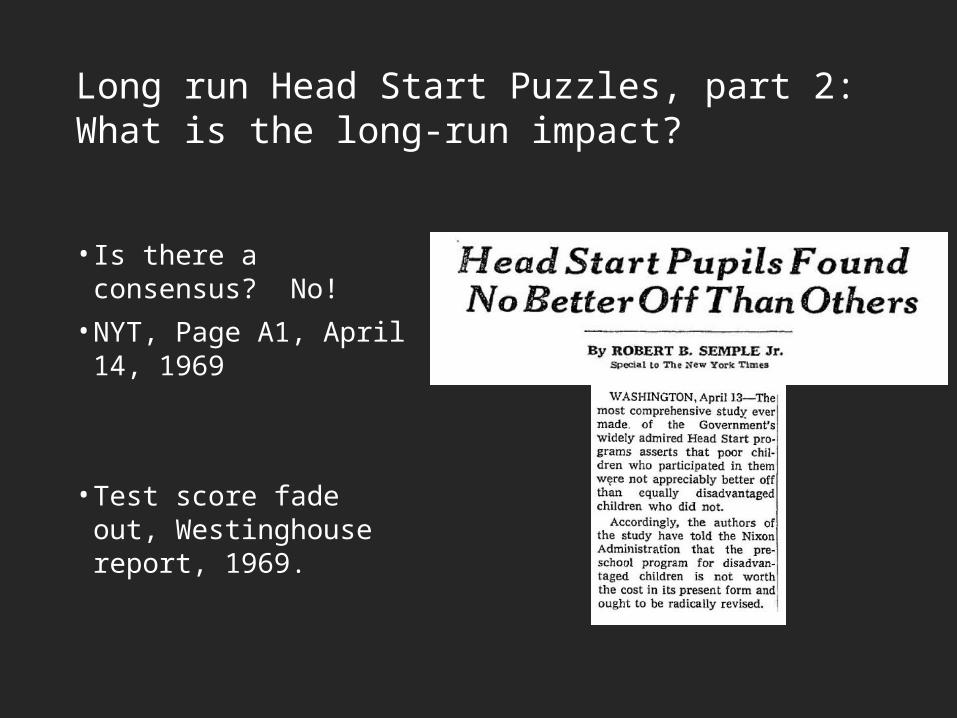
• Is there a consensus? No!• NYT, Page A1, April 14,
1969
• Test score fade out, Westinghouse report, 1969.

Long run Head Start Puzzles, part 2: What is the long-run impact?
• Is there a consensus? No!• Joe Klein, Time
Magazine, July 2011
• Test score fade out, NHSIS, 2010.• Randomized intervention
= “gold standard”
TIME TO AX PUBLIC PROGRAMS THAT DON’T YIELD RESULTS
“…finally there is indisputable evidence about the program’s effectiveness, provided by the Department of Health and Human Services: Head Start simply does not work.”
“[Continued funding is ] criminal, every bit as outrageous as tax breaks for oil companies.”

Long run Head Start Puzzles, part 2: What is the long-run impact?
• Optimism: LR impacts• Pessimism: test score fade out• Optimism rejoinder 1: There was “fade out” for cohorts
w/ LR impacts!• Deming (2009)• Ludwig & Miller, Garces Thomas & Currie, Westinghouse• Also, Perry Preschool• Also, Tennessee STAR
• Optimism rejoinder 2: cognitive scores (1-2 years out) wrong “intermediate clinical endpoint”• Some positive impacts w/in NHSIS
• Parent involvement (Gelber & Isen 2013)• Subgroup (lower tail) impacts, non-cognitive skills (Bitler et al 2013)

Long run Head Start Puzzles, part 2: What is the long-run impact?
• (1) Optimism; (2) Pessimism; (3) Optimism rejoinders• (4) Pessimism rejoinder 1: • NHSIS measured non-cognitive scores
(zero effects)• Is this a fishing expedition? We know
what we want to find!
• Pessimism rejoinder 2: the LR evidence is not bullet proof

Long run Head Start Puzzles, part 2: What is the long-run impact?
• Re-assessing the LR evidence: Ludwig-Miller (2007)• Educational gains?• Marginal statistical significance. • E.g. NELS, Yrs Schooling, +0.58, (T* = 1.55)• E.g. Census, HS Grad, +0.03, (p value = 0.032)• Concerns about migration
• Health gains?• “HS susceptible causes” = Anemias, Meningitis, Respiratory• Small fraction of mortality then; much smaller now.

Long run Head Start Puzzles, part 2: What is the long-run impact?
• Re-assessing the LR evidence: Garces Thomas Currie (2002)• Well-known concerns about “sibling comparison”
strategies• Why did one child get exposure, the other did not?• Back to problems w/ non-experimental research designs
• Our replication & extension of G-T-C indicates:• Sibling comparison estimates in PSID only suggestive,
not definitive.

PSID sibling comparison analysis
• Following G-T-C (2002), we re-construct PSID sample• Looks good for Means and (full sample) sample
size, and “observational” regression.• Then we re-estimate “sibling comparison”
regression …

PSID sibling comparison analysisSibling comparison sample, mother FE estimates
GTC (2002) UC Davis Econ (2014)
ALL AFRICAN-AMERICAN
WHITE ALL AFRICAN-AMERICAN
WHITE
High School Grad 0.037 -0.025 0.203** 0.050 -0.025 0.140
(0.053) (0.065) (0.098) (0.054) (0.057) (0.088)
Some college 0.092 0.023 0.281** 0.097 -0.008 0.230**
(0.056) (0.066) (0.108) (0.059) (0.054) (0.098)
Booked/Charged w/ Crime -0.053 -0.116** 0.122 0.052 -0.050 0.230*
(0.039) (0.045) (0.077) (0.036) (0.042) (0.13)
N 1,742 706 1,036 1,554 627 924

PSID sibling comparison analysisSibling comparison sample, mother FE estimates
• Investigating the discrepancies, we learned: • Smaller “N” than you might think!
• Eg., African-American sibling sample, N = 627• 94% of which are in families with no Head Start switching• About 50 children in “Head Start switching” families ..• … of whom, about 13 kids booked/charged with a crime.

PSID sibling comparison analysisSibling comparison sample, mother FE estimates
•Next, we expand the sample• Later cohorts• Older siblings•More than 3x sample size
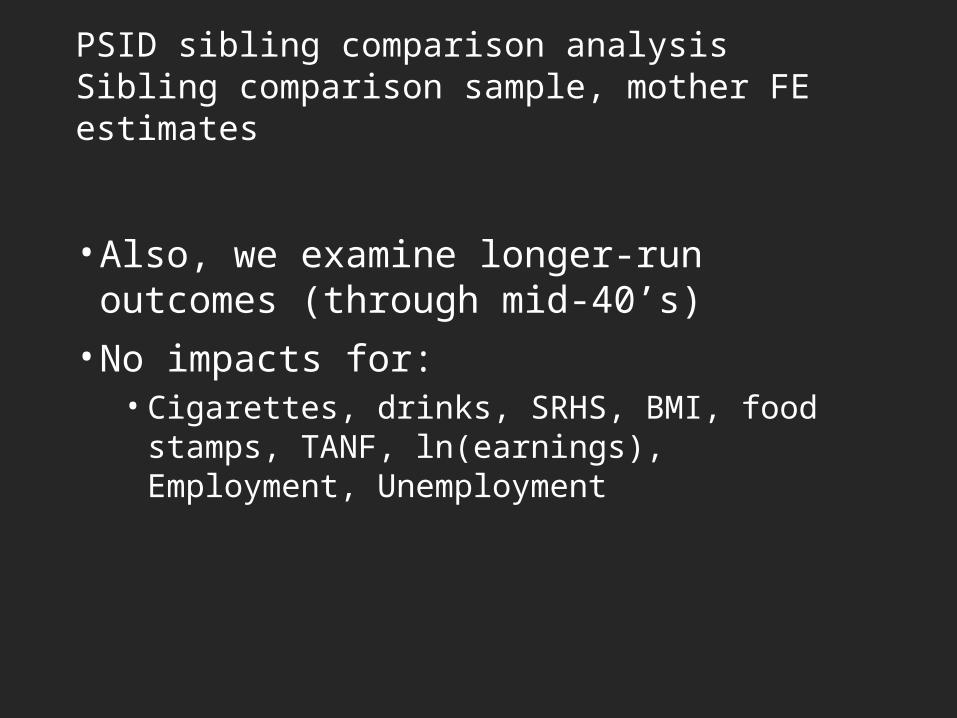
•Also, we examine longer-run outcomes (through mid-40’s)

PSID sibling comparison analysisSibling comparison sample, mother FE estimates
UCD Original Sample
UCD Expanded
Sample
ALL AFRICAN-AMERICAN
WHITE ALL AFRICAN-AMERICAN
WHITE
High School Grad 0.050 -0.025 0.140 0.011 -0.016 0.034
(0.054) (0.057) (0.088) (0.025) (0.028) (0.043)
Some college 0.097 -0.008 0.230** 0.065** -0.025 0.161***
(0.059) (0.054) (0.098) (0.032) (0.031) (0.057)
Booked/Charged w/ Crime 0.052 -0.050 0.230* 0.010 -0.038 0.068
(0.036) (0.042) (0.13) (0.029) (0.024) (0.055)
N 1,554 627 924 5,341 2,347 2,988
PSID sibling comparison analysisSibling comparison sample, mother FE estimates
• Also, we examine longer-run outcomes (through mid-40’s)• No impacts for:• Cigarettes, drinks, SRHS, BMI, food stamps, TANF,
ln(earnings), Employment, Unemployment
Long run Head Start Puzzles, part 2: What is the long-run impact?
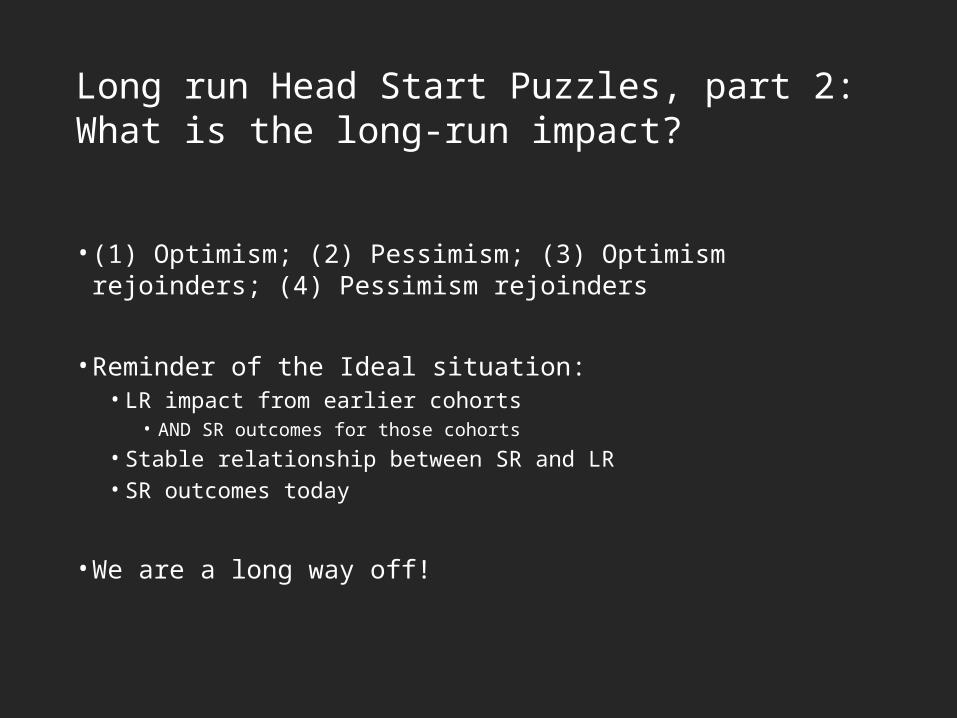
• (1) Optimism; (2) Pessimism; (3) Optimism rejoinders; (4) Pessimism rejoinders
• Reminder of the Ideal situation:• LR impact from earlier cohorts
• AND SR outcomes for those cohorts• Stable relationship between SR and LR• SR outcomes today
• We are a long way off!
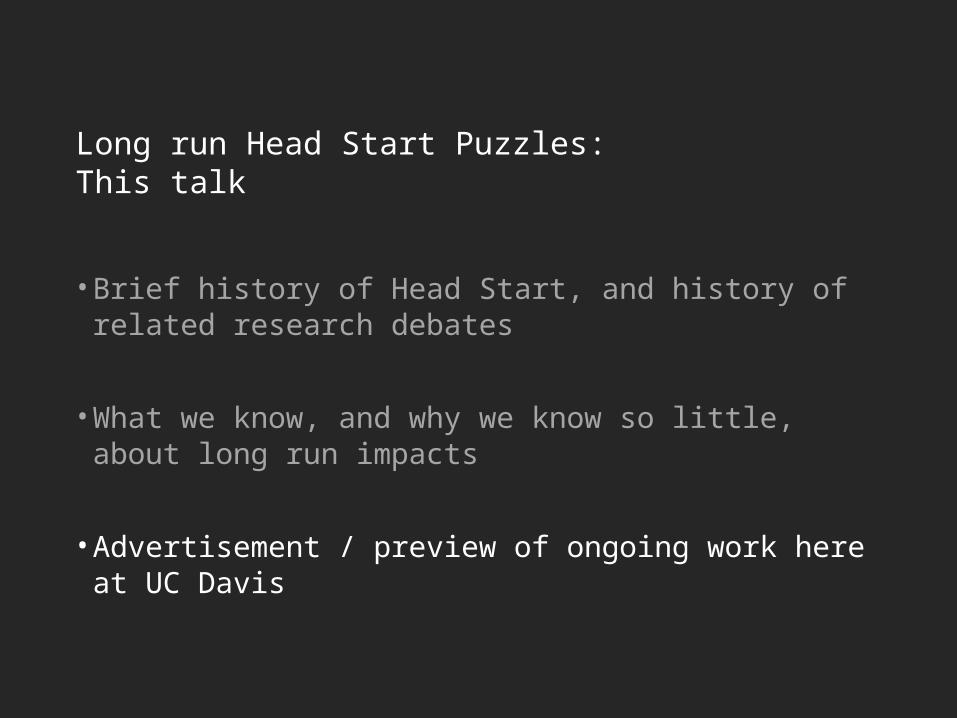
Long run Head Start Puzzles:This talk
• Brief history of Head Start, and history of related research debates
• What we know, and why we know so little, about long run impacts
• Advertisement / preview of ongoing work here at UC Davis

Preliminary Results EULA
• I acknowledge that the following results are based on extremely preliminary data analysis.• I expect that with further data and analysis work by
the researchers, they will change.• I will not take these too seriously – they are
intended as “proof of concept”• I may need to accept cookies to view these results.• (The type you eat)

New work in progress:Three projects in search of titles1. “Untitled project: Head Start long run impact, PSID analysis”
2. “Untitled project: Head Start funding data, county-year and state-year panels”
3. “Untitled project: Head Start long run impact, rapid growth in funding during the 1990s”
Joint work with: Ariel Marek, Esra Kose, Michel Grosz, Na’ama Shenhav, Natalie Ho

2: “Untitled project: Head Start funding data, state-year and county-year panels”

State-Year Panel
• Many sources of secondary data• OEO reports• Head Start Statistical Fact Sheets• NCES digest• Congressional Research Service Report• GPO Budget reports
• Funding and (sometimes) enrollment
• Used in two ways• Can validate later county-year panel• Direct source of information on Head Start exposure
• Also: population (3-4) and child poverty estimates

State-Year Panel
We have many years, but not all!

State-Year Panel

County-Year Panel
• Community Action Program funding data (1965-1968)
• Federal Outlay System Files (1968-1980)
• These provide information on funding at the Program-County-year level.
County-Year Panel
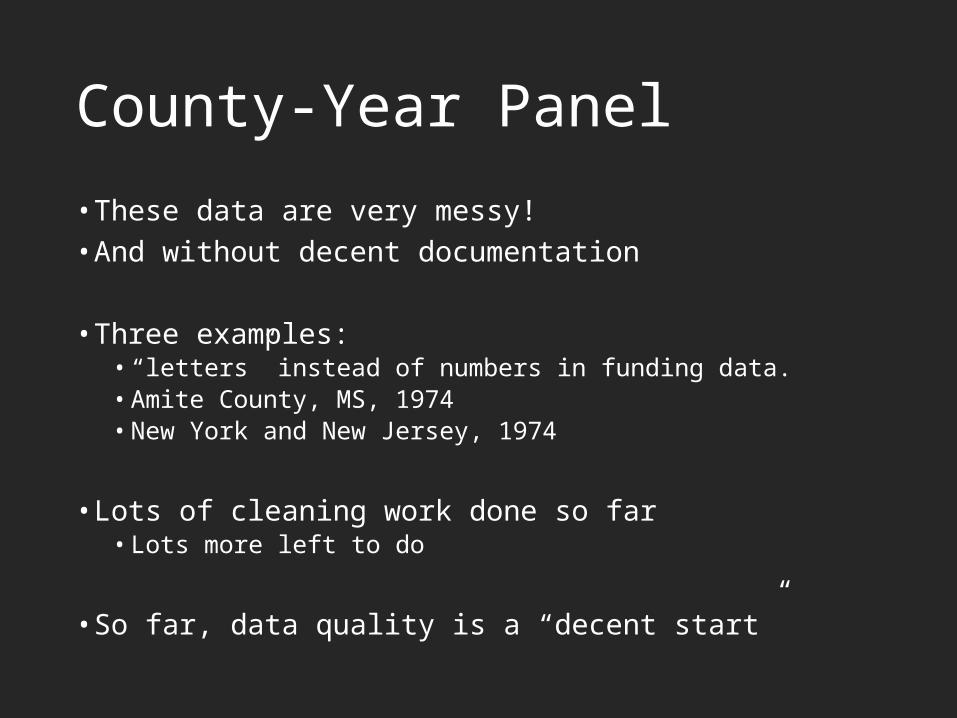
• These data are very messy!• And without decent documentation
• Three examples:• “letters” instead of numbers in funding data.• Amite County, MS, 1974• New York and New Jersey, 1974
• Lots of cleaning work done so far• Lots more left to do
• So far, data quality is a “decent start”
County-Year Panel
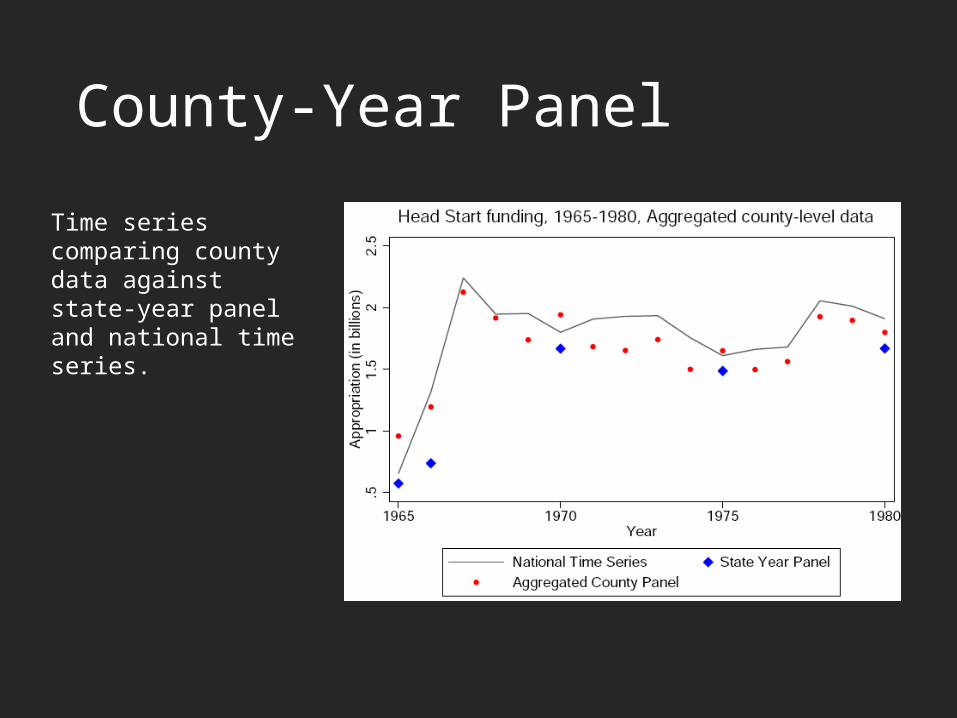
Time series comparing county data against state-year panel and national time series.

County-Year Panel
Cross section comparing county data against state-year panel. Log scale.

County-Year Panel
Cross sections comparing county data against state-year panel. Log scale.

County-Year PanelWhat does the data look like?

State-Year and County-Year PanelsLessons learned
• These data have potential, but require deep attention to cleaning.
• Difficult to even know what to check against
• I would welcome leads and suggestions
3: “Untitled project: Head Start long run impact, rapid growth in funding during the 1990s”
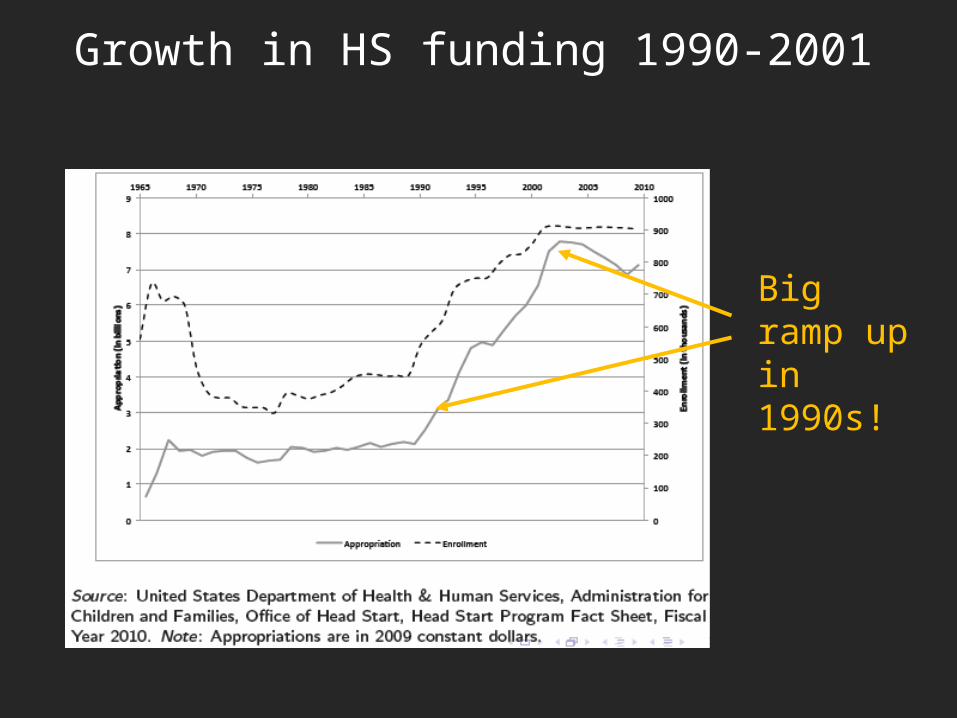
Growth in HS funding 1990-2001
Big ramp up in 1990s!
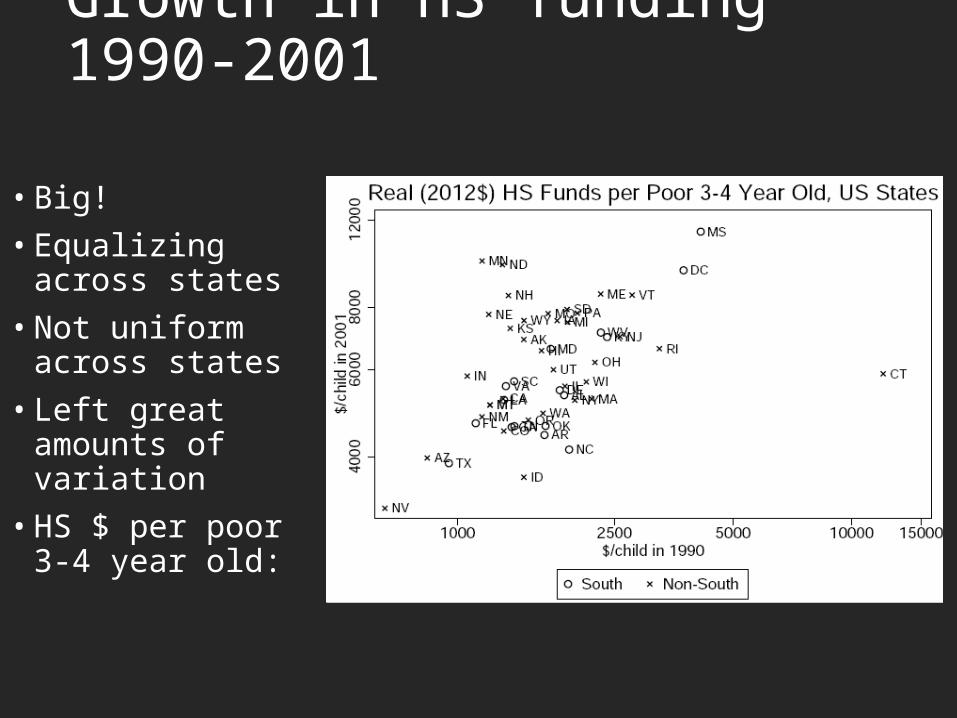
• Big!• Equalizing across
states• Not uniform across
states• Left great amounts
of variation• HS $ per poor 3-4
year old:
Growth in HS funding 1990-2001

• What is behind variation in HS growth? One potential answer: legislative language.
• We are collecting this for Head Start’s history. Example, USC 42, 1994:
Growth in HS funding 1990-2001
1. Set asides2. Each state gets its
1981 $$3. Of the excess …
1. 1/3 based on 0-18 AFDC caseload
2. 2/3 based on 0-5 kids poverty

Growth in HS funding 1990-2001Legislated formula and actual HS $
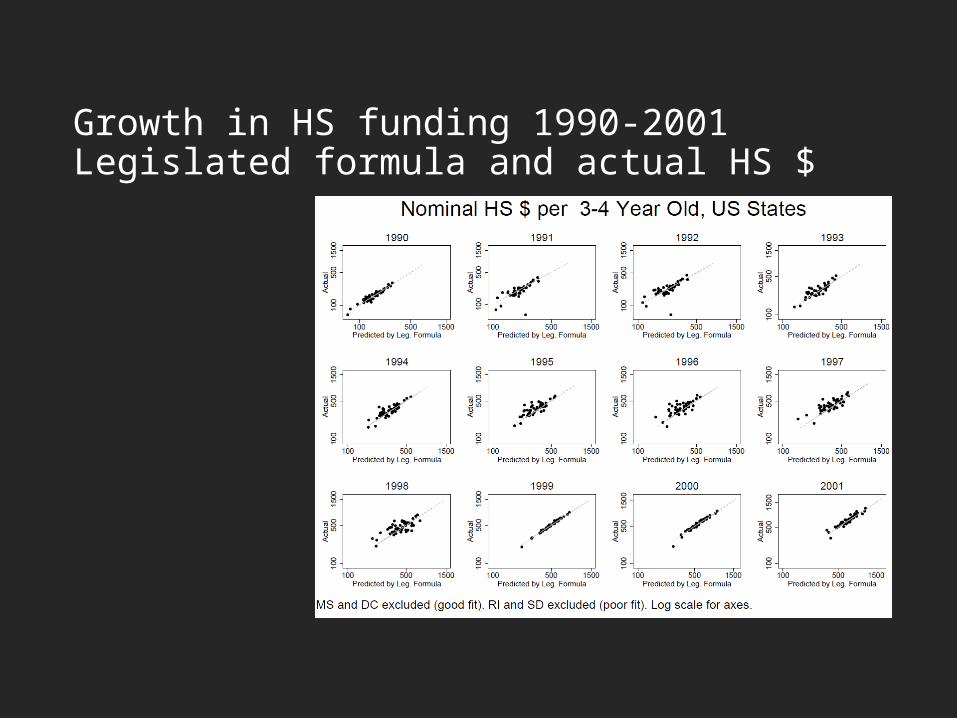
Growth in HS funding 1990-2001Legislated formula and actual HS $

Growth in HS funding 1990-2001
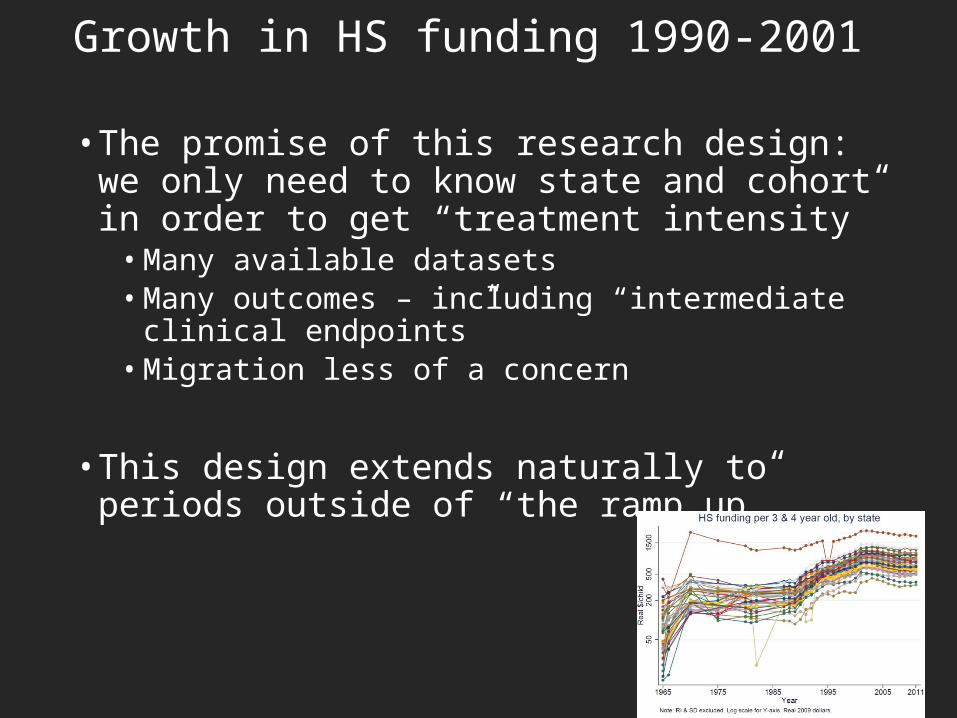
• The promise of this research design: we only need to know state and cohort in order to get “treatment intensity”• Many available datasets• Many outcomes – including “intermediate clinical
endpoints”• Migration less of a concern
• This design extends naturally to periods outside of “the ramp up”
Growth in HS funding 1990-2001

Long run Head Start Puzzles:Conclusion
• We all know and love Head Start• But we don’t know as much as we should• Stay tuned …


