Long-term Acute Care Hospitals Infection Control Issues SHEA 2007 Carolyn V. Gould, MD, MSc Division of Healthcare Quality Promotion Centers for Disease Control and Prevention Atlanta, GA Disclosure: Nothing to disclose
Transcript
Long-term Acute Care HospitalsInfection Control Issues
SHEA 2007Carolyn V. Gould, MD, MSc
Division of Healthcare Quality PromotionCenters for Disease Control and Prevention
Atlanta, GA
Disclosure: Nothing to disclose
Long-term Acute Care Hospitals
Defined by CMS as hospitals with average length of stay ≥ 25 days
LTACH patients:– Have multiple complicated medical conditions– Require skilled, complex medical care– Cannot be managed under lesser level of care
Long-term Acute Care: An oxymoron?
Patients in LTACHs differ from those in other long-term settings:– Require continuous intensive acute care services– Higher severity of illness– Multisystem complications (e.g. ventilator
dependence)– Goal is medical recovery and return home
Long-term Acute Care Hospitals
Examples of conditions appropriate for LTACH:– Prolonged ventilator weaning– Intensive respiratory care– Chronic renal failure requiring dialysis
complicating other medical conditions – Complex medical regimen (e.g. multiple IV
meds, TPN, frequent transfusions)– Complex wound care
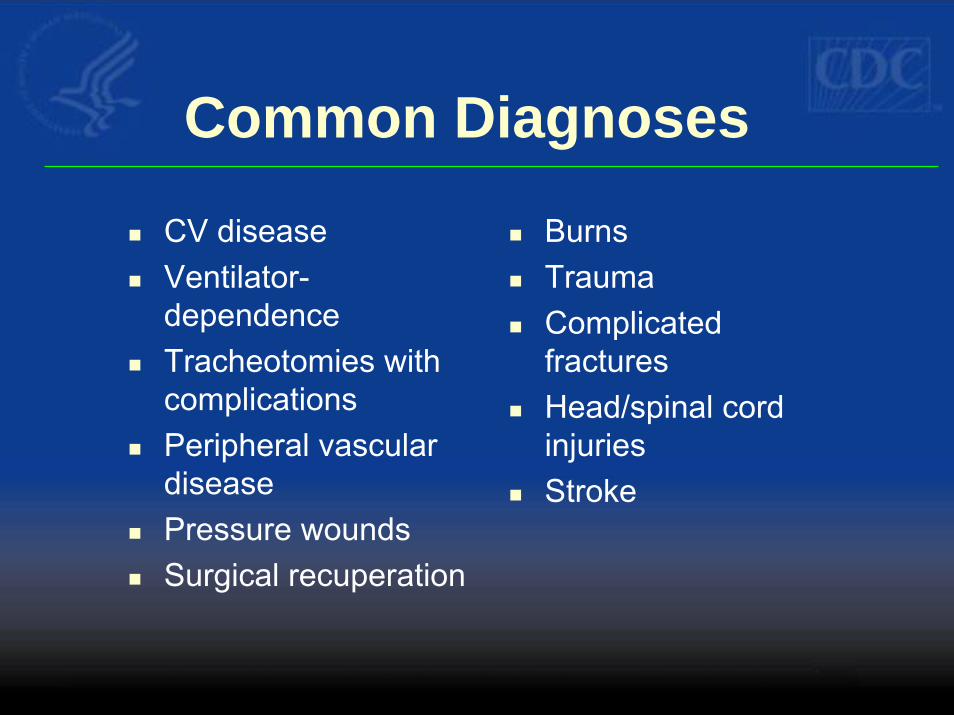
Common Diagnoses
CV diseaseVentilator-dependenceTracheotomies with complicationsPeripheral vascular diseasePressure woundsSurgical recuperation
Aging populationNew technologyEconomic forces– Prospective payment system for
acute care hospitals
Long-term Acute Care Hospitals: History
1984: Medicare implemented acute care hospital prospective payment system– Long-term care exemption
1988-1996: Average annual growth rate 31%1993: 58 LTACHs in 20 states2003: 280 LTACHs in 40 states
Long-term Acute Care Hospitals
Freestanding or “hospitals within hospitals”– “host” hospital leases unused space to LTACH
Separate governing body, administration, and medical staffMust meet same health and safety standards as acute care hospitals
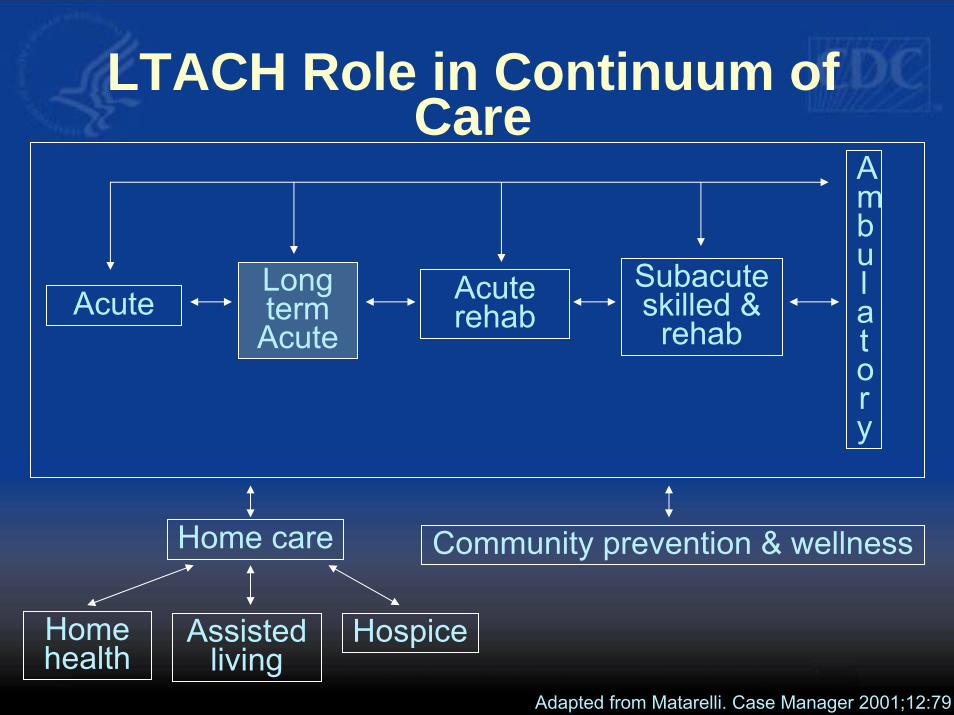
LTACH Role in Continuum of Care
AcuteLong term
AcuteAcute rehab
Subacuteskilled &
rehab
Ambulatory
Home care Community prevention & wellness
Home health
Assisted living
Hospice
Adapted from Matarelli. Case Manager 2001;12:79
Infection Control Issues in LTACHS
Unique population and environmentWhat do we know?How do we apply current infection control recommendations?
Infection Control Challenges in LTACHs
High risk patient population High prevalence of MDROsAvailability of private rooms for isolationLogistics of isolating and cohorting patientsAdequate infection control resourcesActive surveillance capabilitiesAntibiotic pressure
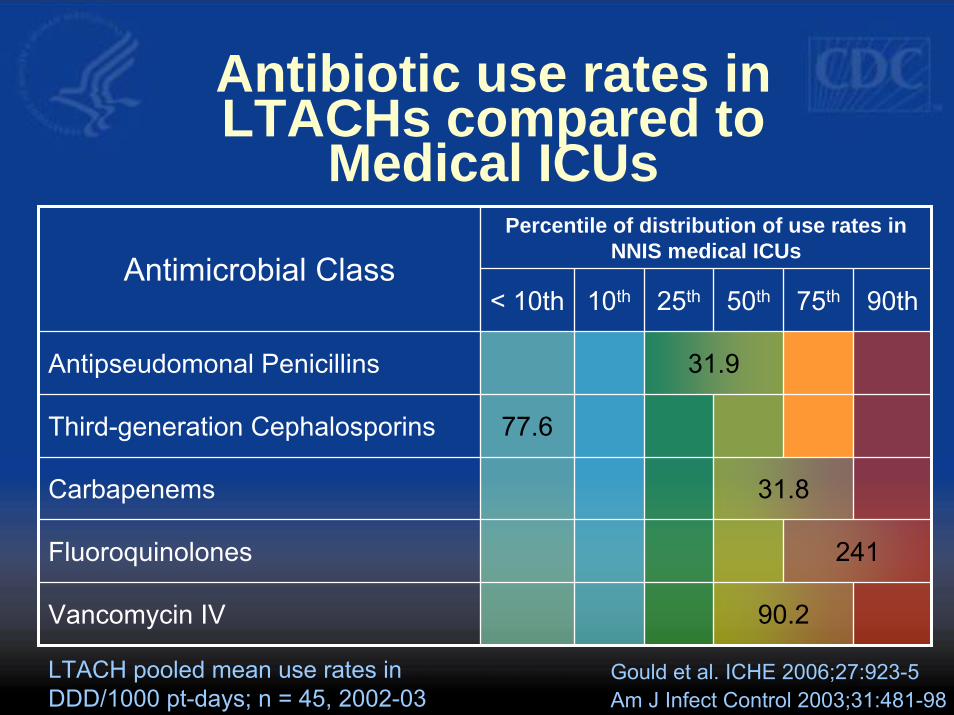
Antibiotic resistance and antibiotic use patterns in
45 LTACHs (2002-2003)
Data obtained from corporation that manages LTACHs in U.S.– Geographically diverse– Most were hospitals within hospitals
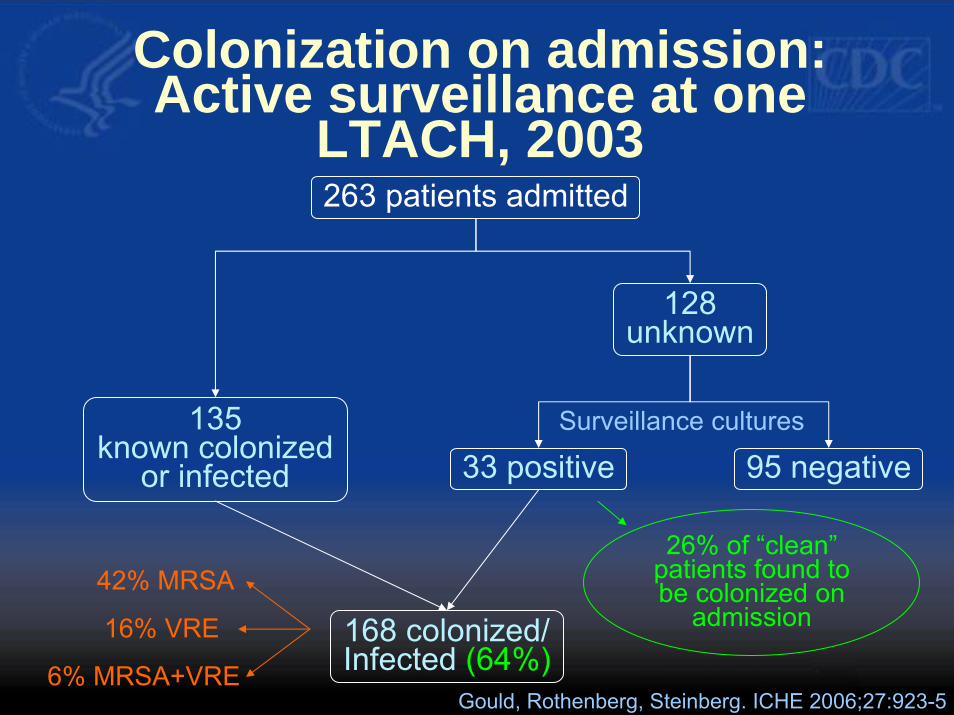
Colonization on admission: Active surveillance at one
LTACH, 2003263 patients admitted
135known colonized
or infected
128unknown
33 positive 95 negative
168 colonized/Infected (64%)
26% of “clean” patients found to be colonized on
admission
Surveillance cultures
42% MRSA
16% VRE
6% MRSA+VREGould, Rothenberg, Steinberg. ICHE 2006;27:923-5
Colonization pressure
“…compliance for hand washing significantly in excess of reported levels, or the cohorting of nursing staff, are needed to prevent nosocomial transmission of VRE in endemic settings.”
Austin DJ et al. Proc Natl Acad Sci USA 1999;96:6908-13
VRE acquisition in relation to colonization pressure and
antibiotic pressure
Bonten MJM et al. Arch Intern Med 1998;158:1127-32
Colonization pressure
Antibiotic pressure
75% 75%25%
75%25%
75%
25%25%
Time to acquisition
5 days6 days
16 days19 days
Antibiotic pressure = % of days with cephalosporin use
Device Utilization
45 LTACHs: – Central line utilization rate†: 56% – Ventilator utilization rate‡: 18%
2 LTACHs, 93 ventilator-dependent patients:– Central line utilization rate: 75%
Gould et al. ICHE 2006;27:923-5Wolfenden et al. ICHE 2007;28:105-6
† Central line days/patient days
‡ Ventilator days/patient days
10% 25% 50% 75% 90% Pooled mean
Central Line Utilization
0.3 0.37 0.52 0.64 0.75 0.56
Ventilator Utilization
0.24 0.35 0.47 0.59 0.67 0.18
45 LTACHS
Am J Infect Control 2003;31:481-98Gould et al. ICHE 2006;27:923-5
Medical ICUs
NNIS data are from Jan 1995 to June 2003
Device Use rates in LTACHscompared to NNIS Medical
ICUs (2002-2003)
▲
▲
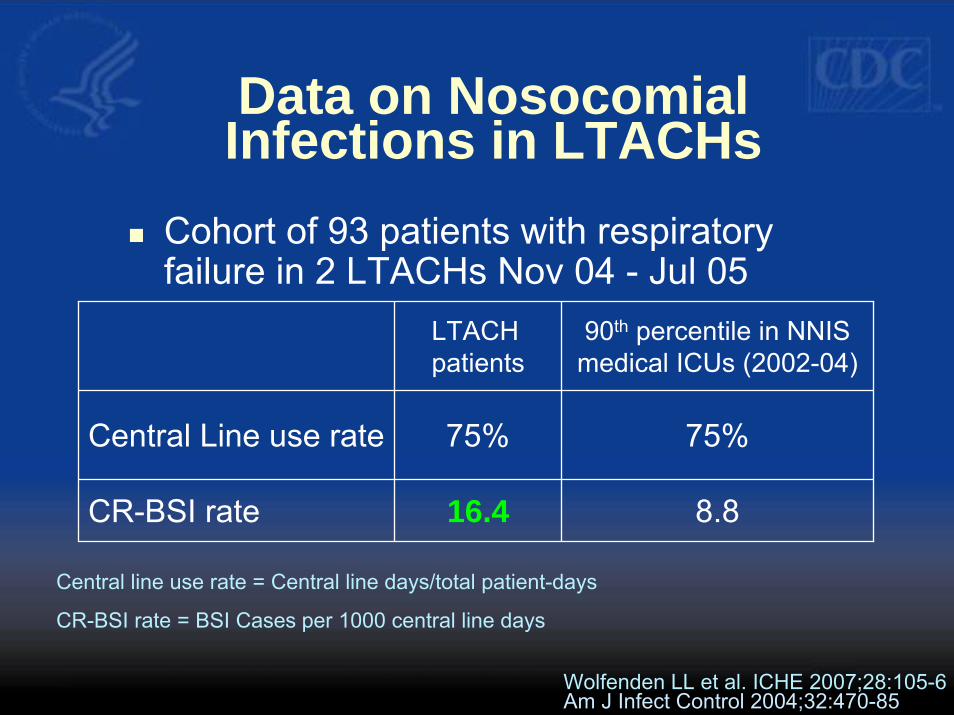
Data on Nosocomial Infections in LTACHs
Cohort of 93 patients with respiratory failure in 2 LTACHs Nov 04 - Jul 05
LTACH patients
90th percentile in NNIS medical ICUs (2002-04)
Central Line use rate 75% 75%
CR-BSI rate 16.4 8.8
Central line use rate = Central line days/total patient-days
CR-BSI rate = BSI Cases per 1000 central line days
Wolfenden LL et al. ICHE 2007;28:105-6Am J Infect Control 2004;32:470-85
Pathogens isolated from 33 LTACH Patients
with CR-BSIOrganism No (%) of isolates
(n=40)Enterococcus species 13 (32)
Coagulase-negative staphylococci 12 (29)
Staphylococcus aureus 5 (12)
Candida species 5 (12)
Klebsiella oxytoca 3 (8)
Acinetobacter baumannii 1 (3)
Alcaligenes xylosoxidans 1 (3)
Wolfenden LL et al. ICHE 2007;28:105-6
Composite Antibiogram from 45 LTACHs (2002-2003)
Organism Antibiotic Median % resistant Range %S. aureus Oxacillin 86* 57-100Enterococcus Vancomycin 32 2-69Pseudomonas Piperacillin 23 2-52
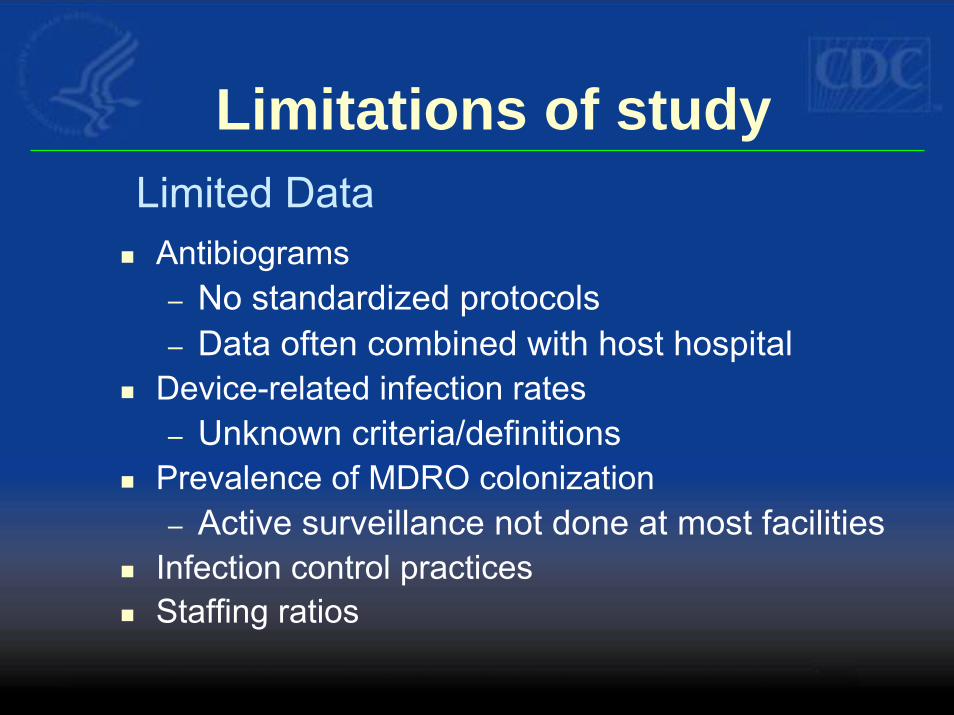
Prevalence of MDRO colonization– Active surveillance not done at most facilities
Infection control practicesStaffing ratios
Limited Data
Antibiotic Resistance in LTACHs
the “Perfect Storm”
Very high rate of MDRO colonization at time of admissionCompromised patientsMultiple sources of infection, invasive devicesHigh rate of antibiotic useProlonged hospitalizations
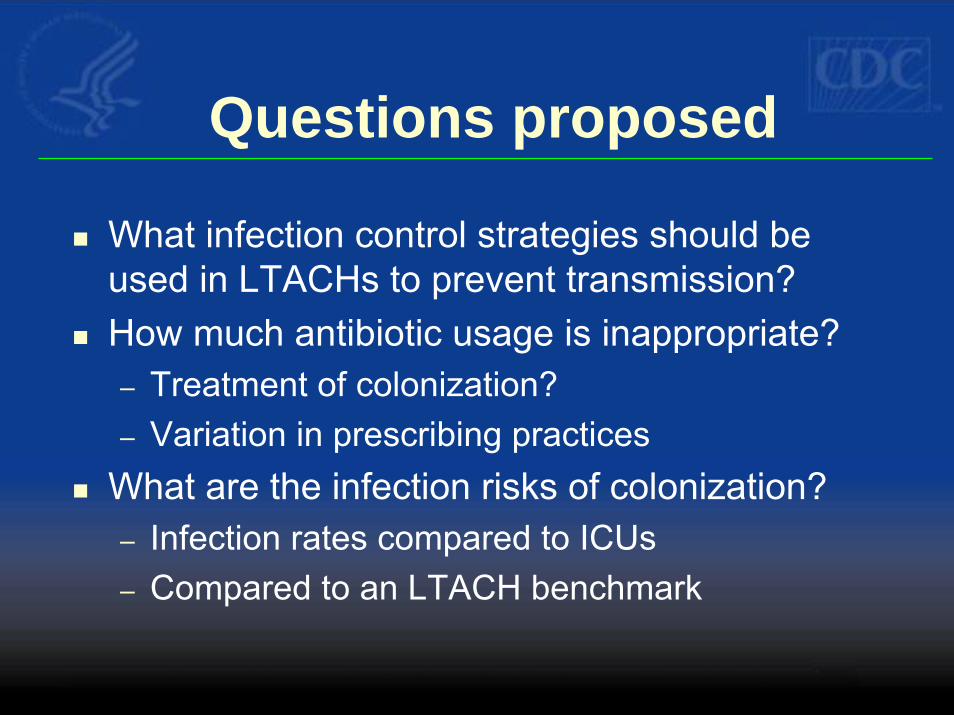
Questions proposed
What infection control strategies should be used in LTACHs to prevent transmission?How much antibiotic usage is inappropriate?– Treatment of colonization?– Variation in prescribing practices
What are the infection risks of colonization?– Infection rates compared to ICUs– Compared to an LTACH benchmark
Infection Control Strategies in LTACHs
Administrative measuresEducation and training of healthcare personnelJudicious use of antimicrobial agentsSurveillanceInfection control precautionsEnvironmental measures
Overview of CDC/HICPAC Recommendations to Prevent Transmission of MDROs
CDC/HICPAC, 2006
Infection Control Strategies in LTACHs
1. Administrative Measures• Make MDRO prevention an organizational
patient safety priority• Provide fiscal and human resources
• Dedicated, trained IC professionals• Provide communication and feedback system
Infection Control Strategies in LTACHs
2. Education and training of healthcare personnel• Periodic training on prevention strategies• Include organization-specific experience with
MDROs
Infection Control Strategies in LTACHs
3. Judicious use of antimicrobial agents• Review and provide feedback on hospital-
specific antimicrobial utilization and susceptibility patterns (antibiograms)
• Implement antimicrobial management systems• Provide appropriate review of prescribed
antimicrobials (e.g. “report cards”) and suggestions for improving use
Infection Control Strategies in LTACHs
4. Surveillance• Ensure standardized laboratory methods for
antimicrobial susceptibility testing• Provide facility-specific antibiograms at
least annually using CLSI standards
Infection Control Strategies in LTACHs
4. Surveillance, continued• Develop protocols for active surveillance for
targeted MDROs• At time of admission• Weekly point prevalence surveys
• Exchange information about MDROs with referring hospitals
Infection Control Strategies in LTACHs
5. Infection control precautions• Follow standard precautions for all patient
encounters• Contact precautions for patients with MDROs• Implement contact precautions until results of
surveillance cultures reported negative• All LTACH rooms should be private
Infection Control Strategies in LTACHs
5. Infection control precautions, continued• Cohort patients with same MDRO in designated
areas with assigned staff• Need for future study: universal gloves and
gowns as an alternative to active surveillance
Infection Control Strategies in LTACHs
6. Environmental measures• Implement patient-dedicated or single-use
equipment• Monitor adherence and reinforce training of
environmental staff• Monitor cleaning performance of high-touch
surfaces
12 Steps to Prevent Antimicrobial Resistance:Hospitalized Adults
12 Break the chain11 Isolate the pathogen
10 Stop treatment when cured9 Know when to say “no” to vanco
8 Treat infection, not colonization7 Treat infection, not contamination
6 Use local data5 Practice antimicrobial control
4 Access the experts3 Target the pathogen
2 Get the catheters out1 Vaccinate
Prevent Transmission
Use Antimicrobials Wisely
Diagnose & Treat Effectively
Prevent Infections
Campaign to Prevent Antimicrobial Resistance in Healthcare Settings
Future DirectionsIncorporation of LTACHs into National Healthcare Safety Network (NHSN)– Standardized protocols for measuring device-
associated infection rates, device utilization– Surveys specific for LTACHs– Risk adjustment of infection rates– Feedback of data for performance improvement– Access to prevention tools, best practices
The findings and conclusions are those of the author(s) and do not necessarily represent the view of the Centers for