Long Term Analysis of Nuclear Containment Structure Considering Material Non-linearity and Geometric Non- linearity Effects Niteesh Halagatti #1 , Rajashekar Swamy #2 , Santhosh H P #3 # Civil Department, M.S Ramaiah University of Applied Science, Bangalore India 1 [email protected]2 [email protected]3 [email protected]Abstract—Demand for energy is increasing day by day across the world resulting in construction of more number of atomic power stations. Critical facilities such as nuclear containment structure design require an exact and accurate assessment of aging requirements, because any failure of these facilities causes great threat to society. In the present study nuclear containment structure is modelled according to specification of kudankulam nuclear containment structure, static and dynamic analysis is carried out for the same site location. In order to overcome the failure of much nuclear containment structure due to adverse durability effects before their expected design life, long term analysis of nuclear containment structure is carried out by considering geometric non-linearity, material non-linearity and temperature effects for period of 100 years using relevant standard codes. The results obtained in this study shows that the long term deflection by considering the effects of creep, shrinkage and temperature are within permissible limit according to clause of I.S 456 2000 is evaluated for period of 100 years. Keyword — P-Delta analysis, Creep, Shrinkage, IS 456- 2000, CEB-FIP 1990 I. INTRODUCTION Earlier nuclear reactors are designed maximum for a period of 40 years. Currently in order to improve the profit and to enhance the nuclear share of the electricity supply, presently nuclear industries are significantly concentrating on expansion of the life of nuclear power plant. As of May 2016, 444 nuclear reactors are operating across 30 countries for the production of electricity and 63 new nuclear power plants are in the construction phase in 15 countries. Across India Twenty atomic reactors with 4780 MW capacity are in operation and seven more reactors of 5300 MW in construction stage. Increasing demand for nuclear energy across the world have increased concerns towards the safety of nuclear power plant as any basic harm to any these atomic reactors resulting in serious risk of radiation effects, real health issues and also organic and ecological dangers. Florida nuclear power plant accident in 2009 and Tarapur first and second boiling reactor units operation are stopped after 2011 Fukushima accident, Tree mile island accident. These accidents increased fear from atomic reactors hence nuclear board is concentrating more on safety issues. Ageing is a continuous time-dependent loss of quality of materials, caused by the operating conditions like temperature, irradiation, corrosion, abrasion, erosion and combination of all factors. The International Energy Agency states as follows “In the coming decade life of nuclear power plant will be the most significant factors for generation of electricity hence if there is no change in principles and policies of atomic energy” II. BACKGROUND THEORY N. M. Bhandari, Banti A. Gedam and AkhilUpadhyay [1] (2009) invested creep and shrinkage of HPC for period of nine hundred days using 4 existing material model code and lastly validation of results is done with experimental study. The results of this study shows that the shrinkage & creep result shows that the CEB FIP 1990 model codal provisions is a closer match with 2% deviation of experimental data, whereas the ACI 209R- 92, B3 and GL2000 models are overestimating deviational coefficient between 31% to 66% for creep and 46 to 89% for shrinkage. Robert S. Dunham Randy J. James, and Joseph Y [2] 2010 studied aging behaviour of Nuclear power plant by Modelling and analysis of NPP structure with advanced technology. The results of this study shows that Advanced modelling and simulation techniques are important in evaluating desired and unusual structural behaviour to enhance the safety operation of NPP Structure which is near to their design life and Time- ISSN (Print) : 2319-8613 ISSN (Online) : 0975-4024 Niteesh Halagatti et al. / International Journal of Engineering and Technology (IJET) DOI: 10.21817/ijet/2017/v9i6/170906252 Vol 9 No 6 Dec 2017-Jan 2018 4097
Transcript
Long Term Analysis of Nuclear Containment Structure Considering
Material Non-linearity and Geometric Non-linearity Effects
Niteesh Halagatti #1, Rajashekar Swamy #2, Santhosh H P #3 # Civil Department, M.S Ramaiah University of Applied Science, Bangalore India
Abstract—Demand for energy is increasing day by day across the world resulting in construction of more number of atomic power stations. Critical facilities such as nuclear containment structure design require an exact and accurate assessment of aging requirements, because any failure of these facilities causes great threat to society.
In the present study nuclear containment structure is modelled according to specification of kudankulam nuclear containment structure, static and dynamic analysis is carried out for the same site location. In order to overcome the failure of much nuclear containment structure due to adverse durability effects before their expected design life, long term analysis of nuclear containment structure is carried out by considering geometric non-linearity, material non-linearity and temperature effects for period of 100 years using relevant standard codes. The results obtained in this study shows that the long term deflection by considering the effects of creep, shrinkage and temperature are within permissible limit according to clause of I.S 456 2000 is evaluated for period of 100 years.
Earlier nuclear reactors are designed maximum for a period of 40 years. Currently in order to improve the profit and to enhance the nuclear share of the electricity supply, presently nuclear industries are significantly concentrating on expansion of the life of nuclear power plant. As of May 2016, 444 nuclear reactors are operating across 30 countries for the production of electricity and 63 new nuclear power plants are in the construction phase in 15 countries. Across India Twenty atomic reactors with 4780 MW capacity are in operation and seven more reactors of 5300 MW in construction stage.
Increasing demand for nuclear energy across the world have increased concerns towards the safety of nuclear power plant as any basic harm to any these atomic reactors resulting in serious risk of radiation effects, real health issues and also organic and ecological dangers. Florida nuclear power plant accident in 2009 and Tarapur first and second boiling reactor units operation are stopped after 2011 Fukushima accident, Tree mile island accident. These accidents increased fear from atomic reactors hence nuclear board is concentrating more on safety issues. Ageing is a continuous time-dependent loss of quality of materials, caused by the operating conditions like temperature, irradiation, corrosion, abrasion, erosion and combination of all factors.
The International Energy Agency states as follows “In the coming decade life of nuclear power plant will be the most significant factors for generation of electricity hence if there is no change in principles and policies of atomic energy”
II. BACKGROUND THEORY
N. M. Bhandari, Banti A. Gedam and AkhilUpadhyay [1] (2009) invested creep and shrinkage of HPC for period of nine hundred days using 4 existing material model code and lastly validation of results is done with experimental study. The results of this study shows that the shrinkage & creep result shows that the CEB FIP 1990 model codal provisions is a closer match with 2% deviation of experimental data, whereas the ACI 209R-92, B3 and GL2000 models are overestimating deviational coefficient between 31% to 66% for creep and 46 to 89% for shrinkage.
Robert S. Dunham Randy J. James, and Joseph Y [2] 2010 studied aging behaviour of Nuclear power plant by Modelling and analysis of NPP structure with advanced technology. The results of this study shows that Advanced modelling and simulation techniques are important in evaluating desired and unusual structural behaviour to enhance the safety operation of NPP Structure which is near to their design life and Time-
ISSN (Print) : 2319-8613 ISSN (Online) : 0975-4024 Niteesh Halagatti et al. / International Journal of Engineering and Technology (IJET)
DOI: 10.21817/ijet/2017/v9i6/170906252 Vol 9 No 6 Dec 2017-Jan 2018 4097
dependent material degradation factors like temperature and alkali aggregate reaction that can affect the long duration behaviour of NPP structures
Rospars .C, P. Bisch, G. Moreaur, Erlicher S and Ruocci. G [14] in year 2015 studied Analysis of cracking pattern in reinforced concrete members subjected to shear cyclic load. Displacement and strain fields in shear wall are evaluated using digital images correlation, cracks patterns are characterised in terms of crack spacing, orientation and average crack width, a comparative study of evolutions of cracks for two different types of cyclic loading is carried out and maximum and residual crack width at ultimate loading case are analysed results reveals that Shear cyclic load test on concrete revels that there is monotonically increase of crack width and propagation of cracks on the concrete structure indicates about the stabilisation of cracking pattern.
N. Dawood, and H. Marzouk, in 2013 provides Design Guidelines criteria for Controlling of cracks in a thick high-Strength Concrete members of an off shore structures in order to determine the behaviour of cracks and prevention measures need to be adopted to control cracks in a thick HSC members by developed empirical equations. Authors found that greater the value of bar spacing and cover of concrete, results in reduction of maximum allowed steel stress. For controlling cracks there is no significant effect of concrete strength on maximum steel tensile stress. Crack formation can be avoided by using lesser diameter bar having a larger steel stress. And finally they concluded the best empirical approach. An easy way to comply with the conference paper formatting requirements is to use this document as a template and simply type your text into it.
III. METHODOLOGY
Finite element modelling of nuclear containment structure is carried out according to specification of Kudankulam nuclear power plant project, which is located along the gulf coast of Mannar at 25km northeast of Kanyakumari India. Static and dynamic analysis is carried out using ETABS according to Indian standards for same site location.
In the present study nuclear containment structure is designed and analysed for a period of hundred years against material non-linearity, geometric non-linearity and varying temperature load of +50oc in order to ensure safety and serviceable for entire design life. For geometric non – linearity p-delta analysis is carried out according to I.S 1893 (part 1) 2002 and UBC 97. Whereas For material non-linearity time dependent properties like creep and shrinkage analysis is carried out according to CEB-FIP 1990 code book and lastly temperature analysis is carried out according to AERB SAFETY STANDARD NO. AERB/SS/CSE-1 and UBC 97, lastly long –term deflection and permissible crack width is evaluated
IV. NUMERICAL MODELING
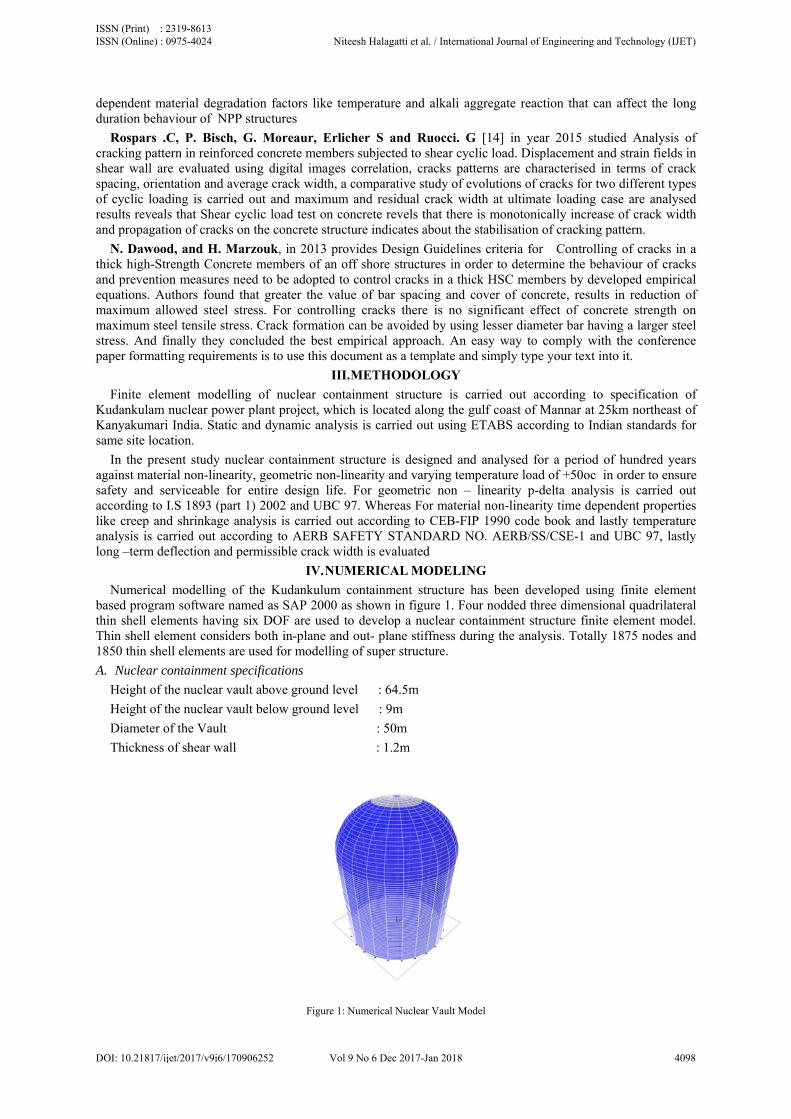
Numerical modelling of the Kudankulum containment structure has been developed using finite element based program software named as SAP 2000 as shown in figure 1. Four nodded three dimensional quadrilateral thin shell elements having six DOF are used to develop a nuclear containment structure finite element model. Thin shell element considers both in-plane and out- plane stiffness during the analysis. Totally 1875 nodes and 1850 thin shell elements are used for modelling of super structure.
A. Nuclear containment specifications
Height of the nuclear vault above ground level : 64.5m
Height of the nuclear vault below ground level : 9m
Diameter of the Vault : 50m
Thickness of shear wall : 1.2m
Figure 1: Numerical Nuclear Vault Model
ISSN (Print) : 2319-8613 ISSN (Online) : 0975-4024 Niteesh Halagatti et al. / International Journal of Engineering and Technology (IJET)
DOI: 10.21817/ijet/2017/v9i6/170906252 Vol 9 No 6 Dec 2017-Jan 2018 4098
B. Material properties
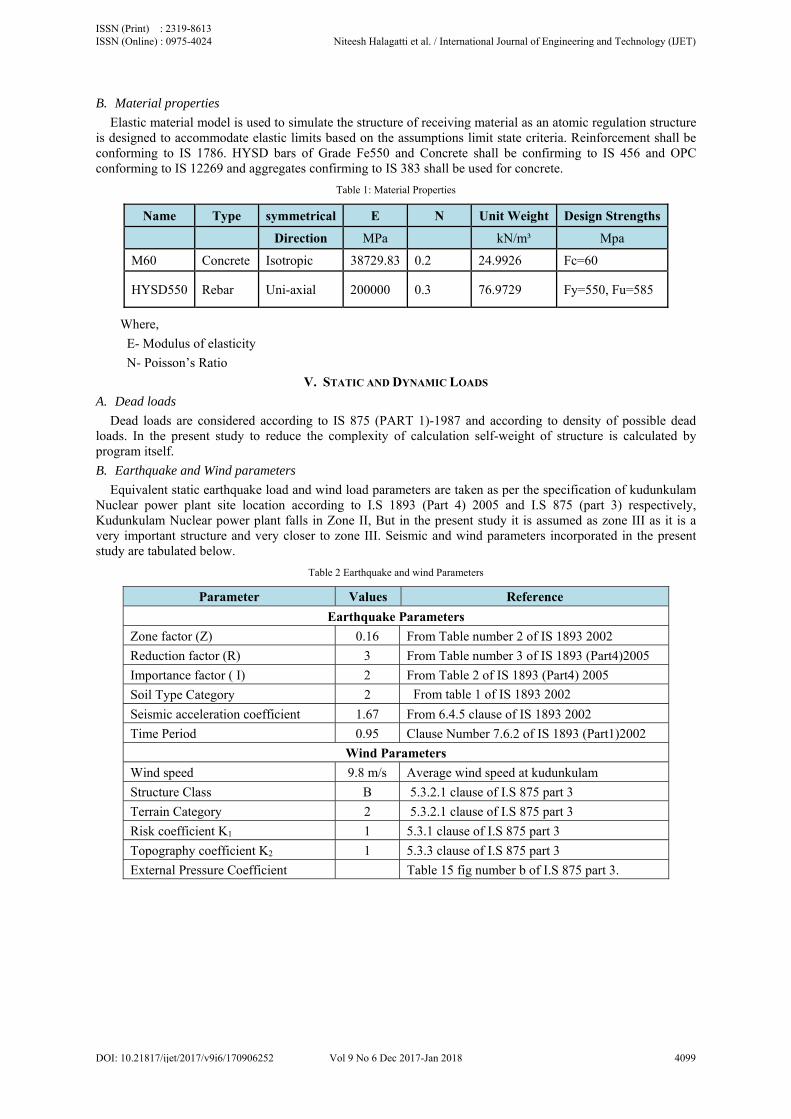
Elastic material model is used to simulate the structure of receiving material as an atomic regulation structure is designed to accommodate elastic limits based on the assumptions limit state criteria. Reinforcement shall be conforming to IS 1786. HYSD bars of Grade Fe550 and Concrete shall be confirming to IS 456 and OPC conforming to IS 12269 and aggregates confirming to IS 383 shall be used for concrete.
Table 1: Material Properties
Name Type symmetrical E Ν Unit Weight Design Strengths
Dead loads are considered according to IS 875 (PART 1)-1987 and according to density of possible dead loads. In the present study to reduce the complexity of calculation self-weight of structure is calculated by program itself.
B. Earthquake and Wind parameters
Equivalent static earthquake load and wind load parameters are taken as per the specification of kudunkulam Nuclear power plant site location according to I.S 1893 (Part 4) 2005 and I.S 875 (part 3) respectively, Kudunkulam Nuclear power plant falls in Zone II, But in the present study it is assumed as zone III as it is a very important structure and very closer to zone III. Seismic and wind parameters incorporated in the present study are tabulated below.
Table 2 Earthquake and wind Parameters
Parameter Values Reference
Earthquake Parameters
Zone factor (Z) 0.16 From Table number 2 of IS 1893 2002
Reduction factor (R) 3 From Table number 3 of IS 1893 (Part4)2005
Importance factor ( I) 2 From Table 2 of IS 1893 (Part4) 2005
Soil Type Category 2 From table 1 of IS 1893 2002
Seismic acceleration coefficient 1.67 From 6.4.5 clause of IS 1893 2002
Time Period 0.95 Clause Number 7.6.2 of IS 1893 (Part1)2002
Wind Parameters
Wind speed 9.8 m/s Average wind speed at kudunkulam
Structure Class B 5.3.2.1 clause of I.S 875 part 3
Terrain Category 2 5.3.2.1 clause of I.S 875 part 3
Risk coefficient K1 1 5.3.1 clause of I.S 875 part 3
Topography coefficient K2 1 5.3.3 clause of I.S 875 part 3
External Pressure Coefficient Table 15 fig number b of I.S 875 part 3.
ISSN (Print) : 2319-8613 ISSN (Online) : 0975-4024 Niteesh Halagatti et al. / International Journal of Engineering and Technology (IJET)
DOI: 10.21817/ijet/2017/v9i6/170906252 Vol 9 No 6 Dec 2017-Jan 2018 4099
Figure 2: External Wind Pressure Coefficient
VI. LONG TERM NON-LINEAR ANALYSIS
The major difference between linear analysis and non-linear analysis is stiffness will remain constant, loading and un-loading path are simple in nature, simple analysis procedure in linear analysis where as in non-linear analysis there is variation of stiffness, loading and unloading paths are complex in nature and complex analysis procedure.
Figure 3: Linear Behaviour versus Non-Linear Behaviour
Zero Initial Conditions -Start from Unstressed State: The structure having zero velocity and displacement, absence of past non-linear deformation.
A. Material Non-linearity
Material non linearity occurs when there is non-linear stress-strain behaviour is observed in the material and there will change in material properties with respect to varying loads. Non-linear behaviour for M60 grade and HYSD 550 is shown in figure
In the present study for material non-linearity creep and shrinkage analysis are carried out according CEB-FIP-1990 EURO code, creep and shrinkage analysis are generally carried out by two methods namely the Dirichlet series method and the full integration method. Creep Coefficient and shrinkage strain are determined manually as well as analytically.
Linear and non-linear behaviour of M60 grade concrete is shown in below figure 4
ISSN (Print) : 2319-8613 ISSN (Online) : 0975-4024 Niteesh Halagatti et al. / International Journal of Engineering and Technology (IJET)
DOI: 10.21817/ijet/2017/v9i6/170906252 Vol 9 No 6 Dec 2017-Jan 2018 4100
Figure 4 Stress Strain Curve for M60 Grade Concrete
Linear and non-linear behaviour of HYSD 550 grade rebar is shown in below figure 5
Figure 5 Stress Strain Curve for HYSD 550 Grade Rebar
A.1Theoretical Calculation
Relative humidity is taken as 50% as per the specification of Kudankulam Nuclear power plant site location.
Notional size (n)
From equation 2.1 -69 of CEB-FIP 1990 code book
= , where Ac is cross sectional area of one element and u is perimeter
= .
. = 862.8mm.
Shrinkage start age is taken as = 7hours
Age of loading = 7 days
ISSN (Print) : 2319-8613 ISSN (Online) : 0975-4024 Niteesh Halagatti et al. / International Journal of Engineering and Technology (IJET)
DOI: 10.21817/ijet/2017/v9i6/170906252 Vol 9 No 6 Dec 2017-Jan 2018 4101
Creep coefficient and shrinkage strain are calculated according to clause 2.1.6.4 of CEP-FIP 1990
Total shrinkage strain calculated as follows:
Total shrinkage strain is given as:
From equation 2.1 -74 of CEB-FIP 1990 code book
εs( t, ts ) = εcsoβs ( t-ts )
Where:
βs= coefficient to know rate of shrinkage development equation 2.1-79 of CIB-FIP 1990
t = Concrete age measured in days
ts= Age of concrete at the time of shrinkage beginning in days
Notional Shrinkage coefficient:
From equation 2.1-75 of CEB-FIP 1990 code book
εcso=εsx (fcm) x βRH
εs(fcm) =x 10-6 [ 160 + 10 x βsc (9- )]
= [160 + 10 x 8 (9 - )] x 10-6
= 400 x 10-6
Where:
fcm = 28 days mean compressive strength of concrete measured in MPa
fcmo= 10MPa
βsc = coefficient depends on the type of cement
= 8 for rapid hardening high strength
RH = Relative humidity as per ambient temperature
RH0 = 100%
As relative humidity is between 40% << RH<<99%
βRH = -1.55 βs RH
Where:
Β sRH = 1- (RH/RH0)3
= 1- (50/100)3
= 0.875
Therefore,
βRH = -1.55 βs RH
= -1.55 x 0.875
=-1.36
Therefore shrinkage coefficient = 400 x 10-6 x 1.36
= 0.000544
Designed for 100 years
Shrinkage development rate is given by:
βs( t-ts ) = /
/
0.5
= /
./
0.5
= 0.7632
Where:
ho = 100mm
t1 = 1 day
t = life span of concrete measured in days
ts = Age of concrete at the time of shrinkage beginning measured in days i.e 1 day
ISSN (Print) : 2319-8613 ISSN (Online) : 0975-4024 Niteesh Halagatti et al. / International Journal of Engineering and Technology (IJET)
DOI: 10.21817/ijet/2017/v9i6/170906252 Vol 9 No 6 Dec 2017-Jan 2018 4102
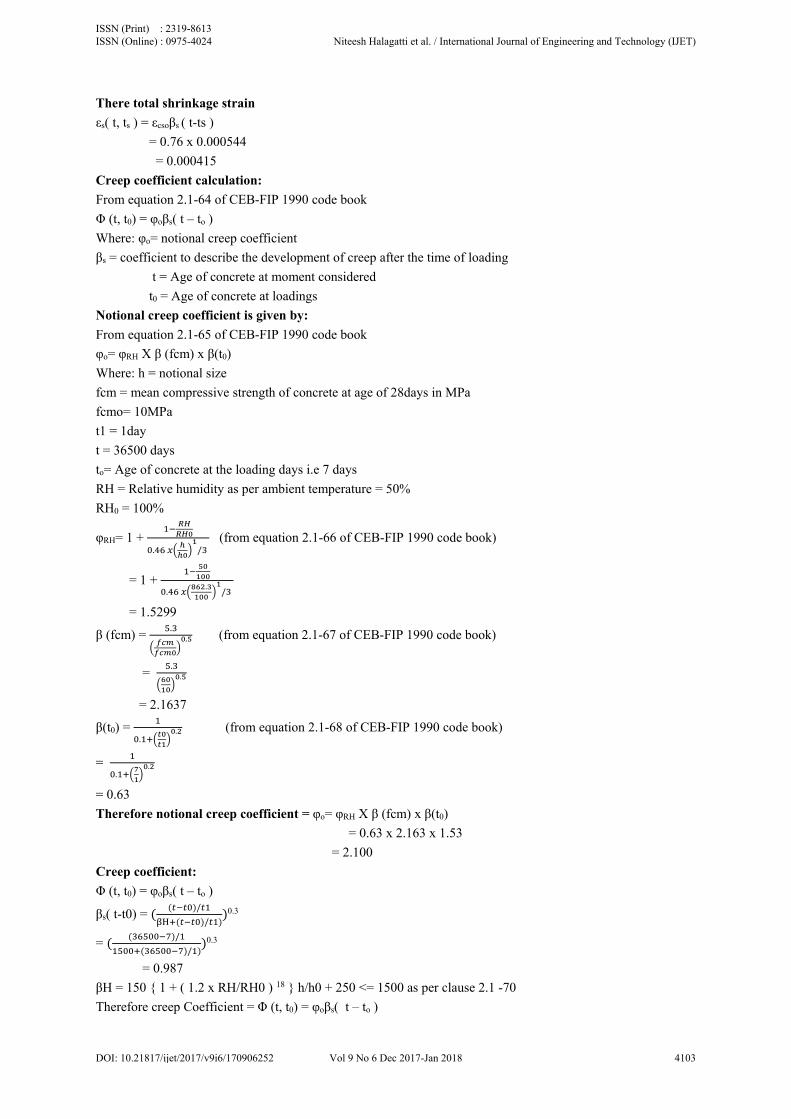
There total shrinkage strain
εs( t, ts ) = εcsoβs ( t-ts )
= 0.76 x 0.000544
= 0.000415
Creep coefficient calculation:
From equation 2.1-64 of CEB-FIP 1990 code book
Φ (t, t0) = φoβs( t – to )
Where: φo= notional creep coefficient
βs = coefficient to describe the development of creep after the time of loading
t = Age of concrete at moment considered
t0 = Age of concrete at loadings
Notional creep coefficient is given by:
From equation 2.1-65 of CEB-FIP 1990 code book
φo= φRH X β (fcm) x β(t0)
Where: h = notional size
fcm = mean compressive strength of concrete at age of 28days in MPa
fcmo= 10MPa
t1 = 1day
t = 36500 days
to= Age of concrete at the loading days i.e 7 days
RH = Relative humidity as per ambient temperature = 50%
RH0 = 100%
φRH= 1 + . /
(from equation 2.1-66 of CEB-FIP 1990 code book)
= 1 + .
./
= 1.5299
β (fcm) = .
. (from equation 2.1-67 of CEB-FIP 1990 code book)
= ..
= 2.1637
β(t0) = .
. (from equation 2.1-68 of CEB-FIP 1990 code book)
= .
.
= 0.63
Therefore notional creep coefficient = φo= φRH X β (fcm) x β(t0)
= 0.63 x 2.163 x 1.53
= 2.100
Creep coefficient:
Φ (t, t0) = φoβs( t – to )
βs( t-t0) = /
/0.3
= /
/0.3
= 0.987
βH = 150 { 1 + ( 1.2 x RH/RH0 ) 18 } h/h0 + 250 <= 1500 as per clause 2.1 -70
Therefore creep Coefficient = Φ (t, t0) = φoβs( t – to )
ISSN (Print) : 2319-8613 ISSN (Online) : 0975-4024 Niteesh Halagatti et al. / International Journal of Engineering and Technology (IJET)
DOI: 10.21817/ijet/2017/v9i6/170906252 Vol 9 No 6 Dec 2017-Jan 2018 4103
= 2.1 x 0.987
= 2.058
B. Geometric Non-linearity
Geometric non-linearity can happen because of huge amount of relocations and rotations of structure and substantial strains developed in the structure it includes nonlinearity in kinematic quantities such as the strain-rotation, stress-strain, strain- deflection relations in basic structural components.
P-Delta effect is known as the geometric nonlinearity, it is the secondary effect on moment and shear of the structural members occurring due to interaction of vertical loads and lateral displacement of the structure resulting from lateral loads like earthquake, wind.
In the present study P-delta analysis is carried out according to IS 1893 part 1 2002 and UBC 97 code book using ETABS program P-delta load combination is repetitive resulting in more computational time of the analysis. Structure undergoes local buckling of the individual members are global buckling of the entire structure if P-Delta compressive axial forces are in large quantity. Buckling of whole structure results somewhat unpredictable deformation and failure mode of the structure.
A. Temperature loads
+50C Temperature load is assigned to nuclear containment structure
Figure 6 Temperature Loa
B. Non-linear loads
Non-linearity loads are defined by creating static nonlinear staged construction cases that are specifically tailored to model construction sequence loading.
A non-linear stage is defined as a collection of operations that are executed at a given time. Each stage has defined in terms of number of days to complete that defined stage. The first stage will start with the initial conditions defined for the Staged-Construction Load Case and each stage starts with initial conditions equal to the end of the previous Stage.
In the present study each story of the nuclear containment structure is adopted as one stage. Number of days for construction of these stages is assumed based on earlier study. Stage 52 is the spherical dome, number of days for construction of the erection of the spherical dome is assumed as 109 days. After construction stages are the maintenance stages defined at every 20 years life span of nuclear containment structure
ISSN (Print) : 2319-8613 ISSN (Online) : 0975-4024 Niteesh Halagatti et al. / International Journal of Engineering and Technology (IJET)
DOI: 10.21817/ijet/2017/v9i6/170906252 Vol 9 No 6 Dec 2017-Jan 2018 4104
Table 3 Non-Linear Staged Loads
Construction Height Stage Name Stage Start
Age Duration
Cumulative Dead load
M Days days Stages
1.5 “Stage 1” 0 54 0
1 “Stage 2” 54 35 Stage 1”
1 “Stage 3” 89 35 “Stage 2”
1 “Stage 4” 124 35 “Stage 3”
1 “Stage 5” 159 35 Stage 4
1 “Stage 6” 194 35 Stage 5
1 “Stage 8” 229 35 Stage 6
1 Stage 8 264 35 Stage 7
1 Stage 9 299 35 stage 8
1 Stage 10 334 35 stage 9
1 Stage 11 369 35 stage 10
1 Stage 12 404 35 stage 11
1 Stage 13 439 35 stage 12
1 Stage 14 474 35 stage 13
1 Stage 15 509 35 stage 14
1 Stage 16 544 35 stage 15
1 Stage 17 579 35 stage 16
1 Stage 18 614 35 stage 17
1 Stage 19 649 35 stage 18
1 Stage 20 684 35 stage 19
1 Stage 21 719 35 stage 20
1 Stage 22 754 35 stage 21
1 Stage 23 789 35 stage 22
1 Stage 24 824 35 stage 23
1 Stage 25 859 35 stage 24
1 Stage 26 894 35 stage 25
1 Stage 27 929 35 stage 26
1 Stage 28 964 35 stage 27
1 Stage 29 999 35 stage 28
1 Stage 30 1034 35 stage 29
1 Stage 31 1069 35 stage 30
1 Stage 32 1104 35 stage 31
1 Stage 33 1139 35 stage 32
1 Stage 34 1174 35 stage 33
1 Stage 35 1209 35 stage 34
1 Stage 36 1244 35 stage 35
1 Stage 37 1279 35 stage 36
1 Stage 38 1314 35 stage 37
1 Stage 39 1349 35 stage 38
1 Stage 40 1384 35 stage 39
1 Stage 41 1419 35 stage 40
1 Stage 42 1454 35 stage 41
ISSN (Print) : 2319-8613 ISSN (Online) : 0975-4024 Niteesh Halagatti et al. / International Journal of Engineering and Technology (IJET)
DOI: 10.21817/ijet/2017/v9i6/170906252 Vol 9 No 6 Dec 2017-Jan 2018 4105
1 Stage 43 1489 35 stage 42
1 Stage 44 1524 35 stage 43
1 Stage 45 1559 35 stage 44
1 Stage 46 1594 35 stage 45
1 Stage 47 1629 35 stage 46
1 Stage 48 1664 35 stage 47
1 Stage 49 1699 35 stage 48
1 Stage 50 1734 35 stage 49
1 Stage 51 1769 35 stage 50
Spherical dome 50m Stage 52 1804 109 stage 51
After construction Stage 53 1913 7300 stage 52
After construction Stage 54 9213 7300 stage 53
After construction Stage 55 16513 7300 stage 54
After construction Stage 56 23813 7300 stage 55
After construction Stage 57 3111 7300 stage 56
VII. RESULTS
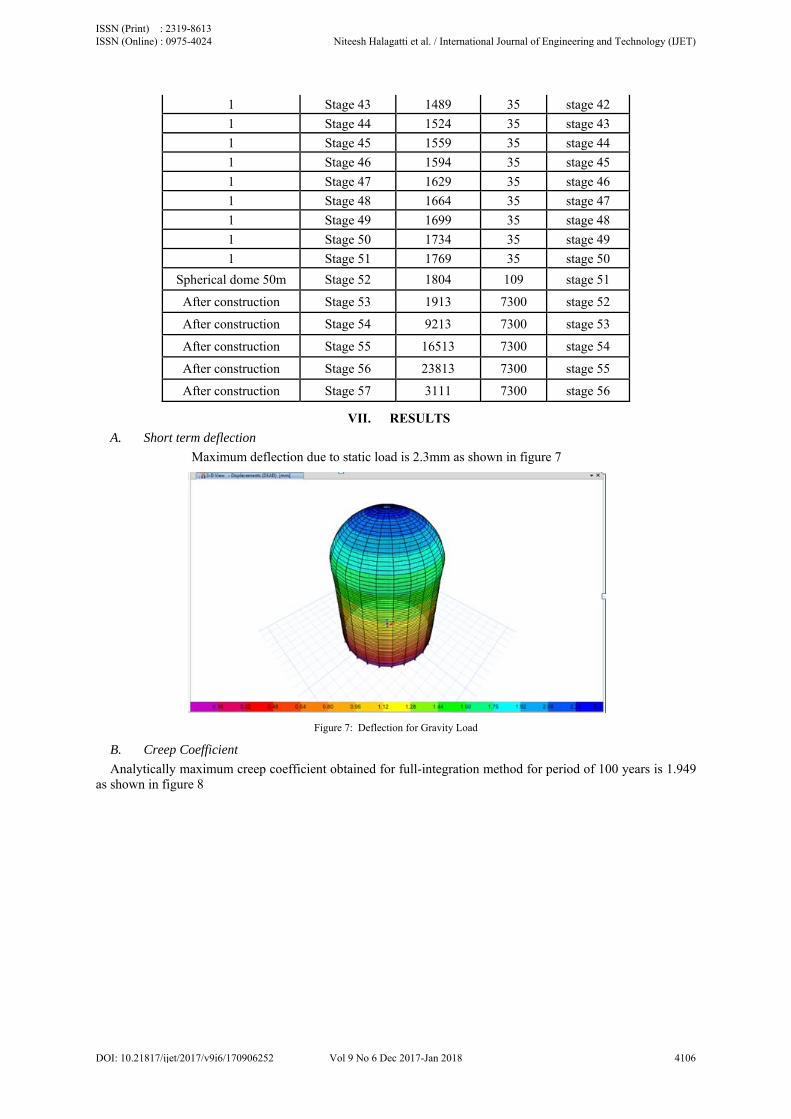
A. Short term deflection
Maximum deflection due to static load is 2.3mm as shown in figure 7
Figure 7: Deflection for Gravity Load
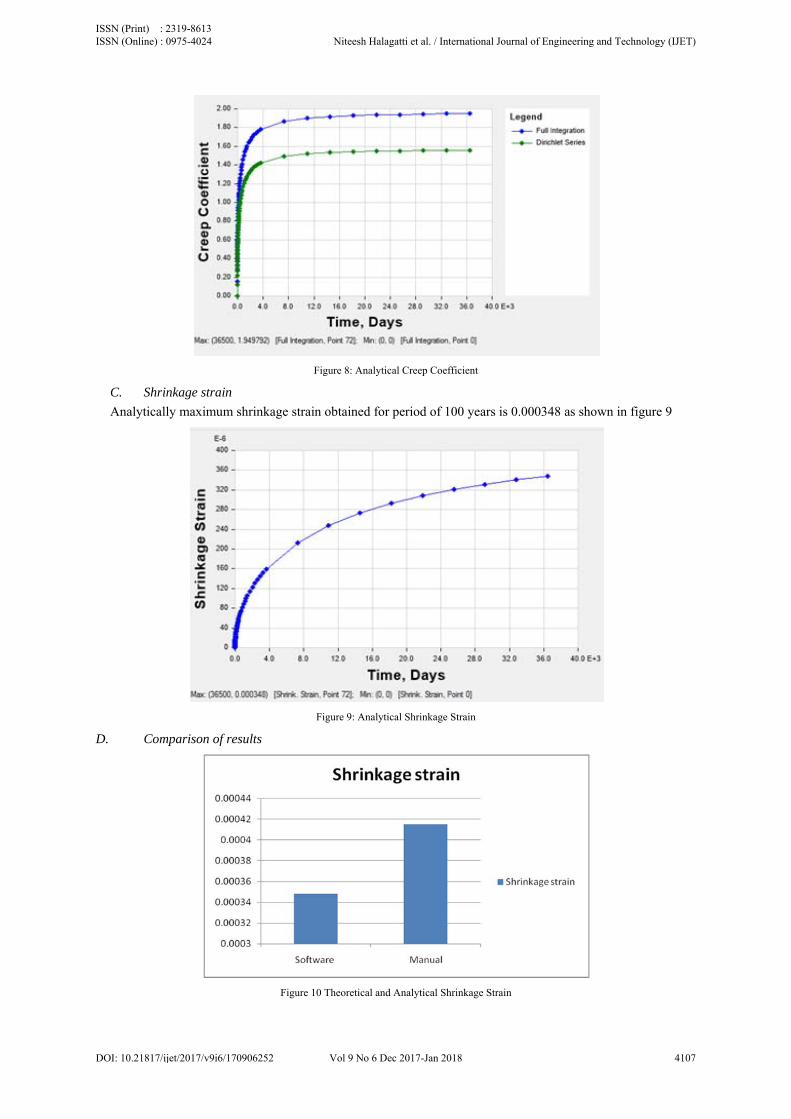
B. Creep Coefficient
Analytically maximum creep coefficient obtained for full-integration method for period of 100 years is 1.949 as shown in figure 8
ISSN (Print) : 2319-8613 ISSN (Online) : 0975-4024 Niteesh Halagatti et al. / International Journal of Engineering and Technology (IJET)
DOI: 10.21817/ijet/2017/v9i6/170906252 Vol 9 No 6 Dec 2017-Jan 2018 4106
Figure 8: Analytical Creep Coefficient
C. Shrinkage strain
Analytically maximum shrinkage strain obtained for period of 100 years is 0.000348 as shown in figure 9
Figure 9: Analytical Shrinkage Strain
D. Comparison of results
Figure 10 Theoretical and Analytical Shrinkage Strain
ISSN (Print) : 2319-8613 ISSN (Online) : 0975-4024 Niteesh Halagatti et al. / International Journal of Engineering and Technology (IJET)
DOI: 10.21817/ijet/2017/v9i6/170906252 Vol 9 No 6 Dec 2017-Jan 2018 4107
Figure 11 Theoretical and Analytical Creep coefficient
E. Temperature
Maximum Temperature load obtained analytically is 12843kN as shown in figure 12
Figure 12 Maximum Temperature Load
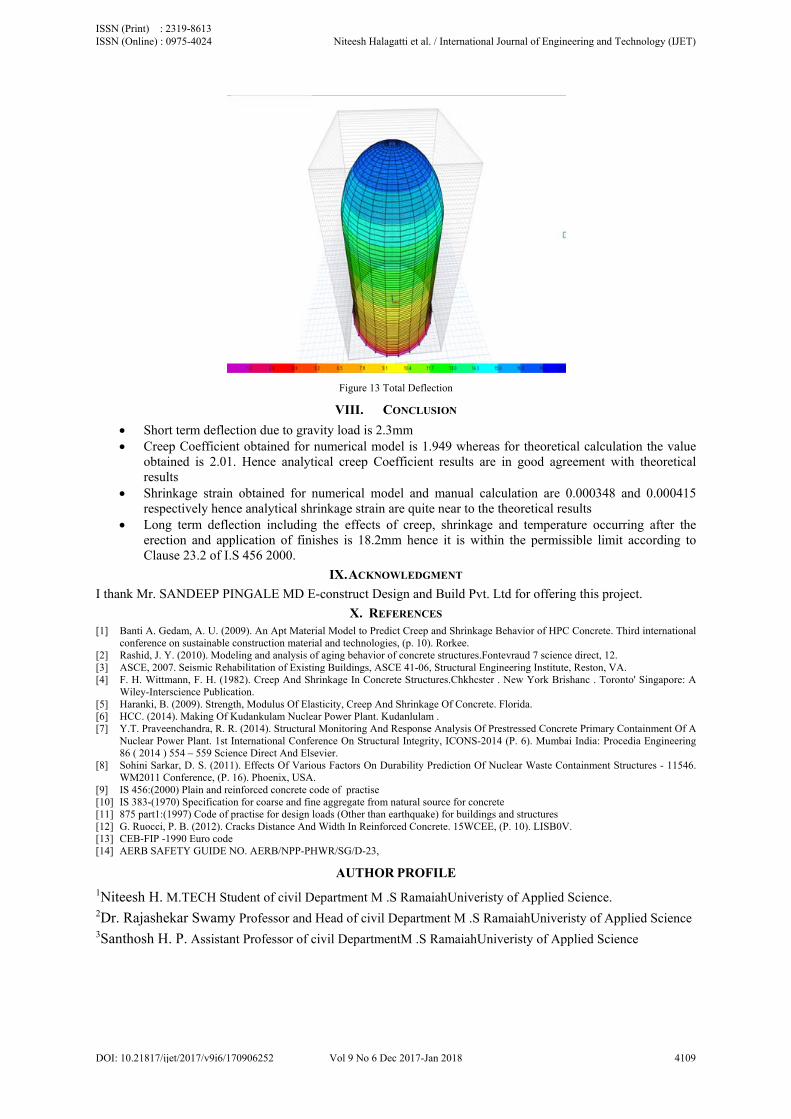
F. Long term deflection:
According to I.S 456 Clause 23.2
The deflection including effects of creep, shrinkage and temperature occurring after the erection and application of finishes should not normally exceed 20mm or span/350 whichever is less
50000/350 (144.3mm) or 20mm > 18.2mm hence deflection for period of 100 years are within permissible limit
As shown in figure 13
1.9
1.92
1.94
1.96
1.98
2
2.02
Software Manual
Creep coefficient
Creep coefficient
ISSN (Print) : 2319-8613 ISSN (Online) : 0975-4024 Niteesh Halagatti et al. / International Journal of Engineering and Technology (IJET)
DOI: 10.21817/ijet/2017/v9i6/170906252 Vol 9 No 6 Dec 2017-Jan 2018 4108
Figure 13 Total Deflection
VIII. CONCLUSION
Short term deflection due to gravity load is 2.3mm Creep Coefficient obtained for numerical model is 1.949 whereas for theoretical calculation the value
obtained is 2.01. Hence analytical creep Coefficient results are in good agreement with theoretical results
Shrinkage strain obtained for numerical model and manual calculation are 0.000348 and 0.000415 respectively hence analytical shrinkage strain are quite near to the theoretical results
Long term deflection including the effects of creep, shrinkage and temperature occurring after the erection and application of finishes is 18.2mm hence it is within the permissible limit according to Clause 23.2 of I.S 456 2000.
IX. ACKNOWLEDGMENT
I thank Mr. SANDEEP PINGALE MD E-construct Design and Build Pvt. Ltd for offering this project.
X. REFERENCES [1] Banti A. Gedam, A. U. (2009). An Apt Material Model to Predict Creep and Shrinkage Behavior of HPC Concrete. Third international
conference on sustainable construction material and technologies, (p. 10). Rorkee. [2] Rashid, J. Y. (2010). Modeling and analysis of aging behavior of concrete structures.Fontevraud 7 science direct, 12. [3] ASCE, 2007. Seismic Rehabilitation of Existing Buildings, ASCE 41-06, Structural Engineering Institute, Reston, VA. [4] F. H. Wittmann, F. H. (1982). Creep And Shrinkage In Concrete Structures.Chkhcster . New York Brishanc . Toronto' Singapore: A
Wiley-Interscience Publication. [5] Haranki, B. (2009). Strength, Modulus Of Elasticity, Creep And Shrinkage Of Concrete. Florida. [6] HCC. (2014). Making Of Kudankulam Nuclear Power Plant. Kudanlulam . [7] Y.T. Praveenchandra, R. R. (2014). Structural Monitoring And Response Analysis Of Prestressed Concrete Primary Containment Of A
Nuclear Power Plant. 1st International Conference On Structural Integrity, ICONS-2014 (P. 6). Mumbai India: Procedia Engineering 86 ( 2014 ) 554 – 559 Science Direct And Elsevier.
[8] Sohini Sarkar, D. S. (2011). Effects Of Various Factors On Durability Prediction Of Nuclear Waste Containment Structures - 11546. WM2011 Conference, (P. 16). Phoenix, USA.
[9] IS 456:(2000) Plain and reinforced concrete code of practise [10] IS 383-(1970) Specification for coarse and fine aggregate from natural source for concrete [11] 875 part1:(1997) Code of practise for design loads (Other than earthquake) for buildings and structures [12] G. Ruocci, P. B. (2012). Cracks Distance And Width In Reinforced Concrete. 15WCEE, (P. 10). LISB0V. [13] CEB-FIP -1990 Euro code [14] AERB SAFETY GUIDE NO. AERB/NPP-PHWR/SG/D-23,
AUTHOR PROFILE 1Niteesh H. M.TECH Student of civil Department M .S RamaiahUniveristy of Applied Science. 2Dr. Rajashekar Swamy Professor and Head of civil Department M .S RamaiahUniveristy of Applied Science 3Santhosh H. P. Assistant Professor of civil DepartmentM .S RamaiahUniveristy of Applied Science
ISSN (Print) : 2319-8613 ISSN (Online) : 0975-4024 Niteesh Halagatti et al. / International Journal of Engineering and Technology (IJET)
DOI: 10.21817/ijet/2017/v9i6/170906252 Vol 9 No 6 Dec 2017-Jan 2018 4109