Page 1
Developing a Canadian Forest Industry Biomass Strategy-
Potential in Biofuels
Task 38- Rotorua, New Zealand- Mar 24, 2004
Australia Bioenergy Association- Sydney,
Australia- Mar 26, 2004
Doug Bradley69 Fulton Avenue ∙Ottawa, Ontario ∙Canada K1S 4Y7
phone ∙ 613.730.1999 email ∙[email protected]
web site ∙ www.climatechangesolutions.net
Page 2
Forest Industry Biomass Strategy
Bioenergy- Forest residue,
agriculture, municipal waste
Forest Industry- Policy,
Competitiveness, Energy….
Page 3
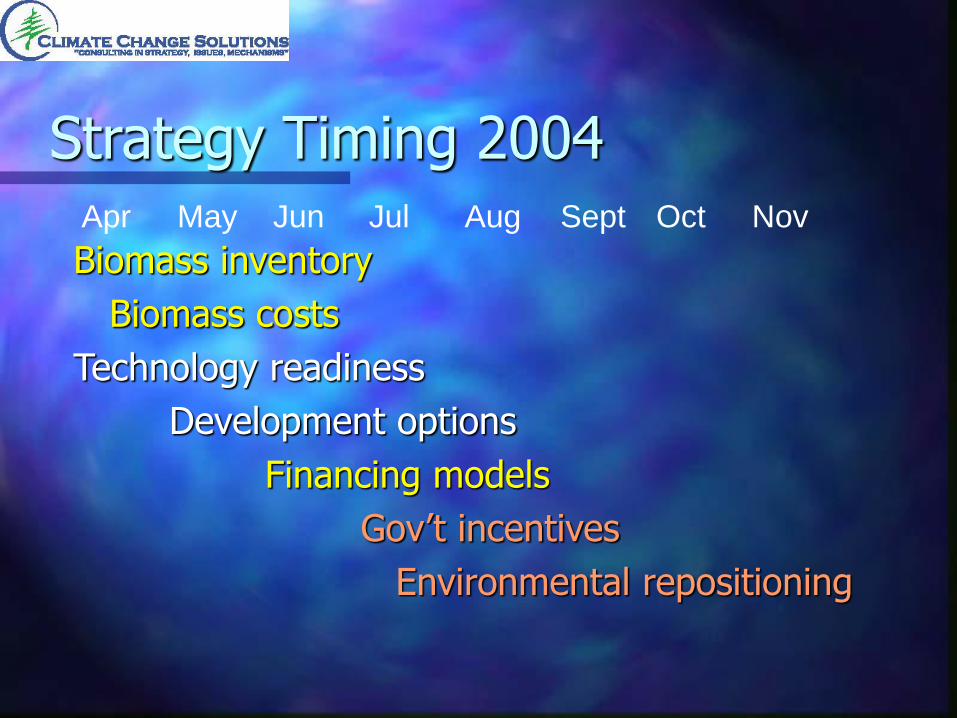
Strategy Timing 2004
Biomass inventory
Biomass costs
Technology readiness
Development options
Financing models
Gov’t incentives
Environmental repositioning
Apr May Jun Jul Aug Sept Oct Nov
Page 4
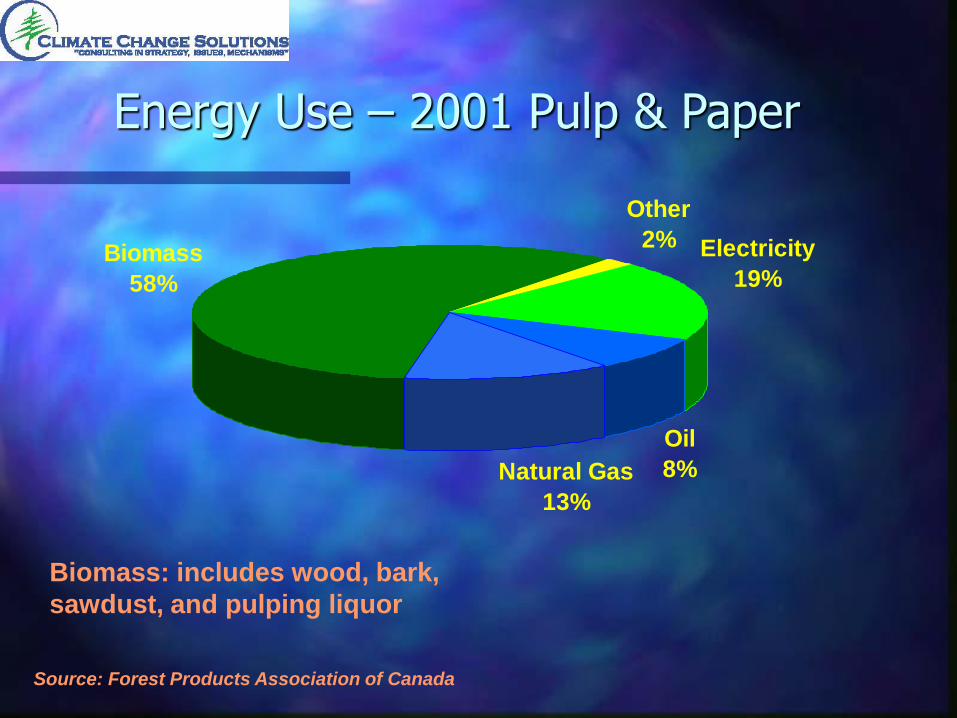
Energy Use – 2001 Pulp & Paper
Oil
8%Natural Gas
13%
Biomass
58%
Other
2% Electricity
19%
Source: Forest Products Association of Canada
Biomass: includes wood, bark,
sawdust, and pulping liquor
Page 5
VolumeBiomass Utilization in Pulp & Paper Industry
9.412.3
9.15.4
0
2
4
6
8
10
12
14
16
18
20
1990 1998
Millio
n B
Dt
pa
Surplus
Use
Page 6
Forest Biomass Supply Potential
MBDT pa
Mill Residues 5.9
Stock piles 0.3
Pulp Sludge 1.0
Forest Floor 0.2*- 43.1**
Total 7.4 – 50.3
* BW McCloy and Associates- Assumes 15% recoverable (12%-chips, 3% energy)
** BIOCAP Canada
Page 7
BC Interior- Mountain Pine Beetle
9 million ha infested- 108 million M3
Page 8
Potential from Forest Floor
Page 9
Location of Harvest Slash
0
0.1
0.2
0.3
0.4
0.5
0.6
0.7
0.8
0.9
1
Ontario Quebec Manitoba British
Columbia
Roadside
At Stump
Page 10
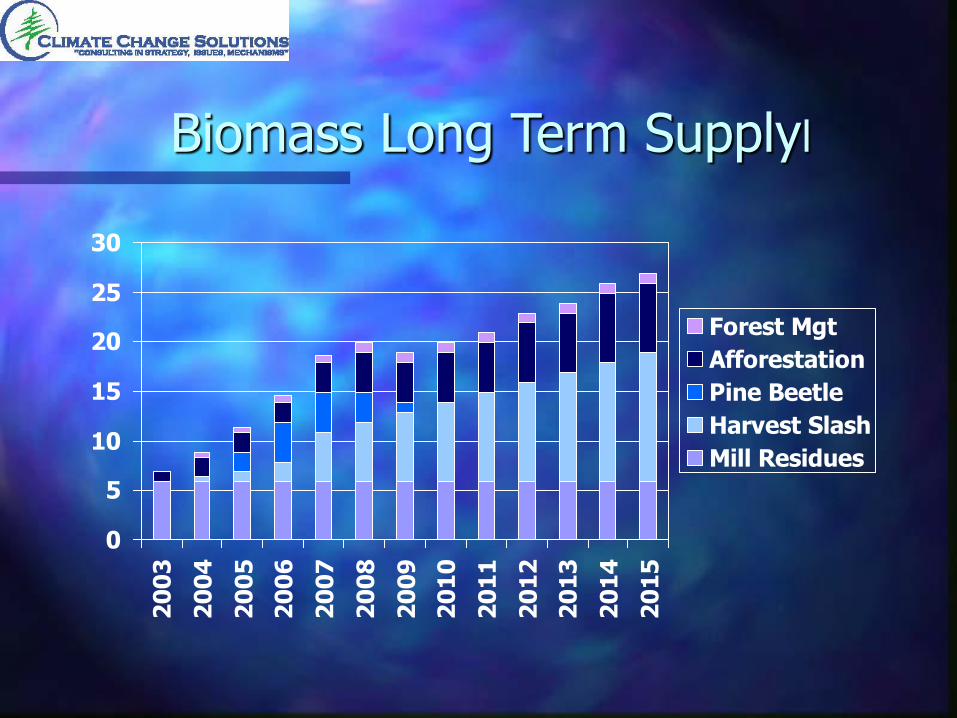
Biomass Long Term Supplyl
0
5
10
15
20
25
30
20
03
20
04
20
05
20
06
20
07
20
08
20
09
20
10
20
11
20
12
20
13
20
14
20
15
Forest Mgt
Afforestation
Pine Beetle
Harvest Slash
Mill Residues
Page 11
Technology Readiness
Direct Combustion
Bio-oil from Fast Pyrolysis- 100 TPD in 2004
Gasification
Bioproducts, biochemicals
Page 12
Biomass Long Term Plan Development Options- hypothetical
0
5
10
15
20
25
30
20
03
20
04
20
05
20
06
20
07
20
08
20
09
20
10
20
11
20
12
20
13
20
14
20
15
Forest Mgt
Afforestation
Pine Beetle
Harvest Slash
Mill Residues
Combustion
Fast Pyrolysis Oil
Gasification
Page 13
Financing Models Needed
Much capital needed
Forest Industry has no money! Focus $capital on core business
Need to explore options to funnel $investment into bioenergy Developer ownership
Joint Ventures
Flow through shares
Oil&gas exploration examples
Page 14
Government Policy Existing
REDI (Renewable Energy Deployment Initiative) max $80,000
Cdn Renewable & Conservation Expenses (Tax)
Tax Depreciation 43.1 for generation equipment
MIP (Market Incentive Program) 40% refund of marketing costs only
10¢ per litre excise tax exemption on ethanol fuel
20% gov’t power purchases from renewable
Wind Power 1¢/KWh production incentive $250 million
Need meaningful incentives Feed-in-tariffs (price premiums)
RPS (Renewable Portfolio Standard)
Grants (capital support)
Page 15
Environmental Repositioning
Loss in Nutrients Most soil nutrients from roots
Most agb nutrients in needles/leaves
Have to eliminate “misinformation”
Particulates- eg. Williams Lake
NGO workshop planned in September
0%
10%
20%
30%
40%
50%
60%
70%
80%
90%
100%
biomass N P
Needles
Branches
Stem
Page 16
Strategy Timing 2004
Biomass inventory
Biomass costs
Technology readiness
Development options
Financing models
Gov’t incentives
Environmental repositioning
Apr May Jun Jul Aug Sept Oct Nov
Page 18
Company founded in 1990
BioTherm™ - a patented fast pyrolysis process that converts
forest and agricultural biomass residue into a liquid fuel
called Bio Oil, char and non-condensable gases.
Independently proven as reliable, replicable and
commercially scaleable
2 plants built (Vancouver Pilots)
2 commercial demo plants under construction (2004)
Aim- low cost producer of bio oil / commoditize technology
and output.
Dynamotive Overview
Page 19
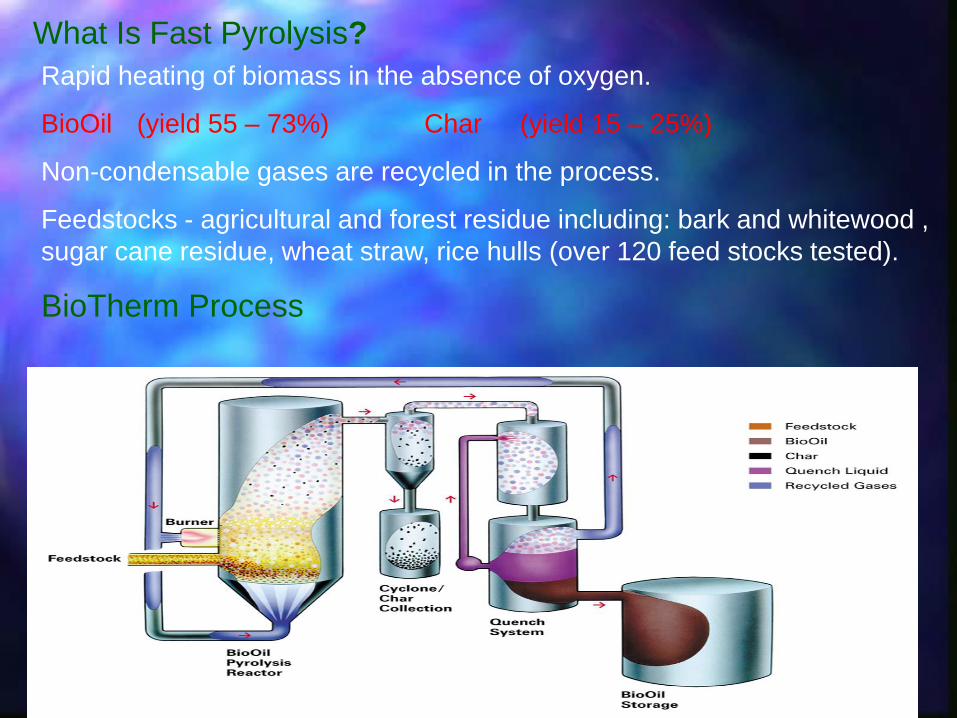
What Is Fast Pyrolysis?
Rapid heating of biomass in the absence of oxygen.
BioOil (yield 55 – 73%) Char (yield 15 – 25%)
Non-condensable gases are recycled in the process.
Feedstocks - agricultural and forest residue including: bark and whitewood ,
sugar cane residue, wheat straw, rice hulls (over 120 feed stocks tested).
BioTherm Process
Page 20
Clean burning CO2 neutral fuel
Alternative to fossil fuel in gas turbines and boilers
Characteristics
No SO2 Emissions
Trace NOx Emissions
Transportable and storable
Produced from non-depleting agricultural and forest biomass
19.5 MJ/litre ( vs 36.9 for light oil)
What is Bio Oil?
Page 21
Electricity and Process Heat
Electricity Export to Grid
Lumber dry kilns, pulp mill lime kilns, diesels
Bio Oil
Bio Oil Refinery
Derivative Products of Bio Oil
Resins / Chemicals / Bio Methanol ++
Europe Japan United States
Green Power Generation
Shipping / Export
of Bio Oil
Char
Heat Briquettes Activated
Carbon
Page 22
15 Tonne Per Day Pilot Plant
Page 23
Installed Capital Cost Projections
$0
$100
$200
$300
$400
$500
$600
$700
BT1
@0.
5 tp
d
BT1
@ 1
.4 tp
d
BT1
@ 2
tpd
S&W
Rep
ort
BT2
@ 1
0 tp
d
BT2
@ 1
5 tp
d
100
tpd
200
tpd
400
tpd
Plant Scale
Estim
ate
d P
rod
uctio
n C
ost
($U
S 1
00
0's
/ tp
d c
ap
acity)
Prod Cost Delta 18Nov02
1996 to 2003 Capital Cost
Progression and Projections
$29
Page 24
1996 to 2003 Production Cost
Progression and Projections.
Production Cost Projections
$10.00
$15.00
$20.00
$25.00
$30.00
Q4/
98
Q4/
99
Q1/
00
Q2/
00
Q3/
00
Q1/
01
Q4/
02
2003
/04
Date of Cost Projection
Fu
lly
Lo
ad
ed
Pro
du
cti
on
Co
st
($U
S/B
OE
@ 4
00
tp
d)
Projected Cost
$14.00 /BOE
Scale up to
Commercial
Prod Cost Reduction 18Nov02 v1* Includes all CAPEX and OPEX with a 15% ROE
*
Page 25
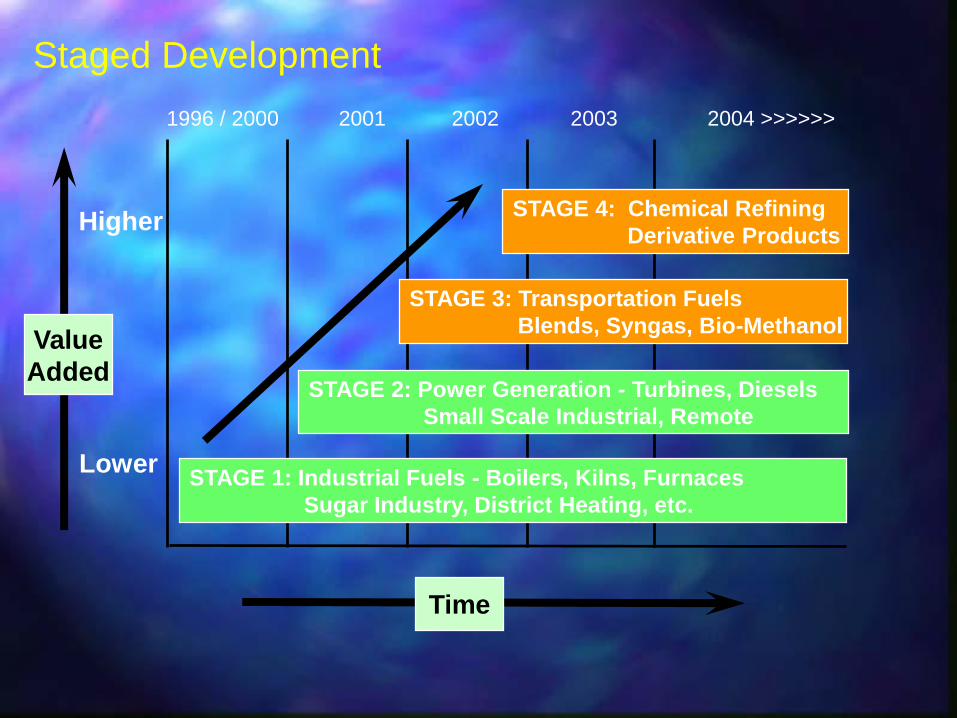
STAGE 1: Industrial Fuels - Boilers, Kilns, Furnaces
Sugar Industry, District Heating, etc.
STAGE 3: Transportation Fuels
Blends, Syngas, Bio-Methanol
STAGE 2: Power Generation - Turbines, Diesels
Small Scale Industrial, Remote
Higher
Lower
Value
Added
STAGE 4: Chemical Refining
Derivative Products
Staged Development
Time
1996 / 2000 2001 2002 2003 2004 >>>>>>
Page 26
R&D Partners: Technology:
Tecna Engineering (Scale up, integration, design)
UMA Engineering (Scale up, design, modularization)
Harper International (Reactor Modeling, scale up, design, construction)
Ramsay Group (Modular fabrication, design)
Resource Transform International (RTI): Technology base
Applications (amongst other):
CanFor: Lumber Kiln applications (Industrial test completed)
Magellan Aerospace Corp, Orenda: Turbine (CHP)
Leading Briquette Manufacturer: Briquette production from char
University of Iowa + Alliant Energy: CHP applications
University of Saskatchewan: Activated Carbon
University of New Hampshire – Bio Oil applications and market opportunity
Bio Mass Refinery: Dr. Desmond Radlein
Success through strategic partnerships
Page 27
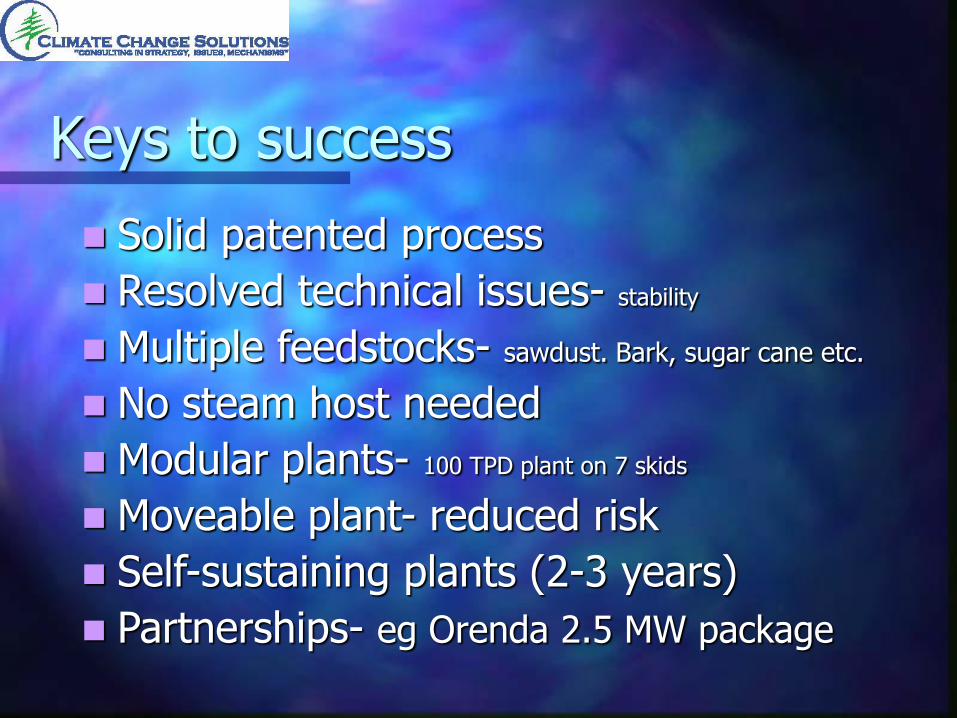
Keys to success
Solid patented process
Resolved technical issues- stability
Multiple feedstocks- sawdust. Bark, sugar cane etc.
No steam host needed
Modular plants- 100 TPD plant on 7 skids
Moveable plant- reduced risk
Self-sustaining plants (2-3 years)
Partnerships- eg Orenda 2.5 MW package
Page 28
First Modular 100 TPD Plant
Page 29
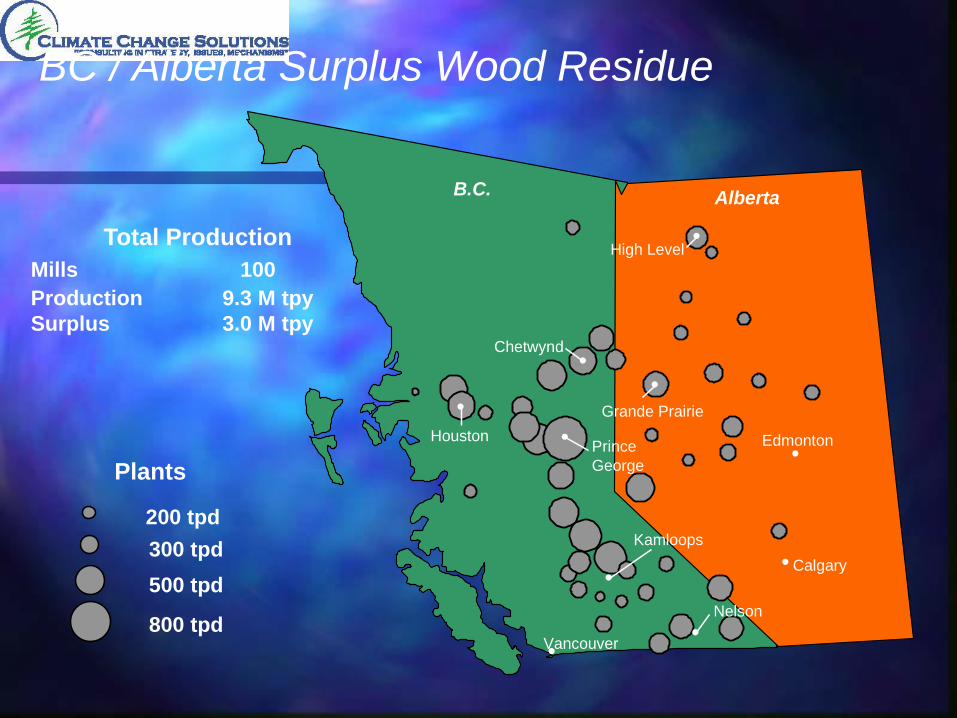
Total Production
Mills 100
Production 9.3 M tpy
Surplus 3.0 M tpyChetwynd
Prince
George
Kamloops
Houston
Vancouver
Grande Prairie
Nelson
Calgary
High Level
Edmonton
B.C. Alberta
BC / Alberta Surplus Wood Residue
200 tpd
300 tpd
500 tpd
800 tpd
Plants
Page 30
Establish DynaMotive’s technology as benchmark.
Complete initial wood based commercial projects, launch bagasse project
Establish order book for plant construction- Canada / US / Europe / Asia / Latin
America.
Launch construction in US, Europe & Latin America. Contract Asia construction
Migrate technology to dirty waste streams (Construction wood waste, Sewage
sludge and animal waste).
Scale reactor for fixed and mobile plant market opportunities.
Launch research into mobile fuel applications. Complete activated carbon and
lime kiln program.
Establish model for biomass reserves, like oil exploration and production model.
Develop bio oil export model / first shipment to Europe from Canada contracted.
Corporate Objectives 2004
Page 31
Establish network of agents / representatives. Support by European desk
in Vancouver Business / Financial Modelling / Technical support.
European Desk: Reports to CEO. Natalia Stepanova (Business
Development), Ivette Vera (Technical support), Nathan Neumer
(Communications). Support Services (Technical Group, Financial Services
Group).
Year 1 Establish fabrication capabilities based on Canadian Model.
Establish Flagship project Export plant from Canada. Feed conditioning
Bruks Klockner, Generation equipment Orenda (70% European content),
integration European Engineering (Three candidates – Spain / Germany).
Agency’s France, Switzerland, Italy, Austria and CIS Countries.
Representation Germany, Sweden, Bulgaria, UK, Poland, Spain, Belgium.
Others to be advised.
Overview European Strategy
Page 32
Dynamotive Development Plan
2 8 18 29 42 580
2,000
4,000
6,000
8,000
10,000
12,000
14,000
16,000
18,000
20,000
TPD
2003 2004 2005 2006 2007 2008
Operating Capacity Projects in Development Plants
Page 33
STAGE 1: Industrial Fuels - Boilers, Kilns, Furnaces
Sugar Industry, District Heating, etc.
STAGE 3: Transportation Fuels
Blends, Syngas, Bio-Methanol
STAGE 2: Power Generation - Turbines, Diesels
Small Scale Industrial, Remote
Higher
Lower
Value
Added
STAGE 4: Chemical Refining
Derivative Products
Staged Development
Time
1996 / 2000 2001 2002 2003 2004 >>>>>>
Page 34
Biomass Refinery
Critical Precursor: Reliable High Quality BioOil Supply
Page 35
Conclusion
Canbio-FPAC promoting bioenergy LT biomass development strategy
Bio-Oil can be major part of strategy
Dynamotive a world leader in fast pyrolysis Excellent process, modular plant design
Global development schedule
New business opportunity for forest industry