University of Groningen Long term dynamics of proteins and peptides Feenstra, Klaas Antoni IMPORTANT NOTE: You are advised to consult the publisher's version (publisher's PDF) if you wish to cite from it. Please check the document version below. Document Version Publisher's PDF, also known as Version of record Publication date: 2002 Link to publication in University of Groningen/UMCG research database Citation for published version (APA): Feenstra, K. A. (2002). Long term dynamics of proteins and peptides Groningen: s.n. Copyright Other than for strictly personal use, it is not permitted to download or to forward/distribute the text or part of it without the consent of the author(s) and/or copyright holder(s), unless the work is under an open content license (like Creative Commons). Take-down policy If you believe that this document breaches copyright please contact us providing details, and we will remove access to the work immediately and investigate your claim. Downloaded from the University of Groningen/UMCG research database (Pure): http://www.rug.nl/research/portal. For technical reasons the number of authors shown on this cover page is limited to 10 maximum. Download date: 02-04-2018
Transcript
University of Groningen
Long term dynamics of proteins and peptidesFeenstra, Klaas Antoni
IMPORTANT NOTE: You are advised to consult the publisher's version (publisher's PDF) if you wish to cite fromit. Please check the document version below.
Document VersionPublisher's PDF, also known as Version of record
Publication date:2002
Link to publication in University of Groningen/UMCG research database
Citation for published version (APA):Feenstra, K. A. (2002). Long term dynamics of proteins and peptides Groningen: s.n.
CopyrightOther than for strictly personal use, it is not permitted to download or to forward/distribute the text or part of it without the consent of theauthor(s) and/or copyright holder(s), unless the work is under an open content license (like Creative Commons).
Take-down policyIf you believe that this document breaches copyright please contact us providing details, and we will remove access to the work immediatelyand investigate your claim.
Downloaded from the University of Groningen/UMCG research database (Pure): http://www.rug.nl/research/portal. For technical reasons thenumber of authors shown on this cover page is limited to 10 maximum.
Flavoproteins are an interesting class of enzymes for studying the dynamic behavior ofbiomacromolecules. One reason for this is the large amount of detailed information onboth catalytic mechanism and atomic structure that is available for many members of thiswide-spread family of redox enzymes. The feature which makes these enzymes particularlysuitable for investigating the role of conformational dynamics in catalysis is the flavincofactor itself. This prosthetic group is not only the redox-active group situated in theheart of the active site, but it is also a naturally fluorescent group that emits green light.In the last decade, time-resolved fluorescence and fluorescence anisotropy studies haveyielded information on the dynamics of the active site of a variety of flavoproteins (for anoverview see Van den Berg & Visser95 and Van den Berg et al.96).
A complicating factor in studying the fluorescence properties of these enzymes is thefact that in most flavoproteins the flavin cofactor is non-covalently bound. In principleit is thus possible to detect fluorescence from the free cofactor as well as the protein-bound one. In enzymes such as glutathione reductase (GR), lipoamide dehydrogenase andthioredoxin reductase (TrxR), the dissociation constant for the flavin cofactor is very low(pM-nM range). For these enzymes, careful sample preparation is sufficient to avoid tracesof free flavin. However, in other flavoenzymes such as ferredoxin NADPH-reductase (FNR)and para-hydroxybenzoate hydroxylase, the flavin is less tightly bound. In these cases,the presence of free flavin has to be taken into account, especially when the fluorescencequantum yield of the free flavin cofactor is high compared to that of the protein-boundcofactor. For this, knowledge of the fluorescence properties of free flavin cofactors underthe experimental conditions used is required.
For several decades, the physical properties of isoalloxazine ring and the two mostcommon flavin cofactors, flavin mononucleotide (fmn) and flavin adenine dinucleotide(fad, Fig. 7.1) have been subject of investigation (for reviews on electronic and struc-tural properties of flavins we refer to Song;97 Leijonmarck;98 and references therein). Theremarkably low fluorescence of fad with respect to free riboflavin was first reported byWeber.99 An intramolecular ground-state complex between the isoalloxazine ring and theadenine moiety was proposed to prevail in aqueous solution, resulting in the formationof a non-fluorescent complex. In steady state fluorescence experiments, the fluorescencequantum yield of fad was found to be 9 times lower than that of fmn. By enzymatic di-gestion of the diphosphate bridge of the fad molecule the fluorescence intensity increasedto equal that of free fmn. From these experiments it was proposed that fad exists intwo conformations; a so called ’closed’ conformation, in which the isoalloxazine and ade-nine rings interact through π-π interactions in a stacked conformation resulting in veryefficient fluorescence quenching, and an extended, ’open’ conformation that is responsiblefor the (remaining) fluorescence of fad. In solution, the fad molecule is considered to bepredominantly in the stacked conformation. Under the assumption that the equilibriumof stacking and unstacking is the same in ground state and first excited state, it can bereasoned that about 80% of the fad molecules are in the closed conformation and that thelifetime of this intramolecular complex is 27 ns.100 Dispersion forces are considered to bethe principal factor favoring flavin-adenine stacking. Strong acidic conditions, non-polarsolvents and even polar solvents such as formamide have been reported to prevent complex
Figure 7.1: Representation of fad includ-ing atomic labeling. The fmn and ampmoieties are indicated separately, as wellas nomenclature for various other moi-eties. Atom labels for the amp moietyare prepended by an ‘A’ when referred toin the text.
Although the existence of an ’open’ and ’closed’ conformation of the fad molecule isnow generally accepted, little is known about the structural details and conformationaldynamics in solution. Crystallographic studies on the complex between free riboflavin andadenosine102,103 revealed an average structure of the π-π stacked isoalloxazine and ade-nine ring systems under crystal packing forces. In aqueous media, support for a stackedconformation was obtained from ultraviolet resonance Raman spectroscopy, where bothchromophores showed Raman hypochromism.104 From nmr studies, different models wereproposed for the interaction between the flavin and adenine moieties, including both in-tramolecular stacking,105,106 and parallel intramolecular hydrogen bonding between thepyrimidine-like ring of the flavin involving N3 and O4, and the adenine NH2 and N7.107 Allnmr studies, however, were complicated by the tendency of flavins to form intermolecularcomplexes at millimolar concentrations.
Early time-resolved fluorescence measurements have provided a picture consistentwith the dynamic model proposed by Weber and co-workers. Decay analysis of fmnrevealed a fluorescence lifetime of 4.7 ns, while fad yielded two lifetime components ofresp. 2.8 ns (72 %) and 0.3 ns (28 %).108 In the last decade, technical progress has provideda broader time-window to sample the dynamics of the excited state. In this paper, theflavin cofactors are therefore re-examined using sub-nanosecond resolved time-correlatedsingle photon counting experiments. Fluorescence lifetime properties, however, relate tothe ensemble of molecules, and do not yield information on the atomic level. For properunderstanding of the process of stacking and the effect of dynamics on the lifetime of theexcited state, a more detailed picture is needed.
7.1.1 Outline of the Method
In this study we have investigated the structural dynamics of fad using a combination oftime-resolved fluorescence and md simulations. Polarized (sub)nanosecond-resolved fluo-rescence experiments under various temperature and solvent conditions yield experimentaldata on the dynamic behavior of the flavin cofactor. Nanosecond molecular dynamics sim-ulations in water give insight into the dynamic behavior of the fad molecule. Changesin the charge distribution were applied to mimic the electronic effect of transition fromthe ground state to the excited state following light absorption109 and to investigate itseffect on the dynamics of the molecule. Special attention was given to the interrelation be-tween the md data and fluorescence data in terms of fluorescence quenching and rotationalbehavior.
Fad and fmn of the highest purity available were purchased from Sigma. A Biogel P2column (Biorad) equilibrated with the appropriate measuring buffer, was used prior tothe fluorescence experiments to remove possible traces of degradation products of fad.Chromatography experiments with fmn using fluorescence detection showed that fmndid not contain any fluorescent impurities. All measurements were carried out in 50 mMpotassium phosphate buffer pH 7.5, except for the control experiments performed in D2O.Buffers were made from nanopure-grade water (Millipore) and were filtered through a0.22 µm filter (Millipore). The samples had a maximum od of 0.10 at the wavelengthof excitation. The concentration was calculated from the molar extinction coefficient,resp. ε450,FAD = 11.3 mM−1cm−1 and ε445,FMN = 12.5 mM−1cm−1.110 Fluorescent gradeglycerol was purchased from Merck. Sample preparations were performed at 277 K in thedark.
(Sub)nanosecond Polarized Fluorescence
Time-correlated single photon counting (tcspc) was used to detect polarized time-resolvedfluorescence on a (sub)nanosecond time-scale. Details of both the set-up and measurementsprocedures are described elsewhere,111,112 and only a short outline will be given below. Amode-locked cw Nd:YLF laser was used to synchronously pump a cavity-dumped dye laser.Vertically polarized light of 450 nm (Stilbene 420) or 460 nm (Coumarine) was used toexcite the sample with a frequency of 594 kHz and a duration of 4 ps fwhm. The excitationintensity was adjusted to yield a detection frequency of 30 kHz in the parallel component.Parallel and perpendicular polarized fluorescence were detected through resp. 557.9 nm(for excitation at 450 nm) or 526.0 nm (for excitation at 460 nm) interference filter (Schott,Mainz, Germany, half band width of 11.8 nm) in combination with kv 520 cut-off filter(Schott). fmn data and regular fad data were collected in a multichannel analyzer with atime-window of 1024 channels at typically 15− 20 ps/channel. For a better determinationof the ultra-short fluorescence lifetime of fad a time-window of 8000 channels at typically3−4 ps/channel was used. The dynamic instrumental response of the set-up was obtainedat the emission wavelength using erythrosine B in water (τ = 80 ps at 293 K) as a referencecompound.113 This instrumental response function is approximately 40 ps fwhm, whichmakes registration of 5 − 10 ps lifetime components realistic. The temperature of thesamples was controlled using a liquid nitrogen flow set-up with a temperature controller(model itc4, Oxford Instruments Inc., Oxford, United Kingdom).
Analysis of the fluorescence intensity decay I(t) and anisotropy decay r(t) was per-formed with a model of discrete exponentials using the ’Trfa Data Processing package’of the Scientific Software Technologies Center of Belarussian State University, Belarus.Global analysis of the total fluorescence decay was performed through linking the fluo-rescence lifetime constants for multiple data sets, global analysis of the anisotropy decay
through linking the rotational correlation time constants. In addition, data were analyzedthrough the maximum entropy method (software package from Maximum Entropy Solu-tions Ltd. Ely, United Kingdom), in terms of distributions of decay times, for which noa priori knowledge of the system is required (Brochon, 1994). The average fluorescencelifetime 〈τ〉 was calculated from the lifetime spectrum α(τ) according to
〈τ〉 =
N∑i=1
αiτi
N∑i=1
αi
(7.1)
where N is the number of τi values of the α(τ) spectrum. The relative fluorescencequantum yield Q was determined from the tcspc data as:
QFAD
QFMN=
〈τ〉FAD
〈τ〉FMN(7.2)
A detailed description of the principles of the analysis of the polarized fluorescence datacan be found elsewhere.111,112,114
7.2.2 Simulations
Force Field
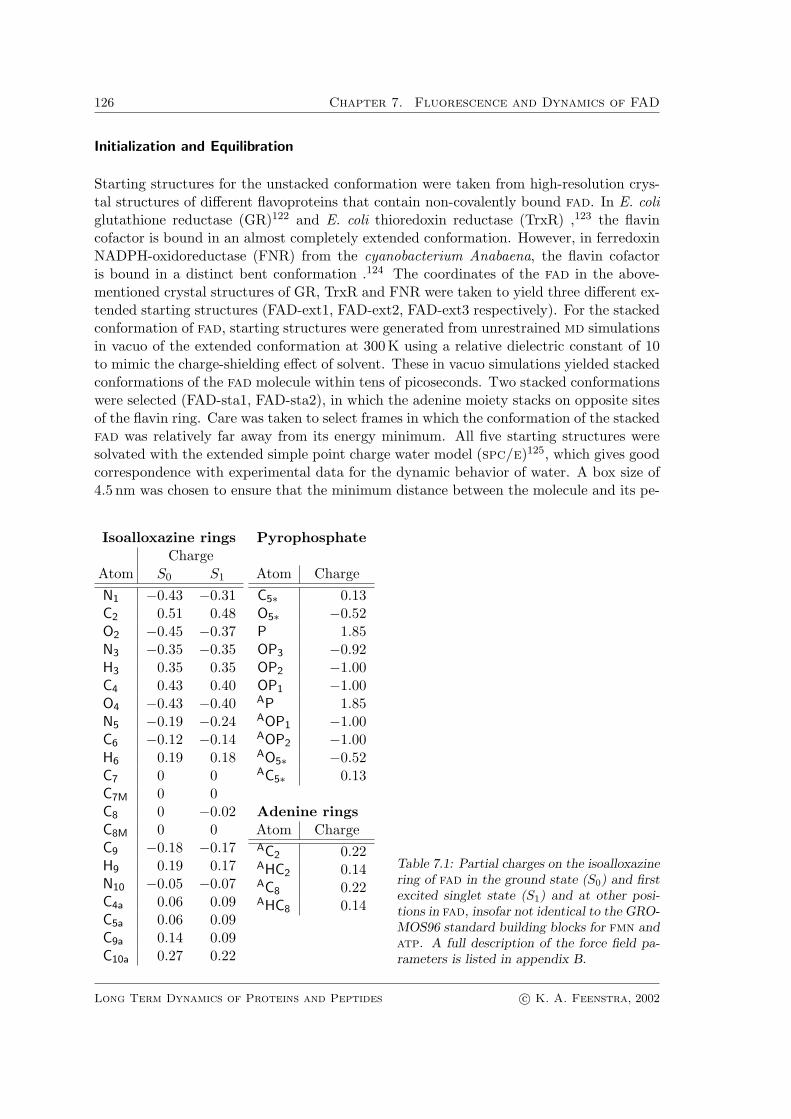
The md simulations were performed with the gromacs 2.0 software.35 The parameter setfor fad was constructed from parameters taken from the standard building blocks of thegromos-96 forcefield for fmn and atp.63 Bond lengths, angle and proper and improperdihedral definitions and parameters from the fmn and atp building blocks were used. Forthe adenosine moiety and the ribityl chain (from C1 to C5) partial charges were taken fromthe gromos-96 force field. Hydrogen atoms on the adenine and isoalloxazine rings weredefined explicitly.115 Improper dihedrals were added to the bonds on N5 and N10 of flavinring B (see Fig. 7.1), in accordance with the planar structure observed in crystallographicdata and molecular geometry optimizations of flavin in the oxidized state.116,117 Partialcharges on the flavin ring in the ground state and the first excited triplet state were basedon ab initio molecular orbital calculations in vacuo on isoalloxazine,118 and semi-empiricalmindo-3 calculations on lumiflavin (7,8,10-trimethylisoalloxazine)119,120 (see Table 7.1).The charge distribution in the first excited singlet state is similar to that of the firstexcited triplet state.119 Partial charges for the pyrophosphate moiety were taken from abinitio molecular orbital calculations on Pi4 (Pi4).121 A full description of the forcefieldparameters, insofar not identical to the gromos-96 standard building blocks for fmn andatp, is given in Table 7.1. A complete description of all force field parameters used isavailable in appendix B.
Starting structures for the unstacked conformation were taken from high-resolution crys-tal structures of different flavoproteins that contain non-covalently bound fad. In E. coliglutathione reductase (GR)122 and E. coli thioredoxin reductase (TrxR) ,123 the flavincofactor is bound in an almost completely extended conformation. However, in ferredoxinNADPH-oxidoreductase (FNR) from the cyanobacterium Anabaena, the flavin cofactoris bound in a distinct bent conformation .124 The coordinates of the fad in the above-mentioned crystal structures of GR, TrxR and FNR were taken to yield three different ex-tended starting structures (FAD-ext1, FAD-ext2, FAD-ext3 respectively). For the stackedconformation of fad, starting structures were generated from unrestrained md simulationsin vacuo of the extended conformation at 300K using a relative dielectric constant of 10to mimic the charge-shielding effect of solvent. These in vacuo simulations yielded stackedconformations of the fad molecule within tens of picoseconds. Two stacked conformationswere selected (FAD-sta1, FAD-sta2), in which the adenine moiety stacks on opposite sitesof the flavin ring. Care was taken to select frames in which the conformation of the stackedfad was relatively far away from its energy minimum. All five starting structures weresolvated with the extended simple point charge water model (spc/e)125, which gives goodcorrespondence with experimental data for the dynamic behavior of water. A box size of4.5 nm was chosen to ensure that the minimum distance between the molecule and its pe-
Table 7.1: Partial charges on the isoalloxazinering of fad in the ground state (S0) and firstexcited singlet state (S1) and at other posi-tions in fad, insofar not identical to the GRO-MOS96 standard building blocks for fmn andatp. A full description of the force field pa-rameters is listed in appendix B.
riodic images was larger than the cut-off used for the Lennard-Jones interactions (1.0 nm).Depending on the starting structure, the number of water molecules varied between 2407and 2415. In the next step, energy minimization was carried out using a steepest descentalgorithm. Two Na+ ions were added to the system to compensate for the two negativecharges on the phosphate groups, by replacing the two water molecules with the lowestelectrostatic potential. The solvent was pre-equilibrated during 20− 30 ps to yield a pres-sure of 1 bar at 300 K, using weak coupling to both an external pressure and temperaturebath24 with harmonic constraints on the atomic coordinates of the fad molecule. A cut-off for Lennard-Jones interactions and short-range electrostatic interactions of 1.0 nm wasapplied. During neighbor-list updates, every 20 fs long-range electrostatics were calculatedwith a cut-off of 1.6 nm. After equilibration, the length of the box edges was in between4.16 and 4.18 nm.
Production Simulations
MD simulations were carried out starting from each of the 5 different starting structures– three in an extended conformation, and two in a stacked conformation – with groundstate charges at 300K. Lennard-Jones and short-range electrostatic interactions were cal-culated using a cut-off of 1.0 nm. Long range electrostatic interactions were calculated
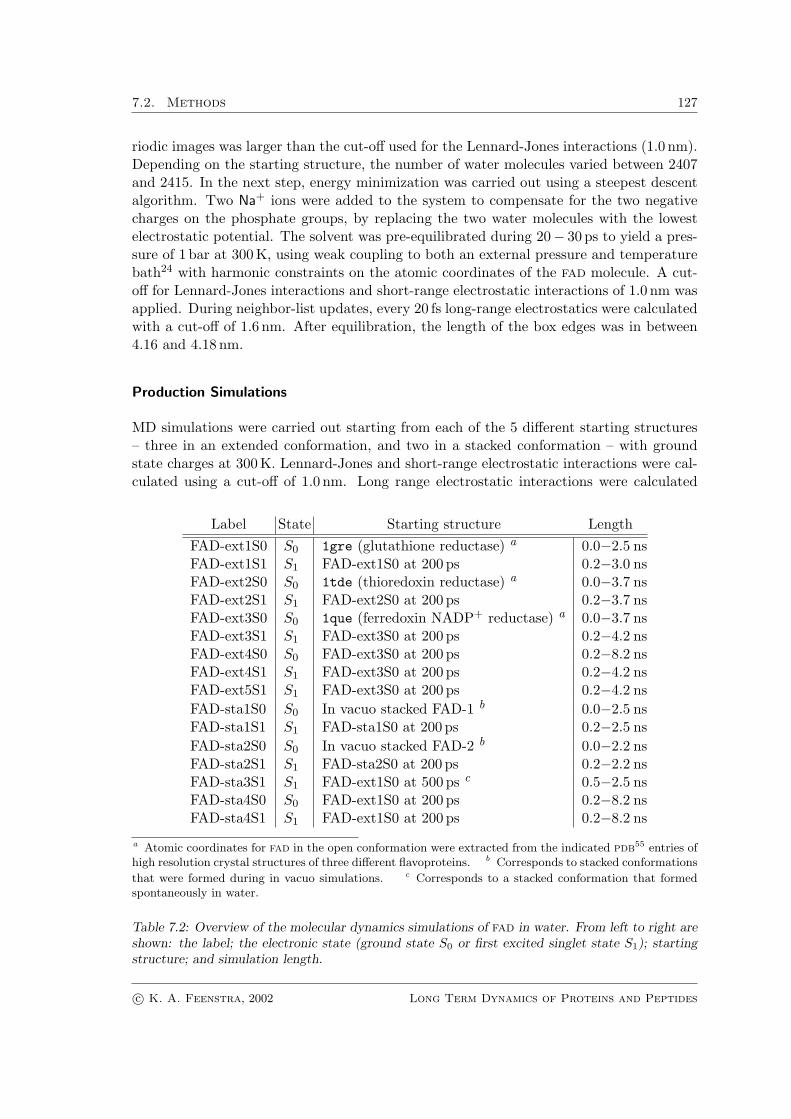
Label State Starting structure LengthFAD-ext1S0 S0 1gre (glutathione reductase) a 0.0−2.5 nsFAD-ext1S1 S1 FAD-ext1S0 at 200 ps 0.2−3.0 nsFAD-ext2S0 S0 1tde (thioredoxin reductase) a 0.0−3.7 nsFAD-ext2S1 S1 FAD-ext2S0 at 200 ps 0.2−3.7 nsFAD-ext3S0 S0 1que (ferredoxin NADP+ reductase) a 0.0−3.7 nsFAD-ext3S1 S1 FAD-ext3S0 at 200 ps 0.2−4.2 nsFAD-ext4S0 S0 FAD-ext3S0 at 200 ps 0.2−8.2 nsFAD-ext4S1 S1 FAD-ext3S0 at 200 ps 0.2−4.2 nsFAD-ext5S1 S1 FAD-ext3S0 at 200 ps 0.2−4.2 nsFAD-sta1S0 S0 In vacuo stacked FAD-1 b 0.0−2.5 nsFAD-sta1S1 S1 FAD-sta1S0 at 200 ps 0.2−2.5 nsFAD-sta2S0 S0 In vacuo stacked FAD-2 b 0.0−2.2 nsFAD-sta2S1 S1 FAD-sta2S0 at 200 ps 0.2−2.2 nsFAD-sta3S1 S1 FAD-ext1S0 at 500 ps c 0.5−2.5 nsFAD-sta4S0 S0 FAD-ext1S0 at 200 ps 0.2−8.2 nsFAD-sta4S1 S1 FAD-ext1S0 at 200 ps 0.2−8.2 ns
a Atomic coordinates for fad in the open conformation were extracted from the indicated pdb55 entries ofhigh resolution crystal structures of three different flavoproteins. b Corresponds to stacked conformations
that were formed during in vacuo simulations. c Corresponds to a stacked conformation that formedspontaneously in water.
Table 7.2: Overview of the molecular dynamics simulations of fad in water. From left to right areshown: the label; the electronic state (ground state S0 or first excited singlet state S1); startingstructure; and simulation length.
during the neighbor-list update, every 20 fs using the Particle-Particle Particle-Mesh ap-proach (pppm).126,127 A time-step of 2 fs was used. After 200 ps the simulations wereforked. In one fork, the charges on the isoalloxazine ring were reassigned to correspond tothe first excited singlet state (Table 7.1) in order to mimic the electronic effects of lightabsorption. In the other, the ground state charges were maintained. A summary of thesimulations performed is presented in Table 7.2. An eleventh run (FAD-sta3) was gener-ated using the conformation of fad from the ground-state md run of starting structureFAD-ext1S0 that had spontaneously stacked in water. In this simulation, the process oflight absorption was simulated using the time frame at 500 ps, where the molecule was inan equilibrated stacked state. In order to estimate the relative free energy difference be-tween the open and the closed conformation in the ground and excited states, trajectoriesof several nanoseconds in which the molecule remained in the open or closed conforma-tion were required. In order to obtain more sampling in the open conformation, threeadditional runs (FAD-ext4S0, FAD-ext4S1, FAD-ext5S1) were performed starting fromFAD-ext3S0 (200 ps frame), using different starting velocities. Two additional simulationsin the stacked conformation (FAD-sta4S0 and FAD-sta4S1) starting from trajectory FAD-sta3S1 (500 ps frame) were performed. Simulations were run for lengths from 2 to 8 ns,with a total simulation time of ∼ 65 ns. An overview of the characteristic parameters ofthe runs is presented in Table 7.2.
Analysis
Stacked conformations were defined as having a maximum distance between the center ofmass of the adenine rings to the plane of the isoalloxazine rings (see Fig. 7.1) of 0.6 nm.
For calculating the planarity of the flavin ring, the angle between the benzene-likeand pyrimidine-like rings of the isoalloxazine ring (rings A and C respectively in Fig. 7.1)was taken from the C8-C5a and C10a-N3 vectors. The angle between the isoalloxazine ringand adenine ring was taken from the angle between the planes defined by N5, C9a andC10a from the flavin and AN1, AC2 and AC8 from the adenine respectively. The rotationalcorrelation time of the isoalloxazine ring was calculated using the vector C8-N3 which isvery close to the direction of the emission dipole moment.128
Hydrogen bonds were determined using a simple distance and angle cut-off criterion(distance donor-acceptor = 0.35 nm and angle hydrogen-donor-acceptor = 60 ◦).39 To re-fine the information on hydrogen-bonding, the trajectories were analyzed for hydrogenbonds between the different regions of the fad (flavin ring, ribityl chain, phosphodi-ester bond, ribofuranosyl and adenine part) separately. Cluster analysis of the ribityl-pyrophosphate-ribofuranosyl chain was performed on the atomic positional root-mean-square differences (rmsd) of different backbone conformations from the simulations. Armsd cut-off for the rmsd of 0.1 nm was used for determining neighbouring conformations.Cluster analysis was performed according to the following procedure: For each conforma-tion, the number of neighbors is determined. The conformation with the largest number ofneighbors is the central structure of the first cluster, and all its neighbors are members ofthat cluster. These conformations are removed from the pool of all conformations and theprocedure is repeated to generate subsequent clusters until the pool is empty. A complete
description of this clustering algorithm has been given by Daura et al.82
The relative free energy difference between the open and closed conformation for theground state and excited state (∆∆G
S0/S1
o/cl ) was calculated using a free energy perturbationapproach129 in conjunction with the following thermodynamic cycle:
Open-S1
∆Go→cl,S1−−−−−−−→ Closed-S1
∆GS0→S1,o
x x∆GS0→S1,cl
Open-S0 −−−−−−−→∆Go→cl,S0
Closed-S0
Scheme 7.1
Since the open/closed equilibrium (corresponding to ∆Go→cl,S0 and ∆Go→cl,S1) is computa-tionally inaccessible, the free energy differences are calculated by perturbing the electronicstate in the open and closed ensemble respectively (∆GS0→S1,o and ∆GS0→S1,cl) in a singlestep and using the following relation:
where ∆GS0→S1,o and ∆GS0→S1,cl are calculated from:
∆GS0→S1,cl = GS1,cl −GS0,cl = −R T ln
⟨e−
ES1−ES0
R T
⟩S0,cl
(7.4)
where 〈· · · 〉S0,cl denotes the average over the ensemble of configurations in the closed andthe ground state (S0), and ES0 and ES1 stand for the energy of the conformations ofthe ensemble in the ground and excited state respectively. Four reference states wereconsidered. The open and closed states, in ground and excited states respectively, wereperturbed to the opposite electronic state in a manner analogous to that described above.From this, using eqn. 7.4 four free energy differences are calculated (vis. ∆GS0→S1,cl,∆GS0→S1,o, ∆GS1→S0,cl and ∆GS1→S0,o). ∆GS0→S1,cl and ∆GS1→S0,cl should converge tothe same value, and likewise ∆GS0→S1,o and ∆GS1→S0,o should. From these convergedvalues, the ∆∆G
S0/S1
o/cl can be calculated and the measure of convergence is a measure forthe accuracy.
7.3 Results
7.3.1 Fluorescence Dynamics
Polarized sub-nanosecond resolved tcspc data of fad reveal excited state dynamics over awider time-range than earlier studies performed at a lower time-resolution108 While anal-ysis of the essentially non-quenched fluorescence decay of fmn confirms a predominantlifetime component of 4.8 ns, analysis of the extraordinarily heterogeneous fluorescencedecay of fad in terms of discrete exponentials yields a lifetime pattern with componentscovering the dynamic range from picoseconds up to several nanoseconds (Table 7.3). Ul-trafast fluorescence quenching is reflected in the steep leading edge of the experimental
a Data suggested the possibility of a third fluorescence lifetime component of a few ps atthe border of the detection limit that could not clearly be resolved.
Table 7.3: Fluorescence lifetimes (τi) and rotational correlation times (φ) of fad and fmn asa function of temperature and solvent composition. Standard experiments were performed in50 mM potassium phosphate buffer at pH 7.5. Presented are time constants (τi) and fractionalcontributions (αi) of the fluorescence lifetime components as obtained from global analysis ofmultiple experiments. The values in the parentheses are obtained from a rigorous error analysisat the 67 % confidence level as described by Beechem.130 For components with low amplitudesupper confidence limits were not always found. For the fractional contributions αi, the standarddeviation is given.
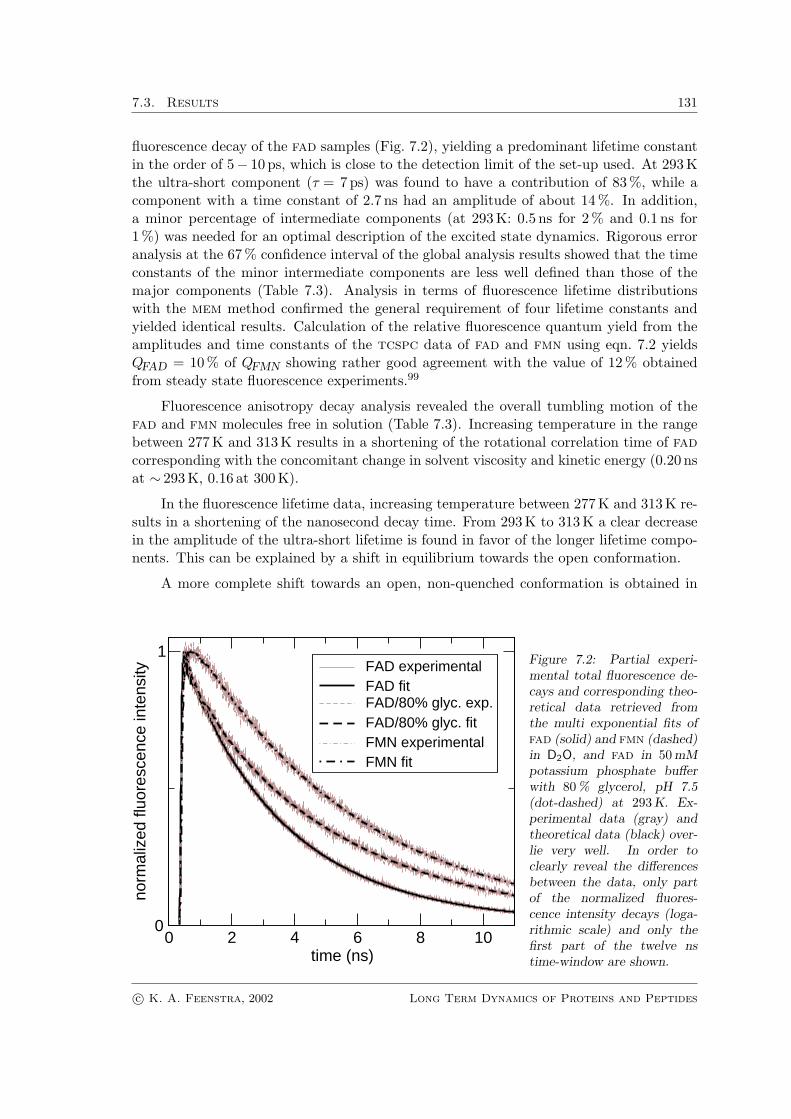
fluorescence decay of the fad samples (Fig. 7.2), yielding a predominant lifetime constantin the order of 5− 10 ps, which is close to the detection limit of the set-up used. At 293Kthe ultra-short component (τ = 7 ps) was found to have a contribution of 83 %, while acomponent with a time constant of 2.7 ns had an amplitude of about 14 %. In addition,a minor percentage of intermediate components (at 293K: 0.5 ns for 2 % and 0.1 ns for1 %) was needed for an optimal description of the excited state dynamics. Rigorous erroranalysis at the 67% confidence interval of the global analysis results showed that the timeconstants of the minor intermediate components are less well defined than those of themajor components (Table 7.3). Analysis in terms of fluorescence lifetime distributionswith the mem method confirmed the general requirement of four lifetime constants andyielded identical results. Calculation of the relative fluorescence quantum yield from theamplitudes and time constants of the tcspc data of fad and fmn using eqn. 7.2 yieldsQFAD = 10 % of QFMN showing rather good agreement with the value of 12 % obtainedfrom steady state fluorescence experiments.99
Fluorescence anisotropy decay analysis revealed the overall tumbling motion of thefad and fmn molecules free in solution (Table 7.3). Increasing temperature in the rangebetween 277 K and 313 K results in a shortening of the rotational correlation time of fadcorresponding with the concomitant change in solvent viscosity and kinetic energy (0.20 nsat ∼ 293 K, 0.16 at 300 K).
In the fluorescence lifetime data, increasing temperature between 277K and 313 K re-sults in a shortening of the nanosecond decay time. From 293 K to 313K a clear decreasein the amplitude of the ultra-short lifetime is found in favor of the longer lifetime compo-nents. This can be explained by a shift in equilibrium towards the open conformation.
A more complete shift towards an open, non-quenched conformation is obtained in
0 2 4 6 8 10time (ns)
0
1
norm
aliz
ed fl
uore
scen
ce in
tens
ity FAD experimentalFAD fitFAD/80% glyc. exp.FAD/80% glyc. fitFMN experimentalFMN fit
Figure 7.2: Partial experi-mental total fluorescence de-cays and corresponding theo-retical data retrieved fromthe multi exponential fits offad (solid) and fmn (dashed)in D2O, and fad in 50 mMpotassium phosphate bufferwith 80 % glycerol, pH 7.5(dot-dashed) at 293 K. Ex-perimental data (gray) andtheoretical data (black) over-lie very well. In order toclearly reveal the differencesbetween the data, only partof the normalized fluores-cence intensity decays (loga-rithmic scale) and only thefirst part of the twelve nstime-window are shown.
80 % glycerol (Fig. 7.2 and Table 7.3), which is consistent with earlier steady-state spec-troscopic studies showing that non-polar solvents prevent stacking interactions (see refer-ence101 and references therein). Measurements of fad in deuterated water revealed onlya slight shift of the longest fluorescence lifetime component towards longer time values,leaving the amplitudes virtually unaffected (see Table 7.3). For fmn, a similar effect onthe predominant fluorescence lifetime was obtained. These results show that deuteriumslightly influences the intrinsic fluorescence lifetime of the isoalloxazine ring, and thatsignificant involvement of hydrogen bonding interactions in the fluorescence quenchingmechanism should not be expected. Fluorescence depolarization analysis of fmn and fadin deuterium revealed slightly reduced rotational dynamics with respect to water (Ta-ble 7.3).
7.3.2 Simulations
Stacking
In order to obtain more insight into the relation between conformational dynamics of thefad molecule in solution and its fluorescence characteristics, molecular dynamics simula-tions were performed. For this study, five different starting structures were used, threeof which represent the fad in an ’open’ conformation and two which represent the flavinand adenine rings in a stacked (or ’closed’) conformation. The electronic effect inducedby light absorption was simulated by instantaneously adjusting the partial charges on theatoms of the flavin ring. An overview of the simulations performed is given in Table 7.2.
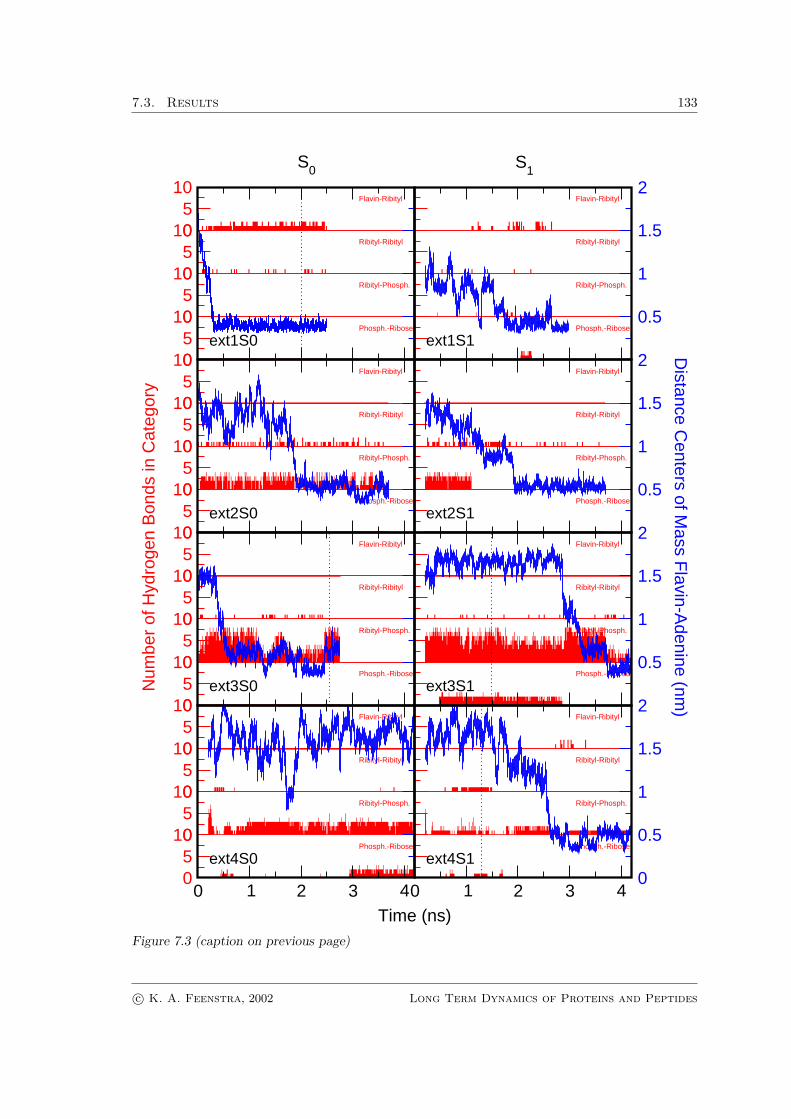
All md trajectories, both in the ground state and the excited state, were analyzedfor the occurrence of flavin-adenine stacking, which is described in detail in “Methods”sec. 7.2.2. The distance between the centers of mass of the flavin and adenine ring sys-tems was used to monitor the process of stacking and unstacking, and to characterize thefad conformations (see Fig. 7.3). In one run, the fad molecule remained in the openconformation throughout the simulation of 8 ns. In seven other runs started from ’open’conformations, the isoalloxazine and adenine rings became stacked in the course of the sim-ulation. While in some cases a nearly instantaneous collapse from a completely extended
Figure 7.3: (next page) Characteristics of the eight molecular dynamics simulations of fad startingfrom the open, extended conformation. In blue the distances between the centers of mass of theflavin and adenine rings are depicted. Vertical dotted blue lines correspond to the snapshotsshown in Fig. 7.4. The distance plots provide a good qualitative overview of the changes inmolecular conformation during the runs. Conformations with a distance of ≤ 0.6 nm were regardedas stacked. Run ext4S0 extends up to 8 ns and shows no stacking. In red (from the upper sub-panel downward) the number of hydrogen bonds between resp. the flavin ring and ribityl chain, theribityl chain with itself, the ribityl chain and the pyrophosphate moiety, and the ribose-moiety andthe pyrophosphate moiety are given for each of the trajectories. Note the presence of hydrogen-bonding networks between the ribose and pyrophosphate moieties, and between the ribityl chainand the pyrophosphate moiety in the extended conformation in most of the trajectories. In thestacked conformations, hydrogen bonds between the flavin and ribityl chain can occur (ext1S0,ext1S1, ext4S1).
conformation to a highly stable stacked conformation occurred (e.g. complete stackingwithin a few hundred ps in FAD-ext1S0), other simulations were characterized by thepresence of many different intermediates some of which were relatively long-lived (up toabout 1 ns, e.g. FAD-ext2S1, FAD-ext3S1). The simulations revealed that the process ofstacking proceeds through the adoption of a more compact but still open conformation inwhich the ribityl-pyrophosphate-ribofuranosyl chain is bent. The time necessary to reachthis conformation appears to be dependent on the presence of particular intramolecularhydrogen bond networks. Subsequently, the isoalloxazine and adenine rings come intocontact.
The first intramolecular interactions observed between ’non-neighbouring’ parts ofthe molecule involved in most cases the hydrophilic ring of the flavin (particularly O2 andN3, see Fig. 7.1) and the six-membered ring of the adenine. This interaction is sometimespreceded by a contact between the flavin and the (hydroxyl groups of the) sugar. Analternative pathway for stacking involves the disruption of a hydrogen bonding networkbetween the amp-phosphate and the sugar. The adenine subsequently moves close to theflavin via the ribityl chain (FAD-ext3S1). After disruption of a second set of hydrogenbonds (between the ribityl chain and the fmn-phosphate), the six-membered ring of theadenine and the hydrophobic ring of the flavin (ring A in Fig. 7.1) stack. It should bementioned that different routes of stacking result in different closed conformations (seethe next section).
Once in a stacked conformation with considerable overlap of the ring systems, un-stacking of the flavin and adenine rings occurred only occasionally and was brief (generallya few ps to 50 ps at most). Hardly any complete unstacking of the flavin and adenine ringswas observed in molecules with full stacking between the rings (FAD-ext1, FAD-sta1, FAD-sta2, FAD-sta3; for the runs starting from stacked conformations, data are not shown),irrespective of the electronic state of the flavin. The less overlap between the ring sys-tems in the stacked state, the easier was unstacking. In the run FAD-ext3S0 a closedconformation with proper stacking was hampered (see Fig. 7.4). Here, unstacking of therings lasting up to several hundreds of picoseconds was more common. However, the fadremained in a compact state with the adenosine and ribityl moieties in contact. In none ofthe simulations, ’unfolding’ of the molecule to a fully extended conformation was observed.
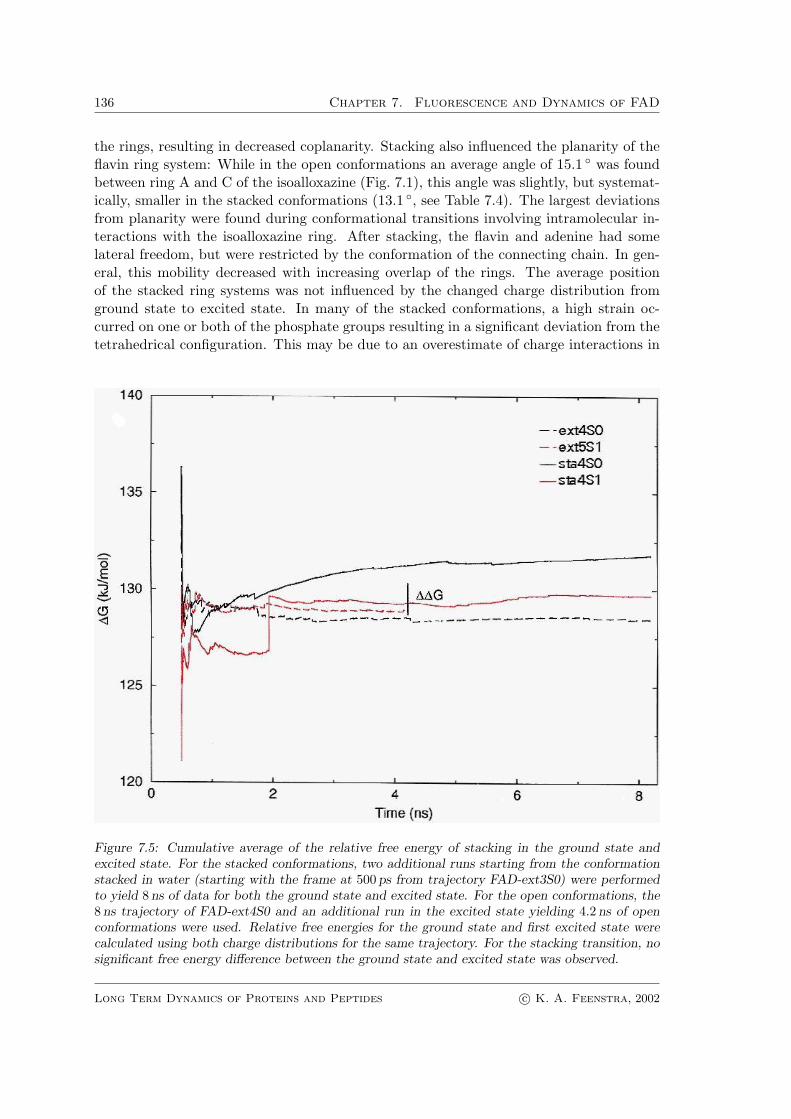
In order to determine whether the process of light absorption influences the equilib-rium between the open and closed conformations of the fad, free energy calculations wereperformed to determine the ∆∆G
S0/S1
o/cl of the stacking transition in the ground state andin the excited state using eqn. 7.4 and the thermodynamic cycle as depicted in Scheme 7.1.The calculations yielded similar free energy differences between the stacked and unstackedconformation for the ground state and for the excited state, in principle suggesting thatin fluorescence the process of light absorption itself indeed does not influence the con-formational equilibrium (Fig. 7.5). The statistics of the calculations are limited by therelatively short lifetime of the open conformation, however, so that differences cannotbe clearly distinguished. From Fig. 7.5 it can easily be estimated that the convergencebetween forward and backward perturbations is on the same order of magnitude of the re-sulting ∆∆G
S0/S1
o/cl , indicating that statistics are the limiting factor in obtaining an accurate
The range of conformations observed for the fad molecule can be best described by therelative positions and orientations of the flavin and adenine rings, and the conformationof the connecting ribityl-pyrophosphate-ribofuranosyl backbone. This is summarized inTable 7.4. Note, the stacked starting structures FAD-sta1 and FAD-sta2 were created invacuo while the other stacked conformations were produced in solution. It appears thatin solution, the adenine ring can stack on either side of the flavin and there is no preferredorientation of the ribityl-pyrophosphate-ribofuranosyl backbone. In general, the isoallox-azine and adenine rings stack coplanar. In water, the fad tends to adopt a fully parallelstacked conformation similar to those created in vacuo (average angle between the flavinand adenine planes of 12.5 ◦). In several simulations, (intermediate) conformations werefound in which the flavin and adenine rings were slightly tilted (about 30 ◦, see Table 7.4),but still had substantial contact. Occasionally, water molecules intercalated on one ofthe edges between the rings, and a hydrogen-bonded water bridge was formed between
Figure 7.4: Snapshot pictures of stacked and open conformations observed in the molecular dy-namics simulations. Shown are from left to right: FAD-ext1S0 at 2 ns, FAD-ext3S0 at 2.54 ns,FAD-ext3S1 at 1.49 ns, and FAD-ext4S1 at 1.3 ns. Hydrogen bonds are indicated with yellow lines.Of special interest are the extensive hydrogen bonding networks involving the phosphate and sugarmoieties. Note the strain in the configuration of the phosphate groups. Plots were generated usingMolScript3and Raster3D.5,6
the rings, resulting in decreased coplanarity. Stacking also influenced the planarity of theflavin ring system: While in the open conformations an average angle of 15.1 ◦ was foundbetween ring A and C of the isoalloxazine (Fig. 7.1), this angle was slightly, but systemat-ically, smaller in the stacked conformations (13.1 ◦, see Table 7.4). The largest deviationsfrom planarity were found during conformational transitions involving intramolecular in-teractions with the isoalloxazine ring. After stacking, the flavin and adenine had somelateral freedom, but were restricted by the conformation of the connecting chain. In gen-eral, this mobility decreased with increasing overlap of the rings. The average positionof the stacked ring systems was not influenced by the changed charge distribution fromground state to excited state. In many of the stacked conformations, a high strain oc-curred on one or both of the phosphate groups resulting in a significant deviation from thetetrahedrical configuration. This may be due to an overestimate of charge interactions in
Figure 7.5: Cumulative average of the relative free energy of stacking in the ground state andexcited state. For the stacked conformations, two additional runs starting from the conformationstacked in water (starting with the frame at 500 ps from trajectory FAD-ext3S0) were performedto yield 8 ns of data for both the ground state and excited state. For the open conformations, the8 ns trajectory of FAD-ext4S0 and an additional run in the excited state yielding 4.2 ns of openconformations were used. Relative free energies for the ground state and first excited state werecalculated using both charge distributions for the same trajectory. For the stacking transition, nosignificant free energy difference between the ground state and excited state was observed.
the force field of the phosphodiester bridge, as these charge interactions are abundant inthe stacked conformation.
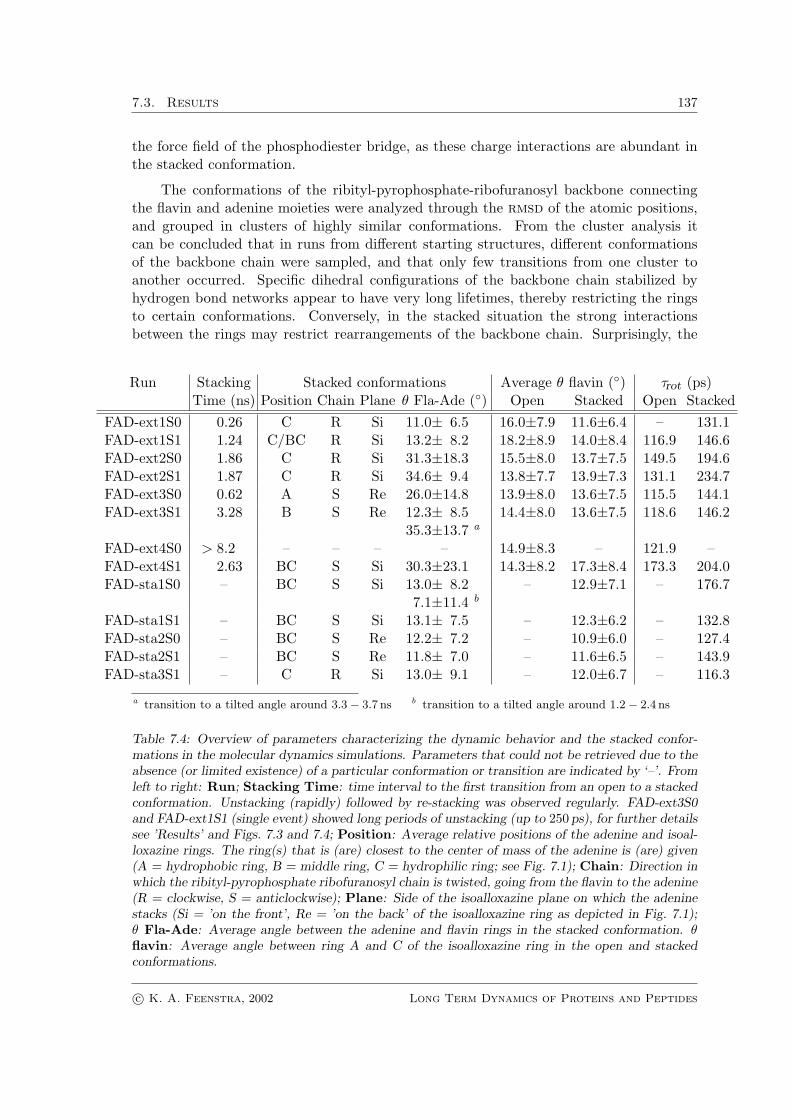
The conformations of the ribityl-pyrophosphate-ribofuranosyl backbone connectingthe flavin and adenine moieties were analyzed through the rmsd of the atomic positions,and grouped in clusters of highly similar conformations. From the cluster analysis itcan be concluded that in runs from different starting structures, different conformationsof the backbone chain were sampled, and that only few transitions from one cluster toanother occurred. Specific dihedral configurations of the backbone chain stabilized byhydrogen bond networks appear to have very long lifetimes, thereby restricting the ringsto certain conformations. Conversely, in the stacked situation the strong interactionsbetween the rings may restrict rearrangements of the backbone chain. Surprisingly, the
Run Stacking Stacked conformations Average θ flavin (◦) τrot (ps)Time (ns) Position Chain Plane θ Fla-Ade (◦) Open Stacked Open Stacked
FAD-ext1S0 0.26 C R Si 11.0± 6.5 16.0±7.9 11.6±6.4 – 131.1FAD-ext1S1 1.24 C/BC R Si 13.2± 8.2 18.2±8.9 14.0±8.4 116.9 146.6FAD-ext2S0 1.86 C R Si 31.3±18.3 15.5±8.0 13.7±7.5 149.5 194.6FAD-ext2S1 1.87 C R Si 34.6± 9.4 13.8±7.7 13.9±7.3 131.1 234.7FAD-ext3S0 0.62 A S Re 26.0±14.8 13.9±8.0 13.6±7.5 115.5 144.1FAD-ext3S1 3.28 B S Re 12.3± 8.5 14.4±8.0 13.6±7.5 118.6 146.2
35.3±13.7 a
FAD-ext4S0 > 8.2 – – – – 14.9±8.3 – 121.9 –FAD-ext4S1 2.63 BC S Si 30.3±23.1 14.3±8.2 17.3±8.4 173.3 204.0FAD-sta1S0 – BC S Si 13.0± 8.2 – 12.9±7.1 – 176.7
7.1±11.4 b
FAD-sta1S1 – BC S Si 13.1± 7.5 – 12.3±6.2 – 132.8FAD-sta2S0 – BC S Re 12.2± 7.2 – 10.9±6.0 – 127.4FAD-sta2S1 – BC S Re 11.8± 7.0 – 11.6±6.5 – 143.9FAD-sta3S1 – C R Si 13.0± 9.1 – 12.0±6.7 – 116.3
a transition to a tilted angle around 3.3− 3.7 ns b transition to a tilted angle around 1.2− 2.4 ns
Table 7.4: Overview of parameters characterizing the dynamic behavior and the stacked confor-mations in the molecular dynamics simulations. Parameters that could not be retrieved due to theabsence (or limited existence) of a particular conformation or transition are indicated by ‘–’. Fromleft to right: Run; Stacking Time: time interval to the first transition from an open to a stackedconformation. Unstacking (rapidly) followed by re-stacking was observed regularly. FAD-ext3S0and FAD-ext1S1 (single event) showed long periods of unstacking (up to 250 ps), for further detailssee ’Results’ and Figs. 7.3 and 7.4; Position: Average relative positions of the adenine and isoal-loxazine rings. The ring(s) that is (are) closest to the center of mass of the adenine is (are) given(A = hydrophobic ring, B = middle ring, C = hydrophilic ring; see Fig. 7.1); Chain: Direction inwhich the ribityl-pyrophosphate ribofuranosyl chain is twisted, going from the flavin to the adenine(R = clockwise, S = anticlockwise); Plane: Side of the isoalloxazine plane on which the adeninestacks (Si = ’on the front’, Re = ’on the back’ of the isoalloxazine ring as depicted in Fig. 7.1);θ Fla-Ade: Average angle between the adenine and flavin rings in the stacked conformation. θflavin: Average angle between ring A and C of the isoalloxazine ring in the open and stackedconformations.
starting structures stacked in vacuo have backbone conformations differing distinctly fromthe structures resulting from stacking in water. This is also reflected in the relative positionof the stacked rings, as shown in Table 7.4.
Physical Properties
An important conclusion from the md simulations is that in solution the backbone of thefad molecule behaves much more rigid than we had expected. To gain insight into theeffect of hydrogen bonds between the different building blocks of the fad, the trajectorieswere analyzed in terms of numbers of hydrogen bonds between two separate regions of themolecule (flavin ring, ribityl chain, pyrophosphate, ribofuranosyl and adenine ring). Thehigh density of hydrogen-bonding donors and acceptors in the chain provides an excellentframework for intramolecular hydrogen bonding. Intramolecular hydrogen bonding net-works between the sugar and the phosphodiester bond appear to have a prominent effecton the lifetime of the open conformation (see Fig. 7.3). Hydrogen bonding between theribityl chain and the phosphodiester bond contributes to this as well. For this network,the number of hydrogen bonds may even temporarily increase just before stacking, asupon bending of the chain the distant phosphate comes within hydrogen bonding distanceto the ribityl chain as well (e.g. ext3S1). Both the formation of hydrogen bonds and theconcomitant breaking of the hydrogen bonds appeared to be highly cooperative. Breakingup a cooperative network involves a free-energy barrier that can ’lock’ the molecule into aparticular open conformation for long periods of time (up to hundreds of ps). The interplaybetween the energetically favorable stacking of the ring systems on the one hand, and thecooperative hydrogen bond formation between the ribityl chain and the fmn-phosphateon the other hand, even resulted in frequent stacking, unstacking and stacking again inthe same conformation (FAD-ext3S0).
In some stacked conformations, especially in FAD-ext1, a hydrogen bond was formedbetween the hydroxyl group attached to C4 or C3 of the ribityl chain and the N1 of theflavin. In literature ,131 interaction between a hydroxyl group of the ribityl chain and theN1 of the flavin was proposed to be involved in the intramolecular photo-reduction of theflavin, resulting in subsequent photo-degradation. As a candidate for this, the hydroxylgroup of the C2 of the ribityl chain was proposed. This hydrogen bond was found in themd simulations as well, but only in rare occasions.
In all simulations, one Na+ ion was either initially positioned at 0.2 nm from the esteroxygen of the phosphodiester bond, or migrated to this position during the run (between0.1 and 2 ns). Sometimes the second Na+ ion moved towards this position as well. Nointeractions between Na+ ions and the flavin ring were found.
The rotational mobility of the fad molecules was analyzed through a second orderLegendre polynomial of the autocorrelation function of the rotational orientation of theflavin ring; for this, the N3-C8 axis was used which has a direction very close to that of theemission dipole moment.128 The rotational correlation time of the flavin was 147± 25 ps.A small difference was found between the rotational correlation time of the flavin in thestacked and the unstacked parts of the simulations. Analysis of the eleven trajectoriesin which only the stacked conformations were taken into account resulted in a rotational
correlation time of 154± 33 ps, while for the unstacked conformations a time-constant of129±13 ps was found. In every single run in which the molecule was in both an unstackedand a stacked conformation for a considerable period of time, the rotational correlationtime for the unstacked situation was significantly smaller than that for the stacked one(Table 7.4). This may be explained by additional mobility of the isoalloxazine ring inthe plane perpendicular to the ribityl-pyrophosphate-ribofuranosyl backbone. The valuesfor the rotational correlation time of 162 ps obtained from the simulations (Table 7.4)are in very good agreement with the time constant of 160 ps found in the time-resolvedfluorescence anisotropy measurements (Table 7.3).
7.4 Discussion
In this study we have demonstrated the combined use of molecular dynamics simulationsand (sub)nanosecond time-resolved fluorescence spectroscopy to obtain more detailed in-sight into the dynamic structure of complex fluorophores such as the flavin adenine din-ucleotide cofactor. Polarized fluorescence experiments with high time resolution yield abroad picture of the dynamic landscape for the ensemble of molecules in solution, while mdsimulations provide a detailed view on the underlying molecular structures and possibletransition pathways. The limitation of the simulations, however, is whether it is possibleto simulate long enough to sufficiently sample the conformational space.
The molecular dynamics simulations confirm that the fad molecule in aqueous solu-tion is predominantly in a compact conformation in which the flavin and adenine moietiesare stacked. Although unstacking of the flavin and adenine ring systems occurs, themolecule is mainly in a conformation in which the flavin and adenine rings show (large)overlap, occasionally alternated by conformations in which the ring systems interact viadirect or water-mediated hydrogen bonds.
These simulation results rule out several potential mechanisms for ultra-rapid fluo-rescence quenching in fad: Interactions between the flavin N5 and the amino group ofthe adenine ring – mostly bridged through a water molecule – were not often found inthe md simulations, and a perpendicular orientation of the flavin and adenine in whichthe lone electron pair of N5 interacts with the π-system of the adenine was not found atall. Likewise, a quenching mechanism involving hydrogen bonding between the adenineand the 2-keto function of the flavin as proposed by Tsibris et al.,132 can be excluded onthe virtual absence of such interactions. Fluorescence experiments in deuterium oxide didnot give any evidence for the involvement of hydrogen bonds in fluorescence quenchingeither. In addition, the absence of substantial hydrogen bonding between the flavin andadenine moieties renders a significant population of molecules with parallel intramolecularhydrogen bonding between the flavin and adenine, as proposed by Raszka & Kaplan107
for the unstacked state, highly unlikely.
The stacked conformations of the flavin and adenine rings observed in the md simu-lations, however, can well explain the ultra-rapid fluorescence quenching in fad. The mdsimulations reveal large overlap of the coplanar flavin and adenine ring systems indicat-ing large π-π overlap. The interactions between the adenine and isoalloxazine rings may
yield additional de-excitation routes through internal conversion. Most likely, however,the mechanism of flavin fluorescence quenching involves a photo-induced charge transferinteraction between the adenine (donor) and flavin (acceptor): Photo-induced electron (orhydrogen) transfer from electron-rich donors to the isoalloxazine is a well known propertyof flavins.133,134,111,135 In flavoproteins that contain a tyrosine or tryptophan residue ad-jacent to the flavin, photo-induced electron transfer to the flavin has been shown to resultin highly efficient flavin fluorescence quenching with time constants in the picosecond andsub-picosecond range.111,136,112,137,135 Although classical charge transfer interactions be-tween flavin and purines have been reported not to contribute significantly in the groundstate, photo-induced electron transfer should be considered for ultrafast excited state-quenching in the complex. For photo-induced electron transfer, the relation between thefree energy of the reaction, the reorganization energy and the distance between donor andacceptor is expressed in the Rehm-Weller equation.138,139 Based on the redox potentialsfor the adenine reported by Seidel et al.140 (about 1.5 V at pH 7.5), and fmn (−0.24 V),photo-induced electron transfer is likely to occur at the wavelength of excitation (energyfor the S0 → S1 transition (π−π∗ character) at 450 nm is 2.76 eV). In general, typical rateconstants for electron transfer derived from a variety of biological and (semi)syntheticalsystems lie in the order of 1 ps−1 to 0.1 ps−1 for donor-acceptor distances of 0.5 nm, whiledistances of 1.0 nm generally result in rates between 10 ns−1 and 1 ns−1.141 The picosec-ond fluorescence quenching observed for fad corresponds to a rate constant of ∼ 0.15 ps−1
which lies in the expected time range for electron transfer. As the time constant is closeto the detection limit of the tcspc set-up used, the rate constant for quenching might besomewhat underestimated. Recently, femtosecond fluorescence quenching was observedin the flavoenzymes riboflavin binding protein137,135 and the D-amino acid oxidase ben-zoate complex,137 which contain a (coplanarly) stacked complex between the isoalloxazinering and an aromatic ring (resp. tryptophan and tyrosine, and benzoate). Such ultrafastprocesses would fall below the detection limit of our experimental set-up. The oxidationpotentials of tryptophan and tyrosine, however, are somewhat lower than that of adenine,thus accelerating an electron transfer reaction. Recently reported transient absorptionspectra of fad142 revealed a time constant for excited state quenching of about 4 ps, whichis in close agreement with the results presented here. Although the study on the transientabsorption of fmn and fad in water and formamide definitely confirmed the rapid excitedstate quenching of flavin-purine complexes in aqueous solution, the molecular mechanismof quenching was not discussed.
Besides the picosecond fluorescence lifetime component discussed above, the fluores-cence lifetime patterns of fad contained a nanosecond component and minor but definitecontributions of intermediate time constants (100 ps – 1 ns). In an extreme model consid-ering each component of the lifetime spectrum as a separate conformational state with aconformational lifetime longer than the fluorescence lifetime of that particular state (’con-formational substates’ model), these could be interpreted as separate conformations ofthe fad molecule with a (very) small, but significant population. However, in the simu-lations we observed the fad molecule to experience conformational transitions during thelifetime of the excited state, on time-scales ranging from several tens of picoseconds tonanoseconds.
Based on the fluorescence characteristics of fmn together with the md simulations,
however, we believe that for fad in the stacked conformation only, the flavin fluorescencewill be quenched immediately. When the picosecond fluorescence lifetime constants offad represents the ’closed’ conformation and the other lifetimes the (various) ’open’ con-formations of the molecule, one can obtain an estimate of the populations. Under theassumptions that only the observed ultrafast component reflects the stacked conforma-tion, and that the equilibrium constant for the excited state is identical to that for theground state (which seems reasonable from the calculations of the free energy differencesfor the stacking equilibrium in the ground state and excited state) the population of fadmolecules in the open conformations, as calculated from the weight of the amplitudes fromthe tcspc data is about 17 % at 293 K.
The open, unstacked conformations of the fad are responsible for the significant2.7 ns fluorescence lifetime component. The md simulations have shown that the fadmolecule can exist in an extended conformation for considerable periods of time, longerthan the intrinsic fluorescence lifetime of the flavin. However, if a considerable number offad molecules would remain in an extended open conformation with no intra-molecularinteractions between the flavin and adenosine moieties during the lifetime of the excitedstate, a nanosecond fluorescence lifetime constant identical to that of fmn (4.7 ns) wouldbe expected. An explanation for the 2.7 ns lifetime component of fad that cannot be fullyexcluded is the existence of a particular compact conformation with a long conformationallifetime (compared to the lifetime of the excited state) in which the flavin does not stack,but interacts with other parts of the molecule resulting in less efficient flavin fluorescencequenching. The long-lived conformation in which the flavin and adenine moieties are close,but do not stack (Fig. 7.4), resembles the X-ray structure of the fad cofactor bound todna photolyase,143 the only flavoprotein known thus far in which the cofactor is bound ina non-extended conformation. This particular conformation, however, occurred in one runonly and therefore cannot explain the magnitude of the 2.7 ns fluorescence component.
0 1 2 3 4 5 6 7 8Time (ns)
Flu
ores
cenc
e In
tens
ity (
arb.
uni
ts)
Theoreticalfit (τ = 1.7 ns)
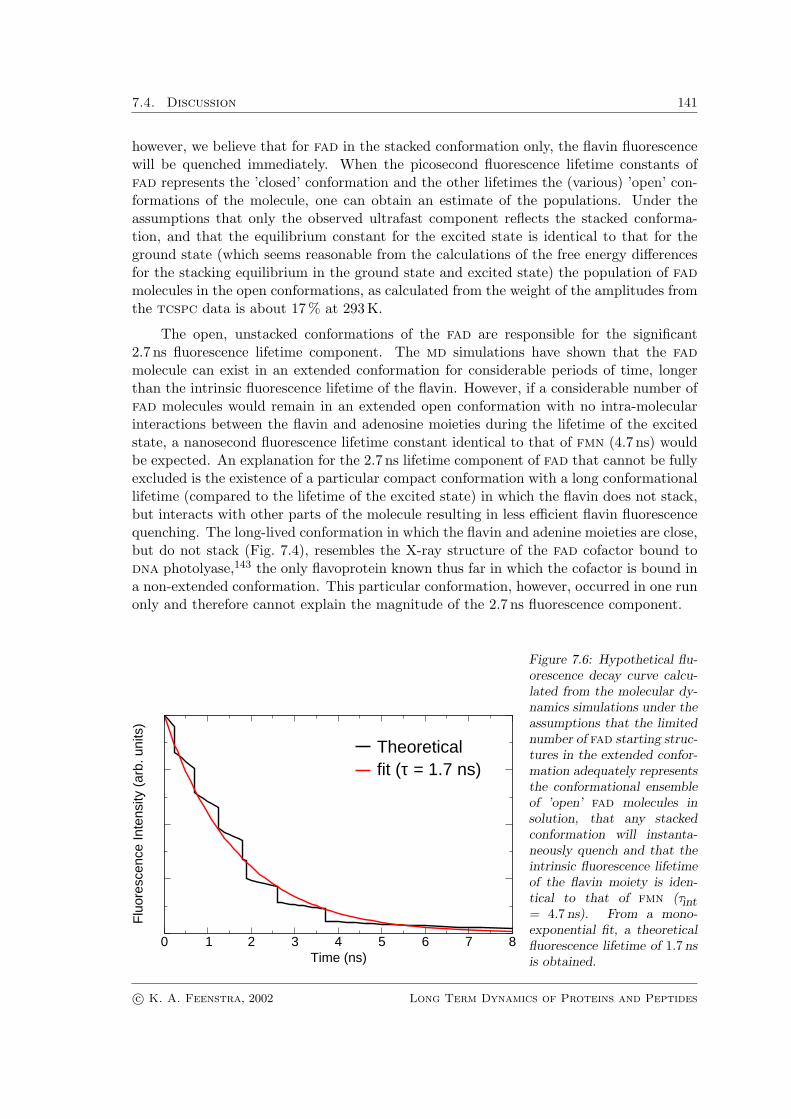
Figure 7.6: Hypothetical flu-orescence decay curve calcu-lated from the molecular dy-namics simulations under theassumptions that the limitednumber of fad starting struc-tures in the extended confor-mation adequately representsthe conformational ensembleof ’open’ fad molecules insolution, that any stackedconformation will instanta-neously quench and that theintrinsic fluorescence lifetimeof the flavin moiety is iden-tical to that of fmn (τint= 4.7 ns). From a mono-exponential fit, a theoreticalfluorescence lifetime of 1.7 nsis obtained.
A more likely hypothesis is therefore that the nanosecond fluorescence lifetime compo-nent of fad corresponds to the conformational lifetime of the open conformation. Supportfor this is found in the md simulations, where except for one run, all simulations startingfrom an extended conformation of the molecule stacked within 5 ns. Under the assump-tions that the limited ensemble of fad starting structures in the extended conformationadequately represents the conformational ensemble of ’open’ fad molecules in solution,and that as soon as a fad molecule stacks, quenching occurs, a hypothetical fluorescencedecay curve can be constructed using the following formula:
Itheo(t) = Nopen(t) · et/τintr (7.5)
where Itheo is the calculated theoretical intensity at time t, Nopen(t) is the number of openmolecules at time t, as can be extracted from Fig. 7.3, and τintr is the intrinsic fluorescencelifetime of the flavin moiety (4.7 ns).
The theoretical fluorescence lifetime retrieved from this hypothetical curve is 1.7 ns(Fig. 7.6) , which is not far from the nanosecond lifetime observed with time-resolvedfluorescence (2.4 ns at 300 K). Together, the time-resolved fluorescence data and moleculardynamics simulations support the picture that the majority of fad molecules is in a ’closed’conformation in which the adenine and flavin rings are stacked, and that a small percentageof fad molecules can remain in the open conformation for nanoseconds of time.
7.5 Acknowledgments
We thank B. Hess for adjustments of the software package, Dr. D. van der Spoel forassistance in early md pilot-experiments, A. van Hoek for help with the fluorescence ex-periments, and Dr. W. J. H. van Berkel for valuable discussions and suggestions.