4.1 Creep and Shrinkage Deformations in Concrete .............4-14.2 Creep Deformations in Concrete.......................................4-2
Creep Effects • Rheological Models
4.3 Creep Prediction..................................................................4-6Creep Prediction for Standard Conditions • Factors Affecting Creep • Creep Prediction for Nonstandard Conditions • CEB-FIP Model Code for Creep
4.4 Shrinkage in Concrete.......................................................4-10General Shrinkage Behavior • Shrinkage Prediction for Standard Conditions • Shrinkage Prediction for Nonstandard Conditions • Alternate Method for Shrinkage Prediction in Prestressed Concrete Elements • CEB-FIP Model Code for Shrinkage • Effects of Water and Slump on Drying Shrinkage
4.5 Strength and Elastic Properties of Concrete vs. Time......4-16Cylinder Compressive Strength (fc′) • Modulus of Rupture (fr) and Tensile Strength (ft′) • Modulus of Elasticity (Ec)
4.6 Serviceability Long-Term Considerations .......................4-18Cracking Moment (Mcr) and Effective Moment of Inertia (Ie) • Flexural Crack Width Development
4.7 Long-Term Shrinkage and Temperature Reinforcement Controlling Cracking between Joints in Walls and Slabs of Liquid-Retaining Structures.........4-34
4.8 Autogenous Shrinkage in Early-Age Concrete................4-35Acknowledgments........................................................................4-35References .....................................................................................4-37
4.1 Creep and Shrinkage Deformations in Concrete
Creep, or lateral material flow, is the increase in strain with time due to sustained load. Initial deformationdue to load is the elastic strain, while the additional strain or time-dependent deformation due to thesame sustained load is the creep strain. Drying shrinkage, on the other hand, is the decrease in volume
* Distinguished Professor, Civil Engineering, Rutgers University, The State University of New Jersey, Piscataway, NewJersey, and ACI honorary member; expert in concrete structures, materials, and forensic engineering.** Associate Professor, Civil and Environmental Engineering, Rutgers University, The State University of New Jersey;expert in structural concrete and cementitious materials.
of the concrete element when it loses moisture due to evaporation. Because every infrastructure elementunder load will suffer this long-term deformation that has to be accounted for in a durable system, thisaspect has been chosen as one of the major topics for consideration in this chapter.
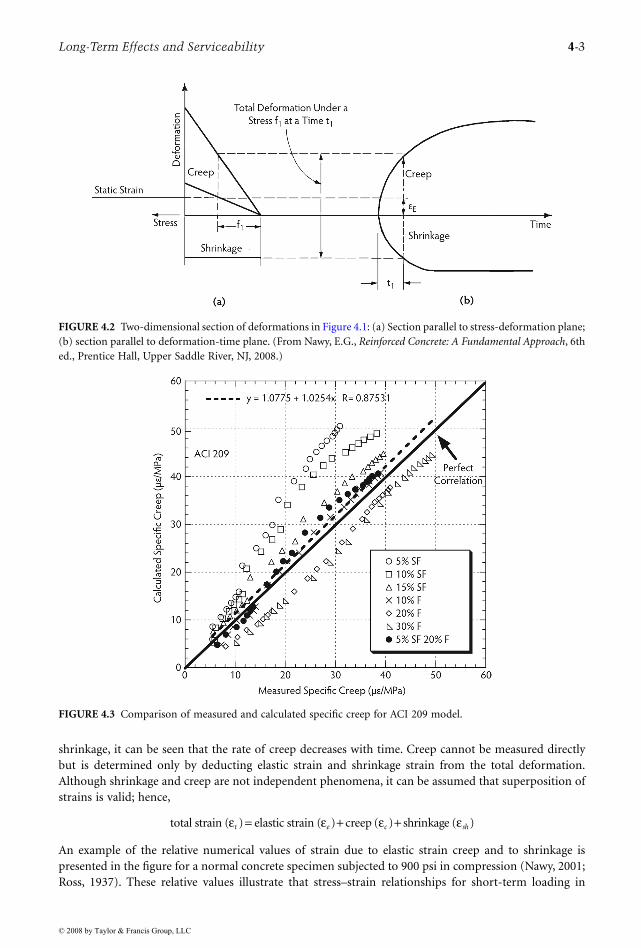
If we look at the three-dimensional representation in Figure 4.1 and its two-dimensional counterpartin Figure 4.2, we can see that the nonlinear relationship in the creep and shrinkage behavior makes itdifficult to come up with an exact model of prediction. This has been a challenge for researchers fromthe 1920s onwards and is why there are so many models of prediction (ACI 209, 1992; Bazant and Boweja,1995a,b, 2000a,b; Bazant and Murphy, 1995; Branson, 1971, 1977; CEB-FIP, 1990; Gardner, 2000; Gardnerand Lockman, 2001; Ross, 1937). Because of the incomplete reversibility of both creep and shrinkagestrains, we can observe cracking, sagging of elements, and progressive deterioration as the strain continuesto increase with time. Figure 4.2a shows a section of the three-dimensional model presented in Figure4.1 parallel to the plane that contains the stress and deformation axes at time t1. The figure indicates thatboth elastic and creep strains are linearly proportional to applied stress. In a similar manner, Figure 4.2billustrates a section parallel to the plane that contains the time and strain axes at a stress f1; hence, itshows the familiar creep time and shrinkage time relationships.
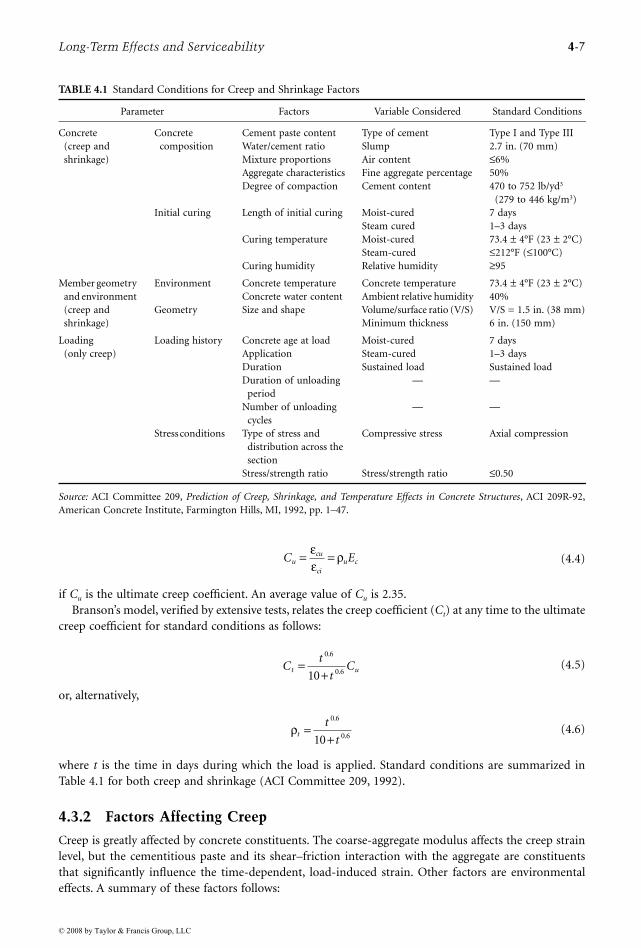
The current ACI 318 code expressions due to Branson are still the acceptable general-purpose expres-sions for the prediction of creep and shrinkage as embodied in the ACI 209 model, and the designer canuse other methods such as the CEB-FIP (1990), Bazant’s B3 model (Bazant and Boweja, 1995a,b, 2000a,b),or Gardner’s GL 2000 model (Gardner, 2000; Gardner and Lockman, 2001) for refined predictions (Nawy,2006a,b, 2008). Recent work by Nassif at Rutgers (Saksawang et al., 2005), shown in Figure 4.3, indicatesthat the ACI 209 model seems to be a close best fit for creep prediction in high-strength, high-performanceconcrete; Figure 4.4 shows essentially similar characteristics for shrinkage but with lesser correlation.
4.2 Creep Deformations in Concrete
Creep or lateral material flow is the increase in strain with time due to sustained load. Initial deformationdue to load is the elastic strain, while the additional strain due to the same sustained load is the creepstrain. This practical assumption is quite acceptable, as the initial recorded deformation includes fewtime-dependent effects. Figure 4.5 illustrates the increase in creep strain with time; in the case of
FIGURE 4.1 Three-dimensional model of time-dependent structural behavior. (From Nawy, E.G., Reinforced Con-crete: A Fundamental Approach, 6th ed., Prentice Hall, Upper Saddle River, NJ, 2008.)
shrinkage, it can be seen that the rate of creep decreases with time. Creep cannot be measured directlybut is determined only by deducting elastic strain and shrinkage strain from the total deformation.Although shrinkage and creep are not independent phenomena, it can be assumed that superposition ofstrains is valid; hence,
An example of the relative numerical values of strain due to elastic strain creep and to shrinkage ispresented in the figure for a normal concrete specimen subjected to 900 psi in compression (Nawy, 2001;Ross, 1937). These relative values illustrate that stress–strain relationships for short-term loading in
FIGURE 4.2 Two-dimensional section of deformations in Figure 4.1: (a) Section parallel to stress-deformation plane;(b) section parallel to deformation-time plane. (From Nawy, E.G., Reinforced Concrete: A Fundamental Approach, 6thed., Prentice Hall, Upper Saddle River, NJ, 2008.)
FIGURE 4.3 Comparison of measured and calculated specific creep for ACI 209 model.
normally reinforced or plain concrete elements lose their significance and the effects of long-term loadingsbecome dominant on the behavior of a structure. In cases of large heavily reinforced columns in buildings,elastic strain can be a more significant component of the total strain.
Numerous tests have indicated that creep deformation is proportional to the applied stress, but theproportionality is valid only for low stress levels. The upper limit of the relationship cannot bedetermined accurately but can vary between 0.2 and 0.5 of the ultimate strength fc′. This range in thelimit of the proportionality is expected due to the large number of microcracks that exist at about40% of the ultimate load.
As in the case of shrinkage, creep is not completely reversible. If a specimen is unloaded after a periodof being under a sustained load, an immediate elastic recovery is obtained that is less than the strainprecipitated on loading. The instantaneous recovery is followed by a gradual decrease in strain, calledcreep recovery. The extent of the recovery depends on the age of the concrete when loaded; older concretespresent higher creep recoveries, while residual strains or deformations become frozen in the structuralelement, as shown in Figure 4.6.
FIGURE 4.4 Comparison of measured and calculated shrinkage strain for ACI 209 model.
FIGURE 4.5 Long-term creep stress–time curve. (From Nawy, E.G., Reinforced Concrete: A Fundamental Approach,6th ed., Prentice Hall, Upper Saddle River, NJ, 2008.)
As in shrinkage, creep increases the deflection of beams and slabs and causes loss of prestress inprestressed concrete elements. In addition, the initial eccentricity of a reinforced concrete columnincreases with time due to creep, resulting in the transfer of the compressive load from the concreteto the steel in the concrete section. When the steel yields, additional load has to be carried by theconcrete; consequently, the resisting capacity of the column is reduced, and the curvature of the columnincreases further, resulting in overstress in the concrete and leading to failure. Similar behavior occursin axially loaded columns.
4.2.2 Rheological Models
Rheological models are mechanical devices that portray the general deformation behavior and flow ofmaterials under stress. A model is basically composed of elastic springs and ideal dashpots denotingstress, elastic strain, delayed elastic strain, irrecoverable strain, and time. The springs represent theproportionality between stress and strain, and the dashpots represent the proportionality of stress tothe rate of strain. A spring and a dashpot in parallel form a Kelvin unit, and in series they form aMaxwell unit.
Two rheological models are discussed here: the Burgers model and the Ross model. The Burgers model(Figure 4.7) is shown because it can approximately simulate the stress–strain–time behavior of concreteat the limit of proportionality, with some limitations. This model simulates the instantaneous recoverablestrain (a), the delayed recoverable elastic strain in the spring (b), and the irrecoverable time-dependentstrain in dashpots (c and d). The weakness in this model is that it continues to deform at a uniform rateas long as the load is sustained by the Maxwell dashpot—a behavior not similar to concrete, where creepreaches a limiting value with time, as shown in Figure 4.7. A modification in the form of the Rossrheological model (Ross, 1958) (Figure 4.8) can eliminate this deficiency. In this model, A represents theHookian direct proportionality of the stress-to-strain element, D represents the Newtonian element, andB and C are the elastic springs that can transmit the applied load P(t) to the enclosing cylinder walls bydirect friction. Because each coil has a defined frictional resistance, only those coils whose resistanceequals the applied load P(t) are displaced; the others remain unstressed, symbolizing irrecoverabledeformation in concrete. As the load continues to increase, it overcomes the spring resistance of unit B,
FIGURE 4.6 Creep recovery vs. time. (From Nawy, E.G., Reinforced Concrete: A Fundamental Approach, 6th ed.,Prentice Hall, Upper Saddle River, NJ, 2008.)
pulling the spring from the dashpot and signifying failure in a concrete element. More rigorous modelshave been used, such as Roll’s model, to assist in predicting the creep strains. Mathematical expressionsfor such predictions can be very rigorous. One convenient expression from Ross defines creep (C) underload after time interval t as follows:
(4.1)
where a and b are constants that can be determined from tests. As will be discussed in the next section,this model seems to represent the creep deformation of concrete and is the background for the ACI codeequations for creep.
4.3 Creep Prediction
4.3.1 Creep Prediction for Standard Conditions
Creep and shrinkage are interrelated phenomena because of the similarity of the variables affecting both,including the forms of their strain–time curves, as seen in Figure 4.2. The ACI (ACI Committee 209,1992) proposed a similar model for expressing both creep and shrinkage behavior. The expression forcreep is as follows:
(4.2)
where a and α are experimental constants and t, in days, is the duration of loading.Work by Branson (1971, 1977) formed the basis for Equation 4.2 and Equation 4.3 in a simplified
creep evaluation. The additional strain (εcu) due to creep can be defined as:
(4.3)
where:
ρu = unit creep coefficient, generally referred to as specific creep.fci = stress intensity in the structural member corresponding to initial unit strain εcu.
FIGURE 4.7 The Burgers rheological model. (From Nawy, E.G., Reinforced Concrete: A Fundamental Approach, 6thed., Prentice Hall, Upper Saddle River, NJ, 2008.)
FIGURE 4.8 Ross rheological model. (From Nawy, E.G., Reinforced Concrete: A Fundamental Approach, 6th ed.,Prentice Hall, Upper Saddle River, NJ, 2008.)
if Cu is the ultimate creep coefficient. An average value of Cu is 2.35.Branson’s model, verified by extensive tests, relates the creep coefficient (Ct) at any time to the ultimate
creep coefficient for standard conditions as follows:
(4.5)
or, alternatively,
(4.6)
where t is the time in days during which the load is applied. Standard conditions are summarized inTable 4.1 for both creep and shrinkage (ACI Committee 209, 1992).
4.3.2 Factors Affecting Creep
Creep is greatly affected by concrete constituents. The coarse-aggregate modulus affects the creep strainlevel, but the cementitious paste and its shear–friction interaction with the aggregate are constituentsthat significantly influence the time-dependent, load-induced strain. Other factors are environmentaleffects. A summary of these factors follows:
TABLE 4.1 Standard Conditions for Creep and Shrinkage Factors
Parameter Factors Variable Considered Standard Conditions
Concrete(creep and shrinkage)
Concrete composition
Cement paste contentWater/cement ratioMixture proportionsAggregate characteristicsDegree of compaction
Type of cementSlumpAir contentFine aggregate percentageCement content
Type I and Type III2.7 in. (70 mm)≤6%50%470 to 752 lb/yd3
(279 to 446 kg/m3)Initial curing Length of initial curing Moist-cured
Steam cured7 days1–3 days
Curing temperature Moist-curedSteam-cured
73.4 ± 4°F (23 ± 2°C)≤212°F (≤100°C)
Curing humidity Relative humidity ≥95
Member geometry and environment (creep and shrinkage)
Environment Concrete temperatureConcrete water content
Concrete temperatureAmbient relative humidity
73.4 ± 4°F (23 ± 2°C)40%
Geometry Size and shape Volume/surface ratio (V/S)Minimum thickness
V/S = 1.5 in. (38 mm)6 in. (150 mm)
Loading(only creep)
Loading history Concrete age at load Moist-cured 7 daysApplication Steam-cured 1–3 daysDuration Sustained load Sustained loadDuration of unloading
period— —
Number of unloading cycles
— —
Stress conditions Type of stress and distribution across the section
Compressive stress Axial compression
Stress/strength ratio Stress/strength ratio ≤0.50
Source: ACI Committee 209, Prediction of Creep, Shrinkage, and Temperature Effects in Concrete Structures, ACI 209R-92,American Concrete Institute, Farmington Hills, MI, 1992, pp. 1–47.
• Sustained load. Creep as a result of sustained load is proportional to the sustained stress and isrecoverable up to 30 to 50% of the ultimate strain.
• Water/cementitious materials ratio (w/(c + p) or w/cm). The higher this ratio, the larger the creep,as seen in Figure 4.9, which relates specific creep to the w/(c + p) ratio (Mindess et al., 1999).
• Aggregate modulus and aggregate/paste ratio. For constant paste-volume content, an increase in aggre-gate volume decreases creep. As an example, an increase from 65 to 75% lowered creep by 10%. Thisbehavior is the same whether the coarse aggregate is natural stone or lightweight artificial aggregate.
• Age at time of loading. The older the concrete at the time of loading, the smaller the induced creepstrain for the same load level.
• Relative humidity. Reconditioning the concrete at a lower relative humidity before applying thesustained external load reduces the resulting creep strain. If creep is considered in two catego-ries—drying creep and wetting creep—the creep strain develops irrespective of the direction ofchange (Mindess et al., 1999), provided the exposure is above 40%.
• Temperature. Creep increases with increase in temperature if the concrete is maintained at elevatedtemperatures while under sustained load. It increases in a linear manner up to a temperature of 175°F(80°C). Its value at this temperature level is almost three times the creep value at ambient temperatures.
• Concrete member size. Creep strain decreases with increasing thickness of the concrete member.• Reinforcement. Creep effects are reduced by use of reinforcement in the compressive zones of
concrete members.
4.3.3 Creep Prediction for Nonstandard Conditions
As the standard conditions for creep described in Table 4.1 change, corrective modifying multipliers haveto be applied to the ultimate creep coefficient (Cu) in Equation 4.5. If the average ultimate creep Cu is2.35 for standard conditions, it has to be adjusted by a multiplier (γCR) so:
(4.7a)
Here, γCR has component coefficients that account for the change in conditions enumerated in thepreceding section. ACI Committee 209 recommends, in detailed tabular form, the various component
FIGURE 4.9 Water/cement ratio effect on the relative specific creep. (From Mindess, S. et al., Concrete, Prentice Hall,Upper Saddle River, NJ, 1999. With permission.)
coefficients for the γCR multiplier (ACI Committee 209, 1992). These are generally based on Branson’s(1977) studies. Tabulated values are given in graphical form (ACI Committee 435, 1995; Branson, 1977;Meyers and Thomas, 1983) in Figure 4.10 for the multiplier as follows:
(4.7b)
where:
γCR = 1 for standard conditions.Kh
c = relative humidity factor.Kd
c = minimum member thickness factor.Ks
c = concrete consistency factor.
FIGURE 4.10 Creep correction factors for nonstandard conditions, ACI 209 method. (From Meyers, B.L. and Thomas,E.W., in Handbook of Structural Concrete, Kong, F.K. et al., Eds., McGraw-Hill, New York, 1983, pp. 11.1–11.33. Withpermission.)
Ktoc = age of concrete at load application factor.
4.3.4 CEB-FIP Model Code for Creep
The total stress-dependent strain per unit stress in the CEB-FIP 90-99 model is given by the followingexpression:
(4.8)
where:
Et0 = modulus of elasticity at age of loading (MPa).E28 = modulus of elasticity at 28 days (MPa).φ(t,t0) = creep coefficient dependent on several factors, each defined by a separate equation relating to
cement type, relative humidity, concrete strength, and age of concrete.
4.4 Shrinkage in Concrete
4.4.1 General Shrinkage Behavior
In general, the two types of shrinkage are plastic shrinkage and drying shrinkage; carbonation shrinkageis another form of shrinkage. Plastic shrinkage occurs during the first few hours after placing freshconcrete in forms. Exposed surfaces such as floor slabs are more easily affected by exposure to dry airbecause of their large contact surface. In such cases, moisture evaporates from the concrete surface fasterthan it is replaced by bleed water from the lower layers. Drying shrinkage, on the other hand, occursafter the concrete has already attained its final set and a good portion of the chemical hydration processin the cement gel has been accomplished. Drying shrinkage is the decrease in the volume of a concreteelement when it loses moisture by evaporation. The opposite phenomenon—volume increase throughwater absorption—is termed swelling. In other words, shrinkage and swelling represent water movementout of or into the gel structure of a concrete specimen that is caused by the difference in humidity orsaturation levels between the specimen and the surroundings, regardless of the external load.
Shrinkage is not a completely reversible process. If a concrete unit is saturated with water after havingfully shrunk, it will not expand to its original volume. Figure 4.11 relates the increase in shrinkage strain
FIGURE 4.11 Concrete shrinkage vs. time curve. (From Nawy, E.G., Reinforced Concrete: A Fundamental Approach,6th ed., Prentice Hall, Upper Saddle River, NJ, 2008.)
(εsh) with time. The rate decreases with time, as older concretes are more resistant to environmentaleffects and consequently undergo less shrinkage, so the shrinkage strain becomes almost asymptotic withtime. Several factors affect the magnitude of drying shrinkage:
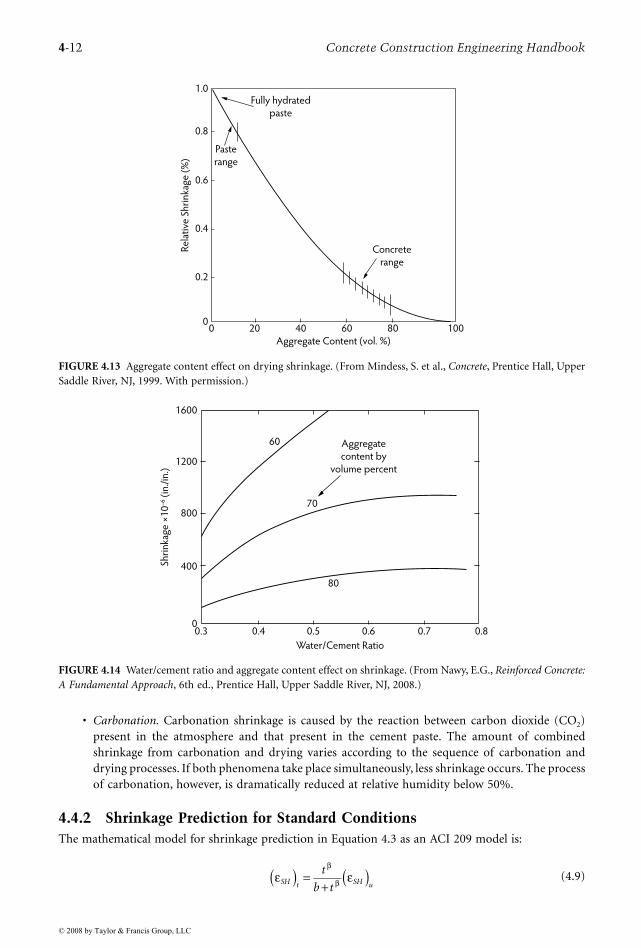
• Aggregate. Aggregate acts to restrain the shrinkage of cement paste; hence, concretes with a highaggregate content are less vulnerable to shrinkage. In addition, the degree of restraint of a givenconcrete is determined by the properties of the aggregates; those with a high modulus of elasticityor with rough surfaces are more resistant to the shrinkage process (see Figure 4.12 and Figure4.13) (Mindess et al., 1999).
• Water/cementitious materials ratio. Traditionally, it is accepted that the higher the water/cementi-tious materials ratio, the higher the shrinkage effects. Figure 4.14 is a typical plot relating shrinkageto aggregate content and, significantly, to the water/cement ratio. More recent work (Suprenantand Malisch, 2000), shown in Figure 4.15, indicates only a slight increase in average dryingshrinkage with increase in water content.
• Size of the concrete element. Both the rate and total magnitude of shrinkage decrease with anincrease in the volume of the concrete element; however, the duration of shrinkage is longer forlarger members as more time is needed for drying to reach the internal regions. It is possible that1 year may be required for the drying process to begin at a depth of 10 inches from the exposedsurface and 10 years for drying to begin at 24 inches below the external surface; large membersmay never dry out completely.
• Ambient conditions of the medium. The relative humidity of the medium greatly affects the mag-nitude of shrinkage; the rate of shrinkage is lower at high relative humidity. Temperature is anotherimportant factor, in that shrinkage becomes stabilized at low temperatures.
• Amount of reinforcement. Reinforced concrete shrinks less than plain concrete; the relative differ-ence is a function of the reinforcement percentage.
• Admixtures. This effect varies depending on the type of admixture. An accelerator such as calciumchloride, used to accelerate the hardening and setting of the concrete, increases the shrinkage.Pozzolans can also increase the drying shrinkage, whereas air-entraining agents have little effect.
• Type of cement. Rapid-hardening cement shrinks somewhat more than other types, whereas shrink-age-compensating cements minimize or eliminate shrinkage cracking when used with restrainingreinforcement.
FIGURE 4.12 Aggregate modulus effect on shrinkage strain. (From Mindess, S. et al., Concrete, Prentice Hall, UpperSaddle River, NJ, 1999. With permission.)
• Carbonation. Carbonation shrinkage is caused by the reaction between carbon dioxide (CO2)present in the atmosphere and that present in the cement paste. The amount of combinedshrinkage from carbonation and drying varies according to the sequence of carbonation anddrying processes. If both phenomena take place simultaneously, less shrinkage occurs. The processof carbonation, however, is dramatically reduced at relative humidity below 50%.
4.4.2 Shrinkage Prediction for Standard ConditionsThe mathematical model for shrinkage prediction in Equation 4.3 as an ACI 209 model is:
(4.9)
FIGURE 4.13 Aggregate content effect on drying shrinkage. (From Mindess, S. et al., Concrete, Prentice Hall, UpperSaddle River, NJ, 1999. With permission.)
FIGURE 4.14 Water/cement ratio and aggregate content effect on shrinkage. (From Nawy, E.G., Reinforced Concrete:A Fundamental Approach, 6th ed., Prentice Hall, Upper Saddle River, NJ, 2008.)
where β is a constant and t, in days, is the amount of time after curing that the concrete hardened. Thevalue of the ultimate shrinkage strain at the standard conditions defined in Table 4.1 has the followingrange:
stipulated by ACI Committee 209 (1992) is as follows:
Moist-cured for 7 days:
Steam-cured for 1 to 3 days:
A common sufficiently accurate average shrinkage strain in standard conditions for both moist-curedand steam-cured concretes (ACI Committee 209, 1992) is:
The values of constant b in the mathematical model of Equation 4.8 are b = 35 for 7-day moist-curedspecimens and b = 55 for 1- to 3-day steam-cured specimens; hence, the shrinkage-strain predictionexpressions for standard conditions become:
Shrinkage after 7 days of moist curing:
(4.10a)
where t is the age of concrete in days after curing.
Shrinkage after 1 to 3 days of steam curing:
(4.10b)
FIGURE 4.15 Effect of water content on 1-year drying shrinkage for concretes with and without water reducers.(From Suprenant, B.A. and Malisch, W. R., A New Look at Water, Slump, and Shrinkage, Technical Note, Paper No.C00D048, Hanley-Wood, Washington, D.C., 2000, pp. 1–6. With permission.)
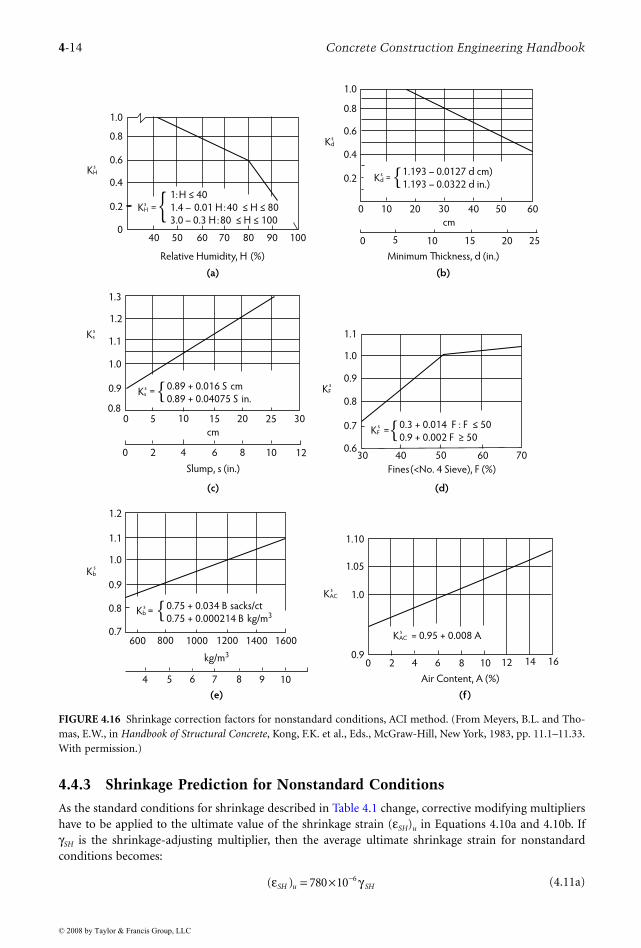
4.4.3 Shrinkage Prediction for Nonstandard Conditions
As the standard conditions for shrinkage described in Table 4.1 change, corrective modifying multipliershave to be applied to the ultimate value of the shrinkage strain (εSH)u in Equations 4.10a and 4.10b. IfγSH is the shrinkage-adjusting multiplier, then the average ultimate shrinkage strain for nonstandardconditions becomes:
(4.11a)
FIGURE 4.16 Shrinkage correction factors for nonstandard conditions, ACI method. (From Meyers, B.L. and Tho-mas, E.W., in Handbook of Structural Concrete, Kong, F.K. et al., Eds., McGraw-Hill, New York, 1983, pp. 11.1–11.33.With permission.)
where (εSH)u,n is the average ultimate strain for nonstandard conditions; hence, for nonstandard condi-tions, Equations 4.10a and 4.10b, respectively, become:
(4.12a)
and
(4.12b)
The multiplier γSH has component coefficients that account for the change in conditions enumerated inSection 4.4.1 (General Shrinkage Behavior). ACI Committee 435 (1995) recommends, in detailed tabularform, the various component coefficients for the γSH multiplier. These are generally based on Branson’s(1977) studies. The tabulated values (ACI Committee 435, 1995; Branson, 1977; Meyers and Thomas,1983) are given in graphical form in Figure 4.16 for:
(4.12c)
where values of these factors are given in Figure 4.13:
γSH = 1 for standard conditions.KH
s = relative humidity-factor.Kd
s = minimum member thickness factor.Ks
s = slump factor.KF
s = fine aggregate content factor.KB
s = cement-content factor.KAC
s = air-content factor.
4.4.4 Alternate Method for Shrinkage Prediction in Prestressed Concrete Elements
For standard conditions, the Precast/Prestressed Concrete Institute (PCI) stipulates an average value fornominal ultimate shrinkage strain (εSH)u = 820 × 10–6 in./in. (mm/mm). If εSH is the shrinkage strainafter adjusting for relative humidity (RH, in percent) at a volume-to-surface ratio (V/S, in inches), theshrinkage strain is:
(4.13)
where KSH =1.0 for pretensioned members. Table 4.2 gives the values of KSH for post-tensioned members.Adjustment of shrinkage losses for standard conditions as a function of time t, in days, is made usingEquations 4.10a and 4.10b for standard conditions and Equations 4.12a and 4.12b for nonstandardconditions.
TABLE 4.2 Values of KSH for Post-Tensioned Members
Time from End of Moist Curing to Application of Prestress (Days)
1 3 5 7 10 20 30 60
KSH 0.92 0.85 0.80 0.70 0.73 0.64 0.58 0.45
Source: Precast/Prestressed Concrete Institute (PCI), Chicago, IL.
The CEB-FIP 90 model proposed by the Euro-International Concrete Committee and the InternationalFederation for Prestressing is based on Muller and Hillsdorf (1990) and is only applicable for concretewith 28-day compressive strength in the range of 20 to 90 MPa. The input parameters of this modeldiffer from the ACI model in terms of compressive strength and type of curing method. The strain dueto shrinkage at normal temperature may be calculated from:
(4.14)
where:
εcso = shrinkage coefficient.βs = coefficient to describe shrinkage with time.t = age of concrete (days).ts = age of concrete (days) at the beginning of shrinkage.
4.4.6 Effects of Water and Slump on Drying Shrinkage
Traditionally, it has been accepted that the higher the water/cement ratio (w/c) and, correspondingly, thehigher the water/cementitious materials ratio (w/cm), the higher the shrinkage effects. This concept datesback to the early days of the 1930s and is exemplified by the relationship shown in Figure 4.16, whichrelates shrinkage to aggregate content and, significantly, to the water/cement ratio. More recent work(Suprenant and Malisch, 2000) has produced results that bring into question the degree of influence onthe drying shrinkage value by the increase in slump resulting from an increase in water content in themix. The indicated work, monitoring the increase in drying shrinkage over a 1-year period, demonstratedthat only a 5% increase in shrinkage resulted for each 2-inch increase in slump: “As a general rule ofthumb, each added gallon of water per cubic yard increases slump by 1 inch” (Suprenant and Malisch,2000). Figure 4.15 graphically illustrates that only a slight increase in average drying shrinkage resultsfrom appreciable increase in water content. The authors proposed in their investigation that, with properinspection, jobsite water additions seldom exceed 2 gallons of water per cubic yard of concrete, or enoughto increase the slump 2 inches. On this basis, the 2 gallons of water, or the extra 2 inches of slump, “mightincrease drying shrinkage by 4% to 5%,” which is not significant over a 1-year period after placement ofthe concrete.
4.5 Strength and Elastic Properties of Concrete vs. Time
4.5.1 Cylinder Compressive Strength (fc′)Cylinder compressive strength increases with time as the cement hydration reaction progresses in thepresence of water. As a function of time, the developing compressive strength is:
(4.15)
where:
α/β = age of concrete, in days, at which one half of the ultimate (in time) compressive strength ofconcrete (fc′)u is reached.
t = age of concrete in days.
The range of α and β for normal weight, sand lightweight, and all lightweight concrete is α = 0.05 to9.25, and β = 0.67 to 0.98. These constants are a function of the type of cement and the type of curingapplied. Typical values for α/β and the time strength ratios are given in Table 4.3.
4.5.2 Modulus of Rupture (fr) and Tensile Strength (ft′)The modulus of rupture (fr) can be expressed as:
(4.16)
where gr has a range of 0.6 to 1.00, with an average value of 0.65 (in SI units, this range is 0.012 to 0.021,with an average of 0.0135 MPa for fr); w is the unit weight of the concrete in pounds per cubic foot forfr in psi or kg/m3 for fr in megapascals. Hence, Equation 4.16 becomes:
(4.17a)
and
(4.17b)
Equation 4.17 is applicable for concrete strengths up to 12,000 psi (83 MPa). For normal weight concrete,w = 145 lb/ft3 (2320 kg/m3), and Equation 4.17 becomes:
(4.18a)
and
(4.18b)
ACI Committee 363 (1992) on high-strength concrete (Nawy, 1996, 2001) recommends higher valuesfor the modulus of rupture for normal weight concrete:
(4.19a)
and
(4.19b)
The tensile splitting strength ft′ as recommended in ACI Committee 363 (1992) and ACI Committee 435(1995) for normal weight concrete of a compressive-strength range up to 12,000 psi (83 MPa) is:
(4.20a)
and
(4.20b)
TABLE 4.3 Values of Constant α/β and Time Strength Ratio (fc′)t/(fc′)u at a Given Age
Source: ACI Committee 209, Prediction of Creep, Shrinkage, and Temperature Effects in Concrete Structures, ACI 209R-92,American Concrete Institute, Farmington Hills, MI, 1992, pp. 1–47.
The modulus of elasticity of concrete is strongly influenced by the concrete materials and mix proportionsused. An increase in compressive strength is accompanied by an increase in the modulus, as the slope ofthe ascending branch of the stress–strain diagram becomes steeper. For concretes with densities in therange of 90 to 155 lb/ft3 (1440 to 2320 kg/m3), based on the secant modulus at 0.45fc′ intercept andcompressive strength up to 6000 psi (42 MPa):
(4.21a)
and
(4.21b)
As the strength of the concrete increases beyond 6000 psi, the measured value of Ec increases at a slowerrate such that the value expressed in Equation 4.21 underestimates the actual value of the modulus. Thevalue of the modulus for a compressive strength range of 6000 to 12,000 psi (42 to 83 MPa) (Nilson,1985) can be predicted by:
(4.22a)
and
(4.22b)
Figure 4.17 gives the best fit for Ec vs. fc′ for high-strength concretes. Deviations from the predicted valuesare highly sensitive to properties of the coarse aggregate such as size, porosity, and hardness. When veryhigh-strength concretes (20,000 psi or 140 MPa, or higher) are used in major structures or whendeformation is critical, Ec should be determined from actual field cylinder test values and the 0.45 fc′intercept in the resulting stress–strain diagram. Long-term effects on the modulus of elasticity can beviewed in terms of the gain in the compressive strength (fc′)t such that:
(4.23)
where (fc′)t is equal to compressive strength at later ages and (fc′) is equal to the 28-day compressivestrength.
4.6 Serviceability Long-Term Considerations
In concrete structural members, serviceability is evaluated by cracking and deflection behavior. Creepand shrinkage effects on cracking and deflection are well established. Both deflections and crack widthsincrease with time. As a section cracks, its gross moment of inertia is reduced, resulting in reducedstiffness and larger deformations and deflections. The crack width (w) and the cracking moment (Mcr),are the principal parameters, together with the contribution of the reinforcement (compressive reinforce-ment in the case of deflection), that determine the long-term behavior of structural elements and systems.
4.6.1 Cracking Moment (Mcr) and Effective Moment of Inertia (Ie)
4.6.1.1 Reinforced Concrete Beams
Tension cracks develop when externally imposed loads cause bending moments in excess of the crackingmoment, Mcr. As a result, tensile stresses in the concrete at the tensile extreme fibers exceed the modulus
of rupture (fr) of the concrete. The cracking moment for an uncracked section can be computed fromthe basic flexural formula:
(4.24a)
or
(4.24b)
where:
Ig = gross moment of inertia.yt = distance form the neutral axis to the extreme tension fibers.fr = modulus of rupture.St = section modulus to the extreme tension fibers.
Cracks develop at several sections along a member length. At those sections where the modulus of rupture(fr) is exceeded, cracks develop and the moment of inertia is reduced to a cracked moment (Icr). At othersections where cracks do not develop, Ig is used for evaluating the stiffness of the sections.
Branson’s work (1977), the basis of the ACI 318 Code, proposed using the effective moment of inertia(Ie) for cracked sections:
(4.25)
FIGURE 4.17 Modulus of elasticity vs. concrete strength. (From Nilson, A.H., Design Implications of Current Researchon High Strength Concrete, ACI SP-87-7, American Concrete Institute, Farmington Hills, MI, 1985.)
1.66
Martinez, Nilson, and SlateMartinez, Nilson, and Slate
Mcr = cracking moment.Ma = maximum moment at the stage at which deflections are being considered.Ig = gross moment of inertia of the section.Icr = moment of inertia of the cracked transformed section.
The two moments, Ig and Icr, are based on the assumption of bilinear load-deflection behavior, as seenin Figure 4.18 (Nawy, 2008). The cracked moment of inertia (Icr) is:
(4.26)
where:
n = modular ratio = Es/Ec.ρ = As/bd.d = effective depth.
Equation 4.25 can be rewritten as follows:
(4.27)
For continuous beams, ACI 318 allows Ie to be taken as the average value obtained from Equation 4.25or Equation 4.26 for the critical positive and negative moment sections. For prismatic sections, Ie maybe taken as the value obtained at midspan for continuous spans. If the designer chooses to average theeffective moments of inertia (Ie), the following expression can be used:
(4.28)
where m, 1, and 2 refer to midspan and the two beam ends, respectively. Improved results for continuousprismatic members can be obtained by using a weighted average (ACI Committee 435, 1995) for beamsthat are continuous on both ends:
(4.29a)
FIGURE 4.18 Bilinear moment of inertia diagram. (From ACI Committee 435, Control of Deflection in ConcreteStructures, American Concrete Institute, Farmington Hills, MI, 1995.)
Ma
Mcr
Icr
Ig
Ie
δcrδe
Mo
me
nt
δe = Deflection using Igδcr = Deflection using Icr
The effective moment of inertia (Ie) in Equation 4.25 and Equation 4.27 is based on different momentlevels for Mcr and Ma in the case of prestressed concrete beams because of the initial compressive stressimposed by the prestressing force. The Mcr/Ma value is defined by:
(4.30)
where:
Here, λ = 1.0 for normal weight concrete; λ = 0.85 for sand lightweight concrete; λ = 0.75 for alllightweight concrete, and
Mcr = moment due to that portion of the unfactored live-load moment that causes cracking.Ma = maximum unfactored live-load moment.fTL = total calculated stress in the member.fL = calculated stress owing to live load.
In prestressed beams that are partially prestressed by the addition of mild steel reinforcement:
(4.31)
4.6.1.3 Effect of Compression Reinforcement
Compression reinforcement in reinforced flexural members and nontensioned reinforcement such as mildsteel in prestressed flexural members tend to offset the movement of the neutral axis caused by creep(ACI Committee 209, 1992). A reverse movement toward the tensile fibers can thus result. A multiplier(γ) has to be used to account for increase in deflection, as required in the ACI 318 Building Code:
(4.32)
where:
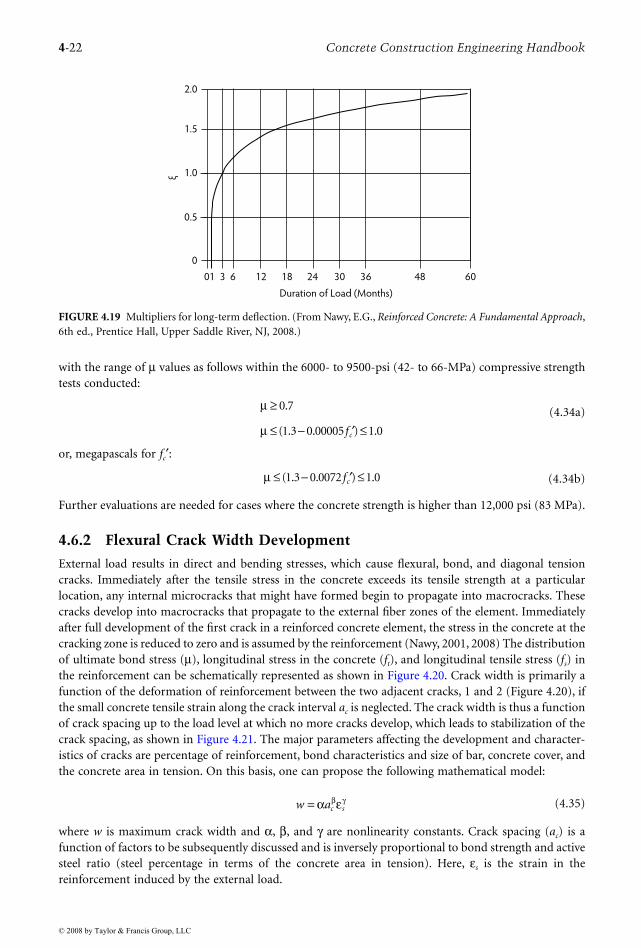
ξ = time-dependent factor for the long-term increase in deflection obtained from Figure 4.19 (ACICommittee 435, 1995).
ρ′ = As′ /bd.As′ = area of compression reinforcement (in square inches).
Nilson (1985) suggested that two modifying factors should be applied to Equation 4.32: the materialmodifier (µm) to be applied to ξ and the section modifier (µs) to be applied to ρ′. Both µm and µs havea value of 1 or less. Combining the two multipliers, without significant loss in accuracy, Equation 4.32becomes:
with the range of µ values as follows within the 6000- to 9500-psi (42- to 66-MPa) compressive strengthtests conducted:
(4.34a)
or, megapascals for fc′:
(4.34b)
Further evaluations are needed for cases where the concrete strength is higher than 12,000 psi (83 MPa).
4.6.2 Flexural Crack Width Development
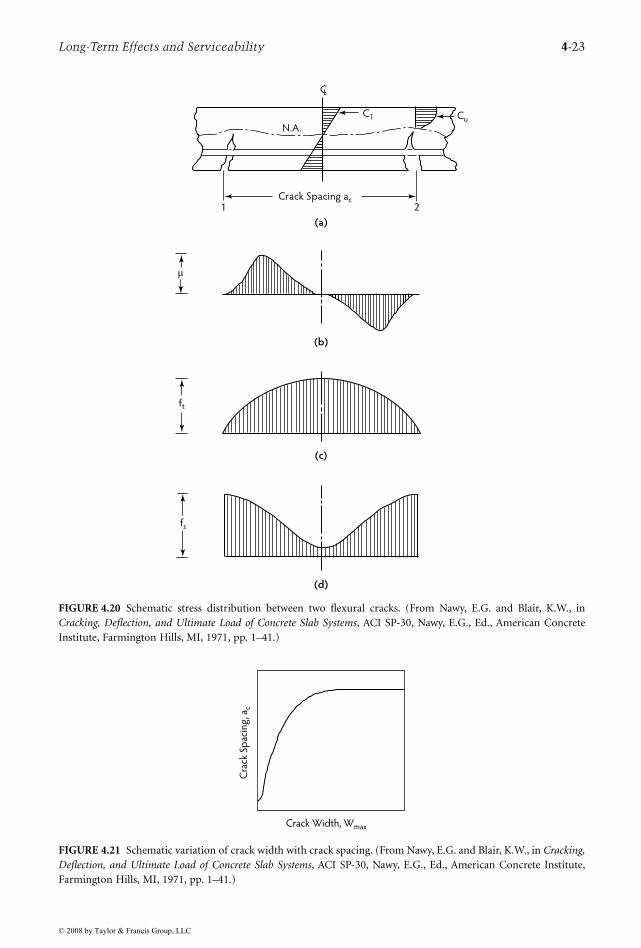
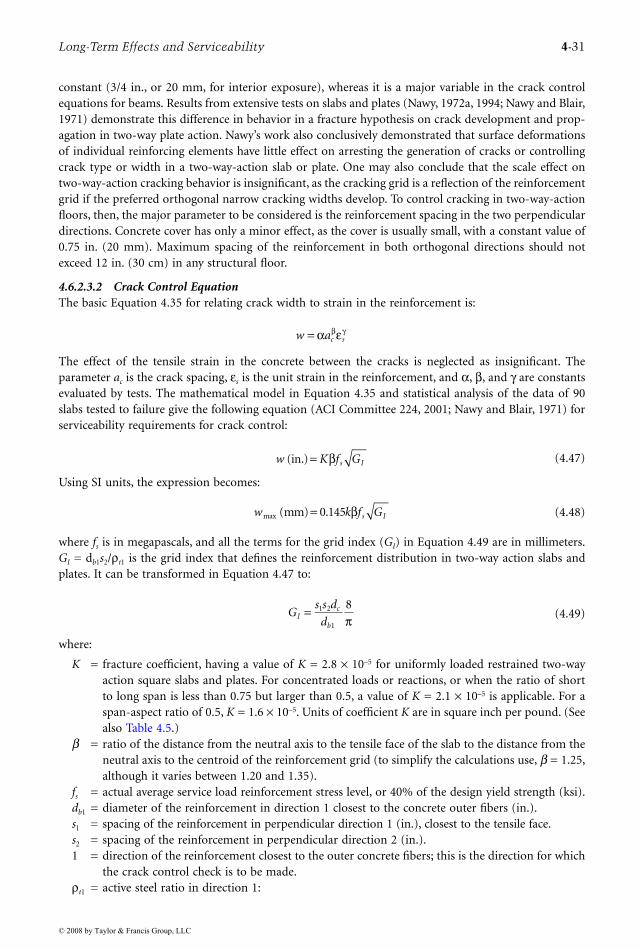
External load results in direct and bending stresses, which cause flexural, bond, and diagonal tensioncracks. Immediately after the tensile stress in the concrete exceeds its tensile strength at a particularlocation, any internal microcracks that might have formed begin to propagate into macrocracks. Thesecracks develop into macrocracks that propagate to the external fiber zones of the element. Immediatelyafter full development of the first crack in a reinforced concrete element, the stress in the concrete at thecracking zone is reduced to zero and is assumed by the reinforcement (Nawy, 2001, 2008) The distributionof ultimate bond stress (µ), longitudinal stress in the concrete (ft), and longitudinal tensile stress (fs) inthe reinforcement can be schematically represented as shown in Figure 4.20. Crack width is primarily afunction of the deformation of reinforcement between the two adjacent cracks, 1 and 2 (Figure 4.20), ifthe small concrete tensile strain along the crack interval ac is neglected. The crack width is thus a functionof crack spacing up to the load level at which no more cracks develop, which leads to stabilization of thecrack spacing, as shown in Figure 4.21. The major parameters affecting the development and character-istics of cracks are percentage of reinforcement, bond characteristics and size of bar, concrete cover, andthe concrete area in tension. On this basis, one can propose the following mathematical model:
(4.35)
where w is maximum crack width and α, β, and γ are nonlinearity constants. Crack spacing (ac) is afunction of factors to be subsequently discussed and is inversely proportional to bond strength and activesteel ratio (steel percentage in terms of the concrete area in tension). Here, εs is the strain in thereinforcement induced by the external load.
FIGURE 4.19 Multipliers for long-term deflection. (From Nawy, E.G., Reinforced Concrete: A Fundamental Approach,6th ed., Prentice Hall, Upper Saddle River, NJ, 2008.)
FIGURE 4.20 Schematic stress distribution between two flexural cracks. (From Nawy, E.G. and Blair, K.W., inCracking, Deflection, and Ultimate Load of Concrete Slab Systems, ACI SP-30, Nawy, E.G., Ed., American ConcreteInstitute, Farmington Hills, MI, 1971, pp. 1–41.)
FIGURE 4.21 Schematic variation of crack width with crack spacing. (From Nawy, E.G. and Blair, K.W., in Cracking,Deflection, and Ultimate Load of Concrete Slab Systems, ACI SP-30, Nawy, E.G., Ed., American Concrete Institute,Farmington Hills, MI, 1971, pp. 1–41.)
The basic mathematical model (Equation 4.35), with the appropriate experimental values of the constantsα, β, and γ, can be derived for a particular type of structural member. Such a member can be a one-dimensional element such as a beam, a two-dimensional structure such as a two-way slab, or a three-dimensional member such as a shell or circular tank wall. Hence, it is expected that different forms orexpressions apply for evaluation of macrocracking behavior of different structural elements consistent withtheir fundamental structural behavior (ACI Committee 224, 2001; ACI Committee 318, 2008; CEB-FIP,1990; Gergely and Lutz, 1968; Nawy, 1972a,b, 1994; Nawy and Blair, 1971).
4.6.2.1 Reinforced Concrete Beams and One-Way Slabs
The requirements for crack control in beams and thick one-way slabs—10 in. (250 mm) or thicker—inthe ACI Building Code (ACI Committee 318, 2008) are based on the statistical analysis of maximumcrack width data from a number of sources. On the basis of the analysis, the following general conclusionswere reached (Gergely and Lutz, 1968; Nawy, 1972a,b, 1994; Nawy and Blair, 1971):
1. The steel stress is the most important variable.2. The thickness of the concrete cover is an important variable.3. The area of concrete surrounding each reinforcing bar is an important geometric variable.4. Bar diameter is not a major variable.5. The bottom crack width is influenced by the amount of strain gradient from the level of the steel
to the tension face of the beam.
The simplified expression relating crack width to steel stress is (Gergely and Lutz, 1968):
(4.36a)
where:
fs = reinforcing steel stress (ksi).A = area of concrete symmetrical with reinforcing steel divided by number of bars (in.2).dc = thickness of concrete cover measured from extreme tension fiber to center of bar or wire closest
thereto (in.).β = h2/h1, where h1 is the distance from the neutral axis to the reinforcing steel (in.), and h2 is the
distance from the neutral axis to the extreme concrete tensile surface.
When the strain (εs) in the steel reinforcement is used instead of stress (fs), Equation 4.36a becomes:
(4.36b)
Equation 4.36b is valid in any system of measurement.The cracking behavior in thick one-way slabs is similar to that in shallow beams. For one-way slabs
that have a clear concrete cover in the range of 1 in. (25.4 mm), Equation 4.38 can be adequately appliedif β = 1.25 to 1.35 is used.
The ACI 318 Building Code currently uses reinforcement spacing as the criteria for control of thecrack width. It recommends for beams and one-way slabs the following expression:
(4.37)
but not greater than 12(40,000/fs), where:
s = spacing (in.).fs = calculated reinforcement stress at service level or alternatively taken as 2/3 the yield strength fy
(psi).cc = clear cover to the reinforcement (in.).
but not to exceed 300(280/fs), where fs in usual cases is taken as 252 MPa.It should be noted that the ACI expression is applicable to reinforced concrete beams and one-way
slabs in normal environmental conditions. In aggressive environments, such as liquid-retaining sanitarystructures, Equations 4.36a and 4.36b, with the appropriate limitation of tolerable crack widths listed inTable 4.4, are more appropriate in such cases.
4.6.2.2 Prestressed Concrete Beams
4.6.2.2.1 Crack SpacingPrimary cracks form in the region of maximum bending moment when the external load reaches thecracking load. Sometimes, in post-tensioned parking garage elements, cracks form in the draped regionbefore forming at the maximum moment region. They can also form at debonded tendon locations. Asloading is increased, additional cracks will form, and the number of cracks will be stabilized when thestress in the concrete no longer exceeds its tensile strength at further locations, regardless of load increase.This condition is important, as it essentially produces the absolute minimum crack spacing that canoccur at high steel stresses, and is termed the stabilized minimum crack spacing. The maximum possiblecrack spacing under this stabilized condition is twice the minimum and is termed the stabilized maximumcrack spacing. Hence, the stabilized mean crack spacing (acs) is deduced as the mean value of the twoextremes. The total tensile force (T) transferred from the steel to the concrete over the stabilized meancrack spacing (Nawy, 1990, 1994, 1996) can be defined as:
(4.39a)
where:
γ = a factor reflecting the distribution of bond stress.µ = maximum bond stress that is a function of .Σo = sum of reinforcing elements’ circumferences.
Figure 4.22 illustrates the forces that cause the formation of the stabilized crack.The resistance (R) of the concrete area in tension (At) can be defined as:
(4.39b)
where ft′ is the tensile splitting strength of the concrete.
TABLE 4.4 Maximum Tolerable Flexural Crack Widths
Exposure Condition
Crack Width
Inch Min.
Dry air or protective membrane 0.016 0.40Humidity, moist air, soil 0.012 0.30Deicing chemicals 0.007 0.18Seawater and seawater spray; wetting and drying 0.006 0.15Water-retaining structures (excluding nonpressure pipes) 0.004 0.10
Sources: ACI Committee 224, Proc. ACI J., 20(10), 35–76, 2001; Nawy, E.G., ReinforcedConcrete: A Fundamental Approach, 6th ed., Prentice Hall, Upper Saddle River, NJ,2008, p. 864.
By equating Equations 4.39a and 4.39b, the following expression for acs is obtained, where c is a constantto be developed from the tests:
(4.40a)
The concrete stretched area (namely, the concrete area At that is under tension for both the evenlydistributed and unevenly distributed reinforcing elements) is illustrated in Figure 4.23. With a meanvalue of:
the mean stabilized crack spacing becomes:
(4.40b)
4.6.2.2.2 Crack WidthIf ∆fs is the net stress in the prestressed tendon or the magnitude of the tensile stress in normal steel atany crack-width load level in which the decompression load (decompression here means fc′ = 0 at the
FIGURE 4.22 Force and stress distribution in stabilized crack in a prestressed beam. (From Nawy, E.G., in Crackingin Prestressed Concrete Structures, ACI SP-113, American Concrete Institute, Farmington Hills, MI, 1990, pp. 1–42.)
Id
dx
π
µ Bond Stress
TT + dT
M + dM Mac
12
Moment
Bending Steel Stress, fs
fs2 fs1
+µ –µ
Bond Stress, µ
Id
ac
fs2
= Crack spacing= Development length= Reinforcement stress at crack 2 > fa1
level of the reinforcing steel) is taken as the reference point (Nawy, 1990, 1996), then for the prestressedtendon:
(4.41)
where:
fnt = stress in the prestressing steel at any load beyond the decompression load.fd = stress in the prestressing steel corresponding to the decompression load.
Unit strain εs = ∆fs/Es. It is logical to disregard as insignificant unit strains in the concrete caused bytemperature, shrinkage, and elastic shortening effects. The maximum crack width as defined in Equation4.35 can therefore be taken as:
(4.42a)
or
(4.42b)
where k′ is a constant in terms of constant k.
4.6.2.2.3 Expression for Pretensioned BeamsEquation 4.42b is rewritten in terms of ∆fs to give the maximum crack width at the reinforcement levelas follows:
(4.43a)
where At = square inches, Σo = inches, and ∆fs = kips/in.2, and
(4.43b)
where At = cm2, Σo = cm, and ∆fs = MPa.
FIGURE 4.23 Effective concrete area in tension: (a) even reinforcement distribution; (b) non-even reinforcementdistribution. (From Nawy, E.G., in Cracking in Prestressed Concrete Structures, ACI SP-113, American ConcreteInstitute, Farmington Hills, MI, 1990, pp. 1–42.)
The maximum crack width (inches) at the tensile face of the concrete is:
(4.43c)
where Ri is the distance ratio equal to h2/h1, where h2 is the distance from the neutral axis to the extremetension fibers and h1 is the distance from the neutral axis to the reinforcement centroid. A plot of thepretensioned beams test data and the best fit expression for Equation 4.43a is given in Figure 4.24 witha 40% spread, which is reasonable in view of the randomness of crack development.
4.6.2.2.4 Expressions for Post-Tensioned BeamsThe expression developed for the crack width in post-tensioned bonded beams that contain mild steelreinforcement is:
(4.44a)
and
(4.44b)
for the crack width at the reinforcement level closest to the tensile face.At the tensile face, the crack width for the post-tensioned beams becomes:
(4.44c)
For nonbonded beams, the factor 6.51 in Equations 4.44a and 4.44c becomes 6.83. A plot of the data andthe best-fit expression for Equation 4.44a is given in Figure 4.25. A typical plot of the effect of the varioussteel percentages on the crack spacing at various stress levels (∆fs) is given in Figure 4.26. It can be seenfrom this plot that crack spacing stabilizes at a net stress level range of 30 to 36 kips/in.2 (207 to 248 MPa).
FIGURE 4.24 Linearized maximum crack width vs. (At/Σo)∆fs for pretensioned beams (Nawy, 1990, 1994, 1996, 2005).
4.6.2.2.5 Cracking of High-Strength Prestressed BeamsAnalysis of continuing subsequent work by the first author on the cracking behavior of pretensioned andnonbonded post-tensioned beams having cylinder compressive strengths in the range of 10,200 to 14,200psi (70.3 to 97.9 MPa) have resulted in the following expression for crack width at the reinforcementlevel of pretensioned members:
(4.45a)
and
(4.45b)
FIGURE 4.25 Linearized maximum crack width vs. (At/Σo)∆fs for post-tensioned beams (Nawy, 1990, 1994, 1996, 2005).
FIGURE 4.26 Effect of steel percentage on mean crack spacing in prestressed beams (Nawy, 1990, 1994, 1996, 2005).
The factor 2.75 is an average of values from the following statistical expression (Nawy, 1994) for areduction multiplier λr of wmax in Equation 4.43 such that:
(4.45c)
This reduced crack width due to use of high-strength concrete is expected in view of the increased bondinteraction between the concrete and the reinforcement.
4.6.2.2.6 Other Work on Cracking in Prestressed ConcreteAfter analyzing results from various investigators (Harajli and Naaman, 1989; Naaman and Siriaksorn,1979), Naaman produced the following modified expression for partially prestressed pretensioned members:
(4.46)
This expression is very close to that in Equation 4.43 by Nawy. If plotted against results of the variousresearchers’ work, it gives a best fit as shown in Figure 4.27.
4.6.2.3 Two-Way Supported Slabs and Plates
Flexural crack control is essential in structural floors, most of which are under two-way action. Cracksat service-load and overload conditions can be serious in floors such as those in office buildings, schools,parking garages, and industrial buildings and in other floors where the design service load and overloadlevels exceed loads in normal-size apartment building panels. Such cracks can only lead to detrimentaleffects on the integrity of the total structure, particularly in adverse environmental conditions.
4.6.2.3.1 Flexural Cracking Mechanism and Fracture HypothesisFlexural cracking behavior in concrete structural floors under two-way action is significantly differentfrom that in one-way members. Crack control equations for beams underestimate crack widths developedin two-way slabs and plates and do not tell the designer how to space reinforcement. Cracking in two-way slabs and plates is primarily controlled by the steel stress level and the spacing of reinforcement intwo perpendicular directions. In addition, the clear concrete cover in two-way slabs and plates is nearly
FIGURE 4.27 Reinforcement stress vs. crack width (best-fit data of several investigators). (From Nawy, E.G., inProceedings of CANMET International Symposium on Advances in Concrete Technology, 2nd ed., Malhotra, V.M., Ed.,Canada Center for Mineral and Energy Technology (CANMET), Ottawa, 1994, pp. 203–242.)
constant (3/4 in., or 20 mm, for interior exposure), whereas it is a major variable in the crack controlequations for beams. Results from extensive tests on slabs and plates (Nawy, 1972a, 1994; Nawy and Blair,1971) demonstrate this difference in behavior in a fracture hypothesis on crack development and prop-agation in two-way plate action. Nawy’s work also conclusively demonstrated that surface deformationsof individual reinforcing elements have little effect on arresting the generation of cracks or controllingcrack type or width in a two-way-action slab or plate. One may also conclude that the scale effect ontwo-way-action cracking behavior is insignificant, as the cracking grid is a reflection of the reinforcementgrid if the preferred orthogonal narrow cracking widths develop. To control cracking in two-way-actionfloors, then, the major parameter to be considered is the reinforcement spacing in the two perpendiculardirections. Concrete cover has only a minor effect, as the cover is usually small, with a constant value of0.75 in. (20 mm). Maximum spacing of the reinforcement in both orthogonal directions should notexceed 12 in. (30 cm) in any structural floor.
4.6.2.3.2 Crack Control EquationThe basic Equation 4.35 for relating crack width to strain in the reinforcement is:
The effect of the tensile strain in the concrete between the cracks is neglected as insignificant. Theparameter ac is the crack spacing, εs is the unit strain in the reinforcement, and α, β, and γ are constantsevaluated by tests. The mathematical model in Equation 4.35 and statistical analysis of the data of 90slabs tested to failure give the following equation (ACI Committee 224, 2001; Nawy and Blair, 1971) forserviceability requirements for crack control:
(4.47)
Using SI units, the expression becomes:
(4.48)
where fs is in megapascals, and all the terms for the grid index (GI) in Equation 4.49 are in millimeters.GI = db1s2/ρt1 is the grid index that defines the reinforcement distribution in two-way action slabs andplates. It can be transformed in Equation 4.47 to:
(4.49)
where:
K = fracture coefficient, having a value of K = 2.8 × 10⁻⁵ for uniformly loaded restrained two-wayaction square slabs and plates. For concentrated loads or reactions, or when the ratio of shortto long span is less than 0.75 but larger than 0.5, a value of K = 2.1 × 10⁻⁵ is applicable. For aspan-aspect ratio of 0.5, K = 1.6 × 10⁻⁵. Units of coefficient K are in square inch per pound. (Seealso Table 4.5.)
β = ratio of the distance from the neutral axis to the tensile face of the slab to the distance from theneutral axis to the centroid of the reinforcement grid (to simplify the calculations use, β = 1.25,although it varies between 1.20 and 1.35).
fs = actual average service load reinforcement stress level, or 40% of the design yield strength (ksi).db1 = diameter of the reinforcement in direction 1 closest to the concrete outer fibers (in.).s1 = spacing of the reinforcement in perpendicular direction 1 (in.), closest to the tensile face.s2 = spacing of the reinforcement in perpendicular direction 2 (in.).1 = direction of the reinforcement closest to the outer concrete fibers; this is the direction for which
the crack control check is to be made.ρt1 = active steel ratio in direction 1:
where c1 is the clear concrete cover measured from the tensile face of the concrete to the nearest edge ofthe reinforcing bar in direction 1, and w is the crack width (in.) at the face of the concrete caused byflexural load. Subscripts 1 and 2 pertain to the directions of reinforcement. Detailed values of the fracturecoefficients for various boundary conditions are given in Table 4.5. A graphical solution for Equation4.47 is given in Figure 4.28 for fy = 60 ksi (414 MPa), fs = 40%, and fy = 40 ksi (165.5 MPa) for rapiddetermination of the reinforcement size and spacing needed for crack control.
Because cracking in two-way slabs and plates is primarily controlled by the grid intersections of thereinforcement, concrete strength is not of major consequence; hence, the value of crack width in two-way action predicted by Equation 4.47 should not be significantly affected if higher strength concretesare used in excess of 6000 psi (41.4 MPa). It has to be pointed out that in two-way normal-slab floors,the use of much higher strengths is not justified in economical terms.
4.6.2.3.3 Tolerable Crack Widths in Concrete StructuresThe maximum crack width that a structural element should be permitted to develop depends on theparticular function of the element and the reasonable guide to the tolerable average crack widths inconcrete structures under various normally encountered environmental conditions. Its values are in closeagreement with the Comité Eurointernational du Beton recommendations (CEB-FIP, 1990) foremostexposure conditions. The crack-control equation and guidelines presented are important not only forthe control of corrosion in reinforcement but also for deflection control. The reduction of the stiffness(EI) of the two-way slabs or plates due to orthogonal cracking when the tolerable crack widths in Table4.6 are exceeded can lead to both short- and long-term excessive deflection. Deflection values that areseveral times greater than those anticipated in the design, including deflection due to constructionloading, can be reasonably controlled through camber and control of the flexural crack width in the slabor plate. Proper selection of reinforcement spacing s1 and s2 in the perpendicular directions, as discussedin this section, that does not exceed 12 in. (30 cm) center-to-center can maintain the good serviceabilityperformance of a slab system under normal and reasonable overload conditions.
4.6.2.3.4 Long-Term Effects on CrackingIn most cases, the magnitude of crack widths increases in long-term exposure and long-term loading.Increase in crack width can vary considerably in cases of cyclic loading, such as in bridges; however, thecrack width increases at decreasing rate with time. In most cases, a doubling of crack width after severalyears under sustained loading is not unusual.
TABLE 4.5 Fracture Coefficients for Slabs and Plates
A Square 4 edges r 1.0 2.1A Square 4 edges s 1.0 2.1B Rectangular 4 edges r 0.5 1.6B Rectangular 4 edges r 0.7 2.2B Rectangular 3 edges r, 1 edge h 0.7 2.3B Rectangular 2 edges r, 2 edges r 0.7 2.7B Square 4 edges r 1.0 2.8B Square 3 edges r, 1 edge h 1.0 2.9 B Square 2 edges r, 2 edges h 1.0 4.2
a A, concentrated; B, uniformly distributed.b r, restrained; s, simply supported; h, hinged.c S, clear short span; L, clear long span.Source: Nawy, E.G. and Blair, K.W., in Cracking, Deflection, and Ultimate Load of Concrete Slab Systems, ACI SP-30,Nawy, E.G., Ed., American Concrete Institute, Farmington Hills, MI, 1971, pp. 1–41.
4.6.2.4 Cracking in Circular Prestressed Concrete Tanks
Circular prestressed tanks are cylindrical shell elements of very large diameter in relation to their height;hence, with respect to flexural cracking, it is possible to treat the wall of a tank in a manner similar tothe treatment of two-way action plates. Vessey and Preston (1978) modified Nawy and Blair’s (1971)expressions for two-way action slabs and plates so the maximum crack width can be defined as:
FIGURE 4.28 Crack control reinforcement distribution in two-way action slabs and plates (Nawy, 1994, 2005; Nawyand Blair, 1971).
TABLE 4.6 Minimum Shrinkage and Temperature Reinforcement
Length between Movement Joints (ft)
Minimum Temperature and Shrinkage Reinforcement Ratio
Grade 40 Grade 60
Less than 20 0.0030 0.003020 to less than 30 0.0040 0.003030 to less than 40 0.0050 0.004040 and greater 0.0060a 0.0050a
a Maximum shrinkage and temperature reinforcement where move-ment joints are not provided.Note: When using this table, the actual joint spacing shall be multipliedby 1.5 if no more than 50% of the reinforcement passes through thejoint.Source: ACI Committee 350, Code Requirements for Environmental Engi-neering Concrete Structures, American Concrete Institute, FarmingtonHills, MI, 2001.
where, in the SI expression, Eps is in MPa, the dimensions of all the parameters of the grid index GI arein millimeters, and
εct = tensile surface strain in the concrete = (λtFp)/(Eps).fp = actual stress in the steel.fpi = initial prestress before losses.λt = fp/fpi.GI = grid index = (s1s2dc/db1)(8/π).db1 = diameter of steel in direction 1.s1 = spacing of the reinforcement in direction 1 closest to the tensile face.s2 = spacing of the reinforcement in direction 2.dc = concrete cover to center of steel, inches.
Note that wmax = 0.004 in. (0.1 mm) should be the limit of crack width for liquid-retaining tanks.
4.7 Long-Term Shrinkage and Temperature Reinforcement Controlling Cracking Between Joints in Walls and Slabs of Liquid-Retaining Structures
Cracking resulting from these unavoidable short-term and long-term strain gradients has always beena problem for the designer to consider as a significant factor in any structural design; hence, the useof joints is inevitable. It would be rare to find a structural system with total stress relievers, where ifenough reinforcement is provided in the direction of the induced forces to prevent the cracks fromopening then no joint would be needed. It would be economically prohibitive, as the volume ofreinforcement required to perform this task would be significant. Because the induced forces are highlyindeterminate, engineering judgment has to be exercised in interpreting the imprecise guidelines incodes and the literature on the type and spacing of joints to control cracking, which often renderconflicting solutions.
Table 4.6 and Figure 4.29 (ACI Committee 350, 2001) stipulate the reinforcement percentages ofshrinkage and temperature reinforcement for effective control of cracks that is essential to maintainbetween joints in liquid-retaining structures. Whereas the maximum percentage in Table 4.6 is givenas 0.5% for movement joints of 40 feet, the high rigidity of the foundation slab at the wall joint tothe slab renders this percentage inadequate. The relative lower flexibility of the wall as compared tothe stiff foundation slab at the lower wall segment makes the connection totally rigid with a lowmagnitude of rotation at the joint, as the wall is almost fixed at the base and free at the top. To preventlong-term vertical cracking concentration at the lower quarter of the wall height, it might even beprudent to use almost 1.0 to 1.25% horizontal reinforcement for the lowermost segment of the wallif the wall thickness is in the range of 30 in. Details regarding the design, spacing, and constructionof joints in most types of structural systems for the control of long-term cracking are covered inChapter 17 of this Handbook.
Shrinkage in early-age concrete is an important aspect in determining the long-term cracking performanceof concrete. The methods of curing have a significant effect on the level of shrinkage strains that develop,so it is useful to observe the different performances expected from different methods of curing and alsothe effect of the constituent cementitious materials on the autogenous shrinkage performance of the system.Tests by Suksawang et al. (2005) have provided a measure of differences in strains (hence, stresses) at 0 to7 days and up to 100 days of curing. Figure 4.30a (early-age performance) and Figure 4.30b (100-dayperformance) indicate that, after 28 days of curing, the dry-cured specimen exhibited steeper shrinkagelevels than the others due to the fact that less internally adsorbed water was available to prevent a higherincrease in shrinkage strains. Figure 4.31 shows the effect of the pozzolanic content in the mixture on theautogenous shrinkage, where concrete with fly ash outperformed the others. Figure 4.32 demonstrates thesignificant difference between the shrinkage performance of lightweight and normal weight aggregateconcrete under identical dry curing conditions and having the same water/cementitious ratio (w/cm) of0.29. Shrinkage in the lightweight aggregate concrete was almost stabilized with minimal increase inshrinkage strain after 36 hours at a shrinkage strain of 200 µε, whereas in the case of normal weight concreteit was close to 700 µε at the same time interval and continuing to increase at a fast rate. This behavior hasbeen observed by many investigators and can be attributed to the fact that lightweight aggregate concretehas a higher inert moisture content; hence, as the cement hydrates, it is constantly supplied with adsorbedmoisture, making the specimen, through internal curing, less susceptible to shrinkage.
Acknowledgments
This chapter is based on material appearing in the previous edition of this Handbook; from Fundamentalsof High-Performance Concrete, 2nd ed., by E.G. Nawy (John Wiley & Sons, 2001); from Reinforced Concrete:A Fundamental Approach, 6th ed., by E.G. Nawy (Prentice Hall, 2008); from Prestressed Concrete: AFundamental Approach, 5th ed., by E.G. Nawy (Prentice Hall, 2006); and from various committee reportsand standards of the American Concrete Institute, Farmington Hills, MI.
FIGURE 4.29 Shrinkage and temperature reinforcement for environmental engineering concrete structures (ACICommittee 224, 1995; ACI Committee 350, 2006).
ACI. 2008. Manual of Concrete Practice, Vols. 1–5. American Concrete Institute, Farmington Hills, MI.ACI Committee 209. 1992. Prediction of Creep, Shrinkage, and Temperature Effects in Concrete Structures,
ACI 209R-92. American Concrete Institute, Farmington Hills, MI, pp. 1–47.ACI Committee 224. 1995. Joints in Concrete Construction, ACI 224-3R-95. American Concrete Institute,
Farmington Hills, MI, 2005, pp 1–44.ACI Committee 224. 2001. Control of cracking in concrete structures. Proc. ACI J. 20(10), 35–76.ACI Committee 318. 2008. Building Code Requirements for Structural Concrete, 318-08; Commentary, ACI
318R-08. American Concrete Institute, Farmington Hills, MI.ACI Committee 350. 2006. Code Requirements for Environmental Engineering Concrete Structures and
Commentary, ACI 350/ACI 350R. American Concrete Institute, Farmington Hills, MI.ACI Committee 363. 1992. State-of-the-Art Report on High-Strength Concrete, ACI 363R-92. American
Concrete Institute, Farmington Hills, MI, pp. 1–55.ACI Committee 435. 1995. Control of Deflection in Concrete Structures. American Concrete Institute,
Farmington Hills, MI, p. 77.Bazant, Z.P. and Boweja, S. 1995a. Justification and refinements of model B3 for concrete and shrinkage.
1. Statistics and sensitivity. Mater. Struct., 28(181), 415–430.Bazant, Z.P., and Boweja, S. 1995b. Justification and refinements of model B3 for concrete and shrinkage.
2. Updating and theoretical basis. Mater. Struct., 28(182), 488–495.Bazant, Z.P. and Boweja, S., 2000a. Creep and shrinkage prediction model for analysis and design of
concrete structures: model B3. In The Adam Neville Symposium: Creep and Shrinkage—StructuralDesign Effects, SP-194. American Concrete Institute, Farmington Hills, MI, pp. 1–83.
Bazant, Z.P. and Boweja, S., 2000b. Creep and shrinkage prediction model for analysis and design ofconcrete structures: model B3 (short form). In The Adam Neville Symposium: Creep and Shrinkage—Structural Design Effects, SP-194. American Concrete Institute, Farmington Hills, MI, pp. 85–100.
Bazant, Z.P. and Murphy, W.P. 1995. Creep and shrinkage prediction model for analysis and design ofconcrete structures: model B3. Mater. Struct., 28(180), 357–365.
Branson, D.E. 1971. Compression steel effects on long-term deflections, Proc. J. Am. Concrete Inst., 68,555–559.
Branson, D.E. 1977. Deformation of Concrete Structures. McGraw-Hill, New York, p. 546.CEB-FIP. 1990. Model Code for Concrete Structures, Vols. 1–3. CEB-FIP, Paris.
FIGURE 4.32 Effect of aggregate type on autogenous shrinkage of concrete.
Gardner, N.J., 2000. Design provisions for shrinkage and creep of concrete. In The Adam Neville Sym-posium: Creep and Shrinkage—Structural Design Effects, SP-194. American Concrete Institute,Farmington Hills, MI, pp. 101–134.
Gardner, N.J. and Lockman, M. 2001. Design provision for drying shrinkage and creep of normal-strengthconcrete, ACI Mater. J., 98, 159–167.
Gergely, P. and Lutz, L.A. 1968. Maximum crack width in reinforced concrete flexural members. In Causes,Mechanism, and Control of Cracking in Concrete, ACI SP-20, Nawy, E.G., Ed., pp. 87–117. AmericanConcrete Institute, Farmington Hills, MI.
Harajli, M.H. and Naaman, A.E. 1989. Cracking in partially prestressed beams under static and fatigueloading. In Cracking in Prestressed Concrete Structures, ACI SP-113, pp. 29–56. American ConcreteInstitute, Farmington Hills, MI.
Meyers, B.L. and Thomas, E.W. 1983. Elasticity, shrinkage, creep and thermal movement of concrete. InHandbook of Structural Concrete, Kong, F.K. et al., Eds., pp. 11.1–11.33. McGraw-Hill, New York.
Mindess, S., Young, J.F., and Darwin. 1999. Concrete. Prentice Hall, Upper Saddle River, NJ, p. 671.Muller, H.S. and Hillsdorf, H.K. 1990. Evaluation of Time Dependent Behavior of Concrete, Summary
Report of General Task Force 9, CEB Bulletin d’Information, No. 199, p. 290.Naaman, A.E. and Siriaksorn, A. 1979. Serviceability based design of partially prestressed beams. Part I.
Analysis. Proc. PCI J., 24(2), 64–89.Nawy, E.G. 1972a. Crack control through reinforcement distribution in two-way acting slabs and plates.
Proc. ACI J., 69(4), 217–219.Nawy, E.G. 1972b. Crack control in beams reinforcement with bundled bars. Proc. ACI J., 69, 637–639.Nawy, E.G. 1990. Flexural cracking behavior of partially prestressed pretensioned and post-tensioned
beams: state-of-the-art. In Cracking in Prestressed Concrete Structures, ACI SP-113, pp. 1–42. Amer-ican Concrete Institute, Farmington Hills, MI.
Nawy, E.G. 1994. Cracking of concrete: ACI and CEB approaches. In Proceedings of the CANMETInternational Symposium on Advances in Concrete Technology, 2nd ed., Malhotra, V.M., Ed., pp.203–242. Canada Center for Mineral and Energy Technology (CANMET), Ottawa.
Nawy, E.G. 1996. Fundamentals of High-Strength, High-Performance Concrete. Addison Wesley Longman,London, 350 pp.
Nawy, E.G. 2001. Fundamentals of High-Performance Concrete, 2nd ed. John Wiley & Sons, New York,440 pp.
Nawy, E.G. 2003. Design for Crack Control in Reinforced and Prestressed Concrete Beams, Two-Way Slabsand Circular Tanks, ACI SP 204-1. American Concrete Institute, Farmington Hills, MI, pp. 1–42.
Nawy, E.G. 2006a. Concrete: The Sustainable Infrastructure Material for the 21st Century, TRB Circular E-C103. Transportation Research Board, National Research Council, Washington, D.C., pp. 1–23.
Nawy, E.G. 2006b. Prestressed Concrete: A Fundamental Approach, 5th ed. Prentice Hall, Upper SaddleRiver, NJ, 944 pp.
Nawy, E.G. 2008. Reinforced Concrete: A Fundamental Approach, 6th ed., pp. 934. Prentice Hall, UpperSaddle River, NJ.
Nawy, E.G. and Blair, K.W. 1971. Further studies on flexural crack control in structural slab systems. InCracking, Deflection, and Ultimate Load of Concrete Slab Systems, ACI SP-30, Nawy, E.G., Ed., pp.1–41. American Concrete Institute, Farmington Hills, MI.
Neville, A.M. 1995. Properties of Concrete, 4th ed. Addison Wesley Longman, London, 844 pp.Nilson, A.H. 1985. Design Implications of Current Research on High-Strength Concrete, ACI SP-87-7.
American Concrete Institute, Farmington Hills, MI, pp. 85–118.Ross, A.D. 1937. Creep concrete data. Proc. Inst. Struct. Eng., 15, 314–326.Ross, A.D. 1958. The elasticity, creep and shrinkage of concrete. In Proceedings of the Conference on Non-
Metallic Brittle Materials, pp. 157–174. Interscience, London.Shah, S.P. and McGarry, F.J. 1971. Griffith fracture criteria and concrete, Proc. J. Eng. Mech. Div. ASCE,
Suksawang, N., Nassif, H., and Mohammed, A. 2005. Creep and shrinkage of high-performance/high-strength concrete. In ACI Seventh International Symposium on Utilization of High-Strength/High-Performance Concrete, Vol. 2, ACI SP-228, pp. 1397–1416. American Concrete Institute, FarmingtonHills, MI.
Suprenant, B.A. and Malisch, W.R., 2000. A New Look at Water, Slump, and Shrinkage, Technical Note,Paper No. C00D048, Hanley-Wood, Washington, D.C., pp. 1–6.
Vessey, J.V. and Preston, R.L. 1978. A Critical Review of Code Requirements for Circular Prestressed ConcreteReservoirs, Federation International Precontrainte, Paris, p. 6.