55
Long Term Financial Plan 2015/2016 to 2024/2025

Long Term Financial Plan 2015/2016 to 2024/2025

Bellingen Shire Council Long Term Financial Plan
2
Contents
1.0 Introduction ................................................................................................................................... 4
1.1 Overview .................................................................................................................................... 4
1.2 Fit for the Future ....................................................................................................................... 4
1.3 NSW Treasury Corp Sustainability Assessment ......................................................................... 6
1.4 Why Do We Need a Long Term Financial Plan? ......................................................................... 8
1.5 Objectives ................................................................................................................................... 8
2.0 Planning Assumptions .................................................................................................................... 9
2.1 Financial Services Model 1 – Service Levels Maintained............................................................ 9
2.2 Financial Services Model 2 – Service Levels Reduced .............................................................. 10
2.3 Financial Services Model 3 – Meeting ‘Fit For the Future’ Requirements by 2020 ................. 10
3.0 Current Financial Position ............................................................................................................ 11
4.0 Revenue Forecasts ....................................................................................................................... 12
4.1 Rates and Annual Charges ........................................................................................................ 12
4.2 User Fees and Charges ............................................................................................................. 14
4.3 Interest Revenue and Investments .......................................................................................... 14
4.4 Other Revenues ........................................................................................................................ 15
4.5 Grants and Contributions – Operating and Capital .................................................................. 15
5.0 Expenditure Forecasts ................................................................................................................. 16
5.1 Employee Costs ........................................................................................................................ 16
5.2 Borrowings ............................................................................................................................... 16
5.3 Materials and Contracts ........................................................................................................... 17
5.4 Depreciation ............................................................................................................................. 17
5.5 Other Expenses ......................................................................................................................... 17
5.6 Asset Management................................................................................................................... 18
6.0 Performance Measures ............................................................................................................... 19
6.1 Sustainability Measures............................................................................................................ 19

Bellingen Shire Council Long Term Financial Plan
3
6.1.1 Operating Performance Ratio ............................................................................................. 19
6.1.2 Own Source Operating Revenue Ratio ................................................................................ 20
6.2 Effective Infrastructure and Service Management ................................................................ 21
6.2.1 Infrastructure Backlog Ratio ................................................................................................ 21
6.2.2 Asset Maintenance Ratio .................................................................................................... 21
6.2.3 Debt Service Ratio ............................................................................................................... 22
6.3 Efficiency Measures .................................................................................................................. 23
6.3.1 Real Operating Expenditure per capita ............................................................................... 23
7.0 Sensitivity Analysis and Financial Modelling ............................................................................... 25
7.1 Employee Costs ........................................................................................................................ 25
7.2 Rates and Annual Charges Revenue ......................................................................................... 25
7.3 Inflation .................................................................................................................................... 26
7.4 Investment Returns .................................................................................................................. 26
7.5 Grants and Contributions ......................................................................................................... 26
7.6 Financial Services Model 1: Service Levels Maintained .......................................................... 27
7.7 Financial Services Model 2: Service Levels Reduced ............................................................... 27
7.8 Financial Services Model 3: Meeting ‘Fit For the Future’ Requirements by 2020 .................. 28
8.0 Appendices .................................................................................................................................. 29

Bellingen Shire Council Long Term Financial Plan
4
1.0 Introduction
1.1 Overview Bellingen Shire has a rich and diverse community with a focus on quality of lifestyle. To ensure that our community’s ideals and values of a healthy, safe and sustainable shire continue into the future, Bellingen Shire Council (BSC) developed its Bellingen 2030 Community Vision. To support the Community Vision, Council has developed a Long Term Financial Plan that plots how the vision will be translated into reality. Local Government has faced many challenges over recent years, both from within the Shire and from the wider environment. Rate peg increases set by the NSW Government have often fallen short of inflation over the years, meaning that costs are increasing at a higher rate than revenues. This has meant that Council’s across the State have been significantly disadvantaged by rate pegging, with the effect that councils have for an extended period spent less than is required on asset maintenance and renewals. Many services that were handled by the State or Commonwealth Government have been moved to Local Government without an appropriate funding adjustment, a process known as “cost shifting”. Increased government reporting requirements, such as asset reporting, have also impacted on costs. From within the Shire, the demand for improved service levels and new services has again increased costs. All of these impacts have left councils with fewer funds to put towards essential services such as infrastructure maintenance and renewal. As a result of this, in 2011 the NSW Government began an unprecedented era of change to local government, starting with a collaboration of councils from across NSW, from which came the:
Destination 2036 review;
Independent Local Government Review;
NSW Treasury Corp sustainability review;
Local Government Infrastructure Audit;
Local Government Acts Taskforce;
introduction of the Integrated Planning and Reporting (IP&R) Framework; and
Fit for the Future program. The aim of the changes is to build stronger, more viable local governments that are financially sustainable, innovative and strategic.
1.2 Fit for the Future
Fit for the Future is a NSW Government initiative aimed at Local Government reform. The Fit for the Future process will help Councils demonstrate to their communities that they are financially sound, operating efficiently and in a strong position to guide growth and deliver quality services into the future.
The Fit for the Future program provides a roadmap
A Fit for the Future council is one that is:
• Sustainable; • Efficient; • Effectively manages infrastructure and
delivers services for communities; • Has the scale and capacity to engage
effectively across community, industry; and government.

Bellingen Shire Council Long Term Financial Plan
5
to outline how councils will become “Fit for the Future”. Councils will be assessed on their ability to be
sustainable and efficient, effectively manage infrastructure, deliver services for their communities, and
have the scale and capacity to engage effectively across community, industry and government.
What does this mean for BSC?
The NSW Government set up the Independent Local Government Review Panel in April 2012 to carry out
the reforms proposed under the Destination 2036 report. Some of the reforms proposed were:
Some Councils to consider amalgamating to achieve increased scale and capacity;
Councils to form Joint Organisational Structures to help Councils to tackle wider regional issues;
NSW Treasury Corporation to conduct a financial review and provide a financial sustainability
assessment of each Council.
Regional Joint Organisational Structures were proposed to act as a forum for Councils and the State to
work together to deliver regional priorities, such as jobs, education, housing, roads and transport. The
three core functions of the Joint Organisations are:
Regional strategic planning;
Working with the State Government;
Regional leadership and advocacy.
They may also decide to undertake such optional functions as regional service delivery and skill sharing.
The Local Government Review Panel has recommended that Bellingen Shire Council retain its
independence as a stand-alone council, and become a member of the North Coast Joint Organisation in
partnership with three of our neighbouring local councils:
Nambucca Shire Council;
Coffs Harbour City Council; and
Clarence Valley Council.
BSC now needs to demonstrate how it will become sustainable, provide efficient and effective services
and continue to meet the needs of our local community. Council will do this by developing an
improvement strategy and action plan (roadmap) demonstrating how we can better meet the
benchmarks provided by the NSW government. This strategy and action plan will then feed into the Fit
for the Future submission to be submitted to the Office of Local Government by 30 June 2015.
The self-assessment submission focuses on a number of key benchmarks to determine if Council is fit for
the future. At present, only two of the seven key performance indicators meet the Fit for the Future
benchmarks. In order to become a Fit for the Future council and receive the benefits offered by the
NSW Government, BSC must show that it is effectively addressing asset management and infrastructure
backlog issues with a focus on long term sustainability.

Bellingen Shire Council Long Term Financial Plan
6
BSC’s result as at the 30 June 2014 is as follows:
The Fit for the Future Key Performance Indicators (KPIs) / benchmarks are discussed further under
Section 6.0 Performance Measures.
It is recognised that there are many factors that will influence the above ratios that are outside the
control of Council. Some of the major contributing factors that may heavily influence Bellingen’s
performance into the future include:
High rainfall with frequent flooding events;
Large portions of Non-Rateable land (State Forests, Crown Reserves and National Parks);
Socio Economic factors.
The benefits of becoming a Fit for the Future council are:
Access to a streamlined IPART process for rate increases above the rate pegging limit;
Access to a NSW Treasury Corporation (TCorp) borrowing facility that will save on the cost of borrowing;
Priority access to other State funding and grants; and
Eligibility for additional devolved planning powers in relation to the making of local environmental plans and development decisions, and opportunities for further devolving planning powers.
1.3 NSW Treasury Corp Sustainability Assessment
In 2013, the NSW Government engaged NSW Treasury Corp (TCorp) to undertake a financial capacity
and sustainability review of all NSW councils. The review considered the Councils’ financial performance
against a range of benchmarks, looking at Councils’ borrowing capacity and their financial sustainability.

Bellingen Shire Council Long Term Financial Plan
7
To be considered financially sustainable, Councils had to show that they had sufficient revenue to
deliver the level of services that the communities expect. The outcome was that each Council was
provided with a Financial Sustainability Rating (FSR) and financial outlook.
Bellingen Shire Council received a FSR rating of moderate and an outlook of negative. This means that
Council has adequate capacity to meet its financial commitments in the short to medium term, and
acceptable capacity in the longer term. However, the negative rating means that Council’s financial
position could deteriorate in the future unless it takes steps to improve its sustainability.
In its review, TCorp made the following observations of BSC:
Council’s Unrestricted Current Ratio had been well above benchmark for the previous four
years, indicating sufficient liquidity;
BSC had operating deficits for the previous four years, and forecasted operating deficits into the
future;
High reliance on grants, not sustainable without grants;
Forecast capital expenditure was insufficient to cover the cost of forecast asset renewals;
No additional borrowing capacity in the short to medium term;
A high number of flood events had negatively affected BSC’s operating expenses and ability to
renew its assets;
High infrastructure backlog with an increasing trend.
For Councils assigned with a negative outlook, TCorp provided some recommendations and areas of
investigations to assist in improving the sustainability position. The recommendations include:
The need to source additional revenue, such as by a Special Rate Variation (SRV);
For Councils with sufficient borrowing capacity, to consider using debt funding to reduce
infrastructure backlogs;
Devising programs and strategies to contain costs and improve efficiencies;
Further improvements in Asset Management Plans and integration into the Long Term Financial
Plan;
Increasing spending on maintenance and infrastructure renewal while balancing this with the
need for capital expenditure on new assets.
In answer to the TCorp Review, Council has already undertaken a broad range of initiatives to address
the issues, including:
successfully secured a Special Rate Variation
reviewed user fees and charges
conducting a review of assets and depreciation
conducting a review of services
forming the Financial Sustainability Program Board (FSPB)
Each of the above measures has been factored into the LTFP and is discussed in greater detail in the
revenue and expenditure forecasts (sections 4.0 and 5.0).

Bellingen Shire Council Long Term Financial Plan
8
1.4 Why Do We Need a Long Term Financial Plan? One of the key changes introduced by the NSW Office of Local Government was the introduction of the Integrated Planning and Reporting (IP&R) Framework. The IP&R Framework recognises that council’s plans and policies need to connect together to achieve the community’s needs and aspirations. As part of the framework, Council is required to prepare a Resourcing Plan which forms part of the Community Strategic Plan and Bellingen Shire Community Vision, and includes a Long Term Financial Plan (LTFP).
Council’s Long Term Financial Plan provides a framework to assess its revenue building capacity to meet the activities and level of services outlined in its Community Vision.
The LTFP is required to be produced annually with a detailed review every four years, and cover a minimum period of 10 years.
In preparing the LTFP, BSC seeks to:
Establish greater transparency and accountability of Council to the Community;
Provide an opportunity for early identification of financial issues and any likely impacts in the longer term;
Provide a mechanism to: • Solve financial problems as a whole • See how various plans fit together • Understand the impact of some
decisions on other plans or strategies;
Provide a means of measuring Council’s success in implementing strategies; and
Confirm that Council can remain financially sustainable in the longer term.
1.5 Objectives For Council to be financially sustainable, it must be able to live within its means. Council must move towards a position where its operating revenue is covering its operating expenditure, including the cost of maintenance and renewal of its assets. The LTFP has been prepared with the following objectives in mind:
Maintaining a fair and equitable rating, fees and charges structure;
Creating pricing structures that effectively address the economic cost of providing the service whilst not precluding community members access to essential services because of individual economic circumstances (refer section 4.2 User Fees and Charges);
Allocating resources that achieves maximum result in meeting Community Vision goals and objectives;
Achieving a strong asset management position;
Long term financial sustainability;
Moving towards achieving a minimum break even operating result by 2027.
Long Term Financial Plan (LTFP)
As one of a suite of long term plans required
under the Integrated Planning and Reporting
framework (IP&R), the LTFP forecasts BSC’s
financial capacity to meet the objectives
adopted in the Community Vision.
The LTFP includes:
• planning assumptions • projected income and expenditure • projected balance sheet and cashflow
• performance monitoring methods
• sensitivity analysis
• scenario modelling

Bellingen Shire Council Long Term Financial Plan
9
2.0 Planning Assumptions
A long term financial plan is dependent on a number of planning assumptions. In preparing the LTFP
Council considered a range of matters and made appropriate assumptions. These assumptions were
used to model and formulate the plan, test a range of scenarios and have ultimately formed the basis of
the agreed plan.
Some of the key variables reviewed as part of the setup of the LTFP include:
Consumer Price Index (CPI) (refer to table 2.1)
Salaries and Employee Costs (refer to table 2.1)
Investment Income (refer to table 2.1)
Rate Pegging (refer to table 2.1)
Sewer Rates (refer to table 2.1)
Waste Charges (refer to table 2.1)
Fees and Charges (refer to table 2.1)
Service Levels - Refer to Bellingen Shire Council Community Strategic Plan (CSP).
Population Growth - Given the uncertainty in population growth in regional NSW it was
concluded that growth in rate revenue or in additional revenue from fees and charges given the
projected size of the market was negligible. Also, any increase in revenue maybe offset against
any increase in costs servicing a greater population base. As a result the LTFP has been prepared
on the assumption of a constant population base.
Economic Growth - As per above, due to uncertainties in economic growth rates in regional
NSW the LTFP has been prepared on the assumption of a constant economic growth rate (status
quo).
As part of the planning process Council modelled three different scenarios in the LTFP. The scenarios
tested as part of the modelling process are:
Financial Services Model 1 – Service Levels Maintained
Financial Services Model 2 – Service Levels Reduced
Financial Services Model 3 – Meet ‘Fit For the Future’ requirements by 2020
2.1 Financial Services Model 1 – Service Levels Maintained
The ‘Financial Services Model 1’ is the base model used throughout this document and assumes a
permanent 6% per year special rate variation across all categories in years 2016/17 – 2024/25. The
scenario also models a $250K (2015/16) and $300K (2016/17) operational cost reductions/savings
continued throughout the LTFP in order to improve Councils infrastructure.
All assumptions detailed in Section 4 and 5 are based on the ‘Financial Services Model 1’. Please refer to
the table in 2.1 for the model assumptions and key indices.

Bellingen Shire Council Long Term Financial Plan
10
2.2 Financial Services Model 2 – Service Levels Reduced
The purpose of the ‘Financial Services Model 2’ is to model the impact on Councils financial position if
Council was not to include any new special variation over the life of LTFP i.e. increase rates by the
annual rate peg limit only. This model incorporates a permanent special variation that commenced in
the 2014/15 financial year to fund road improvements and maintenance, as well as infrastructure
programs. This scenario also models a $1.5M operational cost reductions/savings in 2015/16 continued
throughout the LTFP in order to improve Councils infrastructure.
2.3 Financial Services Model 3 – Meeting ‘Fit For the Future’ Requirements by 2020
The purpose of the ‘Financial Services Model 3’ is to model the impact on Councils financial position if
Council were to meet all required FFF ratios by year 5 (2019/20) of the plan. Model includes a $250K
(2015/16) and $300K (2016/17) operational cost reductions/savings continued throughout the LTFP in
order to improve Councils infrastructure and assumes a permanent 16% per year special rate variation
across all categories in years 2016/17 – 2019/20.
Table 2.1: Summary of Key Planning Assumptions
Assumption/Variable Calculation Basis LTFP %
Consumer Price Index (CPI) NSW Treasury Corporation Forecasts 2.50%
Salaries and Employee Oncosts Award increases and performance based increases
3.50% - 15/16
3.00%
(years 2-10)
Interest Rate Income Market estimate 3.00% - 5.00%
Rate Pegging (General Rates
Income)
Independent Pricing and Regulatory Tribunal (IPART)
and Dept. Local Government figures
2.40% - 15/16
3.00%
(years 2-10)
Sewer Rates Income Hydro Science draft 30 year business plan
5.00% - 15/16
3.00%
(years 2-10)
Water Rates Income Hydro Science draft 30 year business plan
5.00% - 15/16
3.00%
(years 2-10)
Waste Charges Income Based on reasonable cost estimates
3.50% - 15/16
3.00%
(years 2-10)
Fees and Charges Income As per wages above + TCorp Recommendation 3.50%

Bellingen Shire Council Long Term Financial Plan
11
3.0 Current Financial Position As highlighted above through both TCorp’s financial assessment and the Fit for the Future analysis, BSC does not have the required level of revenue to meet expenditure requirements into the future. Without strong corrective measures the financial sustainability of Council will deteriorate significantly into the future. The current financial position of BSC is represented in the table below: Table 3.1 Financial summary as at 30 June 2014 (Source: BSC Financial Statements 13/14)
$'000
INCOME STATEMENT
Total Income from Continuing Operations (including capital) $27,276
Total Expenditure from Continuing Operations $32,142
Net Operating Result for the year (including capital) -$4,876
Net Operating Result Excluding Capital Revenue -$8,976
BALANCE SHEET
Total Current Assets $35,151
Total Non-Current Assets $524,004
Total Current Liabilities $5,728
Total Non-Current Liabilities $5,465
Total Equity $547,962
CASH FLOW STATEMENT
Net Cash Provided - Operating Activities $3,863
Net Cash Used - Investing Activities -$12,805
Net Cash Provided - Financing Activities -$136
Net Decrease in Cash -$9,078
Cash - Beginning of Year $15,143
Cash End of Year $6,065
Investments on Hand - End of Year $23,100
Total Cash, Cash Equivalents & Investments $29,165
The following pie graph shows the breakup of Council’s Income and Expenditure sources for the 2013/14 year:
Table 2.2 Graph of Income and Expenditure as at 30 June 2014 (Source: BSC Financial Statements 13/14)

Bellingen Shire Council Long Term Financial Plan
12
4.0 Revenue Forecasts The LTFP revenue projections over the 10 years of the plan have been based on current knowledge of revenue indices, Australian and NSW Government funding indications, historical trend analysis and consultation with key stakeholders. In order to be financially sustainable into the future, Council has attempted to balance its need to maximise its revenue with the Community Vision’s principles of fairness and equity. In light of this, BSC reviewed its Fees and Charges Policy in April 2015. Fees and Charges were re-assessed having regard to best practice principles of fairness and equity and taking into consideration:
Economic cost;
Community service;
Regulated charges;
User pays principal;
Market forces. User Fees and Charges are outlined in section 4.2.
4.1 Rates and Annual Charges Rate Peg In NSW, increases in general rates are limited by the Independent Pricing and Regulatory Tribunal (IPART) in a practice known as rate pegging. IPART sets the maximum percentage that Councils may increase general rates by each year. It is important to note that this limit does not apply to an individual’s rate levy but rather the total rate levies raised from ordinary and special rates. The rate peg does not apply to stormwater, waste collection or water and sewerage charges. To seek an increase in rates higher than the rate peg, Councils are required to apply to IPART for a Special Rate Variation (SRV). Rates and Charges Income Income from Rates and Charges forms the majority of Council’s revenue. The budget attachments assume a rate peg 2.40% for 2015/16. Income generation from rating is then increased to 6.00% for 2016/2017 onwards. This increase is within the expected allowable increase for those Councils that have proven to be a ‘Fit for the Future’ Council without the need to go through the current IPART Special Variation process. One of the benefits of becoming a Fit for the Future Council that both IPART and the Independent Local Government Review Panel (the Panel) have suggested is support for a level of “earned autonomy” from rate pegging. Fit for the Future Councils would have increased flexibility to set rates within a margin above the rate pegging limit. IPART has suggested a 3% threshold, whereas the Panel suggested up to 5% would be more realistic. The reasoning behind this is to allow Councils to make significant short-term inroads into infrastructure backlogs and correcting operating deficits.
‘Flexibility to set rates of up to 5%
above rate peg….’ Final Report of the NSW Independent Local
Government Review Panel, October 2013

Bellingen Shire Council Long Term Financial Plan
13
Table 4.1: Forecast Rate Increases
2015/16 2016/17 2017/18 2018/19 Onwards
2.40% 6.0% 6.0% 6.0%
Special Rate Variation
In 2014, Council successfully applied for a Special Rate Variation (SRV) of 9.5% in addition to the rate pegging limit of 2.3%. The SRV was implemented to address the priority works in Council’s infrastructure i.e. major renewal works of Council’s roads infrastructure. The SRV was accompanied by a successful application for a Local Infrastructure Renewal Scheme (LIRS) grant which provides a 3% loan interest rate subsidy from the Office of Local Government. Accordingly, a bank loan for $4.85 million was taken out in May 2015 at a rate of 3.75%, the repayments for which are funded by the SRV and LIRS subsidy. These funds are now being utilised for a major upgrade of road infrastructure in Bellingen Shire. Water and Sewerage Charges The NSW Best-Practice Management of Water Supply and Sewerage Framework requires Council to prepare and implement a sound 30 year strategic business plan and financial plan in accordance with the NSW Water and Sewerage Strategic Business Planning Guidelines. Best Practice requires the plans to be reviewed every five years, and provides guidance for the future management of Council’s water and sewerage business. For Residential Properties For water a two-part tariff, being a connection charge and a usage charge, will be applied. Usage charges are based on quarterly meter readings and applied at a per kilolitre rate (refer to Revenue Policy for further information). For Sewerage a uniform charge will be applied to all residential customers in accordance with the Department of Environment, Climate Change and Water and Sewer Best Practice pricing guidelines. For Non-Residential Properties A two-part tariff, being a connection charge and a usage charge, will be applied. Non-residential properties include multiple occupancies, such as non-strata flats and units, and those properties which are categorised as “business” for rating purposes. For Sewerage the connection charge is determined by multiplying the access charge applicable to the water service connection size, by the sewerage discharge factor (SDF). The usage charge is determined by multiplying the number of kilolitres of water consumed, by the SDF, and then by $0.96. Council issues usage charges every three months in arrears, which is included on the quarterly instalment notice. The SDF is a customer’s estimated volume discharged into the sewerage system to the customers total water consumption. For non-residential properties, the SDF varies based on the usage requirements of a customer’s enterprise.

Bellingen Shire Council Long Term Financial Plan
14
Waste Management Charges The Local Government Act 1993 requires that Domestic Waste Management Charges must reflect the actual cost of providing those services. The service is provided to the residents of Bellingen, Dorrigo, Urunga, Mylestom and specific rural areas. The service includes a fortnightly general waste collection service, a fortnightly recycling collection service and a weekly organics waste service. The Domestic Waste Strategy is supported by a ten year financial strategy, as part of the LTFP, which determines the annual charge. The forecast increase in the charges has been set in accordance with the strategy requiring a 3.5% increase to the kerb side domestic waste service and an average of 3% increase throughout the remainder of the plan.
4.2 User Fees and Charges Council annually establishes and regulates its fees and charges in accordance with the provisions of the NSW Local Government Act 1993. Statutory fees are fixed by regulation, legislation or a State/Federal Authority. As such, Council has no influence on how the statutory fee amount is determined nor do such statutory fees tend to increase by CPI or reflect the true cost of providing the service. A review of the remaining Council fees and charges was undertaken in April 2015 using best value principles of value for money, a consideration for community expectations and values, and a balance between affordability and accessibility of services. As part of the process, BSC undertook training and workshops for Managers and Responsible Officers in effective pricing, provided workshops and information packs for its 355 Committees, benchmarked its fees and charges with other Councils and service providers, and improved the format of the Fees and Charges Policy to better align with the Community Vision.
4.3 Interest Revenue and Investments It is estimated that the average cash and investments held throughout the 10 year plan will be $27.5 million. Balancing the need to preserve funds and ensure liquidity with the requirement to maximise returns is an important aspect of managing Council’s investments. In light of this, the Investment Policy was reviewed in April 2015 to provide a stronger framework and guidance on which to base investment decisions. The Policy reflects current legislative requirements including the Minister for Local Government Investment Order and the Basel III banking liquidity reforms instituted by the Australian Prudential Regulation Authority. The budgeted interest rate is determined by a weighted average interest rate based on the 90 day bank bill plus a margin based on the type of investment and duration invested for. The estimated rates used for forecast purposes are as follows: Table 4.3: Interest rate forecast
2015/16 2016/17 2017/18 2018/19 Onwards
3.00% 3.00% 3.00% 4.00%
Bellingen Shire Council Long Term Financial Plan
15
4.4 Other Revenues The majority of other revenues are generated by:
rental income on Council properties;
cost reimbursements and other recoveries, such as workers compensation, legal fees, property
rebates and saleyards reimbursements;
Scrap metal sales;
Long service leave transfers from other councils.
Rental income will vary according to supply and demand, however forecast fluctuations in supply and demand over a ten year period, if available, are not considered reliable. Therefore assuming rents will increase in line with CPI over the long term is considered a reasonable approach. Council’s property portfolio is currently being reviewed as identified in the 2014/15 operational plan, which will consider the long term viability of owning these properties, along with the creation of a sinking fund to facilitate the divestment and investment in the improvement of various building assets. All other income sources have been increased in line with CPI.
4.5 Grants and Contributions – Operating and Capital Given the uncertain nature of grant funding, the LTFP has been prepared with the following grant funding sources included (all assumed to continue over the duration of the LTFP):
Roads to Recovery;
Roads and Maritime Services (RMS);
Financial Assistance Grant (FAGs);
Library Per Capita Grant;
Noxious Weeds Action Plan;
Rural Fire Service – Operating and Capital; and,
Heritage Assistance Schemes In reviewing grants and contributions it is considered prudent not to forecast an increase, other than 3%, over the period of the plan. It is unlikely that there will be any increase in grants, or provision of new grants, for current services. Any reduction or discontinuance of grants will be offset by a corresponding reduction in expenditure. The Financial Assistance Grant issued by the NSW Government is currently frozen with no further increases until 2017/2018. An increase above 3% in 2018/2019 has been forecast to reflect the redistribution from the wealthier City Councils to the Rural Councils based on needs rather than population numbers. The Section 94 Developer Contribution Plan aims to generate contributions that will support the maintenance of levels of service for new community infrastructure to the present standard of facilities per head of existing population. Council’s current S.94 plans for roads and open spaces were reviewed during the 2014/15 financial year to better reflect the current and future needs of our Shire.
‘….money should go to the areas
that need it most (Financial
Assistance Grant)….’ Local Government Minister and Nationals MP
Paul Toole, May 2014

Bellingen Shire Council Long Term Financial Plan
16
5.0 Expenditure Forecasts
In developing the expenditure forecasts, Council has considered its ongoing commitments in alignment
with the objectives of BSC’s Community Vision.
5.1 Employee Costs
Council’s long term forecast relating to staffing is contained in detail within the Workforce Management Strategy. The Workforce Management Strategy also identifies the human resources Bellingen Shire Council requires to continue its strategic direction and deliver services in an efficient and effective manner. Employee costs cover wages, all leave types, training, superannuation and associated costs. Wage increases can be in two parts – increases under the NSW Local Government (State) Award 2014 and grade/step progression under Council’s Salary Structure. The budget factors in a 3.5% increase to overall employee costs in 2015/16 and 3% for the remainder of the LTFP. This assumes that wages will continue to increase in line with the NSW Local Government (State) Award 2010 until such time a new Award is negotiated. All associated employee costs have also been increased by 3.5%, with the exception of superannuation. The increase in employer contributions for Superannuation Guarantee Contributions (SGC) has been delayed until 2018/2019. Contributions will stay at 9.5% until 2018/19 after which they will increase by 0.5% until they reach 12% in 2021/22. Table 5.1: Employee Cost Assumptions
2015/2016 2016/2017 2017/2018 2018/2019
2019/2020
Onwards
Wages 3.50% 3.00% 3.00% 3.00% 3.00%
All Leave 3.50% 3.00% 3.00% 3.00% 3.00%
Training 3.50% 3.00% 3.00% 3.00% 3.00%
Superannuation 9.50% 9.50% 9.50% 10.00% 10.50-12.00%
Workers Compensation 3.50% 3.00% 3.00% 3.00% 3.00%
Council is also a party to an Industry Defined Benefit Plan under the Local Government Superannuation
Scheme, named the ‘Local Government Superannuation Scheme – Pool B’. Council’s additional
contribution for 2015/16 – 2017/2018 is $123,522 per year as a result of the scheme being under
funded post Global Financial Crisis.
5.2 Borrowings
Council had a total loan balance outstanding of $4.95 million as at 30 June 2014. In addition to this, a
further $4.85 million was borrowed in May 2015 for infrastructure renewals. The new loan is funded by
a 9.5% Special Rate Variation approved in 2014 with the interest subsidised by the NSW Government
under the Local Infrastructure Renewal Scheme.

Bellingen Shire Council Long Term Financial Plan
17
Council’s estimated required borrowings over the next 10 years are summarised in the following table.
The table provided below is based on expected discounted borrowings under the proposed TCorp
borrowings facility.
Table 5.2: Summary of new borrowings
Loan Purpose Loan
Amount Loan Term
Annual
Repayment
(Estimate)
Infrastructure Renewal Program 2015/2016 $1,000,000 10 Years $116,121
Infrastructure Renewal Program 2016/2017 $1,500,000 10 Years $174,181
Infrastructure Renewal Program 2017/2018 $2,000,000 10 Years $232,241
Infrastructure Renewal Program 2018/2019 $1,500,000 10 Years $174,181
Infrastructure Renewal Program 2019/2020 $1,000,000 10 Years $116,121
Infrastructure Renewal Program 2020/2021 $2,000,000 10 Years $232,241
Infrastructure Renewal Program 2022/2023 $1,000,000 10 Years $116,121
5.3 Materials and Contracts
Expenditure on materials, contracts and other operating cost has been generally based on CPI. The
exceptions to this are expenditures that are either i) not recurrent every year, ii) have been identified as
increasing by an amount different to CPI or iii) a result of increased services or service levels, for
example increased waste contractor fees in excess of CPI each year reflecting known increases in the
Office of Environment and Heritage NSW waste levy on waste disposed as landfill.
5.4 Depreciation
Depreciation expense has been projected based on useful life estimates in accordance with Council’s
Accounting Policies and Plans. Budgeted capital works expenditure has been included in the
depreciation calculation. A reduction in depreciation has also been forecast due to infrastructure
revaluations conducted during the 2015 financial year.
It is considered reasonable to assume that future asset revaluations will have an impact on
infrastructure values. The LTFP does include the potential impact of future asset revaluations.
5.5 Other Expenses
Generally, other expense budget items have been increased by CPI forecasts or by reviewing historical
expenditure trends. Some expenses are sporadic in nature (for example, conduct of council election
every four years) or tied to grant funding which has not moved by CPI (for example, the Heritage
Assistance Scheme Grant).
Bellingen Shire Council Long Term Financial Plan
18
5.6 Asset Management
Infrastructure (assets) expenditure will progressively be mapped against maintenance and renewal
programs recommended by respective asset management plans. In accordance with Council’s asset
management review, asset maintenance has been increased by CPI with a strong focus on asset
renewals as opposed to construction of new assets.
Subject to successful special rate variations and subsequent loan borrowings, assets should be
maintained and renewed in accordance with the respective asset management plans and agreed
condition intervention levels.
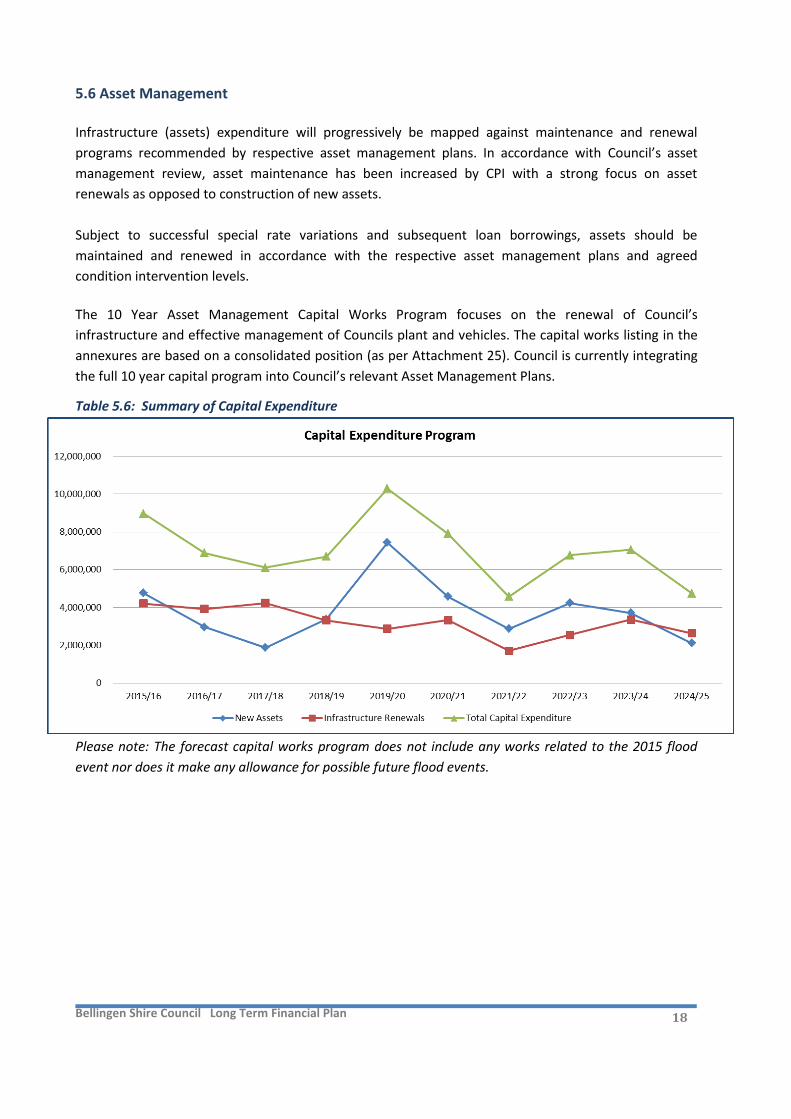
The 10 Year Asset Management Capital Works Program focuses on the renewal of Council’s
infrastructure and effective management of Councils plant and vehicles. The capital works listing in the
annexures are based on a consolidated position (as per Attachment 25). Council is currently integrating
the full 10 year capital program into Council’s relevant Asset Management Plans.
Table 5.6: Summary of Capital Expenditure
Please note: The forecast capital works program does not include any works related to the 2015 flood
event nor does it make any allowance for possible future flood events.

Bellingen Shire Council Long Term Financial Plan
19
6.0 Performance Measures
A number of key indicators have been used to monitor performance against the LTFP to assess Council’s
infrastructure management effectiveness and long term sustainability. The key performance indicators
have been developed as part of the Fit for the Future (FFF) reforms to assess Council’s performance. The
criteria that characterises a FFF council have been developed based on the work of Destination 2036,
the assessments of the sector by the Independent Local Government Review Panel (ILGRP) and the NSW
Treasury Corporation (TCorp), as well as input from the local government sector and IPART. These
criteria are:
scale and capacity to engage effectively across community, industry and government;
sustainability;
effectively managing infrastructure and delivering services for communities, and
Efficiency.
Please note: The ratios below can be heavily influenced by natural disaster events that can have both
positive and negative effects on each of the below ratios. Ratio forecasts do not include any works
related to the 2015 flood event nor does it make any allowance for possible future flood events.
6.1 Sustainability Measures
Sustainability means that councils will generate sufficient funds over the long term to provide the
agreed level and scope of services and infrastructure for communities as identified through the
Integrated Planning and Reporting process. It is paramount that Council have a solid long term financial
plan that effectively addresses the following long term financial sustainability ratios:
6.1.1 Operating Performance Ratio
The Operating Performance Ratio is an important criterion in measuring Council’s core performance.
The issue for Council is whether the operating results can be maintained and in particular if those
operating results can sustain the current level of services into the future. Council’s LTFP shows a
significant decrease in losses primarily due to forecast rate increases and operational savings. It is
expected with the forecast trends that this ratio will be achieved in 2027.
Table 6.1: 2019/2020 Operating Performance Ratio Forecast
Operating Performance Ratio >= break even over 3 years -15.73 +ve
Based on Formula:
Estimated cost to bring assets to a satisfactory condition
Total (WDV) of infrastructure, buildings, other structures and depreciable land improvement assets
Measure Benchmark as per OLGBSC Results
(by 30/06/2020)
Is KPI
Met?
Trend
+ve or –ve
or neutral

Bellingen Shire Council Long Term Financial Plan
20
Table 6.2: Operating Performance Ratio (Includes ratio results as at 30 June 2014)
6.1.2 Own Source Operating Revenue Ratio
This ratio assesses Council’s ability to generate its own revenue, measuring BSC’s dependence on grant
revenue. The ratio is above the benchmark with throughout the LTFP. It is being driven by an increase in
rating revenue. The graph above includes the IPART approved special variations for 2014/15 of 9.5%
plus rate peg.
Table 6.3: 2019/2020 Own Source Operating Revenue Ratio Forecast
Table 6.4: Own Source Operating Revenue Ratio (Includes ratio results as at 30 June 2014)
• OLG
Benchmark
>= break
even over 3
years
• BSC Results
(2014)-33%
• KPI Met?
• Trend +ve-30.00%
-25.00%
-20.00%
-15.00%
-10.00%
-5.00%
0.00%
5.00%
10.00%
TARGET (>)
REVISED LTFP- SCENARIO 1
(Gf)
REVISED LTFP- SCENARIO 1
(Incl. W andS)LTFP REVISED- SCENARIO 2
LTFP REVISED- SCENARIO 3
Operating Performance Ratio
Own Source Revenue Ratio > 60% over 3 years 71.90% +ve
Based on Formula:
Total continuing operating revenue less all grants and contributions
Total continuing operating revenue inclusive of capital grants and contributions
Measure Benchmark as per OLGBSC Results
(by 30/06/2020)
Is KPI
Met?
Trend
+ve or –ve
or neutral
• OLG
Benchmark
> 60% over 3
years
• BSC Results
(2014)59%
• KPI Met?
• Trend +ve50.00%
55.00%
60.00%
65.00%
70.00%
75.00%
REVISED LTFP(General Fund)
TARGET (>)
Own Source Operating Revenue Ratio

Bellingen Shire Council Long Term Financial Plan
21
6.2 Effective Infrastructure and Service Management
The following KPIs assess how well BSC is managing its infrastructure assets, including maintenance and
asset renewals.
6.2.1 Infrastructure Backlog Ratio
The infrastructure backlog ratio indicates the proportion of backlog against the total value of the
Council’s infrastructure assets. It is a measure of the extent to which asset renewal is required to
maintain or improve service delivery in a sustainable way.
Table 6.7: 2019/2020 Infrastructure Backlog Ratio Forecast
Table 6.8: Infrastructure Backlog Ratio (Includes ratio results as at 30 June 2014)
6.2.2 Asset Maintenance Ratio
The asset maintenance ratio reflects the actual asset maintenance expenditure relative to the required
asset maintenance as measured by an individual Council. Council will continue to meet this ratio up until
2020.
Infrastructure Backlog Ratio < 2% 0.54% +ve
(est. only)
Estimated cost to bring assets to a satisfactory condition
Total (WDV) of infrastructure, buildings, other structures and depreciable land improvement assets
Based on Formula:
Measure Benchmark as per OLGBSC Results
(by 30/06/2020)
Is KPI
Met?
Trend
+ve or –ve
or neutral
• OLG
Benchmark< 2%
• BSC Results
(2014)6%
• KPI Met?
• Trend+ve
(est. only)
0.00%
0.50%
1.00%
1.50%
2.00%
2.50%
TARGET
REVISED LTFP
Infrastructure Backlog Ratio
(Estimate Only)

Bellingen Shire Council Long Term Financial Plan
22
Table 6.9: 2019/2020 Asset Maintenance Ratio Forecast
Table 6.10: Asset Maintenance Ratio (Includes ratio results as at 30 June 2014)
6.2.3 Debt Service Ratio
The Debt Service Ratio is used to show the percentage of annual revenue necessary to service annual
debt obligations e.g. loan repayments. It also shows the commitment of future revenue necessary to
fund long term obligations. Council’s LTFP averages 7.32% over the 10 years, well below the maximum
benchmark percentage of 20%. The graph below includes current borrowing repayments and proposed
future borrowings repayments for loans totalling $10 million, for the purpose of addressing the
infrastructure renewal requirements.
Table 6.11: 2019/2020 Debt Service Ratio Forecast
Asset Maintenance Ratio > 100% over 3 years 101.35% +ve
(est. only)
Based on Formula:
Actual asset maintenance
Required asset maintenance
Measure Benchmark as per OLGBSC Results
(by 30/06/2020)
Is KPI
Met?
Trend
+ve or –ve
or neutral
• OLG
Benchmark
> 100% over
3 years
• BSC Results
(2014)126%
• KPI Met?
• Trend Neutral94.00%
96.00%
98.00%
100.00%
102.00%
104.00%
106.00%
TARGET (>)
REVISEDLTFP
(GeneralFund)
Asset Maintenance Ratio
Debt Service Ratio > 0% <= 20% average over 3 years 7.76% +ve
Based on Formula:
Cost of debt service (interest expense & principal repayments)
Total continuing operating revenue (exc. capital grants and contributions)
Measure Benchmark as per OLGBSC Results
(by 30/06/2020)
Is KPI
Met?
Trend
+ve or –ve
or neutral

Bellingen Shire Council Long Term Financial Plan
23
Table 6.12: Debt Service Ratio (Includes ratio results as at 30 June 2014)
6.3 Efficiency Measures
The following measure is aimed at assessing how efficiently Council is managing its resources.
6.3.1 Real Operating Expenditure per capita This measure reflects how the operational costs per capita have grown over time. In the calculation, the
expenditure is deflated by the estimated Consumer Price Index. Councils will be assessed on a joint
consideration of the direction and magnitude of their improvement or deterioration in real expenditure
per capita. The OLG acknowledges that efficiency and service levels are impacted by a broad range of
factors, and that it is unreasonable to establish an absolute benchmark across Councils. Council’s LTFP
shows a downward trend when compared to a conservative population growth rate of 0.2% per annum
(Source ABS 3218.0, NSW Dept. of Planning, Lawrence Consulting).
• OLG
Benchmark
> 0% <= 20%
average over
3 years
• BSC Results 3%
• KPI Met?
• Trend +ve0.00%
5.00%
10.00%
15.00%
20.00%
25.00%
TARGET (<)
REVISEDLTFP
Debt Service Ratio

Bellingen Shire Council Long Term Financial Plan
24
Table 6.13: 2019/2020 Real Operating Expenditure per Capita Ratio Forecast
Table 6.14: Real Operating Expenditure per Capita Ratio (Includes ratio results as at 30 June 2014)
A Decrease in Real Operating Expenditure per
capita over timeDecreasing over past 5 years Decreasing Decreasing
Year 2
Based on Formulas:
Year 3
Year 1
Total expenditure from continuing operations less revaluation decrements, net loss from disposal of assets and net loss of
interests in joint ventures less (1 - CPI Yr 1)
Measure Benchmark as per OLGBSC Results
(by 30/06/2020)
Is KPI
Met?
Trend
+ve or –ve
or neutral
Year 5
Year 4
Population (year 5)
Total expenditure from continuing operations less revaluation decrements, net loss from disposal of assets and net loss of
interests in joint ventures less (1 - CPI Yr 1) less (1 - CPI Yr 2) less (1 - CPI Yr 3) less (1 - CPI Yr 4) less (1 - CPI Yr 5)
Population (year 4)
Total expenditure from continuing operations less revaluation decrements, net loss from disposal of assets and net loss of
interests in joint ventures less (1 - CPI Yr 1) less (1 - CPI Yr 2) less (1 - CPI Yr 3) less (1 - CPI Yr 4)
Population (year 3)
Total expenditure from continuing operations less revaluation decrements, net loss from disposal of assets and net loss of
interests in joint ventures less (1 - CPI Yr 1) less (1 - CPI Yr 2) less (1 - CPI Yr 3)
Population (year 2)
Total expenditure from continuing operations less revaluation decrements, net loss from disposal of assets and net loss of
interests in joint ventures less (1 - CPI Yr 1) less (1 - CPI Yr 2)
Population (year 1)
• OLG
Benchmark
Decreasing
over past 5
years
• BSC Results
(2014)Increasing
• KPI Met?
• Trend-ve
(Increasing)
1.72
1.74
1.76
1.78
1.8
1.82
1.84
1.86
1.88
1.9
1.92
1.94
REVISEDLTFP
Real Operating Expenditure Ratio

Bellingen Shire Council Long Term Financial Plan
25
7.0 Sensitivity Analysis and Financial Modelling
The LTFP is based on a number of underlying assumptions. Sensitivity analysis identifies the impact on
Council’s financial position of changes in these assumptions and highlights the factors most likely to
affect the outcomes of the plan.
Sensitivity analysis looks at “what if” scenarios. For example, what happens to Council’s financial
position if salary and wages increases are 1% higher than forecast, growth is half that forecast, or
investment returns are 1% less than forecast in plan.
All sensitivity analysis was undertaken utilising ‘Financial Services Model 1’ above and the impacts were
assessed by reference to the changes in the cash and investment balance in year 10 (2024/25) of the
LTFP. The major underlying assumptions underpinning the LTFP have been subject to sensitivity analysis
which has identified the following impacts.
7.1 Employee Costs
Employee costs make up 34% of projected 2015/2016 operating expenditure. This is reflective of the
service based nature of a significant proportion of council activities as well as the construction and
maintenance of the considerable infrastructure owned by Council. As it makes up such a large
proportion of the operating expenditure budget, and movements in rates of pay are determined
through industry wide Award negotiations and market forces, the Council is sensitive to unplanned
changes in employee costs. The LTFP assumes annual increases of 3.5% (2015/16) and 3% (Years 2 – 10)
to employee costs.
Due to the above factors an impact of a 1% increase in employee costs each year was modelled. The
analysis indicated that the cash and investment balance would be reduced by an estimated $6,456,000
in year 2024/2025 of the LTFP.
7.2 Rates and Annual Charges Revenue
Rates and Annual Charges revenue makes up over 45% of the projected 2015/2016 operating revenue.
Council cannot set the rate of increase in General Rates but can only accept the rate pegging imposed
on it without a Special Variation application. The LTFP includes a rate peg increase of 2.4% in 2015/16
permanent 6% SRV for the remainder of the LTFP. If these increases are not achieved, Council will need
to adjust expenditure or revenue appropriately.
The LTFP modelling has been devised with scenarios that include the Special Rate Variation, however
progress in addressing the Council asset renewal and maintenance challenges is contingent on the
success of any applications to increase rates through a special variation or on the assumption that
Council will have flexibility to set rates of up to 5% above rate peg without formal approval. The LTFP
has been projected on the premise that current rating income collection patterns are maintained. Any
financial shocks or changed economic conditions have the ability to impact rate payer capacity to pay

Bellingen Shire Council Long Term Financial Plan
26
and in so doing will affect the Council cash flow from rating.
Annual Charges, particularly domestic waste charges, are susceptible to significant cost increases as a
result of legislative change in this area of operation (due to Federal and State climate change policies
and other regulations).
Due to Council’s reliance on rate revenue, an impact of a 1% reduction in rates revenue each year was
modelled assuming that any special variation would also be reduced by 1%. The analysis indicated that
the cash and investment balance would be reduced by an estimated $6,283,000 in year 2024/2025 of
the LTFP.
7.3 Inflation Given the considerable number of assets held, constructed and maintained by Council, variations in
underlying inflation have the potential to have a significant impact on the LTFP. Council has considerable
pressure from rising raw material costs including fuel and other construction materials. Any major
unplanned hikes in these costs will impact the LTFP.
7.4 Investment Returns
Council’s current approach is that interest earnings from investments are used to fund the operational
budget. This source of revenue however, is impacted by the various fluctuations of the investment
market and is not necessarily a reliable source of revenue. The potential use of interest income as a
source of revenue to balance the operational budget may in turn be impacted.
The impact of a reduction in investment interest rates of 1% was modelled. It was concluded that any
impact on Councils operating result was deemed to be immaterial.
7.5 Grants and Contributions
Council relies heavily on income from the Federal Government Financial Assistance and the Roads to
Recovery grant programs. These Grants respectively make up 11% and 1% of Council’s total revenue.
The Financial Assistance Grant is calculated using a formula that takes into account the population of
the Local Government areas, road lengths and a number of other demographics. Given the complexity
of the formula it is difficult to calculate any potential impacts to Council if any of the inputs were to
change. As mentioned in the revenue forecast assumptions above an increase of a normal 3% in the
Financial Assistance Grant has been forecast in 2017/18. If this was not to eventuate a deduction of
$168,000 would need to be made to Council’s annual operating/capital expenditure forecasts.
Money provided under the Roads to Recovery Program is not intended to replace council spending on
roads but to assist councils in their local road construction or maintenance. The Roads to Recovery
Program is scheduled to conclude in 2019. However due to the heavy reliance of this program
throughout NSW there has been much lobbying for the continuation of this program. The LTFP has been
prepared with the assumption that the Roads to Recovery Program will continue indefinitely.

Bellingen Shire Council Long Term Financial Plan
27
7.6 Financial Services Model 1: Service Levels Maintained
The consolidated budget result under the ‘Service Levels Maintained Model’ is provided in the table
below.
Table 7.6: Financial Services Model 1: Service Levels Maintained
7.7 Financial Services Model 2: Service Levels Reduced
The consolidated budget result under the Reduced Services Model is provided in the table below.
Table 7.7: Financial Services Model 2: Service Levels Reduced
2015/16 2016/17 2017/18 2018/19 2019/20 2020/21 2021/22 2022/23 2023/24 2024/25
General Fund -4,873 -4,839 -4,361 -3,920 -3,707 -3,427 -2,941 -2,476 -2,075 -1,453
Sewer Fund -57 -79 -33 36 18 39 156 229 305 392
Water Fund 34 38 56 194 55 26 102 158 202 258
Consolidated Funds -4,896 -4,880 -4,338 -3,689 -3,635 -3,363 -2,683 -2,090 -1,569 -803
-6,000
-5,000
-4,000
-3,000
-2,000
-1,000
0
1,000
2015/16 2016/17 2017/18 2018/19 2019/20 2020/21 2021/22 2022/23 2023/24 2024/25
Budget Result by Fund - Model 1: Services Levels Maintained ($ 000')
General Fund Sewer Fund Water Fund
2015/16 2016/17 2017/18 2018/19 2019/20 2020/21 2021/22 2022/23 2023/24 2024/25 General Fund -4,123 -4,525 -4,206 -3,942 -3,882 -3,820 -3,573 -3,371 -3,227 -2,919 Sewer Fund -57 -73 -20 57 45 74 200 281 367 464 Water Fund 34 43 67 212 79 58 142 205 257 322 Consolidated Funds -4,146 -4,554 -4,159 -3,673 -3,757 -3,688 -3,232 -2,885 -2,603 -2,133
-5,000
-4,000
-3,000
-2,000
-1,000
0
1,000
2015/16 2016/17 2017/18 2018/19 2019/20 2020/21 2021/22 2022/23 2023/24 2024/25
Budget Result by Fund - Model 2: Services Levels Reduced ($ 000')
General Fund Sewer Fund Water Fund

Bellingen Shire Council Long Term Financial Plan
28
7.8 Financial Services Model 3: Meeting ‘Fit For the Future’ Requirements by 2020
The consolidated budget result under the Increased Services Model is provided in the table below.
Table 7.8: Financial Services Model 3: Meeting ‘Fit For the Future’ Requirements by 2020
2015/16 2016/17 2017/18 2018/19 2019/20 2020/21 2021/22 2022/23 2023/24 2024/25 General Fund -4,762 -4,059 -2,813 -1,419 14 284 678 1,025 1,339 1,827 Sewer Fund -57 -73 -20 57 45 74 200 281 367 464 Water Fund 34 43 67 212 79 58 142 205 257 322 Consolidated Funds -4,785 -4,088 -2,765 -1,150 139 416 1,020 1,511 1,963 2,613
-6,000 -5,000 -4,000 -3,000 -2,000 -1,000
0 1,000 2,000 3,000
2015/16 2016/17 2017/18 2018/19 2019/20 2020/21 2021/22 2022/23 2023/24 2024/25
Budget Result by Fund - Model 3: Meet FFF Ratios ($ 000')
General Fund Sewer Fund Water Fund

Bellingen Shire Council Long Term Financial Plan
29
8.0 Appendices

Bellingen Shire Council Long Term Financial Plan
30
Blank Page

Attachment 1 – ‘Model 1’ Projected Income Statement
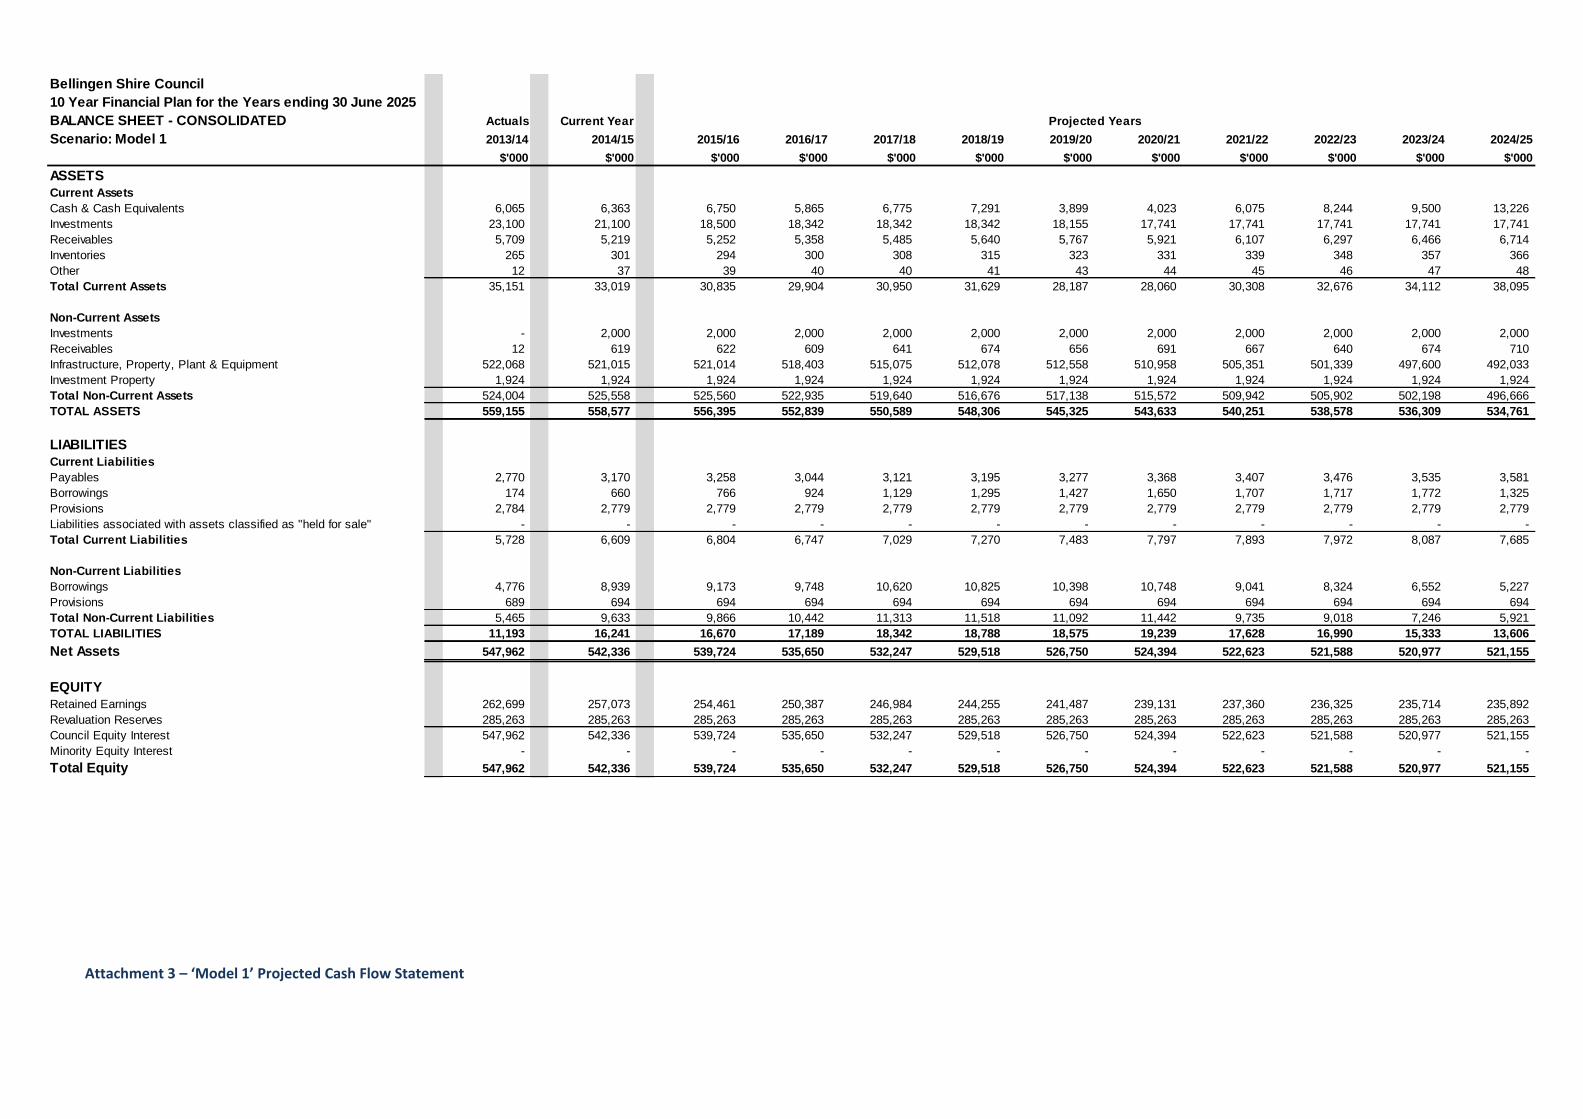
Attachment 2 – ‘Model 1’ Projected Balance Sheet
Bellingen Shire Council
10 Year Financial Plan for the Years ending 30 June 2025
INCOME STATEMENT - CONSOLIDATED Actuals Current Year
Scenario: Model 1 2013/14 2014/15 2015/16 2016/17 2017/18 2018/19 2019/20 2020/21 2021/22 2022/23 2023/24 2024/25
$'000 $'000 $'000 $'000 $'000 $'000 $'000 $'000 $'000 $'000 $'000 $'000
Income from Continuing Operations
Revenue:
Rates & Annual Charges 11,299 12,413 12,856 13,477 14,130 14,816 15,538 16,297 17,095 17,936 18,820 19,750
User Charges & Fees 6,559 5,174 6,085 6,276 6,473 6,676 6,886 7,103 7,326 7,556 7,793 8,038
Interest & Investment Revenue 1,201 950 1,110 1,027 1,041 1,312 1,139 1,055 1,181 1,277 1,336 1,467
Other Revenues 450 490 492 506 522 537 553 570 587 605 623 641
Grants & Contributions provided for Operating Purposes 3,619 5,444 5,816 5,446 5,764 5,924 6,128 6,297 6,471 6,651 6,836 7,026
Grants & Contributions provided for Capital Purposes 4,087 985 2,284 806 935 960 868 1,006 911 1,055 958 982
Other Income:
Net gains from the disposal of assets 73 - - - - - - - - - - -
Joint Ventures & Associated Entities - - - - - - - - - - - -
Total Income from Continuing Operations 27,288 25,456 28,643 27,538 28,864 30,226 31,111 32,327 33,572 35,078 36,365 37,904
Expenses from Continuing Operations
Employee Benefits & On-Costs 9,762 10,066 10,665 10,607 10,924 11,180 11,513 11,856 12,208 12,574 12,951 13,339
Borrowing Costs 468 427 448 457 473 501 509 494 503 446 416 361
Materials & Contracts 9,961 7,853 8,055 8,203 8,412 8,627 8,847 9,074 9,306 9,544 9,789 10,041
Depreciation & Amortisation 9,032 9,589 8,783 8,908 9,034 9,162 9,356 9,500 9,549 9,683 9,816 9,952
Impairment - - - - - - - - - - - -
Other Expenses 2,929 3,147 3,303 3,437 3,423 3,485 3,653 3,761 3,777 3,867 4,004 4,032
Interest & Investment Losses - - - - - - - - - - - -
Net Losses from the Disposal of Assets 12 - - - - - - - - - - -
Joint Ventures & Associated Entities - - - - - - - - - - - -
Total Expenses from Continuing Operations 32,164 31,082 31,255 31,612 32,267 32,955 33,879 34,684 35,343 36,113 36,976 37,725
Operating Result from Continuing Operations (4,876) (5,626) (2,612) (4,074) (3,403) (2,729) (2,768) (2,357) (1,771) (1,035) (611) 179
Discontinued Operations - Profit/(Loss) - - - - - - - - - - - -
Net Profit/(Loss) from Discontinued Operations - - - - - - - - - - - -
Net Operating Result for the Year (4,876) (5,626) (2,612) (4,074) (3,403) (2,729) (2,768) (2,357) (1,771) (1,035) (611) 179
Net Operating Result before Grants and Contributions provided for
Capital Purposes (8,963) (6,611) (4,896) (4,880) (4,338) (3,689) (3,635) (3,363) (2,683) (2,090) (1,569) (803)
Projected Years
Attachment 3 – ‘Model 1’ Projected Cash Flow Statement
Bellingen Shire Council
10 Year Financial Plan for the Years ending 30 June 2025
BALANCE SHEET - CONSOLIDATED Actuals Current Year
Scenario: Model 1 2013/14 2014/15 2015/16 2016/17 2017/18 2018/19 2019/20 2020/21 2021/22 2022/23 2023/24 2024/25
$'000 $'000 $'000 $'000 $'000 $'000 $'000 $'000 $'000 $'000 $'000 $'000
ASSETS
Current Assets
Cash & Cash Equivalents 6,065 6,363 6,750 5,865 6,775 7,291 3,899 4,023 6,075 8,244 9,500 13,226
Investments 23,100 21,100 18,500 18,342 18,342 18,342 18,155 17,741 17,741 17,741 17,741 17,741
Receivables 5,709 5,219 5,252 5,358 5,485 5,640 5,767 5,921 6,107 6,297 6,466 6,714
Inventories 265 301 294 300 308 315 323 331 339 348 357 366
Other 12 37 39 40 40 41 43 44 45 46 47 48
Total Current Assets 35,151 33,019 30,835 29,904 30,950 31,629 28,187 28,060 30,308 32,676 34,112 38,095
Non-Current Assets
Investments - 2,000 2,000 2,000 2,000 2,000 2,000 2,000 2,000 2,000 2,000 2,000
Receivables 12 619 622 609 641 674 656 691 667 640 674 710
Infrastructure, Property, Plant & Equipment 522,068 521,015 521,014 518,403 515,075 512,078 512,558 510,958 505,351 501,339 497,600 492,033
Investment Property 1,924 1,924 1,924 1,924 1,924 1,924 1,924 1,924 1,924 1,924 1,924 1,924
Total Non-Current Assets 524,004 525,558 525,560 522,935 519,640 516,676 517,138 515,572 509,942 505,902 502,198 496,666
TOTAL ASSETS 559,155 558,577 556,395 552,839 550,589 548,306 545,325 543,633 540,251 538,578 536,309 534,761
LIABILITIES
Current Liabilities
Payables 2,770 3,170 3,258 3,044 3,121 3,195 3,277 3,368 3,407 3,476 3,535 3,581
Borrowings 174 660 766 924 1,129 1,295 1,427 1,650 1,707 1,717 1,772 1,325
Provisions 2,784 2,779 2,779 2,779 2,779 2,779 2,779 2,779 2,779 2,779 2,779 2,779
Liabilities associated with assets classified as "held for sale" - - - - - - - - - - - -
Total Current Liabilities 5,728 6,609 6,804 6,747 7,029 7,270 7,483 7,797 7,893 7,972 8,087 7,685
Non-Current Liabilities
Borrowings 4,776 8,939 9,173 9,748 10,620 10,825 10,398 10,748 9,041 8,324 6,552 5,227
Provisions 689 694 694 694 694 694 694 694 694 694 694 694
Total Non-Current Liabilities 5,465 9,633 9,866 10,442 11,313 11,518 11,092 11,442 9,735 9,018 7,246 5,921
TOTAL LIABILITIES 11,193 16,241 16,670 17,189 18,342 18,788 18,575 19,239 17,628 16,990 15,333 13,606
Net Assets 547,962 542,336 539,724 535,650 532,247 529,518 526,750 524,394 522,623 521,588 520,977 521,155
EQUITY
Retained Earnings 262,699 257,073 254,461 250,387 246,984 244,255 241,487 239,131 237,360 236,325 235,714 235,892
Revaluation Reserves 285,263 285,263 285,263 285,263 285,263 285,263 285,263 285,263 285,263 285,263 285,263 285,263
Council Equity Interest 547,962 542,336 539,724 535,650 532,247 529,518 526,750 524,394 522,623 521,588 520,977 521,155
Minority Equity Interest - - - - - - - - - - - -
Total Equity 547,962 542,336 539,724 535,650 532,247 529,518 526,750 524,394 522,623 521,588 520,977 521,155
Projected Years

Attachment 4 – ‘Model 2’ Projected Income Statement
Bellingen Shire Council
10 Year Financial Plan for the Years ending 30 June 2025
CASH FLOW STATEMENT - CONSOLIDATED Actuals Current Year
Scenario: Model 1 2013/14 2014/15 2015/16 2016/17 2017/18 2018/19 2019/20 2020/21 2021/22 2022/23 2023/24 2024/25
$'000 $'000 $'000 $'000 $'000 $'000 $'000 $'000 $'000 $'000 $'000 $'000
Cash Flows from Operating Activities
Receipts:
Rates & Annual Charges 11,345 12,288 12,856 13,482 14,104 14,770 15,567 16,250 17,110 17,955 18,772 19,700
User Charges & Fees 6,536 5,401 6,032 6,261 6,467 6,661 6,880 7,086 7,309 7,538 7,775 8,020
Interest & Investment Revenue Received 1,182 738 1,142 1,049 1,034 1,306 1,131 1,059 1,151 1,251 1,337 1,396
Grants & Contributions 6,732 6,429 8,100 6,252 6,699 6,884 6,995 7,303 7,383 7,706 7,793 8,008
Other 2,466 459 489 411 411 426 440 451 468 479 497 510
Payments:
Employee Benefits & On-Costs (9,502) (10,009) (10,649) (10,890) (10,924) (11,180) (11,513) (11,856) (12,208) (12,574) (12,951) (13,339)
Materials & Contracts (9,219) (7,634) (8,000) (8,164) (8,373) (8,578) (8,780) (9,013) (9,257) (9,484) (9,721) (9,986)
Borrowing Costs (442) (343) (442) (444) (454) (495) (515) (483) (533) (459) (447) (393)
Bonds & Deposits Refunded (28) - - - - - - - - - - -
Other (5,207) (3,147) (3,303) (3,437) (3,423) (3,485) (3,653) (3,761) (3,777) (3,867) (4,004) (4,032)
Net Cash provided (or used in) Operating Activities 3,863 4,182 6,225 4,520 5,541 6,310 6,552 7,036 7,645 8,545 9,051 9,883
Cash Flows from Investing Activities
Receipts:
Sale of Investment Securities 13,750 - 2,601 158 - - 187 414 - - - -
Sale of Infrastructure, Property, Plant & Equipment 330 724 185 583 396 528 458 1 629 1,095 975 363
Deferred Debtors Receipts 9 4 4 - - - - - - - - -
Payments:
Purchase of Investment Securities (23,100) - - - - - - - - - - -
Purchase of Infrastructure, Property, Plant & Equipment (3,794) (9,261) (8,967) (6,880) (6,103) (6,693) (10,294) (7,901) (4,572) (6,765) (7,053) (4,748)
Net Cash provided (or used in) Investing Activities (12,805) (8,533) (6,177) (6,139) (5,707) (6,165) (9,650) (7,486) (3,943) (5,670) (6,078) (4,385)
Cash Flows from Financing Activities
Receipts:
Proceeds from Borrowings & Advances - 4,850 1,000 1,500 2,000 1,500 1,000 2,000 - 1,000 - -
Payments:
Repayment of Borrowings & Advances (136) (202) (660) (766) (924) (1,129) (1,295) (1,427) (1,650) (1,707) (1,717) (1,772)
Net Cash Flow provided (used in) Financing Activities (136) 4,648 340 734 1,076 371 (295) 573 (1,650) (707) (1,717) (1,772)
Net Increase/(Decrease) in Cash & Cash Equivalents (9,078) 298 388 (886) 910 516 (3,392) 124 2,053 2,168 1,257 3,726
plus: Cash, Cash Equivalents & Investments - beginning of year 15,143 6,065 6,363 6,750 5,865 6,775 7,291 3,899 4,023 6,075 8,244 9,500
Cash & Cash Equivalents - end of the year 6,065 6,363 6,750 5,865 6,775 7,291 3,899 4,023 6,075 8,244 9,500 13,226
Cash & Cash Equivalents - end of the year 6,065 6,363 6,750 5,865 6,775 7,291 3,899 4,023 6,075 8,244 9,500 13,226
Investments - end of the year 23,100 23,100 20,499 20,342 20,342 20,342 20,155 19,741 19,741 19,741 19,741 19,741
Cash, Cash Equivalents & Investments - end of the year 29,165 29,463 27,250 26,206 27,117 27,633 24,054 23,764 25,816 27,984 29,241 32,967
Projected Years

Attachment 5 – ‘Model 2’ Projected Balance Sheet
Bellingen Shire Council
10 Year Financial Plan for the Years ending 30 June 2025
INCOME STATEMENT - CONSOLIDATED Actuals Current Year
Scenario: Model 2 2013/14 2014/15 2015/16 2016/17 2017/18 2018/19 2019/20 2020/21 2021/22 2022/23 2023/24 2024/25
$'000 $'000 $'000 $'000 $'000 $'000 $'000 $'000 $'000 $'000 $'000 $'000
Income from Continuing Operations
Revenue:
Rates & Annual Charges 11,299 12,413 12,856 13,274 13,706 14,151 14,611 15,087 15,578 16,084 16,608 17,148
User Charges & Fees 6,559 5,174 6,085 6,276 6,473 6,676 6,886 7,103 7,326 7,556 7,793 8,038
Interest & Investment Revenue 1,201 950 1,110 1,027 1,041 1,312 1,139 1,055 1,181 1,277 1,336 1,467
Other Revenues 450 490 492 506 522 537 553 570 587 605 623 641
Grants & Contributions provided for Operating Purposes 3,619 5,444 5,816 5,446 5,764 5,924 6,128 6,297 6,471 6,651 6,836 7,026
Grants & Contributions provided for Capital Purposes 4,087 985 2,284 806 935 960 868 1,006 911 1,055 958 982
Other Income:
Net gains from the disposal of assets 73 - - - - - - - - - - -
Joint Ventures & Associated Entities - - - - - - - - - - - -
Total Income from Continuing Operations 27,288 25,456 28,643 27,335 28,440 29,561 30,185 31,117 32,054 33,227 34,153 35,303
Expenses from Continuing Operations
Employee Benefits & On-Costs 9,762 10,066 9,415 9,572 9,811 9,984 10,232 10,485 10,745 11,013 11,288 11,571
Borrowing Costs 468 427 448 457 473 501 466 454 467 414 360 312
Materials & Contracts 9,961 7,853 8,055 8,203 8,412 8,627 8,847 9,074 9,306 9,544 9,789 10,041
Depreciation & Amortisation 9,032 9,589 9,283 9,413 9,544 9,677 9,877 10,026 10,080 10,219 10,357 10,499
Impairment - - - - - - - - - - - -
Other Expenses 2,929 3,147 3,303 3,437 3,423 3,485 3,653 3,761 3,777 3,867 4,004 4,032
Interest & Investment Losses - - - - - - - - - - - -
Net Losses from the Disposal of Assets 12 - - - - - - - - - - -
Joint Ventures & Associated Entities - - - - - - - - - - - -
Total Expenses from Continuing Operations 32,164 31,082 30,505 31,083 31,664 32,275 33,075 33,799 34,374 35,057 35,799 36,454
Operating Result from Continuing Operations (4,876) (5,626) (1,862) (3,748) (3,224) (2,713) (2,889) (2,682) (2,321) (1,830) (1,645) (1,152)
Discontinued Operations - Profit/(Loss) - - - - - - - - - - - -
Net Profit/(Loss) from Discontinued Operations - - - - - - - - - - - -
Net Operating Result for the Year (4,876) (5,626) (1,862) (3,748) (3,224) (2,713) (2,889) (2,682) (2,321) (1,830) (1,645) (1,152)
Net Operating Result before Grants and Contributions provided for
Capital Purposes (8,963) (6,611) (4,146) (4,554) (4,159) (3,673) (3,757) (3,688) (3,232) (2,885) (2,603) (2,133)
Projected Years

Attachment 6 – ‘Model 2’ Projected Cash Flow Statement
Bellingen Shire Council
10 Year Financial Plan for the Years ending 30 June 2025
BALANCE SHEET - CONSOLIDATED Actuals Current Year
Scenario: Model 2 2013/14 2014/15 2015/16 2016/17 2017/18 2018/19 2019/20 2020/21 2021/22 2022/23 2023/24 2024/25
$'000 $'000 $'000 $'000 $'000 $'000 $'000 $'000 $'000 $'000 $'000 $'000
ASSETS
Current Assets
Cash & Cash Equivalents 6,065 6,363 7,867 7,844 9,434 9,008 6,081 6,518 8,703 9,795 10,828 14,061
Investments 23,100 21,100 18,500 18,348 18,348 18,348 18,222 17,840 17,840 17,840 17,840 17,840
Receivables 5,709 5,219 5,294 5,424 5,568 5,677 5,816 5,971 6,150 6,286 6,433 6,645
Inventories 265 301 294 300 308 315 323 331 339 348 357 366
Other 12 37 39 40 40 41 43 44 45 46 47 48
Total Current Assets 35,151 33,019 31,994 31,956 33,698 33,390 30,485 30,704 33,077 34,314 35,504 38,960
Non-Current Assets
Investments - 2,000 2,000 2,000 2,000 2,000 2,000 2,000 2,000 2,000 2,000 2,000
Receivables 12 619 622 597 615 634 604 623 590 554 571 589
Infrastructure, Property, Plant & Equipment 522,068 521,015 520,514 517,398 513,560 510,048 510,008 507,882 501,745 497,196 492,916 486,802
Investment Property 1,924 1,924 1,924 1,924 1,924 1,924 1,924 1,924 1,924 1,924 1,924 1,924
Total Non-Current Assets 524,004 525,558 525,060 521,918 518,099 514,606 514,536 512,429 506,258 501,673 497,411 491,314
TOTAL ASSETS 559,155 558,577 557,053 553,874 551,797 547,996 545,020 543,133 539,335 535,987 532,915 530,274
LIABILITIES
Current Liabilities
Payables 2,770 3,170 3,167 3,002 3,074 3,115 3,192 3,279 3,313 3,359 3,415 3,456
Borrowings 174 660 766 924 1,129 1,164 1,292 1,511 1,564 1,483 1,531 1,076
Provisions 2,784 2,779 2,779 2,779 2,779 2,779 2,779 2,779 2,779 2,779 2,779 2,779
Total Current Liabilities 5,728 6,609 6,713 6,705 6,981 7,058 7,264 7,569 7,657 7,621 7,725 7,312
Non-Current Liabilities
Borrowings 4,776 8,939 9,173 9,748 10,620 9,455 9,163 9,652 8,088 6,605 5,075 3,999
Provisions 689 694 694 694 694 694 694 694 694 694 694 694
Total Non-Current Liabilities 5,465 9,633 9,866 10,442 11,313 10,149 9,857 10,346 8,782 7,299 5,769 4,692
TOTAL LIABILITIES 11,193 16,241 16,579 17,147 18,295 17,207 17,121 17,915 16,438 14,920 13,493 12,004
Net Assets 547,962 542,336 540,474 536,726 533,502 530,789 527,900 525,217 522,897 521,067 519,422 518,270
EQUITY
Retained Earnings 262,699 257,073 255,211 251,463 248,239 245,526 242,637 239,954 237,634 235,804 234,159 233,007
Revaluation Reserves 285,263 285,263 285,263 285,263 285,263 285,263 285,263 285,263 285,263 285,263 285,263 285,263
Council Equity Interest 547,962 542,336 540,474 536,726 533,502 530,789 527,900 525,217 522,897 521,067 519,422 518,270
Minority Equity Interest - - - - - - - - - - - -
Total Equity 547,962 542,336 540,474 536,726 533,502 530,789 527,900 525,217 522,897 521,067 519,422 518,270
Projected Years

Attachment 7 – ‘Model 3’ Projected Income Statement
Bellingen Shire Council
10 Year Financial Plan for the Years ending 30 June 2025
CASH FLOW STATEMENT - CONSOLIDATED Actuals Current Year
Scenario: Model 2 2013/14 2014/15 2015/16 2016/17 2017/18 2018/19 2019/20 2020/21 2021/22 2022/23 2023/24 2024/25
$'000 $'000 $'000 $'000 $'000 $'000 $'000 $'000 $'000 $'000 $'000 $'000
Cash Flows from Operating Activities
Receipts:
Rates & Annual Charges 11,345 12,288 12,856 13,292 13,694 14,121 14,653 15,057 15,603 16,113 16,579 17,118
User Charges & Fees 6,536 5,401 6,032 6,261 6,467 6,661 6,880 7,086 7,309 7,538 7,775 8,020
Interest & Investment Revenue Received 1,182 738 1,100 1,024 1,016 1,351 1,119 1,057 1,158 1,304 1,358 1,430
Grants & Contributions 6,732 6,429 8,100 6,252 6,699 6,884 6,995 7,303 7,383 7,706 7,793 8,008
Other 2,466 459 489 409 408 423 437 448 464 475 492 505
Payments:
Employee Benefits & On-Costs (9,502) (10,009) (9,442) (9,813) (9,811) (9,984) (10,232) (10,485) (10,745) (11,013) (11,288) (11,571)
Materials & Contracts (9,219) (7,634) (8,048) (8,155) (8,375) (8,581) (8,783) (9,016) (9,260) (9,487) (9,724) (9,990)
Borrowing Costs (442) (343) (442) (444) (454) (522) (469) (441) (495) (443) (387) (340)
Bonds & Deposits Refunded (28) - - - - - - - - - - -
Other (5,207) (3,147) (3,303) (3,437) (3,423) (3,485) (3,653) (3,761) (3,777) (3,867) (4,004) (4,032)
Net Cash provided (or used in) Operating Activities 3,863 4,182 7,341 5,389 6,221 6,867 6,947 7,247 7,639 8,326 8,593 9,148
Cash Flows from Investing Activities
Receipts:
Sale of Investment Securities 13,750 - 2,601 152 - - 126 383 - - - -
Sale of Infrastructure, Property, Plant & Equipment 330 724 185 583 396 528 458 1 629 1,095 975 363
Deferred Debtors Receipts 9 4 4 - - - - - - - - -
Payments:
Purchase of Investment Securities (23,100) - - - - - - - - - - -
Purchase of Infrastructure, Property, Plant & Equipment (3,794) (9,261) (8,967) (6,880) (6,103) (6,693) (10,294) (7,901) (4,572) (6,765) (7,053) (4,748)
Net Cash provided (or used in) Investing Activities (12,805) (8,533) (6,177) (6,146) (5,707) (6,165) (9,710) (7,517) (3,943) (5,670) (6,078) (4,385)
Cash Flows from Financing Activities
Receipts:
Proceeds from Borrowings & Advances - 4,850 1,000 1,500 2,000 - 1,000 2,000 - - - -
Payments:
Repayment of Borrowings & Advances (136) (202) (660) (766) (924) (1,129) (1,164) (1,292) (1,511) (1,564) (1,483) (1,531)
Net Cash Flow provided (used in) Financing Activities (136) 4,648 340 734 1,076 (1,129) (164) 708 (1,511) (1,564) (1,483) (1,531)
Net Increase/(Decrease) in Cash & Cash Equivalents (9,078) 298 1,504 (23) 1,590 (426) (2,927) 437 2,185 1,092 1,033 3,233
plus: Cash, Cash Equivalents & Investments - beginning of year 15,143 6,065 6,363 7,867 7,844 9,434 9,008 6,081 6,518 8,703 9,795 10,828
Cash & Cash Equivalents - end of the year 6,065 6,363 7,867 7,844 9,434 9,008 6,081 6,518 8,703 9,795 10,828 14,061
Cash & Cash Equivalents - end of the year 6,065 6,363 7,867 7,844 9,434 9,008 6,081 6,518 8,703 9,795 10,828 14,061
Investments - end of the year 23,100 23,100 20,499 20,348 20,348 20,348 20,222 19,839 19,839 19,839 19,839 19,839
Cash, Cash Equivalents & Investments - end of the year 29,165 29,463 28,366 28,192 29,782 29,356 26,302 26,357 28,542 29,634 30,667 33,900
Projected Years

Attachment 8 – ‘Model 3’ Projected Balance Sheet
Bellingen Shire Council
10 Year Financial Plan for the Years ending 30 June 2025
INCOME STATEMENT - CONSOLIDATED Actuals Current Year
Scenario: Model 3 2013/14 2014/15 2015/16 2016/17 2017/18 2018/19 2019/20 2020/21 2021/22 2022/23 2023/24 2024/25
$'000 $'000 $'000 $'000 $'000 $'000 $'000 $'000 $'000 $'000 $'000 $'000
Income from Continuing Operations
Revenue:
Rates & Annual Charges 11,299 12,413 12,856 14,086 15,475 17,046 18,828 19,429 20,050 20,691 21,353 22,036
User Charges & Fees 6,559 5,174 6,085 6,276 6,473 6,676 6,886 7,103 7,326 7,556 7,793 8,038
Interest & Investment Revenue 1,201 950 771 1,018 1,036 1,299 1,181 1,154 1,246 1,364 1,467 1,649
Other Revenues 450 490 492 506 522 537 553 570 587 605 623 641
Grants & Contributions provided for Operating Purposes 3,619 5,444 5,816 5,446 5,764 5,924 6,128 6,297 6,471 6,651 6,836 7,026
Grants & Contributions provided for Capital Purposes 4,087 985 2,284 806 935 960 868 1,006 911 1,055 958 982
Other Income:
Net gains from the disposal of assets 73 - - - - - - - - - - -
Joint Ventures & Associated Entities - - - - - - - - - - - -
Total Income from Continuing Operations 27,288 25,456 28,304 28,138 30,204 32,443 34,443 35,559 36,592 37,921 39,029 40,372
Expenses from Continuing Operations
Employee Benefits & On-Costs 9,762 10,066 9,715 9,880 10,126 10,307 10,563 10,825 11,092 11,370 11,654 11,945
Borrowing Costs 468 427 448 486 529 537 497 452 405 356 305 261
Materials & Contracts 9,961 7,853 8,055 8,203 8,412 8,627 8,847 9,074 9,306 9,544 9,789 10,041
Depreciation & Amortisation 9,032 9,589 9,283 9,413 9,544 9,677 9,877 10,026 10,080 10,219 10,357 10,499
Impairment - - - - - - - - - - - -
Other Expenses 2,929 3,147 3,303 3,437 3,423 3,485 3,653 3,761 3,777 3,867 4,004 4,032
Interest & Investment Losses - - - - - - - - - - - -
Net Losses from the Disposal of Assets 12 - - - - - - - - - - -
Joint Ventures & Associated Entities - - - - - - - - - - - -
Total Expenses from Continuing Operations 32,164 31,082 30,805 31,420 32,035 32,633 33,437 34,137 34,660 35,355 36,109 36,778
Operating Result from Continuing Operations (4,876) (5,626) (2,501) (3,282) (1,831) (190) 1,006 1,422 1,931 2,566 2,920 3,595
Discontinued Operations - Profit/(Loss) - - - - - - - - - - - -
Net Profit/(Loss) from Discontinued Operations - - - - - - - - - - - -
Net Operating Result for the Year (4,876) (5,626) (2,501) (3,282) (1,831) (190) 1,006 1,422 1,931 2,566 2,920 3,595
Net Operating Result before Grants and Contributions provided for
Capital Purposes (8,963) (6,611) (4,785) (4,088) (2,765) (1,150) 139 416 1,020 1,511 1,963 2,613
Projected Years

Attachment 9 – ‘Model 3’ Projected Cash Flow Statement
Bellingen Shire Council
10 Year Financial Plan for the Years ending 30 June 2025
BALANCE SHEET - CONSOLIDATED Actuals Current Year
Scenario: Model 3 2013/14 2014/15 2015/16 2016/17 2017/18 2018/19 2019/20 2020/21 2021/22 2022/23 2023/24 2024/25
$'000 $'000 $'000 $'000 $'000 $'000 $'000 $'000 $'000 $'000 $'000 $'000
ASSETS
Current Assets
Cash & Cash Equivalents 6,065 6,363 6,327 5,646 5,915 5,770 3,470 3,909 7,424 9,990 13,605 19,600
Investments 23,100 21,100 18,500 18,348 18,348 18,348 18,222 17,840 17,840 17,840 17,840 17,840
Receivables 5,709 5,219 5,236 5,371 5,495 5,653 5,854 6,009 6,240 6,432 6,680 6,997
Inventories 265 301 294 300 308 315 323 331 339 348 357 366
Other 12 37 39 40 40 41 43 44 45 46 47 48
Non-current assets classified as "held for sale" - - - - - - - - - - - -
Total Current Assets 35,151 33,019 30,395 29,704 30,106 30,128 27,912 28,133 31,888 34,656 38,528 44,851
Non-Current Assets
Investments - 2,000 2,000 2,000 2,000 2,000 2,000 2,000 2,000 2,000 2,000 2,000
Receivables 12 619 622 646 722 809 840 866 819 768 792 816
Inventories - - - - - - - - - - - -
Infrastructure, Property, Plant & Equipment 522,068 521,015 522,514 521,398 519,560 518,048 520,008 519,882 516,745 515,196 512,916 508,802
Investments Accounted for using the equity method - - - - - - - - - - - -
Investment Property 1,924 1,924 1,924 1,924 1,924 1,924 1,924 1,924 1,924 1,924 1,924 1,924
Intangible Assets - - - - - - - - - - - -
Non-current assets classified as "held for sale" - - - - - - - - - - - -
Other - - - - - - - - - - - -
Total Non-Current Assets 524,004 525,558 527,060 525,967 524,206 522,781 524,771 524,671 521,487 519,887 517,631 513,541
TOTAL ASSETS 559,155 558,577 557,455 555,671 554,312 552,909 552,683 552,804 553,375 554,543 556,160 558,392
LIABILITIES
Current Liabilities
Bank Overdraft - - - - - - - - - - - -
Payables 2,770 3,170 3,207 3,059 3,132 3,186 3,261 3,312 3,351 3,401 3,461 3,506
Borrowings 174 660 853 1,101 1,267 1,307 1,352 1,399 1,448 1,364 1,408 950
Provisions 2,784 2,779 2,779 2,779 2,779 2,779 2,779 2,779 2,779 2,779 2,779 2,779
Liabilities associated with assets classified as "held for sale" - - - - - - - - - - - -
Total Current Liabilities 5,728 6,609 6,840 6,940 7,179 7,272 7,392 7,490 7,578 7,543 7,648 7,235
Non-Current Liabilities
Payables - - - - - - - - - - - -
Borrowings 4,776 8,939 10,085 11,484 11,717 10,410 9,058 7,659 6,211 4,847 3,439 2,489
Provisions 689 694 694 694 694 694 694 694 694 694 694 694
Investments Accounted for using the equity method - - - - - - - - - - - -
Liabilities associated with assets classified as "held for sale" - - - - - - - - - - - -
Total Non-Current Liabilities 5,465 9,633 10,779 12,178 12,411 11,104 9,751 8,352 6,904 5,541 4,133 3,183
TOTAL LIABILITIES 11,193 16,241 17,619 19,118 19,589 18,376 17,144 15,843 14,482 13,084 11,781 10,418
Net Assets 547,962 542,336 539,836 536,553 534,723 534,533 535,539 536,961 538,893 541,459 544,379 547,974
EQUITY
Retained Earnings 262,699 257,073 254,573 251,290 249,460 249,270 250,276 251,698 253,630 256,196 259,116 262,711
Revaluation Reserves 285,263 285,263 285,263 285,263 285,263 285,263 285,263 285,263 285,263 285,263 285,263 285,263
Council Equity Interest 547,962 542,336 539,836 536,553 534,723 534,533 535,539 536,961 538,893 541,459 544,379 547,974
Minority Equity Interest - - - - - - - - - - - -
Total Equity 547,962 542,336 539,836 536,553 534,723 534,533 535,539 536,961 538,893 541,459 544,379 547,974
Projected Years

Attachment 10 - ‘Model 1’ Projected Income Statement (General Fund)
Bellingen Shire Council
10 Year Financial Plan for the Years ending 30 June 2025
CASH FLOW STATEMENT - CONSOLIDATED Actuals Current Year
Scenario: Model 3 2013/14 2014/15 2015/16 2016/17 2017/18 2018/19 2019/20 2020/21 2021/22 2022/23 2023/24 2024/25
$'000 $'000 $'000 $'000 $'000 $'000 $'000 $'000 $'000 $'000 $'000 $'000
Cash Flows from Operating Activities
Receipts:
Rates & Annual Charges 11,345 12,288 12,856 14,051 15,401 16,943 18,805 19,392 20,091 20,735 21,317 21,999
User Charges & Fees 6,536 5,401 6,032 6,261 6,467 6,661 6,880 7,086 7,309 7,538 7,775 8,020
Interest & Investment Revenue Received 1,182 738 819 1,014 1,035 1,295 1,102 1,157 1,169 1,334 1,389 1,507
Grants & Contributions 6,732 6,429 8,100 6,252 6,699 6,884 6,995 7,303 7,383 7,706 7,793 8,008
Bonds & Deposits Received - - - - - - - - - - - -
Other 2,466 459 489 420 421 438 454 449 465 477 494 507
Payments:
Employee Benefits & On-Costs (9,502) (10,009) (9,731) (10,131) (10,126) (10,307) (10,563) (10,825) (11,092) (11,370) (11,654) (11,945)
Materials & Contracts (9,219) (7,634) (8,037) (8,155) (8,375) (8,581) (8,782) (9,016) (9,260) (9,487) (9,724) (9,989)
Borrowing Costs (442) (343) (423) (456) (522) (560) (521) (477) (431) (382) (330) (286)
Bonds & Deposits Refunded (28) - - - - - - - - - - -
Other (5,207) (3,147) (3,303) (3,437) (3,423) (3,485) (3,653) (3,761) (3,777) (3,867) (4,004) (4,032)
Net Cash provided (or used in) Operating Activities 3,863 4,182 6,801 5,818 7,577 9,288 10,717 11,309 11,857 12,684 13,056 13,787
Cash Flows from Investing Activities
Receipts:
Sale of Investment Securities 13,750 - 2,601 152 - - 126 383 - - - -
Sale of Infrastructure, Property, Plant & Equipment 330 724 185 583 396 528 458 1 629 1,095 975 363
Deferred Debtors Receipts 9 4 4 - - - - - - - - -
Payments:
Purchase of Investment Securities (23,100) - - - - - - - - - - -
Purchase of Investment Property - - - - - - - - - - - -
Purchase of Infrastructure, Property, Plant & Equipment (3,794) (9,261) (10,967) (8,880) (8,103) (8,693) (12,294) (9,901) (7,572) (9,765) (9,053) (6,748)
Net Cash provided (or used in) Investing Activities (12,805) (8,533) (8,177) (8,146) (7,707) (8,165) (11,710) (9,517) (6,943) (8,670) (8,078) (6,385)
Cash Flows from Financing Activities
Receipts:
Proceeds from Borrowings & Advances - 4,850 2,000 2,500 1,500 - - - - - - -
Payments:
Repayment of Borrowings & Advances (136) (202) (660) (853) (1,101) (1,267) (1,307) (1,352) (1,399) (1,448) (1,364) (1,408)
Net Cash Flow provided (used in) Financing Activities (136) 4,648 1,340 1,647 399 (1,267) (1,307) (1,352) (1,399) (1,448) (1,364) (1,408)
Net Increase/(Decrease) in Cash & Cash Equivalents (9,078) 298 (36) (681) 269 (144) (2,300) 439 3,515 2,566 3,615 5,995
plus: Cash, Cash Equivalents & Investments - beginning of year 15,143 6,065 6,363 6,327 5,646 5,915 5,770 3,470 3,909 7,424 9,990 13,605
Cash & Cash Equivalents - end of the year 6,065 6,363 6,327 5,646 5,915 5,770 3,470 3,909 7,424 9,990 13,605 19,600
Cash & Cash Equivalents - end of the year 6,065 6,363 6,327 5,646 5,915 5,770 3,470 3,909 7,424 9,990 13,605 19,600
Investments - end of the year 23,100 23,100 20,499 20,348 20,348 20,348 20,222 19,839 19,839 19,839 19,839 19,839
Cash, Cash Equivalents & Investments - end of the year 29,165 29,463 26,826 25,993 26,263 26,118 23,692 23,748 27,263 29,829 33,444 39,439
Projected Years

Attachment 11 - ‘Model 1’ Projected Balance Sheet (General Fund)
Bellingen Shire Council
10 Year Financial Plan for the Years ending 30 June 2025
INCOME STATEMENT - GENERAL FUND Actuals Current Year
Scenario: Model 1 2013/14 2014/15 2015/16 2016/17 2017/18 2018/19 2019/20 2020/21 2021/22 2022/23 2023/24 2024/25
$'000 $'000 $'000 $'000 $'000 $'000 $'000 $'000 $'000 $'000 $'000 $'000
Income from Continuing Operations
Revenue:
Rates & Annual Charges 8,375 9,142 9,422 9,922 10,450 11,008 11,596 12,218 12,873 13,566 14,297 15,069
User Charges & Fees 4,669 3,221 4,163 4,287 4,416 4,549 4,685 4,826 4,970 5,119 5,273 5,431
Interest & Investment Revenue 599 443 339 314 292 387 341 289 345 357 346 386
Other Revenues 415 473 478 493 507 523 538 554 571 588 606 624
Grants & Contributions provided for Operating Purposes 3,525 5,355 5,724 5,352 5,667 5,824 6,025 6,191 6,362 6,538 6,720 6,907
Grants & Contributions provided for Capital Purposes 3,150 900 1,069 644 769 790 693 827 728 867 765 784
Other Income:
Net gains from the disposal of assets 73 - - - - - - - - - - -
Total Income from Continuing Operations 20,806 19,535 21,195 21,012 22,102 23,080 23,879 24,905 25,850 27,036 28,007 29,201
Expenses from Continuing Operations
Employee Benefits & On-Costs 7,531 7,756 8,239 8,108 8,350 8,529 8,782 9,043 9,311 9,591 9,878 10,174
Borrowing Costs 468 427 448 457 473 501 509 494 503 446 416 361
Materials & Contracts 9,247 6,564 6,986 7,134 7,327 7,525 7,728 7,937 8,152 8,372 8,599 8,831
Depreciation & Amortisation 7,300 7,931 6,762 6,830 6,898 6,967 7,037 7,107 7,178 7,250 7,322 7,395
Other Expenses 2,396 2,467 2,563 2,678 2,646 2,688 2,836 2,924 2,919 2,987 3,102 3,108
Total Expenses from Continuing Operations 26,942 25,146 24,999 25,207 25,694 26,210 26,893 27,504 28,063 28,645 29,317 29,870
Operating Result from Continuing Operations (6,136) (5,611) (3,804) (4,195) (3,592) (3,130) (3,014) (2,599) (2,212) (1,609) (1,310) (669)
Discontinued Operations - Profit/(Loss) - - - - - - - - - - - -
Net Profit/(Loss) from Discontinued Operations - - - - - - - - - - - -
Net Operating Result for the Year (6,136) (5,611) (3,804) (4,195) (3,592) (3,130) (3,014) (2,599) (2,212) (1,609) (1,310) (669)
Net Operating Result before Grants and Contributions provided for
Capital Purposes (9,286) (6,511) (4,873) (4,839) (4,361) (3,920) (3,707) (3,427) (2,941) (2,476) (2,075) (1,453)
Projected Years

Attachment 12 - ‘Model 1’ Projected Cash Flow Statement (General Fund)
Bellingen Shire Council
10 Year Financial Plan for the Years ending 30 June 2025
BALANCE SHEET - GENERAL FUND Actuals Current Year
Scenario: Model 1 2013/14 2014/15 2015/16 2016/17 2017/18 2018/19 2019/20 2020/21 2021/22 2022/23 2023/24 2024/25
$'000 $'000 $'000 $'000 $'000 $'000 $'000 $'000 $'000 $'000 $'000 $'000
ASSETS
Current Assets
Cash & Cash Equivalents 2,020 4,810 4,166 3,210 2,909 2,662 2,503 1,889 2,255 2,471 1,869 3,167
Investments 6,100 4,100 4,100 4,100 4,100 4,100 4,100 4,100 4,100 4,100 4,100 4,100
Receivables 4,748 4,664 4,747 4,836 4,973 5,111 5,249 5,386 5,554 5,725 5,875 6,102
Inventories 252 248 260 266 273 280 288 295 303 311 319 328
Other 12 37 39 40 40 41 43 44 45 46 47 48
Total Current Assets 13,132 13,859 13,312 12,452 12,296 12,194 12,183 11,715 12,257 12,653 12,210 13,746
Non-Current Assets
Investments - 2,000 2,000 2,000 2,000 2,000 2,000 2,000 2,000 2,000 2,000 2,000
Receivables 12 619 622 609 641 674 656 691 667 640 674 710
Infrastructure, Property, Plant & Equipment 438,808 434,694 431,902 429,091 426,766 424,138 420,929 419,415 415,060 412,433 409,861 405,882
Investment Property 1,924 1,924 1,924 1,924 1,924 1,924 1,924 1,924 1,924 1,924 1,924 1,924
Total Non-Current Assets 440,744 439,237 436,448 433,623 431,330 428,736 425,508 424,029 419,651 416,996 414,458 410,515
TOTAL ASSETS 453,876 453,096 449,760 446,075 443,626 440,930 437,691 435,744 431,909 429,649 426,669 424,260
LIABILITIES
Current Liabilities
Payables 2,440 2,623 2,750 2,527 2,593 2,656 2,726 2,805 2,832 2,888 2,935 2,967
Borrowings 174 660 766 924 1,129 1,295 1,427 1,650 1,707 1,717 1,772 1,325
Provisions 2,784 2,779 2,779 2,779 2,779 2,779 2,779 2,779 2,779 2,779 2,779 2,779
Total Current Liabilities 5,398 6,061 6,296 6,230 6,501 6,730 6,932 7,234 7,318 7,384 7,486 7,072
Non-Current Liabilities
Borrowings 4,776 8,939 9,173 9,748 10,620 10,825 10,398 10,748 9,041 8,324 6,552 5,227
Provisions 689 694 694 694 694 694 694 694 694 694 694 694
Total Non-Current Liabilities 5,465 9,633 9,866 10,442 11,313 11,518 11,092 11,442 9,735 9,018 7,246 5,921
TOTAL LIABILITIES 10,863 15,694 16,162 16,672 17,814 18,248 18,023 18,676 17,053 16,402 14,732 12,992
Net Assets 443,013 437,402 433,598 429,403 425,811 422,682 419,668 417,068 414,856 413,247 411,937 411,268
EQUITY
Retained Earnings 235,648 230,037 226,233 222,038 218,446 215,317 212,303 209,703 207,491 205,882 204,572 203,903
Revaluation Reserves 207,365 207,365 207,365 207,365 207,365 207,365 207,365 207,365 207,365 207,365 207,365 207,365
Council Equity Interest 443,013 437,402 433,598 429,403 425,811 422,682 419,668 417,068 414,856 413,247 411,937 411,268
Total Equity 443,013 437,402 433,598 429,403 425,811 422,682 419,668 417,068 414,856 413,247 411,937 411,268
Projected Years
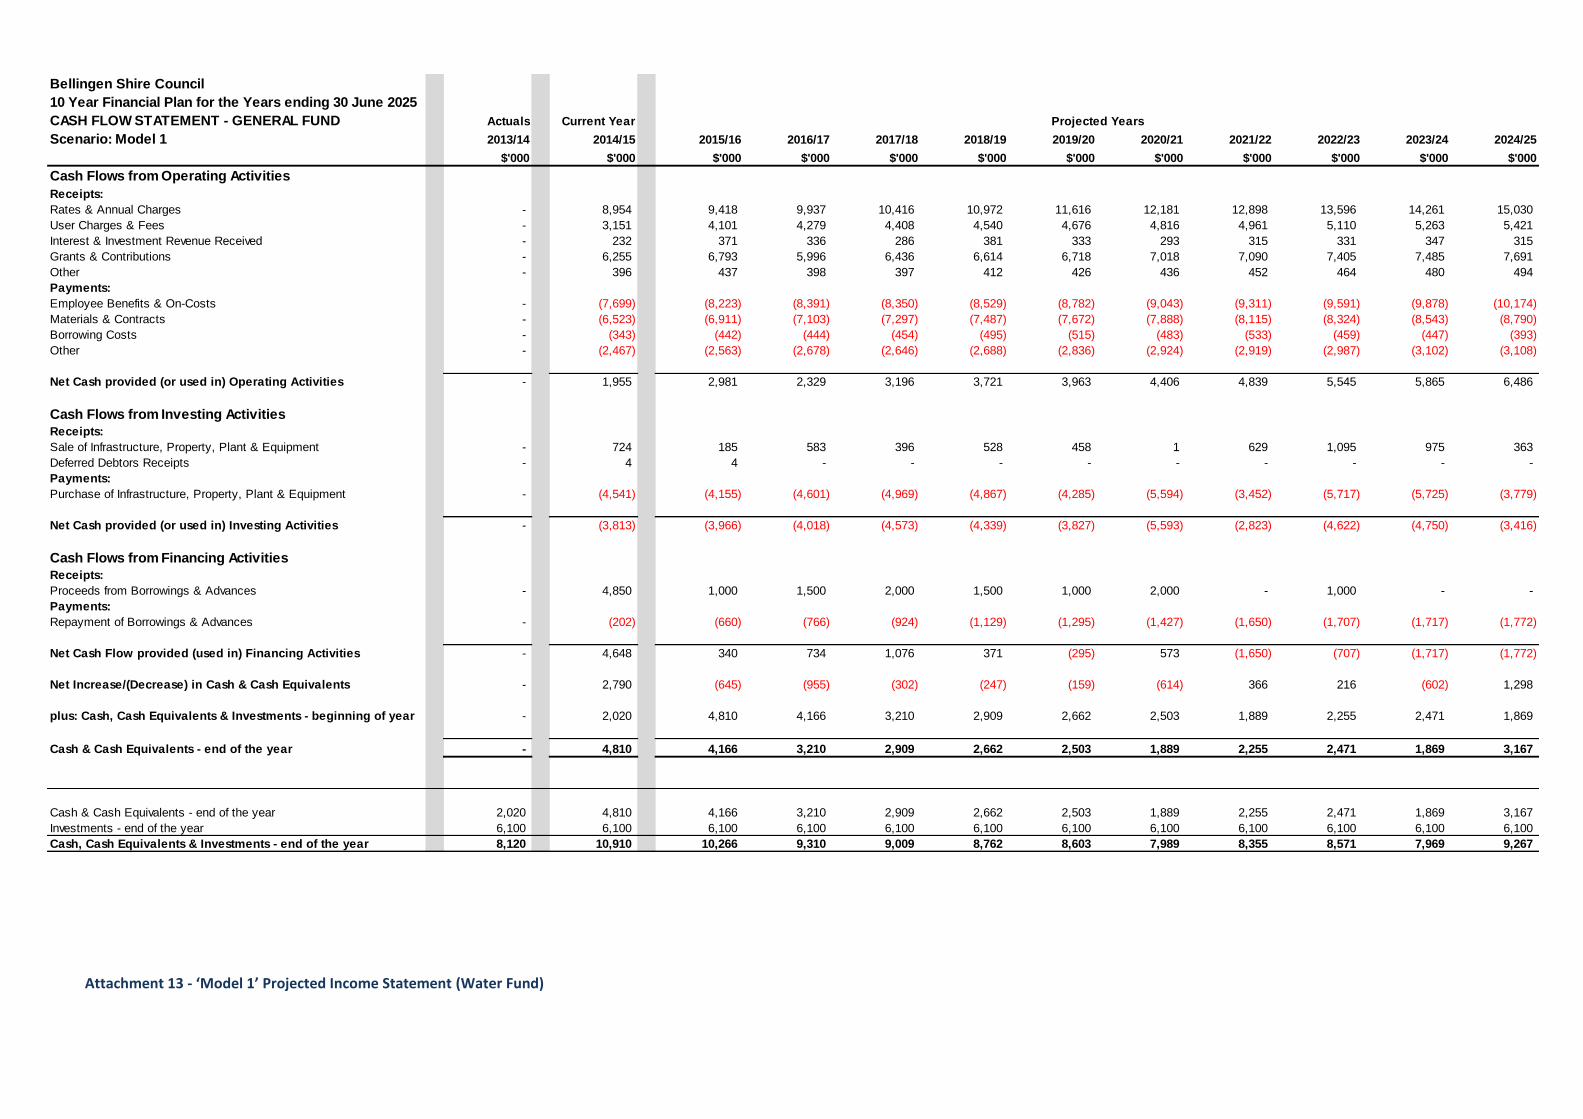
Attachment 13 - ‘Model 1’ Projected Income Statement (Water Fund)
Bellingen Shire Council
10 Year Financial Plan for the Years ending 30 June 2025
CASH FLOW STATEMENT - GENERAL FUND Actuals Current Year
Scenario: Model 1 2013/14 2014/15 2015/16 2016/17 2017/18 2018/19 2019/20 2020/21 2021/22 2022/23 2023/24 2024/25
$'000 $'000 $'000 $'000 $'000 $'000 $'000 $'000 $'000 $'000 $'000 $'000
Cash Flows from Operating Activities
Receipts:
Rates & Annual Charges - 8,954 9,418 9,937 10,416 10,972 11,616 12,181 12,898 13,596 14,261 15,030
User Charges & Fees - 3,151 4,101 4,279 4,408 4,540 4,676 4,816 4,961 5,110 5,263 5,421
Interest & Investment Revenue Received - 232 371 336 286 381 333 293 315 331 347 315
Grants & Contributions - 6,255 6,793 5,996 6,436 6,614 6,718 7,018 7,090 7,405 7,485 7,691
Other - 396 437 398 397 412 426 436 452 464 480 494
Payments:
Employee Benefits & On-Costs - (7,699) (8,223) (8,391) (8,350) (8,529) (8,782) (9,043) (9,311) (9,591) (9,878) (10,174)
Materials & Contracts - (6,523) (6,911) (7,103) (7,297) (7,487) (7,672) (7,888) (8,115) (8,324) (8,543) (8,790)
Borrowing Costs - (343) (442) (444) (454) (495) (515) (483) (533) (459) (447) (393)
Other - (2,467) (2,563) (2,678) (2,646) (2,688) (2,836) (2,924) (2,919) (2,987) (3,102) (3,108)
Net Cash provided (or used in) Operating Activities - 1,955 2,981 2,329 3,196 3,721 3,963 4,406 4,839 5,545 5,865 6,486
Cash Flows from Investing Activities
Receipts:
Sale of Infrastructure, Property, Plant & Equipment - 724 185 583 396 528 458 1 629 1,095 975 363
Deferred Debtors Receipts - 4 4 - - - - - - - - -
Payments:
Purchase of Infrastructure, Property, Plant & Equipment - (4,541) (4,155) (4,601) (4,969) (4,867) (4,285) (5,594) (3,452) (5,717) (5,725) (3,779)
Net Cash provided (or used in) Investing Activities - (3,813) (3,966) (4,018) (4,573) (4,339) (3,827) (5,593) (2,823) (4,622) (4,750) (3,416)
Cash Flows from Financing Activities
Receipts:
Proceeds from Borrowings & Advances - 4,850 1,000 1,500 2,000 1,500 1,000 2,000 - 1,000 - -
Payments:
Repayment of Borrowings & Advances - (202) (660) (766) (924) (1,129) (1,295) (1,427) (1,650) (1,707) (1,717) (1,772)
Net Cash Flow provided (used in) Financing Activities - 4,648 340 734 1,076 371 (295) 573 (1,650) (707) (1,717) (1,772)
Net Increase/(Decrease) in Cash & Cash Equivalents - 2,790 (645) (955) (302) (247) (159) (614) 366 216 (602) 1,298
plus: Cash, Cash Equivalents & Investments - beginning of year - 2,020 4,810 4,166 3,210 2,909 2,662 2,503 1,889 2,255 2,471 1,869
Cash & Cash Equivalents - end of the year - 4,810 4,166 3,210 2,909 2,662 2,503 1,889 2,255 2,471 1,869 3,167
Cash & Cash Equivalents - end of the year 2,020 4,810 4,166 3,210 2,909 2,662 2,503 1,889 2,255 2,471 1,869 3,167
Investments - end of the year 6,100 6,100 6,100 6,100 6,100 6,100 6,100 6,100 6,100 6,100 6,100 6,100
Cash, Cash Equivalents & Investments - end of the year 8,120 10,910 10,266 9,310 9,009 8,762 8,603 7,989 8,355 8,571 7,969 9,267
Projected Years

Attachment 14 - ‘Model 1’ Projected Balance Sheet (Water Fund)
Bellingen Shire Council
10 Year Financial Plan for the Years ending 30 June 2025
INCOME STATEMENT - WATER FUND Actuals Current Year
Scenario: Model 1 2013/14 2014/15 2015/16 2016/17 2017/18 2018/19 2019/20 2020/21 2021/22 2022/23 2023/24 2024/25
$'000 $'000 $'000 $'000 $'000 $'000 $'000 $'000 $'000 $'000 $'000 $'000
Income from Continuing Operations
Revenue:
Rates & Annual Charges 532 462 485 502 520 538 557 576 596 617 639 661
User Charges & Fees 1,740 1,761 1,722 1,782 1,845 1,909 1,976 2,045 2,116 2,190 2,267 2,346
Interest & Investment Revenue 397 408 552 554 569 705 595 571 604 648 677 718
Other Revenues 31 12 13 13 14 14 14 15 15 16 16 17
Grants & Contributions provided for Operating Purposes 53 48 49 51 52 54 55 57 59 60 62 64
Grants & Contributions provided for Capital Purposes 506 30 153 157 160 164 169 173 177 182 186 191
Other Income:
Net gains from the disposal of assets - - - - - - - - - - - -
Joint Ventures & Associated Entities - - - - - - - - - - - -
Total Income from Continuing Operations 3,259 2,721 2,974 3,059 3,159 3,384 3,365 3,437 3,568 3,713 3,847 3,997
Expenses from Continuing Operations
Employee Benefits & On-Costs 1,032 1,068 1,142 1,176 1,211 1,247 1,285 1,323 1,363 1,404 1,446 1,489
Borrowing Costs - - - - - - - - - - - -
Materials & Contracts 118 566 363 367 372 376 381 385 389 394 398 402
Depreciation & Amortisation 780 739 863 891 919 950 1,013 1,054 1,049 1,076 1,104 1,132
Impairment - - - - - - - - - - - -
Other Expenses 333 410 420 431 441 452 464 475 487 499 512 525
Net Losses from the Disposal of Assets 11 - - - - - - - - - - -
Total Expenses from Continuing Operations 2,274 2,784 2,787 2,865 2,943 3,026 3,142 3,238 3,289 3,373 3,459 3,548
Operating Result from Continuing Operations 985 (64) 187 194 216 359 223 199 280 340 388 449
Discontinued Operations - Profit/(Loss) - - - - - - - - - - - -
Net Profit/(Loss) from Discontinued Operations - - - - - - - - - - - -
Net Operating Result for the Year 985 (64) 187 194 216 359 223 199 280 340 388 449
Net Operating Result before Grants and Contributions provided for
Capital Purposes 479 (94) 34 38 56 194 55 26 102 158 202 258
Projected Years

Attachment 15 - ‘Model 1’ Projected Cash Flow Statement (Water Fund)
Bellingen Shire Council
10 Year Financial Plan for the Years ending 30 June 2025
BALANCE SHEET - WATER FUND Actuals Current Year
Scenario: Model 1 2013/14 2014/15 2015/16 2016/17 2017/18 2018/19 2019/20 2020/21 2021/22 2022/23 2023/24 2024/25
$'000 $'000 $'000 $'000 $'000 $'000 $'000 $'000 $'000 $'000 $'000 $'000
ASSETS
Current Assets
Cash & Cash Equivalents 2,484 1,454 2,085 2,154 2,540 2,484 500 500 1,238 2,204 2,879 3,799
Investments 12,000 12,000 12,000 12,000 12,000 12,000 11,813 11,399 11,399 11,399 11,399 11,399
Receivables 641 200 188 195 190 196 190 197 204 211 218 226
Inventories 13 53 34 34 35 35 36 36 36 37 37 38
Other - - - - - - - - - - - -
Non-current assets classified as "held for sale" - - - - - - - - - - - -
Total Current Assets 15,138 13,707 14,307 14,383 14,764 14,715 12,539 12,132 12,877 13,851 14,533 15,461
Non-Current Assets
Infrastructure, Property, Plant & Equipment 44,064 45,661 45,206 45,332 45,176 45,593 48,001 48,617 48,161 47,537 47,252 46,783
Total Non-Current Assets 44,064 45,661 45,206 45,332 45,176 45,593 48,001 48,617 48,161 47,537 47,252 46,783
TOTAL ASSETS 59,202 59,368 59,512 59,715 59,940 60,308 60,541 60,749 61,038 61,387 61,786 62,244
LIABILITIES
Current Liabilities
Payables 205 435 392 401 410 419 428 437 447 457 467 477
Total Current Liabilities 205 435 392 401 410 419 428 437 447 457 467 477
Non-Current Liabilities
Borrowings - - - - - - - - - - - -
Total Non-Current Liabilities - - - - - - - - - - - -
TOTAL LIABILITIES 205 435 392 401 410 419 428 437 447 457 467 477
Net Assets 58,997 58,933 59,120 59,315 59,531 59,890 60,113 60,311 60,591 60,931 61,319 61,767
EQUITY
Retained Earnings 18,557 18,493 18,680 18,875 19,091 19,450 19,673 19,871 20,151 20,491 20,879 21,327
Revaluation Reserves 40,440 40,440 40,440 40,440 40,440 40,440 40,440 40,440 40,440 40,440 40,440 40,440
Council Equity Interest 58,997 58,933 59,120 59,315 59,531 59,890 60,113 60,311 60,591 60,931 61,319 61,767
Minority Equity Interest - - - - - - - - - - - -
Total Equity 58,997 58,933 59,120 59,315 59,531 59,890 60,113 60,311 60,591 60,931 61,319 61,767
Projected Years

Attachment 16 - ‘Model 1’ Projected Income Statement (Sewer Fund)
Bellingen Shire Council
10 Year Financial Plan for the Years ending 30 June 2025
CASH FLOW STATEMENT - WATER FUND Actuals Current Year
Scenario: Model 1 2013/14 2014/15 2015/16 2016/17 2017/18 2018/19 2019/20 2020/21 2021/22 2022/23 2023/24 2024/25
$'000 $'000 $'000 $'000 $'000 $'000 $'000 $'000 $'000 $'000 $'000 $'000
Cash Flows from Operating Activities
Receipts:
Rates & Annual Charges - 528 486 501 521 536 558 575 595 616 637 660
User Charges & Fees - 2,090 1,734 1,778 1,849 1,904 1,981 2,040 2,111 2,185 2,261 2,340
Interest & Investment Revenue Received - 408 552 554 569 705 595 571 604 648 677 718
Grants & Contributions - 78 202 207 213 218 224 230 236 242 248 255
Other - 58 13 13 13 14 14 15 15 15 16 16
Payments:
Employee Benefits & On-Costs - (1,068) (1,142) (1,176) (1,211) (1,247) (1,285) (1,323) (1,363) (1,404) (1,446) (1,489)
Materials & Contracts - (376) (387) (359) (363) (368) (372) (376) (380) (384) (388) (392)
Borrowing Costs - - - - - - - - - - - -
Bonds & Deposits Refunded - - - - - - - - - - - -
Other - (410) (420) (431) (441) (452) (464) (475) (487) (499) (512) (525)
Net Cash provided (or used in) Operating Activities - 1,307 1,038 1,087 1,149 1,310 1,251 1,255 1,331 1,419 1,494 1,583
Cash Flows from Investing Activities
Receipts:
Sale of Investment Securities - - - - - - 187 414 - - - -
Payments:
Purchase of Infrastructure, Property, Plant & Equipment - (2,337) (407) (1,018) (763) (1,366) (3,421) (1,670) (593) (453) (819) (663)
Net Cash provided (or used in) Investing Activities - (2,337) (407) (1,018) (763) (1,366) (3,235) (1,255) (593) (453) (819) (663)
Cash Flows from Financing Activities
Receipts:
Proceeds from Borrowings & Advances - - - - - - - - - - - -
Payments:
Repayment of Borrowings & Advances - - - - - - - - - - - -
Net Cash Flow provided (used in) Financing Activities - - - - - - - - - - - -
Net Increase/(Decrease) in Cash & Cash Equivalents - (1,030) 631 70 386 (56) (1,984) (0) 738 966 675 920
plus: Cash, Cash Equivalents & Investments - beginning of year - 2,484 1,454 2,085 2,154 2,540 2,484 500 500 1,238 2,204 2,879
Cash & Cash Equivalents - end of the year - 1,454 2,085 2,154 2,540 2,484 500 500 1,238 2,204 2,879 3,799
Cash & Cash Equivalents - end of the year 2,484 1,454 2,085 2,154 2,540 2,484 500 500 1,238 2,204 2,879 3,799
Investments - end of the year 12,000 12,000 12,000 12,000 12,000 12,000 11,813 11,399 11,399 11,399 11,399 11,399
Cash, Cash Equivalents & Investments - end of the year 14,484 13,454 14,085 14,154 14,540 14,484 12,313 11,899 12,637 13,603 14,278 15,198
Projected Years

Attachment 17 - ‘Model 1’ Projected Balance Sheet (Sewer Fund)
Bellingen Shire Council
10 Year Financial Plan for the Years ending 30 June 2025
INCOME STATEMENT - SEWER FUND Actuals Current Year
Scenario: Model 1 2013/14 2014/15 2015/16 2016/17 2017/18 2018/19 2019/20 2020/21 2021/22 2022/23 2023/24 2024/25
$'000 $'000 $'000 $'000 $'000 $'000 $'000 $'000 $'000 $'000 $'000 $'000
Income from Continuing Operations
Revenue:
Rates & Annual Charges 2,392 2,809 2,949 3,053 3,160 3,270 3,385 3,503 3,626 3,753 3,884 4,020
User Charges & Fees 150 192 200 206 212 219 225 232 239 246 254 261
Interest & Investment Revenue 205 99 219 158 180 220 204 195 231 272 312 363
Other Revenues 4 5 1 1 1 1 1 1 1 1 1 1
Grants & Contributions provided for Operating Purposes 41 41 42 44 45 46 48 49 51 52 54 55
Grants & Contributions provided for Capital Purposes 431 55 1,062 5 5 6 6 6 6 6 6 6
Other Income:
Net gains from the disposal of assets - - - - - - - - - - - -
Total Income from Continuing Operations 3,223 3,200 4,474 3,467 3,603 3,761 3,867 3,986 4,153 4,330 4,510 4,706
Expenses from Continuing Operations
Employee Benefits & On-Costs 1,199 1,241 1,284 1,323 1,363 1,404 1,446 1,489 1,534 1,580 1,627 1,676
Borrowing Costs - - - - - - - - - - - -
Materials & Contracts 596 722 706 702 714 726 739 752 765 779 793 807
Depreciation & Amortisation 952 920 1,159 1,187 1,217 1,245 1,307 1,339 1,322 1,356 1,390 1,425
Impairment - - - - - - - - - - - -
Other Expenses 200 269 320 328 336 344 353 362 371 380 390 399
Interest & Investment Losses - - - - - - - - - - - -
Net Losses from the Disposal of Assets 1 - - - - - - - - - - -
Total Expenses from Continuing Operations 2,948 3,152 3,469 3,540 3,630 3,720 3,844 3,941 3,992 4,095 4,200 4,308
Operating Result from Continuing Operations 275 49 1,005 (74) (27) 42 23 44 162 235 311 399
Discontinued Operations - Profit/(Loss) - - - - - - - - - - - -
Net Profit/(Loss) from Discontinued Operations - - - - - - - - - - - -
Net Operating Result for the Year 275 49 1,005 (74) (27) 42 23 44 162 235 311 399
Net Operating Result before Grants and Contributions provided for
Capital Purposes (156) (6) (57) (79) (33) 36 18 39 156 229 305 392
Projected Years

Attachment 18 - ‘Model 1’ Projected Cash Flow Statement (Sewer Fund)
Bellingen Shire Council
10 Year Financial Plan for the Years ending 30 June 2025
BALANCE SHEET - SEWER FUND Actuals Current Year
Scenario: Model 1 2013/14 2014/15 2015/16 2016/17 2017/18 2018/19 2019/20 2020/21 2021/22 2022/23 2023/24 2024/25
$'000 $'000 $'000 $'000 $'000 $'000 $'000 $'000 $'000 $'000 $'000 $'000
ASSETS
Current Assets
Cash & Cash Equivalents 1,561 98 500 500 1,326 2,146 896 1,634 2,582 3,569 4,753 6,261
Investments 5,000 5,000 2,399 2,242 2,242 2,242 2,242 2,242 2,242 2,242 2,242 2,242
Receivables 320 355 316 327 322 333 327 338 350 361 374 386
Total Current Assets 6,881 5,453 3,216 3,068 3,890 4,720 3,465 4,214 5,174 6,172 7,368 8,889
Non-Current Assets
Infrastructure, Property, Plant & Equipment 39,196 40,659 43,906 43,980 43,134 42,347 43,628 42,926 42,131 41,369 40,487 39,368
Total Non-Current Assets 39,196 40,659 43,906 43,980 43,134 42,347 43,628 42,926 42,131 41,369 40,487 39,368
TOTAL ASSETS 46,077 46,113 47,122 47,049 47,023 47,068 47,093 47,140 47,304 47,541 47,855 48,257
LIABILITIES
Current Liabilities
Payables 125 112 116 116 119 121 123 126 128 131 134 136
Total Current Liabilities 125 112 116 116 119 121 123 126 128 131 134 136
Non-Current Liabilities
Borrowings - - - - - - - - - - - -
Total Non-Current Liabilities - - - - - - - - - - - -
TOTAL LIABILITIES 125 112 116 116 119 121 123 126 128 131 134 136
Net Assets 45,952 46,001 47,006 46,932 46,905 46,947 46,970 47,014 47,176 47,410 47,721 48,120
EQUITY
Retained Earnings 8,494 8,543 9,548 9,474 9,447 9,489 9,512 9,556 9,718 9,952 10,263 10,662
Revaluation Reserves 37,458 37,458 37,458 37,458 37,458 37,458 37,458 37,458 37,458 37,458 37,458 37,458
Council Equity Interest 45,952 46,001 47,006 46,932 46,905 46,947 46,970 47,014 47,176 47,410 47,721 48,120
Minority Equity Interest - - - - - - - - - - - -
Total Equity 45,952 46,001 47,006 46,932 46,905 46,947 46,970 47,014 47,176 47,410 47,721 48,120
Projected Years

Attachment 19 - ‘Model 2’ Projected Income Statement (General Fund)
Bellingen Shire Council
10 Year Financial Plan for the Years ending 30 June 2025
CASH FLOW STATEMENT - SEWER FUND Actuals Current Year
Scenario: Model 1 2013/14 2014/15 2015/16 2016/17 2017/18 2018/19 2019/20 2020/21 2021/22 2022/23 2023/24 2024/25
$'000 $'000 $'000 $'000 $'000 $'000 $'000 $'000 $'000 $'000 $'000 $'000
Cash Flows from Operating Activities
Receipts:
Rates & Annual Charges - 2,806 2,952 3,044 3,167 3,262 3,393 3,495 3,617 3,744 3,875 4,010
User Charges & Fees - 160 197 204 210 216 223 230 237 244 251 258
Interest & Investment Revenue Received - 99 219 158 180 220 204 195 231 272 312 363
Grants & Contributions - 96 1,104 49 50 52 53 55 57 58 60 62
Other - 4 40 0 0 0 0 0 0 0 0 0
Payments:
Employee Benefits & On-Costs - (1,241) (1,284) (1,323) (1,363) (1,404) (1,446) (1,489) (1,534) (1,580) (1,627) (1,676)
Materials & Contracts - (735) (702) (702) (712) (724) (736) (749) (762) (776) (790) (805)
Borrowing Costs - - - - - - - - - - - -
Bonds & Deposits Refunded - - - - - - - - - - - -
Other - (269) (320) (328) (336) (344) (353) (362) (371) (380) (390) (399)
Net Cash provided (or used in) Operating Activities - 920 2,206 1,103 1,197 1,279 1,338 1,375 1,475 1,582 1,692 1,814
Cash Flows from Investing Activities
Receipts:
Sale of Investment Securities - - 2,601 158 - - - - - - - -
Payments:
Purchase of Infrastructure, Property, Plant & Equipment - (2,383) (4,405) (1,261) (371) (459) (2,588) (637) (526) (595) (508) (306)
Net Cash provided (or used in) Investing Activities - (2,383) (1,805) (1,103) (371) (459) (2,588) (637) (526) (595) (508) (306)
Cash Flows from Financing Activities
Receipts:
Proceeds from Borrowings & Advances - - - - - - - - - - - -
Payments:
Repayment of Borrowings & Advances - - - - - - - - - - - -
Net Cash Flow provided (used in) Financing Activities - - - - - - - - - - - -
Net Increase/(Decrease) in Cash & Cash Equivalents - (1,463) 402 - 826 820 (1,249) 737 949 987 1,184 1,508
plus: Cash, Cash Equivalents & Investments - beginning of year - 1,561 98 500 500 1,326 2,146 896 1,634 2,582 3,569 4,753
Cash & Cash Equivalents - end of the year - 98 500 500 1,326 2,146 896 1,634 2,582 3,569 4,753 6,261
Cash & Cash Equivalents - end of the year 1,561 98 500 500 1,326 2,146 896 1,634 2,582 3,569 4,753 6,261
Investments - end of the year 5,000 5,000 2,399 2,242 2,242 2,242 2,242 2,242 2,242 2,242 2,242 2,242
Cash, Cash Equivalents & Investments - end of the year 6,561 5,098 2,899 2,742 3,568 4,387 3,138 3,875 4,824 5,811 6,994 8,503
Projected Years

Attachment 20 - ‘Model 2’ Projected Balance Sheet (General Fund)
Bellingen Shire Council
10 Year Financial Plan for the Years ending 30 June 2025
INCOME STATEMENT - GENERAL FUND Actuals Current Year
Scenario: Model 2 2013/14 2014/15 2015/16 2016/17 2017/18 2018/19 2019/20 2020/21 2021/22 2022/23 2023/24 2024/25
$'000 $'000 $'000 $'000 $'000 $'000 $'000 $'000 $'000 $'000 $'000 $'000
Income from Continuing Operations
Revenue:
Rates & Annual Charges 8,375 9,142 9,422 9,719 10,026 10,343 10,670 11,008 11,356 11,715 12,085 12,468
User Charges & Fees 4,669 3,221 4,163 4,287 4,416 4,549 4,685 4,826 4,970 5,119 5,273 5,431
Interest & Investment Revenue 599 443 339 314 292 387 341 289 345 357 346 386
Other Revenues 415 473 478 493 507 523 538 554 571 588 606 624
Grants & Contributions provided for Operating Purposes 3,525 5,355 5,724 5,352 5,667 5,824 6,025 6,191 6,362 6,538 6,720 6,907
Grants & Contributions provided for Capital Purposes 3,150 900 1,069 644 769 790 693 827 728 867 765 784
Other Income:
Net gains from the disposal of assets 73 - - - - - - - - - - -
Total Income from Continuing Operations 20,806 19,535 21,195 20,809 21,678 22,415 22,952 23,695 24,332 25,185 25,795 26,600
Expenses from Continuing Operations
Employee Benefits & On-Costs 7,531 7,756 6,989 7,086 7,262 7,372 7,554 7,740 7,931 8,129 8,333 8,541
Borrowing Costs 468 427 448 457 473 501 466 454 467 414 360 312
Materials & Contracts 9,247 6,564 6,986 7,134 7,327 7,525 7,728 7,937 8,152 8,372 8,599 8,831
Depreciation & Amortisation 7,300 7,931 7,262 7,335 7,408 7,482 7,557 7,632 7,709 7,786 7,864 7,942
Other Expenses 2,396 2,467 2,563 2,678 2,646 2,688 2,836 2,924 2,919 2,987 3,102 3,108
Total Expenses from Continuing Operations 26,942 25,146 24,249 24,690 25,116 25,568 26,141 26,687 27,177 27,689 28,257 28,735
Operating Result from Continuing Operations (6,136) (5,611) (3,054) (3,881) (3,438) (3,152) (3,188) (2,993) (2,845) (2,504) (2,462) (2,135)
Discontinued Operations - Profit/(Loss) - - - - - - - - - - - -
Net Profit/(Loss) from Discontinued Operations - - - - - - - - - - - -
Net Operating Result for the Year (6,136) (5,611) (3,054) (3,881) (3,438) (3,152) (3,188) (2,993) (2,845) (2,504) (2,462) (2,135)
Net Operating Result before Grants and Contributions provided for
Capital Purposes (9,286) (6,511) (4,123) (4,525) (4,206) (3,942) (3,882) (3,820) (3,573) (3,371) (3,227) (2,919)
Projected Years

Attachment 21 - ‘Model 2’ Projected Cash Flow Statement (General Fund)
Bellingen Shire Council
10 Year Financial Plan for the Years ending 30 June 2025
BALANCE SHEET - GENERAL FUND Actuals Current Year
Scenario: Model 2 2013/14 2014/15 2015/16 2016/17 2017/18 2018/19 2019/20 2020/21 2021/22 2022/23 2023/24 2024/25
$'000 $'000 $'000 $'000 $'000 $'000 $'000 $'000 $'000 $'000 $'000 $'000
ASSETS
Current Assets
Cash & Cash Equivalents 2,020 4,810 5,282 5,184 5,537 4,309 4,623 4,287 4,702 3,741 2,799 3,468
Investments 6,100 4,100 4,100 4,100 4,100 4,100 4,100 4,100 4,100 4,100 4,100 4,100
Receivables 4,748 4,664 4,790 4,902 5,056 5,148 5,298 5,436 5,597 5,714 5,841 6,033
Inventories 252 248 260 266 273 280 288 295 303 311 319 328
Other 12 37 39 40 40 41 43 44 45 46 47 48
Total Current Assets 13,132 13,859 14,471 14,492 15,007 13,879 14,352 14,163 14,747 13,912 13,107 13,978
Non-Current Assets
Investments - 2,000 2,000 2,000 2,000 2,000 2,000 2,000 2,000 2,000 2,000 2,000
Receivables 12 619 622 597 615 634 604 623 590 554 571 589
Infrastructure, Property, Plant & Equipment 438,808 434,694 431,402 428,086 425,251 422,108 418,378 416,339 411,453 408,290 405,177 400,650
Investment Property 1,924 1,924 1,924 1,924 1,924 1,924 1,924 1,924 1,924 1,924 1,924 1,924
Total Non-Current Assets 440,744 439,237 435,948 432,606 429,789 426,666 422,906 420,886 415,967 412,767 409,671 405,163
TOTAL ASSETS 453,876 453,096 450,419 447,097 444,796 440,545 437,258 435,048 430,714 426,680 422,778 419,141
LIABILITIES
Current Liabilities
Payables 2,440 2,623 2,659 2,485 2,545 2,575 2,641 2,716 2,738 2,771 2,814 2,842
Borrowings 174 660 766 924 1,129 1,164 1,292 1,511 1,564 1,483 1,531 1,076
Provisions 2,784 2,779 2,779 2,779 2,779 2,779 2,779 2,779 2,779 2,779 2,779 2,779
Total Current Liabilities 5,398 6,061 6,205 6,188 6,453 6,518 6,712 7,006 7,081 7,033 7,124 6,698
Non-Current Liabilities
Borrowings 4,776 8,939 9,173 9,748 10,620 9,455 9,163 9,652 8,088 6,605 5,075 3,999
Provisions 689 694 694 694 694 694 694 694 694 694 694 694
Total Non-Current Liabilities 5,465 9,633 9,866 10,442 11,313 10,149 9,857 10,346 8,782 7,299 5,769 4,692
TOTAL LIABILITIES 10,863 15,694 16,071 16,630 17,767 16,668 16,569 17,352 15,863 14,333 12,893 11,390
Net Assets 443,013 437,402 434,348 430,467 427,030 423,877 420,689 417,696 414,851 412,347 409,885 407,750
EQUITY
Retained Earnings 235,648 230,037 226,983 223,102 219,665 216,512 213,324 210,331 207,486 204,982 202,520 200,385
Revaluation Reserves 207,365 207,365 207,365 207,365 207,365 207,365 207,365 207,365 207,365 207,365 207,365 207,365
Council Equity Interest 443,013 437,402 434,348 430,467 427,030 423,877 420,689 417,696 414,851 412,347 409,885 407,750
Total Equity 443,013 437,402 434,348 430,467 427,030 423,877 420,689 417,696 414,851 412,347 409,885 407,750
Projected Years

Attachment 22 - ‘Model 3’ Projected Income Statement (General Fund)
Bellingen Shire Council
10 Year Financial Plan for the Years ending 30 June 2025
CASH FLOW STATEMENT - GENERAL FUND Actuals Current Year
Scenario: Model 2 2013/14 2014/15 2015/16 2016/17 2017/18 2018/19 2019/20 2020/21 2021/22 2022/23 2023/24 2024/25
$'000 $'000 $'000 $'000 $'000 $'000 $'000 $'000 $'000 $'000 $'000 $'000
Cash Flows from Operating Activities
Receipts:
Rates & Annual Charges - 8,954 9,418 9,747 10,007 10,323 10,702 10,987 11,391 11,753 12,067 12,449
User Charges & Fees - 3,151 4,101 4,279 4,408 4,540 4,676 4,816 4,961 5,110 5,263 5,421
Interest & Investment Revenue Received - 232 329 311 268 426 321 291 322 384 368 349
Grants & Contributions - 6,255 6,793 5,996 6,436 6,614 6,718 7,018 7,090 7,405 7,485 7,691
Other - 396 437 395 394 409 422 433 448 459 475 488
Payments:
Employee Benefits & On-Costs - (7,699) (7,016) (7,326) (7,262) (7,372) (7,554) (7,740) (7,931) (8,129) (8,333) (8,541)
Materials & Contracts - (6,523) (6,960) (7,094) (7,300) (7,489) (7,675) (7,891) (8,118) (8,327) (8,546) (8,793)
Borrowing Costs - (343) (442) (444) (454) (522) (469) (441) (495) (443) (387) (340)
Other - (2,467) (2,563) (2,678) (2,646) (2,688) (2,836) (2,924) (2,919) (2,987) (3,102) (3,108)
Net Cash provided (or used in) Operating Activities - 1,955 4,097 3,186 3,851 4,240 4,305 4,549 4,750 5,225 5,290 5,616
Cash Flows from Investing Activities
Receipts:
Sale of Infrastructure, Property, Plant & Equipment - 724 185 583 396 528 458 1 629 1,095 975 363
Deferred Debtors Receipts - 4 4 - - - - - - - - -
Payments:
Purchase of Infrastructure, Property, Plant & Equipment - (4,541) (4,155) (4,601) (4,969) (4,867) (4,285) (5,594) (3,452) (5,717) (5,725) (3,779)
Net Cash provided (or used in) Investing Activities - (3,813) (3,966) (4,018) (4,573) (4,339) (3,827) (5,593) (2,823) (4,622) (4,750) (3,416)
Cash Flows from Financing Activities
Receipts:
Proceeds from Borrowings & Advances - 4,850 1,000 1,500 2,000 - 1,000 2,000 - - - -
Payments:
Repayment of Borrowings & Advances - (202) (660) (766) (924) (1,129) (1,164) (1,292) (1,511) (1,564) (1,483) (1,531)
Net Cash Flow provided (used in) Financing Activities - 4,648 340 734 1,076 (1,129) (164) 708 (1,511) (1,564) (1,483) (1,531)
Net Increase/(Decrease) in Cash & Cash Equivalents - 2,790 472 (99) 354 (1,228) 313 (336) 415 (961) (943) 669
plus: Cash, Cash Equivalents & Investments - beginning of year - 2,020 4,810 5,282 5,184 5,537 4,309 4,623 4,287 4,702 3,741 2,799
Cash & Cash Equivalents - end of the year - 4,810 5,282 5,184 5,537 4,309 4,623 4,287 4,702 3,741 2,799 3,468
Cash & Cash Equivalents - end of the year 2,020 4,810 5,282 5,184 5,537 4,309 4,623 4,287 4,702 3,741 2,799 3,468
Investments - end of the year 6,100 6,100 6,100 6,100 6,100 6,100 6,100 6,100 6,100 6,100 6,100 6,100
Cash, Cash Equivalents & Investments - end of the year 8,120 10,910 11,382 11,284 11,637 10,409 10,723 10,387 10,802 9,841 8,899 9,568
Projected Years

Attachment 23 - ‘Model 3’ Projected Balance Sheet (General Fund)
Bellingen Shire Council
10 Year Financial Plan for the Years ending 30 June 2025
INCOME STATEMENT - GENERAL FUND Actuals Current Year
Scenario: Model 3 2013/14 2014/15 2015/16 2016/17 2017/18 2018/19 2019/20 2020/21 2021/22 2022/23 2023/24 2024/25
$'000 $'000 $'000 $'000 $'000 $'000 $'000 $'000 $'000 $'000 $'000 $'000
Income from Continuing Operations
Revenue:
Rates & Annual Charges 8,375 9,142 9,422 10,531 11,795 13,238 14,886 15,350 15,828 16,322 16,830 17,355
User Charges & Fees 4,669 3,221 4,163 4,287 4,416 4,549 4,685 4,826 4,970 5,119 5,273 5,431
Interest & Investment Revenue 599 443 0 305 287 374 383 388 410 444 477 568
Other Revenues 415 473 478 493 507 523 538 554 571 588 606 624
Grants & Contributions provided for Operating Purposes 3,525 5,355 5,724 5,352 5,667 5,824 6,025 6,191 6,362 6,538 6,720 6,907
Grants & Contributions provided for Capital Purposes 3,150 900 1,069 644 769 790 693 827 728 867 765 784
Other Income:
Net gains from the disposal of assets 73 - - - - - - - - - - -
Total Income from Continuing Operations 20,806 19,535 20,856 21,612 23,442 25,298 27,211 28,136 28,870 29,879 30,671 31,669
Expenses from Continuing Operations
Employee Benefits & On-Costs 7,531 7,756 7,289 7,393 7,577 7,695 7,885 8,080 8,279 8,486 8,698 8,916
Borrowing Costs 468 427 448 486 529 537 497 452 405 356 305 261
Materials & Contracts 9,247 6,564 6,986 7,134 7,327 7,525 7,728 7,937 8,152 8,372 8,599 8,831
Depreciation & Amortisation 7,300 7,931 7,262 7,335 7,408 7,482 7,557 7,632 7,709 7,786 7,864 7,942
Other Expenses 2,396 2,467 2,563 2,678 2,646 2,688 2,836 2,924 2,919 2,987 3,102 3,108
Total Expenses from Continuing Operations 26,942 25,146 24,549 25,027 25,486 25,926 26,503 27,025 27,463 27,987 28,568 29,058
Operating Result from Continuing Operations (6,136) (5,611) (3,693) (3,415) (2,044) (629) 707 1,112 1,407 1,892 2,104 2,611
Discontinued Operations - Profit/(Loss) - - - - - - - - - - - -
Net Profit/(Loss) from Discontinued Operations - - - - - - - - - - - -
Net Operating Result for the Year (6,136) (5,611) (3,693) (3,415) (2,044) (629) 707 1,112 1,407 1,892 2,104 2,611
Net Operating Result before Grants and Contributions provided for
Capital Purposes (9,286) (6,511) (4,762) (4,059) (2,813) (1,419) 14 284 678 1,025 1,339 1,827
Projected Years

Attachment 24 - ‘Model 3’ Projected Cash Flow Statement (General Fund)
Bellingen Shire Council
10 Year Financial Plan for the Years ending 30 June 2025
BALANCE SHEET - GENERAL FUND Actuals Current Year
Scenario: Model 3 2013/14 2014/15 2015/16 2016/17 2017/18 2018/19 2019/20 2020/21 2021/22 2022/23 2023/24 2024/25
$'000 $'000 $'000 $'000 $'000 $'000 $'000 $'000 $'000 $'000 $'000 $'000
ASSETS
Current Assets
Cash & Cash Equivalents 2,020 4,810 3,742 2,985 2,018 1,072 2,012 1,678 3,423 3,936 5,576 9,007
Investments 6,100 4,100 4,100 4,100 4,100 4,100 4,100 4,100 4,100 4,100 4,100 4,100
Receivables 4,748 4,664 4,731 4,849 4,984 5,124 5,337 5,474 5,687 5,860 6,088 6,386
Inventories 252 248 260 266 273 280 288 295 303 311 319 328
Other 12 37 39 40 40 41 43 44 45 46 47 48
Total Current Assets 13,132 13,859 12,873 12,240 11,415 10,617 11,780 11,592 13,558 14,254 16,131 19,869
Non-Current Assets
Investments - 2,000 2,000 2,000 2,000 2,000 2,000 2,000 2,000 2,000 2,000 2,000
Receivables 12 619 622 646 722 809 840 866 819 768 792 816
Infrastructure, Property, Plant & Equipment 438,808 434,694 433,402 432,086 431,251 430,108 428,378 428,339 426,453 426,290 425,177 422,650
Investment Property 1,924 1,924 1,924 1,924 1,924 1,924 1,924 1,924 1,924 1,924 1,924 1,924
Total Non-Current Assets 440,744 439,237 437,948 436,655 435,896 434,841 433,142 433,128 431,196 430,981 429,892 427,390
TOTAL ASSETS 453,876 453,096 450,821 448,895 447,311 445,458 444,921 444,720 444,754 445,235 446,023 447,259
LIABILITIES
Current Liabilities
Payables 2,440 2,623 2,699 2,542 2,604 2,646 2,710 2,749 2,775 2,813 2,860 2,893
Borrowings 174 660 853 1,101 1,267 1,307 1,352 1,399 1,448 1,364 1,408 950
Provisions 2,784 2,779 2,779 2,779 2,779 2,779 2,779 2,779 2,779 2,779 2,779 2,779
Total Current Liabilities 5,398 6,061 6,332 6,423 6,650 6,733 6,841 6,927 7,003 6,956 7,047 6,622
Non-Current Liabilities
Borrowings 4,776 8,939 10,085 11,484 11,717 10,410 9,058 7,659 6,211 4,847 3,439 2,489
Provisions 689 694 694 694 694 694 694 694 694 694 694 694
Total Non-Current Liabilities 5,465 9,633 10,779 12,178 12,411 11,104 9,751 8,352 6,904 5,541 4,133 3,183
TOTAL LIABILITIES 10,863 15,694 17,111 18,601 19,061 17,836 16,592 15,279 13,907 12,496 11,180 9,805
Net Assets 443,013 437,402 433,709 430,294 428,250 427,621 428,329 429,440 430,847 432,739 434,843 437,454
EQUITY
Retained Earnings 235,648 230,037 226,344 222,929 220,885 220,256 220,964 222,075 223,482 225,374 227,478 230,089
Revaluation Reserves 207,365 207,365 207,365 207,365 207,365 207,365 207,365 207,365 207,365 207,365 207,365 207,365
Council Equity Interest 443,013 437,402 433,709 430,294 428,250 427,621 428,329 429,440 430,847 432,739 434,843 437,454
Total Equity 443,013 437,402 433,709 430,294 428,250 427,621 428,329 429,440 430,847 432,739 434,843 437,454
Projected Years

Attachment 25 – ‘Model 1’ Capital Expenditure Projections
Bellingen Shire Council
10 Year Financial Plan for the Years ending 30 June 2025
CASH FLOW STATEMENT - GENERAL FUND Actuals Current Year
Scenario: Model 3 2013/14 2014/15 2015/16 2016/17 2017/18 2018/19 2019/20 2020/21 2021/22 2022/23 2023/24 2024/25
$'000 $'000 $'000 $'000 $'000 $'000 $'000 $'000 $'000 $'000 $'000 $'000
Cash Flows from Operating Activities
Receipts:
Rates & Annual Charges - 8,954 9,418 10,506 11,713 13,145 14,854 15,322 15,879 16,376 16,805 17,329
User Charges & Fees - 3,151 4,101 4,279 4,408 4,540 4,676 4,816 4,961 5,110 5,263 5,421
Interest & Investment Revenue Received - 232 48 301 286 370 304 391 334 414 399 426
Grants & Contributions - 6,255 6,793 5,996 6,436 6,614 6,718 7,018 7,090 7,405 7,485 7,691
Other - 396 437 406 407 424 440 434 450 461 477 490
Payments:
Employee Benefits & On-Costs - (7,699) (7,306) (7,644) (7,577) (7,695) (7,885) (8,080) (8,279) (8,486) (8,698) (8,916)
Materials & Contracts - (6,523) (6,948) (7,094) (7,300) (7,489) (7,674) (7,891) (8,117) (8,327) (8,546) (8,793)
Borrowing Costs - (343) (423) (456) (522) (560) (521) (477) (431) (382) (330) (286)
Other - (2,467) (2,563) (2,678) (2,646) (2,688) (2,836) (2,924) (2,919) (2,987) (3,102) (3,108)
Net Cash provided (or used in) Operating Activities - 1,955 3,557 3,615 5,206 6,660 8,075 8,611 8,967 9,584 9,753 10,255
Cash Flows from Investing Activities
Receipts:
Sale of Infrastructure, Property, Plant & Equipment - 724 185 583 396 528 458 1 629 1,095 975 363
Deferred Debtors Receipts - 4 4 - - - - - - - - -
Payments:
Purchase of Infrastructure, Property, Plant & Equipment - (4,541) (6,155) (6,601) (6,969) (6,867) (6,285) (7,594) (6,452) (8,717) (7,725) (5,779)
Net Cash provided (or used in) Investing Activities - (3,813) (5,966) (6,018) (6,573) (6,339) (5,827) (7,593) (5,823) (7,622) (6,750) (5,416)
Cash Flows from Financing Activities
Receipts:
Proceeds from Borrowings & Advances - 4,850 2,000 2,500 1,500 - - - - - - -
Payments:
Repayment of Borrowings & Advances - (202) (660) (853) (1,101) (1,267) (1,307) (1,352) (1,399) (1,448) (1,364) (1,408)
Net Cash Flow provided (used in) Financing Activities - 4,648 1,340 1,647 399 (1,267) (1,307) (1,352) (1,399) (1,448) (1,364) (1,408)
Net Increase/(Decrease) in Cash & Cash Equivalents - 2,790 (1,068) (757) (968) (946) 941 (334) 1,745 513 1,639 3,431
plus: Cash, Cash Equivalents & Investments - beginning of year - 2,020 4,810 3,742 2,985 2,018 1,072 2,012 1,678 3,423 3,936 5,576
Cash & Cash Equivalents - end of the year - 4,810 3,742 2,985 2,018 1,072 2,012 1,678 3,423 3,936 5,576 9,007
Cash & Cash Equivalents - end of the year 2,020 4,810 3,742 2,985 2,018 1,072 2,012 1,678 3,423 3,936 5,576 9,007
Investments - end of the year 6,100 6,100 6,100 6,100 6,100 6,100 6,100 6,100 6,100 6,100 6,100 6,100
Cash, Cash Equivalents & Investments - end of the year 8,120 10,910 9,842 9,085 8,118 7,172 8,112 7,778 9,523 10,036 11,676 15,107
Projected Years

Bellingen Shire Council
10 Year Financial Plan for the Years ending 30 June 2025
CAPITAL EXPENDITURE - CONSOLIDATED FUND
Scenario: Model 1
2015/16 2016/17 2017/18 2018/19 2019/20 2020/21 2021/22 2022/23 2023/24 2024/25
BUILDINGS $'000 $'000 $'000 $'000 $'000 $'000 $'000 $'000 $'000 $'000
BUILDING CAPITAL RENEWALS PROGRAM 200 200 200 200 200 200 200 200 200 200
INFRASTRUCTURE
ROADS, BRIDGES AND FOOTPATHS 2810* 2,585 3,220 2,760 2,476 2,650 1,130 1,960 2,310 2,260
PLANT & EQUIPMENT
LIGHT VEHICLE REPLACEMENT
FURNITURE AND FITTINGS 14 14 15 15 16 16 17 17 18 18
PLANT REPLACEMENT - LIGHT/MAJOR/MINOR 858 1,643 1,395 1,765 1,445 2,593 1,960 3,392 3,048 1,180
I.T. EXPENSES 120 102 83 71 94 80 91 94 96 67
OTHER CAPITAL PURCHASES 153 65 65 65 65 65 65 65 65 65
TOTAL PLANT & EQUIPMENT 1,131 1,810 1,543 1,901 1,604 2,738 2,116 3,551 3,209 1,312
WATER AND SEWER
INFRASTRUCTURE, PROPERTY, PLANT & EQUIPMENT 4,826 2,285 1,140 1,832 6,014 2,313 1,126 1,054 1,334 976
TOTAL CAPITAL EXPENDITURE 8,967 6,880 6,103 6,693 10,294 7,901 4,572 6,765 7,053 4,748
*BELLINGEN SHIRE COUNCIL - ROADS, BRIDGES AND FOOTPATHS CAPITAL WORKS PROGRAM
2015/2016
ROAD RESEALING PROGRAM
HYDES CREEK ROAD, DOME ROAD, KALANG ROAD
TYRINGHAM ROAD MR 119, CORAMBA ROAD MR 469
OTHER RESEALS AND HEAVY PATCHING
ROAD REHABILITATION
NORTH BANK ROAD RECONSTRUCTION (500 METRES) 200,000
VERNON PLACE, URUNGA RECONSTRUCTION, KERB AND GUTTER 220,000
FORD ST, BELLINGEN RETAINING WALL REPAIR 200,000
HILLSIDE DRIVE, URUNGA RETAINING WALL REPAIR 150,000
CHURCH ST, BELLINGEN CARPARK UPGRADE 100,000
PROMISED LAND ROAD, GLENIFFER RIVER BANK EROSION 60,000
DARKWOOD ROAD, THORA BELLINGER RIVER WORK ADJACENT TO HOBARTS BRIDGE 20,000
TOTAL 2,810,000
1,860,000


