20
0 Long Term Financial Plan 2017 to 2026 Public Consultation version April 2016
0
Long Term Financial Plan 2017 to 2026
Public Consultation version April 2016
District Council of Elliston Long Term Financial Plan 2017 to 2026
1
INDEX
Page # 1. Introduction 2 2. Strategic Management Plan 2 3. Financial Strategy 3 4. Key assumptions 4 5. Long-term Financial Sustainability - Key Financial Indicators 5 6. Uniform Presentation of Finances 9 Appendix A – Financial Statements 12 Reference Material 16
District Council of Elliston Long Term Financial Plan 2017 to 2026
2
1. Introduction The purpose of this long-term financial plan (LTFP) is to express, in financial terms, the activities that the District Council of Elliston (Council) proposes to undertake over the medium to longer term to achieve its stated objectives as outlined in its Strategic Management Plan.
It is a guide for future action based on the longer-term impact of revenue and expenditure proposals. The aggregation of future intended outlays and anticipated revenues enables the accumulating overall financial implications to be readily identified and if warranted, for proposed future activities to be revised.
Long-term financial plans are particularly important for local governments as they are responsible for managing a high level of long-lived assets relative to their income base. A council may have long-periods with modest levels of asset renewal requirements and then other periods when very significant outlays are necessary. All councils need to generate revenue in an equitable manner over time and ensure they have capacity to finance peaks in asset management and other outlays when, and including by way of borrowings where, necessary.
The preparation of a LTFP generates improved information to guide decisions about the mix and timing of outlays on operating activities and additional assets and the funding implications of these. Without a soundly based LTFP an organisation with significant asset management responsibilities is unlikely to have sufficient data to determine sustainable service levels and affordable asset stockholding strategies, appropriate revenue targets or optimal treasury management.
2. Strategic Direction Our Vision for the community A viable, cohesive and dynamic community, which supports expanding economic opportunities in a sustainable manner without compromising the natural assets or quality of lifestyle of the community. Our Mission As a legislated business, the District Council of Elliston aims to provide leadership, representation, advocacy and prudent management for its communities and visitors, and to work with them to identify asset needs and improve services. As a Council, we are committed to achieving financial sustainability. We recognise the benefits and advantages of working with the regional stakeholders and our neighbouring Councils.
District Council of Elliston Long Term Financial Plan 2017 to 2026
3
Our Core Values The Elected Members and staff of the District Council of Elliston are guided by the following day-to-day principles to create a positive and dynamic organisational culture:
• Good governance
• Ethical behaviour
• Community focus
• Integrity
• Team Focus
• Openness and Accountability
• Responsibility
• Cohesiveness
• Positive Leadership
• Prudent financial management. Our key strategic objectives
1. Economy
To actively encourage, support and promote opportunities to increase the prosperity and sustainable growth of the community 2. Infrastructure
To effectively and efficiently manage and improve our community infrastructure. 3. Environment
To promote the enjoyment of our natural resources in a prudent and environmentally sustainable manner and ensure that our built environment effectively provides for the long term needs of our communities. 4. Community Services
To deliver a high standard of essential community services and show leadership in developing positive community spirit. 5. Leadership and Governance
To provide progressive leadership and good governance which encourages confidence of the community in the Council, and conduct our business in a financially responsible manner.
District Council of Elliston Long Term Financial Plan 2017 to 2026
4
3. Financial Strategy The LTFP is based on Councils current operating service levels as well as projected capital renewal expenditure obtained from Councils asset management plan. Roads and plant & equipment account for approximately 80% of Councils total renewal expenditure over time.
• At this stage Council is intending to increase rates by 3% (plus cpi) per annum for the years ending 30 June 2018, 2019 & 2020. An increase of this size will ensure that Council moves from its current underlying operating deficit situation of ($185k) to a breakeven result by 2020. Increases will be restricted to CPI from 2021 onwards unless it is decided to build new assets or to upgrade existing assets, in which case (in the absence of other revenue streams) rates may need to increase to cover these outlays.
• Community Wastewater Management Schemes (CWMS) service charges are set at an appropriate level to ensure whole of life costs are recovered.
• Waste management user charges are set at an appropriate level to ensure the full cost of providing these services is recovered from those who benefit from the service.
• Council will continue to review service delivery to the community to identify any further opportunities to reduce operating costs due to increased operating efficiencies. This will be an ongoing objective for management to ensure the maximum benefit to the community per dollar of rates. Target reductions of $12k per annum in operating expenditure have been built into the first 3 years the plan.
• Council will not undertake any construction of upgraded or new assets over the next 10 years unless additional revenue is identified that will fund such upgrades. By committing to this strategy Council will be able to allocate resources to replacing existing assets in a timely manner as well as minimising any increases in operating costs associated with additional assets. Should an upgrade program be agreed to, then a complete rework of the Long Term Financial Plan will be required to confirm Council will remain in a financially sustainable position after the completion of these works.
• Grant revenue will be targeted in a strategic manner. This means that grant revenue to build new assets would only be pursued and accepted if the new assets were deemed to have strategic significance, particularly if additional funding was to be contributed by Council. Where an operating grant is sought and additional Council funds are required to be contributed, then careful consideration will be given to long-run benefits and costs. This will ensure activities that may better fit Council’s strategic objectives are not being delayed in lieu of the activity being funded by the grant.
• The Long Term Financial Plan will be revised as part of the Annual Business Planning process each year.
District Council of Elliston Long Term Financial Plan 2017 to 2026
5
4. Key assumptions The following assumptions have been built into the forecast calculations:
• The content of the LTFP is based on real (2016-17) dollar values for all future years to facilitate comparisons between years;
• Forecast debt and cash reserves in future years have been discounted by 2%p.a. in recognition of the fact that inflation reduces the real value of financial assets and liabilities;
• Commonwealth Financial Assistance Grant (FAGs) revenue is not expected to vary over the planning period. Timing of receipt of FAGs revenue has been assumed to be quarterly four times each year. Capital and maintenance expenditure on road renewal and plant & equipment matches expenditure requirements from the 10 year renewal programs;
• Capital expenditure renewal levels have been set to ensure assets are renewed in a timely manner that is consistent with Councils asset management plan;
• The cost of new or upgraded assets will be included in future iterations of the long term plan. The current plan assume no new assets or upgraded assets except for the sealing of Kyancutta road and some new items identified in the 2016-17 Annual Business Plan.
• Commonwealth Roads to Recovery funding is maintained at current levels throughout the planning period. Again this assumption may well change in future iterations.
• Investment income has been calculated at a conservative 2% p.a. on the previous year’s closing cash balance.
• The upgrade of Kyancutta road will increase annual depreciation by $21k per annum.
• That forecast savings of $328k in Materials, Contractors & Other operating expenses will be realised as identified in the 2016-17 Annual Budget.

District Council of Elliston Long Term Financial Plan 2017 to 2026
6
5. Long-term Financial Sustainability - Key Financial Indicators Indicator 1A - Operating Surplus Ratio (OSR) – Adjusted to reveal the underlying deficit
The operating surplus ratio expresses the operating surplus (deficit) as a percentage of general and other rates.
Calculated as: (Operating revenue minus operating expense) divided by rate revenue.
The OSR is used to confirm that Council can cover its operating expenditure and depreciation charge from its operating revenue. A negative result indicates that Council is not doing so.
Indicator 1A is a recalculation of the actual OSR (Indicator 1B below) included in this plan to remove the impact of the additional roads to recovery and special local roads grant funding that is included in the forecasts for the year ending 30 June 2017 & 2018. As these grant funds have been used to upgrade Kyancutta road the capital expenditure and associated increase in the depreciation charge have also been removed from the recalculations.
When these amounts are removed from the operating statement it can be seen that they are covering up an underlying operating deficit (compare shaded cells in table 1 & table 2 below) which means in reality Council are not covering its operating expenses from operating revenue as is expected.
Accordingly the increase in rates and reduction in operating expenses as identified in section ‘3. Financial Strategy’ earlier in this document are required to return Council to a breakeven or better position by the year ending 30 June 2020.
-15%
-10%
-5%
0%
5%
10%
15%
2016 2017 2018 2019 2020 2021 2022 2023 2024 2025 2026
Adju
sted
Rat
io
Plan Year
LTFP Projected
Max Target
Min Target
District Council of Elliston Long Term Financial Plan 2017 to 2026
7
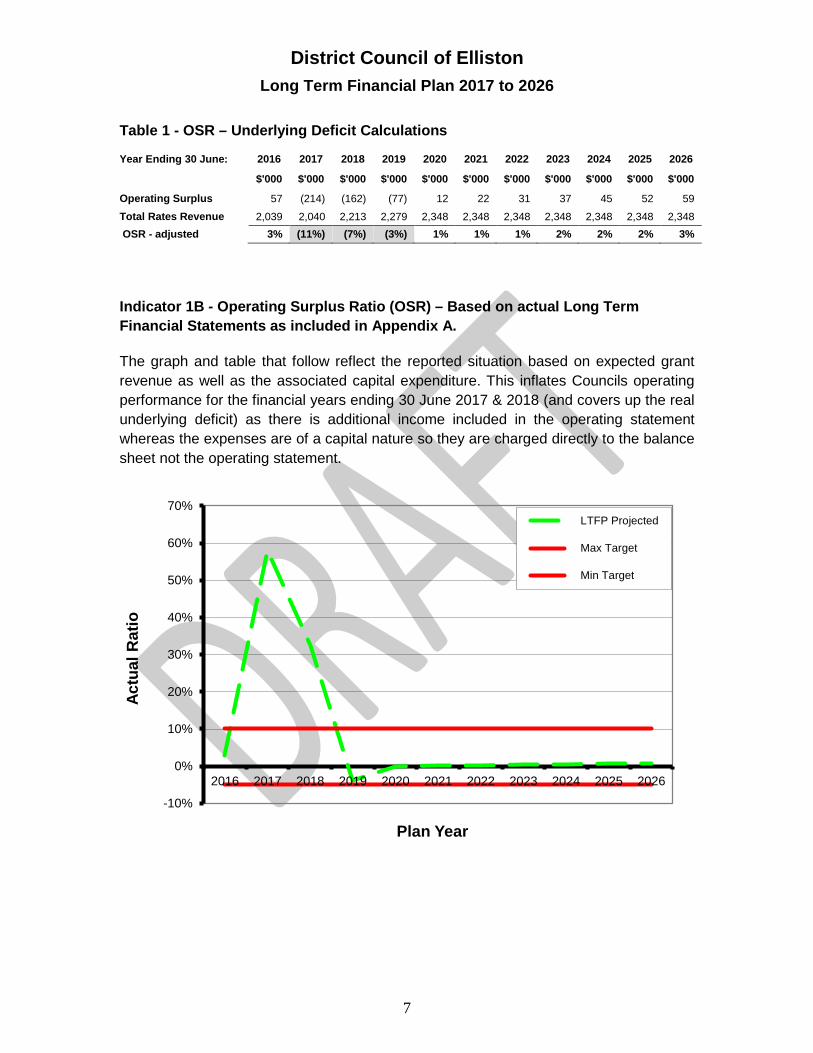
Table 1 - OSR – Underlying Deficit Calculations
Year Ending 30 June: 2016 2017 2018 2019 2020 2021 2022 2023 2024 2025 2026
$'000 $'000 $'000 $'000 $'000 $'000 $'000 $'000 $'000 $'000 $'000
Operating Surplus 57 (214) (162) (77) 12 22 31 37 45 52 59 Total Rates Revenue 2,039 2,040 2,213 2,279 2,348 2,348 2,348 2,348 2,348 2,348 2,348 OSR - adjusted 3% (11%) (7%) (3%) 1% 1% 1% 2% 2% 2% 3%
Indicator 1B - Operating Surplus Ratio (OSR) – Based on actual Long Term Financial Statements as included in Appendix A.
The graph and table that follow reflect the reported situation based on expected grant revenue as well as the associated capital expenditure. This inflates Councils operating performance for the financial years ending 30 June 2017 & 2018 (and covers up the real underlying deficit) as there is additional income included in the operating statement whereas the expenses are of a capital nature so they are charged directly to the balance sheet not the operating statement.
-10%
0%
10%
20%
30%
40%
50%
60%
70%
2016 2017 2018 2019 2020 2021 2022 2023 2024 2025 2026
Actu
al R
atio
Plan Year
LTFP Projected
Max Target
Min Target
District Council of Elliston Long Term Financial Plan 2017 to 2026
8
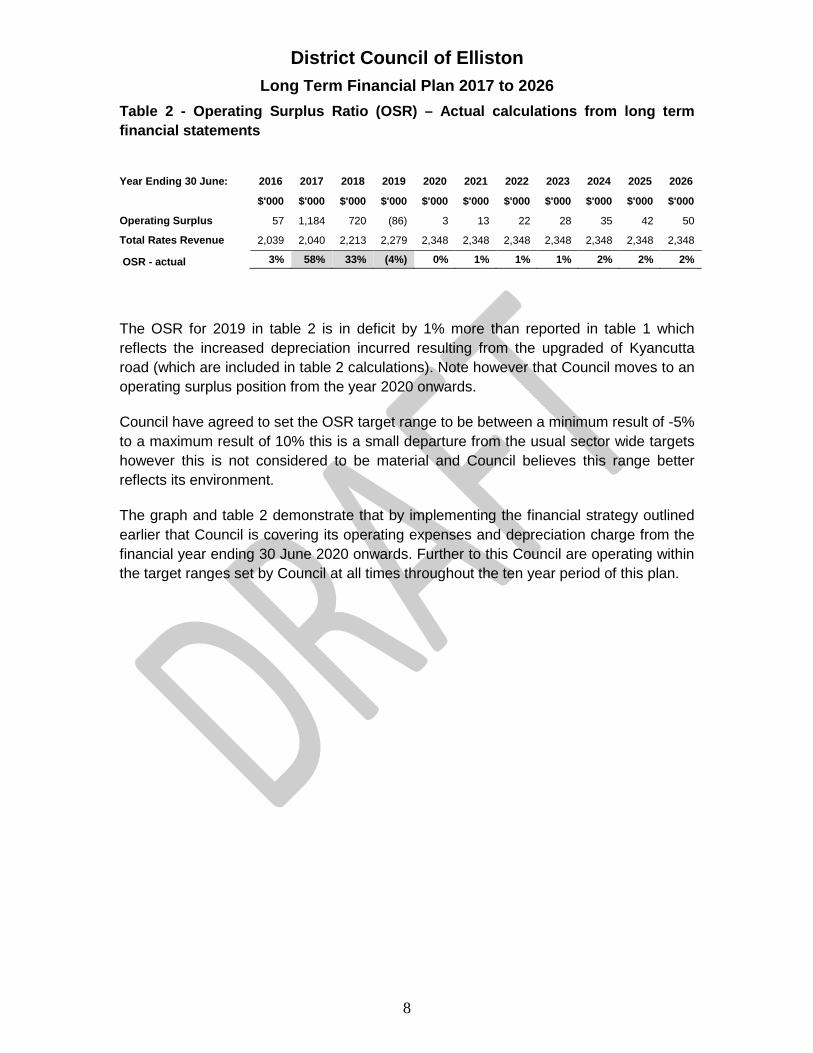
Table 2 - Operating Surplus Ratio (OSR) – Actual calculations from long term financial statements
The OSR for 2019 in table 2 is in deficit by 1% more than reported in table 1 which reflects the increased depreciation incurred resulting from the upgraded of Kyancutta road (which are included in table 2 calculations). Note however that Council moves to an operating surplus position from the year 2020 onwards.
Council have agreed to set the OSR target range to be between a minimum result of -5% to a maximum result of 10% this is a small departure from the usual sector wide targets however this is not considered to be material and Council believes this range better reflects its environment.
The graph and table 2 demonstrate that by implementing the financial strategy outlined earlier that Council is covering its operating expenses and depreciation charge from the financial year ending 30 June 2020 onwards. Further to this Council are operating within the target ranges set by Council at all times throughout the ten year period of this plan.
Year Ending 30 June: 2016 2017 2018 2019 2020 2021 2022 2023 2024 2025 2026
$'000 $'000 $'000 $'000 $'000 $'000 $'000 $'000 $'000 $'000 $'000
Operating Surplus 57 1,184 720 (86) 3 13 22 28 35 42 50
Total Rates Revenue 2,039 2,040 2,213 2,279 2,348 2,348 2,348 2,348 2,348 2,348 2,348
OSR - actual 3% 58% 33% (4%) 0% 1% 1% 1% 2% 2% 2%
District Council of Elliston Long Term Financial Plan 2017 to 2026
9
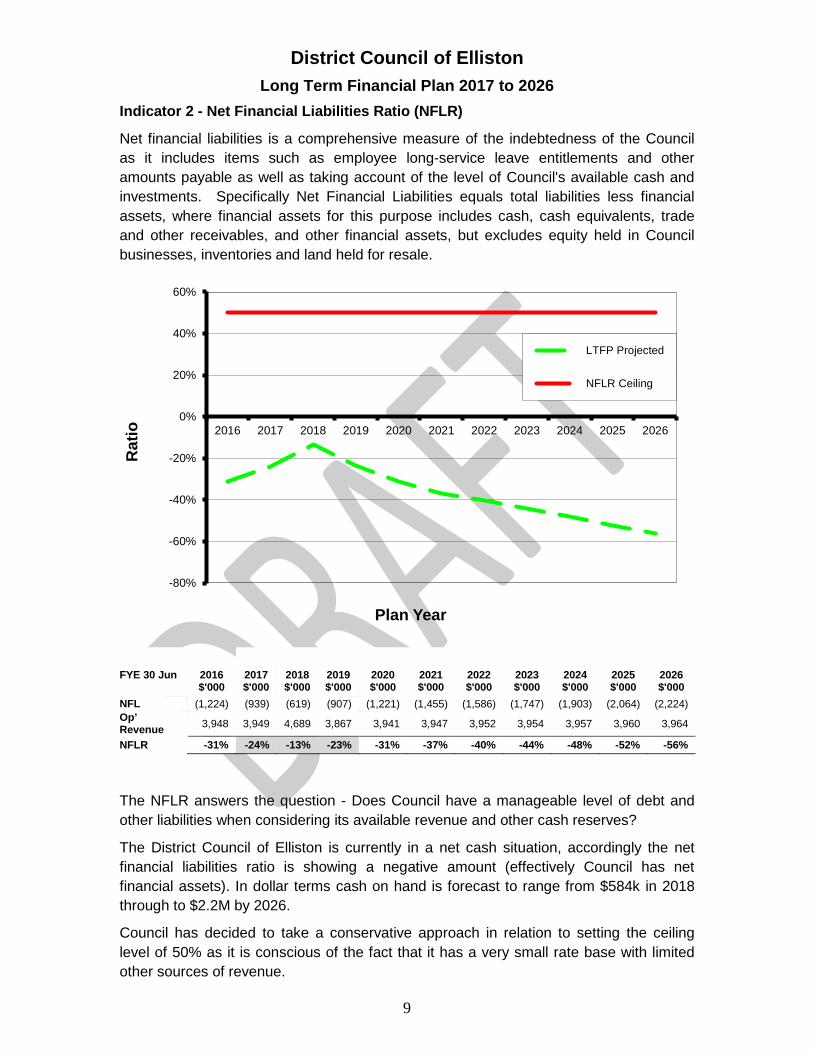
Indicator 2 - Net Financial Liabilities Ratio (NFLR)
Net financial liabilities is a comprehensive measure of the indebtedness of the Council as it includes items such as employee long-service leave entitlements and other amounts payable as well as taking account of the level of Council's available cash and investments. Specifically Net Financial Liabilities equals total liabilities less financial assets, where financial assets for this purpose includes cash, cash equivalents, trade and other receivables, and other financial assets, but excludes equity held in Council businesses, inventories and land held for resale.
The NFLR answers the question - Does Council have a manageable level of debt and other liabilities when considering its available revenue and other cash reserves?
The District Council of Elliston is currently in a net cash situation, accordingly the net financial liabilities ratio is showing a negative amount (effectively Council has net financial assets). In dollar terms cash on hand is forecast to range from $584k in 2018 through to $2.2M by 2026.
Council has decided to take a conservative approach in relation to setting the ceiling level of 50% as it is conscious of the fact that it has a very small rate base with limited other sources of revenue.
-80%
-60%
-40%
-20%
0%
20%
40%
60%
2016 2017 2018 2019 2020 2021 2022 2023 2024 2025 2026
Rat
io
Plan Year
LTFP Projected
NFLR Ceiling
FYE 30 Jun 2016 2017 2018 2019 2020 2021 2022 2023 2024 2025 2026 $'000 $'000 $'000 $'000 $'000 $'000 $'000 $'000 $'000 $'000 $'000 NFL (1,224) (939) (619) (907) (1,221) (1,455) (1,586) (1,747) (1,903) (2,064) (2,224) Op’ Revenue 3,948 3,949 4,689 3,867 3,941 3,947 3,952 3,954 3,957 3,960 3,964
NFLR -31% -24% -13% -23% -31% -37% -40% -44% -48% -52% -56%
District Council of Elliston Long Term Financial Plan 2017 to 2026
10
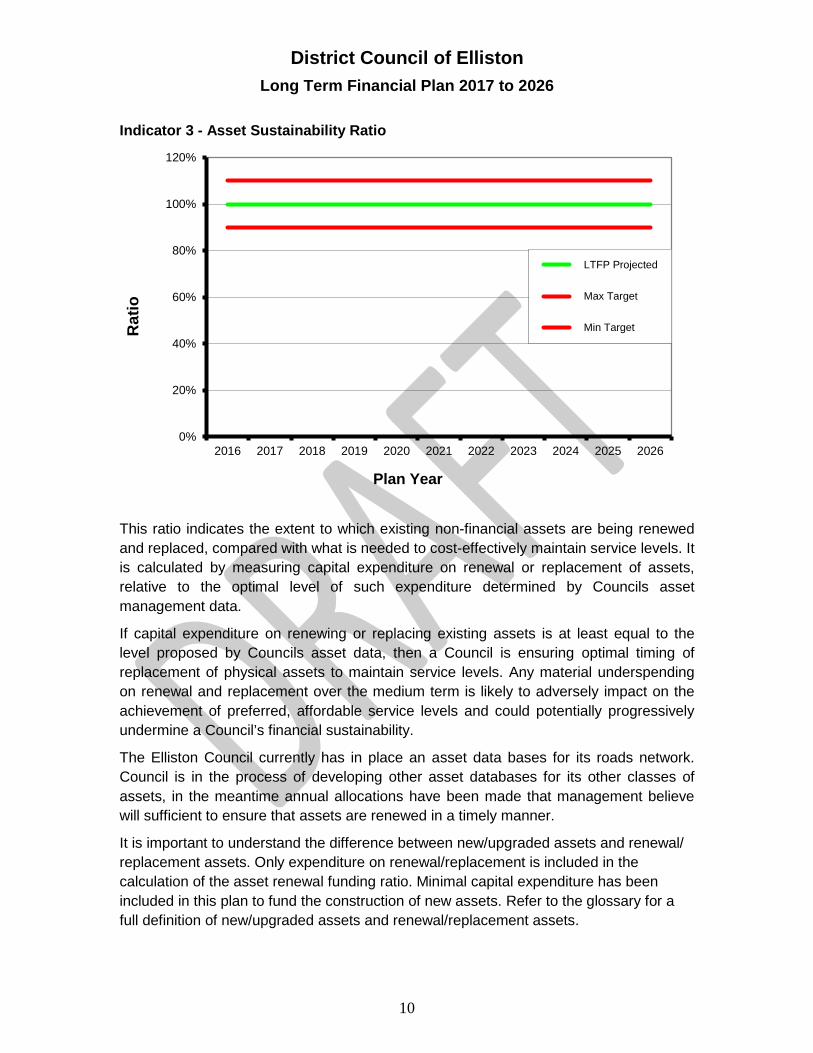
Indicator 3 - Asset Sustainability Ratio
This ratio indicates the extent to which existing non-financial assets are being renewed and replaced, compared with what is needed to cost-effectively maintain service levels. It is calculated by measuring capital expenditure on renewal or replacement of assets, relative to the optimal level of such expenditure determined by Councils asset management data.
If capital expenditure on renewing or replacing existing assets is at least equal to the level proposed by Councils asset data, then a Council is ensuring optimal timing of replacement of physical assets to maintain service levels. Any material underspending on renewal and replacement over the medium term is likely to adversely impact on the achievement of preferred, affordable service levels and could potentially progressively undermine a Council’s financial sustainability.
The Elliston Council currently has in place an asset data bases for its roads network. Council is in the process of developing other asset databases for its other classes of assets, in the meantime annual allocations have been made that management believe will sufficient to ensure that assets are renewed in a timely manner.
It is important to understand the difference between new/upgraded assets and renewal/ replacement assets. Only expenditure on renewal/replacement is included in the calculation of the asset renewal funding ratio. Minimal capital expenditure has been included in this plan to fund the construction of new assets. Refer to the glossary for a full definition of new/upgraded assets and renewal/replacement assets.
0%
20%
40%
60%
80%
100%
120%
2016 2017 2018 2019 2020 2021 2022 2023 2024 2025 2026
Rat
io
Plan Year
LTFP Projected
Max Target
Min Target
District Council of Elliston Long Term Financial Plan 2017 to 2026
11
Summary of Council’s Long-term Sustainability based on LTFP forecasts
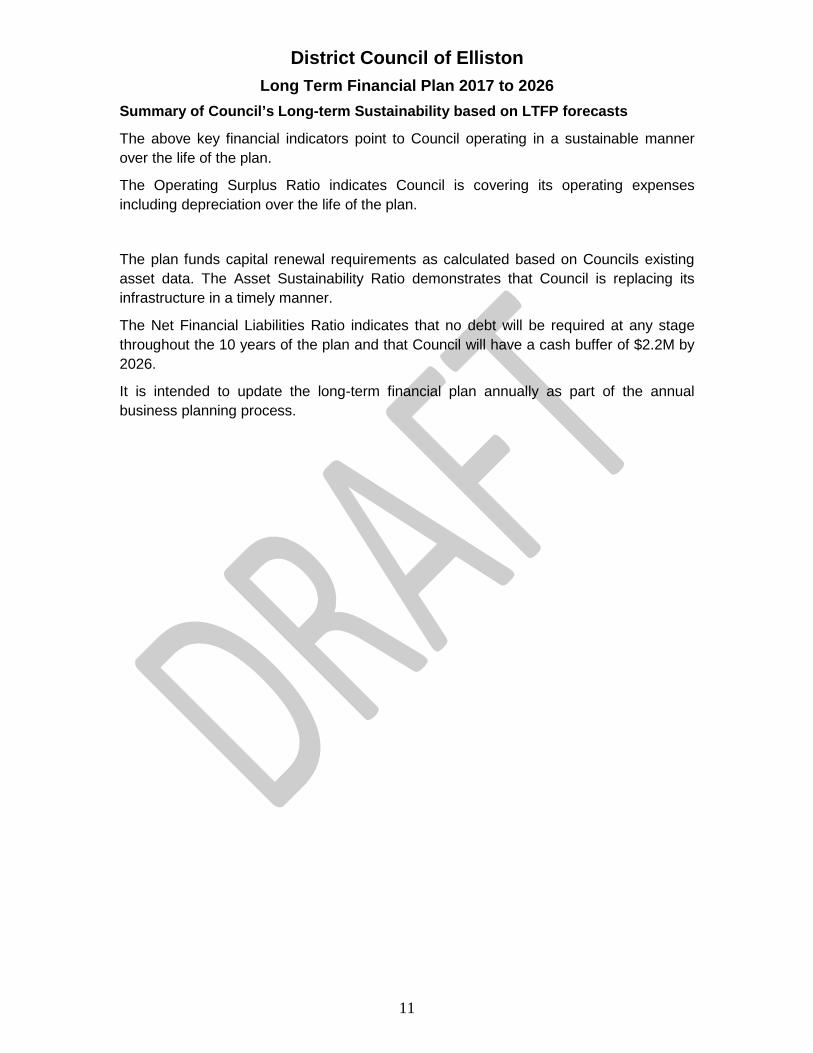
The above key financial indicators point to Council operating in a sustainable manner over the life of the plan.
The Operating Surplus Ratio indicates Council is covering its operating expenses including depreciation over the life of the plan.
The plan funds capital renewal requirements as calculated based on Councils existing asset data. The Asset Sustainability Ratio demonstrates that Council is replacing its infrastructure in a timely manner.
The Net Financial Liabilities Ratio indicates that no debt will be required at any stage throughout the 10 years of the plan and that Council will have a cash buffer of $2.2M by 2026.
It is intended to update the long-term financial plan annually as part of the annual business planning process.
District Council of Elliston Long Term Financial Plan 2017 to 2026
12
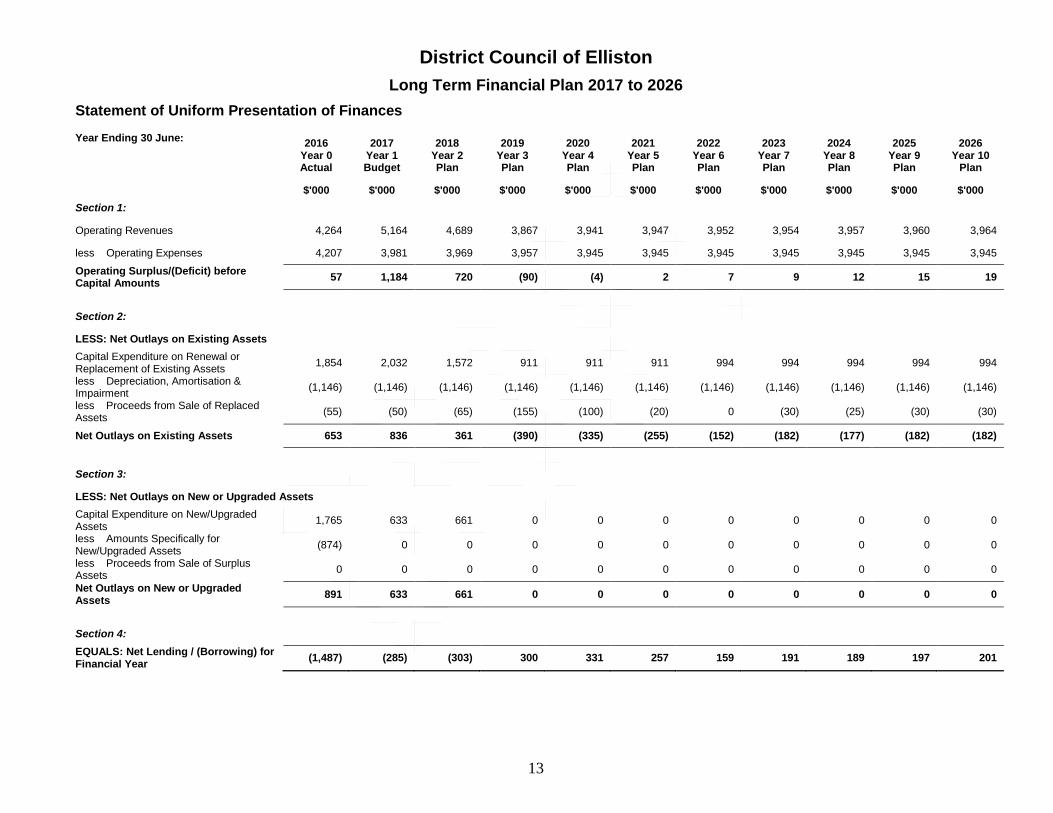
6. Statement of Uniform Presentation of Finances The Statement of Uniform Presentation of Finances together with the results of the Key Financial Indicators provides a summarised report that focuses on Council’s finances at a strategic level.
Readers are strongly encouraged to take the time to comprehend how this report is structured and what the implications of the various lines of this report are for the Key Financial Indicator calculations.
The Statement of Uniform Presentation of Finances highlights the operating surplus / (deficit) measure which is considered the most critical indicator of a Council's financial performance.
The last line or rather the result of this report is the movement in Net Financial Liabilities (Net Lending / Borrowing) for the year based on Council’s planned capital and operating budgets for that year.
Achieving a zero result on the net lending / (borrowing) measure in any one year essentially means that the Council has met all of its expenditure (both operating and capital) from the current year's income (with income including amounts received specifically for new / upgraded assets).
New / Upgraded vs Renewal / Replacement of Assets A clear understanding of the difference between expenditure incurred to renew or replace existing assets and expenditure incurred to create new or upgraded assets is essential in order to understand the strategic relevance of the Statement of Uniform Presentation of Finances.
A new asset is additional to Council’s previous asset complement.
E.g. Roads constructed as part of a Council owned subdivision are new assets. Similarly laying footpaths in areas where they did not previously exist are also new assets.
An upgraded asset replaces a previously existing asset with enhanced capability or functionality.
Renewal or replacement of an asset occurs where a previously existing asset is replaced without enhancement of the service capability except where this is incidental and unavoidable.
It is possible for capital expenditure to be a combination of renewal as well as upgrade. This is particularly prevalent in this Council region due to the increased volume of B-double traffic experienced in recent times. This has required existing roads to be rebuilt to higher standards.
E.g. the replacement of a road that was initially was a 6 metre wide sheeted surface with an 8 metre width sheeted surface can be considered part replacement and part upgrade.
The important point to understand is that if Council is not able to replace its existing assets in a timely manner then new assets should not be built unless less essential. By building new assets Council is effectively building new liabilities as the assets usually don’t generate revenue (e.g. roads) cannot be sold and will need to be maintained and eventually replaced.
District Council of Elliston Long Term Financial Plan 2017 to 2026
13
Statement of Uniform Presentation of Finances Year Ending 30 June: 2016 2017 2018 2019 2020 2021 2022 2023 2024 2025 2026 Year 0
Actual Year 1 Budget
Year 2 Plan
Year 3 Plan
Year 4 Plan
Year 5 Plan
Year 6 Plan
Year 7 Plan
Year 8 Plan
Year 9 Plan
Year 10 Plan
$'000 $'000 $'000 $'000 $'000 $'000 $'000 $'000 $'000 $'000 $'000 Section 1: Operating Revenues 4,264 5,164 4,689 3,867 3,941 3,947 3,952 3,954 3,957 3,960 3,964
less Operating Expenses 4,207 3,981 3,969 3,957 3,945 3,945 3,945 3,945 3,945 3,945 3,945 Operating Surplus/(Deficit) before Capital Amounts 57 1,184 720 (90) (4) 2 7 9 12 15 19
Section 2:
LESS: Net Outlays on Existing Assets Capital Expenditure on Renewal or Replacement of Existing Assets 1,854 2,032 1,572 911 911 911 994 994 994 994 994
less Depreciation, Amortisation & Impairment (1,146) (1,146) (1,146) (1,146) (1,146) (1,146) (1,146) (1,146) (1,146) (1,146) (1,146)
less Proceeds from Sale of Replaced Assets (55) (50) (65) (155) (100) (20) 0 (30) (25) (30) (30)
Net Outlays on Existing Assets 653 836 361 (390) (335) (255) (152) (182) (177) (182) (182)
Section 3:
LESS: Net Outlays on New or Upgraded Assets Capital Expenditure on New/Upgraded Assets 1,765 633 661 0 0 0 0 0 0 0 0
less Amounts Specifically for New/Upgraded Assets (874) 0 0 0 0 0 0 0 0 0 0
less Proceeds from Sale of Surplus Assets 0 0 0 0 0 0 0 0 0 0 0
Net Outlays on New or Upgraded Assets 891 633 661 0 0 0 0 0 0 0 0
Section 4: EQUALS: Net Lending / (Borrowing) for Financial Year (1,487) (285) (303) 300 331 257 159 191 189 197 201
District Council of Elliston Long Term Financial Plan 2017 to 2026
14
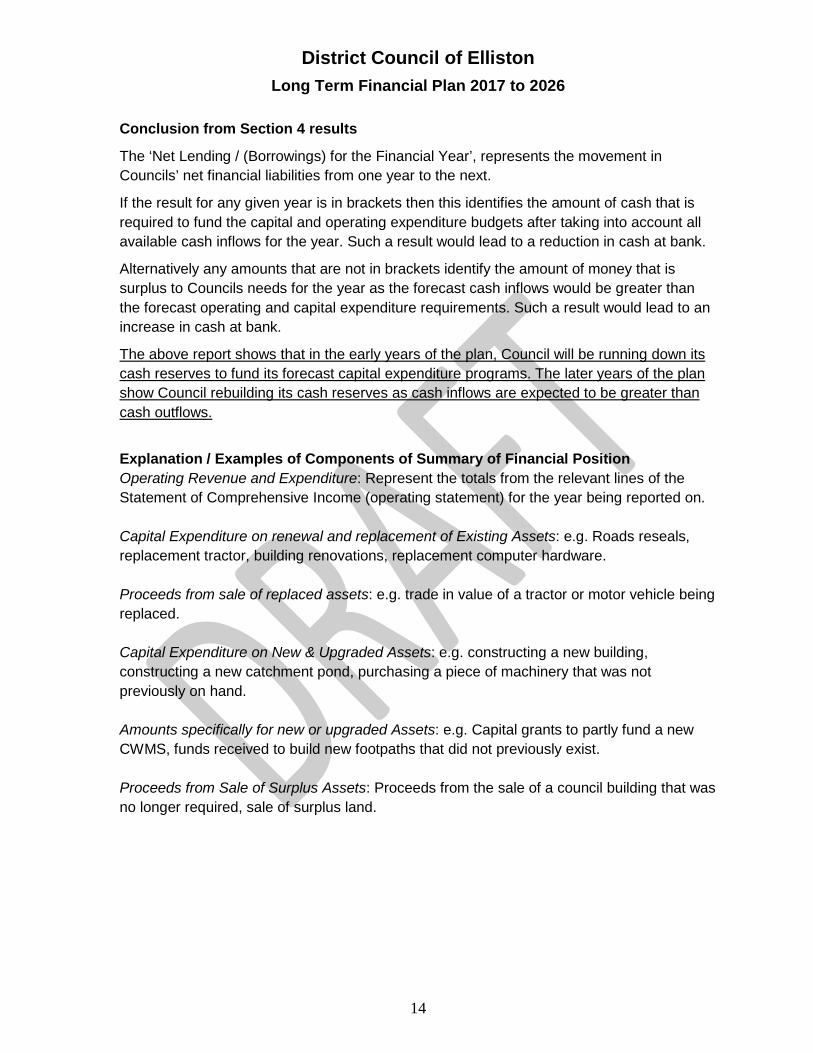
Conclusion from Section 4 results
The ‘Net Lending / (Borrowings) for the Financial Year’, represents the movement in Councils’ net financial liabilities from one year to the next.
If the result for any given year is in brackets then this identifies the amount of cash that is required to fund the capital and operating expenditure budgets after taking into account all available cash inflows for the year. Such a result would lead to a reduction in cash at bank.
Alternatively any amounts that are not in brackets identify the amount of money that is surplus to Councils needs for the year as the forecast cash inflows would be greater than the forecast operating and capital expenditure requirements. Such a result would lead to an increase in cash at bank.
The above report shows that in the early years of the plan, Council will be running down its cash reserves to fund its forecast capital expenditure programs. The later years of the plan show Council rebuilding its cash reserves as cash inflows are expected to be greater than cash outflows.
Explanation / Examples of Components of Summary of Financial Position Operating Revenue and Expenditure: Represent the totals from the relevant lines of the Statement of Comprehensive Income (operating statement) for the year being reported on. Capital Expenditure on renewal and replacement of Existing Assets: e.g. Roads reseals, replacement tractor, building renovations, replacement computer hardware. Proceeds from sale of replaced assets: e.g. trade in value of a tractor or motor vehicle being replaced. Capital Expenditure on New & Upgraded Assets: e.g. constructing a new building, constructing a new catchment pond, purchasing a piece of machinery that was not previously on hand. Amounts specifically for new or upgraded Assets: e.g. Capital grants to partly fund a new CWMS, funds received to build new footpaths that did not previously exist. Proceeds from Sale of Surplus Assets: Proceeds from the sale of a council building that was no longer required, sale of surplus land.
District Council of Elliston Long Term Financial Plan 2017 to 2026
15
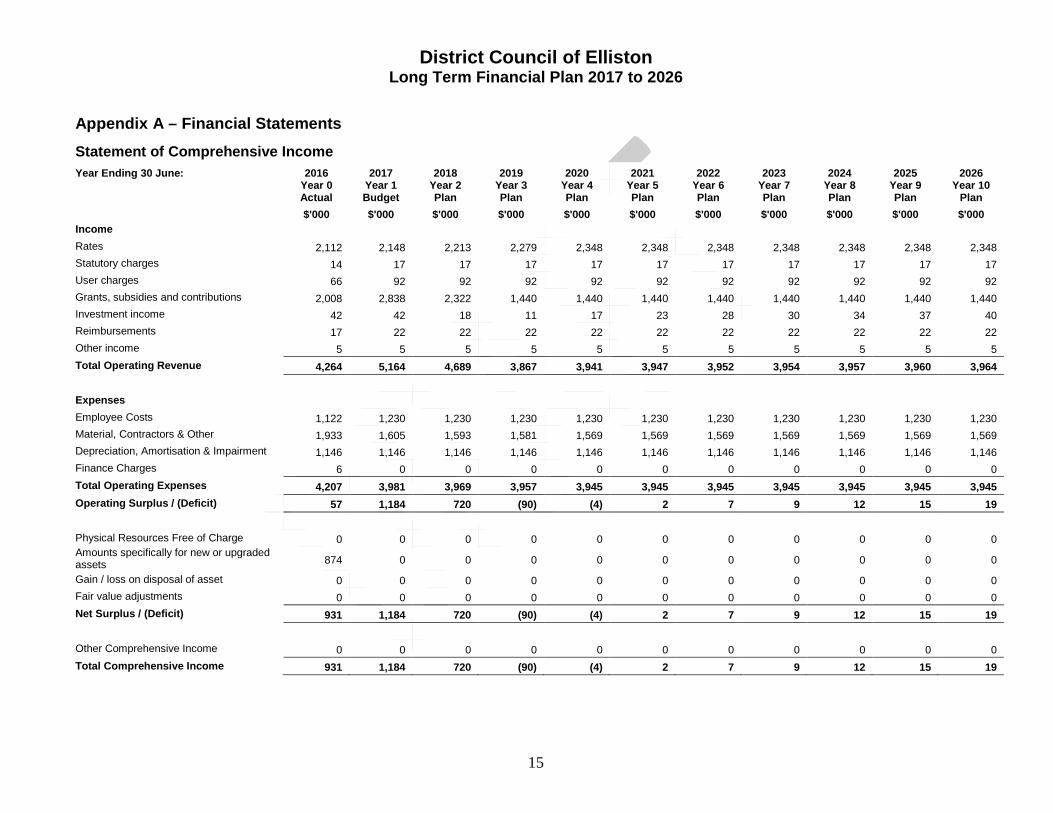
Appendix A – Financial Statements Statement of Comprehensive Income Year Ending 30 June: 2016 2017 2018 2019 2020 2021 2022 2023 2024 2025 2026
Year 0 Actual
Year 1 Budget
Year 2 Plan
Year 3 Plan
Year 4 Plan
Year 5 Plan
Year 6 Plan
Year 7 Plan
Year 8 Plan
Year 9 Plan
Year 10 Plan
$'000 $'000 $'000 $'000 $'000 $'000 $'000 $'000 $'000 $'000 $'000 Income Rates 2,112 2,148 2,213 2,279 2,348 2,348 2,348 2,348 2,348 2,348 2,348 Statutory charges 14 17 17 17 17 17 17 17 17 17 17 User charges 66 92 92 92 92 92 92 92 92 92 92 Grants, subsidies and contributions 2,008 2,838 2,322 1,440 1,440 1,440 1,440 1,440 1,440 1,440 1,440 Investment income 42 42 18 11 17 23 28 30 34 37 40 Reimbursements 17 22 22 22 22 22 22 22 22 22 22 Other income 5 5 5 5 5 5 5 5 5 5 5 Total Operating Revenue 4,264 5,164 4,689 3,867 3,941 3,947 3,952 3,954 3,957 3,960 3,964 Expenses Employee Costs 1,122 1,230 1,230 1,230 1,230 1,230 1,230 1,230 1,230 1,230 1,230 Material, Contractors & Other 1,933 1,605 1,593 1,581 1,569 1,569 1,569 1,569 1,569 1,569 1,569 Depreciation, Amortisation & Impairment 1,146 1,146 1,146 1,146 1,146 1,146 1,146 1,146 1,146 1,146 1,146 Finance Charges 6 0 0 0 0 0 0 0 0 0 0 Total Operating Expenses 4,207 3,981 3,969 3,957 3,945 3,945 3,945 3,945 3,945 3,945 3,945 Operating Surplus / (Deficit) 57 1,184 720 (90) (4) 2 7 9 12 15 19 Physical Resources Free of Charge 0 0 0 0 0 0 0 0 0 0 0 Amounts specifically for new or upgraded assets 874 0 0 0 0 0 0 0 0 0 0
Gain / loss on disposal of asset 0 0 0 0 0 0 0 0 0 0 0 Fair value adjustments 0 0 0 0 0 0 0 0 0 0 0 Net Surplus / (Deficit) 931 1,184 720 (90) (4) 2 7 9 12 15 19 Other Comprehensive Income 0 0 0 0 0 0 0 0 0 0 0 Total Comprehensive Income 931 1,184 720 (90) (4) 2 7 9 12 15 19
District Council of Elliston Long Term Financial Plan 2017 to 2026
16
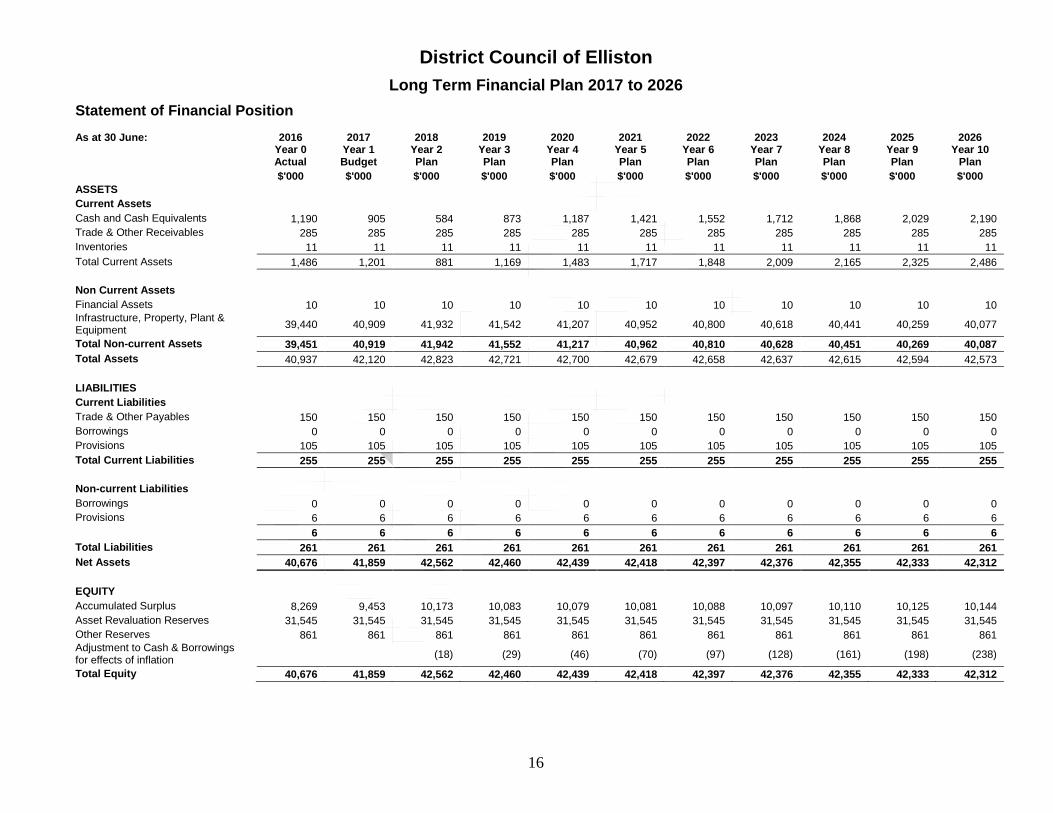
Statement of Financial Position As at 30 June: 2016 2017 2018 2019 2020 2021 2022 2023 2024 2025 2026
Year 0 Actual
Year 1 Budget
Year 2 Plan
Year 3 Plan
Year 4 Plan
Year 5 Plan
Year 6 Plan
Year 7 Plan
Year 8 Plan
Year 9 Plan
Year 10 Plan
$'000 $'000 $'000 $'000 $'000 $'000 $'000 $'000 $'000 $'000 $'000 ASSETS Current Assets Cash and Cash Equivalents 1,190 905 584 873 1,187 1,421 1,552 1,712 1,868 2,029 2,190 Trade & Other Receivables 285 285 285 285 285 285 285 285 285 285 285 Inventories 11 11 11 11 11 11 11 11 11 11 11 Total Current Assets 1,486 1,201 881 1,169 1,483 1,717 1,848 2,009 2,165 2,325 2,486 Non Current Assets Financial Assets 10 10 10 10 10 10 10 10 10 10 10 Infrastructure, Property, Plant & Equipment 39,440 40,909 41,932 41,542 41,207 40,952 40,800 40,618 40,441 40,259 40,077
Total Non-current Assets 39,451 40,919 41,942 41,552 41,217 40,962 40,810 40,628 40,451 40,269 40,087 Total Assets 40,937 42,120 42,823 42,721 42,700 42,679 42,658 42,637 42,615 42,594 42,573 LIABILITIES Current Liabilities Trade & Other Payables 150 150 150 150 150 150 150 150 150 150 150 Borrowings 0 0 0 0 0 0 0 0 0 0 0 Provisions 105 105 105 105 105 105 105 105 105 105 105 Total Current Liabilities 255 255 255 255 255 255 255 255 255 255 255 Non-current Liabilities Borrowings 0 0 0 0 0 0 0 0 0 0 0 Provisions 6 6 6 6 6 6 6 6 6 6 6 6 6 6 6 6 6 6 6 6 6 6 Total Liabilities 261 261 261 261 261 261 261 261 261 261 261 Net Assets 40,676 41,859 42,562 42,460 42,439 42,418 42,397 42,376 42,355 42,333 42,312 EQUITY Accumulated Surplus 8,269 9,453 10,173 10,083 10,079 10,081 10,088 10,097 10,110 10,125 10,144 Asset Revaluation Reserves 31,545 31,545 31,545 31,545 31,545 31,545 31,545 31,545 31,545 31,545 31,545 Other Reserves 861 861 861 861 861 861 861 861 861 861 861 Adjustment to Cash & Borrowings for effects of inflation (18) (29) (46) (70) (97) (128) (161) (198) (238)
Total Equity 40,676 41,859 42,562 42,460 42,439 42,418 42,397 42,376 42,355 42,333 42,312
District Council of Elliston Long Term Financial Plan 2017 to 2026
17
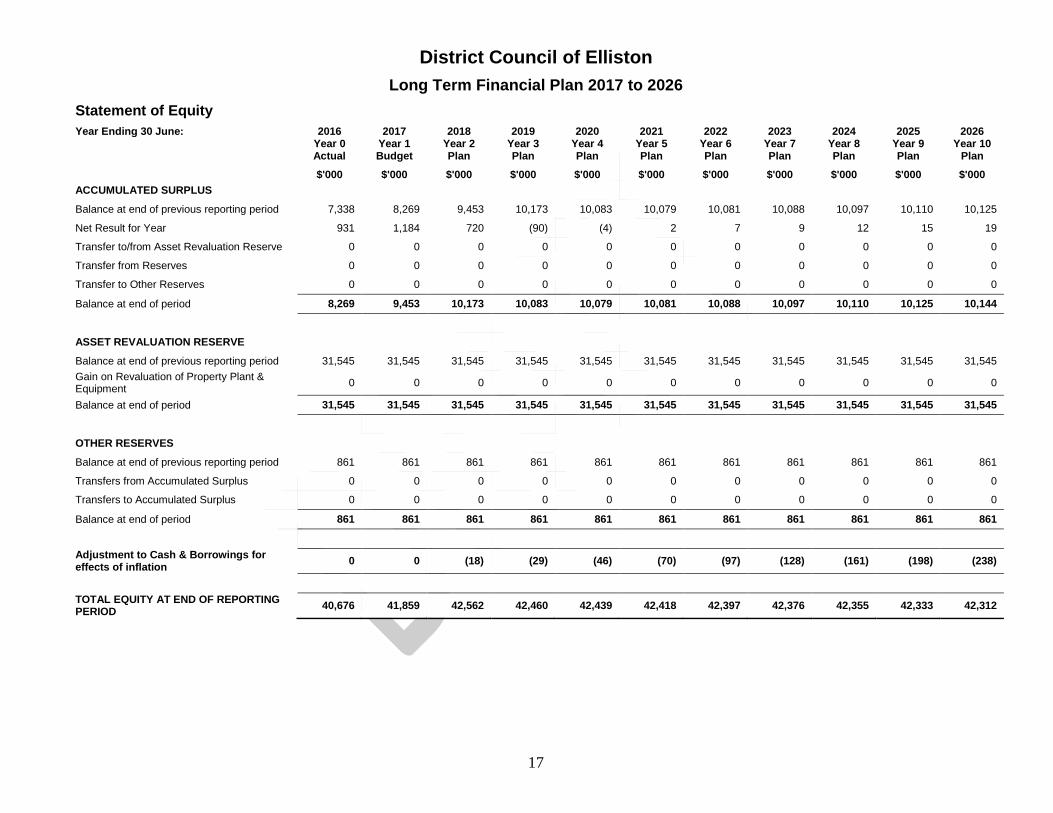
Statement of Equity Year Ending 30 June: 2016 2017 2018 2019 2020 2021 2022 2023 2024 2025 2026 Year 0
Actual Year 1 Budget
Year 2 Plan
Year 3 Plan
Year 4 Plan
Year 5 Plan
Year 6 Plan
Year 7 Plan
Year 8 Plan
Year 9 Plan
Year 10 Plan
$'000 $'000 $'000 $'000 $'000 $'000 $'000 $'000 $'000 $'000 $'000 ACCUMULATED SURPLUS Balance at end of previous reporting period 7,338 8,269 9,453 10,173 10,083 10,079 10,081 10,088 10,097 10,110 10,125
Net Result for Year 931 1,184 720 (90) (4) 2 7 9 12 15 19
Transfer to/from Asset Revaluation Reserve 0 0 0 0 0 0 0 0 0 0 0
Transfer from Reserves 0 0 0 0 0 0 0 0 0 0 0
Transfer to Other Reserves 0 0 0 0 0 0 0 0 0 0 0
Balance at end of period 8,269 9,453 10,173 10,083 10,079 10,081 10,088 10,097 10,110 10,125 10,144
ASSET REVALUATION RESERVE
Balance at end of previous reporting period 31,545 31,545 31,545 31,545 31,545 31,545 31,545 31,545 31,545 31,545 31,545 Gain on Revaluation of Property Plant & Equipment 0 0 0 0 0 0 0 0 0 0 0
Balance at end of period 31,545 31,545 31,545 31,545 31,545 31,545 31,545 31,545 31,545 31,545 31,545
OTHER RESERVES
Balance at end of previous reporting period 861 861 861 861 861 861 861 861 861 861 861
Transfers from Accumulated Surplus 0 0 0 0 0 0 0 0 0 0 0
Transfers to Accumulated Surplus 0 0 0 0 0 0 0 0 0 0 0
Balance at end of period 861 861 861 861 861 861 861 861 861 861 861
Adjustment to Cash & Borrowings for effects of inflation 0 0 (18) (29) (46) (70) (97) (128) (161) (198) (238)
TOTAL EQUITY AT END OF REPORTING PERIOD 40,676 41,859 42,562 42,460 42,439 42,418 42,397 42,376 42,355 42,333 42,312
District Council of Elliston Long Term Financial Plan 2017 to 2026
18
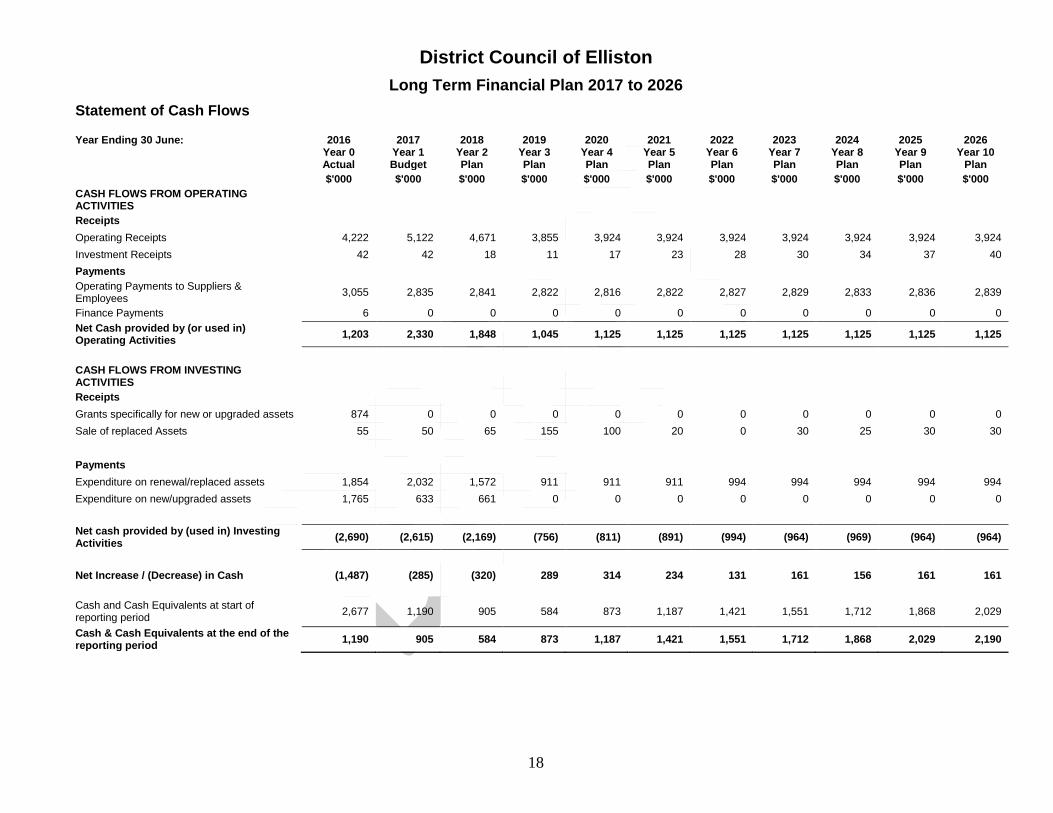
Statement of Cash Flows
Year Ending 30 June: 2016 2017 2018 2019 2020 2021 2022 2023 2024 2025 2026 Year 0
Actual Year 1 Budget
Year 2 Plan
Year 3 Plan
Year 4 Plan
Year 5 Plan
Year 6 Plan
Year 7 Plan
Year 8 Plan
Year 9 Plan
Year 10 Plan
$'000 $'000 $'000 $'000 $'000 $'000 $'000 $'000 $'000 $'000 $'000 CASH FLOWS FROM OPERATING ACTIVITIES
Receipts Operating Receipts 4,222 5,122 4,671 3,855 3,924 3,924 3,924 3,924 3,924 3,924 3,924 Investment Receipts 42 42 18 11 17 23 28 30 34 37 40 Payments Operating Payments to Suppliers & Employees 3,055 2,835 2,841 2,822 2,816 2,822 2,827 2,829 2,833 2,836 2,839
Finance Payments 6 0 0 0 0 0 0 0 0 0 0 Net Cash provided by (or used in) Operating Activities 1,203 2,330 1,848 1,045 1,125 1,125 1,125 1,125 1,125 1,125 1,125
CASH FLOWS FROM INVESTING ACTIVITIES
Receipts Grants specifically for new or upgraded assets 874 0 0 0 0 0 0 0 0 0 0 Sale of replaced Assets 55 50 65 155 100 20 0 30 25 30 30 Payments Expenditure on renewal/replaced assets 1,854 2,032 1,572 911 911 911 994 994 994 994 994 Expenditure on new/upgraded assets 1,765 633 661 0 0 0 0 0 0 0 0 Net cash provided by (used in) Investing Activities (2,690) (2,615) (2,169) (756) (811) (891) (994) (964) (969) (964) (964)
Net Increase / (Decrease) in Cash (1,487) (285) (320) 289 314 234 131 161 156 161 161 Cash and Cash Equivalents at start of reporting period 2,677 1,190 905 584 873 1,187 1,421 1,551 1,712 1,868 2,029
Cash & Cash Equivalents at the end of the reporting period 1,190 905 584 873 1,187 1,421 1,551 1,712 1,868 2,029 2,190
District Council of Elliston Long Term Financial Plan 2017 to 2026
19
Reference Material IPWEA Practice Note 6 – Long-term Financial Planning. LGA Information Paper 9 – Local Government Financial Indicators LGA Information Paper 12 – Targets for Local Government Financial Indicators South Australian Local Government Model Financial Statements (see http://www.lga.sa.gov.au/site/page.cfm?u=769#e4291 ).


