Long-term observations of cloud condensation nuclei in the Amazonrain forest – Part 1: Aerosol size distribution, hygroscopicity, andnew model parametrizations for CCN predictionMira L. Pöhlker1, Christopher Pöhlker1, Florian Ditas1, Thomas Klimach1, Isabella Hrabe de Angelis1,Alessandro Araújo2, Joel Brito3,a, Samara Carbone3,b, Yafang Cheng1, Xuguang Chi1,c, Reiner Ditz1,Sachin S. Gunthe4, Jürgen Kesselmeier1, Tobias Könemann1, Jošt V. Lavric5, Scot T. Martin6, Eugene Mikhailov7,Daniel Moran-Zuloaga1, Diana Rose8, Jorge Saturno1, Hang Su1, Ryan Thalman9,d, David Walter1, Jian Wang9,Stefan Wolff1,10, Henrique M. J. Barbosa3, Paulo Artaxo3, Meinrat O. Andreae1,11, and Ulrich Pöschl11Multiphase Chemistry and Biogeochemistry Departments, Max Planck Institute for Chemistry, 55020 Mainz, Germany2Empresa Brasileira de Pesquisa Agropecuária (EMBRAPA), Trav. Dr. Enéas Pinheiro, Belém, PA, 66095-100, Brazil3Institute of Physics, University of São Paulo, São Paulo, 05508-900, Brazil4EWRE Division, Department of Civil Engineering, Indian Institute of Technology Madras, Chennai 600036, India5Department of Biogeochemical Systems, Max Planck Institute for Biogeochemistry, 07701 Jena, Germany6School of Engineering and Applied Sciences, Harvard University, Cambridge, MA 02138, USA7St. Petersburg State University, 7/9 Universitetskaya nab, St. Petersburg, 199034, Russia8Institute for Atmospheric and Environmental Research, Goethe University Frankfurt am Main, 60438 Frankfurt, Germany9Biological, Environmental & Climate Sciences Department, Brookhaven National Laboratory, Upton, NY 11973, USA10Instituto Nacional de Pesquisas da Amazonia (INPA), Manaus, 69083-000, Brazil11Scripps Institution of Oceanography, University of California San Diego, La Jolla, CA 92037, USAanow at: Laboratory for Meteorological Physics, University Blaise Pascal, Clermont-Ferrand, Francebnow at: Federal University of Uberlândia, Uberlândia-MG, 38408-100, Brazilcnow at: Institute for Climate and Global Change Research & School of Atmospheric Sciences, Nanjing University,Nanjing, 210093, Chinadnow at: Department of Chemistry, Snow College, Richfield, UT 84701, USA
Received: 16 June 2016 – Published in Atmos. Chem. Phys. Discuss.: 23 June 2016Revised: 18 October 2016 – Accepted: 7 November 2016 – Published: 20 December 2016
Abstract. Size-resolved long-term measurements of atmo-spheric aerosol and cloud condensation nuclei (CCN) con-centrations and hygroscopicity were conducted at the re-mote Amazon Tall Tower Observatory (ATTO) in the cen-tral Amazon Basin over a 1-year period and full seasonalcycle (March 2014–February 2015). The measurements pro-vide a climatology of CCN properties characteristic of a re-mote central Amazonian rain forest site.
The CCN measurements were continuously cycledthrough 10 levels of supersaturation (S = 0.11 to 1.10 %)and span the aerosol particle size range from 20 to 245 nm.The mean critical diameters of CCN activation range from
43 nm at S= 1.10 % to 172 nm at S= 0.11 %. The particlehygroscopicity exhibits a pronounced size dependence withlower values for the Aitken mode (κAit= 0.14± 0.03), highervalues for the accumulation mode (κAcc= 0.22± 0.05), andan overall mean value of κmean= 0.17± 0.06, consistent withhigh fractions of organic aerosol.
The hygroscopicity parameter, κ , exhibits remarkably lit-tle temporal variability: no pronounced diurnal cycles, onlyweak seasonal trends, and few short-term variations duringlong-range transport events. In contrast, the CCN numberconcentrations exhibit a pronounced seasonal cycle, trackingthe pollution-related seasonality in total aerosol concentra-
Published by Copernicus Publications on behalf of the European Geosciences Union.
15710 M. L. Pöhlker et al.: Long-term observations of cloud condensation nuclei in the Amazon rain forest – Part 1
tion. We find that the variability in the CCN concentrationsin the central Amazon is mostly driven by aerosol particlenumber concentration and size distribution, while variationsin aerosol hygroscopicity and chemical composition matteronly during a few episodes.
For modeling purposes, we compare different approachesof predicting CCN number concentration and present a novelparametrization, which allows accurate CCN predictionsbased on a small set of input data.
1 Introduction
1.1 Atmospheric aerosols and clouds
In our current understanding of the Earth’s climate systemand its man-made perturbation, the multiscale and feedback-rich life cycles of clouds represent one of the largest uncer-tainties (Boucher et al., 2013; Stevens et al., 2016). Accord-ingly, the adequate and robust representation of cloud prop-erties is an Achilles’ heel in climate modeling efforts (Bonyet al., 2015). Atmospheric aerosols are a key ingredient inthe life cycle of clouds (known as aerosol indirect effect) asthey affect their formation, development, and properties byacting as cloud condensation nuclei (CCN) and ice nuclei(IN) (Lohmann and Feichter, 2005; Rosenfeld et al., 2008).Aerosol particles can originate from various natural and an-thropogenic sources and span wide ranges of concentration,particle size, composition, as well as chemical and phys-ical properties (Pöschl, 2005). Their activation into clouddroplets depends on their size, composition, and mixing stateas well as the water vapor supersaturation (e.g., Köhler, 1936;Dusek et al., 2006; McFiggans et al., 2006; Andreae andRosenfeld, 2008; Su et al., 2010). The microphysical linkbetween clouds and aerosol has been the subject of mani-fold and long-term research efforts. On one hand, the cyclingof CCN as well as their relationship to the aerosol populationhas been studied in a variety of field experiments worldwide(e.g., Gunthe et al., 2009; Rose et al., 2010; Jurányi et al.,2011; Paramonov et al., 2015). On the other hand, the knowl-edge obtained from the growing body of field data has beentranslated into different parametrization strategies that repre-sent the cloud–aerosol microphysical processes in modelingstudies (e.g., Nenes and Seinfeld, 2003; Petters and Kreiden-weis, 2007; Su et al., 2010; Deng et al., 2013; Mikhailov etal., 2013).
1.2 Amazon rain forest and its hydrological cycle
The Amazon rain forest is a unique and important ecosys-tem for various reasons such as its high density and diversityof life, its role as major carbon storage, and its large recy-cling rate of energy and water in the Earth’s hydrological cy-cle (Brienen et al., 2015; Gloor et al., 2015; Olivares et al.,2015; Yáñez-Serrano et al., 2015). In times of global change,
the man-made disturbance and pressure on this ecosystemhave strongly increased and have started a transition of theAmazon into an uncharted future (Davidson et al., 2012;Lawrence and Vandecar, 2015). In the context of atmosphericcomposition, the Amazon is unique since it represents oneof the last terrestrial locations worldwide that allows – atleast for part of the year – to investigate an relatively undis-turbed state of the atmosphere in the absence of major an-thropogenic pollution (Roberts et al., 2001; Andreae, 2007;Andreae et al., 2012; Hamilton et al., 2014).
Overall, the troposphere over the Amazon is defined bythe alternation of a relatively clean wet season and a polluteddry season, as outlined in more detail in previous studies(e.g., Martin et al., 2010b; Andreae et al., 2012, 2015; Mishraet al., 2015). In this paper, we use the following classifica-tion of the Amazonian seasons1: (i) the wet season typicallyspans February to May and shows the cleanest atmosphericstate, (ii) the transition period from wet to dry season typi-cally spans June and July, (iii) the dry season months Augustto November show the highest pollution levels, and (iv) thetransition period from dry to wet season spans December andJanuary (Andreae et al., 2015; Moran-Zuloaga et al., 2017).
A lively discussed aspect of the Amazonian hydrologicalcycle is the potential impact of changing aerosol regimes,which oscillate between polluted and pristine extremes, onthe development of clouds and precipitation (e.g., Roberts etal., 2003; Andreae et al., 2004; Rosenfeld et al., 2008). A va-riety of pollution-induced changes in cloud properties, suchas increased cloud drop concentrations with a correspondingdecrease of their average size, intense competition for wa-ter vapor, and thus a deceleration of drop growth rates, sup-pression of supersaturation, reduced coalescence of smallerdroplets, increased cloud depths as well as an invigoration ofcloud dynamics and rain, are well documented (e.g., Korenet al., 2004, 2012; Freud et al., 2008).
Overall, the aforementioned observations indicate that in-creasing aerosol concentrations can have substantial impactson spatial and temporal rainfall patterns in the Amazon (e.g.,Martins et al., 2009a; Reutter et al., 2009). In view of theglobally increasing pollution levels and the ongoing defor-estation in the Amazon, pollution-triggered perturbationsof the hydrological cycle are discussed as potential majorthreats to the Amazonian ecosystem, its forest structure, sta-bility, and integrity (e.g., Coe et al., 2013; Junk, 2013).
1The Amazonian seasons are mostly defined meteorologicallywith respect to precipitation data (Fu et al., 2001; Fernandes et al.,2015). Note that in this study we use a slightly different definitionof the seasons in the central Amazon based on meteorological andaerosol data to emphasize the seasonality in aerosol sources andprevalence. For example, the “meteorological wet season” typicallyhas its core period in February (maximum in precipitation), whereasthe “pollution-defined wet season” has its core period in April/May(e.g., minimum in carbon monoxide (CO) and black carbon (BC)concentrations) (Andreae et al., 2015).
M. L. Pöhlker et al.: Long-term observations of cloud condensation nuclei in the Amazon rain forest – Part 1 15711
1.3 Previous CCN measurements in the Amazon
Ground-based and airborne CCN measurements have beenconducted in a number of field campaigns in the AmazonBasin as outlined below in chronological order, constitutingthe baseline and context for the present study.
1998: Roberts and coworkers (Roberts et al., 2001; Robertset al., 2002) conducted the first CCN measurementsin the Amazon in the context of the LBA/CLAIRE-98campaign (ground-based, Balbina site, March and April1998) and pointed out that under clean conditions theCCN concentration NCCN(S) (at a certain supersatura-tion S) in the “green ocean” Amazon is surprisinglysimilar to conditions in the maritime “blue ocean” at-mosphere. Regarding the low natural NCCN(S), whichis dominated by mostly organic particles, they furthersuggested that cloud and precipitation properties mayreact sensitively to pollution-induced increases of thetotal aerosol load.
1999: In the context of the LBA-EUSTACH campaign in1999, ground-based CCN measurements at three dif-ferent sites in the Amazon Basin were conducted (An-dreae et al., 2002; Roberts et al., 2003). This was thefirst study on CCN properties and cloud dynamics un-der the influence of strong biomass burning emissionsin the Amazon.
2001: In the follow-up study LBA/CLAIRE-2001 in July2001, ground-based (Balbina site) and airborne mea-surements (around Manaus) were conducted. For theground-based study, Rissler et al. (2004) combined a hy-groscopicity tandem differential mobility analyzer (HT-DMA) with CCN measurements, focusing on the CCN-relevant water-soluble fraction in the particles, and pro-vided a CCN closure and parametrization for model ap-proaches. In addition, an airborne analysis of the aerosoland CCN properties was conducted, focusing on thecontrast between the Amazonian background air and theManaus plume (Kuhn et al., 2010).
2002: Subsequently, in the course of the LBA-SMOCC-2002 campaign in southern Brazil during major biomassburning episodes (Rondônia state, September and Octo-ber 2002), ground-based and airborne CCN measure-ments were performed (Vestin et al., 2007; Martins etal., 2009b). A major finding of this study was that theCCN efficiency of natural biogenic and man-made py-rogenic (cloud-processed) aerosols is surprisingly sim-ilar (Andreae et al., 2004). Furthermore, NCCN(0.5 %)was found as a valuable predictor for the required clouddepth of warm rain formation, which is an importantproperty for cloud dynamics (Freud et al., 2008).
2008: During the AMAZE-08 campaign (ground-based,ZF2 site, February and March 2008), the first size-
resolved CCN measurements in the Amazon were con-ducted (Gunthe et al., 2009; Martin et al., 2010a). Thesestudies report that aerosol particles in the Aitken and ac-cumulation modes, which represent the CCN-relevantsize range, predominantly contain organic constituentsand thus have comparably low hygroscopicity levels.The observed hygroscopicity parameter κ ranges be-tween 0.1 and 0.2, which corresponds to the typical hy-groscopicity of secondary organic aerosol (SOA) (An-dreae and Rosenfeld, 2008).
2010/11: During several short observational periods,Almeida et al. (2014) measured total CCN concentra-tions around the city of Fortaleza in northeast Brazil.The selected measurement locations receive wind fromchanging directions. Accordingly, the response of theCCN population to marine, urban, and rural air masseswas investigated.
2013: Recently, Whitehead et al. (2016) reported resultsfrom further short-term, size-resolved CCN and HT-DMA measurements that were conducted north of Man-aus (ground-based, ZF2 site, July 2013) as part of theBrazil–UK network for investigation of Amazonian at-mospheric composition and impacts on climate (BUNI-AACIC) project. The results of this study agree wellwith Gunthe et al. (2009).
2014/15: As part of the international field campaign ob-servation and modeling of the green ocean Amazon(GoAmazon2014/5), size-resolved CCN measurementswere conducted at three sites in and around Manaus:the Amazon Tall Tower Observatory (ATTO) site (T0a,pristine rain forest), which is discussed in the presentstudy, the T2 site (in Manaus, urban environment), andthe T3 site (rural site in the Manaus plume) (Martin etal., 2016; Thalman et al., 2017). All three size-resolvedCCN measurements in the context of GoAmazon2014/5took place in close collaboration. Moreover, CCN mea-surements were conducted onboard the G-1 aircraft dur-ing the GoAmazon2014/5 intensive observation periodsIOP1 and IOP2 (Martin et al., 2016).
2014: Furthermore, as part of the German–BrazilianACRIDICON (Wendisch et al., 2016) and CHUVA(Machado et al., 2014) projects, airborne CCN mea-surements were made over the entire Amazon Basin(September 2014). The results of this study are currentlybeing analyzed for an upcoming publication and repre-sent an ideal complement to the long-term data of thepresent study.
In addition to the aforementioned CCN measurements,some further studies relied on HTDMA measurements toprobe the aerosol hygroscopicity and particle growth fac-tors below 100 % relative humidity (RH), which can be used
15712 M. L. Pöhlker et al.: Long-term observations of cloud condensation nuclei in the Amazon rain forest – Part 1
to extrapolate the CCN activity in supersaturation regimes(Zhou et al., 2002; Rissler et al., 2006).
1.4 Aims and scope of this study
All of the previously published CCN measurements in theAmazon have been conducted over relatively short time pe-riods of up to several weeks. In addition, size-resolved CCNmeasurements are still sparse in the Amazon region. In thisstudy, we present the first continuous, long-term, and size-resolved CCN data set from the Amazon Basin, which spansa full seasonal cycle and therefore represents the CCN prop-erties during contrasting seasonal conditions.
The focus of this study is on presenting major trendsand characteristics of the CCN population in the AmazonBasin. Thus, our study contributes to a global inventory ofCCN properties, representing this unique and climaticallyimportant ecosystem. We extract key CCN properties andparameters that help to include CCN predictions in the Ama-zon region into future modeling studies. Based on our dataset, different parametrization strategies for CCN predictionare compared and discussed. Moreover, we present a noveland generalized CCN parametrization, which allows efficientmodeling of CCN concentrations based on a minimal set ofbasic aerosol properties.
This paper represents part 1 of a comprehensive analy-sis of the CCN cycling in the central Amazon. It covers theoverall trends and presents annually averaged CCN param-eters as well as characteristic differences in the CCN pop-ulation between the Amazonian seasons. A companion pa-per (Part 2) provides in-depth analyses of particularly inter-esting events through short-term case studies and aims fora more emission- and process-related understanding of theCCN variability (M. L. Pöhlker et al., 2017a).
2 Methods
2.1 Measurement site and period
The measurements reported in this study were conductedat the ATTO site (02◦08.602′ S, 59◦00.033′W; 130 m a.s.l.),which is located in an untouched rain forest area in the cen-tral Amazon, about 150 km northeast of the city of Manaus,Brazil. An overview of the atmospheric, geographic, and eco-logical conditions at the ATTO site has been published re-cently by Andreae et al. (2015), where a detailed descriptionof the aerosol setup for the long-term measurements can befound. The instrumentation for CCN measurements is partof a broad aerosol measurement setup, which also coversaerosol size and concentration, absorptivity, scattering, flu-orescence, as well as chemical composition (Andreae et al.,2015). The aerosol inlet is located at a height of 60 m, whichis about 30 m above the forest canopy. The sample air is driedby silica gel diffusion dryers at the main inlet, which keepsthe RH below 40 %. For the CCN setup, a second diffusion
dryer decreases the RH even further to < 20 %, which en-sures reliable hygroscopicity measurements.
The CCN measurements are ongoing since the end ofMarch 2014. This study covers the measurement period fromthe end of March 2014 to February 2015, representing almosta full seasonal cycle. Also, the measurement period overlapswith the international large-scale field campaign GoAma-zon2014/5 that was conducted in and around the city of Man-aus from 1 January 2014 through 31 December 2015. Dur-ing GoAmazon2014/5, comprehensive CCN measurementswere conducted at different sites (see Sect. 1.3) (Martin etal., 2016). The ATTO site served as a clean background(T0a) site during GoAmazon2014/5. Furthermore, the mea-surement period of this study encompasses the German–Brazilian ACRIDICON-CHUVA field measurement cam-paign in September 2014 (Machado et al., 2014; Wendisch etal., 2016), where (non-size-resolved) CCN measurements atmultiple supersaturation levels were performed onboard thehigh-altitude and long-range research aircraft (HALO) flyingover the Amazon Basin.
2.2 Size-resolved CCN measurements
The number concentration of CCN was measured with acontinuous-flow streamwise thermal gradient CCN counter(CCNC, model CCN-100, DMT, Boulder, CO, USA)(Roberts and Nenes, 2005; Rose et al., 2008b). The inlet flowrate of the CCNC was 0.5 L min−1 with a sheath-to-aerosolflow ratio of 11. The water pump was operated at a rate of4 mL h−1 corresponding to the CCNC setting of “low” liq-uid flow. The supersaturation (S) of the CCNC was cycledthrough 10 different S values between 0.11 and 1.10 % (seeTable 1), which are defined by controlled temperature gra-dients inside the CCNC column. Particles with a critical su-persaturation (Sc) ≤ S in the column are activated and formwater droplets. Droplets with diameters ≥ 1 µm are detectedby an optical particle counter (OPC) at the exit of the column.
Size-resolved CCN activation curves (for nomenclature,see Sect. 2.3) were measured based on the concept of Franket al. (2006), following the procedures in Rose et al. (2008a)and Krüger et al. (2014) by combining the CCNC with a dif-ferential mobility analyzer (DMA, model M, Grimm AerosolTechnik, Ainring, Germany). The DMA was operated with asheath-to-aerosol flow ratio of 5. The DMA selects particleswith a certain diameter (D) in the size range of 20 to 245 nm(sequence ofD value has been optimized for every S), whichare then passed into the two instruments: (i) the CCNC sys-tem and (ii) a condensation particle counter (CPC, model5412, Grimm Aerosol Technik), which measures the numberconcentration of aerosol particles with selected D(NCN(D)),while the CCNC measures the number concentration of CCNwith selected D for the given S(NCCN(S,D)). The cyclethrough a full CCN activation curve (NCCN(S,D)/NCN(D))for one S level took ∼ 28 min, including ∼ 40 s equilibra-tion time for every new D, and ∼ 2 min equilibration time
M. L. Pöhlker et al.: Long-term observations of cloud condensation nuclei in the Amazon rain forest – Part 1 15713
Table 1. Characteristic CCN parameters as a function of the supersaturation S, averaged over the entire measurement period: midpointactivation diameter Da(S), hygroscopicity parameter κ(S,Da), width of CCN activation curve σ (S), heterogeneity parameter σ (S)/Da(S),maximum activated fraction MAF(S), CCN number concentrationNCCN(S), total particle concentration (> 10 nm)NCN,10, CCN efficienciesNCCN(S)/NCN,10, and number of data points n. S is shown as set value± the experimentally derived deviation in S. All other values aregiven as arithmetic mean± 1 standard deviation. All values are provided for ambient conditions (temperature ∼ 28 ◦C; pressure ∼ 100 kPa).
S Da(S) κ(S,Da) σ (S) σ(S)/Da(S) MAF(S) NCCN(S) NCN,10 NCCN(S)/NCN,10 n
for every new S level. The completion of a full measurementcycle comprising CCN activation curves for 12–13 D val-ues (number of D depends on S) and 10 different S levelstook ∼ 4.5 h. The entire CCN system (including the CCNC,DMA, and CPC) was controlled by a dedicated LabVIEW(National Instruments, Munich, Germany) routine.
The S levels of the CCNC system were calibrated period-ically (March, May, and September 2014) using ammoniumsulfate ((NH4)2SO4, Sigma Aldrich, St. Louis, MO, USA)particles generated in an aerosol nebulizer (TSI Inc., Shore-view, MN, USA). The calibration procedure was conductedaccording to Rose et al. (2008b). All three calibrations gaveconsistent results and thus confirmed that the S cycling inthe CCNC was very stable and reliable throughout the entiremeasurement period.
All concentration data presented here are given for am-bient conditions. During the entire measurement period, nosignificant fluctuations in temperature (∼ 28 ◦C) and pressure(∼ 100 kPa) were observed in the air-conditioned laboratorycontainer.
2.3 Data analysis, error analysis, and nomenclature ofCCN key parameters
The theoretical background and related CCN analysis pro-cedures are comprehensively described elsewhere (Pettersand Kreidenweis, 2007; Rose et al., 2008a). For the presentstudy, the following corrections were applied to the dataset. (i) The CCN activation curves were corrected for sys-tematic deviations in the counting efficiency of the CCNCand CPC according to Rose et al. (2010). (ii) Usually, thedouble-charge correction of the CCN activation curve is con-ducted according to Frank et al. (2006). For this study, wedeveloped the following alternative approach, which recon-structs the CCN efficiency curves based on data from an inde-pendent scanning mobility particle sizer (SMPS, TSI model
3080 with CPC 3772 operating with standard TSI software)at the ATTO site. The activation curve for every D can bedescribed by the following equation:
∑i
NCCN (S,Di)∑i
NCN(Di)=
∑i
f (Di) · s (Di) · a(S,Di)∑i
f (Di) · s (Di). (1)
The index i represents the charge of the particles (typically1≤ i ≤ 4). The left side of the equation is the measured (non-corrected) ratio of CCN to condensation nuclei (CN) for oneselected D and S. The parameter s(Di) is the multi-charge-corrected particle number size distribution inverted from theSMPS measurements at Di with its different charge states.The parameter f (Di) is the corresponding fraction of parti-cles with the charge i. The function a(S,Di) accounts for theactivated fraction of s(Di) at a given supersaturation S. Wedescribe a(S,Di) as a cumulative Gaussian function. Usinga nonlinear least-squares fit method (Levenberg–Marquardt)together with the knowledge of s(Di) and f (Di), the param-eters of the function a(S,Di) can be optimized to get an op-timal fit of the measured CCN activation curve for a given S.The function a(S,D) is the cumulative Gaussian function af-ter the fit, which describes the multi-charge-corrected CCNactivation curve and has been used as a basis for the furtheranalysis. Because the information on multiple charged par-ticles also contributes to the fit results, this approach is su-perior to previously used methods, where this informationis neglected. Based on a(S,D), the critical diameter (Da(S),where 50 % of the particles are activated) is used to retrievethe effective hygroscopicity parameter (κ(S,Da)) accordingto the κ-Köhler model (Petters and Kreidenweis, 2007). Adetailed description of the calculation can be found in Pettersand Kreidenweis (2007), Rose et al. (2010), and Mikhailovet al. (2009).
15714 M. L. Pöhlker et al.: Long-term observations of cloud condensation nuclei in the Amazon rain forest – Part 1
The CCN size distribution (NCCN(S,D)) was calculated by
NCCN (S,D)= s (D) · a (S,D). (2)
In this equation, s(D) represents the particle number size dis-tribution of the SMPS at D (10≤D ≤ 450 nm).
The CCN efficiencies (NCCN(S)/NCN,10; for nomencla-ture, see end of Sect. 2.3) have been calculated based onthe integral concentration of CN with lower size cutoffDcut= 10 nm (NCN,10)
2 and CCN (NCCN(S)) as
NCCN(S)
NCN,10=
∫DNCCN (S,D) · dD∫Ds(D) · dD
. (3)
In addition to Da(S), the maximum activated fraction(MAF(S)) can be obtained from a(S,D). MAF(S) typicallyequals unity, except for completely hydrophobic particles(i.e., fresh soot). The third parameter that can be derivedfrom a(S,D) is the width of the CCN activation curve σ (S),which strongly depends on Da(S). The ratio between σ (S)and Da(S) (σ (S)/Da(S)) is called heterogeneity parameterand can be used as an indicator for the chemical and geomet-ric diversity of the aerosol particles.
The error in S was calculated based on the uncertainty ac-cording to the commonly used calibration procedure (Rose etal., 2008b). Overall, the error 1S of S equals approximately10 %; however, in the following analysis, we have used thespecific1S values for every S (see Table 1). The uncertaintyof the selected D of the DMA (1D) was obtained as themean width of the Gaussian fit of polystyrene latex (PSL)beads and equals 5.3 nm. For NCCN(S,D) and NCN(D), thestandard error of the counting statistic was used. By Gaussianerror propagation we determined 1(NCCN(S,D)/NCN(D))and then repeated the data analysis for the upper andlower bounds (1±1)× (NCCN(D,S)/NCN(D)). The result-ing relative errors of the values NCCN(S), NCN,10, andNCCN(S)/NCN,10 do not depend on S and equal 6 %. The er-rors ofDa(S) and κ(S,Da) depend on S and can be describedas
1Da(S)=Da(S) · (S · 0.07+ 0.03) (4)1κ (S,Da)= κ (S,Da) · (S · 0.17+ 0.10). (5)
Throughout this study, we observed a slight systematic de-viation of the results for the supersaturation S= 0.47 %. Thiseffect can be seen, for example, in MAF(0.47 %) values ex-ceeding unity in Fig. 1 andNCCN(0.47 %,D)/NCN(D) valuesexceeding unity in Fig. 5. The effect persists even after ap-plying all aforementioned corrections to the data and is mostpronounced during the dry season. Yet, since we did not findany evidence of these data being erroneous, we decided tokeep them in the study.
2Note that NCN,10 usually corresponds to the total CPC-detectable aerosol particle number concentration for the characteris-tic size distribution at the ATTO site because the particle populationin the nucleation-mode range (i.e., < 10 nm) is negligibly small.
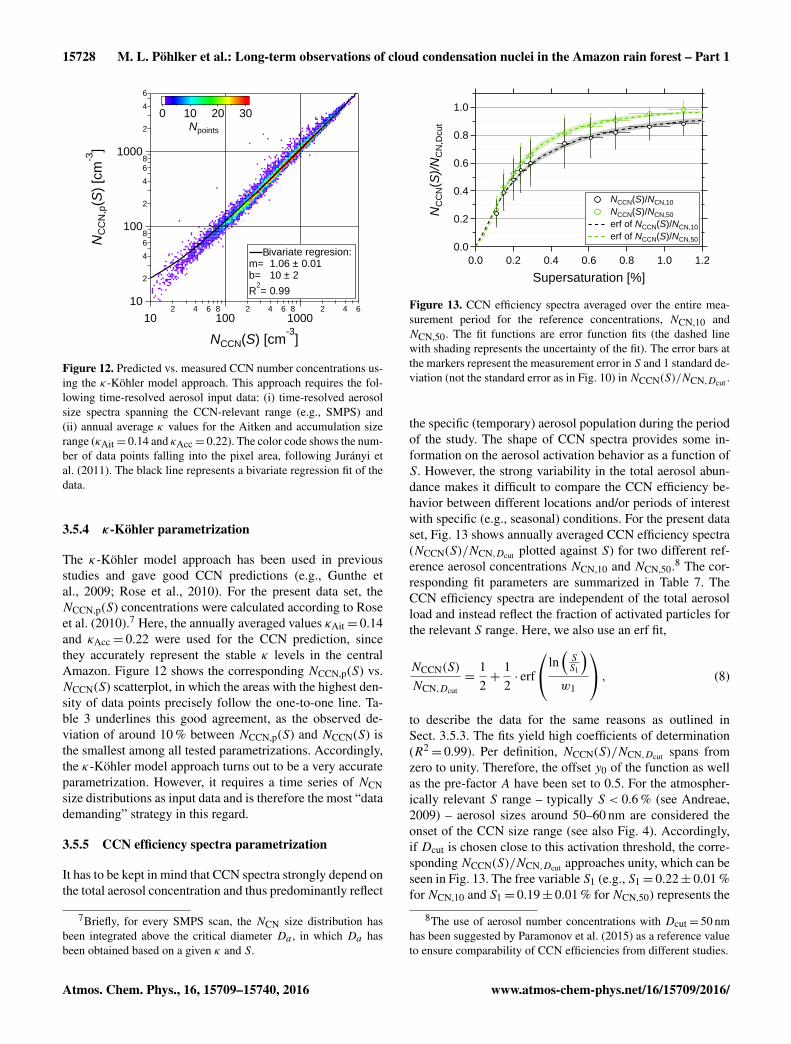
The use of certain terms in the context of CCN mea-surements is not uniform in the literature. For clarity, wesummarize the key parameters and terms applied in thisstudy as follows: (i) the value NCCN(S,D)/NCN(D) is calledCCN activated fraction, while (ii) NCCN(S,D)/NCN(D)plotted against D is called CCN activation curve;(iii) NCCN(S) plotted against S is called CCN spectrum;(iv) NCCN(S)/NCN,Dcut at a certain S level is called CCN ef-ficiency; (v) NCCN(S)/NCN,Dcut plotted against S is calledCCN efficiency spectrum.
2.4 Aerosol mass spectrometry
In addition to the CCN measurements, aerosol chemical spe-ciation monitor (ACSM, Aerodyne Research Inc., Billerica,MA, USA) measurements are being performed at the ATTOsite (Andreae et al., 2015). The ACSM routinely charac-terizes nonrefractory submicron aerosol species such as or-ganics, nitrate, sulfate, ammonium, and chloride (Ng et al.,2011). Particles are focused by an aerodynamic lens systeminto a narrow particle beam, which is transmitted throughthree successive vacuum chambers. In the third chamber, theparticle beam is directed into a hot tungsten oven (600 ◦C)where the particles are flash vaporized, ionized with a 70 eVelectron impact ionizer, and detected with a quadrupole massspectrometer. In this study, a time resolution of 30 min wasused. The measurements provide a total mass concentrationof the chemical composition of the aerosol particles. Furtherdetails about the ACSM can be found in Ng et al. (2011).
2.5 Carbon monoxide measurements
Carbon monoxide (CO) measurements are conducted con-tinuously at the ATTO site using a G1302 analyzer (PicarroInc. Santa Clara, CA, USA). The experimental setup from thepoint of view of functioning and performance is a duplicationof the system described in Winderlich et al. (2010).
3 Results and discussion
3.1 Time series of CCN parameters for the entiremeasurement period
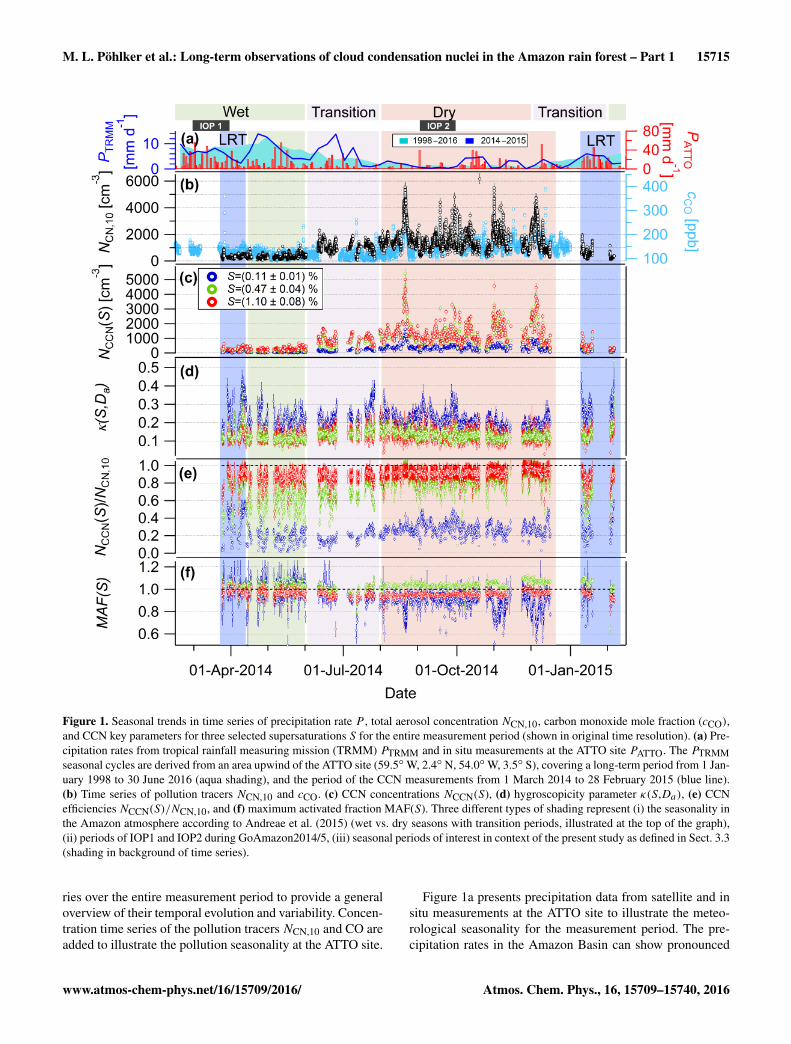
Over the entire measurement period from 25 March 2014to 5 February 2015 we recorded size-resolved CCN activa-tion curves at 10 different levels of water vapor supersat-uration S with an overall time resolution of approximately4.5 h. A total of 10 253 CCN activation curves were fittedand analyzed to obtain parameters of CCN activity as de-tailed above (Sect. 2.3). Table 1 serves as a central refer-ence in the course of this study and summarizes the annualmean values and standard deviations of the following key pa-rameters, resolved by S: Da(S), κ(S,Da), σ (S), σ (S)/Da(S),MAF(S), NCCN(S),NCN,10, and NCCN(S)/NCN,10. In Fig. 1,some of these CCN key parameters are presented as time se-
M. L. Pöhlker et al.: Long-term observations of cloud condensation nuclei in the Amazon rain forest – Part 1 15715
Figure 1. Seasonal trends in time series of precipitation rate P , total aerosol concentration NCN,10, carbon monoxide mole fraction (cCO),and CCN key parameters for three selected supersaturations S for the entire measurement period (shown in original time resolution). (a) Pre-cipitation rates from tropical rainfall measuring mission (TRMM) PTRMM and in situ measurements at the ATTO site PATTO. The PTRMMseasonal cycles are derived from an area upwind of the ATTO site (59.5◦W, 2.4◦ N, 54.0◦W, 3.5◦ S), covering a long-term period from 1 Jan-uary 1998 to 30 June 2016 (aqua shading), and the period of the CCN measurements from 1 March 2014 to 28 February 2015 (blue line).(b) Time series of pollution tracers NCN,10 and cCO. (c) CCN concentrations NCCN(S), (d) hygroscopicity parameter κ(S,Da), (e) CCNefficiencies NCCN(S)/NCN,10, and (f) maximum activated fraction MAF(S). Three different types of shading represent (i) the seasonality inthe Amazon atmosphere according to Andreae et al. (2015) (wet vs. dry seasons with transition periods, illustrated at the top of the graph),(ii) periods of IOP1 and IOP2 during GoAmazon2014/5, (iii) seasonal periods of interest in context of the present study as defined in Sect. 3.3(shading in background of time series).
ries over the entire measurement period to provide a generaloverview of their temporal evolution and variability. Concen-tration time series of the pollution tracers NCN,10 and CO areadded to illustrate the pollution seasonality at the ATTO site.
Figure 1a presents precipitation data from satellite and insitu measurements at the ATTO site to illustrate the meteo-rological seasonality for the measurement period. The pre-cipitation rates in the Amazon Basin can show pronounced
15716 M. L. Pöhlker et al.: Long-term observations of cloud condensation nuclei in the Amazon rain forest – Part 1
anomalies due to teleconnections with the Atlantic and/orPacific sea surface temperatures (SSTs) (Fu et al., 2001;Fernandes et al., 2015). The most prominent example hereis the El Niño–Southern Oscillation (ENSO) and its vari-ous impacts on the Amazonian ecosystem (e.g., Asner etal., 2000; Ronchail et al., 2002). For the measurement pe-riod, the Oceanic Niño Index (ONI) ranged between −0.4and 0.6 ◦C, confirming that only towards the end of the mea-surement period a slightly positive anomaly was observed.3
In Fig. 1a, satellite data from the tropical rainfall measure-ment mission (TRMM) are presented for the area around theATTO site. The TRMM data are provided for an extendedtime period (January 1998 until June 2016) and, for com-parison, for the CCN measurement period (March 2014 un-til February 2015). This comparison shows that the 2014/15precipitation rates do not deviate substantially from the 18-year average data, and thus further confirms that the measure-ment period can be regarded as a typical year with typicalseasons and no pronounced hydrological anomalies.
Figure 1b displays the characteristic seasonal cycle inNCN,10 and the CO mole fraction (cCO). Both pollu-tion tracers reach their maxima during the dry season(NCN,10= 1400± 710 cm−3; cCO= 144± 45 ppb), whereasthe lowest values are observed during the wet season(NCN,10= 285± 131 cm−3; cCO= 117± 12 ppb) (given asmean± 1 standard deviation). An obvious feature of thedry season months is the occurrence of rather shortand strong peaks (reaching up to NCN,10=∼ 5000 cm−3;cCO=∼ 400 ppb) on top of elevated background pollutionlevels. The pronounced peaks originate from biomass burn-ing plumes, which impact the ATTO site for comparativelyshort periods (a few hours up to several days). Selectedevents are discussed in detail in M. L. Pöhlker et al. (2017a).Figure 1c shows that NCCN(S) follows the same overalltrends. A rather close correlation between NCCN(S) andNCN,10 as well as NCCN(S) and cCO can be observed, aspointed out in previous studies (Andreae, 2009; Kuhn et al.,2010). Figure 1d displays the κ(S,Da) time series for threeexemplary S levels. It shows that the κ(S,Da) values, whichprovide indirect information of the particles’ chemical com-position, are remarkably stable throughout the year (see alsostandard deviations of κ(S,Da) in Table 1). This illustratesthat the dry season maximum in NCCN(S) is mainly relatedto the overall increase inNCN,10, and not to substantial varia-tions in aerosol composition and therefore κ(S,Da). The lev-els of the three κ(S,Da) time series, with their correspondingDa(S), provide a first indication that κ(S,Da) shows a clearsize dependence, as further discussed in Sect. 3.2. The pro-
3For the ONI data and specific information on the ref-erence area and time frame, refer to National Oceanic andAtmospheric Administration (NOAA)/National Weather Service,2016. Historical El Niño/La Niña episodes (1950–present)are available at http://www.cpc.ncep.noaa.gov/products/analysis_monitoring/ensostuff/ensoyears.shtml (last access: 1 October 2016).
nounced (but rather rare) “spikes” in κ(S,Da) (i.e., in Apriland August) as well as various other specific events in thistime series are analyzed in detail in the companion Part 2 pa-per (M. L. Pöhlker et al., 2017a). Figure 1e gives an overviewof the CCN efficiencies NCCN(S)/NCN,10 (for three S lev-els) and its seasonal trends. This representation shows con-tinuously high fractions of cloud-active particles for higherS (e.g., NCCN(1.10 %) /NCN,10 > 0.9) throughout the entiremeasurement period with almost no seasonality. For interme-diate S, such as 0.47 %, the values of NCCN(0.47 %) /NCN,10range from 0.6 to 0.9 and reveal a noticeable seasonal cy-cle, with the highest levels during the dry season. Further-more, NCCN(0.11 %) /NCN,10 is mostly below 0.4, with clearseasonal trends. These observations can be explained by thecharacteristic aerosol size distribution at the ATTO site (An-dreae et al., 2015), which (i) is dominated by particles in theAitken (annually averaged peak DAit at ∼ 70 nm) and accu-mulation modes (annually averaged peakDAcc at∼ 150 nm),(ii) shows a sparse occurrence of nucleation-mode parti-cles (< 30 nm), and (iii) reveals a clear seasonality in therelative abundance of Aitken and accumulation modes (seeSect. 3.3 and Fig. 6). Thus, the higher dry season abundanceof accumulation-mode particles, which are more prone to actas CCN, results in higher NCCN(S)/NCN,10 levels, particu-larly at lower S.
Analogous NCCN(S)/NCN results from othercontinental background sites have been pub-lished previously: for example, Levin etal. (2012) reported NCCN(0.97 %) /NCN= 0.4–0.7,NCCN(0.56 %) /NCN= 0.25–0.5, and NCCN(0.14 %) /NCN< 0.15 for a semi-arid Rocky Mountain site. Jurányiet al. (2011) reported NCCN(1.18 %)/NCN,16= 0.6–0.9, NCCN(0.47 %)/NCN,16= 0.2–0.6, andNCCN(0.12 %)/NCN,16 < 0.25 for the high alpine Jungfrau-joch site. At both locations, the CCN efficiencies tend tobe lower than the corresponding results at the ATTO site,which can be explained by the frequent occurrence of newparticle formation (NPF) and the related abundance ofultrafine particles (with sizes well below Da(S)) at thesesites (Boulon et al., 2010; Ortega et al., 2014). The activatedfractions at the Rocky Mountain and Jungfraujoch siteshave a stronger seasonality than those at ATTO, probablyinversely related to the seasonal cycle in NPF. Overall, westate that the activated fractions in the central Amazon,due the absence of significant ultrafine particle (< 30 nm)populations, tend to be constantly higher than in other con-tinental background locations (Paramonov et al., 2015). Theabsence of “classical” NPF (Kulmala et al., 2004) and thecorresponding lack of ultrafine particles is a unique propertyof the Amazon atmosphere resulting in the uniquely highCCN efficiencies. A systematic study on the abundance,properties, and seasonality of the sparse nucleation-modebursts in the central Amazon is the subject of an upcomingstudy.
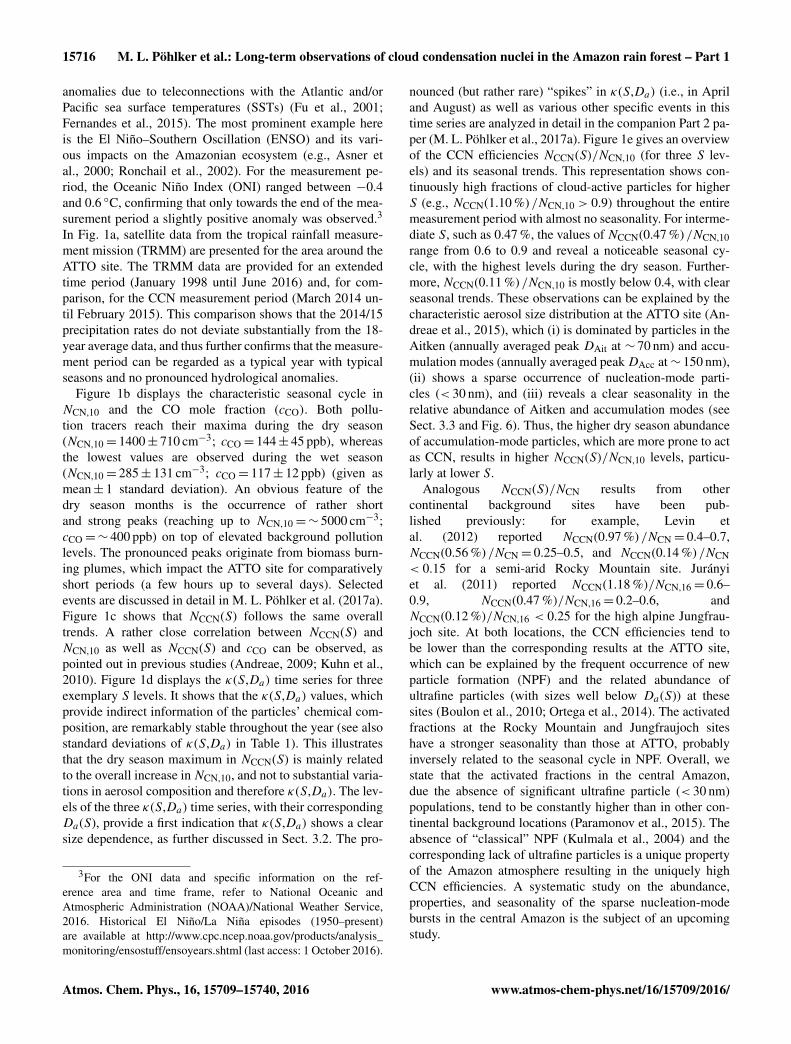
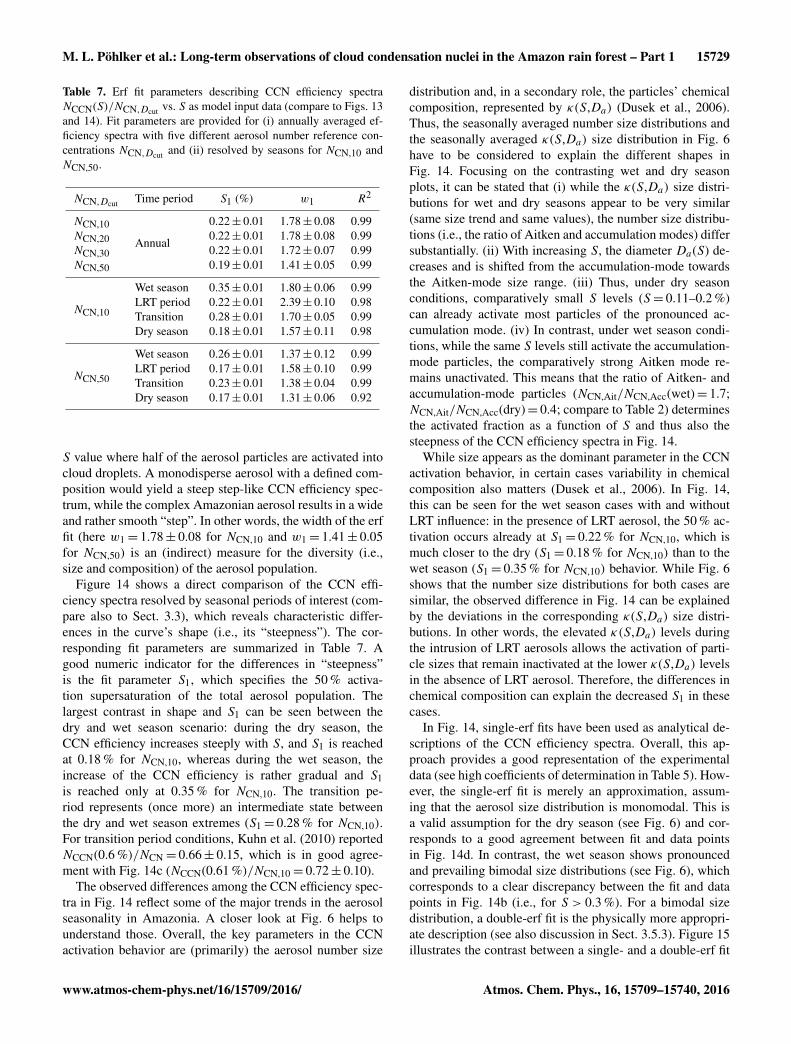
Figure 2. CCN activation curves for all measured S lev-els (S= 0.11–1.10 %), averaged over the entire measurementperiod. Data points represent arithmetic mean values. ForNCCN(S,D)/NCN(D), the standard error is plotted, which is verysmall (due to the large number of scans with comparatively smallvariability) and therefore not perceptible in this representation. Forthe diameter, D, the error bars represent the experimental error asspecified in Sect. 2.3. The grey vertical band represents the posi-tion of the Hoppel minimum (including error range) for the annualmean number size distribution (compare to Fig. 3). Dashed linesprovide visual orientation and indicate 0, 50, and 100 % activation.The value at 50 % activation is used for calculation of the hygro-scopicity parameter κ(S,Da). The lines connecting the data pointsmerely serve as visual orientation.
The MAF(S) time series in Fig. 1f represents a valuableadditional parameter to determine the abundance of “poor”CCN (i.e., aerosol particles that are not activated into CCNwithin the tested S range). For higher S (i.e., S > 0.11 %),MAF(S) is close to unity over the whole year. In contrast,MAF(0.11 %) fluctuates around unity during the wet seasonmonths; however, it drops below unity during the biomass-burning-impacted dry season and subsequent transition pe-riod. For some episodes, MAF(S) shows very pronounceddips, as further discussed in the Part 2 study (M. L. Pöhlkeret al., 2017a).
3.2 Annual means of CCN activation curves andhygroscopicity parameter
Figure 2 displays the annual mean CCN activation curves forall S levels. Thus, it represents an overall characterizationof the particle activation behavior, which means that for de-creasing S levels the activation diameter,Da(S), increases. Inother words, every S corresponds to a certain (and to someextent typical) Da(S) range, where particles start to becomeactivated (see Table 1). As an example, relatively high S con-ditions (0.47–1.10 %) yield substantial activation already inthe Aitken-mode range, while low S levels (0.11–0.29 %)correspond to activation of larger particles, mostly in the ac-
cumulation mode. Note that S levels in convective cloudsrarely exceed 1.0 %, but that in the presence of precipitationhigher S values are possible (Cotton and Anthes, 1989). Thestep from the activation curves at S= 0.47 % to S= 0.29 %relates to the position of the characteristic Hoppel minimum(at 97 nm for the annual mean size distribution; see Table 2)between Aitken and accumulation mode in the bimodal sizedistribution. Thus, the step to S= 0.47 % represents the onsetof significant activation in the Aitken-mode size range.
A different representation of these observations is dis-played in Fig. 3, which shows the bimodally fitted (bi-modal logarithmic normal distribution, R2
= 0.99) an-nual mean NCN(D) size distribution. In this annual aver-age representation, the Aitken-mode maximum is locatedat DAit= 69± 1 nm, the accumulation-mode maximum atDAcc= 149± 2 nm, and both are separated by the Hoppelminimum (compare to Table 2) (Hoppel et al., 1996). Fur-thermore, Fig. 3 clearly shows that different κ(S,Da) val-ues are retrieved for the Aitken (κAit = 0.14± 0.03) vs. theaccumulation-mode size range (κAcc = 0.22± 0.03). This in-dicates that Aitken- and accumulation-mode particles havedifferent hygroscopicities and thus different chemical com-positions. In this case, Aitken-mode particles tend to bemore predominantly organic (close to κ = 0.1) than theaccumulation-mode particles, which tend to contain moreinorganic species (i.e., ammonium, sulfates, potassium)(Prenni et al., 2007; Gunthe et al., 2009; Wex et al., 2009; C.Pöhlker et al., 2012). The enhanced hygroscopicity in the ac-cumulation mode is a well-documented observation for vari-ous locations worldwide, which is thought to result from thecloud processing history of this aerosol size fraction (e.g.,Paramonov et al., 2013, 2015). For the Amazon Basin, ourobserved size dependence of κ(S,Da) agrees well with thevalues reported by Gunthe et al. (2009) and Whitehead etal. (2016).
The arithmetic mean hygroscopicity parameter at theATTO site for all sizes (43 nm<Da < 172 nm) and for theentire measurement period is κmean= 0.17± 0.06. For com-parison, Gunthe et al. (2009) reported κmean = 0.16± 0.06(for the early wet season 2008). The observed standard de-viation is rather small, which reflects the low variability ofκmean throughout the year (see Fig. 1b).
No perceptible diurnal trend in κmean is present in theannually averaged data. This is because the ATTO site isnot (strongly) influenced by aerosol compositional changesthat follow pronounced diurnal cycles (i.e., input of an-thropogenic emissions). A consequence of this finding isthat the overall hygroscopicity of the aerosol at the ATTOsite (as a representative measurement station of the cen-tral Amazon) is well represented in model studies by us-ing κmean= 0.17± 0.06 (see also Sect. 3.5.4). Previous long-term CCN observations from alpine, semi-arid, and borealbackground sites have similarly shown that diurnal cycles inκ(S,Da) (or the relatedDa(S)) tend to be rather small or even
15718 M. L. Pöhlker et al.: Long-term observations of cloud condensation nuclei in the Amazon rain forest – Part 1
Table 2. Properties (position x0, integral number concentration NCN, width σ) of Aitken and accumulation modes from the double log-normal fit (compare to R2) of the total particle size distributions. Values are given as annual means and subdivided into seasonal periodsof interest as specified in Sect. 3.3 (compare also to Fig. 6). In addition, values for the position of the Hoppel minimum DH as well asestimated average peak supersaturation in cloud Scloud(DH,κ) are listed. The errors represent the uncertainty of the fit parameters. The errorin Scloud(DH,κ) is the experimentally derived error in S.
�(S,Da) SMPS size distribution Double log normal fit Aitken and accumulation mode
Figure 3. Size dependence of the hygroscopicity parameter κ(S,Da) averaged over the entire measurement period. Values of κ(S,Da) forevery S level are plotted against their corresponding midpoint activation diameter Da(S) (left axis). For κ(S,Da), the error bars represent1 standard deviation. For Da(S), the experimentally derived error is shown. In addition, the average number size distribution for the entiremeasurement period is shown (right axis). Dashed green lines represent the average Aitken and accumulation modes. The standard errorof the number size distribution is indicated as grey shading, which is very small and therefore hardly perceptible in this representation dueto the large number of scans with comparatively small variability. Distinctly different κ(S,Da) levels can be observed for the Aitken andaccumulation modes with lower variability in the Aitken than in the accumulation mode.
absent (Jurányi et al., 2011; Levin et al., 2012; Paramonov etal., 2013).
Figure 4 combines the annually averaged size distributionsof NCN(D) as well as NCCN(S,D) for all S levels. Thesecurves result from multiplying the NCN(D) size distributionwith the CCN activation curves in Fig. 2 and clearly visu-alize the inverse relationship of Da(S) and S. Following the
previous discussion of Fig. 2, S ranging between 0.11 and0.29 % mostly activates accumulation-mode particles, whileS ranging between 0.47 and 1.10 % activates the accumula-tion mode plus a substantial fraction of Aitken-mode parti-cles. For the highest supersaturation (S= 1.10 %) that wasused in this study, almost the entire NCN(D) size distribu-tion is being activated into CCN, which (regarding the very
Figure 4. Number size distributions of total aerosol particles,NCN(D), and of cloud condensation nuclei, NCCN(S,D), at all 10supersaturation levels (S= 0.11–1.10 %) averaged over the entiremeasurement period. The NCCN(S,D) size distributions were cal-culated by multiplying the average NCN(D) size distributions (inFig. 3) with the average CCN activation curves in (Fig. 2).
sparse occurrence of particles< 30 nm) explains the highNCCN(1.10 %)/NCN,10 levels in Fig. 1d.
3.3 Seasonal differences in CCN properties at theATTO site
Within the seasonal periods in the central Amazon as definedin Sect. 1.2, we have subdivided the annual data set into thefollowing four periods of interest, which represent the con-trasting aerosol conditions and/or sources. (a) The first half ofthe wet seasons 2014 and 2015 received substantial amountsof long-range transport (LRT) aerosol: mostly African dust,biomass smoke, and fossil fuel emissions (Ansmann et al.,2009; Salvador et al., 2016). Here, the corresponding periodof interest will be called LRT season and covers 24 Marchto 13 April 2014 and 9 January to 10 February 2015. (b) Inthe late wet season 2014, all pollution indicators approachedbackground conditions. Thus, the period from 13 April to31 May 2014 will be treated as the clean wet season in thisstudy. (c) The months June to July represent the transitionperiod from wet to dry season and will be called “transitionwet to dry”. (d) The period of interest that covers the dry sea-son with frequent intrusion of biomass burning smoke rangesfrom August to December 2014.
Figure 5 shows the CCN activation curves for all S lev-els, subdivided into the four seasonal periods of interest. Al-though the plots for the individual seasons appear to differonly subtly, e.g., in Da(S) position and curve width, thereis one major difference: the variable shape of the activa-tion curve for the smallest S= 0.11 %. Particularly, the be-havior of MAF(0.11 %) shows clear seasonal differences. Itreaches unity during the wet season, whereas it levels offbelow unity for the LRT, transition, and particularly for the
dry season periods. The fraction of non-activated particleswith D≤ 245 nm at S = 0.11 % is ∼ 10 % during the tran-sition period and ∼ 20 % during the dry season. Interest-ingly, this effect is only observed for S = 0.11 %, whereasMAF(> 0.11 %) reaches unity throughout the entire year. Anexplanation for this observation could be the intrusion ofrelatively fresh biomass burning aerosol plumes during thetransition period and dry season, which contain a fractionof comparatively inefficient CCN. Soot is probably a maincandidate here; however, fresh soot should also significantlyreduce the MAF(S) for higher S levels (Rose et al., 2010).Thus, we speculate that probably “semi-aged” soot particlesmay be an explanation for the observed activation behavior.
Figure 6 corresponds to Fig. 3 and subdivides the annualmean κ(S,Da) size distribution (κ(S,Da) plotted against allmeasured Da(S)) as well as the annual mean NCN(D) sizedistribution into their seasonal counterparts. The particle sizedistributions were fitted with a bimodal logarithmic normaldistribution and the corresponding results are listed in de-tail in Table 2. The differences in the characteristic size dis-tributions for the individual seasons clearly emerge: in ad-dition to the strong variations in total particle number con-centration (see Fig. 1), the accumulation mode overwhelmsthe Aitken mode during the dry season, while accumulationand Aitken modes occur at comparable strength under wetseason conditions. In other words, during the dry season,Aitken-mode particles account on average for about 26 %of the total aerosol population (NCN,Ait= 483± 49 cm−3
vs. NCN,Acc= 1349± 47 cm−3), whereas during the wetseason, the Aitken mode accounts for about 62 %(NCN,Ait= 246± 9 cm−3 vs. NCN,Acc= 145± 8 cm−3) (seeTable 2). The size distribution of the transition period fromwet to dry season represents an intermediate state betweenthe wet and dry season “extremes”. Furthermore, the com-parison between wet season conditions with and without LRTinfluence reveals comparable distributions. However, a slightincrease in the accumulation mode during LRT conditions in-dicates the presence of dust, smoke, pollution, and aged seaspray on top of the biogenic aerosol population during pris-tine periods (M. L. Pöhlker et al., 2017a).
The Hoppel minimum DH (Hoppel et al., 1996) betweenthe Aitken and accumulation modes4 also shows seasonalvariations with its largest values around 110 nm in the wetseason and its smallest values around 95 nm in the dry sea-son (compare to Fig. 5 and Table 2). Following Krüger etal. (2014), the observed DH can be used to determine aneffective average cloud peak supersaturation Scloud(DH,κ).
4The position of DH was determined as the intersection of thefitted and normalized modes (monomodal fits for Aitken and ac-cumulation mode were normalized to equal area). The normaliza-tion is necessary for a precise localization of DH because large dif-ferences in Aitken- and accumulation-mode strength (e.g., for thedry season conditions) cause biased DH as the intersection of bothmodes is shifted towards the smaller mode.
15720 M. L. Pöhlker et al.: Long-term observations of cloud condensation nuclei in the Amazon rain forest – Part 1
Figure 5. CCN activation curves for all measured S levels (S= 0.11–1.10 %), subdivided into seasonal periods of interest as specified inSect. 3.3. Data points represent arithmetic mean values. For NCCN(S,D)/NCN(D), the standard error is plotted, which is very small (dueto the large number of scans with comparatively small variability) and therefore not perceptible in this representation. For the diameter,D, the error bars represent the experimental error as specified in Sect. 2.3. The grey vertical bands represent the (seasonal) position of theHoppel minima (including error range; compare to Table 2). Dashed horizontal lines provide visual orientation and indicate 0, 50, and 100 %activation. The 50 % activation diameter is used for calculation of the hygroscopicity parameter κ(S,Da). The lines connecting the data pointsmerely serve as visual orientation.
Cloud development and dynamics are highly complex pro-cesses in which aerosol particles are activated at differentsupersaturations. In the context of this study, Scloud(DH,κ)is used as a mean cloud supersaturation and serves as anoverall reference value; however, it does not reflect the com-plex development of S inside a cloud. Based on our data,Scloud(DH,κ) is estimated as a value around 0.29 % duringdry season conditions and around 0.22 % during wet seasonconditions (Table 2). This indicates that Scloud(DH,κ) levelstend to be noticeable lower during wet season cloud devel-opment compared to the dry season scenario. A plausiblecause for the comparatively smallDH and high Scloud(DH,κ)in the dry season could be invigorated updraft regimes in theconvective clouds. This invigoration could be caused by thestronger solar heating during the dry season and/or the in-creased aerosol load under biomass-burning-impacted condi-tions, as suggested previously (Andreae et al., 2004; Rosen-feld et al., 2008). As outlined in Sect. 1.1, aerosol particle
size, concentration, and hygroscopicity as well as cloud su-persaturation represent key parameters for a detailed under-standing of cloud properties. Figure 6 provides reference val-ues for all these parameters, resolved by seasons and thusprovides comprehensive insight into the Amazonian cloudproperties.
Comparing the seasonal κ(S,Da) size distributions inFig. 6, it is obvious that the (seasonally averaged) κAit val-ues in the Aitken-mode size range are surprisingly stable be-tween 0.13 and 0.14 throughout the whole year. This indi-cates that the Aitken-mode aerosol population was persis-tently dominated by almost pure organic particles through-out the seasons. In contrast, noticeable seasonal differenceswere observed for (seasonally averaged) κAcc values in theaccumulation-mode size range, with mean values rangingfrom around 0.21 to 0.28. This indicates that the accumu-lation mode also comprises high contents of organic mate-rials, however, with elevated amounts of inorganic ingredi-
Figure 6. Size dependence of the hygroscopicity parameter κ(S,Da) subdivided into seasonal periods of interest (color coding) as specifiedin Sect. 3.3. Values of κ(S,Da) for every S level are plotted against their corresponding midpoint activation diameter Da(S) (left axis). Forκ(S,Da), the error bars represent 1 standard deviation. ForDa(S), the experimentally derived error is shown. In addition, the average numbersize distributions for the seasonal periods of interest are shown (right axis). The standard error of the number size distributions is indicatedas shading, which is very small and therefore hardly perceptible in this representation due to the large number of scans with comparativelysmall variability. A clear size dependence and seasonal trends in κ(S,Da) levels can be observed. The averaged number size distributionsshow very pronounced seasonal differences.
ents (i.e., sulfate, ammonium, and potassium). In the sizerange around DH, which separates the (apparently) chemi-cally distinct aerosol populations of Aitken and accumula-tion modes, a step-like increase in κ(S,Da) is observed. Thehighest seasonally averaged κ(S,Da) values (up to 0.28) areobserved during intrusion of dust, marine sulfate, and sea-salt-rich LRT plumes. Note that short-term peaks in κ(S,Da)can be even higher; see case studies in Part 2 (M. L. Pöh-lker et al., 2017a). In the absence of LRT, the κAcc valuesare also rather stable for most of the year and range between0.21 and 0.24. Overall, a remarkable observation is the highsimilarity between the wet and dry season κ(S,Da) size dis-tributions, while many other aerosol parameters undergo sub-stantial seasonal variations (Andreae et al., 2015).
The κ(S,Da) levels reported here agree well with the cor-responding results in the previous Amazonian CCN studiesby Gunthe et al. (2009) and Whitehead et al. (2016), whichrange between 0.1 and 0.4, with a mean around 0.16± 0.06.In a wider context, our results also agree well with previ-ous long-term measurements at other continental backgroundlocations (i.e., alpine, semi-arid, and boreal sites) (Jurányiet al., 2011; Levin et al., 2012; Paramonov et al., 2013;Mikhailov et al., 2015). Comparing these four sites witheach other, the following observations can be made. (i) κAittends to be smaller than κAcc at all four background loca-tions. (ii) At the alpine, semi-arid, and boreal sites, κ(S,Da)undergoes a rather gradual increase from the Aitken- tothe accumulation-mode size range (Paramonov et al., 2013,
and references therein), whereas this increase appears to besteeper (step-like) in the Amazon. This can clearly be seenin the present study (e.g., Fig. 3) as well as in Gunthe etal. (2009) and Whitehead et al. (2016). (iii) Particularly inthe vegetated environments (i.e., tropical, boreal, and semi-arid forests), κAit mostly ranges between 0.1 and 0.2, sug-gesting that the Aitken-mode particles predominantly com-prise organic constituents. Furthermore, κAit shows a remark-ably small seasonality for these locations. (iv) The κAcc levelsshow a much wider variability throughout the seasons for alllocations.
Figure 7 presents the diurnal cycles in κmean for the fourseasonal periods of interest. No perceptible diurnal trends inκmean can be observed for any of the seasons. The only ob-servable difference is an increased variability of κmean dur-ing the LRT season (see error bars in Fig. 7a). This can beexplained by the episodic character of LRT intrusions, whichcauses an “alternating pattern” of clean periods with back-ground conditions and periods of elevated concentrations ofLRT aerosol (M. L. Pöhlker et al., 2017a). For comparison,the diurnal cycles in NCN concentration have been added toFig. 7, which confirm the absence of strong diurnal variationsin the aerosol population.
15722 M. L. Pöhlker et al.: Long-term observations of cloud condensation nuclei in the Amazon rain forest – Part 1
Figure 7. Diurnal cycles in hygroscopicity parameter, κmean, and total aerosol number concentration, NCN, subdivided into seasonal periodsof interest as specified in Sect. 3.3. No diurnal trend is detectable throughout the year. Note that the range of 1 standard deviation ofκmean around the mean is surprisingly small given that long seasonal time periods and data from all S levels have been averaged. The onlyperceptible difference is a larger scattering during a period with LRT influence (a). Grey and yellow shading indicate night and day.
3.4 Aerosol chemical composition and effectivehygroscopicity
Continuous ACSM measurements are being conducted at theATTO site since March 2014, providing online and non-size-resolved information on the chemical composition ofthe non-refractory aerosol (Andreae et al., 2015). Here, wecompare the ACSM data on the aerosol’s chemical compo-sition with the CCNC-derived κ(S,Da) values. This analysisfocuses on the dry season months, when ACSM and CCNCwere operated in parallel.5 Note that the ACSM covers a sizerange from 75 to 650 nm (Ng et al., 2010), while the size-resolved CCN measurements provide information only up toparticle sizes of about 170 nm. Since the ACSM records thesize-integrated masses of defined chemical species (organics,
5Although the ACSM measurements were started inMarch 2014, instrumental issues during the initial monthscaused some uncertainty for the corresponding data. Thus, for thisstudy, we focus only on the data period August to December 2014,when the instrumental issues were resolved.
nitrate, sulfate, ammonium, and chloride), the results tend tobe dominated by the fraction of larger particles with com-paratively high masses (i.e., in the accumulation-mode sizerange) and are influenced less by the fraction of small parti-cles with comparatively low masses (i.e., in the Aitken-modesize range). Thus, in order to increase the comparability be-tween ACSM and CCNC, we have chosen the lowest S level(S= 0.11± 0.01 %), which represents the largest measuredDa(S) (Da(S)= 172± 12 nm).
In Fig. 8, the κ(0.11 %,Da) values are plotted againstthe ACSM-derived organic mass fraction (forg). The datawere fitted with (i) a linear fit and (ii) a bivariate regres-sion according to Cantrell (2008). A linear fit approachwas used by Gunthe et al. (2009) to determine the effec-tive hygroscopicity parameters κorg= 0.1 of biogenic Ama-zonian SOA (forg= 1) and κinorg= 0.6 for the inorganic frac-tion (forg= 0). For the present data set, the same proce-dure results in an acceptable coefficient of determination(R2= 0.66). We estimated the effective hygroscopicity pa-
rameters κorg = 0.12± 0.01 and κinorg = 0.61± 0.01 based
Figure 8. Correlation between κ(0.11 %,∼ 170 nm) and the organicmass fraction, forg, determined by the ACSM during the dry seasonmonths. The data were fitted by a linear and a bivariate regressionfit. Shading of the fit lines shows the standard error of the fit. The er-ror bars of the data markers represent the experimental error, whichis estimated as 5 % for forg and 10 % for κ(0.11 %, ∼ 170 nm).
on the linear fit and extrapolation to forg= 1 and forg= 0,respectively. This is in good agreement with previous studies(King et al., 2007; Engelhart et al., 2008; Gunthe et al., 2009;Rose et al., 2011). However, a drawback of the linear fittingapproach is the fact that swapping forg and κ(0.11 %,Da) onthe axes will change the results.
Therefore, we also applied the bivariate regression fit,which takes into account that both parameters, forg andκ(0.11 %,Da), have an experimental error. For the bivariateregression, an error of 5 % in forg and an error of 10 % inκ(0.11 %,Da) were used. A coefficient of determination ofR2= 0.71 was obtained for the bivariate regression, which
is slightly better than for the linear fit. Based on the bivari-ate regression, we estimated effective hygroscopicity param-eters κorg = 0.10± 0.01 and κinorg = 0.71± 0.01 for the or-ganic and inorganic fractions, respectively.
3.5 CCN parametrizations and prediction of CCNnumber concentrations
Cloud-resolving models at all scales – spanning from largeeddy simulations (LESs) to global climate models (GCMs) –require simple and efficient parametrizations of the complexmicrophysical basis to adequately reflect the spatiotemporalCCN cycling (Cohard et al., 1998; Andreae, 2009). Previ-ously, several different approaches to predict CCN concen-
trations have been suggested (Andreae, 2009; Gunthe et al.,2009; Rose et al., 2010; Deng et al., 2013). Any parametriza-tion strategy seeks, on one hand, an efficient combination ofa minimal set of input data and, on the other hand, a goodrepresentation of the atmospheric CCN population.
The detailed analysis in this study has shown that the CCNpopulation in the central Amazon is mainly defined by com-paratively stable κ(S,Da) levels, due to the predominanceof organic aerosol particles, and rather pronounced seasonaltrends in aerosol number size distribution. Particularly, theremarkably stable κ(S,Da) values suggest that the Amazo-nian CCN cycling can be parametrized rather precisely forefficient prediction of CCN concentrations. In the follow-ing paragraphs, we apply the following CCN parametrizationstrategies to the present data set and explore their strengthsand limitations:
i. CCN prediction based on the correlation be-tween NCCN(0.4 %) and NCN, called the1NCCN(0.4 %)/1NCN parametrization here;
ii. CCN prediction based on the correla-tion between NCCN(S) and cCO, called the1NCCN(S)/1cCO parametrization here;
iii. CCN prediction based on analytical fit functions of ex-perimentally obtained CCN spectra, called CCN spectraparametrization;
iv. CCN prediction based on the κ-Köhler model, called κ-Köhler parametrization; and
v. CCN prediction based on a novel and effectiveparametrization built on CCN efficiency spectra, calledCCN efficiency spectra parametrization.
The prediction accuracy for the individual strategies issummarized in Table 3.
3.5.1 1NCCN(0.4 %)/1NCN parametrization
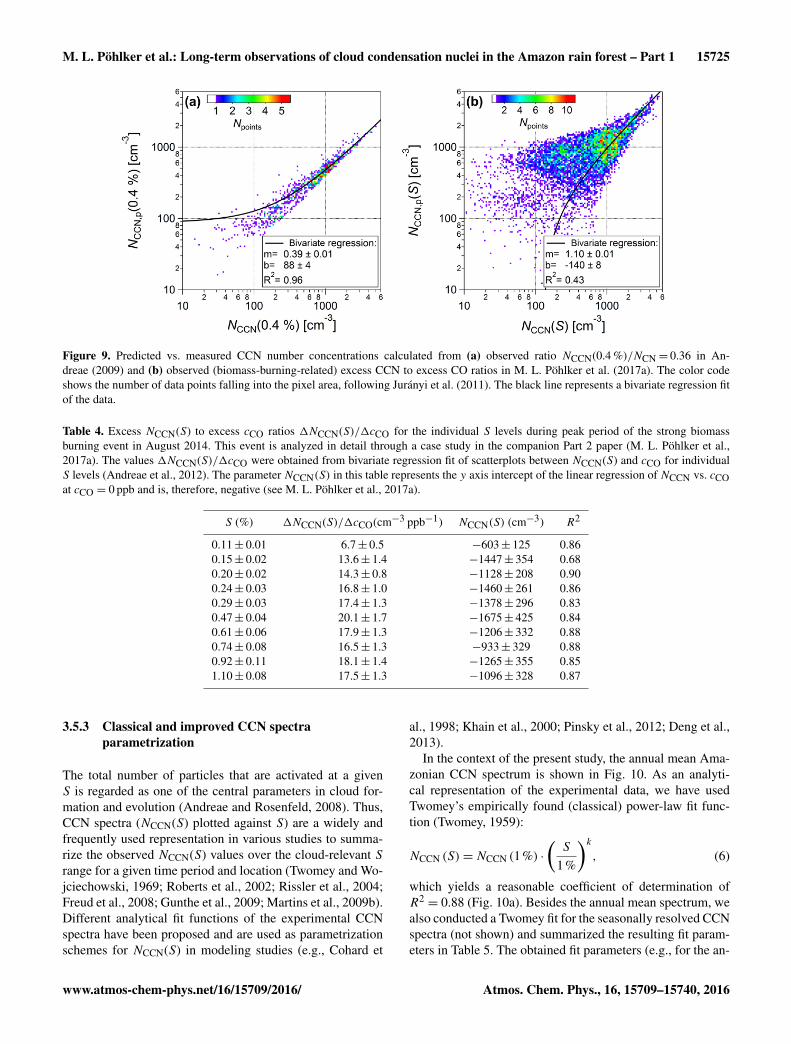
Andreae (2009) analyzed CCN data sets from several con-trasting field sites worldwide and found significant re-lationships between the satellite-retrieved aerosol opticalthickness (AOT) and the corresponding NCCN(0.4 %) lev-els as well as between the total aerosol number con-centration NCN and NCCN(0.4 %). The obtained ratioNCCN(0.4 %)/NCN= 0.36± 0.14 – in other words, the glob-ally averaged CCN efficiency at S= 0.4 % – can be used topredict CCN concentrations. The corresponding results forthe present data set are displayed in Fig. 9a and show asurprisingly tight correlation, given that a globally obtainedNCCN(0.4 %)/NCN ratio has been used. However, Fig. 9aalso shows a systematic underestimation of the predictedCCN concentration NCCN,p(0.4 %), which can be explainedby the comparatively high activated fractions in the Ama-zon (e.g., NCCN(0.47 %)/NCN,10 ranging from 0.6 to 0.9;
15724 M. L. Pöhlker et al.: Long-term observations of cloud condensation nuclei in the Amazon rain forest – Part 1
Table3.
Characteristic
deviationbetw
eenobserved
andpredicted
CC
Nnum
berconcentrations
–N
CC
N(S)
andN
CC
N,p (S)
–based
ondifferent
parametrization
schemes,
ac-cording
toR
oseet
al.(2008).
Forevery
parametrization
scheme
andresolved
byS,
thefollow
inginform
ationis
provided:(i)
arithmetic
mean
valuesof
therelative
bias1
bias NC
CN
(S)=
(NC
CN
,p (S)−N
CC
N(S))/N
CC
N(S)and
(ii)ofthetotalrelative
deviation1
devN
CC
N(S)=|N
CC
N,p (S
)−N
CC
N(S)|/N
CC
N(S).
S(%
)1N
CC
N(S)/1N
CN
1N
CC
N(S)/1cC
OFits
ofCC
Nspectra
κ-Köhler
ErffitofC
CN
efficiencyspectra
Twom
eypow
er-lawfit
Erffit
Annualaverage
Resolved
byseasons
annualseasonal
annualseasonal
biasdev
biasdev
biasdev
biasdev
biasdev
biasdev
biasdev
biasdev
biasdev
biasdev
biasdev
0.11±
0.01–
–1.48
1.754.68
4.751.50
1.572.54
2.810.61
0.890.18
0.220.64
0.740.24
0.440.39
0.530.14
0.360.15±
0.02–
–0.50
1.212.78
2.990.71
0.922.42
2.690.62
0.850.07
0.110.27
0.470.10
0.320.15
0.360.04
0.270.20±
0.02–
–2.84
2.962.46
2.750.59
0.852.60
2.860.70
0.910.11
0.130.22
0.430.13
0.300.14
0.330.08
0.240.24±
0.03–
–1.78
1.981.93
2.260.45
0.742.24
2.500.64
0.840.09
0.100.16
0.370.12
0.250.12
0.280.09
0.200.29±
0.03–
–2.19
2.331.74
2.090.40
0.712.12
2.390.62
0.820.14
0.140.22
0.420.14
0.250.17
0.320.11
0.200.40
−0.41
0.47–
––
––
––
––
––
––
––
––
––
–0.47±
0.04–
–1.33
1.541.36
1.730.33
0.631.70
1.930.50
0.710.04
0.060.09
0.260.07
0.160.08
0.200.06
0.120.61±
0.06–
–1.02
1.151.23
1.550.36
0.611.47
1.730.47
0.670.08
0.090.08
0.180.05
0.090.08
0.150.05
0.080.74±
0.08–
–1.50
1.591.22
1.510.40
0.621.37
1.630.44
0.640.09
0.100.09
0.160.04
0.060.09
0.140.04
0.060.92±
0.11–
–1.11
1.281.15
1.420.45
0.631.18
1.440.40
0.600.08
0.080.05
0.100.01
0.030.05
0.090.01
0.041.10±
0.08–
–1.12
1.251.11
1.350.48
0.641.05
1.310.35
0.570.08
0.080.04
0.08−
0.010.04
0.050.08
−0.01
0.05
All
––
1.501.73
2.002.27
0.570.80
1.892.15
0.540.75
0.100.11
0.190.33
0.100.20
0.140.25
0.060.17
see Fig. 1). Activated fractions in other locations worldwidetend to be lower due to the (more persistent) abundance ofnucleation-mode particles, as discussed in Sect. 3.1.
In Sect. 3.5.5, we will show that our novelparametrization is an extension of this approach: theNCCN(0.4 %)/NCN parametrization refers to a globallyaveraged CCN efficiency at one specific S, while the CCNefficiency spectra parametrization is based on an analyticaldescription of CCN efficiencies across the entire (relevant)S range and has been determined specifically for the centralAmazon.
3.5.2 1NCCN(S)/1cCO parametrization
Experimentally obtained excess NCCN(S) to excess cCOratios can be used to calculate NCCN,p(S). Kuhn et al. (2010)determined 1NCCN(0.6 %)/1cCO= ∼ 26 cm−3 ppb−1 forbiomass burning plumes and 1NCCN(0.6 %)/1cCO=
∼ 49 cm−3 ppb−1 for urban emissions in the areaaround Manaus, Brazil. Lawson et al. (2015) investi-gated biomass burning emissions in Australia and found1NCCN(0.5 %)/1cCO= 9.4 cm−3 ppb−1. In the context ofthe present study, we have calculated 1NCCN(S)/1cCO fora strong biomass burning event in August 2014. This eventand its impact on the CCN population is the subject of adetailed discussion in the companion Part 2 paper (M. L.Pöhlker et al., 2017a). Here, we use the 1NCCN(S)/1cCOratios from the companion paper to obtain a CCN pre-diction. The observed 1NCCN(S)/1cCO ratios rangebetween 6.7± 0.5 cm−3 ppb−1 (for S= 0.11 %) and valuesaround 18.0± 1.3 cm−3 ppb−1 (for higher S) (see summaryin Table 4). Since biomass burning is the dominant sourceof pollution in the central Amazon, these biomass-burning-related 1NCCN(S)/1cCO ratios in Table 4 were used tocalculate NCCN,p(S) for the present data set. The corre-sponding results in Fig. 9b show a reasonable correlationfor highly polluted conditions (NCN > 2000 cm−3) and apoor correlation for cleaner states (NCN < 2000 cm−3).This behavior can be explained by the fact that the highconcentrations in CCN and CO originate from frequentbiomass burning plumes during the Amazonian dry season(see Fig. 1). Thus, they can be assigned to the same sourceswith rather defined 1NCCN(S)/1cCO ratios (Andreae et al.,2012). During the contrasting cleaner periods, CN and COoriginate from a variety of different sources, which are oftennot related and therefore explain the poor correlation forclean to semi-polluted conditions. Overall, Fig. 9b indicatesthat the quality of CO-based CCN prediction is rather poor,due to the complex interplay of different sources. The overalldeviation between NCCN,p(S) and NCCN(S) for this approachis about 170 % (Table 3).
M. L. Pöhlker et al.: Long-term observations of cloud condensation nuclei in the Amazon rain forest – Part 1 15725
Figure 9. Predicted vs. measured CCN number concentrations calculated from (a) observed ratio NCCN(0.4 %)/NCN= 0.36 in An-dreae (2009) and (b) observed (biomass-burning-related) excess CCN to excess CO ratios in M. L. Pöhlker et al. (2017a). The color codeshows the number of data points falling into the pixel area, following Jurányi et al. (2011). The black line represents a bivariate regression fitof the data.
Table 4. Excess NCCN(S) to excess cCO ratios 1NCCN(S)/1cCO for the individual S levels during peak period of the strong biomassburning event in August 2014. This event is analyzed in detail through a case study in the companion Part 2 paper (M. L. Pöhlker et al.,2017a). The values 1NCCN(S)/1cCO were obtained from bivariate regression fit of scatterplots between NCCN(S) and cCO for individualS levels (Andreae et al., 2012). The parameter NCCN(S) in this table represents the y axis intercept of the linear regression of NCCN vs. cCOat cCO = 0 ppb and is, therefore, negative (see M. L. Pöhlker et al., 2017a).
3.5.3 Classical and improved CCN spectraparametrization
The total number of particles that are activated at a givenS is regarded as one of the central parameters in cloud for-mation and evolution (Andreae and Rosenfeld, 2008). Thus,CCN spectra (NCCN(S) plotted against S) are a widely andfrequently used representation in various studies to summa-rize the observed NCCN(S) values over the cloud-relevant Srange for a given time period and location (Twomey and Wo-jciechowski, 1969; Roberts et al., 2002; Rissler et al., 2004;Freud et al., 2008; Gunthe et al., 2009; Martins et al., 2009b).Different analytical fit functions of the experimental CCNspectra have been proposed and are used as parametrizationschemes for NCCN(S) in modeling studies (e.g., Cohard et
al., 1998; Khain et al., 2000; Pinsky et al., 2012; Deng et al.,2013).
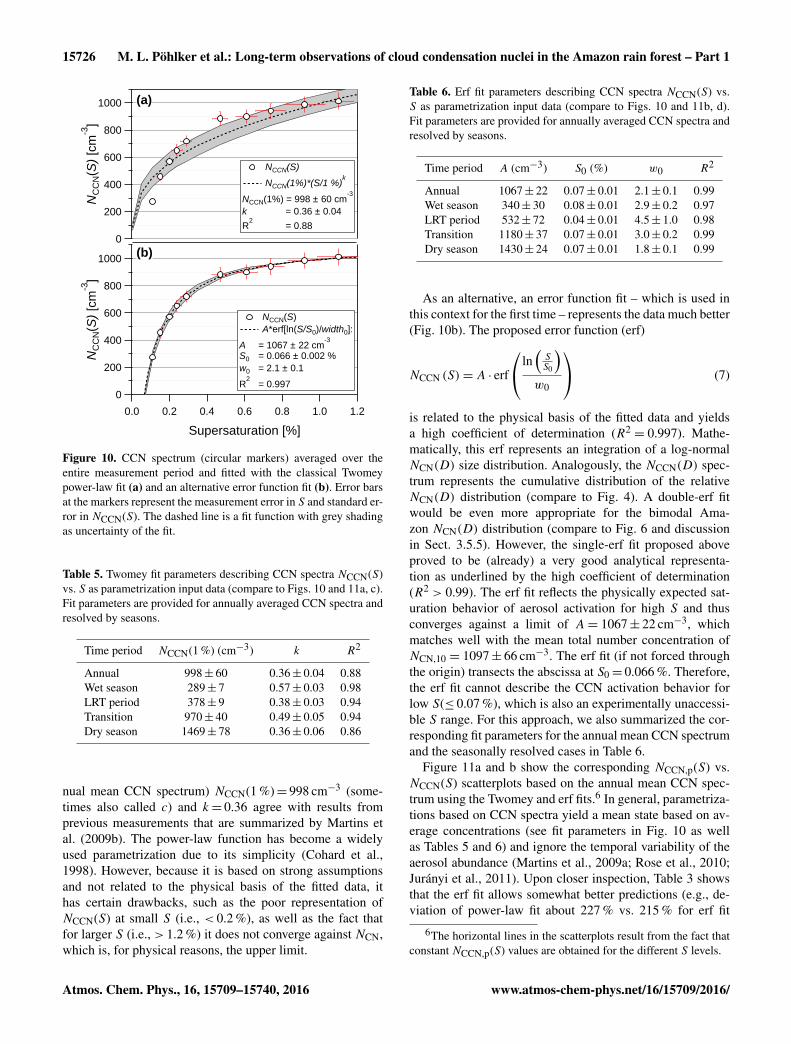
In the context of the present study, the annual mean Ama-zonian CCN spectrum is shown in Fig. 10. As an analyti-cal representation of the experimental data, we have usedTwomey’s empirically found (classical) power-law fit func-tion (Twomey, 1959):
NCCN (S)=NCCN (1%) ·(S
1%
)k, (6)
which yields a reasonable coefficient of determination ofR2= 0.88 (Fig. 10a). Besides the annual mean spectrum, we
also conducted a Twomey fit for the seasonally resolved CCNspectra (not shown) and summarized the resulting fit param-eters in Table 5. The obtained fit parameters (e.g., for the an-
15726 M. L. Pöhlker et al.: Long-term observations of cloud condensation nuclei in the Amazon rain forest – Part 1
1000
800
600
400
200
0
NC
CN(S
) [c
m-3
]
1.21.00.80.60.40.20.0
Supersaturation [%]
1000
800
600
400
200
0
NC
CN(S
) [c
m-3
]
NCCN(S) A*erf[ln(S/S0)/width0]:
A = 1067 ± 22 cm-3
S0 = 0.066 ± 0.002 %w0 = 2.1 ± 0.1
R2
= 0.997
NCCN(S)
NCCN(1%)*(S/1 %)k
NCCN(1%) = 998 ± 60 cm-3
k = 0.36 ± 0.04
R2
= 0.88
(a)
(b)
Figure 10. CCN spectrum (circular markers) averaged over theentire measurement period and fitted with the classical Twomeypower-law fit (a) and an alternative error function fit (b). Error barsat the markers represent the measurement error in S and standard er-ror in NCCN(S). The dashed line is a fit function with grey shadingas uncertainty of the fit.
Table 5. Twomey fit parameters describing CCN spectra NCCN(S)vs. S as parametrization input data (compare to Figs. 10 and 11a, c).Fit parameters are provided for annually averaged CCN spectra andresolved by seasons.
Time period NCCN(1 %) (cm−3) k R2
Annual 998± 60 0.36± 0.04 0.88Wet season 289± 7 0.57± 0.03 0.98LRT period 378± 9 0.38± 0.03 0.94Transition 970± 40 0.49± 0.05 0.94Dry season 1469± 78 0.36± 0.06 0.86
nual mean CCN spectrum) NCCN(1 %)= 998 cm−3 (some-times also called c) and k= 0.36 agree with results fromprevious measurements that are summarized by Martins etal. (2009b). The power-law function has become a widelyused parametrization due to its simplicity (Cohard et al.,1998). However, because it is based on strong assumptionsand not related to the physical basis of the fitted data, ithas certain drawbacks, such as the poor representation ofNCCN(S) at small S (i.e., < 0.2 %), as well as the fact thatfor larger S (i.e., > 1.2 %) it does not converge against NCN,which is, for physical reasons, the upper limit.
Table 6. Erf fit parameters describing CCN spectra NCCN(S) vs.S as parametrization input data (compare to Figs. 10 and 11b, d).Fit parameters are provided for annually averaged CCN spectra andresolved by seasons.
As an alternative, an error function fit – which is used inthis context for the first time – represents the data much better(Fig. 10b). The proposed error function (erf)
NCCN (S)= A · erf
ln(SS0
)w0
(7)
is related to the physical basis of the fitted data and yieldsa high coefficient of determination (R2
= 0.997). Mathe-matically, this erf represents an integration of a log-normalNCN(D) size distribution. Analogously, the NCCN(D) spec-trum represents the cumulative distribution of the relativeNCN(D) distribution (compare to Fig. 4). A double-erf fitwould be even more appropriate for the bimodal Ama-zon NCN(D) distribution (compare to Fig. 6 and discussionin Sect. 3.5.5). However, the single-erf fit proposed aboveproved to be (already) a very good analytical representa-tion as underlined by the high coefficient of determination(R2 > 0.99). The erf fit reflects the physically expected sat-uration behavior of aerosol activation for high S and thusconverges against a limit of A= 1067± 22 cm−3, whichmatches well with the mean total number concentration ofNCN,10 = 1097± 66 cm−3. The erf fit (if not forced throughthe origin) transects the abscissa at S0= 0.066 %. Therefore,the erf fit cannot describe the CCN activation behavior forlow S(≤ 0.07 %), which is also an experimentally unaccessi-ble S range. For this approach, we also summarized the cor-responding fit parameters for the annual mean CCN spectrumand the seasonally resolved cases in Table 6.
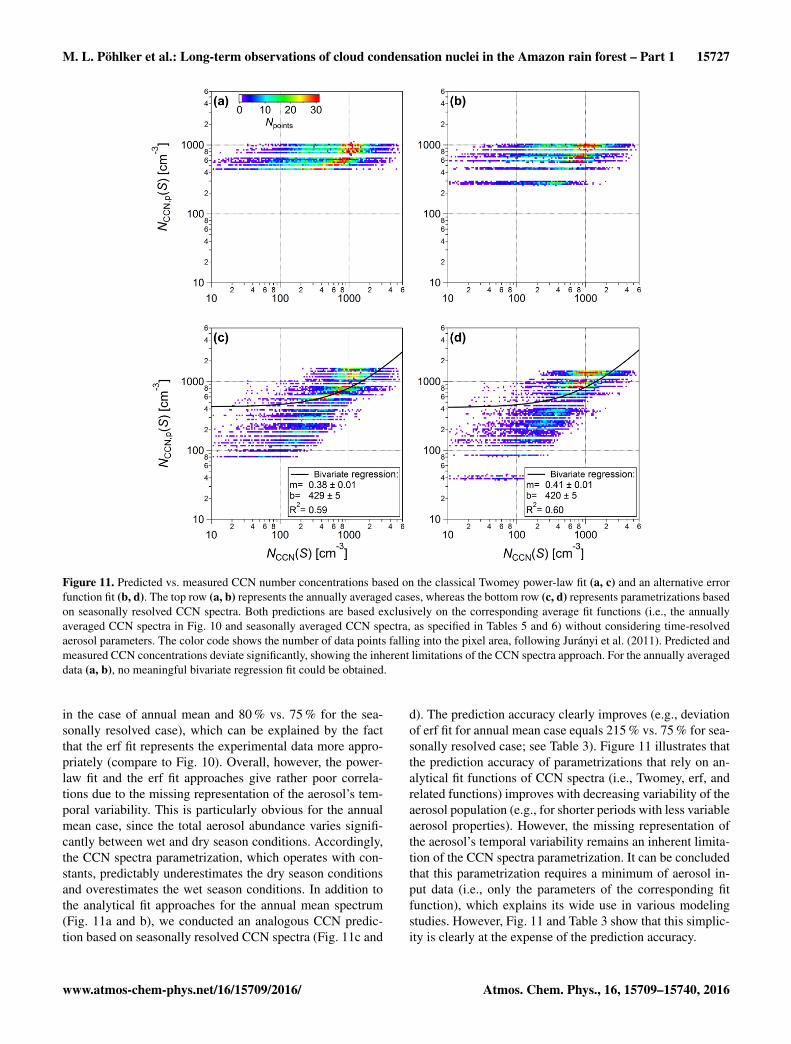
Figure 11a and b show the corresponding NCCN,p(S) vs.NCCN(S) scatterplots based on the annual mean CCN spec-trum using the Twomey and erf fits.6 In general, parametriza-tions based on CCN spectra yield a mean state based on av-erage concentrations (see fit parameters in Fig. 10 as wellas Tables 5 and 6) and ignore the temporal variability of theaerosol abundance (Martins et al., 2009a; Rose et al., 2010;Jurányi et al., 2011). Upon closer inspection, Table 3 showsthat the erf fit allows somewhat better predictions (e.g., de-viation of power-law fit about 227 % vs. 215 % for erf fit
6The horizontal lines in the scatterplots result from the fact thatconstant NCCN,p(S) values are obtained for the different S levels.
M. L. Pöhlker et al.: Long-term observations of cloud condensation nuclei in the Amazon rain forest – Part 1 15727
Figure 11. Predicted vs. measured CCN number concentrations based on the classical Twomey power-law fit (a, c) and an alternative errorfunction fit (b, d). The top row (a, b) represents the annually averaged cases, whereas the bottom row (c, d) represents parametrizations basedon seasonally resolved CCN spectra. Both predictions are based exclusively on the corresponding average fit functions (i.e., the annuallyaveraged CCN spectra in Fig. 10 and seasonally averaged CCN spectra, as specified in Tables 5 and 6) without considering time-resolvedaerosol parameters. The color code shows the number of data points falling into the pixel area, following Jurányi et al. (2011). Predicted andmeasured CCN concentrations deviate significantly, showing the inherent limitations of the CCN spectra approach. For the annually averageddata (a, b), no meaningful bivariate regression fit could be obtained.
in the case of annual mean and 80 % vs. 75 % for the sea-sonally resolved case), which can be explained by the factthat the erf fit represents the experimental data more appro-priately (compare to Fig. 10). Overall, however, the power-law fit and the erf fit approaches give rather poor correla-tions due to the missing representation of the aerosol’s tem-poral variability. This is particularly obvious for the annualmean case, since the total aerosol abundance varies signifi-cantly between wet and dry season conditions. Accordingly,the CCN spectra parametrization, which operates with con-stants, predictably underestimates the dry season conditionsand overestimates the wet season conditions. In addition tothe analytical fit approaches for the annual mean spectrum(Fig. 11a and b), we conducted an analogous CCN predic-tion based on seasonally resolved CCN spectra (Fig. 11c and
d). The prediction accuracy clearly improves (e.g., deviationof erf fit for annual mean case equals 215 % vs. 75 % for sea-sonally resolved case; see Table 3). Figure 11 illustrates thatthe prediction accuracy of parametrizations that rely on an-alytical fit functions of CCN spectra (i.e., Twomey, erf, andrelated functions) improves with decreasing variability of theaerosol population (e.g., for shorter periods with less variableaerosol properties). However, the missing representation ofthe aerosol’s temporal variability remains an inherent limita-tion of the CCN spectra parametrization. It can be concludedthat this parametrization requires a minimum of aerosol in-put data (i.e., only the parameters of the corresponding fitfunction), which explains its wide use in various modelingstudies. However, Fig. 11 and Table 3 show that this simplic-ity is clearly at the expense of the prediction accuracy.
15728 M. L. Pöhlker et al.: Long-term observations of cloud condensation nuclei in the Amazon rain forest – Part 1
10
2
4
68
100
2
4
68
1000
2
4
6N
CC
N,p
(S)
[cm
-3]
102 4 6 8
1002 4 6 8
10002 4 6
NCCN(S) [cm-3
]
ivariate regresion:m= 1.06 ± 0.01b= 10 ± 2
R2= 0.99
3020100Npoints
B
Figure 12. Predicted vs. measured CCN number concentrations us-ing the κ-Köhler model approach. This approach requires the fol-lowing time-resolved aerosol input data: (i) time-resolved aerosolsize spectra spanning the CCN-relevant range (e.g., SMPS) and(ii) annual average κ values for the Aitken and accumulation sizerange (κAit= 0.14 and κAcc= 0.22). The color code shows the num-ber of data points falling into the pixel area, following Jurányi etal. (2011). The black line represents a bivariate regression fit of thedata.
3.5.4 κ-Köhler parametrization
The κ-Köhler model approach has been used in previousstudies and gave good CCN predictions (e.g., Gunthe etal., 2009; Rose et al., 2010). For the present data set, theNCCN,p(S) concentrations were calculated according to Roseet al. (2010).7 Here, the annually averaged values κAit= 0.14and κAcc= 0.22 were used for the CCN prediction, sincethey accurately represent the stable κ levels in the centralAmazon. Figure 12 shows the corresponding NCCN,p(S) vs.NCCN(S) scatterplot, in which the areas with the highest den-sity of data points precisely follow the one-to-one line. Ta-ble 3 underlines this good agreement, as the observed de-viation of around 10 % between NCCN,p(S) and NCCN(S) isthe smallest among all tested parametrizations. Accordingly,the κ-Köhler model approach turns out to be a very accurateparametrization. However, it requires a time series of NCNsize distributions as input data and is therefore the most “datademanding” strategy in this regard.
3.5.5 CCN efficiency spectra parametrization
It has to be kept in mind that CCN spectra strongly depend onthe total aerosol concentration and thus predominantly reflect
7Briefly, for every SMPS scan, the NCN size distribution hasbeen integrated above the critical diameter Da , in which Da hasbeen obtained based on a given κ and S.
1.0
0.8
0.6
0.4
0.2
0.0
NC
CN(S
)/N
CN
,Dcu
t
1.21.00.80.60.40.20.0
Supersaturation [%]
NCCN(S)/NCN,10
NCCN(S)/NCN,50
erf of NCCN(S)/NCN,10
erf of NCCN(S)/NCN,50
Figure 13. CCN efficiency spectra averaged over the entire mea-surement period for the reference concentrations, NCN,10 andNCN,50. The fit functions are error function fits (the dashed linewith shading represents the uncertainty of the fit). The error bars atthe markers represent the measurement error in S and 1 standard de-viation (not the standard error as in Fig. 10) in NCCN(S)/NCN,Dcut .
the specific (temporary) aerosol population during the periodof the study. The shape of CCN spectra provides some in-formation on the aerosol activation behavior as a function ofS. However, the strong variability in the total aerosol abun-dance makes it difficult to compare the CCN efficiency be-havior between different locations and/or periods of interestwith specific (e.g., seasonal) conditions. For the present dataset, Fig. 13 shows annually averaged CCN efficiency spectra(NCCN(S)/NCN,Dcut plotted against S) for two different ref-erence aerosol concentrations NCN,10 and NCN,50.8 The cor-responding fit parameters are summarized in Table 7. TheCCN efficiency spectra are independent of the total aerosolload and instead reflect the fraction of activated particles forthe relevant S range. Here, we also use an erf fit,
NCCN(S)
NCN,Dcut
=12+
12· erf
ln(SS1
)w1
, (8)
to describe the data for the same reasons as outlined inSect. 3.5.3. The fits yield high coefficients of determination(R2= 0.99). Per definition, NCCN(S)/NCN,Dcut spans from
zero to unity. Therefore, the offset y0 of the function as wellas the pre-factor A have been set to 0.5. For the atmospher-ically relevant S range – typically S < 0.6 % (see Andreae,2009) – aerosol sizes around 50–60 nm are considered theonset of the CCN size range (see also Fig. 4). Accordingly,if Dcut is chosen close to this activation threshold, the corre-sponding NCCN(S)/NCN,Dcut approaches unity, which can beseen in Fig. 13. The free variable S1 (e.g., S1= 0.22± 0.01 %forNCN,10 and S1= 0.19± 0.01 % forNCN,50) represents the
8The use of aerosol number concentrations with Dcut= 50 nmhas been suggested by Paramonov et al. (2015) as a reference valueto ensure comparability of CCN efficiencies from different studies.
M. L. Pöhlker et al.: Long-term observations of cloud condensation nuclei in the Amazon rain forest – Part 1 15729
Table 7. Erf fit parameters describing CCN efficiency spectraNCCN(S)/NCN,Dcut vs. S as model input data (compare to Figs. 13and 14). Fit parameters are provided for (i) annually averaged ef-ficiency spectra with five different aerosol number reference con-centrations NCN,Dcut and (ii) resolved by seasons for NCN,10 andNCN,50.
Wet season 0.35± 0.01 1.80± 0.06 0.99LRT period 0.22± 0.01 2.39± 0.10 0.98Transition 0.28± 0.01 1.70± 0.05 0.99Dry season 0.18± 0.01 1.57± 0.11 0.98
NCN,50
Wet season 0.26± 0.01 1.37± 0.12 0.99LRT period 0.17± 0.01 1.58± 0.10 0.99Transition 0.23± 0.01 1.38± 0.04 0.99Dry season 0.17± 0.01 1.31± 0.06 0.92
S value where half of the aerosol particles are activated intocloud droplets. A monodisperse aerosol with a defined com-position would yield a steep step-like CCN efficiency spec-trum, while the complex Amazonian aerosol results in a wideand rather smooth “step”. In other words, the width of the erffit (here w1= 1.78± 0.08 for NCN,10 and w1= 1.41± 0.05for NCN,50) is an (indirect) measure for the diversity (i.e.,size and composition) of the aerosol population.
Figure 14 shows a direct comparison of the CCN effi-ciency spectra resolved by seasonal periods of interest (com-pare also to Sect. 3.3), which reveals characteristic differ-ences in the curve’s shape (i.e., its “steepness”). The cor-responding fit parameters are summarized in Table 7. Agood numeric indicator for the differences in “steepness”is the fit parameter S1, which specifies the 50 % activa-tion supersaturation of the total aerosol population. Thelargest contrast in shape and S1 can be seen between thedry and wet season scenario: during the dry season, theCCN efficiency increases steeply with S, and S1 is reachedat 0.18 % for NCN,10, whereas during the wet season, theincrease of the CCN efficiency is rather gradual and S1is reached only at 0.35 % for NCN,10. The transition pe-riod represents (once more) an intermediate state betweenthe dry and wet season extremes (S1= 0.28 % for NCN,10).For transition period conditions, Kuhn et al. (2010) reportedNCCN(0.6 %)/NCN= 0.66± 0.15, which is in good agree-ment with Fig. 14c (NCCN(0.61 %)/NCN,10= 0.72± 0.10).
The observed differences among the CCN efficiency spec-tra in Fig. 14 reflect some of the major trends in the aerosolseasonality in Amazonia. A closer look at Fig. 6 helps tounderstand those. Overall, the key parameters in the CCNactivation behavior are (primarily) the aerosol number size
distribution and, in a secondary role, the particles’ chemicalcomposition, represented by κ(S,Da) (Dusek et al., 2006).Thus, the seasonally averaged number size distributions andthe seasonally averaged κ(S,Da) size distribution in Fig. 6have to be considered to explain the different shapes inFig. 14. Focusing on the contrasting wet and dry seasonplots, it can be stated that (i) while the κ(S,Da) size distri-butions for wet and dry seasons appear to be very similar(same size trend and same values), the number size distribu-tions (i.e., the ratio of Aitken and accumulation modes) differsubstantially. (ii) With increasing S, the diameter Da(S) de-creases and is shifted from the accumulation-mode towardsthe Aitken-mode size range. (iii) Thus, under dry seasonconditions, comparatively small S levels (S= 0.11–0.2 %)can already activate most particles of the pronounced ac-cumulation mode. (iv) In contrast, under wet season condi-tions, while the same S levels still activate the accumulation-mode particles, the comparatively strong Aitken mode re-mains unactivated. This means that the ratio of Aitken- andaccumulation-mode particles (NCN,Ait/NCN,Acc(wet)= 1.7;NCN,Ait/NCN,Acc(dry)= 0.4; compare to Table 2) determinesthe activated fraction as a function of S and thus also thesteepness of the CCN efficiency spectra in Fig. 14.
While size appears as the dominant parameter in the CCNactivation behavior, in certain cases variability in chemicalcomposition also matters (Dusek et al., 2006). In Fig. 14,this can be seen for the wet season cases with and withoutLRT influence: in the presence of LRT aerosol, the 50 % ac-tivation occurs already at S1= 0.22 % for NCN,10, which ismuch closer to the dry (S1= 0.18 % for NCN,10) than to thewet season (S1= 0.35 % for NCN,10) behavior. While Fig. 6shows that the number size distributions for both cases aresimilar, the observed difference in Fig. 14 can be explainedby the deviations in the corresponding κ(S,Da) size distri-butions. In other words, the elevated κ(S,Da) levels duringthe intrusion of LRT aerosols allows the activation of parti-cle sizes that remain inactivated at the lower κ(S,Da) levelsin the absence of LRT aerosol. Therefore, the differences inchemical composition can explain the decreased S1 in thesecases.
In Fig. 14, single-erf fits have been used as analytical de-scriptions of the CCN efficiency spectra. Overall, this ap-proach provides a good representation of the experimentaldata (see high coefficients of determination in Table 5). How-ever, the single-erf fit is merely an approximation, assum-ing that the aerosol size distribution is monomodal. This isa valid assumption for the dry season (see Fig. 6) and cor-responds to a good agreement between fit and data pointsin Fig. 14d. In contrast, the wet season shows pronouncedand prevailing bimodal size distributions (see Fig. 6), whichcorresponds to a clear discrepancy between the fit and datapoints in Fig. 14b (i.e., for S > 0.3 %). For a bimodal sizedistribution, a double-erf fit is the physically more appropri-ate description (see also discussion in Sect. 3.5.3). Figure 15illustrates the contrast between a single- and a double-erf fit
15730 M. L. Pöhlker et al.: Long-term observations of cloud condensation nuclei in the Amazon rain forest – Part 1
Figure 14. CCN efficiency spectra averaged over the entire measurement period for reference concentrations, NCN,10 and NCN,50, andsubdivided into seasonal periods of interest as specified in Sect. 3.3. The fit functions are error function fits (the dashed line with shadingrepresents the uncertainty of the fit). The error bars at the markers represent the measurement error in S and 1 standard deviation (not thestandard error, as in Fig. 10) in NCCN(S)/NCN,Dcut .
Figure 15. CCN efficiency spectrum for the wet season scenario(Fig. 14b) with NCN,50 as reference concentration. The experimen-tal data have been fitted with single- and double-erf fits (dashedlines with shading as uncertainty of the fits). The error bars at themarkers represent the measurement error in S and 1 standard devi-ation in NCCN(S)/NCN,50.
of the wet season CCN efficiency spectrum for NCN,50. Asexpected, the double-erf fit is clearly a better representationof the data across the entire S range. However, in the con-text of this study, the double-erf fit of CCN spectra merelyserves as proof of concept. It will be discussed in more detailin a follow-up study (M. L. Pöhlker et al., 2017b). Thus, inthe context of the following CCN parametrization, we willwork exclusively with the single-erf fit approach for the fol-lowing reasons: (i) the single-erf fit represents the simplerparametrization scheme (two fit parameters instead of six)and (ii) the difference in the CCN prediction accuracy ofsingle- vs. double-erf fit turns out to be insignificant.
Figure 16 explores the applicability of the CCN effi-ciency spectra parametrization (single-erf fits) to calculateCCN concentrations. The following four modifications ofthe parametrization scheme are compared: annually aver-aged CCN efficiency spectra with (i) Dcut= 10 nm and(ii) Dcut= 50 nm (compare to Fig. 13) as well as seasonallyresolved CCN efficiency spectra with (iii) Dcut= 10 nm, and(iv) Dcut= 50 nm (compare to Fig. 14). All cases in Fig. 16show rather tight correlations, which prove the high predic-tion accuracy of the CCN efficiency spectra parametriza-tion. The corresponding deviations between NCCN(S) and
M. L. Pöhlker et al.: Long-term observations of cloud condensation nuclei in the Amazon rain forest – Part 1 15731
Figure 16. Predicted vs. measured CCN number concentrations, based on our novel parametrization using time-resolved aerosol numberconcentrations and average error function fits of CCN efficiency spectra. The panels show the following four variations of the parametrization:(a) erf fit of the annually averaged NCCN(S)/NCN,10 vs. S efficiency plot, (b) erf fit of the annually averaged NCCN(S)/NCN,50 vs. Sefficiency plot, (c) erf fits of the NCCN(S)/NCN,10 vs. S efficiency plot, resolved by seasons, and (d) erf fits of the NCCN(S)/NCN,50 vs.S efficiency plot, resolved by seasons. This approach requires the following as input data: (i) a time series of total aerosol concentration(e.g., NCN,10 from a CPC measurement or NCN,50 as model output) and (ii) the parameters of the erf fit (e.g., as provided in Table 7). Thecolor code shows the number of data points falling into the pixel area, following Jurányi et al. (2011). The black line represents a bivariateregression fit of the data.
NCCN,p(S) are summarized in Table 3. The comparison con-firms that the cases with Dcut= 50 nm perform better thanDcut= 10 nm. Moreover, the seasonally resolved cases showhigher prediction accuracies than the annually averaged sce-narios. Thus, the highest deviation of 33 % is observed forthe case of Fig. 16a and the lowest deviation (and thereforebest performance) with 17 % for the case of Fig. 16d (seeTable 3).
In a way, the CCN efficiency spectra parametrization rep-resents a “compromise” between the previously introducedparametrization strategies: it operates with a comparativelysmall set of input data and still provides good prediction ac-
curacies. The input data require the fit parameters S1 andw1 of the single-erf fit, which reflects the “shape” of the fitfunctions. This part conveys the specific CCN activation be-havior of the given aerosol population (e.g., the wet seasonscenario). In addition, a time series of NCN,Dcut is required,which accounts for the temporal variability of the aerosolpopulation. The new parametrization approach is currentlyextended and applied to further data sets worldwide (M. L.Pöhlker et al., 2017b).
15732 M. L. Pöhlker et al.: Long-term observations of cloud condensation nuclei in the Amazon rain forest – Part 1
4 Conclusions
Size-resolved CCN measurements have been conducted atthe remote ATTO site in the central Amazon, spanning a fullseasonal cycle from March 2014 to February 2015. Thesemeasurements represent the first long-term study on CCNconcentrations and hygroscopicity in this unique and glob-ally important ecosystem. The reported measurements spanthe aerosol size range of 20–245 nm and therefore cover theAitken and accumulation modes, which dominate the aerosolburden in the Amazon throughout the year (Andreae et al.,2015). The supersaturation in the CCN counter was cycledthrough 10 levels from S= 0.11 % to S= 1.10 %. Overall,this study presents an in-depth analysis of the key CCNparameters, based on a continuous sequence of more than10 000 CCN activation curves with a temporal resolution of4.5 h and therefore allows a detailed analysis of the CCN cy-cling in the central Amazon Basin.
The Amazonian atmosphere reveals a characteristic bi-modal aerosol size distribution, which is dominated bypronounced Aitken and accumulation modes (DAit∼ 70 nmvs. DAcc∼ 150 nm) as well as the sparse occurrence ofnucleation-mode particles (< 30 nm). This size distributionclosely relates to the observed CCN properties, as its en-tire size range – and thus the majority of particles – fallinto the CCN-active range. Accumulation-mode particles areCCN active at supersaturations between 0.11 and 0.29 %,while supersaturations between 0.47 and 1.10 % activateboth the Aitken and accumulation modes. The absence ofnucleation-mode particles further explains the high activatedfractions NCCN(S)/NCN,10 that were observed throughoutall seasons, with NCCN(0.11 %)/NCN,10 reaching up to 0.4and NCCN(1.10 %)/NCN,10 constantly exceeding 0.9. Thesevalues are substantially higher than corresponding activatedfractions at other continental background sites worldwide(Jurányi et al., 2011; Levin et al., 2012; Paramonov et al.,2013). Overall, the CCN concentrations NCCN(S) for all Slevels closely follow the pronounced pollution-related sea-sonal cycle in NCN that is typical for the Amazon region.
The hygroscopicity parameter κ(S,Da), which reflects thechemical composition of the particles, appears to be remark-ably stable throughout the entire measurement period withonly a weak seasonal cycle and no perceptible diurnal trends.Numerically, the κ(S,Da) values lie within a rather narrowrange from 0.1 to 0.3 for most of the time. The mean hygro-scopicity averaged over the entire period and size range andits corresponding standard deviation is κmean= 0.17± 0.06.In terms of particle size, κ(S,Da) reveals a clear size de-pendence with lower values for the Aitken mode (κAit =
0.14± 0.03) and elevated levels in the accumulation-moderange (κAcc = 0.22± 0.05). Previous studies showed thatthe Amazonian aerosol population is dominated by organicaerosols throughout the seasons (Talbot et al., 1988, 1990;Graham et al., 2003; Gunthe et al., 2009; Martin et al., 2010b;Chen et al., 2015). The comparatively low κ(S,Da) values in
this study underline this observation. However, the observeddifference between κAit and κAcc shows that the Aitken modeis almost purely organic (close to κ = 0.1), while the accumu-lation mode is somewhat enriched in inorganic constituents.
Focusing on seasonal differences, substantial changes inthe aerosol concentrations and the shape of the size distri-bution have been observed. During the (clean) wet season,equally strong Aitken and accumulation modes were ob-served, while during the (polluted) dry season the accumu-lation mode overwhelms the Aitken mode. The transition pe-riods represent intermediate states between these extremes.Interestingly, the strong seasonal variability in aerosol abun-dance and sources does not correspond to noticeable changesin κ(S,Da). In other words, κAit and κAcc are almost iden-tical for dry and wet season conditions. The only seasonalperiod where κ(S,Da) deviates from its typical range is theLRT season when out-of-basin dust, marine sulfate, and seasalt are transported into the Amazon Basin. During this pe-riod, a significant increase in κAcc up to 0.28 is observed. Insummary, the seasonally averaged CCN populations (repre-sented by the CCN efficiency spectra) are mostly defined byparticle size (i.e., shape of aerosol size distribution). The onlyepisodes when (besides size) chemical variability also mat-ters are the LRT periods with their enhanced κ(S,Da) values.
Based on the CCN key parameters that have been obtainedin the present study, we show that the CCN population overAmazonia can be modeled very effectively. Different ap-proaches to infer a CCN concentration from basic aerosolparameters have been compared and it turns out that a re-markably good correlation between modeled and measureddata can be obtained based on continuous SMPS time seriesas well as the annually averaged κAit and κacc values fromthis study. Alternatively, CCN concentration can effectivelybe calculated based on our novel parametrization, which isbased on fitted CCN efficiency spectra and continuous timeseries of total aerosol number concentrations. These efficientapproaches to infer the Amazonian CCN population are ex-pected to help improve future modeling studies.
5 Data availability
The CCN data of this study has been deposited as aSupplement. The data is provided in NASA Ames for-mat (see British Atmospheric Data Centre (BADC), 2008).For specific data requests or detailed information on thedeposited data, please refer to the corresponding [email protected].
M. L. Pöhlker et al.: Long-term observations of cloud condensation nuclei in the Amazon rain forest – Part 1 15733
Appendix A
Table A1. List of symbols.
Symbol Quantity and unit
A CN number concentration derived from erf fit of CCN spectra, cm−3
a(S,Di) cumulative Gaussian fit of multi-charge CCN activation fraction at a given D and Sa(S,D) cumulative Gaussian fit of CCN activation fraction at a given ScCO CO mole fraction, ppbD mobility equivalent particle diameter, nmDa(S) midpoint activation diameter determined from CCN activation curve, nmDAit position of Aitken-mode maximum, nmDAcc position of accumulation-mode maximum, nmDcut lower cutoff diameter in aerosol number reference concentration NCN,Dcut , nmDH position of Hoppel minimum, nmf (Di) multiple-charged fraction at a given Dforg organic mass fractionfinorg inorganic mass fractionI number of chargesκ hygroscopicity parameterκ(S,Da) hygroscopicity parameter determined from CCN activation curveκAcc mean hygroscopicity parameter for accumulation-mode particlesκAit mean hygroscopicity parameter for Aitken-mode particlesκmean mean hygroscopicity parameter for all measured SMAF(S) maximum activated fraction determined by CCN activation curveN number of data pointsNCCN(S) CCN number concentration at a given S, cm−3
NCCN,p(S) predicted CCN number concentration at a given S, cm−3
NCCN(S,Da) CCN number concentration determined from CCN activation curve, cm−3
NCCN(S,D)/NCN(D) CCN activation fractionNCCN(S)/NCN,Dcut CCN efficiency for aerosol reference concentration NCN,DcutNCN,Dcut aerosol number reference concentration (>Dcut), cm−3
NCN,10 aerosol number reference concentration (> 10 nm), cm−3
NCN,50 aerosol number reference concentration (> 50 nm), cm−3
NCN,Acc CN number concentration for accumulation-mode particles, cm−3
NCN,Ait CN number concentration for Aitken-mode particles, cm−3
PATTO precipitation rate at ATTO site, mm day−1
PTRMM precipitation rate from TRMM mission, mm day−1
S water vapor supersaturation, %Sc critical supersaturation for CCN activation, %Scloud(DH,κ) average cloud peak supersaturation, %s(D) SMPS size distribution, cm−3
s(Di) multi-charge size distribution of D, cm−3
S0 abscissa transect of erf fit of CCN spectra, %S1 midpoint activation supersaturation determined from CCN efficiency spectra, %w0 width of erf fit of CCN spectraw1 width of erf fit of CCN efficiency spectrax0 position of mobility equivalent particle diameter, nmσ width of log-normal fit of Aitken and accumulation modesσ (S) width of CCN activation curve, nmσ (S)/Da(S) heterogeneity parameter
15734 M. L. Pöhlker et al.: Long-term observations of cloud condensation nuclei in the Amazon rain forest – Part 1
Table A2. List of abbreviations.
Abbreviation Description
ACSM aerosol chemical speciation monitorAOT aerosol optical thicknessATTO Amazon Tall Tower ObservatoryACRIDICON aerosol, cloud, precipitation, and radiation interactions and dynamics of convective cloud systemsBUNIAACIC Brazil–UK network for investigation of Amazonian atmospheric composition and impacts on climateBC black carbonCCN cloud condensation nucleiCCNC cloud condensation nuclei counterCN condensation nucleiCHUVA cloud processes of the main precipitation systems in Brazil: a contribution to cloud resolving modeling
and to the GPMs (global precipitation measurements)CPC condensation particle counterCO carbon monoxideDMA differential mobility analyzerENSO El Niño–Southern OscillationErf log-normal error functionGCMs global climate modelsGoAmazon14/5 green ocean Amazon 2014/5HALO high-altitude and long-range research aircraftHTDMA hygroscopicity tandem differential mobility analyzerIN ice nucleiIOP intensive observation periodLES large eddy simulationLRT long-range transportNPF new particle formationONI Oceanic Niño IndexOPC optical particle counterPSL polystyrene latexRH relative humiditySE standard errorSMPS scanning mobility particle sizerSOA secondary organic aerosolSST sea surface temperatureTRMM tropical rainfall measuring missionUTC coordinated universal time
M. L. Pöhlker et al.: Long-term observations of cloud condensation nuclei in the Amazon rain forest – Part 1 15735
The Supplement related to this article is available onlineat doi:10.5194/acp-16-15709-2016-supplement.
Acknowledgements. This work has been supported by the MaxPlanck Society (MPG) and the Max Planck Graduate Centerwith the Johannes Gutenberg University Mainz (MPGC). For theoperation of the ATTO site, we acknowledge the support by theGerman Federal Ministry of Education and Research (BMBFcontract 01LB1001A) and the Brazilian Ministério da Ciência,Tecnologia e Inovação (MCTI/FINEP contract 01.11.01248.00) andthe Amazon State University (UEA), FAPEAM, LBA/INPA andSDS/CEUC/RDS-Uatumã, and the St. Petersburg state University,Russia (project 11.37.220.2016) as well as the EU FP7 projectBACCHUS (project no. 603445). This paper contains results ofresearch conducted under the Technical/Scientific CooperationAgreement between the National Institute for Amazonian Research,the State University of Amazonas, and the Max Planck Gesellschafte.V.; the opinions expressed are the entire responsibility ofthe authors and not of the participating institutions. We highlyacknowledge the support by the Instituto Nacional de Pesquisasda Amazônia (INPA). We would like to especially thank all thepeople involved in the technical, logistical, and scientific supportof the ATTO project, in particular Matthias Sörgel, Thomas Disper,Andrew Crozier, Uwe Schulz, Steffen Schmidt, Antonio OcimarManzi, Alcides Camargo Ribeiro, Hermes Braga Xavier, EltonMendes da Silva, Nagib Alberto de Castro Souza, Adi VasconcelosBrandão, Amaury Rodrigues Pereira, Antonio Huxley MeloNascimento, Thiago de Lima Xavier, Josué Ferreira de Souza,Roberta Pereira de Souza, Bruno Takeshi, and Wallace RabeloCosta. Further, we thank the GoAmazon2014/5 team for the fruitfulcollaboration and discussions. We acknowledge technical supportby the DMT and Grimm Aerosol Technik teams in the courseof the experiments. Moreover, we thank Qiaoqiao Wang, BettinaWeber, Nina Ruckteschler, Bruna Amorim Holanda, KathrinReinmuth-Selzle, J. Alex Huffman, Ramon Braga, and DanielRosenfeld for support and stimulating discussions.
The article processing charges for this open-accesspublication were covered by the Max Planck Society.
Edited by: G. FischReviewed by: two anonymous referees
References
Almeida, G. P., Borrmann, S., and Leal Junior, J. B. V.: Cloud con-densation nuclei (CCN) concentration in the Brazilian northeastsemi-arid region: the influence of local circulation, Meteorol.Atmos. Phys., 125, 159–176, doi:10.1007/s00703-014-0329-1,2014.
Andreae, M. O.: Aerosols before pollution, Science, 315, 50–51,doi:10.1126/science.1136529, 2007.
Andreae, M. O.: Correlation between cloud condensation nu-clei concentration and aerosol optical thickness in remoteand polluted regions, Atmos. Chem. Phys., 9, 543–556,doi:10.5194/acp-9-543-2009, 2009.
Andreae, M. O. and Rosenfeld, D.: Aerosol-cloud-precipitation interactions. Part 1. The nature and sourcesof cloud-active aerosols, Earth-Sci. Rev., 89, 13–41,doi:10.1016/j.earscirev.2008.03.001, 2008.
Andreae, M. O., Artaxo, P., Brandao, C., Carswell, F. E., Cicci-oli, P., da Costa, A. L., Culf, A. D., Esteves, J. L., Gash, J.H. C., Grace, J., Kabat, P., Lelieveld, J., Malhi, Y., Manzi, A.O., Meixner, F. X., Nobre, A. D., Nobre, C., Ruivo, M., Silva-Dias, M. A., Stefani, P., Valentini, R., von Jouanne, J., and Wa-terloo, M. J.: Biogeochemical cycling of carbon, water, energy,trace gases, and aerosols in Amazonia: The LBA-EUSTACH ex-periments, J. Geophys. Res.-Atmos., 107, LBA 33-1–BA 33-25doi:10.1029/2001jd000524, 2002.
Andreae, M. O., Artaxo, P., Beck, V., Bela, M., Freitas, S., Gerbig,C., Longo, K., Munger, J. W., Wiedemann, K. T., and Wofsy, S.C.: Carbon monoxide and related trace gases and aerosols overthe Amazon Basin during the wet and dry seasons, Atmos. Chem.Phys., 12, 6041–6065, doi:10.5194/acp-12-6041-2012, 2012.
Andreae, M. O., Rosenfeld, D., Artaxo, P., Costa, A. A., Frank,G. P., Longo, K. M., and Silva-Dias, M. A. F.: Smok-ing rain clouds over the Amazon, Science, 303, 1337–1342,doi:10.1126/science.1092779, 2004.
Andreae, M. O., Acevedo, O. C., Araùjo, A., Artaxo, P., Barbosa, C.G. G., Barbosa, H. M. J., Brito, J., Carbone, S., Chi, X., Cintra,B. B. L., da Silva, N. F., Dias, N. L., Dias-Júnior, C. Q., Ditas, F.,Ditz, R., Godoi, A. F. L., Godoi, R. H. M., Heimann, M., Hoff-mann, T., Kesselmeier, J., Könemann, T., Krüger, M. L., Lavric,J. V., Manzi, A. O., Lopes, A. P., Martins, D. L., Mikhailov, E.F., Moran-Zuloaga, D., Nelson, B. W., Nölscher, A. C., SantosNogueira, D., Piedade, M. T. F., Pöhlker, C., Pöschl, U., Que-sada, C. A., Rizzo, L. V., Ro, C.-U., Ruckteschler, N., Sá, L. D.A., de Oliveira Sá, M., Sales, C. B., dos Santos, R. M. N., Sat-urno, J., Schöngart, J., Sörgel, M., de Souza, C. M., de Souza,R. A. F., Su, H., Targhetta, N., Tóta, J., Trebs, I., Trumbore,S., van Eijck, A., Walter, D., Wang, Z., Weber, B., Williams,J., Winderlich, J., Wittmann, F., Wolff, S., and Yáñez-Serrano,A. M.: The Amazon Tall Tower Observatory (ATTO): overviewof pilot measurements on ecosystem ecology, meteorology, tracegases, and aerosols, Atmos. Chem. Phys., 15, 10723—10776,doi:10.5194/acp-15-10723-2015, 2015.
Ansmann, A., Baars, H., Tesche, M., Muller, D., Althausen, D., En-gelmann, R., Pauliquevis, T., and Artaxo, P.: Dust and smoketransport from Africa to South America: Lidar profiling overCape Verde and the Amazon rainforest, Geophys. Res. Lett., 36,L11802, doi:10.1029/2009gl037923, 2009.
Asner, G. P., Townsend, A. R., and Braswell, B. H.: Satel-lite observation of El Nino effects on Amazon forest phe-nology and productivity, Geophys. Res. Lett., 27, 981–984,doi:10.1029/1999gl011113, 2000.
Bony, S., Stevens, B., Frierson, D. M. W., Jakob, C., Kageyama,M., Pincus, R., Shepherd, T. G., Sherwood, S. C., Siebesma,A. P., Sobel, A. H., Watanabe, M., and Webb, M. J.: Clouds,circulation and climate sensitivity, Nat. Geosci., 8, 261–268,doi:10.1038/ngeo2398, 2015.
Boucher, O., Randall, D., Artaxo, P., Bretherton, C., Feingold, G.,Forster, P., Kerminen, V. M., Kondo, Y., Liao, H., Lohmann, U.,Rasch, P., Satheesh, S. K., Sherwood, S., B., S., and Zhang, X.Y.: Clouds and Aerosols, Cambridge, United Kingdom and NewYork, NY, US, 571–658, 2013.
15736 M. L. Pöhlker et al.: Long-term observations of cloud condensation nuclei in the Amazon rain forest – Part 1
Boulon, J., Sellegri, K., Venzac, H., Picard, D., Weingartner, E.,Wehrle, G., Collaud Coen, M., Bütikofer, R., Fl”uckiger, E., Bal-tensperger, U., and Laj, P.: New particle formation and ultrafinecharged aerosol climatology at a high altitude site in the Alps(Jungfraujoch, 3580 m a.s.l., Switzerland), Atmos. Chem. Phys.,10, 9333–9349, doi:10.5194/acp-10-9333-2010, 2010.
Brienen, R. J. W., Phillips, O. L., Feldpausch, T. R., Gloor,E., Baker, T. R., Lloyd, J., Lopez-Gonzalez, G., Monteagudo-Mendoza, A., Malhi, Y., Lewis, S. L., Martinez, R. V., Alexiades,M., Davila, E. A., Alvarez-Loayza, P., Andrade, A., Aragao, L.,Araujo-Murakami, A., Arets, E., Arroyo, L., Aymard, G. A.,Banki, O. S., Baraloto, C., Barroso, J., Bonal, D., Boot, R. G. A.,Camargo, J. L. C., Castilho, C. V., Chama, V., Chao, K. J., Chave,J., Comiskey, J. A., Valverde, F. C., da Costa, L., de Oliveira, E.A., Di Fiore, A., Erwin, T. L., Fauset, S., Forsthofer, M., Gal-braith, D. R., Grahame, E. S., Groot, N., Herault, B., Higuchi, N.,Coronado, E. N. H., Keeling, H., Killeen, T. J., Laurance, W. F.,Laurance, S., Licona, J., Magnussen, W. E., Marimon, B. S., Ma-rimon, B. H., Mendoza, C., Neill, D. A., Nogueira, E. M., Nunez,P., Camacho, N. C. P., Parada, A., Pardo-Molina, G., Peacock, J.,Pena-Claros, M., Pickavance, G. C., Pitman, N. C. A., Poorter,L., Prieto, A., Quesada, C. A., Ramirez, F., Ramirez-Angulo, H.,Restrepo, Z., Roopsind, A., Rudas, A., Salomao, R. P., Schwarz,M., Silva, N., Silva-Espejo, J. E., Silveira, M., Stropp, J., Tal-bot, J., ter Steege, H., Teran-Aguilar, J., Terborgh, J., Thomas-Caesar, R., Toledo, M., Torello-Raventos, M., Umetsu, R. K.,Van der Heijden, G. M. F., Van der Hout, P., Vieira, I. C. G.,Vieira, S. A., Vilanova, E., Vos, V. A., and Zagt, R. J.: Long-term decline of the Amazon carbon sink, Nature, 519, p. 344,doi:10.1038/nature14283, 2015.
British Atmospheric Data Centre (BADC): NASA Ames Format forData Exchange, available at: http://cedadocs.badc.rl.ac.uk/73/4/index.html (last access: 19 December 2016), 2008.
Cantrell, C. A.: Technical Note: Review of methods for linear least-squares fitting of data and application to atmospheric chemistryproblems, Atmos. Chem. Phys., 8, 5477–5487, doi:10.5194/acp-8-5477-2008, 2008.
Chen, Q., Farmer, D. K., Rizzo, L. V., Pauliquevis, T., Kuwata, M.,Karl, T. G., Guenther, A., Allan, J. D., Coe, H., Andreae, M. O.,Pöschl, U., Jimenez, J. L., Artaxo, P., and Martin, S. T.: Submi-cron particle mass concentrations and sources in the Amazonianwet season (AMAZE-08), Atmos. Chem. Phys., 15, 3687–3701,doi:10.5194/acp-15-3687-2015, 2015.
Coe, M. T., Marthews, T. R., Costa, M. H., Galbraith, D. R.,Greenglass, N. L., Imbuzeiro, H. M. A., Levine, N. M., Malhi,Y., Moorcroft, P. R., Muza, M. N., Powell, T. L., Saleska,S. R., Solorzano, L. A., and Wang, J.: Deforestation andclimate feedbacks threaten the ecological integrity of south-southeastern Amazonia, Philos. T. Roy. Soc. B, 368, 1–9,doi:10.1098/rstb.2012.0155, 2013.
Cohard, J. M., Pinty, J. P., and Bedos, C.: Extending Twomey’s an-alytical estimate of nucleated cloud droplet concentrations fromCCN spectra, J. Atmos. Sci., 55, 3348–3357, doi:10.1175/1520-0469(1998)055<3348:etsaeo>2.0.co;2, 1998.
Cotton, W. R. and Anthes, R. A.: Storm and cloud dynamics, SanDiego, Academic Press, 833 pp., 1989.
Davidson, E. A., de Araujo, A. C., Artaxo, P., Balch, J. K., Brown,I. F., Bustamante, M. M. C., Coe, M. T., DeFries, R. S., Keller,M., Longo, M., Munger, J. W., Schroeder, W., Soares-Filho, B.
S., Souza Jr., C. M., and Wofsy, S. C.: The Amazon basin in tran-sition, Nature, 481, 321–328, doi:10.1038/nature10717, 2012.
Deng, Z. Z., Zhao, C. S., Ma, N., Ran, L., Zhou, G. Q., Lu, D.R., and Zhou, X. J.: An examination of parameterizations forthe CCN number concentration based on in situ measurementsof aerosol activation properties in the North China Plain, At-mos. Chem. Phys., 13, 6227–6237, doi:10.5194/acp-13-6227-2013, 2013.
Dusek, U., Frank, G. P., Hildebrandt, L., Curtius, J., Schneider, J.,Walter, S., Chand, D., Drewnick, F., Hings, S., Jung, D., Bor-rmann, S., and Andreae, M. O.: Size matters more than chem-istry for cloud-nucleating ability of aerosol particles, Science,312, 1375–1378, doi:10.1126/science.1125261, 2006.
Engelhart, G. J., Asa-Awuku, A., Nenes, A., and Pandis, S. N.: CCNactivity and droplet growth kinetics of fresh and aged monoter-pene secondary organic aerosol, Atmos. Chem. Phys., 8, 3937–3949, doi:10.5194/acp-8-3937-2008, 2008.
Fernandes, K., Giannini, A., Verchot, L., Baethgen, W., andPinedo-Vasquez, M.: Decadal covariability of Atlantic SSTsand western Amazon dry-season hydroclimate in observationsand CMIP5 simulations, Geophys. Res. Lett., 42, 6793–6801,doi:10.1002/2015gl063911, 2015.
Frank, G. P., Dusek, U., and Andreae, M. O.: Technical note: Amethod for measuring size-resolved CCN in the atmosphere, At-mos. Chem. Phys. Discuss., 6, 4879–4895, doi:10.5194/acpd-6-4879-2006, 2006.
Freud, E., Rosenfeld, D., Andreae, M. O., Costa, A. A., and Ar-taxo, P.: Robust relations between CCN and the vertical evolu-tion of cloud drop size distribution in deep convective clouds, At-mos. Chem. Phys., 8, 1661–1675, doi:10.5194/acp-8-1661-2008,2008.
Fu, R., Dickinson, R. E., Chen, M. X., and Wang, H.: How do trop-ical sea surface temperatures influence the seasonal distributionof precipitation in the equatorial Amazon?, J. Climate, 14, 4003–4026, doi:10.1175/1520-0442(2001)014<4003:hdtsst>2.0.co;2,2001.
Gloor, M., Barichivich, J., Ziv, G., Brienen, R., Schongart, J.,Peylin, P., Cintra, B. B. L., Feldpausch, T., Phillips, O., andBaker, J.: Recent Amazon climate as background for possibleongoing and future changes of Amazon humid forests, GlobalBiogeochem. Cy., 29, 1384–1399, doi:10.1002/2014gb005080,2015.
Graham, B., Guyon, P., Maenhaut, W., Taylor, P. E., Ebert, M.,Matthias-Maser, S., Mayol-Bracero, O. L., Godoi, R. H. M.,Artaxo, P., Meixner, F. X., Moura, M. A. L., Rocha, C.,Van Grieken, R., Glovsky, M. M., Flagan, R. C., and An-dreae, M. O.: Composition and diurnal variability of the nat-ural Amazonian aerosol, J. Geophys. Res.-Atmos., 108, 4765,doi:10.1029/2003jd004049, 2003.
Gunthe, S. S., King, S. M., Rose, D., Chen, Q., Roldin, P., Farmer,D. K., Jimenez, J. L., Artaxo, P., Andreae, M. O., Martin, S.T., and Pöschl, U.: Cloud condensation nuclei in pristine tropi-cal rainforest air of Amazonia: size-resolved measurements andmodeling of atmospheric aerosol composition and CCN activity,Atmos. Chem. Phys., 9, 7551–7575, doi:10.5194/acp-9-7551-2009, 2009.
Hamilton, D. S., Lee, L. A., Pringle, K. J., Reddington, C. L.,Spracklen, D. V., and Carslaw, K. S.: Occurrence of pristine
M. L. Pöhlker et al.: Long-term observations of cloud condensation nuclei in the Amazon rain forest – Part 1 15737
aerosol environments on a polluted planet, P. Natl. Acad. Sci.USA, 111, 18466–18471, doi:10.1073/pnas.1415440111, 2014.
Hoppel, W. A., Frick, G. M., and Fitzgerald, J. W.: Deducingdroplet concentration and supersaturation in marine boundarylayer clouds from surface aerosol measurements, J. Geophys.Res.-Atmos., 101, 26553–26565, doi:10.1029/96jd02243, 1996.
Junk, W. J.: Current state of knowledge regarding South Americawetlands and their future under global climate change, Aquat.Sci., 75, 113–131, doi:10.1007/s00027-012-0253-8, 2013.
Jurányi, Z., Gysel, M., Weingartner, E., Bukowiecki, N., Kammer-mann, L., and Baltensperger, U.: A 17 month climatology ofthe cloud condensation nuclei number concentration at the highalpine site Jungfraujoch, J. Geophys. Res.-Atmos., 116, D10204,doi:10.1029/2010JD015199, 2011.
Khain, A., Ovtchinnikov, M., Pinsky, M., Pokrovsky, A., andKrugliak, H.: Notes on the state-of-the-art numerical mod-eling of cloud microphysics, Atmos. Res., 55, 159–224,doi:10.1016/s0169-8095(00)00064-8, 2000.
King, S. M., Rosenoern, T., Shilling, J. E., Chen, Q., and Martin,S. T.: Cloud condensation nucleus activity of secondary organicaerosol particles mixed with sulfate, Geophys. Res. Lett., 34,2007GL030390, doi:10.1029/2007GL030390, 2007.
Köhler, H.: The nucleus in and the growth of hygroscopic droplets,T. Faraday Soc., 32, 1152–1161, doi:10.1039/tf9363201152,1936.
Koren, I., Kaufman, Y. J., Remer, L. A., and Martins, J. V.: Measure-ment of the effect of Amazon smoke on inhibition of cloud for-mation, Science, 303, 1342–1345, doi:10.1126/science.1089424,2004.
Koren, I., Altaratz, O., Remer, L. A., Feingold, G., Martins, J.V., and Heiblum, R. H.: Aerosol-induced intensification of rainfrom the tropics to the mid-latitudes, Nat. Geosci., 5, 118–122,doi:10.1038/ngeo1364, 2012.
Krüger, M. L., Mertes, S., Klimach, T., Cheng, Y. F., Su, H., Schnei-der, J., Andreae, M. O., Pöschl, U., and Rose, D.: Assessment ofcloud supersaturation by size-resolved aerosol particle and cloudcondensation nuclei (CCN) measurements, Atmos. Meas. Tech.,7, 2615–2629, doi:10.5194/amt-7-2615-2014, 2014.
Kuhn, U., Ganzeveld, L., Thielmann, A., Dindorf, T., Schebeske,G., Welling, M., Sciare, J., Roberts, G., Meixner, F. X.,Kesselmeier, J., Lelieveld, J., Kolle, O., Ciccioli, P., Lloyd, J.,Trentmann, J., Artaxo, P., and Andreae, M. O.: Impact of ManausCity on the Amazon Green Ocean atmosphere: ozone production,precursor sensitivity and aerosol load, Atmos. Chem. Phys., 10,9251–9282, doi:10.5194/acp-10-9251-2010, 2010.
Kulmala, M., Vehkamaki, H., Petaja, T., Dal Maso, M., Lauri,A., Kerminen, V. M., Birmili, W., and McMurry, P. H.:Formation and growth rates of ultrafine atmospheric parti-cles: a review of observations, J. Aerosol Sci., 35, 143–176,doi:10.1016/j.jaerosci.2003.10.003, 2004.
Lawrence, D. and Vandecar, K.: Effects of tropical deforestationon climate and agriculture, Nature Climate Change, 5, 27–36,doi:10.1038/nclimate2430, 2015.
Lawson, S. J., Keywood, M. D., Galbally, I. E., Gras, J. L., Cainey,J. M., Cope, M. E., Krummel, P. B., Fraser, P. J., Steele, L. P.,Bentley, S. T., Meyer, C. P., Ristovski, Z., and Goldstein, A. H.:Biomass burning emissions of trace gases and particles in marineair at Cape Grim, Tasmania, Atmos. Chem. Phys., 15, 13393–13411, doi:10.5194/acp-15-13393-2015, 2015.
Levin, E. J. T., Prenni, A. J., Petters, M. D., Kreidenweis, S. M.,Sullivan, R. C., Atwood, S. A., Ortega, J., DeMott, P. J., andSmith, J. N.: An annual cycle of size-resolved aerosol hygroscop-icity at a forested site in Colorado, J. Geophys. Res.-Atmos., 117,D06201, doi:10.1029/2011JD016854, 2012.
Lohmann, U. and Feichter, J.: Global indirect aerosol effects: a re-view, Atmos. Chem. Phys., 5, 715–737, doi:10.5194/acp-5-715-2005, 2005.
Machado, L. A. T., Silva Dias, M. A. F., Morales, C., Fisch, G.,Vila, D., Albrecht, R., Goodman, S. J., Calheiros, A. J. P., Bis-caro, T., Kummerow, C., Cohen, J., Fitzjarrald, D., Nascimento,E. L., Sakamoto, M. S., Cunningham, C., Chaboureau, J.-P., Pe-tersen, W. A., Adams, D. K., Baldini, L., Angelis, C. F., Sa-pucci, L. F., Salio, P., Barbosa, H. M. J., Landulfo, E., Souza,R. A. F., Blakeslee, R. J., Bailey, J., Freitas, S., Lima, W. F.A., and Tokay, A.: THE CHUVA PROJECT How Does Convec-tion Vary across Brazil?, B. Am. Meteorol. Soc., 95, 1365–1380,doi:10.1175/bams-d-13-00084.1, 2014.
Martin, S. T., Andreae, M. O., Althausen, D., Artaxo, P., Baars, H.,Borrmann, S., Chen, Q., Farmer, D. K., Guenther, A., Gunthe,S. S., Jimenez, J. L., Karl, T., Longo, K., Manzi, A., Müller, T.,Pauliquevis, T., Petters, M. D., Prenni, A. J., Pöschl, U., Rizzo,L. V., Schneider, J., Smith, J. N., Swietlicki, E., Tota, J., Wang,J., Wiedensohler, A., and Zorn, S. R.: An overview of the Ama-zonian Aerosol Characterization Experiment 2008 (AMAZE-08), Atmos. Chem. Phys., 10, 11415–11438, doi:10.5194/acp-10-11415-2010, 2010a.
Martin, S. T., Andreae, M. O., Artaxo, P., Baumgardner, D., Chen,Q., Goldstein, A. H., Guenther, A., Heald, C. L., Mayol-Bracero,O. L., McMurry, P. H., Pauliquevis, T., Pöschl, U., Prather, K.A., Roberts, G. C., Saleska, S. R., Dias, M. A. S., Spracklen,D. V., Swietlicki, E., and Trebs, I.: Sources and propertiesof Amazonian aerosol particles, Rev. Geophys., 48, RG2002,doi:10.1029/2008rg000280, 2010b.
Martin, S. T., Artaxo, P., Machado, L. A. T., Manzi, A. O., Souza, R.A. F., Schumacher, C., Wang, J., Andreae, M. O., Barbosa, H. M.J., Fan, J., Fisch, G., Goldstein, A. H., Guenther, A., Jimenez, J.L., Pöschl, U., Silva Dias, M. A., Smith, J. N., and Wendisch, M.:Introduction: Observations and Modeling of the Green OceanAmazon (GoAmazon2014/5), Atmos. Chem. Phys., 16, 4785–4797, doi:10.5194/acp-16-4785-2016, 2016.
Martins, J. A., Dias, M., and Goncalves, F. L. T.: Impact ofbiomass burning aerosols on precipitation in the Amazon: Amodeling case study, J. Geophys. Res.-Atmos., 114, 83–93,doi:10.1029/2007jd009587, 2009a.
Martins, J. A., Goncalves, F. L. T., Morales, C. A., Fisch, G. F., Pin-heiro, F. G. M., Leal, J. B. V., Jr., Oliveira, C. J., Silva, E. M.,Oliveira, J. C. P., Costa, A. A., and Silva Dias, M. A. F.: Cloudcondensation nuclei from biomass burning during the Amazo-nian dry-to-wet transition season, Meteorol. Atmos. Phys., 104,83–93, doi:10.1007/s00703-009-0019-6, 2009b.
McFiggans, G., Artaxo, P., Baltensperger, U., Coe, H., Facchini, M.C., Feingold, G., Fuzzi, S., Gysel, M., Laaksonen, A., Lohmann,U., Mentel, T. F., Murphy, D. M., O’Dowd, C. D., Snider, J. R.,and Weingartner, E.: The effect of physical and chemical aerosolproperties on warm cloud droplet activation, Atmos. Chem.Phys., 6, 2593–2649, doi:10.5194/acp-6-2593-2006, 2006.
Mikhailov, E., Vlasenko, S., Martin, S. T., Koop, T., and Pöschl,U.: Amorphous and crystalline aerosol particles interacting with
15738 M. L. Pöhlker et al.: Long-term observations of cloud condensation nuclei in the Amazon rain forest – Part 1
water vapor: conceptual framework and experimental evidencefor restructuring, phase transitions and kinetic limitations, At-mos. Chem. Phys., 9, 9491–9522, doi:10.5194/acp-9-9491-2009,2009.
Mikhailov, E., Vlasenko, S., Rose, D., and Pöschl, U.: Mass-basedhygroscopicity parameter interaction model and measurement ofatmospheric aerosol water uptake, Atmos. Chem. Phys., 13, 717–740, doi:10.5194/acp-13-717-2013, 2013.
Mikhailov, E. F., Mironov, G. N., Pöhlker, C., Chi, X., Krüger,M. L., Shiraiwa, M., Förster, J.-D., Pöschl, U., Vlasenko, S. S.,Ryshkevich, T. I., Weigand, M., Kilcoyne, A. L. D., and An-dreae, M. O.: Chemical composition, microstructure, and hygro-scopic properties of aerosol particles at the Zotino Tall TowerObservatory (ZOTTO), Siberia, during a summer campaign, At-mos. Chem. Phys., 15, 8847–8869, doi:10.5194/acp-15-8847-2015, 2015.
Mishra, A. K., Lehahn, Y., Rudich, Y., and Koren, I.: Co-variabilityof smoke and fire in the Amazon basin, Atmos. Environ., 109,97–104, doi:10.1016/j.atmosenv.2015.03.007, 2015.
Moran-Zuloaga, D., Ditas, F., Walter, D., Araùjo, A., Brito, J., Car-bone, S., Chi, X., Hrabe de Angelis, I., Lavric, J. V., Ming, J.,Pöhlker, M. L., Ruckteschler, N., Saturno, J., Wang, Y., Wang,Q., Weber, B., Wolff, S., Artaxo, P., Andreae, M. O., and Pöh-lker, C.: Coarse mode aerosols in the Amazon rainforest, Atmos.Chem. Phys. Discuss., in preparation, 2017.
Nenes, A. and Seinfeld, J. H.: Parameterization of cloud dropletformation in global climate models, J. Geophys. Res.-Atmos.,108, AAC 7-1–ACC 7-14, doi:10.1029/2002jd002911, 2003.
Ng, N. L., Canagaratna, M. R., Zhang, Q., Jimenez, J. L., Tian,J., Ulbrich, I. M., Kroll, J. H., Docherty, K. S., Chhabra, P.S., Bahreini, R., Murphy, S. M., Seinfeld, J. H., Hildebrandt,L., Donahue, N. M., DeCarlo, P. F., Lanz, V. A., Prévôt, A. S.H., Dinar, E., Rudich, Y., and Worsnop, D. R.: Organic aerosolcomponents observed in Northern Hemispheric datasets fromAerosol Mass Spectrometry, Atmos. Chem. Phys., 10, 4625–4641, doi:10.5194/acp-10-4625-2010, 2010.
Ng, N. L., Herndon, S. C., Trimborn, A., Canagaratna, M. R.,Croteau, P. L., Onasch, T. B., Sueper, D., Worsnop, D. R., Zhang,Q., Sun, Y. L., and Jayne, J. T.: An Aerosol Chemical Specia-tion Monitor (ACSM) for Routine Monitoring of the Composi-tion and Mass Concentrations of Ambient Aerosol, Aerosol Sci.Tech., 45, 780–794, doi:10.1080/02786826.2011.560211, 2011.
Olivares, I., Svenning, J. C., van Bodegom, P. M., and Balslev,H.: Effects of Warming and Drought on the Vegetation andPlant Diversity in the Amazon Basin, Bot. Rev., 81, 42–69,doi:10.1007/s12229-014-9149-8, 2015.
Ortega, J., Turnipseed, A., Guenther, A. B., Karl, T. G., Day, D. A.,Gochis, D., Huffman, J. A., Prenni, A. J., Levin, E. J. T., Krei-denweis, S. M., DeMott, P. J., Tobo, Y., Patton, E. G., Hodzic, A.,Cui, Y. Y., Harley, P. C., Hornbrook, R. S., Apel, E. C., Monson,R. K., Eller, A. S. D., Greenberg, J. P., Barth, M. C., Campuzano-Jost, P., Palm, B. B., Jimenez, J. L., Aiken, A. C., Dubey, M. K.,Geron, C., Offenberg, J., Ryan, M. G., Fornwalt, P. J., Pryor, S.C., Keutsch, F. N., DiGangi, J. P., Chan, A. W. H., Goldstein, A.H., Wolfe, G. M., Kim, S., Kaser, L., Schnitzhofer, R., Hansel,A., Cantrell, C. A., Mauldin, R. L., and Smith, J. N.: Overviewof the Manitou Experimental Forest Observatory: site descriptionand selected science results from 2008 to 2013, Atmos. Chem.Phys., 14, 6345–6367, doi:10.5194/acp-14-6345-2014, 2014.
Paramonov, M., Aalto, P. P., Asmi, A., Prisle, N., Kerminen, V.-M., Kulmala, M., and Petäjä, T.: The analysis of size-segregatedcloud condensation nuclei counter (CCNC) data and its impli-cations for cloud droplet activation, Atmos. Chem. Phys., 13,10285–10301, doi:10.5194/acp-13-10285-2013, 2013.
Paramonov, M., Kerminen, V.-M., Gysel, M., Aalto, P. P., Andreae,M. O., Asmi, E., Baltensperger, U., Bougiatioti, A., Brus, D.,Frank, G. P., Good, N., Gunthe, S. S., Hao, L., Irwin, M., Jaati-nen, A., Jurányi, Z., King, S. M., Kortelainen, A., Kristensson,A., Lihavainen, H., Kulmala, M., Lohmann, U., Martin, S. T.,McFiggans, G., Mihalopoulos, N., Nenes, A., O’Dowd, C. D.,Ovadnevaite, J., Petäjä, T., Pöschl, U., Roberts, G. C., Rose, D.,Svenningsson, B., Swietlicki, E., Weingartner, E., Whitehead, J.,Wiedensohler, A., Wittbom, C., and Sierau, B.: A synthesis ofcloud condensation nuclei counter (CCNC) measurements withinthe EUCAARI network, Atmos. Chem. Phys., 15, 12211–12229,doi:10.5194/acp-15-12211-2015, 2015.
Petters, M. D. and Kreidenweis, S. M.: A single parameter repre-sentation of hygroscopic growth and cloud condensation nucleusactivity, Atmos. Chem. Phys., 7, 1961–1971, doi:10.5194/acp-7-1961-2007, 2007.
Pinsky, M., Khain, A., Mazin, I., and Korolev, A.: Analytical esti-mation of droplet concentration at cloud base, J. Geophys. Res.-Atmos., 117, D18211, doi:10.1029/2012jd017753, 2012.
Pöhlker, C., Wiedemann, K. T., Sinha, B., Shiraiwa, M., Gun-the, S. S., Smith, M., Su, H., Artaxo, P., Chen, Q., Cheng,Y. F., Elbert, W., Gilles, M. K., Kilcoyne, A. L. D., Moffet,R. C., Weigand, M., Martin, S. T., Pöschl, U., and Andreae,M. O.: Biogenic Potassium Salt Particles as Seeds for Sec-ondary Organic Aerosol in the Amazon, Science, 337, 1075–1078, doi:10.1126/science.1223264, 2012.
Pöhlker, M. L., Pöhlker, C., Ditas, F., Klimach, T., Hrabe de Ange-lis, I., Araujo, A., Brito, J., Carbone, S., Chi, X., Cheng, Y., Ditz,R., Gunthe, S. S., Kesselmeier, J., Könemann, T., Lavric, J. V.,Martin, S. T., Moran, D., Rose, D., Saturno, J., Su, H., Thalman,R., Walter, D., Wang, J., Wolff, S., Barbosa, H. M. J., Artaxo,P., Andreae, M. O., and Pöschl, U.: Long-term observations ofcloud condensation nuclei in the Amazon rain forest – Part 2:Near-pristine episodes, ultrafine particle bursts, biomass burningand long range transport events, in preparation, 2017a.
Pöhlker, M. L., Rose, D., Pöhlker, C., Klimach, T., Hrabe de An-gelis, I., Ditas, F., Cheng, Y., Gunthe, S. S., Su, H., Andreae, M.O., and Pöschl, U.: Parameterizations for model predictions ofcloud condensation nuclei (CCN) concentration and hygroscop-icity from tropical to polar environments, in preparation, 2017b.
Pöschl, U.: Atmospheric aerosols: Composition, transformation,climate and health effects, Angew. Chem.-Int. Edit., 44, 7520–7540, doi:10.1002/anie.200501122, 2005.
Prenni, A. J., Petters, M. D., Kreidenweis, S. M., DeMott,P. J., and Ziemann, P. J.: Cloud droplet activation of sec-ondary organic aerosol, J. Geophys. Res.-Atmos., 112, 402–405,doi:10.1029/2006jd007963, 2007.
Reutter, P., Su, H., Trentmann, J., Simmel, M., Rose, D., Gunthe,S. S., Wernli, H., Andreae, M. O., and Pöschl, U.: Aerosol- andupdraft-limited regimes of cloud droplet formation: influence ofparticle number, size and hygroscopicity on the activation ofcloud condensation nuclei (CCN), Atmos. Chem. Phys., 9, 7067–7080, doi:10.5194/acp-9-7067-2009, 2009.
M. L. Pöhlker et al.: Long-term observations of cloud condensation nuclei in the Amazon rain forest – Part 1 15739
Rissler, J., Swietlicki, E., Zhou, J., Roberts, G., Andreae, M. O.,Gatti, L. V., and Artaxo, P.: Physical properties of the sub-micrometer aerosol over the Amazon rain forest during the wet-to-dry season transition – comparison of modeled and mea-sured CCN concentrations, Atmos. Chem. Phys., 4, 2119–2143,doi:10.5194/acp-4-2119-2004, 2004.
Rissler, J., Vestin, A., Swietlicki, E., Fisch, G., Zhou, J., Artaxo,P., and Andreae, M. O.: Size distribution and hygroscopic prop-erties of aerosol particles from dry-season biomass burning inAmazonia, Atmos. Chem. Phys., 6, 471–491, doi:10.5194/acp-6-471-2006, 2006.
Roberts, G. C. and Nenes, A.: A continuous-flow stream-wise thermal-gradient CCN chamber for atmosphericmeasurements, Aerosol Sci. Technol., 39, 206–221,doi:10.1080/027868290913988, 2005.
Roberts, G. C., Artaxo, P., Zhou, J. C., Swietlicki, E., and An-dreae, M. O.: Sensitivity of CCN spectra on chemical andphysical properties of aerosol: A case study from the AmazonBasin, J. Geophys. Res.-Atmos., 107, LBA 37-1–LBA 37-18doi:10.1029/2001jd000583, 2002.
Roberts, G. C., Nenes, A., Seinfeld, J. H., and Andreae, M. O.:Impact of biomass burning on cloud properties in the Ama-zon Basin, J. Geophys. Res.-Atmos., 108, ACC 9-1–ACC 9-19.,doi:10.1029/2001jd000985, 2003.
Roberts, M. C., Andreae, M. O., Zhou, J. C., and Artaxo, P.: Cloudcondensation nuclei in the Amazon Basin: “Marine” conditionsover a continent?, Geophys. Res. Lett., 28, 2807–2810, 2001.
Ronchail, J., Cochonneau, G., Molinier, M., Guyot, J. L., Chaves,A. G. D., Guimaraes, V., and de Oliveira, E.: Interannual rainfallvariability in the Amazon basin and sea-surface temperatures inthe equatorial Pacific and the tropical Atlantic Oceans, Int. J. Cli-matol., 22, 1663–1686, doi:10.1002/joc.815, 2002.
Rose, D., Gunthe, S. S., Mikhailov, E., Frank, G. P., Dusek, U.,Andreae, M. O., and Pöschl, U.: Calibration and measurementuncertainties of a continuous-flow cloud condensation nucleicounter (DMT-CCNC): CCN activation of ammonium sulfateand sodium chloride aerosol particles in theory and experiment,Atmos. Chem. Phys., 8, 1153-1179, doi:10.5194/acp-8-1153-2008, 2008a.
Rose, D., Gunthe, S. S., Mikhailov, E., Frank, G. P., Dusek, U.,Andreae, M. O., and Pöschl, U.: Calibration and measurementuncertainties of a continuous-flow cloud condensation nucleicounter (DMT-CCNC): CCN activation of ammonium sulfateand sodium chloride aerosol particles in theory and experiment,Atmos. Chem. Phys., 8, 1153–1179, doi:10.5194/acp-8-1153-2008, 2008b.
Rose, D., Nowak, A., Achtert, P., Wiedensohler, A., Hu, M., Shao,M., Zhang, Y., Andreae, M. O., and Pöschl, U.: Cloud conden-sation nuclei in polluted air and biomass burning smoke near themega-city Guangzhou, China – Part 1: Size-resolved measure-ments and implications for the modeling of aerosol particle hy-groscopicity and CCN activity, Atmos. Chem. Phys., 10, 3365–3383, doi:10.5194/acp-10-3365-2010, 2010.
Rose, D., Gunthe, S. S., Su, H., Garland, R. M., Yang, H., Berghof,M., Cheng, Y. F., Wehner, B., Achtert, P., Nowak, A., Wieden-sohler, A., Takegawa, N., Kondo, Y., Hu, M., Zhang, Y., Andreae,M. O., and Pöschl, U.: Cloud condensation nuclei in pollutedair and biomass burning smoke near the mega-city Guangzhou,China – Part 2: Size-resolved aerosol chemical composition, di-
Rosenfeld, D., Lohmann, U., Raga, G. B., O’Dowd, C. D., Kulmala,M., Fuzzi, S., Reissell, A., and Andreae, M. O.: Flood or drought:How do aerosols affect precipitation?, Science, 321, 1309–1313,doi:10.1126/science.1160606, 2008.
Salvador, P., Almeida, S. M., Cardoso, J., Almeida-Silva, M.,Nunes, T., Cerqueira, M., Alves, C., Reis, M. A., Chaves,P. C., Artíñano, B., and Pio, C.: Composition and ori-gin of PM10 in Cape Verde: Characterization of long-range transport episodes, Atmos. Environ., 127, 326–339,doi:10.1016/j.atmosenv.2015.12.057, 2016.
Stevens, B., Farrell, D., Hirsch, L., Jansen, F., Nuijens, L., Serikov,I., Brügmann, B., Forde, M., Linne, H., Lonitz, K., and Prospero,J. M.: The Barbados Cloud Observatory – Anchoring Investiga-tions of Clouds and Circulation on the Edge of the ITCZ, B. Am.Meteorol. Soc., 0, 787–801, doi:10.1175/BAMS-D-14-00247.1,2016.
Su, H., Rose, D., Cheng, Y. F., Gunthe, S. S., Massling, A., Stock,M., Wiedensohler, A., Andreae, M. O., and Pöschl, U.: Hygro-scopicity distribution concept for measurement data analysis andmodeling of aerosol particle mixing state with regard to hygro-scopic growth and CCN activation, Atmos. Chem. Phys., 10,7489–7503, doi:10.5194/acp-10-7489-2010, 2010.
Talbot, R. W., Andreae, M. O., Andreae, T. W., and Harriss,R. C.: Regional aerosol chemistry of the amazon basin dur-ing the dry season, J. Geophys. Res.-Atmos., 93, 1499–1508,doi:10.1029/JD093iD02p01499, 1988.
Talbot, R. W., Andreae, M. O., Berresheim, H., Artaxo, P., Garstang,M., Harriss, R. C., Beecher, K. M., and Li, S. M.: Aerosol chem-istry during the wet season in central amazonia – the influenceof long-range transport, J. Geophys. Res.-Atmos., 95, 16955–16969, doi:10.1029/JD095iD10p16955, 1990.
Thalman, R., de Sá, S. S., Palm, B. B., Barbosa, H. M. J., Plker, M.L., Alexander, M. L., Carbone, S., Day, D. A., Kuang, C., Manzi,A. O., Ng, N. L., Sedlacek, A., Souza, R. A. F., Springston, S.,Watson, T., Pöhlker, C., Pöschl, U., Andreae, M. O., Artaxo, P.,Jimenez, J. L., Martin, S. T., and Wang, J.: CCN activity and or-ganic hygroscopicity of Amazonian aerosols – seasonal and dielvariations and impact of anthropogenic emissions, in preparation,2017.
Twomey, S.: The nuclei of natural cloud formation—part II: The su-persaturation in natural clouds and the variation of cloud dropletconcentration, Geofis Pura e Appl, 43, 243–249, 1959.
Twomey, S. and Wojciechowski, T. A.: Observations of the geo-graphical variation of cloud nuclei, J. Atmos. Sci., 26, 684–688,1969.
Vestin, A., Rissler, J., Swietlicki, E., Frank, G. P., and An-dreae, M. O.: Cloud-nucleating properties of the Amazonianbiomass burning aerosol: Cloud condensation nuclei measure-ments and modeling, J. Geophys. Res.-Atmos., 112, D14201,doi:10.1029/2006jd8104, 2007.
Wendisch, M., Pöschl, U., Andreae, M. O., Machado, L. A. T., Al-brecht, R., Schlager, H., Rosenfeld, D., Martin, S. T., Abdel-monem, A., Afchine, A., Araùjo, A., Artaxo, P., Aufmhoff, H.,Barbosa, H. M. J., Borrmann, S., Braga, R., Buchholz, B., Cec-chini, M. A., Costa, A., Curtius, J., Dollner, M., Dorf, M., Dreil-ing, V., Ebert, V., Ehrlich, A., Ewald, F., Fisch, G., Fix, A., Frank,
15740 M. L. Pöhlker et al.: Long-term observations of cloud condensation nuclei in the Amazon rain forest – Part 1
F., Fütterer, D., Heckl, C., Heidelberg, F., Hüneke, T., Jäkel, E.,Järvinen, E., Jurkat, T., Kanter, S., Kästner, U., Kenntner, M.,Kesselmeier, J., Klimach, T., Knecht, M., Kohl, R., Kölling, T.,Krämer, M., Krüger, M., Krisna, T. C., Lavric, J. V., Longo, K.,Mahnke, C., Manzi, A. O., Mayer, B., Mertes, S., Minikin, A.,Molleker, S., Münch, S., Nillius, B., Pfeilsticker, K., Pöhlker,C., Roiger, A., Rose, D., Rosenow, D., Sauer, D., Schnaiter, M.,Schneider, J., Schulz, C., de Souza, R. A. F., Spanu, A., Stock, P.,Vila, D., Voigt, C., Walser, A., Walter, D., Weigel, R., Weinzierl,B., Werner, F., Yamasoe, M. A., Ziereis, H., Zinner, T., andZöger, M.: ACRIDICON-CHUVA Campaign: Studying TropicalDeep Convective Clouds and Precipitation over Amazonia Usingthe New German Research Aircraft HALO, B. Am. Meteorol.Soc., 97, 1885–1908, doi:10.1175/bams-d-14-00255.1, 2016.
Wex, H., Petters, M. D., Carrico, C. M., Hallbauer, E., Massling,A., McMeeking, G. R., Poulain, L., Wu, Z., Kreidenweis, S. M.,and Stratmann, F.: Towards closing the gap between hygroscopicgrowth and activation for secondary organic aerosol: Part 1 – Ev-idence from measurements, Atmos. Chem. Phys., 9, 3987–3997,doi:10.5194/acp-9-3987-2009, 2009.
Whitehead, J. D., Darbyshire, E., Brito, J., Barbosa, H. M. J., Craw-ford, I., Stern, R., Gallagher, M. W., Kaye, P. H., Allan, J. D.,Coe, H., Artaxo, P., and McFiggans, G.: Biogenic cloud nuclei inthe central Amazon during the transition from wet to dry season,Atmos. Chem. Phys., 16, 9727–9743, doi:10.5194/acp-16-9727-2016, 2016.
Winderlich, J., Chen, H., Gerbig, C., Seifert, T., Kolle, O., Lavric,J. V., Kaiser, C., Höfer, A., and Heimann, M.: Continuous low-maintenance CO2/CH4/H2O measurements at the Zotino TallTower Observatory (ZOTTO) in Central Siberia, Atmos. Meas.Tech., 3, 1113–1128, doi:10.5194/amt-3-1113-2010, 2010.
Yáñez-Serrano, A. M., Nölscher, A. C., Williams, J., Wolff, S.,Alves, E., Martins, G. A., Bourtsoukidis, E., Brito, J., Jardine,K., Artaxo, P., and Kesselmeier, J.: Diel and seasonal changesof biogenic volatile organic compounds within and above anAmazonian rainforest, Atmos. Chem. Phys., 15, 3359–3378,doi:10.5194/acp-15-3359-2015, 2015.
Zhou, J., Swietlicki, E., Hansson, H. C., and Artaxo, P.: Submicrom-eter aerosol particle size distribution and hygroscopic growthmeasured in the Amazon rain forest during the wet season, J.Geophys. Res., 107, 8055, doi:10.1029/2000jd000203, 2002.