72
Long-term public finance report: an analysis of fiscal sustainability December 2006
Long-termpublic finance report:
an analysis of fiscal sustainability
December 2006


December 2006
Long-termpublic finance report:
an analysis of fiscal sustainability
© Crown copyright 2006
Published with the permission of HM Treasury on behalf ofthe Controller of Her Majesty’s Stationery Office.
The text in this document (excluding the Royal Coat of Armsand departmental logos) may be reproduced free of chargein any format or medium providing that it is reproducedaccurately and not used in a misleading context. The materialmust be acknowledged as Crown copyright and the title ofthe document specified.
Any enquiries relating to the copyright in this documentshould be sent to:
HMSOLicensing DivisionSt Clements House2-16 ColegateNorwichNR3 1BQ
Fax: 01603 723000E-mail: [email protected]
HM Treasury contacts
This document can be found on the Treasury website at:
hm-treasury.gov.uk
For general enquiries about HM Treasury and its work, contact:
Correspondence and Enquiry UnitHM Treasury1 Horse Guards RoadLondonSW1A 2HQ
Tel: 020 7270 4558 Fax: 020 7270 4861E-mail: [email protected]
ISBN-10: 1-84532-225-8ISBN-13: 978-1-84532-225-0
Printed by The Stationery Office 12/06 349627
Printed on at least 75% recycled paper.When you have finished with it please recycle it again.
PU089
CO N T E N T S
Page
Chapter 1 Overview 3
Chapter 2 Long-term socio-economic trends 7
Chapter 3 Approaches to assessing long-term fiscal sustainability 19
Chapter 4 Assumptions 23
Chapter 5 Results 35
Bibliography 59
List of charts 63
List of tables 63
List boxes 63
List of abbreviations 65


1 OV E R V I E W
Long-term public finance report
INTRODUCTION
1.1 Since 2002 the Government has published the Long-term public finance report on anannual basis, with the intention of providing a comprehensive analysis of long-term socio-economic and demographic developments, and their likely impact on the public finances.The Long-term public finance report complements the illustrative long-term fiscalprojections presented in the Economic and Fiscal Strategy Report (EFSR),1 published at thetime of the Budget. The Government is committed to updating and reporting regularly on itsassessments of long-term fiscal sustainability, both through the Long-term public financereport and through the illustrative long-term fiscal projections presented with each Budget.
1.2 The publication of the Long-term public finance report is motivated by theGovernment’s belief that sustainable public finances are a prerequisite to achieving high andstable rates of long-term economic growth, which are shared by all, and to ensuring thatspending and taxation impact fairly between generations. It is therefore important for theGovernment to have a good understanding of potential future social and economic trends,and the fiscal implications of current policy for future generations. A better understanding ofthese trends also assists the Government in making strategic policy decisions, including thosethat will shape the outcome of the 2007 Comprehensive Spending Review (CSR).2
1.3 Moreover, additional information on long-term fiscal trends – particularly whenupdated on a regular basis – greatly improves fiscal transparency and credibility. TheGovernment also hopes that this publication and its recently published analysis for the 2007CSR on long-term opportunities and challenges will help to stimulate a public discussion onissues and choices facing individuals, businesses, communities and government as the UKresponds to a profound change in the decade ahead and beyond.3
1.4 This Report focuses on long-term demographic changes and their implications forfiscal sustainability. It explains how one of the key challenges that all developed economiesare facing over the coming decades is the ageing of their populations. The ageing trend ismainly driven by increases in longevity (life expectancy) and continuing low fertility rates (thenumber of children per woman). In many developed countries these factors are alsopredicted to lead to a decline in the size of the working-age population. At the same time, thepopulations of working age in many less-developed countries are predicted to increase. It islikely that these global demographic trends will affect future capital flows and the location ofeconomic activity.
1.5 These trends are likely to have profound effects on Britain’s society and economy overthe coming decades. Even though the UK population is projected to age less rapidly thanthose of many other developed countries (and hence the associated challenges should be lessmarked), a thorough understanding of the demographic and other likely long-term trends4 isessential for the Government to make the right long-term strategic policy decisions and to
Long-termchallenges
Motivation forthe Report
3
1 Annex A of the Economic and Fiscal Strategy Report, in Budget 2006: A strong and strengthening economy: Investing inBritain’s future, HM Treasury, March 2006.2 In July 2005 the Government announced that the 2007 Comprehensive Spending Review would look at domestic andinternational trends, which might unfold over the longer term. See Written statement to Parliament on the Spending Review,HM Treasury, July 2005. Also see Long-term opportunities and challenges for the UK: analysis for the 2007 ComprehensiveSpending Review, HM Treasury, November 2006.3 Ibid.4 See Chapter 2 for a discussion of the longer-term trends that have been identified by the Government as important forthe 2007 Comprehensive Spending Review.
OV E R V I E W1ensure that government policy will be fiscally sustainable in the long term. Without this typeof analysis there is a risk that fiscally unsustainable polices might be pursued, which requiresharp corrective policy adjustments in the future. Such sudden and unexpected changes inpolicy could be very harmful and unfair towards firms and individuals.
1.6 The 2006 Long-term public finance report follows the general structure developed inprevious reports. On the basis of an updated assessment, which takes account of the latestmedium-term public finance projections published in the 2006 Pre-Budget Report5 andpolicy developments,6 the 2006 Report finds that the UK’s long-term fiscal position remainssustainable. The Report also concludes that the UK is well placed relative to many otherdeveloped countries to deal with the fiscal challenges arising from ageing populations in thefuture.
THE UK FISCAL FRAMEWORK
1.7 The UK’s fiscal framework is central to achieving the Government’s objective of highand stable long-term economic growth. The framework facilitates transparent, long-termdecision-making in both the public and private sectors. According to the InternationalMonetary Fund (IMF): “...the fiscal framework is at the forefront of international bestpractice”.7
1.8 The fiscal framework is guided by the Code for Fiscal Stability,8 which sets out acommitment to managing the public finances in the long-term interests of Britain. The fivekey principles of the Code – transparency, stability, responsibility, fairness and efficiency –also support a long-term focus in the policy-making process.
1.9 Fiscal policy is set with consideration for the short, medium and long terms. The Coderequires the Government to state its objectives and the fiscal rules by which fiscal policy isoperated. The Government’s objectives for fiscal policy are:
• over the medium term, to ensure sound public finances and that spendingand taxation impact fairly both within and between generations; and
• over the short term, to support monetary policy; and, in particular, to allowthe automatic stabilisers to help smooth the path of the economy.
1.10 In the long run, fiscal policy supports the Government’s long-term goals by ensuringthat the public finances are sustainable, contributing to a stable environment that promoteseconomic growth. This environment is important for achieving the Government’s objective ofbuilding a stronger, more enterprising economy and a fairer society, extending economicopportunity and supporting those most in need to ensure that rising national prosperity isshared by all.
Objectives forfiscal policy
4 Long-term public finance report
5 2006 Pre-Budget Report, HM Treasury, December 2006.6 The analysis in this Report takes into account the policies proposed in the Government’s White Paper on pensions. SeeSecurity in Retirement: towards a new pensions system, Department for Work and Pensions, May 2006.7 United Kingdom: 2005 Article IV Consultation - Staff Report; Public Information Notice on the Executive Board Discussion; andStatement by the Executive Director for the United Kingdom, International Monetary Fund, March 2006, page 19.8 Code for Fiscal Stability, HM Treasury, March 1998.
OV E R V I E W 11.11 The Government has formulated two fiscal rules through which the objectives forfiscal policy are implemented, which also reflect the commitments to fiscal sustainability andgenerational fairness. They are:
• the golden rule: over the economic cycle, the Government will borrow only toinvest and not to fund current spending; and
• the sustainable investment rule: public sector net debt as a proportion ofGDP will be held over the economic cycle at a stable and prudent level. Otherthings being equal, net debt will be maintained below 40 per cent of GDP overthe economic cycle.
1.12 The golden rule specifies that current spending should be financed by current taxesover the economic cycle, thus ensuring generational fairness and fiscal sustainability. Inaddition, the sustainable investment rule ensures debt sustainability and also supportsgenerational fairness by limiting the scope for the current generation to leave excessive debtburdens to future generations.
PURPOSE AND STRUCTURE OF THIS REPORT
1.13 The Code also requires the Government to publish illustrative long-term fiscalprojections, covering a horizon of at least ten years. The projections, which are published inAnnex A of the EFSR have in practice covered a 30-year horizon but, due to theirmethodology, do not identify specific long-term spending trends. This Report extends andcomplements the analysis in the EFSR, and aims to provide a comprehensive picture of thesustainability of the public finances over the long term based on a range of plausibleassumptions. In addition, it offers better quality information to guide policy and enhance thedecision-making and planning by both the Government and individuals, and establishes aframework for examining the effects of demographic change and other long-term trends onthe public finances.
1.14 When analysing the results presented in this Report, it is important to remember theuncertainties involved in any long-term modelling exercise of this kind. Many factors willaffect future trends in the public finances, including technological advances, internationaldevelopments and socio-economic changes. These factors are often of a complex andnonlinear nature and are therefore difficult to predict accurately. The results presented inChapter 5 should therefore be seen as indicative.
Structure
1.15 To assess the long-term sustainability of the public finances, it is necessary to look atexpected future trends. Chapter 2 focuses on the key long-term demographic trends thatmight affect the sustainability of the public finances. It examines in particular the ageing ofthe population. In addition, the chapter also discusses past and future trends in averagefamily size. These are just some of the long-term challenges facing the UK. The Government’smore comprehensive analysis of future trends can be found in Long-term opportunities andchallenges for the UK: analysis for the 2007 CSR.
1.16 This year’s Report uses approaches to assessing long-term fiscal sustainability, whichhave been used in previous reports. These approaches are: net debt, intertemporal budgetconstraint/gap, fiscal gaps and an indicative estimate of accruals-based net liabilities. Theseare discussed in Chapter 3.
Comprehensiveassessment ofsustainability
Long-termchallenges
Uncertainties
Fiscal rules
5Long-term public finance report
OV E R V I E W11.17 Chapter 4 discusses the assumptions used in this Report. Projecting future GDPgrowth, for example, requires assumptions about future labour-market trends andproductivity growth. This year’s Report uses an updated and refined model (using the so-called ‘cohort’ method) to project future employment trends, which also takes account of theproposed changes in the State Pension age announced in the Government’s White PaperSecurity in retirement: towards a new pensions system.10 As in previous years, the Reportpresents results based on three different productivity growth rate assumptions to providesome sensitivity analysis.
1.18 Chapter 4 also discusses the methodology used to project future spending andrevenue trends. These projections require gender- and age-specific profiles for nearly 80different spending and revenue items. These profiles have been updated comprehensively forthis year’s Report. In addition, the methodology to project health care spending has beenrefined to take advantage of new data becoming available.
1.19 Using the latest medium-term public finance projections, as published in the 2006Pre-Budget Report, Chapter 5 presents updated long-term fiscal projections and comparesthem with those published in last year’s Long-term public finance report. Age-relatedspending, as a share of GDP, is projected to be similar by the mid 2050s to that projected inlast year’s Report. The information on net debt and the forward-looking indicators iscomplemented by indicative balance-sheet data, which provide an illustration of the trendsin the Government’s net liabilities. Updated international comparisons show that the UK,based on current policies, remains in a relatively strong position to deal with the fiscalchallenges arising from an ageing population.
Updatedprojections and
assessment ofsustainability
Updated age-profiles
Refinedemployment
model
6 Long-term public finance report
8 Code for Fiscal Stability, HM Treasury, March 1998.
2 LO N G -T E R M S O C I O -E C O N O M I C T R E N D S
Long-term public finance report
INTRODUCTION
2.1 This chapter presents potential long-term socio-economic trends. The main focus, asin previous Long-term public finance reports, is on demographic changes in general andpopulation ageing in particular. The long-term demographic trends presented in this chapterare based on the Government Actuary’s Department’s (GAD’s) 2004-based populationprojections, produced in October 2005, which are the latest projections available. Theseprojections were also used for the purposes of last year’s Report.1
2.2 Population ageing is not the only socio-economic trend that is likely to occur over thecoming decades. Previous Long-term public finance reports have looked at other potentialtrends, including:
• differences in projected population growth between countries of the UnitedKingdom;2 and
• demand for health and long-term care services, which will depend to a certaindegree on the evolution of morbidity. In combination with future supplydrivers such as technological and medical advances, these will influencefuture health spending.3
2.3 Given the time horizons, there is inevitably a very high degree of uncertainty involvedin predicting trends. History tells us that change is often rapid and abrupt rather than gradual.Few people in the mid 1980s, for example, would have imagined that the Soviet Union woulddisintegrate by the late 1980s, and that central and eastern European countries would join theEuropean Union in 2004. In addition to the discussion of population ageing, which is anunderlying trend and therefore relatively certain, this chapter also provides some suggestionsabout how to deal with more uncertain trends.
THE CHANGING STRUCTURE OF THE UK POPUL ATION
2.4 One of the most important future developments is the changing structure of the UK’spopulation. Up to 2005, GAD was the producer of official population projections for the UK.This responsibility moved to the Office for National Statistics (ONS) on 31 January 2006,which intends to issue the next full set of population projections in October 2007.4 GADpublished its latest principal population projections, the 2004-based projections, in October2005.5 Table 2.1 summarises GAD’s main long-term assumptions for the principal and highvariant population projections.6
2004-basedpopulationprojections
7
1 See 2005 Long-term public finance report: an analysis of fiscal sustainability, HM Treasury, December 2005, pages 5 to 19.2 Ibid, page 10. 3 2004 Long-term public finance report: an analysis of fiscal sustainability, HM Treasury, December 2004, pages 17 to 19.4 See 2004-based national population projections for the UK and constituent countries, Chris Shaw, Population Trends No.123,Office for National Statistics, Spring 2006, page 9. 5 http://www.gad.gov.uk/Population/index.asp.6 GAD also produces low and other variants. These are not shown in Table 2.1.
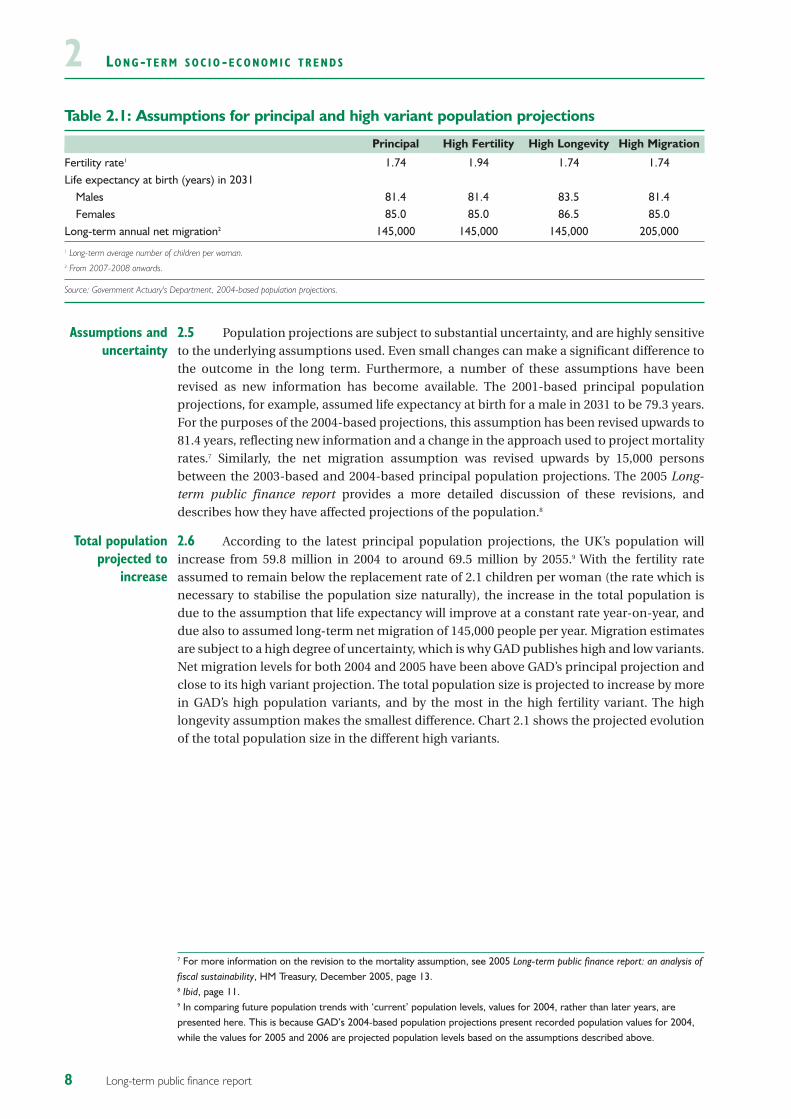
LO N G -T E R M S O C I O -E C O N O M I C T R E N D S2Table 2.1: Assumptions for principal and high variant population projections
Principal High Fertility High Longevity High Migration
Fertility rate1 1.74 1.94 1.74 1.74Life expectancy at birth (years) in 2031
Males 81.4 81.4 83.5 81.4Females 85.0 85.0 86.5 85.0
Long-term annual net migration2 145,000 145,000 145,000 205,0001 Long-term average number of children per woman.2 From 2007-2008 onwards.
Source: Government Actuary's Department, 2004-based population projections.
2.5 Population projections are subject to substantial uncertainty, and are highly sensitiveto the underlying assumptions used. Even small changes can make a significant difference tothe outcome in the long term. Furthermore, a number of these assumptions have beenrevised as new information has become available. The 2001-based principal populationprojections, for example, assumed life expectancy at birth for a male in 2031 to be 79.3 years.For the purposes of the 2004-based projections, this assumption has been revised upwards to81.4 years, reflecting new information and a change in the approach used to project mortalityrates.7 Similarly, the net migration assumption was revised upwards by 15,000 personsbetween the 2003-based and 2004-based principal population projections. The 2005 Long-term public finance report provides a more detailed discussion of these revisions, anddescribes how they have affected projections of the population.8
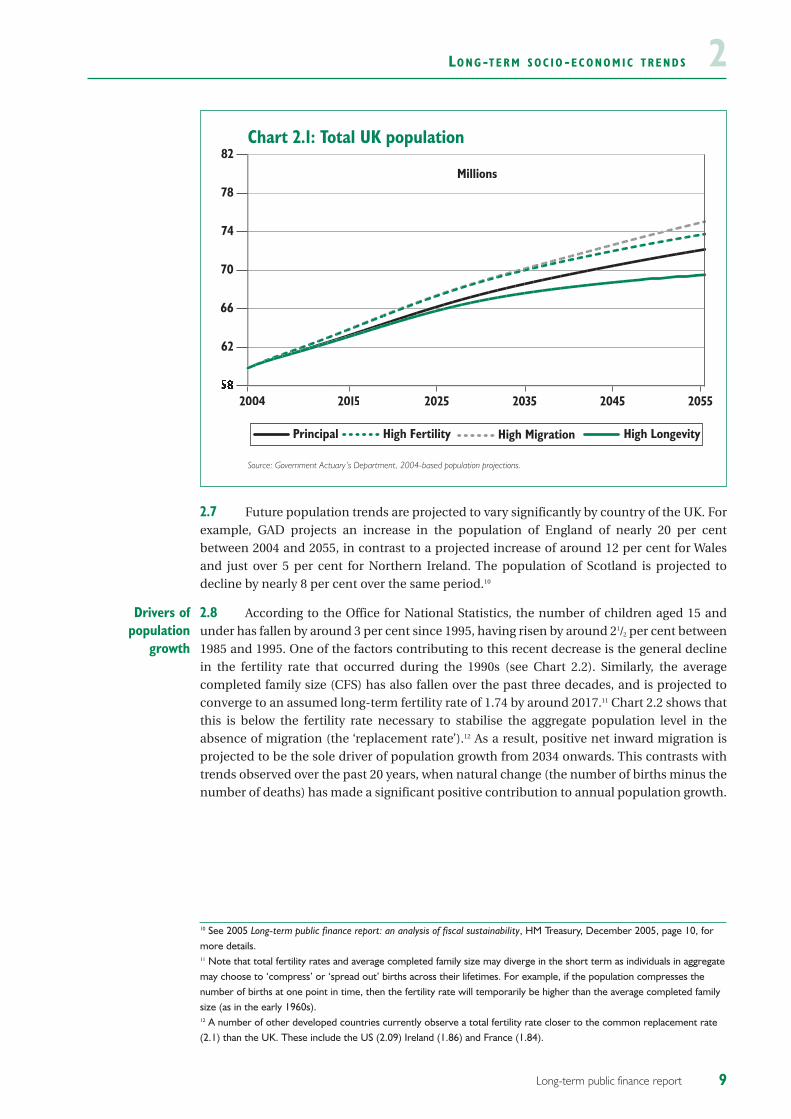
2.6 According to the latest principal population projections, the UK’s population willincrease from 59.8 million in 2004 to around 69.5 million by 2055.9 With the fertility rateassumed to remain below the replacement rate of 2.1 children per woman (the rate which isnecessary to stabilise the population size naturally), the increase in the total population isdue to the assumption that life expectancy will improve at a constant rate year-on-year, anddue also to assumed long-term net migration of 145,000 people per year. Migration estimatesare subject to a high degree of uncertainty, which is why GAD publishes high and low variants.Net migration levels for both 2004 and 2005 have been above GAD’s principal projection andclose to its high variant projection. The total population size is projected to increase by morein GAD’s high population variants, and by the most in the high fertility variant. The highlongevity assumption makes the smallest difference. Chart 2.1 shows the projected evolutionof the total population size in the different high variants.
Total populationprojected to
increase
Assumptions anduncertainty
8 Long-term public finance report
7 For more information on the revision to the mortality assumption, see 2005 Long-term public finance report: an analysis offiscal sustainability, HM Treasury, December 2005, page 13. 8 Ibid, page 11. 9 In comparing future population trends with ‘current’ population levels, values for 2004, rather than later years, arepresented here. This is because GAD’s 2004-based population projections present recorded population values for 2004,while the values for 2005 and 2006 are projected population levels based on the assumptions described above.
LO N G -T E R M S O C I O -E C O N O M I C T R E N D S 2
2.7 Future population trends are projected to vary significantly by country of the UK. Forexample, GAD projects an increase in the population of England of nearly 20 per centbetween 2004 and 2055, in contrast to a projected increase of around 12 per cent for Walesand just over 5 per cent for Northern Ireland. The population of Scotland is projected todecline by nearly 8 per cent over the same period.10
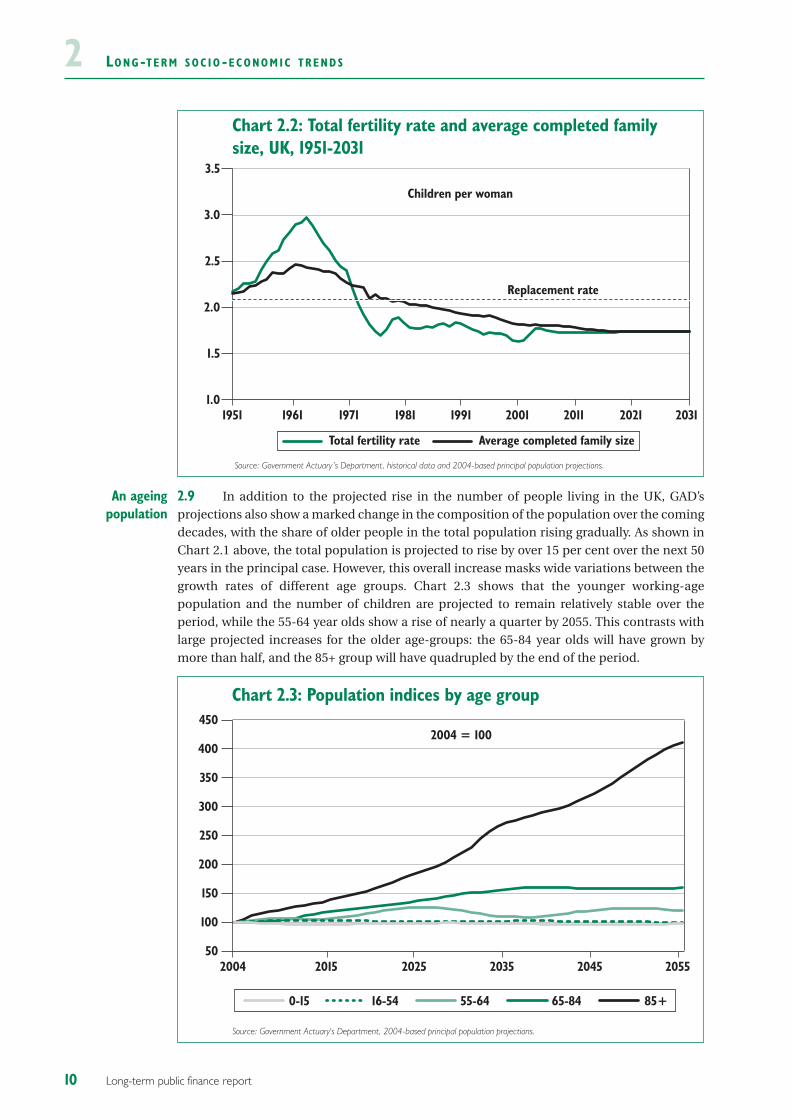
2.8 According to the Office for National Statistics, the number of children aged 15 andunder has fallen by around 3 per cent since 1995, having risen by around 21/2 per cent between1985 and 1995. One of the factors contributing to this recent decrease is the general declinein the fertility rate that occurred during the 1990s (see Chart 2.2). Similarly, the averagecompleted family size (CFS) has also fallen over the past three decades, and is projected toconverge to an assumed long-term fertility rate of 1.74 by around 2017.11 Chart 2.2 shows thatthis is below the fertility rate necessary to stabilise the aggregate population level in theabsence of migration (the ‘replacement rate’).12 As a result, positive net inward migration isprojected to be the sole driver of population growth from 2034 onwards. This contrasts withtrends observed over the past 20 years, when natural change (the number of births minus thenumber of deaths) has made a significant positive contribution to annual population growth.
Drivers ofpopulation
growth
9Long-term public finance report
62
66
70
74
78
82
205520452035202520152004
Chart 2.1: Total UK population
Millions
Principal High MigrationHigh Fertility High Longevity
Source: Government Actuary’s Department, 2004-based population projections.
10 See 2005 Long-term public finance report: an analysis of fiscal sustainability, HM Treasury, December 2005, page 10, formore details. 11 Note that total fertility rates and average completed family size may diverge in the short term as individuals in aggregatemay choose to ‘compress’ or ‘spread out’ births across their lifetimes. For example, if the population compresses thenumber of births at one point in time, then the fertility rate will temporarily be higher than the average completed familysize (as in the early 1960s). 12 A number of other developed countries currently observe a total fertility rate closer to the common replacement rate(2.1) than the UK. These include the US (2.09) Ireland (1.86) and France (1.84).
LO N G -T E R M S O C I O -E C O N O M I C T R E N D S2
2.9 In addition to the projected rise in the number of people living in the UK, GAD’sprojections also show a marked change in the composition of the population over the comingdecades, with the share of older people in the total population rising gradually. As shown inChart 2.1 above, the total population is projected to rise by over 15 per cent over the next 50years in the principal case. However, this overall increase masks wide variations between thegrowth rates of different age groups. Chart 2.3 shows that the younger working-agepopulation and the number of children are projected to remain relatively stable over theperiod, while the 55-64 year olds show a rise of nearly a quarter by 2055. This contrasts withlarge projected increases for the older age-groups: the 65-84 year olds will have grown bymore than half, and the 85+ group will have quadrupled by the end of the period.
An ageingpopulation
10 Long-term public finance report
1.0
1.5
2.0
2.5
3.0
3.5
203120212011200119911981197119611951
Chart 2.2: Total fertility rate and average completed family size, UK, 1951-2031
Children per woman
Total fertility rate Average completed family size
Source: Government Actuary’s Department, historical data and 2004-based principal population projections.
Replacement rate
Chart 2.3: Population indices by age group
Source: Government Actuary's Department, 2004-based principal population projections.
50
100
150
200
250
300
350
400
450
205520452035202520152004
2004 = 100
0-15 16-54 55-64 65-84 85+

LO N G -T E R M S O C I O -E C O N O M I C T R E N D S 22.10 The effect of the changes in the age structure of the population can be illustrated bythe evolution of the demographic old-age dependency ratio. This ratio shows the number ofpeople aged 65 years and over relative to the number of people aged 16 to 64 years. As can beseen from Chart 2.4 the demographic old-age dependency ratio has edged up slightly sincethe early 1970s, reaching around 25 per cent in the mid 1990s. The ageing process is expectedto accelerate significantly after 2010, with the ratio projected to rise to 42 per cent by 2040 andthen 45 per cent by the mid 2050s in the principal projections. In the high longevity variant,the old-age dependency ratio is projected to reach over 50 per cent by 2054, due to the highernumber of people aged 65 years and over. The ratio is projected to rise by slightly less in thehigh migration and high fertility variants than in the principal case. For the former, thisreflects the fact that migrants are assumed to be mainly of working age. For the latter, this isbecause the size of the working-age population will be boosted by an inflow of more youngpeople in the coming decades.
2.11 Projections of the demographic old-age dependency ratio are a useful way to assessthe projected demographic shift from the working-age population to the population over theage of 65. However, they are of limited use in evaluating possible changes in the agecomposition of the working-age population itself, which are likely to have significantimplications for future labour market trends. Box 2.1 provides more information on theprojected age structure of the working-age population.
11Long-term public finance report
Chart 2.4: Demographic old-age dependency ratios
Source: Government Actuary’s Department, historical data and 2004-based population projections.
20
25
30
35
40
45
50
55
60
205420442034202420142004199419841974
Per cent
Principal High MigrationHigh Fertility High Longevity
LO N G -T E R M S O C I O -E C O N O M I C T R E N D S2
2.12 The UK is not the only country with an ageing population; ageing is a trend seen inmost developed countries. Chart 2.5 shows that a number of EU Member States are projectedto observe an increase in the demographic old-age dependency ratio between 2005 and 2050in excess of 30 percentage points. This includes four of the new Member States that joined theEU in 2004 (Czech Republic, Poland, Slovakia and Slovenia), as well as Bulgaria and Romania,who will join in 2007.
Ageing: a globalphenomenon
12 Long-term public finance report
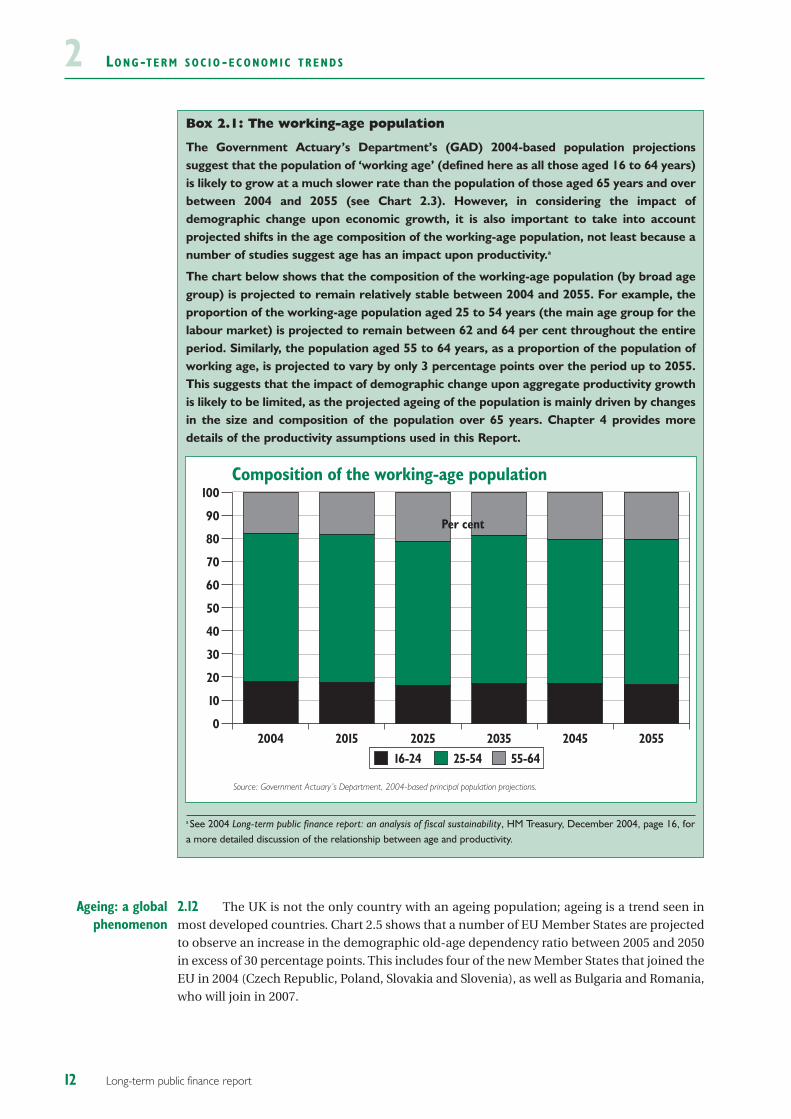
Box 2.1: The working-age population
The Government Actuary’s Department’s (GAD) 2004-based population projectionssuggest that the population of ‘working age’ (defined here as all those aged 16 to 64 years)is likely to grow at a much slower rate than the population of those aged 65 years and overbetween 2004 and 2055 (see Chart 2.3). However, in considering the impact ofdemographic change upon economic growth, it is also important to take into accountprojected shifts in the age composition of the working-age population, not least because anumber of studies suggest age has an impact upon productivity.a
The chart below shows that the composition of the working-age population (by broad agegroup) is projected to remain relatively stable between 2004 and 2055. For example, theproportion of the working-age population aged 25 to 54 years (the main age group for thelabour market) is projected to remain between 62 and 64 per cent throughout the entireperiod. Similarly, the population aged 55 to 64 years, as a proportion of the population ofworking age, is projected to vary by only 3 percentage points over the period up to 2055.This suggests that the impact of demographic change upon aggregate productivity growthis likely to be limited, as the projected ageing of the population is mainly driven by changesin the size and composition of the population over 65 years. Chapter 4 provides moredetails of the productivity assumptions used in this Report.
a See 2004 Long-term public finance report: an analysis of fiscal sustainability, HM Treasury, December 2004, page 16, fora more detailed discussion of the relationship between age and productivity.
0
10
20
30
40
50
60
70
80
90
100
205520452035202520152004
Composition of the working-age population
16-24 25-54 55-64
Source: Government Actuary’s Department, 2004-based principal population projections.
Per cent
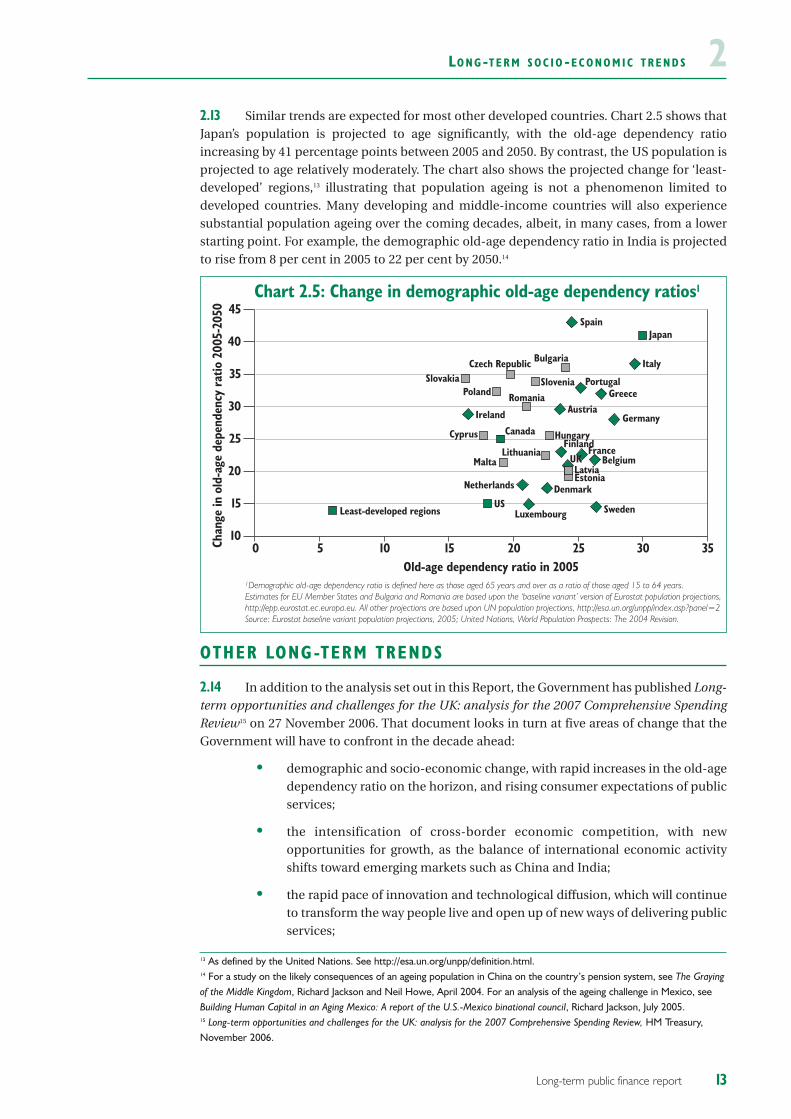
LO N G -T E R M S O C I O -E C O N O M I C T R E N D S 22.13 Similar trends are expected for most other developed countries. Chart 2.5 shows thatJapan’s population is projected to age significantly, with the old-age dependency ratioincreasing by 41 percentage points between 2005 and 2050. By contrast, the US population isprojected to age relatively moderately. The chart also shows the projected change for ‘least-developed’ regions,13 illustrating that population ageing is not a phenomenon limited todeveloped countries. Many developing and middle-income countries will also experiencesubstantial population ageing over the coming decades, albeit, in many cases, from a lowerstarting point. For example, the demographic old-age dependency ratio in India is projectedto rise from 8 per cent in 2005 to 22 per cent by 2050.14
OTHER LONG-TERM TRENDS
2.14 In addition to the analysis set out in this Report, the Government has published Long-term opportunities and challenges for the UK: analysis for the 2007 Comprehensive SpendingReview15 on 27 November 2006. That document looks in turn at five areas of change that theGovernment will have to confront in the decade ahead:
• demographic and socio-economic change, with rapid increases in the old-agedependency ratio on the horizon, and rising consumer expectations of publicservices;
• the intensification of cross-border economic competition, with newopportunities for growth, as the balance of international economic activityshifts toward emerging markets such as China and India;
• the rapid pace of innovation and technological diffusion, which will continueto transform the way people live and open up of new ways of delivering publicservices;
13Long-term public finance report
Chart 2.5: Change in demographic old-age dependency ratios1
1Demographic old-age dependency ratio is defined here as those aged 65 years and over as a ratio of those aged 15 to 64 years. Estimates for EU Member States and Bulgaria and Romania are based upon the ‘baseline variant’ version of Eurostat population projections, http://epp.eurostat.ec.europa.eu. All other projections are based upon UN population projections, http://esa.un.org/unpp/index.asp?panel=2Source: Eurostat baseline variant population projections, 2005; United Nations, World Population Prospects: The 2004 Revision.
0 5 10 15 20 25 30 3510
15
20
25
30
35
40
45
JapanSpain
ItalyBulgaria
PortugalGreece
Germany
FranceBelgium
Sweden
Denmark
Czech RepublicSlovakia
Poland RomaniaSlovenia
Austria
Netherlands
Ireland
CyprusFinland
Hungary
UKLatviaEstonia
LuxembourgUS
Least-developed regions
Canada
LithuaniaMalta
Old-age dependency ratio in 2005
Chan
ge in
old
-age
dep
ende
ncy
ratio
200
5-20
50
13 As defined by the United Nations. See http://esa.un.org/unpp/definition.html.14 For a study on the likely consequences of an ageing population in China on the country’s pension system, see The Grayingof the Middle Kingdom, Richard Jackson and Neil Howe, April 2004. For an analysis of the ageing challenge in Mexico, seeBuilding Human Capital in an Aging Mexico: A report of the U.S.-Mexico binational council, Richard Jackson, July 2005.15 Long-term opportunities and challenges for the UK: analysis for the 2007 Comprehensive Spending Review, HM Treasury,November 2006.
LO N G -T E R M S O C I O -E C O N O M I C T R E N D S2• continued global uncertainty with ongoing threats of international terrorism
and conflict and the continued imperative to tackle global poverty; and
• increasing pressures on our natural resources and global climate, requiringaction by governments, businesses, and individuals to maintain prosperityand improve environmental care.
2.15 It explains how the Government will use the CSR as a key milestone in making furtherprogress against its established long-term goals of sustainable growth and employment;fairness and opportunity; a secure and fair world; and modern and efficient public services inthe new context facing the UK.
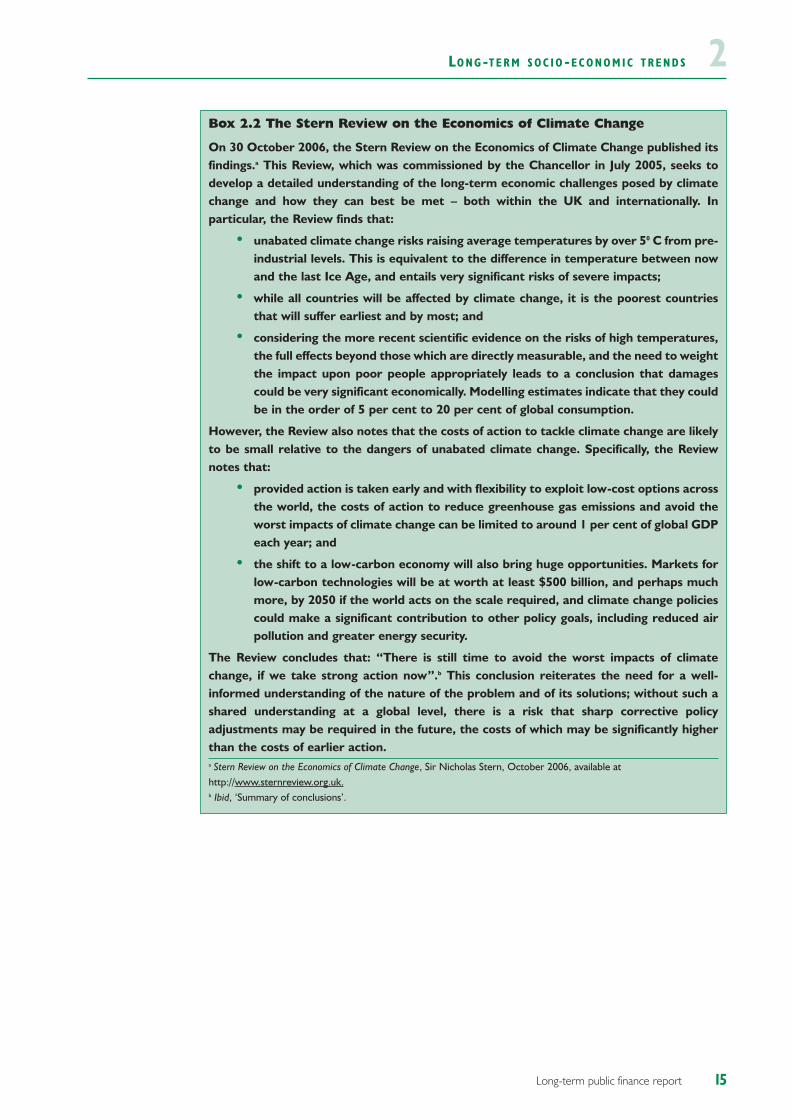
2.16 The CSR will be informed by a series of policy reviews to identify the cross-departmental actions and reforms necessary to seize opportunities and meet the challengesin the decade ahead. These reviews are set out in detail in Long-term opportunities andchallenges for the UK: analysis for the 2007 Comprehensive Spending Review.16 Box 2.2 providesmore details of the Stern Review on the Economics of Climate Change,17 which was publishedon 30 October 2006.
14 Long-term public finance report
16 Long-term opportunites and challenges for the UK: analysis for the 2007 Comprehensive Spending Review, HM Treasury,November 2006.17 Stern Review on the Economics of Climate Change, Sir Nicholas Stern, October 2006, available athttp://www.sternreview.org.uk.
LO N G -T E R M S O C I O -E C O N O M I C T R E N D S 2
15Long-term public finance report
Box 2.2 The Stern Review on the Economics of Climate Change
On 30 October 2006, the Stern Review on the Economics of Climate Change published itsfindings.a This Review, which was commissioned by the Chancellor in July 2005, seeks todevelop a detailed understanding of the long-term economic challenges posed by climatechange and how they can best be met – both within the UK and internationally. Inparticular, the Review finds that:
• unabated climate change risks raising average temperatures by over 50 C from pre-industrial levels. This is equivalent to the difference in temperature between nowand the last Ice Age, and entails very significant risks of severe impacts;
• while all countries will be affected by climate change, it is the poorest countriesthat will suffer earliest and by most; and
• considering the more recent scientific evidence on the risks of high temperatures,the full effects beyond those which are directly measurable, and the need to weightthe impact upon poor people appropriately leads to a conclusion that damagescould be very significant economically. Modelling estimates indicate that they couldbe in the order of 5 per cent to 20 per cent of global consumption.
However, the Review also notes that the costs of action to tackle climate change are likelyto be small relative to the dangers of unabated climate change. Specifically, the Reviewnotes that:
• provided action is taken early and with flexibility to exploit low-cost options acrossthe world, the costs of action to reduce greenhouse gas emissions and avoid theworst impacts of climate change can be limited to around 1 per cent of global GDPeach year; and
• the shift to a low-carbon economy will also bring huge opportunities. Markets forlow-carbon technologies will be at worth at least $500 billion, and perhaps muchmore, by 2050 if the world acts on the scale required, and climate change policiescould make a significant contribution to other policy goals, including reduced airpollution and greater energy security.
The Review concludes that: “There is still time to avoid the worst impacts of climatechange, if we take strong action now”.b This conclusion reiterates the need for a well-informed understanding of the nature of the problem and of its solutions; without such ashared understanding at a global level, there is a risk that sharp corrective policyadjustments may be required in the future, the costs of which may be significantly higherthan the costs of earlier action. a Stern Review on the Economics of Climate Change, Sir Nicholas Stern, October 2006, available athttp://www.sternreview.org.uk.b Ibid, ‘Summary of conclusions’.
LO N G -T E R M S O C I O -E C O N O M I C T R E N D S2DEALING WITH UNCERTAINTIES
2.17 One of the greatest challenges when assessing long-term trends is how to deal withthe high degree of uncertainty surrounding them.18 While some trends are pre-determinedand should therefore be relatively easy to predict, others are more difficult to quantify, andsome are not expected to occur. And even those trends that fall into the first group still havea high degree of uncertainty attached to them;19 the future evolution of longevity is a case inpoint. The challenge is made bigger by the fact that future trends are not often merely linearextrapolations of past developments. As a result, dramatic changes can happen over a veryshort period of time.
2.18 While GAD’s variant population projections provide a useful spectrum of how the UKpopulation may evolve, they do not provide a formal quantification of the level of uncertaintyassociated with future demographic trends. The ‘deterministic’ approach used by GAD (andby most official population forecasters) to establish projections of the population does notattach probabilities to different projection variants.
2.19 An alternative approach to projecting demographic trends is that of ‘stochastic’modelling, in which the key vital parameters (fertility rates, mortality rates and migrationflows) are shocked at random to establish projections of the population. This method allowsfor an explicit measurement of the uncertainty associated with predicting how the populationwill evolve, and can be used to attach probabilities to different realisations. For example, in astudy conducted by the National Institute of Economic and Social Research (NIESR),20 half ofthe stochastic simulations generated project the demographic old-age dependency ratio inthe UK to be between 44 per cent and 54 per cent by 2052.21
2.20 However, even stochastic modelling cannot capture the potential interdependenciesbetween the future paths of the underlying parameters. For example, it is highly likely thatfertility rates would fall endogenously in the event that the population expands to very largelevels. Many stochastic models do not incorporate these feedback mechanisms, and thereforedo not provide a comprehensive indication of the uncertainty associated with the projectionsthey generate.
Stochasticmodelling
16 Long-term public finance report
18 The Stern Review on the Economics of Climate Change (see Box 2.2) draws attention to the uncertainty associated withprojecting long-term trends by emphasising that “economic models over timescales of centuries do not offer preciseforecasts – but they are an important way to illustrate the scale of effects we might see”. See Press notice: Publication ofthe Stern Review on the Economics of Climate Change, HM Treasury, available at http://www.hm-treasury.gov.uk/newsroom-and-speeches/press/2006/press/stern-06.cfm.19 For example, a study of UK population projections cites a census from 1891 that projected the combined populationstock of Australia and New Zealand in 1981 to be 94 million, five times greater than the actual outcome. See Accuracy anduncertainty of the national population projections for the United Kingdom, Chris Shaw, Population Trends No.77, 1994, page24. The study was revealed in a letter to Royal Statistical Society News, February 1994. 20 Fiscal Implications of Demographic Uncertainty for the United Kingdom, James Sefton and Martin Weale, National Instituteof Economic and Social Research, 2005. 21 Stochastic population projections have also been generated for other countries. A recent study projects an 80 per centprobability that the total combined population of a group of European countries (the EU15 plus Norway, Iceland andSwitzerland) will be between 381 million and 474 million by 2050. See New Forecast: Population decline postponed inEurope, Juha Alho et al. Statistical Journal of the United Nations ECE 23, 2006. Similarly, stochastic projections suggest thatthere is a two-thirds probability that the population of Australia will be between 24.4 million and 31.8 million by 2051.See Australia’s uncertain demographic future, Tom Wilson and Martin Bell, Demographic Research Vol. 11, 2004.
LO N G -T E R M S O C I O -E C O N O M I C T R E N D S 22.21 Another way to shed light on how future trends might evolve is to construct scenarios.These scenarios could be based on pre-determined (and therefore reasonably predictable)trends and uncertain developments, which are possible (but not necessarily likely) and couldhave a major impact on future developments. Scenario planning is a well-establisheddiscipline and is conducted by governments and businesses alike. By their nature, scenariosare not limited to linear extrapolations of past trends but can also take account of abrupt(assumed) changes.
2.22 For example, in the UK the Government is sponsoring the Foresight project, whichhas looked at different issues that affect society and how these might evolve over the next 20years. Recent studies have covered issues as diverse as brain science, and the future of druguse and infrastructure systems. One of its current projects considers how levels of obesitymay evolve in the future, and aims to “produce a long term vision of how we can deliver asustainable response to obesity in the UK over the next 40 years”.
Scenarios
17Long-term public finance report
20 Other projects include an analysis of sustainable energy management, as well as a study into mental capital and wellbeing.

18 Long-term public finance report

1 Generally Accepted Accounting Practice.2 For more details of these approaches, see previous Long-term public finance reports, Chapters 3 and 4. A more
technical discussion of the fiscal indicators can be found in the 2002 Long-term public finance report: an analysis of fiscalsustainability, HM Treasury, November 2002.
3 AP P R OAC H E S T O A S S E S S I N G LO N G -T E R MF I S C A L S U S TA I N A B I L I T Y
Long-term public finance report
INTRODUCTION
3.1 This chapter sets out the different methodologies that can be used to assess the long-term sustainability of the public finances. The chapter provides a summary of threecomplementary approaches to assessing sustainability: the national accounts measure ofdebt, GAAP-based1 balance sheets and indicators based on comprehensive projections.
ASSESSING LONG-TERM FISCAL SUSTAINABILITY
3.2 Any assessment of long-term fiscal sustainability will have to be made against abenchmark. There are many possible definitions of sustainability. One definition is that agovernment should be able to meet its obligations if and when they arise in the future.Sustainability will therefore also depend on a government’s future revenue (with which itmight be able to meet its obligations) and the timing of the future obligations. The ability tomeet obligations when they arise implies that a government should consider debt financingonly as long as the debt burden remains at a prudent level. The definition is therefore in thespirit of the Government’s sustainable investment rule.
3.3 In this chapter three different approaches that could be used to assess long-termsustainability are discussed.2 These approaches are:
• the national accounts measure of public sector (net) debt;
• GAAP-based balance sheets, which will be prepared as part of Whole ofGovernment Accounts (WGA); and
• fiscal indicators based on comprehensive projections of future spending andrevenue.
3.4 These different approaches have their respective advantages and disadvantages.Measures of public debt have often been the prime focus when analysing the sustainability ofthe public finances. Debt (less liquid financial assets) is the cumulative effect of pastborrowing, and as such provides a measure of obligations created in the past that have beenaccumulated to date. One particular advantage is that the national accounts approach, whichunderpins measures of debt, is based on internationally agreed rules, allowing the publicfinances in one country to be compared with those in other countries. Furthermore, debt caneasily be understood and interpreted as a concept, helping to improve transparency.Obviously, debt is a backward-looking indicator and cannot answer the question of whethera government will be able to meet its obligations if and when they arise in the future.
3.5 GAAP-based accounts look at past transactions and the extent to which these havealready committed future funding flows; they therefore provide a fuller picture of an entity’sposition than a simple cash statement by including all of that entity’s assets and liabilities.One of the balance sheet’s advantages is that it will show a wider range of assets and liabilitiesthan net debt, including financial and non-financial assets and liabilities as well as provisionsfor future cash transfers arising from past events. However, as with debt, GAAP-based balancesheets are mainly backward-looking. For example, they do not include future spending andrevenue that will occur as a result of future events, which limits the balance sheet’s use inassessing long-term fiscal sustainability.
GAAP-basedbalance sheets
Nationalaccounts
measure of netdebt
Defining long-term fiscal
sustainability
19
AP P R OAC H E S T O A S S E S S I N G LO N G -T E R M F I S C A L S U S TA I N A B I L I T Y33.6 Indicators based on comprehensive projections will generally take account of existingliabilities (for example debt) but also include information about future spending and revenuestreams. As such they can provide an answer to the question whether government will be ableto meet its obligations if and when they arise in the future. The main limitation is thatprojecting into the future is inevitably subject to a high degree of uncertainty, makingsensitivity analysis and careful interpretation of the results important. Box 3.1 provides moreinformation on these indicators.
Indicators basedon
comprehensiveprojections
20 Long-term public finance report
AP P R OAC H E S T O A S S E S S I N G LO N G -T E R M F I S C A L S U S TA I N A B I L I T Y 3
21Long-term public finance report
Box 3.1: Indicators based on comprehensive projections
Top-down approach
The Code for Fiscal Stabilitya requires that illustrative long-term projections of the outlookfor the key fiscal aggregates are presented for a period of no less than ten years into thefuture, based on a range of plausible assumptions. These projections, which are presentedin Annex A of the Economic and Fiscal Strategy Report, are derived using a top-downapproach. This approach starts with a set of constraints on fiscal aggregates, for examplethe debt to GDP ratio, and then determines what spending or revenue path would berequired to meet these constraints, given likely demographic and economic developments.One of the main strengths of this approach is that it can be based on the assumption thatthe Government’s fiscal rules are met. As such, the top-down approach answers thequestion what resources are available for future spending, assuming that the fiscal rulesare met.
Bottom-up approach
The bottom-up approach projects the path of individual spending and revenue items,either in absolute terms or as a share of GDP, into the future, without any constraints onthe fiscal aggregates. Bottom-up projections can take into account a wide range of factorsincluding demographic developments, cost and demand drivers, and investmentrequirements. An advantage of bottom-up projections is that they allow the individualdrivers of each spending and revenue item to be examined in more detail. However, bylooking at taxation and spending items in isolation from the rest of a government’s fiscalpolicy decisions, the results can paint an unrealistic picture of the future path of aggregatespending and revenue.
A comprehensive set of bottom-up spending and revenue projections can also be used toderive future primary balances. A number of fiscal sustainability indicators are based onthe relationship of projected primary balances in the long term and the initial debt stock.These indicators form an integral part of the assessment of long-term fiscal sustainabilitypresented in this Report.b
Arguably the two most popular indicators in the economics literature are the so-calledintertemporal budget constraint (IBC) and the fiscal gap. These are also the mainindicators used in this Report. The intertemporal budget constraint states that the presentdiscounted value (PDV) of all future primary balances must equal the current level of debt.If the PDV of future primary balances is not sufficient to cover the current debt burden,then the fiscal stance needs to be tightened. The intertemporal budget gap, whichmeasures the extent of the imbalance, can be used to calculate the immediate andpermanent change in the fiscal stance to meet the IBC.
By contrast, the fiscal gap indicator calculates the immediate and permanent change in theprimary balance needed to achieve a certain, pre-determined debt target in the future.The required change in the primary balance to GDP ratio depends on the initial anddesired target ratios, the time horizon and the projected primary balance.
a Code for Fiscal Stability, HM Treasury, March 1998.b See 2005 Long-term public finance report: an analysis of fiscal sustainability, HM Treasury, December 2005, Chapter 3
for a more detailed discussion, while the 2002 Long-term public finance report: an analysis of fiscal sustainability, HMTreasury, November 2002, provides technical derivations of the indicators.

22 Long-term public finance report
1 This method was also adopted for the 2005 Long-term public finance report: an analysis of fiscal sustainability, HMTreasury, December 2006.
2 Coping with Ageing: A Dynamic Approach to Quantify the Impact of Alternative Policy Options on Future Labour Supply inOECD Countries, OECD, June 2004.
3 The 2005 projections of age-related expenditure (2004-2050) for the EU-25 Member States: underlying assumptions andprojection methodologies, Economic Policy Committee and European Commission, November 2005.
4 A S S U M P T I O N S
Long-term public finance report
DEMOGRAPHY
4.1 The population projections used in this Report are the latest projections available, inother words the Government Actuary’s Department (GAD) 2004-based principal populationprojections. These were published in October 2005 and were also used for the projections inthe 2005 Long-term public finance report. Chapter 2 provides more information on thesepopulation projections.
L ABOUR MARKET
4.2 The Report requires assumptions on labour market participation rates and theunemployment rate. These are needed for a number of reasons, including:
• transfers such as Jobseeker’s Allowance depend on unemployment rates;
• future state pension expenditure depends on entitlements. For example, thegradual rise in the female participation rate will, everything else equal, lead togreater pension spending in the future as these women build up higherpension entitlements; and
• projections of the working-age population, and assumptions on rates ofparticipation in the labour market and unemployment (and hence theemployment rate) are needed to derive employment levels. These in turn arenecessary, alongside productivity assumptions, to derive economic growthrates and hence future GDP levels.
4.3 This year’s Report uses the so-called ‘cohort’ method to project employment levels.1
Studies by the Organisation for Economic Co-operation and Development (OECD)2 andanalysis of the long-term sustainability of the public finances in EU Member Statesconducted by the European Union’s Economic Policy Committee (EPC) also utilise thisapproach.3
4.4 The cohort method of projecting employment trends captures the negative impact ofan ageing workforce on overall participation (due to older workers generally having lowerparticipation rates than younger workers) and the effect of current young cohorts graduallyreplacing current older cohorts. This is important, as given generations or cohorts have theirown specific level of participation that is usually different from the corresponding level ofparticipation of preceding generations. Annex B of the 2005 Long-term public finance reportprovides a more detailed discussion of the underlying methodology.
Projectingemployment
levels
23
A S S U M P T I O N S44.5 A major difference between this year’s and last year’s employment projections is thatthe former explicitly take into account the proposed changes to the State Pension age asannounced in the Government’s White Paper Security in retirement: towards a new pensionssystem,4 and set out in the Pensions Bill currently before Parliament.5 The White Paperproposes a gradual increase of the State Pension age in line with gains in average lifeexpectancy. This will begin with a rise from 65 to 66 years over a two-year period from 2024,then again by one year over a two-year period from 2034 and from 2044.
4.6 It is reasonable to assume that the proposed increases in the State Pension age asoutlined in the White Paper will have a positive effect on future participation levels. Historicalevidence suggests that the State Pension age has a significant impact on labour supplydecisions. Indeed, evidence from other countries suggests that the pension age is a majordeterminant of labour market participation rates at certain ages.6
4.7 However, it is difficult to predict with complete accuracy the impact of the proposedincrease in the State Pension age on labour markets, not least because the role of the StatePension age in the decision to participate may be very different in the future. To capture thisuncertainty in the employment projections, three variants have been developed, incollaboration with the Department for Work and Pensions (DWP): ‘lower’, ‘middle’ and‘upper’.7 Each of these variants represents a different estimate of the possible effect of theincrease in the State Pension age on future labour market participation. For the purposes ofthe projections used in this Report, the ‘middle’ variant has been used to capture the likelylabour market impact of the proposed increase in the State Pension age. Box 4.1 providesmore details of the approach used to construct each of these variants.
Employment andthe State Pension
age
24 Long-term public finance report
4 Security in retirement: towards a new pensions system, Department for Work and Pensions, May 2006. Box 4.2 providesdetails of the assumptions used to account for the pensions reforms in projections of State Pension expenditure.
5 The approach used to model the impact of the proposed increase in the State Pension age upon employment isconsistent with the methodology adopted in Pensions Bill: Regulatory Impact Assessment, Department for Work andPensions, November 2006.
6 A cross-country analysis of 22 OECD countries finds that the ‘standard retirement age’ has a significant and positiveeffect on the participation rate of the 60-64 and 65+ age groups. See The retirement effects of old-age pension and earlyretirement schemes in OECD countries, Romain Duval, OECD working paper no. 270, 2003. Similarly, New Zealandobserved a substantial increase in participation rates of the 55-59 and 60-64 age groups following an increase in thepension age from 60 years to 65 years between 1992 and 2001. See 2005 Long-term public finance report: an analysis offiscal sustainability, HM Treasury, December 2005, page 74, for more information on the New Zealand pensions reformand its impact on labour market activity.
7 The increase in the female State Pension age from 60 years to 65 years over the period 2010 to 2020 is also taken intoaccount in the employment projections, using a similar approach. For more details, see 2005 Long-term public financereport: an analysis of sustainability, HM Treasury, December 2005, page 73.

A S S U M P T I O N S 4
25Long-term public finance report
Box 4.1: Adjusting for the proposed increase in the State Pension age
To capture the possible labour market effects of the proposed increase in the State Pensionage, two behavioural effects were considered. A ‘lower’ estimate is to assume that thosecohorts affected by the reform only increase their labour supply at the age(s) for whichthey are no longer eligible for a state pension. In other words, for the increase in the StatePension age from 65 to 66 years between 2024 and 2026 it is assumed that the cohortsaffected by this change (such as females born in 1965) only adjust their labour marketbehaviour at the age of 65. This is the minimum behavioural response that can reasonablybe expected. As can be seen from the chart below, this adjustment is made byextrapolating the participation rate profile so that the slope of the profile is constant from63 years to 65 years. A similar assumption is used to adjust the participation rates of 65and 66 year olds following the increase in the State Pension age to 67 (between 2034 and2036) and the participation rates of 65, 66 and 67 year olds following the increase in theState Pension age to 68 (between 2044-46).
By contrast, the ‘upper’ estimate assumes that those cohorts affected by the increase inthe State Pension age begin to increase their labour supply earlier in their lifetimes, fromthe age of 55 onwards.a Specifically, for the increase in the State Pension age to 66 yearsit is assumed that the participation rate profiles of these cohorts are ‘shifted’ to the rightby one year. As can be seen from the chart, this adjustment increases the participation rateat 65 years of females born in 1965 by around 15 percentage points (a similar approach isused for males). For the subsequent increases in the State Pension age to 67 and 68 years,the participation rate profiles of cohorts affected by these changes are shifted to the rightfrom the age of 55 years by two and three years respectively.
The ‘middle’ variant represents an average of these two behavioural extremes, andtherefore provides a reasonable estimate of the likely labour market effect of the proposedincrease in the State Pension age.b Box 4.2 provides details of the assumptions used toaccount for the pensions reforms in projections of state pension expenditure.
a Historical data indicate that participation rates typically begin to fall significantly from the age of 55 onwards. It istherefore reasonable to assume that this is the earliest age at which the State Pension age begins to affect behaviour.
b The effect of the State Pension age on labour market participation using the ‘middle variant’ is broadly in line withestimates of the labour market effect of the State Pension age produced in a recent study by the Office for NationalStatistics. See Labour Force Projections 2006-2020, Office for National Statistics, January 2006.
Projected participation rate profile: females born in 1965
0
10
20
30
40
50
60
70
80
90
69686766656463626160595857565554
Source: HM Treasury.
Post-White Paper: LowerPre-White Paper Post-White Paper: Middle
Post-White Paper: Upper
Per cent
Age
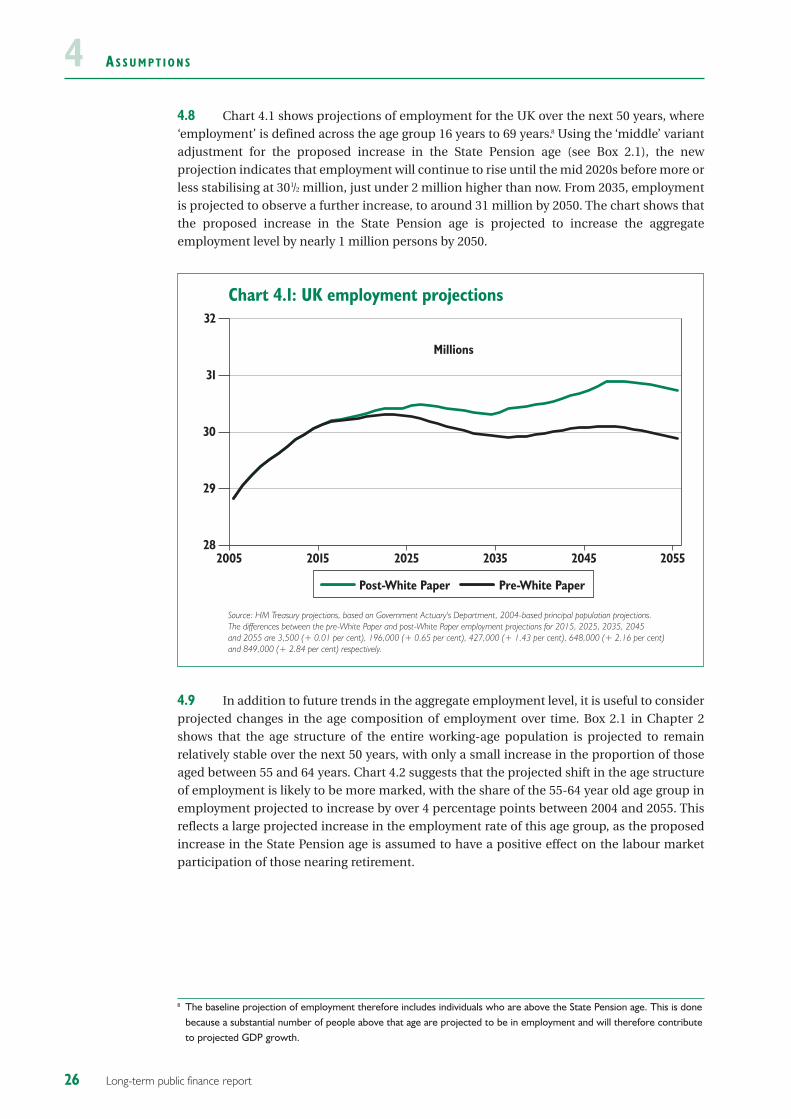
A S S U M P T I O N S44.8 Chart 4.1 shows projections of employment for the UK over the next 50 years, where‘employment’ is defined across the age group 16 years to 69 years.8 Using the ‘middle’ variantadjustment for the proposed increase in the State Pension age (see Box 2.1), the newprojection indicates that employment will continue to rise until the mid 2020s before more orless stabilising at 301/2 million, just under 2 million higher than now. From 2035, employmentis projected to observe a further increase, to around 31 million by 2050. The chart shows thatthe proposed increase in the State Pension age is projected to increase the aggregateemployment level by nearly 1 million persons by 2050.
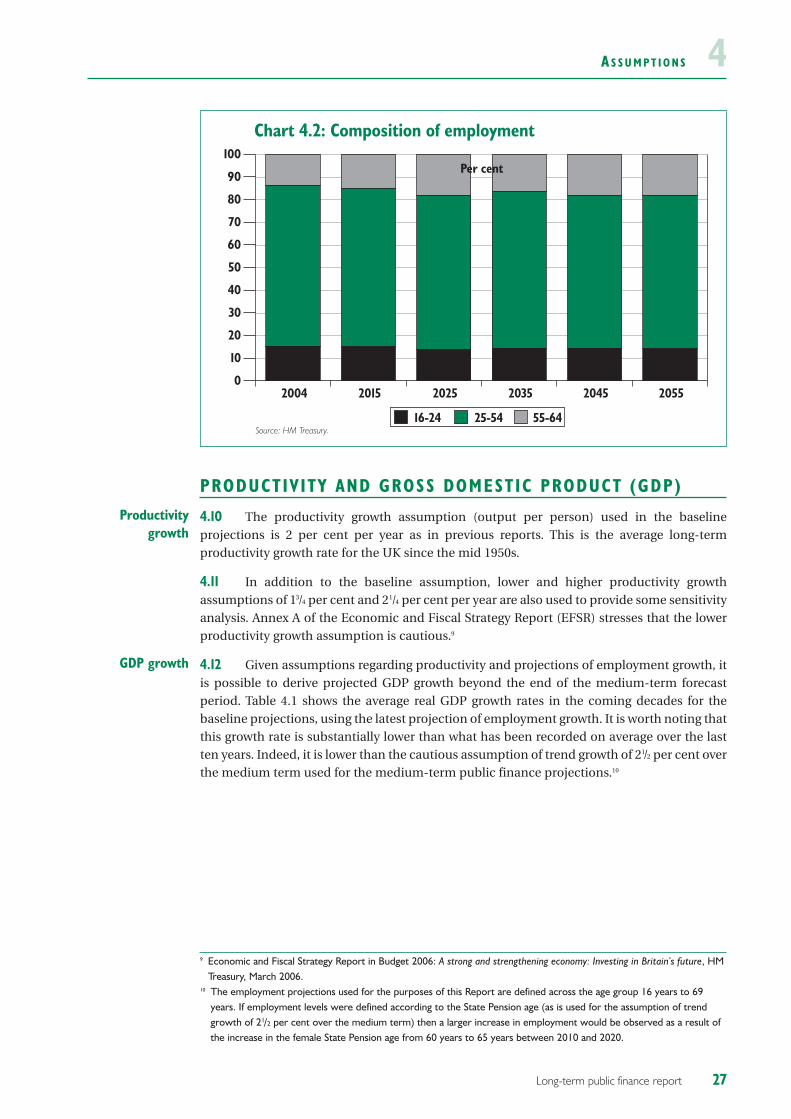
4.9 In addition to future trends in the aggregate employment level, it is useful to considerprojected changes in the age composition of employment over time. Box 2.1 in Chapter 2shows that the age structure of the entire working-age population is projected to remainrelatively stable over the next 50 years, with only a small increase in the proportion of thoseaged between 55 and 64 years. Chart 4.2 suggests that the projected shift in the age structureof employment is likely to be more marked, with the share of the 55-64 year old age group inemployment projected to increase by over 4 percentage points between 2004 and 2055. Thisreflects a large projected increase in the employment rate of this age group, as the proposedincrease in the State Pension age is assumed to have a positive effect on the labour marketparticipation of those nearing retirement.
26 Long-term public finance report
Chart 4.1: UK employment projections
28
29
30
31
32
205520452035202520152005
Millions
Post-White Paper Pre-White Paper
Source: HM Treasury projections, based on Government Actuary's Department, 2004-based principal population projections. The differences between the pre-White Paper and post-White Paper employment projections for 2015, 2025, 2035, 2045 and 2055 are 3,500 (+ 0.01 per cent), 196,000 (+ 0.65 per cent), 427,000 (+ 1.43 per cent), 648,000 (+ 2.16 per cent)and 849,000 (+ 2.84 per cent) respectively.
8 The baseline projection of employment therefore includes individuals who are above the State Pension age. This is donebecause a substantial number of people above that age are projected to be in employment and will therefore contributeto projected GDP growth.
A S S U M P T I O N S 4
PRODUCTIVITY AND GROSS DOMESTIC PRODUCT (GDP)
4.10 The productivity growth assumption (output per person) used in the baselineprojections is 2 per cent per year as in previous reports. This is the average long-termproductivity growth rate for the UK since the mid 1950s.
4.11 In addition to the baseline assumption, lower and higher productivity growthassumptions of 13/4 per cent and 21/4 per cent per year are also used to provide some sensitivityanalysis. Annex A of the Economic and Fiscal Strategy Report (EFSR) stresses that the lowerproductivity growth assumption is cautious.9
4.12 Given assumptions regarding productivity and projections of employment growth, itis possible to derive projected GDP growth beyond the end of the medium-term forecastperiod. Table 4.1 shows the average real GDP growth rates in the coming decades for thebaseline projections, using the latest projection of employment growth. It is worth noting thatthis growth rate is substantially lower than what has been recorded on average over the lastten years. Indeed, it is lower than the cautious assumption of trend growth of 21/2 per cent overthe medium term used for the medium-term public finance projections.10
GDP growth
Productivitygrowth
27Long-term public finance report
9 Economic and Fiscal Strategy Report in Budget 2006: A strong and strengthening economy: Investing in Britain’s future, HMTreasury, March 2006.
10 The employment projections used for the purposes of this Report are defined across the age group 16 years to 69years. If employment levels were defined according to the State Pension age (as is used for the assumption of trendgrowth of 21/2 per cent over the medium term) then a larger increase in employment would be observed as a result ofthe increase in the female State Pension age from 60 years to 65 years between 2010 and 2020.
Chart 4.2: Composition of employment
Source: HM Treasury.
0
10
20
30
40
50
60
70
80
90
100
205520452035202520152004
16-24 25-54 55-64
Per cent
A S S U M P T I O N S4Table 4.1: Real GDP growth and its components in the baseline scenario (per cent)1
Year 2015-16 2025-26 2035-36 2045-46to 2024-25 to 2034-35 to 2044-45 to 2054-55
Productivity 2 2 2 2
Employment 0 0 0 0
Real GDP 2 2 2 2
1 Productivity growth is 13/4 per cent and 21/4 per cent in the low and high productivity scenarios respectively.
Source: HM Treasury.
DISCOUNT/DEBT INTEREST RATE
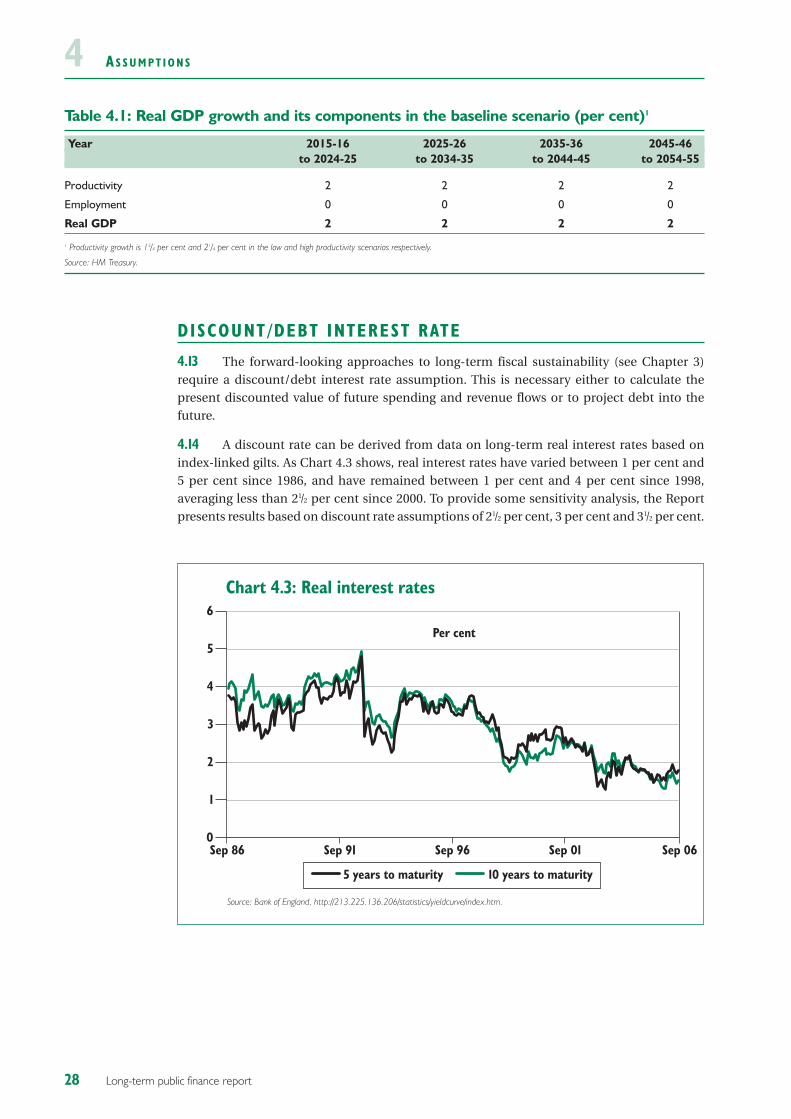
4.13 The forward-looking approaches to long-term fiscal sustainability (see Chapter 3)require a discount/debt interest rate assumption. This is necessary either to calculate thepresent discounted value of future spending and revenue flows or to project debt into thefuture.
4.14 A discount rate can be derived from data on long-term real interest rates based onindex-linked gilts. As Chart 4.3 shows, real interest rates have varied between 1 per cent and5 per cent since 1986, and have remained between 1 per cent and 4 per cent since 1998,averaging less than 21/2 per cent since 2000. To provide some sensitivity analysis, the Reportpresents results based on discount rate assumptions of 21/2 per cent, 3 per cent and 31/2 per cent.
28 Long-term public finance report
Chart 4.3: Real interest rates
Source: Bank of England, http://213.225.136.206/statistics/yieldcurve/index.htm.
0
1
2
3
4
5
6
Sep 06Sep 01Sep 96Sep 91Sep 86
Per cent
5 years to maturity 10 years to maturity
A S S U M P T I O N S 44.15 The discount/debt interest rate assumptions are higher than the real interest rates forUK government bonds with five- and ten-year maturities have been since the end of the1990s.11 However, they are in line with the recommendations of the 2003 Green Book.12 TheGreen Book is a best practice guide for all central Government departments and executiveagencies on the process of project appraisal and evaluation. The 2003 Green Bookrecommends a discount rate of 31/2 per cent but also states that there are a number ofcircumstances (for example when the impacts occur over the long term as in thesecalculations of long-term fiscal sustainability), in which a lower discount rate may beappropriate.13
SPENDING AND REVENUE
4.16 The long-term projections are based on the assumption of current policy, in otherwords it is assumed that the Government will leave current policy unchanged in the future.This should not be interpreted as meaning that policy will not change over time but it is usedso that the long-term projections do not prejudge future Government policy. The assumptionof current policy is frequently used in long-term projections, for example in the illustrativelong-term fiscal projections in Annex A of the EFSR and by the EPC.14
4.17 Current policy has been interpreted as all policy already in place or announced in thisyear’s Pre-Budget Report. Current policy refers to the level of per capita spending and revenuein 2011-12, in other words what is used for the projections is the level of spending andrevenue per head at the end of the medium term, and not the growth rate of spending andrevenue in that particular year. Box 4.2 provides more information on the assumptions usedin this Report relating to the Pensions White Paper.
Current policiesare assumed
29Long-term public finance report
11 See 2005 Long-term public finance report: an analysis of fiscal sustainability, HM Treasury, December 2005, page 35 for a discussion of ultra-long gilt issuance by the UK Debt Management Office in 2005.
12 The Green Book: appraisal and evaluation in central government, HM Treasury, 2003.13 The EU’s Economic Policy Committee also assumes a real interest rate of 3 per cent for the purposes of their age-
related spending projections. See The impact of ageing on public expenditure: projections for the EU25 Member States onpensions, health care, long-term care, education and unemployment transfers, Economic Policy Committee and EuropeanCommission, February 2006.
14 Ibid.
A S S U M P T I O N S4
30 Long-term public finance report
Box 4.2: Projecting state pension spending
The Pensions White Papera published in May 2006 announced a set of reforms to statepensions. Included in these reforms was the commitment to re-link the basic State Pensionto increases in average earnings. The White Paper stated that: “During the next Parliament,we will re-link the uprating of the basic State Pension to average earnings. Our objective,subject to affordability and the fiscal position, is to do this in 2012, but in any event by the endof the next Parliament at the latest. We will make a statement at the beginning of the nextParliament.”b
The Long-term public finance report provides a comprehensive analysis of long-term socio-economic and demographic developments, and their likely impact on the public finances.It does not provide a framework for making decisions around shorter-term spendingcommitments and as such does not provide an assessment of the affordability of statepension reforms in the short to medium term.
For the modelling of White Paper reforms it is assumed that the reforms to state pensionsand Pension Credit announced in the White Paper, and now set out in the Pensions BillRegulatory Impact Assessment, are implemented. Consistent with the White Paperstatement above, and the figures presented in the White Paper, it is assumed that the basicState Pension is linked to increases in average earnings from 2012 onwards. This is aprudent and cautious assumption and leads to an upper estimate of the cost of the basicState Pension uprating. The decision on when to re-link the basic State Pension to earningswill be subject to affordability and the fiscal position.
In addition it is assumed that, as set out in the White Paper:
• the State Second Pension is reformed so that it becomes a simple flat-rate weeklytop-up to the basic State Pension. Accruals will start to become flat rate at thesame time as the basic State Pension is linked to earnings. It is estimated that theState Second Pension will become completely flat rate around 2030 or shortlyafterwards;
• before implementing the earnings link of the basic State pension, means-testedprovision continues to be focused on those with small savings, by taking steps from2008 to target the Pension Credit on this group; and
• from 2010 the contributory principle is radically reformed by recognisingcontributions to society while retaining the link between rights and responsibilities.
To simplify decision-making, members of defined contribution pension schemes will nolonger be able to contract out of the State Second Pension. It is expected that thismeasure will commence at the same time as the basic State Pension is linked to earnings.
These assumptions have been incorporated in the baseline projections for ‘state pensions’expenditure, along with the assumption that the State Pension age will be raised graduallyin line with expected gains in average life expectancy, beginning with a rise from 65 yearsto 66 years over a two-year period from 2024, then again by one year over a two-yearperiod from 2034 and from 2044. Box 4.1 provides details of the assumptions used to capturethe potential labour market effects of the proposed increase in the State Pension age.
a Security in retirement: towards a new pensions system, Department for Work and Pensions, May 2006.b Ibid, page 17.c Pensions Bill: Regulatory Impact Assessment, Department for Work and Pensions, November 2006.

A S S U M P T I O N S 44.18 This year’s Report is based on updated age profiles for males and females for all majorspending and revenue categories.15 Previous reports were based on profiles, which had mainlybeen calculated by the National Institute of Economic and Social Research (NIESR), and usedbefore in the context of generational accounts for the UK.16 As in previous years, the profileshave been derived from household or individual micro-data. Where necessary, otherGovernment departments also provided data. The profiles present the latest data available.
4.19 The profiles capture the age distribution of spending and revenue over arepresentative individual’s lifetime. The intuition behind the age profiles can be bestdescribed with a simple example. Assume that a person lives only two ages, ‘young’ and ‘old’.When ‘young’ the person consumes £10 of a particular government service, when ‘old’ £20.Lifetime consumption is therefore £30. The age profile would therefore be a third for ‘young’and two-thirds for ‘old’. Note that this age profile does not say anything about the absoluteamount of consumption. The same profile would apply if the person consumed £1000 when‘young’ and £2000 when ‘old’. This approach can be extended to cover all possible ages (in thisexercise the age limit is set to 101 years).
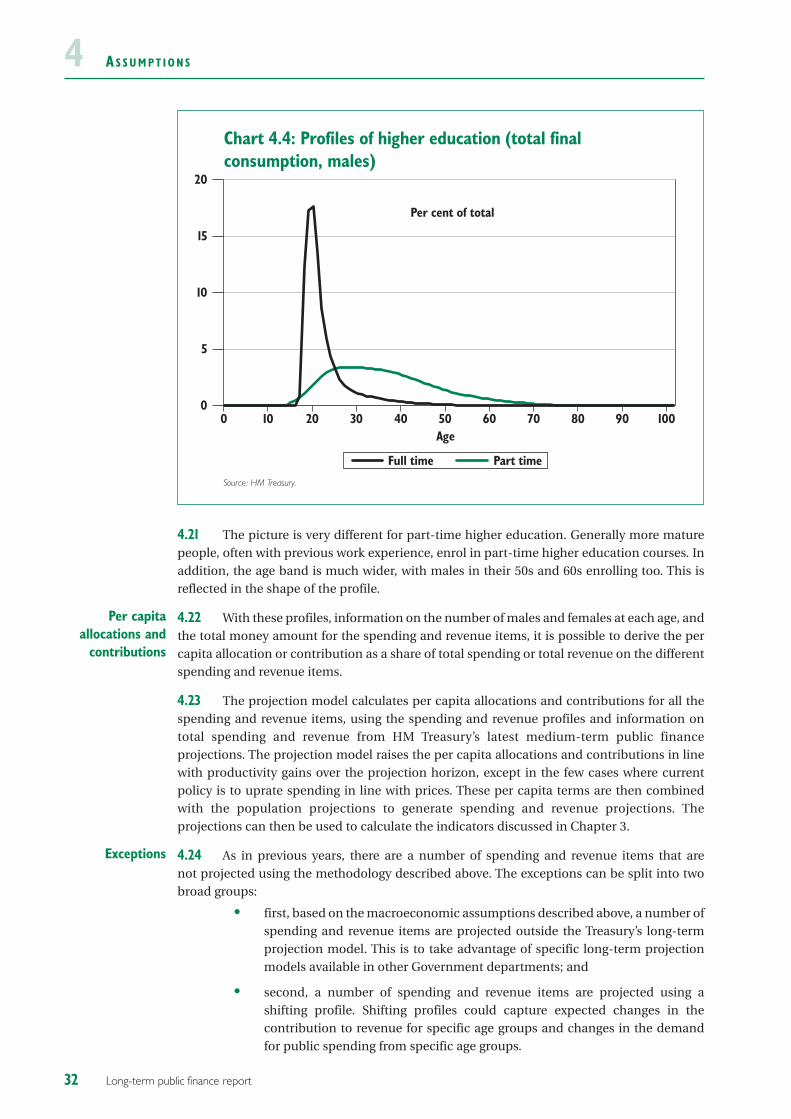
4.20 Chart 4.4 provides the age profiles for full-time and part-time higher education for arepresentative male as examples.17 Assuming that the representative male will live to 101years, the profile shows the percentage consumed of total lifetime spending on full-time(part-time) education at any specific age. Over the entire life, the representative male willconsume all of the full-time (part-time) spending on higher education and hence the areabelow the profile will add up to 100 per cent. The chart shows that the representative maleconsumes around 171/2 per cent of total lifetime spending on full-time higher education inevery year between the ages of 20 and 22, in other words around half of lifetime spending willbe consumed aged 20 to 22 years. After the age of 22, the profile shows a rapid decline,converging towards 0 by age 50. This reflects the fact that the number of students enrolled infull-time higher education drops rapidly with increases in age.
Updatedspending and
revenue profiles
31Long-term public finance report
15 The breakdown of spending and revenue follows the classification of function of government (COFOG).16 For more details how the specific profiles were derived see Generational accounting in the UK, Roberto Cardarelli,
James Sefton, and Laurence J. Kotlikoff, Economic Journal, 2000.17 More examples can be found in previous reports.
A S S U M P T I O N S4
4.21 The picture is very different for part-time higher education. Generally more maturepeople, often with previous work experience, enrol in part-time higher education courses. Inaddition, the age band is much wider, with males in their 50s and 60s enrolling too. This isreflected in the shape of the profile.
4.22 With these profiles, information on the number of males and females at each age, andthe total money amount for the spending and revenue items, it is possible to derive the percapita allocation or contribution as a share of total spending or total revenue on the differentspending and revenue items.
4.23 The projection model calculates per capita allocations and contributions for all thespending and revenue items, using the spending and revenue profiles and information ontotal spending and revenue from HM Treasury’s latest medium-term public financeprojections. The projection model raises the per capita allocations and contributions in linewith productivity gains over the projection horizon, except in the few cases where currentpolicy is to uprate spending in line with prices. These per capita terms are then combinedwith the population projections to generate spending and revenue projections. Theprojections can then be used to calculate the indicators discussed in Chapter 3.
4.24 As in previous years, there are a number of spending and revenue items that are not projected using the methodology described above. The exceptions can be split into twobroad groups:
• first, based on the macroeconomic assumptions described above, a number ofspending and revenue items are projected outside the Treasury’s long-termprojection model. This is to take advantage of specific long-term projectionmodels available in other Government departments; and
• second, a number of spending and revenue items are projected using ashifting profile. Shifting profiles could capture expected changes in thecontribution to revenue for specific age groups and changes in the demandfor public spending from specific age groups.
Exceptions
Per capitaallocations and
contributions
32 Long-term public finance report
Chart 4.4: Profiles of higher education (total final consumption, males)
Source: HM Treasury.
0
5
10
15
20
1009080706050403020100
Per cent of total
Full time Part time
Age
A S S U M P T I O N S 44.25 The social security and public service pension projections fall into the first group. TheDepartment for Work and Pensions projects social security spending, using models whichcapture the complexities of the individual benefit item. The GAD projects unfunded publicservice pensions, again using models specifically designed for this purpose.18 As a result, theGAD projections pick up scheme-specific characteristics such as maturity and the agestructure of the workforce as well as scheme-specific policies, which would not be capturedby the Treasury’s long-term projection model.
4.26 The second group comprises the income tax and national insurance contributions(NICs) projections. The profiles for these items have been shifted so as to maintainconsistency with the employment projections. As discussed above, the employment rate of,in particular, older females, is projected to increase over the coming decades. Everything elseequal, higher employment rates should lead to higher income tax and NICs. A fixed profilewould fail to pick up this expected increase. Chart 4.5 shows the shift in the income tax profilefor females over time.
4.27 The 2004 and 2005 Long-term public finance reports assumed that healthy lifeexpectancy increases in line with rises in overall life expectancy.19 To capture this assumption,the health and long-term care profiles were shifted to the right. Unlike in the 2004 and 2005reports, the health and long-term care profiles used in this year’s Report have not beenshifted. Recent evidence published by the King’s Fund suggests that improvements in healthylife expectancy in the UK might have not been as marked over previous decades as previously
Refinedmodelling ofhealth care
trends
33Long-term public finance report
Chart 4.5: Profile of income tax (female)
Source: HM Treasury.
0
1
2
3
2005 20352015 20452025
Per cent of total
Age0 10 20 30 40 50 60 70 80 90 100
18 The Government Actuary’s Department intends to publish by the end of 2006 information on the methodology andassumptions adopted for their projections of cash flows in respect of unfunded public service pension schemes. Seehttp://www.gad.gov.uk.
19 See 2004 Long-term public finance report: an analysis of fiscal sustainability, HM Treasury, December 2004, pages 18 to19 for a discussion of trends in healthy life expectancy.

A S S U M P T I O N S4thought.20 Rather than growing in line with overall life expectancy, healthy life expectancyappears to have increased less rapidly.21 The baseline health and long-term care projectionspresented in Chapter 5 are therefore based on unchanged profiles. This is in line with acautious approach to assessing the long-term sustainability of the public finances. However,global evidence is mixed. For example, studies in the United States found that healthy lifeexpectancy has risen significantly over the last few decades.22 To illustrate the sensitivity of thehealth projections to changes in the underlying assumptions, Chapter 5 provides a variantprojection based on shifting profiles.
4.28 In addition, separate profiles of per capita expenditure by age band were developedfor survivors and decedents, for the Hospital and Community Health Services (HCHS). Thisfollows the approach used in the Wanless review 23 and constitutes a significant improvementon the methodology used in previous years. The basis for the approach is the finding that ahigh proportion of lifetime utilisation of health care costs is concentrated in the final year oflife. As the Wanless review argued: “…there is a considerable body of evidence from theUK and other countries that demonstrates that acute health care costs are strongly associatedwith proximity to death”.24 If this finding is ignored and a single profile is used for survivorsand decedents, the impact of demographic pressures is over-estimated.
4.29 Estimates of total HCHS expenditure by age band are available from the Departmentof Health programme budget 2003-04. Estimates of the ratio of per capita expenditure by ageon survivors and decedents are available from an analysis of Scottish data conducted for theWanless review. The programme budget estimates were split between survivors anddecedents, by age band, on the basis of the Scottish findings.25
34 Long-term public finance report
20 Securing Good Care for Older People: Taking a long-term view, Derek Wanless, 2006. 21 Recent estimates (for Great Britain) produced by the Office for National Statistics indicate that healthy life expectancy,
as a share of total life expectancy fell from 91 per cent in 1981 to 881/2 per cent in 2001 for males, and from 87 percent in 1981 to 851/2 per cent in 2001 for females. Seehttp://www.statistics.gov.uk/StatBase/Product.asp?vlnk=12964&Pos=3&ColRank=2&Rank=272.
21 Estimates presented in Long-Term Trends in Life Expectancy and Active Life Expectancy in the United States, Kenneth G.Manton, XiLiang Gu and Vicky L. Lamb, Population and Development Review, 2006 suggest that ‘active’ life expectancy(one of a number of measures of ‘healthy’ life expectancy) at 65 years increased more rapidly than total life expectancybetween 1982 and 1999.
23 Securing our Future Health: Taking a long-term view Interim Report, Derek Wanless, 2001.24 Ibid, page 137.25 Proximity to death and acute health care utilisation in Scotland, Barbara Graham and Yvonne Goodall, Scottish Executive,
2002.
5 RE S U LT S
Long-term public finance report
INTRODUCTION
5.1 This chapter presents the results of this year’s Long-term public finance report. Theresults are presented in terms of indicators based on historical data and forward-lookingindicators. The latter are presented on a range of discount rate and productivity growth rateassumptions, thereby illustrating some of the uncertainty regarding long-term projections.1
The results are compared with those presented in previous reports and other internationalstudies.
5.2 The analysis in this Report assumes, for modelling purposes, that spending andtaxation policies at the end of the medium term, as presented in the 2006 Pre-Budget Report,2
are continued into the future. The nature of these assumptions does not mean that theGovernment has made a commitment to continue current policy. Similarly, it does not meanthat there will be no changes to spending and taxation in the future, the former, for example,will depend on the results of future Spending Reviews.
5.3 As discussed in Chapter 3, there are a variety of indicators that can be used to assesslong-term fiscal sustainability. What matters from the Government’s perspective is keepingwithin the fiscal rules as discussed in Chapter 1. Importantly, the Government aims to meetthe fiscal rules over the cycle. It does not make sense to try to set fiscal policy now to meetexactly the fiscal rules over, say, 20, 50 or 100 years – the uncertainties are simply too great.Moreover, at these horizons the range of policy instruments available is much greater thansimply changing spending plans and tax rates. A wide range of structural reforms could alsomake a vital contribution.
INDICATORS BASED ON HISTORICAL DATA
Net debt , net worth and indicat ive net l iab i l i t ies
5.4 A common starting point for thinking about long-term fiscal sustainability is toconsider a sustainable debt to GDP ratio. The Government’s sustainable investment rule isbased on this idea. The sustainable investment rule states that public sector net debt will beheld at a stable and prudent level over the cycle, and that, other things equal, net debt will bemaintained below 40 per cent of GDP over the economic cycle.
5.5 The national accounts measure of net debt is one of the key fiscal aggregates and isthe basis for the Government’s sustainable investment rule. The Government has reduced netdebt, as a share of GDP, from more than 40 per cent in 1997-98 and Chart 5.1 shows that netdebt has remained well below 40 per cent since then. Chapter 2 of the 2006 Pre-Budget Reportprovides updated projections of net debt as a share of GDP up to 2011-12.3,4 The chart alsoshows the public sector’s net worth position, which is also taken from the national accounts.Net worth is a broader measure of sustainability than net debt as it includes non-financial, as
Long-termsustainability and
the fiscal rules
35
1 The assumptions used in this Report are stated in Chapter 4.2 2006 Pre-Budget Report, HM Treasury, December 2006.3 Ibid.4 In September 2006, the Office for National Statistics published estimates of Public Sector Net Debt including imputedfinance lease liabilities. These liabilities arise mainly from Public Private Partnerships and Private Finance Initiativesprojects. These data had not been included before due to data quality issues.
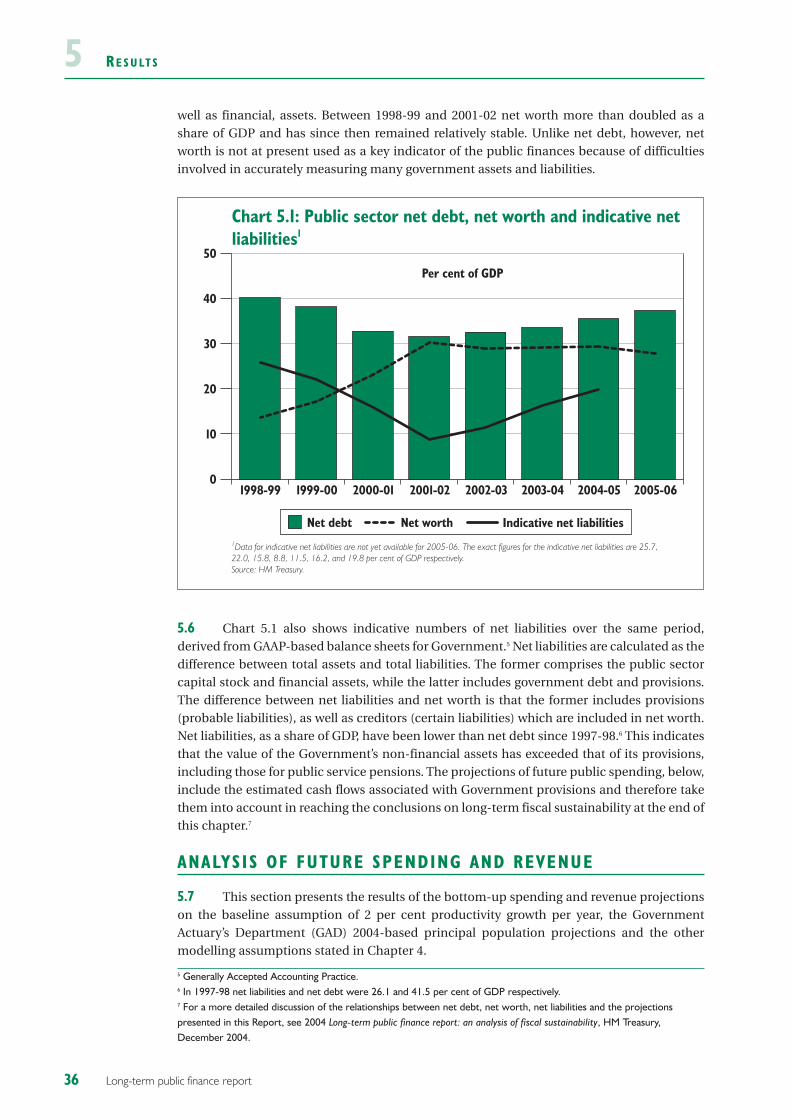
RE S U LT S5well as financial, assets. Between 1998-99 and 2001-02 net worth more than doubled as ashare of GDP and has since then remained relatively stable. Unlike net debt, however, networth is not at present used as a key indicator of the public finances because of difficultiesinvolved in accurately measuring many government assets and liabilities.
5.6 Chart 5.1 also shows indicative numbers of net liabilities over the same period,derived from GAAP-based balance sheets for Government.5 Net liabilities are calculated as thedifference between total assets and total liabilities. The former comprises the public sectorcapital stock and financial assets, while the latter includes government debt and provisions.The difference between net liabilities and net worth is that the former includes provisions(probable liabilities), as well as creditors (certain liabilities) which are included in net worth.Net liabilities, as a share of GDP, have been lower than net debt since 1997-98.6 This indicatesthat the value of the Government’s non-financial assets has exceeded that of its provisions,including those for public service pensions. The projections of future public spending, below,include the estimated cash flows associated with Government provisions and therefore takethem into account in reaching the conclusions on long-term fiscal sustainability at the end ofthis chapter.7
ANALYSIS OF FUTURE SPENDING AND REVENUE
5.7 This section presents the results of the bottom-up spending and revenue projectionson the baseline assumption of 2 per cent productivity growth per year, the GovernmentActuary’s Department (GAD) 2004-based principal population projections and the othermodelling assumptions stated in Chapter 4.
36 Long-term public finance report
5 Generally Accepted Accounting Practice.6 In 1997-98 net liabilities and net debt were 26.1 and 41.5 per cent of GDP respectively.7 For a more detailed discussion of the relationships between net debt, net worth, net liabilities and the projectionspresented in this Report, see 2004 Long-term public finance report: an analysis of fiscal sustainability, HM Treasury,December 2004.
Chart 5.1: Public sector net debt, net worth and indicative net liabilities1
1Data for indicative net liabilities are not yet available for 2005-06. The exact figures for the indicative net liabilities are 25.7,22.0, 15.8, 8.8, 11.5, 16.2, and 19.8 per cent of GDP respectively.Source: HM Treasury.
0
10
20
30
40
50
2005-062004-052003-042002-032001-022000-011999-001998-99
Per cent of GDP
Net debt Indicative net liabilitiesNet worth

RE S U LT S 5Spending pro ject ions
5.8 Caution must be exercised when interpreting the long-term spending projectionsbecause of the uncertainty surrounding the underlying assumptions. The results are based onprojections (which depend on assumptions) and do not represent forecasts. Some trends arepredictable, others are not. Chart 5.2 shows the evolution of total spending and some of thekey spending items, as a share of GDP, over the next five decades.
5.9 Education spending is projected to remain relatively stable over the coming decades,fluctuating between 5 and 51/2 per cent of GDP. This reflects the fact that the number of peopleof education age (either in schools, higher education or further education) is projected to varyonly slightly.
5.10 State pension spending8 is projected to increase from just over 5 per cent of GDP in2005-06 to around 63/4 per cent by the mid 2050s. As stated in Chapter 4, these projections arebased on the policies set out in Security in retirement: towards a new pensions system9 and thePensions Bill Regulatory Impact Assessment.10
State pensions
Education
Projections, notforecasts
37Long-term public finance report
Chart 5.2: Spending1
1Total spending including gross investment but excluding interest and dividends paid.Source: HM Treasury.
0
10
20
30
40
50
2055-562045-462035-362025-262015-162005-06
Other spending
Health
State pensions
Education Long-term care
Public service pensions
Per cent of GDP
8 State pension spending is defined as the sum of the basic State Pension, State Second Pension, Pension Credit, WinterFuel Payments, Over 75 TV licenses, and Christmas Bonus.9 Security in retirement: towards a new pensions system, Department for Work and Pensions, May 2006.10 Pensions bill: regulatory impact assessment, Department for Work and Pensions, November 2006.
RE S U LT S55.11 Health spending is projected to increase from around 71/2 per cent in 2005-06 toaround 10 per cent of GDP by 2055-56 as the population ages. As in previous years, non-demographic factors that might affect health spending beyond the medium term are notmodelled. The projected increase, as a share of GDP, is larger than that projected by theEuropean Union’s Economic Policy Committee (EPC).11 In the EPC ‘reference’ projection, UKpublic health spending increases by 1.9 percentage points between 2004 and 2050. Alongsidethe reference projection, the EPC produced a number of variant health projections, which arediscussed in more detail in Box 5.2. These variants and the differences between the baselineprojections and the EPC ‘reference’ projections illustrate the uncertainty surrounding thehealth projections.
5.12 Long-term care spending is projected to increase from 11/4 per cent of GDP in 2005-06to 11/2 per cent by 2025-26 and then 2 per cent by 2055-56. The increase up to 2025-26 is similarto that derived in scenario 1 of the King’s Fund study into long-term care in the UK.12
5.13 Expenditure on public service pension benefits is projected to increase from 11/2 percent of GDP now to 2 per cent by 2055-56. This projected increase reflects recent changes inthe size of the public service workforce, improved longevity and the fact that some schemes,and in particular the NHS scheme, are not yet mature. Box 5.1 analyses the projectionsfurther.
Public servicepensions
Long-term care
Health
38 Long-term public finance report
11 The impact of ageing on public expenditure: projections for the EU25 Member States on pensions, health care, long-term care,education and unemployment transfers (2004-2050), Economic Policy Committee and European Commission, February2006, page 11.12 Securing Good Care for Older People: Taking a long-term view, Derek Wanless, March 2006.
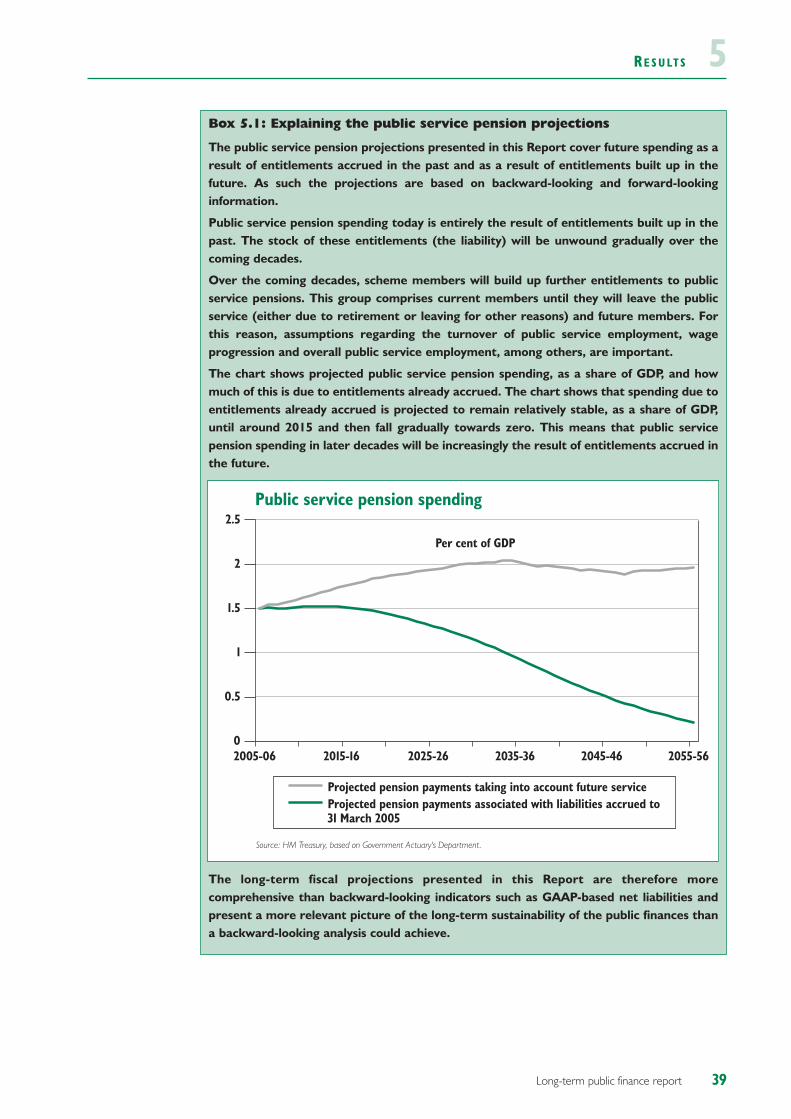
RE S U LT S 5
39Long-term public finance report
Box 5.1: Explaining the public service pension projections
The public service pension projections presented in this Report cover future spending as aresult of entitlements accrued in the past and as a result of entitlements built up in thefuture. As such the projections are based on backward-looking and forward-lookinginformation.
Public service pension spending today is entirely the result of entitlements built up in thepast. The stock of these entitlements (the liability) will be unwound gradually over thecoming decades.
Over the coming decades, scheme members will build up further entitlements to publicservice pensions. This group comprises current members until they will leave the publicservice (either due to retirement or leaving for other reasons) and future members. Forthis reason, assumptions regarding the turnover of public service employment, wageprogression and overall public service employment, among others, are important.
The chart shows projected public service pension spending, as a share of GDP, and howmuch of this is due to entitlements already accrued. The chart shows that spending due toentitlements already accrued is projected to remain relatively stable, as a share of GDP,until around 2015 and then fall gradually towards zero. This means that public servicepension spending in later decades will be increasingly the result of entitlements accrued inthe future.
The long-term fiscal projections presented in this Report are therefore morecomprehensive than backward-looking indicators such as GAAP-based net liabilities andpresent a more relevant picture of the long-term sustainability of the public finances thana backward-looking analysis could achieve.
Public service pension spending
Source: HM Treasury, based on Government Actuary's Department.
0
0.5
1
1.5
2
2.5
2055-562045-462035-362025-262015-162005-06
Projected pension payments taking into account future serviceProjected pension payments associated with liabilities accrued to31 March 2005
Per cent of GDP
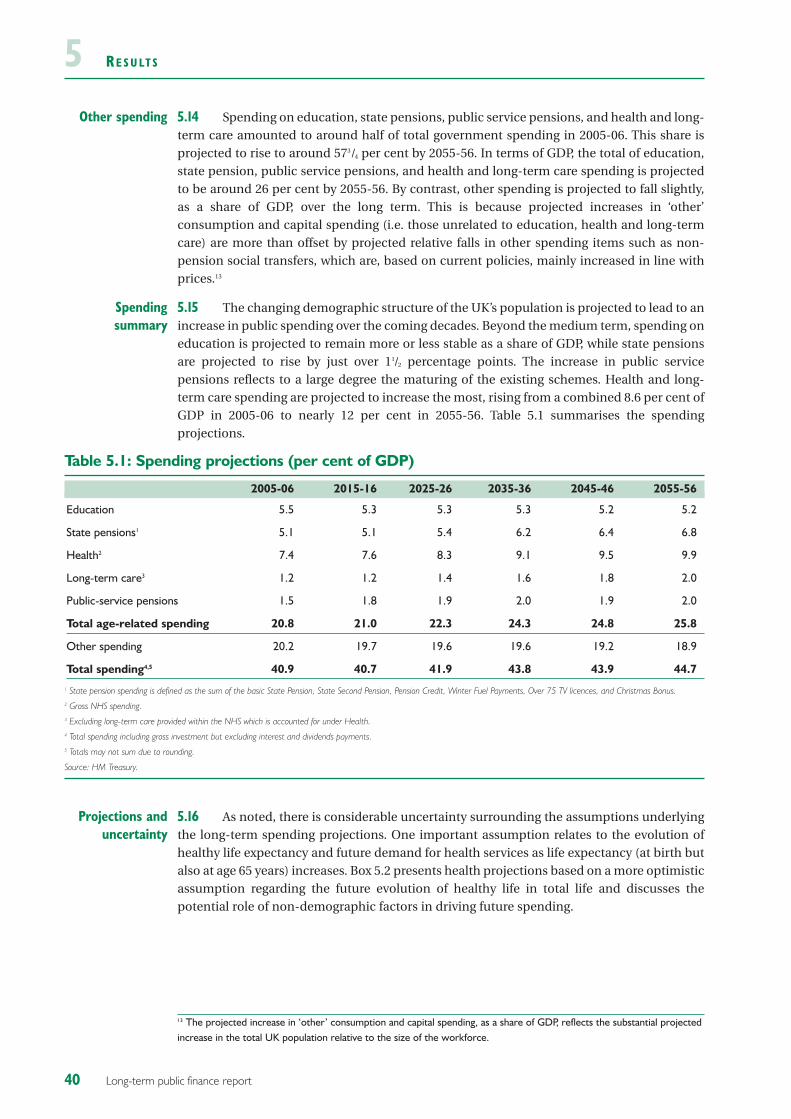
RE S U LT S55.14 Spending on education, state pensions, public service pensions, and health and long-term care amounted to around half of total government spending in 2005-06. This share isprojected to rise to around 573/4 per cent by 2055-56. In terms of GDP, the total of education,state pension, public service pensions, and health and long-term care spending is projectedto be around 26 per cent by 2055-56. By contrast, other spending is projected to fall slightly,as a share of GDP, over the long term. This is because projected increases in ‘other’consumption and capital spending (i.e. those unrelated to education, health and long-termcare) are more than offset by projected relative falls in other spending items such as non-pension social transfers, which are, based on current policies, mainly increased in line withprices.13
5.15 The changing demographic structure of the UK’s population is projected to lead to anincrease in public spending over the coming decades. Beyond the medium term, spending oneducation is projected to remain more or less stable as a share of GDP, while state pensionsare projected to rise by just over 11/2 percentage points. The increase in public servicepensions reflects to a large degree the maturing of the existing schemes. Health and long-term care spending are projected to increase the most, rising from a combined 8.6 per cent ofGDP in 2005-06 to nearly 12 per cent in 2055-56. Table 5.1 summarises the spendingprojections.
Table 5.1: Spending projections (per cent of GDP)
2005-06 2015-16 2025-26 2035-36 2045-46 2055-56
Education 5.5 5.3 5.3 5.3 5.2 5.2
State pensions1 5.1 5.1 5.4 6.2 6.4 6.8
Health2 7.4 7.6 8.3 9.1 9.5 9.9
Long-term care3 1.2 1.2 1.4 1.6 1.8 2.0
Public-service pensions 1.5 1.8 1.9 2.0 1.9 2.0
Total age-related spending 20.8 21.0 22.3 24.3 24.8 25.8
Other spending 20.2 19.7 19.6 19.6 19.2 18.9
Total spending4,5 40.9 40.7 41.9 43.8 43.9 44.71 State pension spending is defined as the sum of the basic State Pension, State Second Pension, Pension Credit, Winter Fuel Payments, Over 75 TV licences, and Christmas Bonus.2 Gross NHS spending. 3 Excluding long-term care provided within the NHS which is accounted for under Health.4 Total spending including gross investment but excluding interest and dividends payments.5 Totals may not sum due to rounding.
Source: HM Treasury.
5.16 As noted, there is considerable uncertainty surrounding the assumptions underlyingthe long-term spending projections. One important assumption relates to the evolution ofhealthy life expectancy and future demand for health services as life expectancy (at birth butalso at age 65 years) increases. Box 5.2 presents health projections based on a more optimisticassumption regarding the future evolution of healthy life in total life and discusses thepotential role of non-demographic factors in driving future spending.
Projections anduncertainty
Spendingsummary
Other spending
40 Long-term public finance report
13 The projected increase in ‘other’ consumption and capital spending, as a share of GDP, reflects the substantial projectedincrease in the total UK population relative to the size of the workforce.
RE S U LT S 5
5.17 Box 5.3 discusses alternative projections for state pensions, based on themacroeconomic and demographic assumptions used by the European Union’s EconomicPolicy Committee.
Alternativepension
projections
41Long-term public finance report
Box 5.2: Alternative health projections
As stated in Chapter 4, previous reports assumed that healthy life expectancy increases inline with rises in overall life expectancy. Previous reports captured this assumption byshifting the health profiles to the right.a As Chapter 4 also states, the baseline projectionsin this Report no longer use this assumption, reflecting methodological changes to theprojection model but also emerging evidence for the UK, which paints a slightly lesspositive picture of healthy life trends. Future health status will be an importantdeterminant of demand for health care in the future and will ultimately be a major driverof health spending. Everything else equal, a more healthy population should require lesshealth spending.
This box illustrates the impact of shifting the age-specific profiles for non-hospital healthspending to the right on total health spending.b As a large proportion of health spending isconsumed by those aged 65 years and over, the shifts are based on projected changes oflife expectancy at 65 years consistent with the GAD 2004-based population projections.Specifically, if life expectancy at age 65 years increased by one year between, say, 2010 and2020, then the age profile would be shifted in such a way that a 66 year old in 2020 has thesame demand for health services as a 65 year old in 2010.c Using these assumptions, healthcare spending would be 8.0 per cent of GDP in 2025-26, 8.8 per cent in 2035-36, 9.1 percent in 2045-46 and 9.4 per cent in 2055-56.
Future health status will not be the only determinant of future health spending. As theWanless Review found, many other (non-demographic) factors, both on the supply side andon the demand side, will have an impact on future health spending.d While it is impossibleto say by how much future health spending will be affected by these factors, which includefor example technological progress and changing preferences, some studies have usedhistorical data on non-demographic cost drivers to project future health spending. Forexample, the New Zealand Treasury calculates a ‘residual growth factor’ using historicaldata, which captures relative price changes and technological progress.e The New ZealandTreasury finds that health spending is projected to be higher in the long term with theresidual factor included rather than excluded in the projection.
a 2004 Long-term public finance report: an analysis of fiscal sustainability, HM Treasury, December 2004, pages 40 to 41.b As stated in Chapter 4, hospital care spending is projected using age-related and death-related cost profiles. As thesplit into age-related and death-related profiles is meant to capture some of the aspects of changes in healthy lifeexpectancy, it would be inappropriate to shift the hospital care spending profiles.c The Personal Social Services Research Unit uses this approach (which they call the ‘Brookings scenario’) to illustratedifferent potential health trends. See Thirty-Five Years On: Future Demand for Long-Term Care in England, Personal SocialServices Research Unit, Research Summary 35, March 2006.d Securing our Future Health: Taking a Long-term View, Derek Wanless, April 2002.e New Zealand’s Long-term fiscal position, New Zealand Treasury, June 2006. Also see Who is going broke? Comparinggrowth in healthcare costs in ten OECD countries, Hagist and Kotlikoff, 2005.

RE S U LT S5
5.18 In addition to the uncertainties surrounding the underlying assumptions of theprojections, it also has to be recognised that the projections do not attempt to modelpotential behavioural changes (by government, businesses or individuals) over time. Indeed,by projecting every spending and revenue line separately, the model does not attempt tocapture many important economic interdependencies. Box 5.4 explores the issue ofinterdependencies and long-term projections in more detail.
Projections andinter-
dependencies
42 Long-term public finance report
Box 5.3: Alternative state pension projections
In February 2006, the European Union’s Economic Policy Committee (EPC) published amajor study into the effects of demographic change on age-related spending in EU MemberStates over the coming decades.a The pension projections (state pensions and publicservice pensions) published in the EPC study were provided by national authorities in thedifferent Member States. The projections were generated using commonly-agreeddemographic and macroeconomic assumptions but using national models so as to capturethe complexities of the different pension systems. The projections were presented as ashare of GDP, with the latter provided by the EPC.
The policy proposals made in the White Paper on pensionsb will also affect theseprojections. Modifying the baseline projections presented in this Report to take account ofdifferences in the underlying demographic and macroeconomic assumptions, it is possibleto express state pension spending as a share of GDP (as provided by the EPC). On thisbasis, state pension spending will be 5 per cent of GDP in 2010, 5.1 per cent in 2020, 5.9per cent in 2030, 6.7 per cent in 2040 and 6.9 per cent in 2050.
These figures do not take into account the expected positive effect of the proposedpension reform on employment and hence GDP. The reform should lead to an increase inemployment amounting to 0.2 per cent in 2020, 1.1 per cent in 2030, 1.8 per cent in 2040and 2.8 per cent in 2050. Adjusting the EPC GDP projections by these amounts, then leadsto state pension spending, as a share of GDP, of 5.9 per cent in 2030, 6.6 per cent in 2040and 6.7 per cent in 2050.
a The impact of ageing on public expenditure: projections for the EU25 Member States on pensions, health care, long-termcare, education and unemployment transfers (2004-2050), Economic Policy Committee and European Commission,February 2006.b Security in retirement: towards a new pensions system, Department for Work and Pensions, May 2006.
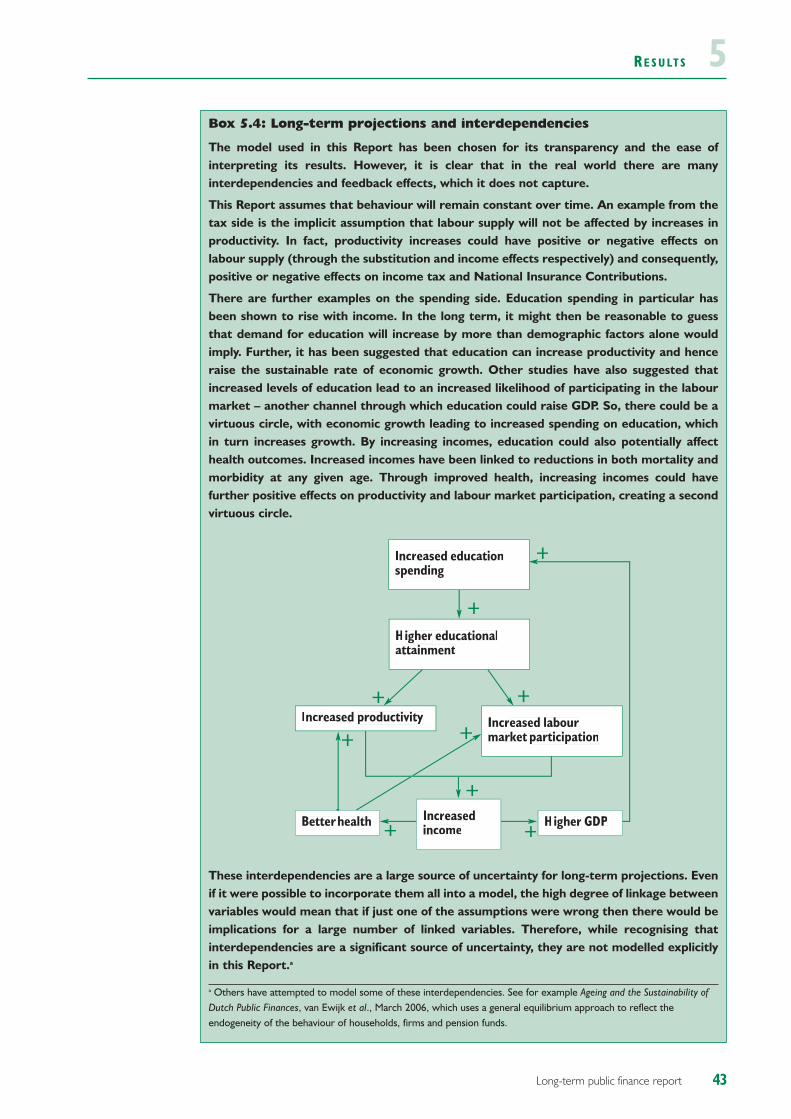
RE S U LT S 5
43Long-term public finance report
Box 5.4: Long-term projections and interdependencies
The model used in this Report has been chosen for its transparency and the ease ofinterpreting its results. However, it is clear that in the real world there are manyinterdependencies and feedback effects, which it does not capture.
This Report assumes that behaviour will remain constant over time. An example from thetax side is the implicit assumption that labour supply will not be affected by increases inproductivity. In fact, productivity increases could have positive or negative effects onlabour supply (through the substitution and income effects respectively) and consequently,positive or negative effects on income tax and National Insurance Contributions.
There are further examples on the spending side. Education spending in particular hasbeen shown to rise with income. In the long term, it might then be reasonable to guessthat demand for education will increase by more than demographic factors alone wouldimply. Further, it has been suggested that education can increase productivity and henceraise the sustainable rate of economic growth. Other studies have also suggested thatincreased levels of education lead to an increased likelihood of participating in the labourmarket – another channel through which education could raise GDP. So, there could be avirtuous circle, with economic growth leading to increased spending on education, whichin turn increases growth. By increasing incomes, education could also potentially affecthealth outcomes. Increased incomes have been linked to reductions in both mortality andmorbidity at any given age. Through improved health, increasing incomes could havefurther positive effects on productivity and labour market participation, creating a secondvirtuous circle.
These interdependencies are a large source of uncertainty for long-term projections. Evenif it were possible to incorporate them all into a model, the high degree of linkage betweenvariables would mean that if just one of the assumptions were wrong then there would beimplications for a large number of linked variables. Therefore, while recognising thatinterdependencies are a significant source of uncertainty, they are not modelled explicitlyin this Report.a
a Others have attempted to model some of these interdependencies. See for example Ageing and the Sustainability ofDutch Public Finances, van Ewijk et al., March 2006, which uses a general equilibrium approach to reflect theendogeneity of the behaviour of households, firms and pension funds.
Increased educationspending
Higher educationalattainment
Increased labourmarket participation
Increased productivity
Betterhealth Higher GDPIncreasedincome
+
+
+
+
+
+
+ +
+
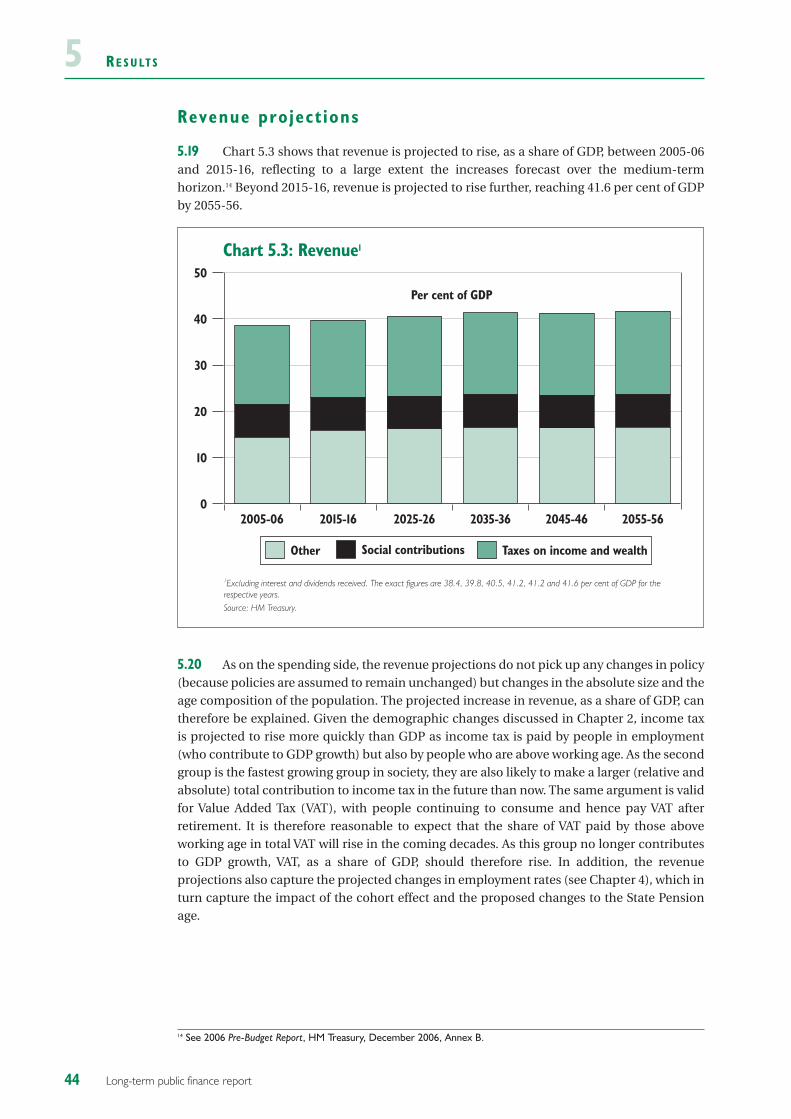
RE S U LT S5Revenue pro ject ions
5.19 Chart 5.3 shows that revenue is projected to rise, as a share of GDP, between 2005-06and 2015-16, reflecting to a large extent the increases forecast over the medium-termhorizon.14 Beyond 2015-16, revenue is projected to rise further, reaching 41.6 per cent of GDPby 2055-56.
5.20 As on the spending side, the revenue projections do not pick up any changes in policy(because policies are assumed to remain unchanged) but changes in the absolute size and theage composition of the population. The projected increase in revenue, as a share of GDP, cantherefore be explained. Given the demographic changes discussed in Chapter 2, income taxis projected to rise more quickly than GDP as income tax is paid by people in employment(who contribute to GDP growth) but also by people who are above working age. As the secondgroup is the fastest growing group in society, they are also likely to make a larger (relative andabsolute) total contribution to income tax in the future than now. The same argument is validfor Value Added Tax (VAT), with people continuing to consume and hence pay VAT afterretirement. It is therefore reasonable to expect that the share of VAT paid by those aboveworking age in total VAT will rise in the coming decades. As this group no longer contributesto GDP growth, VAT, as a share of GDP, should therefore rise. In addition, the revenueprojections also capture the projected changes in employment rates (see Chapter 4), which inturn capture the impact of the cohort effect and the proposed changes to the State Pensionage.
44 Long-term public finance report
14 See 2006 Pre-Budget Report, HM Treasury, December 2006, Annex B.
0
10
20
30
40
50
2055-562045-462035-362025-262015-162005-06
Chart 5.3: Revenue1
Per cent of GDP
Other Social contributions Taxes on income and wealth
1Excluding interest and dividends received. The exact figures are 38.4, 39.8, 40.5, 41.2, 41.2 and 41.6 per cent of GDP for the respective years.Source: HM Treasury.
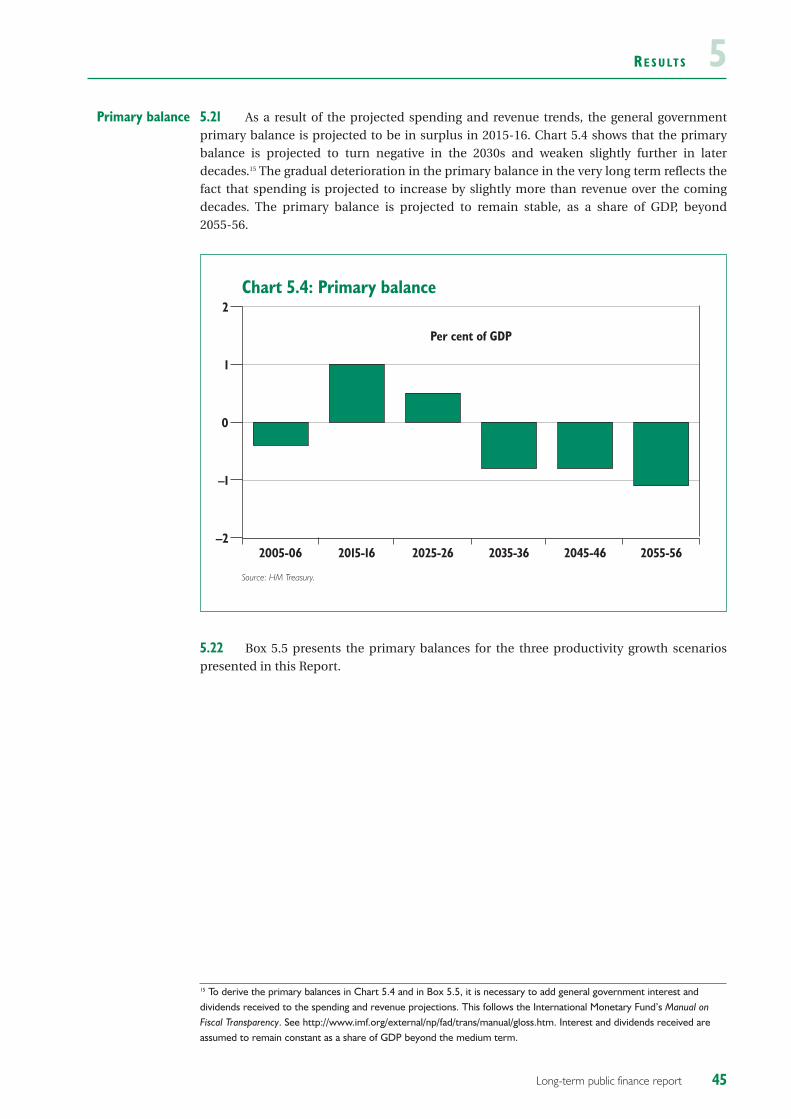
RE S U LT S 55.21 As a result of the projected spending and revenue trends, the general governmentprimary balance is projected to be in surplus in 2015-16. Chart 5.4 shows that the primarybalance is projected to turn negative in the 2030s and weaken slightly further in laterdecades.15 The gradual deterioration in the primary balance in the very long term reflects thefact that spending is projected to increase by slightly more than revenue over the comingdecades. The primary balance is projected to remain stable, as a share of GDP, beyond 2055-56.
5.22 Box 5.5 presents the primary balances for the three productivity growth scenariospresented in this Report.
Primary balance
45Long-term public finance report
15 To derive the primary balances in Chart 5.4 and in Box 5.5, it is necessary to add general government interest anddividends received to the spending and revenue projections. This follows the International Monetary Fund’s Manual onFiscal Transparency. See http://www.imf.org/external/np/fad/trans/manual/gloss.htm. Interest and dividends received areassumed to remain constant as a share of GDP beyond the medium term.
–2
–1
0
1
2
2055-562045-462035-362025-262015-162005-06
Chart 5.4: Primary balance
Per cent of GDP
Source: HM Treasury.
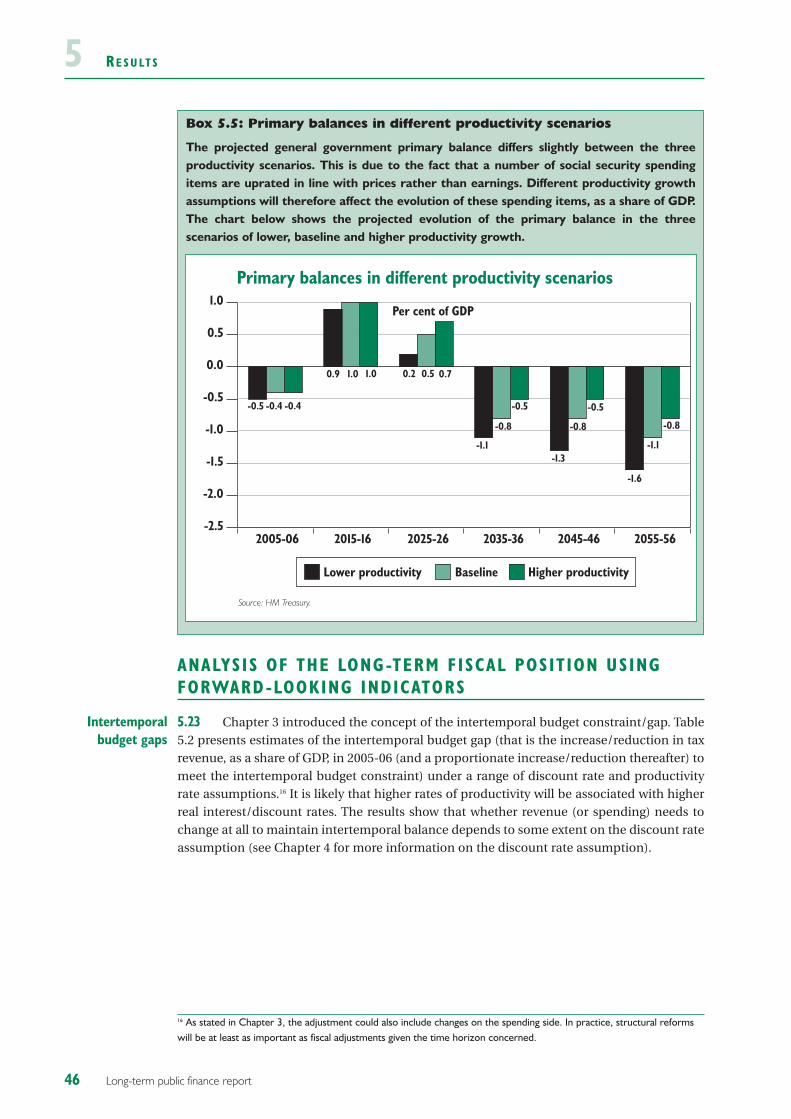
RE S U LT S5
ANALYSIS OF THE LONG-TERM FISCAL POSITION USINGFORWARD -LOOKING INDICATORS
5.23 Chapter 3 introduced the concept of the intertemporal budget constraint/gap. Table5.2 presents estimates of the intertemporal budget gap (that is the increase/reduction in taxrevenue, as a share of GDP, in 2005-06 (and a proportionate increase/reduction thereafter) tomeet the intertemporal budget constraint) under a range of discount rate and productivityrate assumptions.16 It is likely that higher rates of productivity will be associated with higherreal interest/discount rates. The results show that whether revenue (or spending) needs tochange at all to maintain intertemporal balance depends to some extent on the discount rateassumption (see Chapter 4 for more information on the discount rate assumption).
Intertemporalbudget gaps
46 Long-term public finance report
Box 5.5: Primary balances in different productivity scenarios
The projected general government primary balance differs slightly between the threeproductivity scenarios. This is due to the fact that a number of social security spendingitems are uprated in line with prices rather than earnings. Different productivity growthassumptions will therefore affect the evolution of these spending items, as a share of GDP.The chart below shows the projected evolution of the primary balance in the threescenarios of lower, baseline and higher productivity growth.
Primary balances in different productivity scenarios
-2.5
-2.0
-1.5
-1.0
-0.5
0.0
0.5
1.0
2055-562045-462035-362025-262015-162005-06
Per cent of GDP
Lower productivity Baseline Higher productivity
-0.5 -0.4 -0.4
1.0 0.2
0.9
1.00.90.2
0.5 0.7
-1.6
-1.1
-0.8-0.8
-1.1-1.3
-0.8
-0.5 -0.5
Source: HM Treasury.
16 As stated in Chapter 3, the adjustment could also include changes on the spending side. In practice, structural reformswill be at least as important as fiscal adjustments given the time horizon concerned.
RE S U LT S 5Table 5.2: Intertemporal budget gaps1 (per cent of GDP)
Discount rate (per cent) 21⁄2 3 31⁄2Lower productivity (13⁄4 per cent) 0 3⁄4 11⁄4Baseline (2 per cent) –1 0 3⁄4Higher productivity (21⁄4 per cent) –21⁄4 –3⁄4 01 Fiscal tightening (or loosening) in 2005-06 and a permanent, proportionate fiscal tightening (or loosening) thereafter needed to ensure intertemporalbalance. Rounded to the nearest quarter percentage point.
5.24 The fiscal gap measure introduced in Chapter 3 represents the change in theprojected primary balance needed to attain a particular debt target at a particular point intime. A negative fiscal gap, for example, implies that fiscal policy could be loosened relative tothat indicated by the projections, while still attaining a particular debt level in the future.Taking the 40 per cent net debt to GDP ratio from the sustainable investment rule as thetarget, it is therefore possible to use the fiscal gap concept to estimate the primary balancethat is consistent with the Government’s sustainable investment rule over different timehorizons.17
5.25 Tables 5.3 to 5.5 show the fiscal gaps required under a variety of scenarios where thechange in the primary balance is assumed to occur from 2012-13 onwards, that is, beyond themedium-term horizon for fiscal policy.18 Table 5.3 shows the baseline projections under thedifferent interest rate assumptions.
Table 5.3: Fiscal gaps1 in baseline scenario2 (per cent of GDP)
Interest rate (per cent) 21⁄2 3 31⁄2Target year2025-26 –1⁄2 –1⁄4 –1⁄42035-36 0 1⁄4
1⁄42045-46 1⁄4
1⁄23⁄4
2055-56 1⁄23⁄4
3⁄41 Change to primary balance needed to attain net debt of 40 per cent of GDP at end of target year. Rounded to the nearest quarter percentage point.2 2 per cent productivity growth.
5.26 The results show that the UK public finances are in a solid long-term position. Table5.3 shows, for example, that if the Government wished to achieve a net debt to GDP ratio of40 per cent by 2025-26, it could loosen its fiscal stance. Table 5.3 also shows that theGovernment could tighten fiscal policy by slightly less the lower the assumed interest rate. Itshould also be emphasised that all the numbers are small, varying between – 1/2 and 3/4 percent of GDP. This needs to be seen in the context of an average absolute difference betweenforecast and outturn for public sector net borrowing of little over 1 per cent of GDP for theone-year ahead forecast over the period 1970-71 to 2005-06.19
Fiscal gaps
47Long-term public finance report
17 The fiscal gap calculations in this Report are based on the public sector rather than the general government sector. This is to increase consistency with the Government’s sustainable investment rule, which is defined over the public ratherthan the general government sector. To derive public sector spending and revenue from the general government-basedprojections, it is assumed that all spending and revenue items linked to public corporations remain constant as a share ofGDP after the medium term. The difference between the general government and public sector numbers is small. Notethat for the fiscal gap and the alternative fiscal gap calculations, the primary balance is defined as net borrowing excludingnet debt interest payments. This is consistent with the UK’s definition of primary balance, which, by excluding interestreceipts, yields larger deficits and/or smaller surpluses than the IMF’s definition (see footnote 15). See Analysing UK FiscalPolicy, HM Treasury, November 1999, page 35. Excluding interest receipts is consistent with calculating the fiscal gaps on a net debt basis.18 If the change in the primary balance were assumed to take place earlier than 2012-13, then the implied increases orreductions in the primary balance would be correspondingly smaller.19 2006 End of year fiscal report, HM Treasury, December 2006.
RE S U LT S55.27 Tables 5.4 and 5.5 illustrate the effect of assuming lower and higher productivitygrowth respectively than in the baseline scenario. The figures suggest that the fiscal gapcalculations are robust to changes in the productivity growth rate assumption, with therequired policy action only slightly different from those under the baseline projections.
Table 5.4: Fiscal gaps1 in lower productivity scenario2 (per cent of GDP)
Interest rate (per cent) 21⁄2 3 31⁄2Target year2025-26 –1⁄4 0 02035-36 1⁄4
1⁄23⁄4
2045-46 3⁄43⁄4 1
2055-56 1 1 11⁄41 Change to primary balance needed to attain net debt of 40 per cent of GDP at end of target year. Rounded to the nearest quarter percentage point.2 13/4 per cent productivity growth.
Table 5.5: Fiscal gaps1 in higher productivity scenario2 (per cent of GDP)
Interest rate (per cent) 21⁄2 3 31⁄2Target year2025-26 –3⁄4 –1⁄2 –1⁄42035-36 –1⁄4 0 02045-46 0 1⁄4
1⁄22055-56 1⁄4
1⁄21⁄2
1 Change to primary balance needed to attain net debt of 40 per cent of GDP at end of target year. Rounded to the nearest quarter percentage point.2 21/4 per cent productivity growth.
COMPARISON WITH PREVIOUS RESULTS
5.28 The results presented in this year’s Report show differences but also similarities to theresults shown in the 2005 Report.
Spending
• By the mid 2050s, total spending, as a share of GDP, is projected to be slightlyless than projected in the 2005 Report, as marginally larger projectedincreases in total age-related spending are offset by larger falls in otherspending.
• Comparing the results published in previous Long-term public financereports, it can be seen that the projections have remained reasonably stable.One factor driving changes to the projections has been updated populationprojections; life expectancies for males and females have been revised up inevery year that new projections have been used for the Report (2002, 2004 and2005). A further factor has been methodological improvements. For example,before 2004 public service pensions were not modelled explicitly; they weresimply a component of the ‘other’ spending category. From 2004, GADprojections of the combined costs of NHS, teachers and civil service pensionschemes (grossed up to cover all public service schemes) were used in the
Spending andrevenue
48 Long-term public finance report
RE S U LT S 5Report.20 In this year’s Report, the methodology has been further refined andnow GAD models all public service schemes individually. Changes are alsodriven by revisions to the medium-term public finance projections and byupdates to the spending and revenue profiles.21
Revenue
• Revenue is projected to rise by less, as a share of GDP, than in last year’sReport. This is because the increase in the State Pension age proposed in theGovernment’s White Paper on pensions is assumed to bring about higher ratesof labour market participation and therefore increase projected GDP levels.While revenue items such as income tax and national insurance contributionswill also be affected by the proposed increase in the State Pension age (as theyare assumed to grow broadly in line with employment), the majority ofrevenue items will be unaffected as they are not adjusted for projectedemployment growth. As a result, the impact of the proposed increase in theState Pension age upon overall revenue is projected to be smaller than theeffect upon GDP, bringing about a smaller increase in revenue as a share ofGDP.
49Long-term public finance report
20 See 2004 Long-term public finance report: an analysis of fiscal sustainability, HM Treasury, December 2004, page 43, formore detail.21 See Chapter 4 for more detail.
RE S U LT S55.29 The fiscal indicators are similar to those presented in last year’s Report.
• The intertemporal budget gap is projected to be either larger or smaller thanthe 2005 estimates depending on the productivity assumption and discountrate used. Whereas the deficit on the primary balance was projected to declinein the second half of the century in previous Long-term public financereports,22 it is now projected to remain more or less stable, as a share of GDP,at its 2050s level.
• The fiscal gap calculations show that the required tightening in the primarybalance to stabilise net debt at 40 per cent of GDP in a specific target year islittle different from in last year’s Report. It should also be emphasised that thefiscal gaps are small, and should be seen in the context of an average absolutedifference between forecast and outturn for public sector net borrowing of alittle over 1 per cent of GDP for the one-year ahead forecast over the period1970-71 to 2005-06.23
• The illustrative long-term fiscal projections, updating those presented inAnnex A of the 2006 Economic and Fiscal Strategy Report (EFSR),24 show thatthe UK’s public finances are sustainable in the long term, confirming theprevious projections. Box 5.6 provides details of the updated illustrative long-term fiscal projections, which are based on the medium-term public financeprojections as presented in the 2006 Pre-Budget Report.
Fiscal indicators
50 Long-term public finance report
22 See for example, 2004 Long-term public finance report: an analysis of fiscal sustainability, HM Treasury, December 2004.23 2006 End of year fiscal report, HM Treasury, December 2006.24 Economic and Fiscal Strategy Report in Budget 2006: A strong and strengthening economy: Investing in Britain’s future, HMTreasury, March 2006.

RE S U LT S 5
INTERNATIONAL COMPARISONS
5.30 International comparisons suggest that the UK’s long-term fiscal position is relativelystrong compared with those of other developed countries facing challenges from ageingpopulations, including many EU countries and the United States. As the OECD notes in itsEconomic Survey of the United Kingdom: “Unlike the situation in many OECD countries,future fiscal costs are not projected to rise significantly as the population ages”.25
51Long-term public finance report
25 OECD Economic Survey of the United Kingdom 2005, OECD, October 2005, page 11.
Box 5.6: Updated illustrative long-term fiscal projections
The chart below presents the results of the updated projections, following the approachused in Annex A of the Economic and Fiscal Strategy Report (EFSR).a Transfers now includepensions on post-White Paper policies. The chart shows that transfers, as a share of GDP,are projected to fall slightly between 2012-13 and 2035-36 as gradual increases in statepension spending are offset by relatively lower other transfers such as non-pension socialbenefits.
The chart also shows that current consumption is projected to remain more or less thesame, as a share of GDP, over the coming decades, ensuring that resources are available tomeet potential future spending pressures. Finally, the net debt to GDP ratio is projectedto remain below 40 per cent until the end of the projection horizon, implying that thesustainable investment rule is met.
The illustrative long-term fiscal projections presented here therefore differ only slightlyfrom those presented in Annex A of the 2006 EFSR, indicating that the UK’s public financesare sustainable over the long term.
a The modelling and long-term macroeconomic assumptions remain unchanged from those used for the illustrativelong-term fiscal projections presented in Annex A of the 2006 EFSR.
Updated illustrative long-term fiscal projections1
1 Medium-term projections as in the 2006 Pre-Budget Report.Source: HM Treasury.
0
5
10
15
20
25
30
35
40
45
2035-20362025-20262015-20162012-20132005-2006
Net debtCurrentconsumption
TransfersTotal currentspending
Per cent of GDP
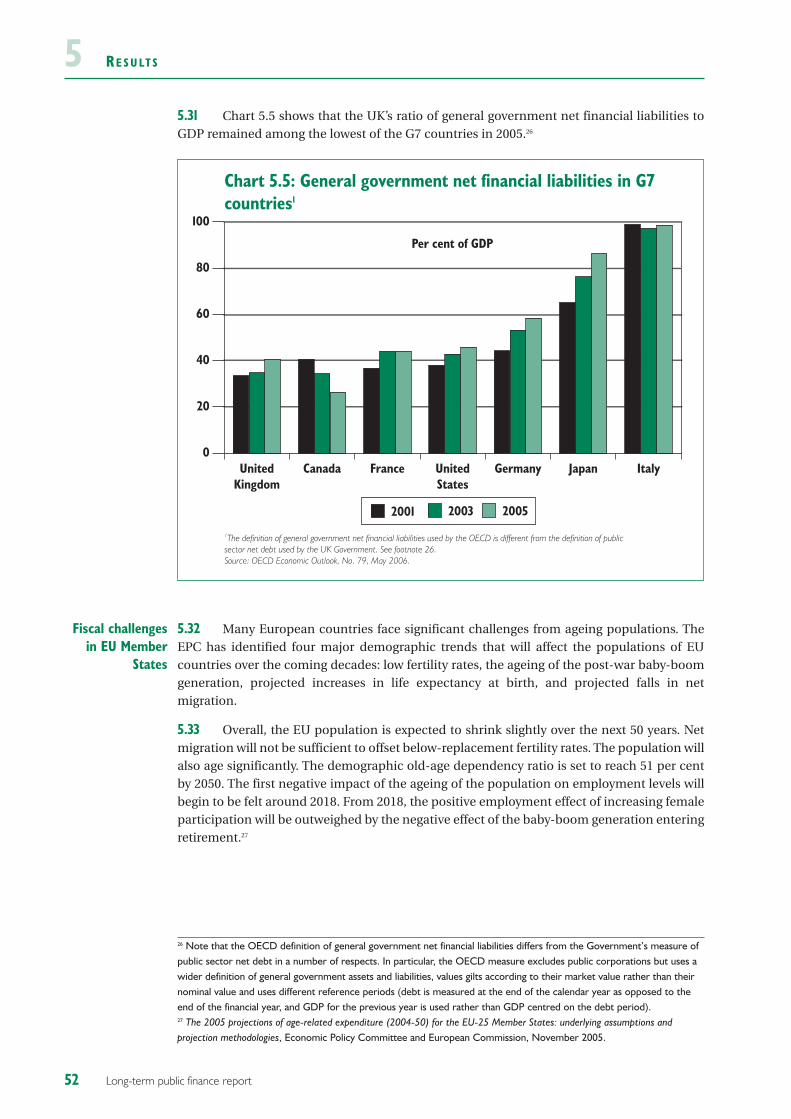
RE S U LT S55.31 Chart 5.5 shows that the UK’s ratio of general government net financial liabilities toGDP remained among the lowest of the G7 countries in 2005.26
5.32 Many European countries face significant challenges from ageing populations. TheEPC has identified four major demographic trends that will affect the populations of EUcountries over the coming decades: low fertility rates, the ageing of the post-war baby-boomgeneration, projected increases in life expectancy at birth, and projected falls in netmigration.
5.33 Overall, the EU population is expected to shrink slightly over the next 50 years. Netmigration will not be sufficient to offset below-replacement fertility rates. The population willalso age significantly. The demographic old-age dependency ratio is set to reach 51 per centby 2050. The first negative impact of the ageing of the population on employment levels willbegin to be felt around 2018. From 2018, the positive employment effect of increasing femaleparticipation will be outweighed by the negative effect of the baby-boom generation enteringretirement.27
Fiscal challengesin EU Member
States
52 Long-term public finance report
0
20
40
60
80
100
ItalyJapanGermanyUnitedStates
FranceCanadaUnitedKingdom
Chart 5.5: General government net financial liabilities in G7 countries1
Per cent of GDP
2001 2003 2005
1The definition of general government net financial liabilities used by the OECD is different from the definition of public sector net debt used by the UK Government. See footnote 26.Source: OECD Economic Outlook, No. 79, May 2006.
26 Note that the OECD definition of general government net financial liabilities differs from the Government’s measure ofpublic sector net debt in a number of respects. In particular, the OECD measure excludes public corporations but uses awider definition of general government assets and liabilities, values gilts according to their market value rather than theirnominal value and uses different reference periods (debt is measured at the end of the calendar year as opposed to theend of the financial year, and GDP for the previous year is used rather than GDP centred on the debt period).27 The 2005 projections of age-related expenditure (2004-50) for the EU-25 Member States: underlying assumptions andprojection methodologies, Economic Policy Committee and European Commission, November 2005.
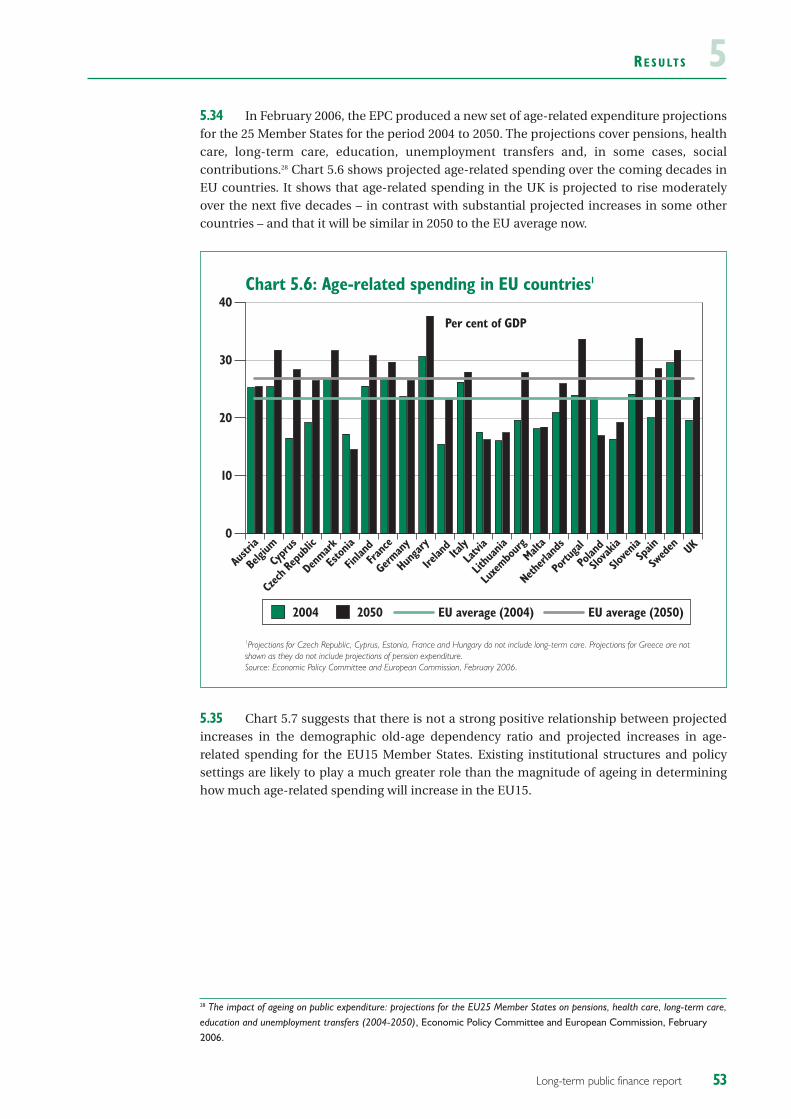
RE S U LT S 55.34 In February 2006, the EPC produced a new set of age-related expenditure projectionsfor the 25 Member States for the period 2004 to 2050. The projections cover pensions, healthcare, long-term care, education, unemployment transfers and, in some cases, socialcontributions.28 Chart 5.6 shows projected age-related spending over the coming decades inEU countries. It shows that age-related spending in the UK is projected to rise moderatelyover the next five decades – in contrast with substantial projected increases in some othercountries – and that it will be similar in 2050 to the EU average now.
5.35 Chart 5.7 suggests that there is not a strong positive relationship between projectedincreases in the demographic old-age dependency ratio and projected increases in age-related spending for the EU15 Member States. Existing institutional structures and policysettings are likely to play a much greater role than the magnitude of ageing in determininghow much age-related spending will increase in the EU15.
53Long-term public finance report
28 The impact of ageing on public expenditure: projections for the EU25 Member States on pensions, health care, long-term care,education and unemployment transfers (2004-2050), Economic Policy Committee and European Commission, February2006.
0
10
20
30
40
UK
Swed
enSp
ain
Slove
nia
Slova
kia
Polan
d
Portu
gal
Netherl
ands
Malta
Luxe
mbour
g
Lithu
ania
Latvi
aIta
ly
Irelan
d
Hunga
ry
German
yFra
nce
Finlan
d
Eston
ia
Denmark
Czech
Repu
blic
Cypr
us
Belgi
umAu
stria
Chart 5.6: Age-related spending in EU countries1
Per cent of GDP
2004 2050 EU average (2004) EU average (2050)
1Projections for Czech Republic, Cyprus, Estonia, France and Hungary do not include long-term care. Projections for Greece are notshown as they do not include projections of pension expenditure.Source: Economic Policy Committee and European Commission, February 2006.
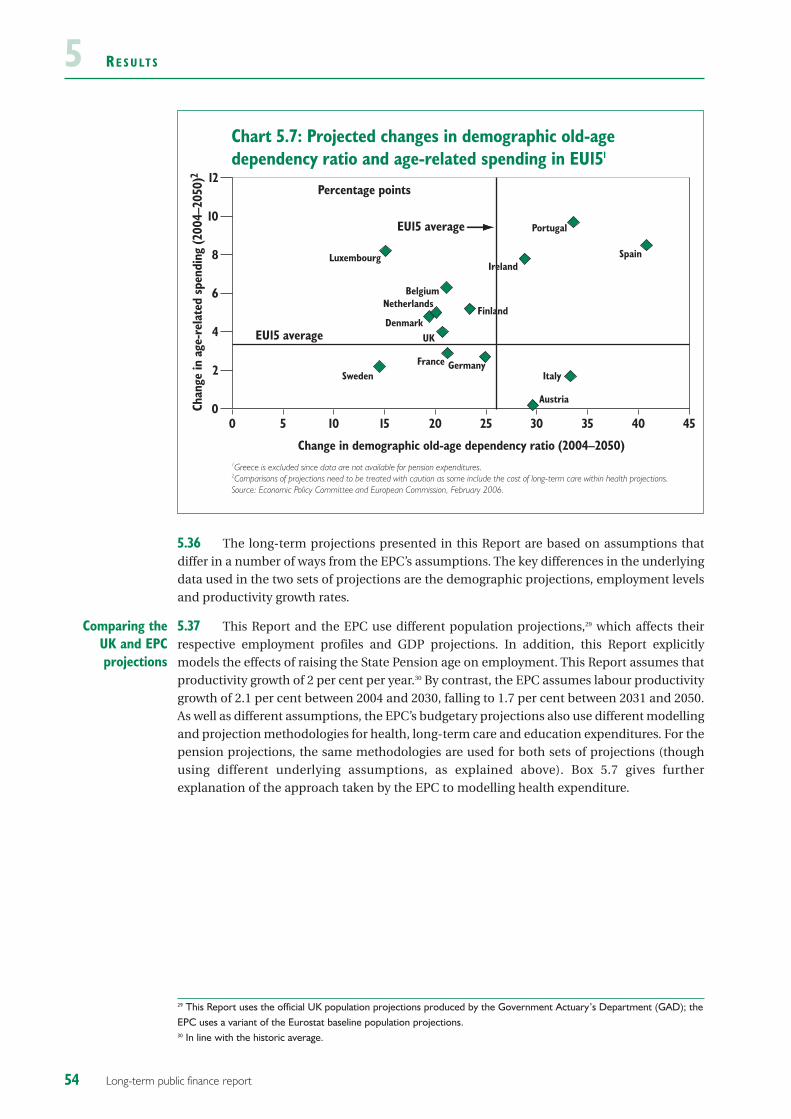
RE S U LT S5
5.36 The long-term projections presented in this Report are based on assumptions thatdiffer in a number of ways from the EPC’s assumptions. The key differences in the underlyingdata used in the two sets of projections are the demographic projections, employment levelsand productivity growth rates.
5.37 This Report and the EPC use different population projections,29 which affects theirrespective employment profiles and GDP projections. In addition, this Report explicitlymodels the effects of raising the State Pension age on employment. This Report assumes thatproductivity growth of 2 per cent per year.30 By contrast, the EPC assumes labour productivitygrowth of 2.1 per cent between 2004 and 2030, falling to 1.7 per cent between 2031 and 2050.As well as different assumptions, the EPC’s budgetary projections also use different modellingand projection methodologies for health, long-term care and education expenditures. For thepension projections, the same methodologies are used for both sets of projections (thoughusing different underlying assumptions, as explained above). Box 5.7 gives furtherexplanation of the approach taken by the EPC to modelling health expenditure.
Comparing theUK and EPCprojections
54 Long-term public finance report
0 5 10 15 20 25 30 35 40 450
2
4
6
8
10
12
Sweden
LuxembourgIreland
Portugal
Spain
Finland
BelgiumNetherlands
DenmarkUK
France Germany
Austria
Italy
Chart 5.7: Projected changes in demographic old-age dependency ratio and age-related spending in EU151
Change in demographic old-age dependency ratio (2004–2050)
Chan
ge in
age
-rel
ated
spe
ndin
g (2
004–
2050
)2
1Greece is excluded since data are not available for pension expenditures.2Comparisons of projections need to be treated with caution as some include the cost of long-term care within health projections.Source: Economic Policy Committee and European Commission, February 2006.
EU15 average
EU15 average
Percentage points
29 This Report uses the official UK population projections produced by the Government Actuary’s Department (GAD); theEPC uses a variant of the Eurostat baseline population projections.30 In line with the historic average.
RE S U LT S 5
5.38 Individual EU Member States have also carried out a considerable amount of work onlong-term fiscal sustainability. For example, in March 2006 the Netherlands Bureau forEconomic Policy Analysis (CPB) produced an update of its 2000 assessment of fiscalsustainability.31 The report is unusual in using a general equilibrium approach, whichexplicitly tries to model the fact that individuals’ savings and labour supply decisions areinfluenced by the interest rate, the wage rate and the tax rate on labour supply.
Netherlands
55Long-term public finance report
31 Ageing and the Sustainability of Dutch Public Finances, van Eijk, C et al., Netherlands Bureau for Economic Policy Analysis,March 2006.
Box 5.7: Health scenarios used by the European Union’s Economic PolicyCommittee
For its 2006 projections of age-related expenditure the European Union’s Economic PolicyCommittee (EPC) looked at different scenarios, using a variety of assumptions. The sixmain scenarios are described below.a All scenarios use the Eurostat baseline populationprojection, adapted for EPC purposes.
Main scenarios
1. Pure ageing: It assumes that health spending per capita for each given ageremains constant, which implies that as people live longer their healthy lifeexpectancy will not increase. Costs are assumed to evolve in line with GDP.
2. Constant health: This scenario uses the more optimistic assumption that allgains in life expectancy will be spent in good health. The health spending ageprofile thus shifts outwards as life expectancy increases.
3. Death-related costs: The profiles in this scenario are constructed based on theprobability that an individual will die in the near future. This reflects the fact thata large proportion of the total health expenditure on any given individual will be intheir last year of life, regardless of their age at death.
4. Income elasticity of demand: As scenario 1, except that it assumes an incomeelasticity of demand for health care greater than unity. This reflects observedhistorical trends.
5. Unit costs – GDP per worker: In this scenario unit costs increase in line withGDP per worker, rather than GDP per capita.
6. Reference: This central reference scenario incorporates death-related costs,greater-than-unity income elasticity and developments in healthy life expectanciesthat lie between the pure ageing and constant health scenarios.
For the EU15 (weighted) average, scenario 5, which assumes health unit costs rising in linewith GDP per worker, gives the greatest increase in health spending between 2004 and2050. Scenario 2, which assumes that all gains in longevity will be spent in good health,gives the smallest increase. The reference scenario is close to halfway between these twoextremes.
a Additional scenarios are presented in Annex 6 of the EPC’s report. See The impact of ageing on public expenditure:projections for the EU25 Member States on pensions, health care, long-term care, education and unemployment transfers(2004-2050), Economic Policy Committee and European Commission, February 2006.
RE S U LT S55.39 The CPB’s 2006 sustainability assessment is more pessimistic than in 2000 mainly dueto falling returns to pension investments. The report argues that developments in equityprices and interest rates have more than offset the Dutch government’s policy measures,which were intended to tackle the budgetary effects of the ageing population. The reportconcludes that an increasing old-age dependency ratio will put pressure on the publicfinances and budgetary reforms will be necessary in order to maintain fiscal sustainability inthe future.
5.40 Chapter 2 of this Report noted that ageing is a trend seen in most developedcountries, including those outside the EU. However, as Chart 5.7 demonstrates, those EU15Member States with more pronounced ageing processes do not necessarily face greaterchallenges in achieving long-term fiscal sustainability. The importance of institutionalstructures and policy settings in influencing increases in age-related spending is also shownby the experiences of developed countries outside the EU.
5.41 For example, as shown in Chapter 2, the US is ageing slowly by comparison with otherdeveloped countries. Nonetheless, fiscal imbalances are projected to arise in the US over thecoming decades. The US Congressional Budget Office (CBO) regularly publishes long-termanalysis covering a wide range of topics. For example, the CBO projects that spending onsocial security will increase from 4.2 per cent of GDP in 2005 to 6.4 per cent by 2050, whilespending on Medicare and Medicaid (the two principal public health care schemes) isprojected (for the ‘intermediate-spending path’) to rise from just over 4 per cent of GDP in2005 to 12.6 per cent by 2050, due to a combination of demographic and non-demographicfactors.32
5.42 Japan faces a particularly dramatic ageing of its population. By 2050, just over a thirdof the total population are projected to be aged 65 years or over. Recent projections by theJapanese Ministry of Finance33 suggest a rise in social security payments from 23.9 per cent to26.1 per cent of National Income between 2006 and 2025. Its already high levels of debt makeJapan’s sustainability challenge more difficult, with the Ministry acknowledging that“...Japan’s gross debt has rapidly worsened to reach the worst level among developedcountries.”34 Reforms to tackle the issues of debt sustainability and an ageing populationinclude significant increases in contributions to healthcare costs for citizens aged 70 yearsand over with a certain income level from October 2006 and the creation of a specific healthcare system for elderly people in April 2008.
5.43 Canada is also projected to experience an increase in its demographic old-agedependency ratio over the coming decades (see Chapter 2). This will place pressure on thepublic finances. The International Monetary Fund therefore suggests that long-term fiscalanalysis should be carried out on an annual basis in order to focus attention on theimportance of debt reduction. Its other recommendations include setting debt objectivesover a five to ten year horizon in order to allow some flexibility regarding debt consolidationin any one year.35
5.44 In March 2005 the Australian Government Productivity Commission published areport on the economic implications of ageing in Australia.36 According to the report, between2003-04 and 2044-45: “...spending is projected to rise by about 61/2 percentage points of GDP,
Australia
Canada
Japan
US
56 Long-term public finance report
32 The Long-Term Budget Outlook, Congressional Budget Office, December 2005.33 Current Japanese Fiscal Conditions and Issues to be Considered, Ministry of Finance of Japan, 2006.34 Ibid, page 9.35 Canada: 2006 Article IV Consultation-Staff Report; Staff Supplement; and Public Information Notice on the Executive BoardDiscussion, International Monetary Fund, June 2006, page 17.36 Economic Implications of an Ageing Australia, Australian Government Productivity Commission, March 2005.
RE S U LT S 5of which most is health and aged care”.37 The report projects that during this period there willbe an increase in fiscal pressure (the extent to which government spending outpaces revenuegrowth) of 5.7 percentage points of GDP. This is slightly higher than was found earlier by theAustralian Treasury’s first intergenerational report (published in May 2002).38 The AustralianTreasury is now in the process of updating its intergenerational report, in line with theAustralian Charter of Budget Honesty, which requires that an intergenerational report bepublished at least once every five years.39
5.45 In June 2006, New Zealand published a report on its long-term fiscal position.40 Thereport follows both top-down and bottom-up approaches. The report uses the top-downapproach to examine a range of scenarios. For example, if the government chose to keep grossdebt close to its current level of 20 per cent of GDP and all the adjustment to rising age-relatedexpenditure were made on the tax side, then the tax-to-GDP ratio would have to rise from 32per cent to 35 per cent. Following the bottom-up approach and assuming no changes inpolicy, the report projects gross debt rising from the current 20 per cent of GDP to close to 100per cent by 2050. Assets in the New Zealand Superannuation fund would offset this to a largeextent, so that net debt would rise much less dramatically. Primary spending is predicted toincrease by seven percentage points between 2005 and 2050. Increased health spendingdrives most of the increase.
CONCLUSIONS
5.46 The Report provides updated bottom-up projections of spending and revenue. Totalspending is projected to increase by marginally less, as a share of GDP, than in last year’sReport. On the revenue side, revenue is projected to continue to rise, as a share of GDP, overthe coming decades but by also marginally less than projected in last year’s Report.
5.47 As in previous years, this Report also assesses the long-term sustainability of thepublic finances using a series of fiscal sustainability indicators, including the intertemporalbudget gap/constraint and fiscal gaps. The updated results confirm the findings of previousreports that the UK fiscal position is sustainable in the long term on the basis of currentpolicies and that the UK is in a strong position relative to many other developed countries toface the challenges of an ageing society.
5.48 In addition, the Report updates the illustrative long-term fiscal projections presentedin Annex A of the EFSR and confirms the findings in Budget 2006. Given the assumed profilefor tax revenue and the projected profile for transfers, current consumption can grow ataround the same rate as GDP growth in the long term while meeting the Government’s goldenrule. In addition, public sector net investment can grow close to the economy’s growth rateover the projection period without jeopardising the sustainable investment rule. Given themodelling assumptions, the net debt to GDP is projected to remain below 40 per cent in thelong term.
New Zealand
57Long-term public finance report
37 Economic Implications of an Ageing Australia, Australian Government Productivity Commission, March 2005, page 306.38 Intergenerational Report 2002-03, Department of the Treasury of Australia, May 2002.39 Charter of Budget Honesty Act 1998, section 20.40 New Zealand’s Long-Term Fiscal Position, New Zealand Treasury, June 2006.41 Security in Retirement: towards a new pensions system, Department for Work and Pensions, May 2006.

58 Long-term public finance report
BI B L I O G R A P H Y
Long-term public finance report
Alho, J., Alders, M., Cruijsen, H., Keilman, N., Nikander, T. and Pham, D.Q.: New Forecast:Population decline postponed in Europe, Statistical Journal of the United Nations EconomicCommission for Europe Vol. 23, pp.1-10, 2006.
Australian Government: Charter of Budget Honesty Act 1998, Australian Government, 1998.
Australian Government Productivity Commission: Economic Implications of an AgeingAustralia, Australian Government Productivity Commission, March 2005.
Cardarelli, R. Sefton, J. and Kotlikoff, L.J.: Generational accounting in the UK, EconomicJournal, pp. F547-F574, 2000.
Congressional Budget Office: The Long-term Budget Outlook, CBO, December 2005.
Department for Work and Pensions: Security in retirement: towards a new pensions system,DWP, May 2006.
Department for Work and Pensions: Pensions Bill-Regulatory Impact Assessment, DWP,November 2006.
Department of the Treasury of Australia: Intergenerational Report 2002-03, 2002-03 BudgetPaper No.5, Treasury of Australia, May 2002.
Duval, R: The retirement effects of old-age pension and early retirement schemes in OECDcountries, OECD Working Paper No. 270, OECD, 2003.
Economic Policy Committee and European Commission: The 2005 projections of age-relatedexpenditure (2004-2050) for the EU-25 Member States: underlying assumptions andprojection methodologies, EPC, November 2005.
Economic Policy Committee and European Commission: The impact of ageing on publicexpenditure: projections for the EU25 Member States on pensions, health care, long-termcare, education and unemployment transfers (2004-2050), EPC, February 2006.
Eurostat population projections, Eurostat, 2005, http://www.europa.eu.int/comm/eurostat/.
Foresight. http://www.foresight.gov.uk and http://www.foresight.gov.uk/Obesity/Obesity.htm.
Government Actuary’s Department: 2002-based, 2003-based interim and 2004-basedpopulation projections. http://www.gad.gov.uk/Population/index.asp.
Graham, B. and Goodall, Y.: Proximity to death and acute care utilisation in Scotland, ScottishExecutive, 2002.
Hagist, C. and Kotlikoff, L.: Who’s going broke? Comparing growth in healthcare costs in tenOECD countries, NBER Working Paper No.11833, 2005.
HM Treasury: Code for Fiscal Stability, HM Treasury, 1998.
HM Treasury, Analysing UK Fiscal Policy, HM Treasury, 1999.
HM Treasury: Long-term public finance report: an analysis of fiscal sustainability, HMTreasury, November 2002.
HM Treasury: The Green Book: Appraisal and Evaluation In Central Government, HMTreasury, 2003.
59
BI B L I O G R A P H Y
HM Treasury: Long-term public finance report: fiscal sustainability with an ageingpopulation, HM Treasury, December 2003.
HM Treasury: Long-term public finance report: an analysis of fiscal sustainability, HMTreasury, December 2004.
HM Treasury: Written statement to Parliament on the Spending Review, HM Treasury, July2005.
HM Treasury: Long-term public finance report: an analysis of fiscal sustainability, HMTreasury, December 2005.
HM Treasury: Budget 2006: Economic and Fiscal Strategy Report: A strong and strengtheningeconomy: Investing in Britain’s future, HM Treasury, March 2006.
HM Treasury: Long-term opportunities and challenges for the UK: analysis for the 2007Comprehensive Spending Review, HM Treasury, November 2006.
HM Treasury: Press notice: Publication of the Stern Review on the Economics of CimateChange, available at http://www.hm-treasury.gov.uk/newsroom-and-speeches/press/2006/press/stern-06.cfm.
HM Treasury: End of Year Fiscal Report 2006, HM Treasury, December 2006.
International Monetary Fund: Manual on Fiscal Transparency, IMF.http://imf.org/external/np/fad/trans/manual/gloss.htm.
International Monetary Fund: United Kingdom: 2006 Article IV Consultation – Staff Report;Staff Supplement; and Public Information Notice on the Executive Board Discussion, IMF,March 2006.
International Monetary Fund: Canada: 2006 Article IV Consultation – Staff Report; StaffSupplement; and Public Information Notice on the Executive Board Discussion, IMF, June2006.
Jackson, R.: Building Human Capital in an Aging Mexico: A report of the U.S.-Mexicobinational council, Center for Strategic and International Studies, July 2005.
Jackson, R. and Howe, N.: The Graying of the Middle Kingdom – The Demographics andEconomics of Retirement Policy in China, Center for Strategic and International Studies, April2004.
Manton, K.G., Gu, X. and Lamb, V.L.: Long-Term Trends in Life Expectancy and Active LifeExpectancy in the United States, Population and Development Review Vol.32, pp.81-105, 2006.
Ministry of Finance of Japan: Current Japanese Fiscal Conditions and Issues to be Considered,Ministry of Finance of Japan, 2006.
New Zealand Treasury: New Zealand’s Long-term fiscal position, New Zealand Treasury, June2006.
Office for National Statistics: Labour Force Projections 2006-2020, ONS, January 2006.
Office for National Statistics: Health expectancies at birth & at age 65 in the United Kingdom,ONS. http://www.statistics.gov.uk/StatBase/Product.asp?vlnk=12964&Pos=3&ColRank=2&Rank=272.
60 Long-term public finance report
BI B L I O G R A P H Y
Organisation for Economic Co-operation and Development: Coping with Ageing: A DynamicApproach to Quantify the Impact of Alternative Policy Options on Future Labour Supply inOECD Countries, OECD, June 2004.
Organisation for Economic Co-operation and Development: OECD Economic Survey of theUnited Kingdom 2005, OECD, October 2005.
Organisation for Economic Co-operation and Development: OECD Economic Outlook No.79, May 2006, OECD, May 2006.
Personal Social Services Research Unit: Thirty-Five Years on: Future Demand for Long-TermCare in England, PSSRU Research Summary 35, 2006.
Sefton, J. and Weale, M.: Fiscal Implications of Demographic Uncertainty for the UnitedKingdom, National Institute of Economic and Social Research, January 2005.
Shaw, C.: Accuracy and uncertainty of the national population projections for the UnitedKingdom, Population Trends No.77, pp.24-32, 1994.
Shaw, C.: 2004-based national population projections for the UK and constituent countries,Population Trends No. 123, 2006.
Stern, N.: Stern Review on the Economics of Climate Change, October 2006.
United Nations: World Population Prospects, The 2004 Revision, United Nations, 2005.
Van Ewijk, C., Draper, N., ter Rele, H. and Westerhout, E.: Ageing and the Sustainability ofDutch Public Finances, Netherlands Bureau for Economic Policy Analysis, 2006.
Wanless, D.: Securing our Future Health: Taking a Long-term View Interim Report, April 2001.
Wanless, D.: Securing our Future Health: Taking a Long-term View, April 2002.
Wanless, D.: Securing Good Care for Older People: Taking a Long-term View, King’s Fund,2006.
Wilson, T and Bell, M: Australia’s uncertain demographic future, Demographic research Vol. 11,pp. 195-234, 2004.
61Long-term public finance report

62 Long-term public finance report
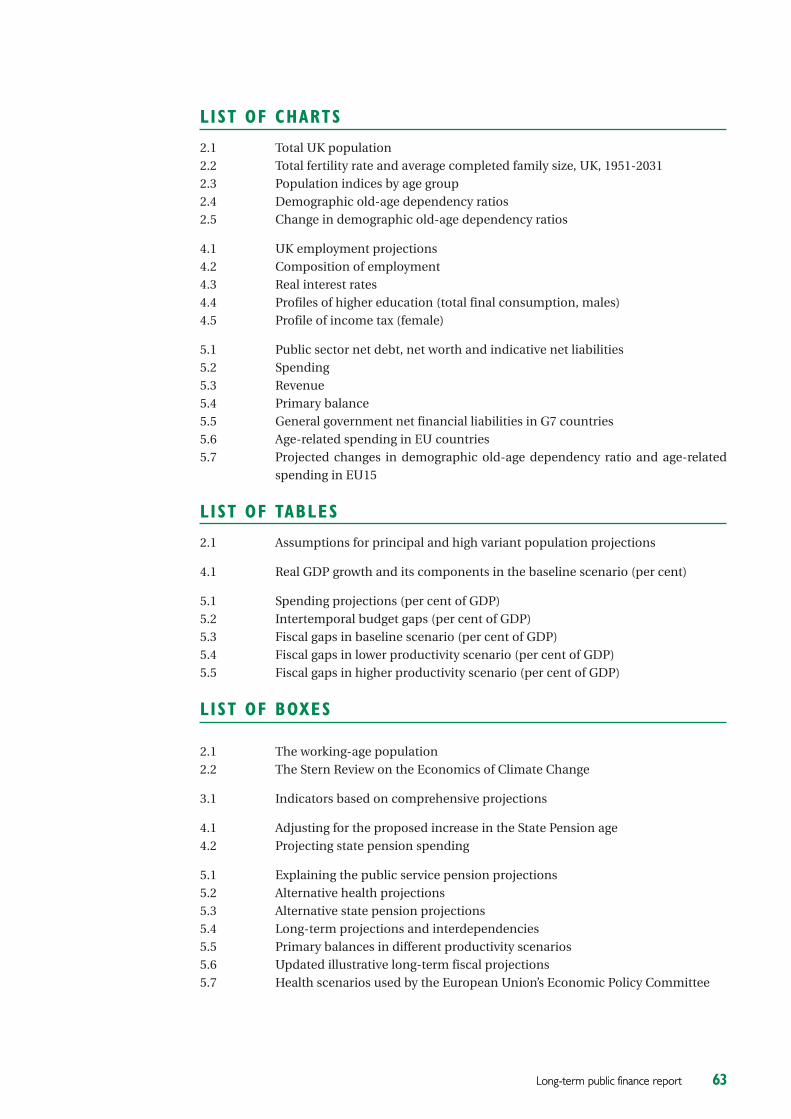
LIST OF CHARTS
2.1 Total UK population2.2 Total fertility rate and average completed family size, UK, 1951-20312.3 Population indices by age group2.4 Demographic old-age dependency ratios2.5 Change in demographic old-age dependency ratios
4.1 UK employment projections4.2 Composition of employment4.3 Real interest rates4.4 Profiles of higher education (total final consumption, males)4.5 Profile of income tax (female)
5.1 Public sector net debt, net worth and indicative net liabilities5.2 Spending5.3 Revenue5.4 Primary balance5.5 General government net financial liabilities in G7 countries5.6 Age-related spending in EU countries5.7 Projected changes in demographic old-age dependency ratio and age-related
spending in EU15
LIST OF TABLES
2.1 Assumptions for principal and high variant population projections
4.1 Real GDP growth and its components in the baseline scenario (per cent)
5.1 Spending projections (per cent of GDP)5.2 Intertemporal budget gaps (per cent of GDP)5.3 Fiscal gaps in baseline scenario (per cent of GDP)5.4 Fiscal gaps in lower productivity scenario (per cent of GDP)5.5 Fiscal gaps in higher productivity scenario (per cent of GDP)
LIST OF BOXES
2.1 The working-age population2.2 The Stern Review on the Economics of Climate Change
3.1 Indicators based on comprehensive projections
4.1 Adjusting for the proposed increase in the State Pension age4.2 Projecting state pension spending
5.1 Explaining the public service pension projections5.2 Alternative health projections5.3 Alternative state pension projections5.4 Long-term projections and interdependencies5.5 Primary balances in different productivity scenarios5.6 Updated illustrative long-term fiscal projections5.7 Health scenarios used by the European Union’s Economic Policy Committee
63Long-term public finance reportLong-term public finance report

AP P R OAC H E S T O A S S E S S I N G LO N G -T E R M F I S C A L S U S TA I N A B I L I T Y3
64 Long-term public finance report
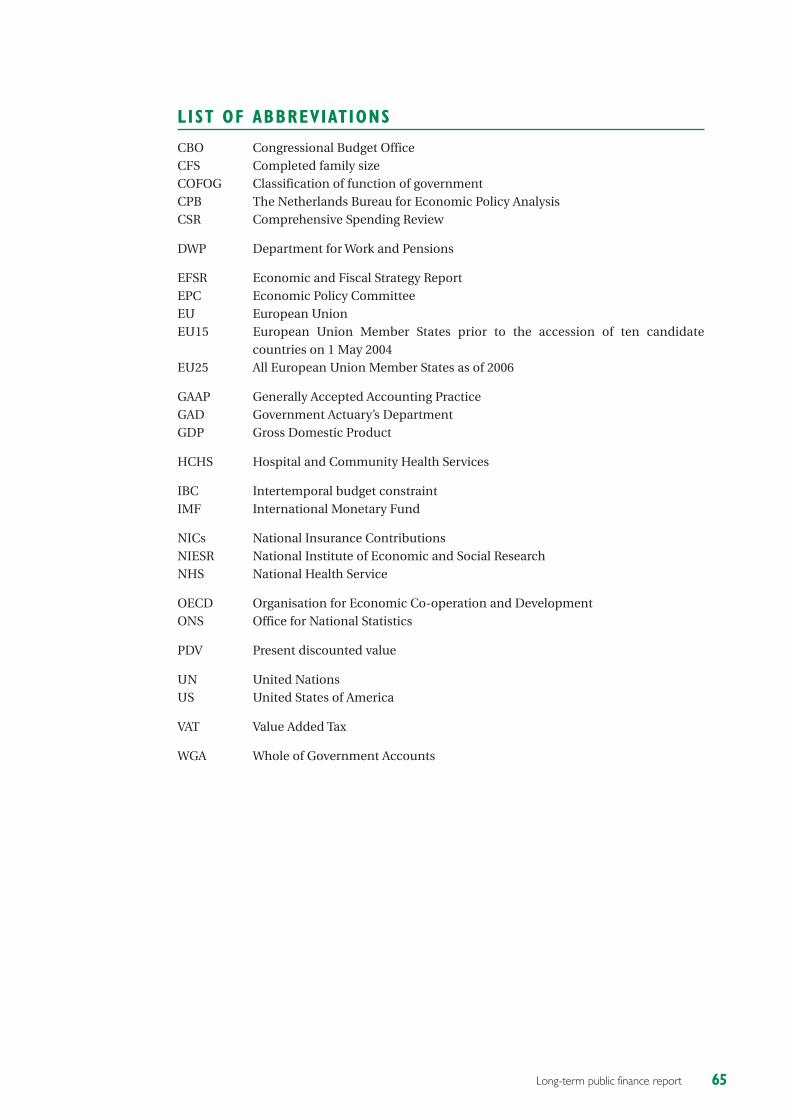
AP P R OAC H E S T O A S S E S S I N G LO N G -T E R M F I S C A L S U S TA I N A B I L I T Y 3
65Long-term public finance report
LIST OF ABBREVIATIONS
CBO Congressional Budget OfficeCFS Completed family sizeCOFOG Classification of function of governmentCPB The Netherlands Bureau for Economic Policy AnalysisCSR Comprehensive Spending Review
DWP Department for Work and Pensions
EFSR Economic and Fiscal Strategy ReportEPC Economic Policy CommitteeEU European UnionEU15 European Union Member States prior to the accession of ten candidate
countries on 1 May 2004EU25 All European Union Member States as of 2006
GAAP Generally Accepted Accounting PracticeGAD Government Actuary’s DepartmentGDP Gross Domestic Product
HCHS Hospital and Community Health Services
IBC Intertemporal budget constraintIMF International Monetary Fund
NICs National Insurance ContributionsNIESR National Institute of Economic and Social ResearchNHS National Health Service
OECD Organisation for Economic Co-operation and DevelopmentONS Office for National Statistics
PDV Present discounted value
UN United NationsUS United States of America
VAT Value Added Tax
WGA Whole of Government Accounts

AP P R OAC H E S T O A S S E S S I N G LO N G -T E R M F I S C A L S U S TA I N A B I L I T Y3
66 Long-term public finance report