c p & m & w z r Forschungszentrum Karlsruhe Technik und Umwelt Wissenschaftliche Berichte FZKA 5767 /"/•y ? q Cdß. • , , , t Long-Term Safety of Radioactive Waste Disposal Retention of Pu, Am, Np and Tc in the Corrosion of COGEMA Glass R7T7 in Salt Solutions Final report B. Grambow, W. Lutze, L. Kahl, H. Geckeis, E. Bohnert, A. Loida, P. Dressier Institut für Nukleare Entsorgungstechnik Institut für Technische Chemie August 1996 VOL 2 8 IIa 0 3
Transcript
c p & m & w z r
Forschungszentrum Karlsruhe Technik und Umwelt Wissenschaftliche Berichte FZKA 5767
/ " / • y ? q Cdß. • , , , t
Long-Term Safety of Radioactive Waste Disposal Retention of Pu, Am, Np and Tc in the Corrosion of COGEMA Glass R7T7 in Salt Solutions Final report
B. Grambow, W. Lutze, L. Kahl, H. Geckeis, E. Bohnert, A. Loida, P. Dressier Institut für Nukleare Entsorgungstechnik Institut für Technische Chemie
August 1996
VOL 2 8 IIa 0 3
NOTICE
PLEASE BE AWARE THAT THIS IS THE
BEST REPRODUCTION POSSIBLE BASED
UPON THE ORIGINAL DOCUMENT
RECEIVED
K S 0 0 2 1 1 1 8 2 2 R : FI D E 0 0 9 4 4 0 9 8 5
Forschungszentrum Karlsruhe Technik und Umwelt
*DE009440985*
Wissenschaftliche Berichte
FZKA 5767
Long-Term Safety of Radioactive Waste Disposal:
Retention of Pu, Am, Np and Tc in the Corrosion of COGEMA Glass R7T7 in Salt Solutions
Final report
B. Grambow, W. Lutze*, L. Kahl, H. Geckeis, E. Bohnert, A. Loida, P. Dressler
Institut für Nukleare Entsorgungstechnik Institut für Technische Chemie
* University of New Mexico, Albuquerque
Forschungszentrum Karlsruhe GmbH, Karlsruhe
1996
Als Manuskript gedruckt Für diesen Bericht behalten wir uns alle Rechte vor
For performance assessment o f high-level radioactive waste disposal in salt formations, corrosion tests were carried out, using high active R7T7-type glass containing reprocessing waste, produced by C E A Marcoule. The objective of this investigation was to describe the extent to which Np, Pu, A m and Tc are mobilized from vitrified high-level waste into the near field, when a repository-relevant (Gorleben) concentrated salt solution intrudes the emplacement locations. Furthermore, it should be assessed, if the large data base generated on the reaction behavior o f inactive R7T7-type glass under saline conditions is applicable to the high active glass. Glass powder with an average grain size of 86 um (surface area to solution volume ratio S /V = 9370 m*1). was corroded in a halite saturated concentrated Mg(Ca )C l2 - salt solution for periods o f time up to 720 days at 110°, 150° and 190°C. In order to assess, whether the results from previous inactive tests are applicable to those of the active experiments, the results of both type of experiments are compared. pH changes of the radioactive leachate are the same as in inactive leachates. Acidification of the leachate during glass dissolution results from the formation of solid alteration products, in particular of the clay mineral saponite. The time and temperature dependence of the reaction for the radioactive glass are in excellent agreement with that of the inactive glass suggesting that the corrosion mechanism remains the same. The data for Pu and A m release indicate that fractions of these glass constituents are retained to various degrees during glass corrosion, controlled by the temperature, whereas N p and Tc are released congruently with the soluble elements from the glass. In the presence of corroding container material concentrations of N p and Tc were found to be about 100 times lowe.r_wheigas_P.u_ concentrations were higher than in the parallel experiment without iron.f Since active and inactive glass have the same time and tempe'rature d e p ^ radiation damage or radiolysis are not
expected to change the reaction kinetics. Hence, kinetic data of the inactive and active laboratory glass are directly applicable to full size radioactive glass canisters^ \
Kurzfassung : Rückhaltung von Pu, A m , Np, und Tc bei der Korrosion von C O G E M A Glas R 7 T 7 in Salzlösung
T z u r Beurteilung des Langzeitverhaltens von hochradioaktivem Glas aus der Wiederaufarbeitung bei \ Kontakt mit Salzlösung wurden Korrosionsexperimente mit dem Glas R7T7 (COGEMA-Glas ) , hergestellt
bei CEA-Marcoule, durchgeführt. Ziel dieser Arbeiten ist die Untersuchung in welchem Ausmaß Np, Pu, A m , und Tc bei der Korrosion von hochaktivem Glas in das Nahfeld mobilisiert werden, wenn endlagerrelevante (Gorleben) konzentrierte Salzlösungen in das Endlager eindringen sollten. Darüberhinaus soll überprüft werden, ob die umfangreiche Datenbasis zum Reaktionsverhalten von inaktivem R7T7-GIas mit Salzlösung auch zur Beschreibung des Verhaltens von hochaktiven Glasprodukten verwendet werden kann. Die Korrosionstests wurden durchgeführt mit Glaspulver (Korngröße 86 pm; S/V-Verhältnis = 9370 m"1) und halitgesättigter Mg(Ca)Cl 2 Salzlösung über Reaktionszeiten bis zu 720 Tagen bei 110°, 150° und 190°C. Die Ergebnisse wurden verglichen mit denen, die mit dem entsprechenden inaktiven Glas unter den gleichen Versuchbedingungen erzielt worden waren. Die Veränderung des pH-Werts der Auslauglösung in Abhängigkeit von der Zeit ist bei den aktiven sowie bei den inktiven Versuchen identisch. Die sich einstellenden niedrigen pH-Werte können mit der Bildung fester sekundärer Phasen, insbesondere des Tonminerals Saponit erklärt werden. Die Zeit- und Temperaturabhängigkeit der Reaktion des aktiven Glases stimmt mit derjenigen des inaktiven Glases sehr gut überein, was auf identische Korrosionsmechanismen schließen läßt. Die Daten zur Mobilisierung von Pu und A m zeigen, daß Anteile dieser Glasbestandteile in unterschiedlichem Ausmaß, jeweils in Abhängigkeit von der Temperatur bei der Korrosion zurückgehalten werden, dagegen werden N p und Tc kongruent mit den löslichen Elementen des Glases mobilisiert. In Gegenwart von korrodierendem Behältermaterial sind die Konzentrationen von N p und Tc um ca. Faktor 100 niedriger und die Pu Konzentrationen aber deutlich höher als im vergleichbare^ Experiment ohne EisenzugabeJ Wegen der gleichen Abhängigkeit der Glaskorrosionsreaktion von der Zeit / und der Temperatur ist nicht zu erwarten, daß Radiolyse und Strahlenschäden von großem Einfluß auf das Korrosionsgeschehen sind. Daher kann aus den Daten zur Korrosionskinetik von aktiven und inaktiven Gläsern, die in Laborexperimenten erzielt worden sind, auch auf das mögliche Korrosionsverhalten von endgelagerten hochaktiven Glasprodukten im technischen Maßstab geschlossen werden, j '
•We were advised by CEA Marcoulc to use a different designation for the glass. The glass investigated here was fabricated by C E A Marcoule closely simulating the chemical composition of the glass produced by C O G E M A at La Hague in their vitrification plants. In the text, the glass from Marcoule is designated CEA R7T7.
2
LONG - TERM SAFETY OF RADIOACTIVE WASTE DISPOSAL
According to German nuclear waste management regulations, high-level radioactivo^-^3. waste products such as HLW-glass and /or spent fuel shall be disposed in deep geological1
formations. The release of hazardous quantities of radionuclides from the repository into the biosphere shall be excluded for all future. For this purpose several in part independent barriers ("multibarrier concept") shall limit the transport of ground water to and from the waste and shall also reduce the mobility of radionuclides by retention within stable waste matrices, by < remineralization and sorption processes. The innermost barrier is an engineered system con-sisting of the waste form "high-level waste glass" or "spent nuclear fuel", the packaging ma-terial (e.g., steel container) and the backfilling material (e.g., salt chippings, clay, apatite). In' addition, geoengineered barriers (e.g.,filling material, dams) and the geological barrier (hosí< rock, overburden) contribute to safety by delaying the transport of the radionuclides (e.g., by sorption). Without comprehensive knowledge of the performance of each of the various barri-ers under disposal conditions long-term safety of the repository cannot be guaranteed.
Performance of the engineered barrier system
Experimental programs are currently under way at our research center (FZK-INE), aiming at performance assessment of glass and spent fuel as barriers for radionuclide immo-bilization. The dissolution or corrosion behavior of the waste forms and the containers is stu-died in order to evaluate ihe potential mobilization of radionuclides, the subsequent reimmo-bilization within newly formed mineral phases (secondary reaction products) or by sorption on surfaces of host rock or engineered materials. The waste form corrosion behavior is studied in conjunction with basic studies on the chemistry (solubility, compiexation, coprecipitati-on...) of important radionuclides (in particular the actinides) in repository relevant aqueous solutions (deep groundwaters, brines). For assessing of the performance of the engineered barrier system, dissolution, remineralisation and migration phenomena must be analysed in the context of an integrated geochemical model. Results obtained in this research project were and will be published in a number of FZKA-reports (previously KfK-reports) related to the subject of "long-term safety of radioactive waste disposal".
The corrosion behavior of real high radioactive waste products and container materi-als is studied under repository relevant conditions. Waste products currently under investiga-tion are
• high-level waste borosilicate glass R7T7, similar in composition to thr °OGEMA produ-ced HAW-glass for the German base load customers,
• high bumup UO2 fuel (burnup > 50 MWd/kg U) from the Biblis and Gösgen (Switzerland) nuclear power plants.
Principal container materials studied include • thick fine grained carbon steels (corrosion allowance concept) • thin Ti0.2Pd alloys (corrosion resistant concept)
The behaviour of the waste forms in contact with solutions is evaluated on the basis o f the type and amount of radionuclides released to solution and gas phase and the structural change of the solid phases (e.g., decomposition of the microstructures, formation of secondary phases). Corrosion mechanisms, rate laws and processes governing release of individual radi-onuclides (sorption, coprecipitation, solubility, etc.) are to be determined. Container corrosion is evaluated on the basis of corrosion rates, mechanism and corrosion products. The effect of simoultaneously corroding container materials and of waste forms is investigated inserting container materials in the glass and spent fuel corrosion experiments.
Our work serves the purpose of developing models by means of which the contribution of the engineered barrier system to repository long-term safety can be assessed. The signifi-cance of individual experimental observations can only be evaluated in the general context. The relevance of laboratory findings for the natural system must be assessed as well as the validity o f the models developed.
Table of Contents
LIST OF FIGURES 5
A. OBJECTIVES AND SCOPE 7
B. WORK PROGRAM 8
SUMMARY 9
INTRODUCTION 13
The highly radioactive CEA-glass R7T7 17
EXPERIMENTAL 19
Preparation of hot cells, reaction vessels and auxiliary tools. 19 Preparation of hot cells 19 Autoclaves 21 Leachants 25 Procedure for conduction of the corrosion tests 26 Preparation of samples from leachates, filter residues, plate out of reaction vessel and surface alteration layers 29 Eh/pH analyses 34
Radiochemical separation and analyses techniques for Tc, Pu, Am and Np and other radionuclides in concentrated salt solutions 35
Sample preparation and analyzes of solid reaction products 40
RESULTS OF GLASS CORROSION TESTS 41
Useful units 41
Radionuclide distribution among mobile and immobile phases: mass balances 43
Glass dissolution characteristics and radionuclide behavior . 49 Evolution of pH values with reaction progress 49 Time dependence of reaction 50 Retention Behavior of Np. Am. Pu and Tc during glass corrosion 56 Oxidation states of Pu and Pu mobility 59 Colloid formation . 62
3
Effcct of the presence of iron 63
Identification of solid alteration products 65
MODELING 73
Modeling and discussion of individual radionuclide behavior 76 Behavior of Pu 76 Behavior of trivalent actinides 79
CONCLUSIONS 83
ACKNOWLEDGMENT 84
APPENDIX 85
4
List of Figures
Figure 1: The highly active block of CEA-R7T7 glass and some fractured pieces in the hot cells 17 Figure 2: Interior of cell 4, used for preparation of glass powder. From left to right a jaw braker for glass
fracturing, the centrifugation mill and the sieving machine. In the front: coarse glass fragments 20 Figure 3: Interior of cell 5a, used for conducting glass corrosion tests. The mirror of the door of the heating
cabinet shows autoclaves located at the bottom of the heating cabinet 20 Figure 4: Various parts of the autoclaves used, including the corrosion and radiation resistant Ta liner and
its PTFE-Teflon support 21 Figure 5: View on an autoclave used for glass corrosion tests, closed by means of an clcctrical srew driver 22 Figure 6a-c: Various stages of fracturing the highly radioactive glass block 23 Figure 7: Introduction of fractured glass into the mill 24 Figure 8: Glass powder for glass corrosion tests (average grain size 86 jim) 25 Figure 9: Filling the autoclave with glass powder 27 Figure 10: Introducing Ar-gas into the reaction vessel via a metal pipe beneath a cover out of acrylic glass 28 Figure 11: Removing Ar-gas inlet to close vessel lid 28 Figure 12: Scheme of sampling after terminating the glass corrosion tests 30 Figure 13: Solution sampling after terminating the glass corrosion tests: a) opening teaction vessel, b)
removal of liner lid, c) solution sampling, d) filtration through membrane of 450 nm pore size, e) solution in ultrafiltration vial, 0 vial in centrifuge for ultrafiltration, g) pH measurement, h) pH rcading32
Figure 14: Steps after solution sampling: a) view into the reaction vessel, b) rinsing the autoclave liner, c) decanting remaining solution (waste), d) collection of corroded glass powder 33
Figure 15: Flow sheet of the radioanalytical procedure 36 Figure 16: Example for the distribution of Am241, Pu239, Sr90, Csl37, Np237 and Tc99 among solid
reaction products, sorbed material on the surface of the liner of the reaction vessel and the solution and colloidal phases after glass corrosion in a halite saturated Mg(Ca)CI2 rich brine at a temperature 110°C for 720 d. 45
Figure 17: Example for the distribution of Am241, Pu239, Sr90, Csl37, Np237 and Tc99 among solid reaction products, sorbed material on the surface of the liner of the reaction vessel and the solution and colloidal phases after glass corrosion in a halite saturated Mg(Ca)CI2 rich brine at a temperature 150°C for 720 d. 47
Figure 18: Example for the distribution of Am241, Pu239, Sr90, Csl37, Np237 and Tc99 among solid reaction products, sorbed material on the surface of the liner of the reaction vessel and the solution and colloidal phases after glass corrosion in a halite saturated Mg(Ca)CI* rich brine at a temperature 190°C for 720 d. 48
Figure 19: Evolution of pH during corrosion of active and inactive CEA-R7T7 glass in halite saturated Mg(Ca)Cl2-solution at 190°C 50
Figure 20: Time and temperature dependence of CEA-R7T7 glass corrosion in halite saturated Mg(Ca)Ch-solution. Reaction progress values calculated by according to Eq. 4 and plotted versus the product of the square root of time and the S/V ratio. 52
Figure 21: Release of radionuclides from high active CEA-R7T7 glass in halite saturated Mg(Ca)Cl2-solution at 110°C. 57
Figure 22: Release of radionuclides from high active CEA-R7T7 glass in MgClz- solution at 150°C. 58 Figure 23: Release of radionuclides from high active CEA-R7T7 glass in halite saturated Mg(Ca)CI2-
solution at 190°C. 61 Figure 24 Relative change in solution concentrations of significant radionuclides by addition of iron powder
(Experiment performed for 90 days at 190"C, y-axis denote the ratio of solution concentration of a given element to a similar experiment without iron) 65
Figure 25: Scanning electron micrograph of a small fraction of the surface of a tantalum plate retrieved after terminating a glass corrosion experiment for 45d at 110°C (gold plated) 66
5
Figure 26: Detail of Figure 25 66 Figure 27: EDX-analyses of crystals observed in Figure 25: Ca-Nd-molyhdates (Powellite) 67 Figure 28: Alteration products of corroding higly active CEA-R7T7 glass at 110°C. a) powellite, b) silica
rich nodules 67 Figure 29: EDX-spcctra of powellite crystal and of silica rich nodules 68 Figure 30: Powcllite crystal formed after 90 days of corrosion of highly active R7T7 glass in Mg(Ca)-rich
saline brine at 150°C. The crystal shows signs of a beginning dissolution process 69 Figure 31: Various phases formed during the corrosion of highly active R7Y7 glass in a halite and anhydrite
saturated concentrated Mg(Ca)Cl2 solution: a) corrodcd glass grain, b) clay mineral, c) Si-rich flakes, d) C a C 0 3 (calcite?), c) powellite, g) clay, g) NaCI, h) C a S 0 4 (anhydrite?) 70
Figure 32: SEM micro graph of a calcium molybdate crystal (powcllite type), observed on the tantalum metal plate retrieved from an inactive control experiment performed with simulated CEA-R7T7 glass for 90 d at 190°C Beneath the crystal is seen a layer of alumo-magnesium-silicate, 71
Figure 33: Details of the clay layer beneath the powcllite crystal of Figure 32 72 Figure 34: EDX-Analyses of the elemental composition of the clay layer shown in Figure 32, compared with
the EDX spectrum of the surface alteration layer on the glass measured in a similar experiment 72 Figure 35: Paragenetic sequence of secondary minerals predicted by geochcmical modeling (EQ3/6) to form
along the reaction path of glass dissolution 75 Figure 36: Same calculations of reaction path as in Figure 35: cation percentages for the main components
Mg, Al, Si 75 Figure 37:.Estimation of predominances of various Pu-spccies and valence states as a function of pH and Eh
in the abscncc of carbonate at 25°C in brine 2 solution. Included arc experimentally measured Eh/pH data for experiments performed at • 110°C, A 150°C and o 190°C in the abscncc of iron (for details see text) Eh/pH ranges for other relevant repository conditions (NaCI rich brine 3, experiments with iron) arc indicated for comparison 78
Figure 38: Relative proportion of Pu(V) measured in our experiments, plotted as a function of the pH-valuc of the final leachatc. Comparison to curves calculated for a constant nominal fugacity of oxygen (pc+pH=15,4 corresponds to log_/{02) = -22). Calculations were performed with the help of the Programm EQ3/6 using the thermodynamic data discusscd in the text. 79
6
A. Objectives and Scope
High-level radioactive waste from the reprocessing of German spent fuel is vitrified at La
Hague, France. Glass blocks will be returned to Germany to be disposed in a deep repository,
probably located in the Gorleben salt dome. The repositoiy constitutes a system of technical and
natural barriers (multibarrier system) against the long-term release of radionuclides. The role of
the glass block as a technical barrier is to immobilize radionuclides, even after accidental intrusion
of saline solutions. A detailed understanding of the long-term corrosion of glass must be obtained
for all conceivable repository relevant conditions. The respective results shall be used to describe
source terms in the framework of safety analyses,
The objective of the present investigation is to study the chemical durability of a highly
radioactive French borosilicate glass of R7T7-type in one of the three German reference salt
solutions as a function of time and temperature, This work complements previous investigations
on the durability of a very similar but non-radioactive CEA glass of R7T7-type by measuring the
release and retention behaviour of Pu, Am, Np and Tc.
7
B. Work program
The work program consists of
1. Installation of the hot cells and preparation of powdered glass samples with an average grain
size of 86 um
2. Modification of analytical techniques for radiochemical separation of Te, Pu, Am and Np from
concentrated salt solutions
3. Equipment for corrosion tests: Tantalum lined autoclaves
4. Powdered glass shall be corroded in salt solutions under Argon atmosphere
(T=l 10,150,190°C; S/V 10000 m"1) for 45 to 1000 days (duplicate tests).
5. Solution analyses: Solution sampling at test termination and determination of pH, B, Si and Tc,
Pu, Am and Np. Measurement of filtered and ultrafiltered samples and determination of colloidal
contributions.
6. Analyses of the corrosion layers to search for host phases for actinoids and Tc
During analyses and evaluation of the results of the first experiments it became obvious that an
extension of the work program was necessary in order to be able to evaluate the release and
retention of radionuclides during glass corrosion. This extension consists (1) of certain examples
of a full and complete analyses of the distribution (mass balance) of long lived radionuclides
among the surface alteration layer on the glass, the aqueous phase and material sorbed on the
vessel walls. (2) For interpreting the experimental results it was necessary to model the glass-
water reaction with geochemical programs and compare the results with the experimental data.
8
SUMMARY
For performance assessment of high-level radioactive waste disposal in salt formations,
corrosion tests were performed at FZK, using high active R7T7-îype glass contacting saline
solutions. The objective of this investigation was to describe the extent to which Np, Pu, Am and
Tc are mobilized from vitrified high-level waste into the near field, when a repository-relevant
(Gorleben salt dome) concentrated salt solution intrudes the emplacement locations. The
maximum test temperature is determined by the designed maximum surface temperature of 200°C
for vitrified waste in the salt. Furthermore, it should be assessed, if the large data base generated
on the reaction behavior of inactive R7T7-type glass under saline conditions is applicable to the
high active glass.
Glass samples containing reprocessing waste were produced by CEA's 'Centre de la
Vallée du Rhône', France. Activity concentrations, except for Pu, are lower in this glass than in
the COGEMA glass R7T7, because a different waste was used. The glass was powdered to an
average grain size of 86 |im and corroded in a halite saturated concentrated Mg(Ca)Cl2- salt
solution for periods of time up to 720 days at 110°, 150°, and 190°C (surface area to solution
volume ratio S/V = 9370 m"1). Analyzes were performed on filtered and ultrafiltered leachates, on
filter residues, on sorbed radionuclides at the reaction vessel wall, and on the altered glass
surfaces. Pu oxidation states were determined at all temperatures after cooling.
The reaction behavior of the high radioactive glass was similar to the behavior of
simulated inactive glass studied in previous research projects under the same environmental
constraints. The pH values of leachates from corrosion experiments with the radioactive glass are
in excellent agreement with those from experiments with the inactive glass. Acidification of the
leachate during glass dissolution results from the formation of solid alteration products, in
particular of the clay mineral saponite. The extent of matrix dissolution of the active glass differs
by less than a factor of two from respective results with the inactive glass. This is true for both
the time and temperature dependence of the corrosion reaction, suggesting that the corrosion
mechanism remains the same. Hence, the abundant information on the time dependence of the
9
reaction of the inactive R7T7 glass and the empirical rate law derived from these data can be used
to describe the behavior of the active glass. As has been shown previously for the inactive glass,
the corrosion reaction of R7T7-type glasses follows a square root of time rate law, indicating
diffusion control. Under silica saturated conditions, the extent of glass corrosion has been found
to be directly proportional to surface area and to be independent on solution volume.
The data for Pu and Am indicate that fractions of these glass constituents are retained to
various degrees during glass corrosion whereas Np and Tc are released congruently with the
soluble elements from the glass. Initial retention of Tc at 190°C is of transitory nature. There is a
specific effect of temperature on the degree of retention of Pu and Am. With increasing reaction
progrès (£) values at 110°C Pu concentrations becc./ie progressively controlled by the kinetics of
glass matrix dissolution. Am data indicate a high but decreasing retention with increasing At
190°C Pu is strongly retained in the surface layer of the glass whereas release of Am appears to be
controlled by the kinetics of glass matrix dissolution. Retention of Am at 110°C may be explained
by the formation of Ca,REE,Am-molybdate (powellite solid solutions). This phase is known to
limit concentrations of rare earth elements in solution and a powellite-type phase was detected on
either glass surface or reaction vessel wall. The decreasing rather than increasing concentrations of
Pu with time and increasing (decreasing pH) at 190°C are surprising and may be associated with
the complex redox chemistry of Pu. Higher Pu or.idation states, Pu(V,VI), were most abundant in
leachates from experiments at 110°C. Here Pu and U(VI) behavior is also similar. Leachates from
experiments at 190°C contained Pu(III) and Pu(IV) and no Pu(V,VI). Behavior of Pu and U(VI) is
quite different. Pu mobility is highest with the highest oxidation states of Pu, observed at the
lowest temperature. At 190°C, Pu concentrations are relatively low, as expected from the presence
of Pu(IV) that forms insoluble Pu(hydr)oxide, part of which has been found in the solution in
colloidal form. Maximum solution concentrations of actinides were rather high, as expected for the
rather acid solution concentrations: 10"4 M for U, 7-10"5 M for Pu, 4-10'5 M for Am, 5-10"5 M for
Tc and 5-10"6 M for Np.
The effect of container material on the retention of Np, Am, Pu and Tc has been studied
by means of glass corrosion experiments performed at 190°C with iron powder added.
10
Concentrations of Np and Tc were found to be lower whereas Pu concentrations were higher
than in the parallel experiment without iron. The presence of iron probably results in the
reduction of Np (V) and Tc(VTl) to sparingly soluble Np(IV) and Tc(IV). Pu was released to the
same extent than Am, Eu and Cm, indicating presence of Pu in the trivalent state. The increase in
the solution concentrations of Pu in presence of Fe may be explained by the reaction Pu3+ +
7/2H20 + l/402(g) <-> Pu(OH)4(s) + 3H+. In the presence of metallic Fe the partial pressure of
oxygen is extremely small, and, consequently, the reaction is pushed to the left side, thus
augmenting Pu solubility.
Modeling of the reaction path of R7T7 glass with the Mg-rich reference brine was
performed based on Pitzer's electrolyte theory using the geochemical code EQ3/6. No database
adjustment was performed. The same pH evolution and the solid reaction products were
postdicted which were found experimentally: halite, anhydrite, Mg-rich smectite minerals with a
composition between saponite and montmorillonite, Sr-containing barite (BaS04) and powellite
(CaMo04). The rare earth content of powellite calculated by means of an ideal solid solution
model matched well experimental values, and, consequently, calculated contents of Am in this
phase may also be valid. The results show, that the retention of Am in powellite is a complication
function of environmental constraints, including mass balance of Calcium and molybdenum and
competing reactions with sulfate.
Certain findings of our work are directly applicable to repository relevant conditions.
Concentrations of actinides and Tc in the leachates are determined by their oxidation states which
depend on the composition of the system, in particular on the presence of reducing components such as
container materials (Fe, ..). Due to limited retention of Tc, Np, Pu and Am in the experiments in the
absence of container materials, we can take no credit from secondary phase formation (solubility,
coprecipitation) and the rate law for glass matrix dissolution must be used to estimate the long-term
release of these elements, provided that the effect of the canister is neglected.
Since active and inactive glass have the same time and temperature dependence of
corrosion, radiation damage or radiolysis are not expected to change the reaction kinetics. It has been
537
shown in the literature tbitï inactive glass produced under laboratory conditions behaves almost
identical to industrial scale full size glass canisters if exposed to the same experimental conditions.
Hence, kinetic data of the inactive and active laboratory glass are directly applicable to full size
radioactive glass canisters. Maximum extent of matrix dissolution was about 3 jim after two years of
reaction, cot responding to alteration of about 0.01% of a full size fractured glass canister. Not
considering decrease of temperature and rates with time, this would already correspond to glass „life
times" of about 10000 years, indicating strong kinetic stability of the glass under conditions of disposal
in salt formations.
12
Introduction
Borosilicate glass is the principal solid matrix for immobilizing about 99% of the highly
radioactive, heat generating isotopes extracted during reprocessing from spent nuclear fuel.
Industrial scale production of so called R7T7 glass has been started by the COGEMA in La
Hague (France) in the vitrification plants R7 and T7. Until the year 2003 about 2800 glass
canisters, each filled with about 150 liter of R7T7 glass, shall be returned from France to
Germany awaiting permanent disposal. It must be ascertained that the waste can be safely isolated
in deep underground repositories for long periods of time. The release of hazardous quantities of
radionuclides from a repository shall be excluded by a multiple barrier containment system,
including a central engineered system consisting of the canistered glass, an overpack and backfill
materials. If the glass would retain all radionuclides upon contact with groundwater, proof would
not be necessary that geological isolation is safe. However, the glass corrodes slowly in water and
humid air and inevitably certain quantities of radionuclides are mobilized. The corrosion resistance
of glass is not an inherent property of the material but depends on the waste package and on
geochemical and hydrological constraints. The difficult task is to predict the release/retention of
radionuclides for long time periods considering the interaction with other engineered and natural
barriers.
The durability of glass in contact with ground water and its ability to retain radionuclides
within its structure ("glass network") has been studied for more than three decades1. Radionuclide
release may be controlled by the glass dissolution rate, by solubility, sorption etc.. The two
fundamental controls of dissolution rates are initial water diffusion/ ion exchange and subsequent
network hydrolysis/ dissolution. The accumulation of dissolved silica and other glass constituents
in solution leads in many cases to significant decrease in the dissolution rate2. Considering that the
glass phase is thermodynamically metastable with respect to a crystalline phase assemblage, the
1 Lutze, W.; "Silicate Glasses", in Radioactive Waste Forms for the Future, edited by W. Lutze and R.C. Ewing, Elsevier Science Publishers B.V., Amsterdam (1988) pp. 1-160
2 Vernaz, E.Y. and J-L. Dussossoy, "Current State of Knowledge of Nuclear Waste Glass Corrosion Mechanism: The Case of R7T7 Glass", Appl. Geochem., Suppl. Issue No. 1 (1992)
13
disequilibrium between the bulk glass phase and the solution remains3 and the reaction will
continue as long as an aqueous phase is present.
Glass alteration may or may not be accompanied by transfer of glass constituents
(including radionuclides) to a potentially mobile aqueous phase. Sparingly soluble glass
constituents become incorporated in or sorbed on solid glass alteration products forming a surface
layer on the glass and will sorb, if present, on the surface of iron canisters, but may also be
mobilized by complexation in solution cr by sorption on groundwater colloids. Newly formed
The mobility of radionuclides depends on glass properties and on the properties of the
other engineered barrier materials, on hydrodynamic constraints, on the groundwater
composition, on the quantity of transportable colloids and on solubility and complexation
behavior of the radionuclides. Of particular importance is the impact of glass dissolution on near
field chemistry (pH etc.). Using geochemical models, the mass transfer relations of all components
in the system, i.e. the "reaction path", can be rationalized and in part predicted. The evolution of
the composition (pH etc.) of the aquatic medium (near field chemistry) thus, can be assessed
[3,4]. In particular, container materials may strongly interact with the glass corrosion process.
Using highly radioactive glasses or actinide doped glasses, significant insight into the
behavior of individual radionuclides can obtained. Release rates in particular of Pu and Am are
often orders of magnitude lower than glass dissolution rates. However, only for specific
experimental conditions it it is possible to quantify radionuclide retention. Many experiments with
a given reference glass composition must be performed under a wide range of conditions, and the
results of all these tests must be described with an unambiguous model, before realistic
predictions can be performed.
3 Advocat. T.. J.L. Crovisier. B. Fritz and E. Vcrnaz. Mat. Res. Soc. Symp. Proc. Vol 176, pp. 241-48, Materials Research Society, Pittsburgh, P A USA (1990)
A Grambow, B., W. Lutze and R. Müller, "Empirical Dissolution Rate Law for the Glass R7T7 Contacting Halite-and Silica-Saturated Brines". Mat. Res. Soc. Symp. Proc. 257. (1992)
14
The present work attempts to enhance understanding of glass dissolution properties,
release properties of individual radionuclides and related radionuclide source terms for safety
assessments of repositories in salt formations. With respect to glass as a barrier against
radionuclide mobilization from such a repository, the worst case scenario is the early intrusion of
certain quantities MgCh lieh brines to the disposal location and the leaching of long-lived
radionuclides at rather high temperatures of up to 200°C. The experimental conditions reflect this
scenario.
For the experiments the high active glass CEA R7T7 was used, as produced by the
Commissariat à l'Energie Atomique (CEA) in Marcoule, France. It is not the "real" glass R7T7,
industrially produced by the COGEMA in La Hague, France, but it closely simulates its elemental
composition and the a and y radioactivity contents of a real glass after about 100 years of decay.
It contains a radioactive fission product mixture, originating from reprocessing of spent nuclear
fuels and inactive simulated fission products. The CEA glass is additionally enriched with Pu-238
to simulate the contents of a decaying actinides.
A fully simulated inactive glass of the composition R7T7 has already been investigated by
the authors for the conditions of disposal in salt formations. The results are published in
[4,5,6,7,8]. Nevertheless, certain corrosion properties of the real waste glasses cannot be studied
using inactive glasses alone. This is true in particular for the behavior of Tc and the transuranic
elements, because for these elements there do not exist truly chemically homologue elements for
simulation. Also the effect of a - and y-radiolysis on glass corrosion cannot be studied exclusively
with inactive glasses.
5 Lutze. W., Malow, G. Rabe, H. Headley, T. J., Surface Layer Fonnation on a Nuclear Waste Glass, Mat. Res. Soc. Symp. Proc., D. G. Brookins. ed., Vol.15. (1983) 37.
6 Freude, E., Grambow, B„ Lutze, W., Ewing, R. C.. Long-Tenn Release from High Level Waste Glass - Part IV: The Effect of Leaching Mechanism, Mat. Res. Soc. Symp. Proc., C. M. Jantzen, J. A. Stone. R. C. Ewing, eds., Rabe, H. Vol.44, 99-106 (1984).
7 Lutze, W.. Müller. R.. Montserrat. W., Chemical Corrosion of Cogeina Glass R7T7 in High Saline Brines, Mat. Res. Soc. Symp. Proc., M. J. Apted, R. E. Westennan. eds., Vol.112, (1988) 575.
8 Grambow, B., Müller, R., Rother, A.. Lutze, W., Release of Rare Earth Elements and Uranium from Glass in Low pH High Saline Brines, Radiochimica Acta (1991) 52/53, 1991, p. 501.
15
Therefore, the present study is an extension of previous inactive experience with special
emphasis on actinide and Tc release/retention during glass corrosion in salt brines, including
colloid formation and formation of new solid phases. The formation of secondary solid alteration
products may provide a new barrier against release of radionuclides from the waste packages.
16
The high radioactive CEA-glass R7T7
The high radioactive glass R7T7 has been prepared by the CEA's 'Centre de la Vallée du
Rhône', Marcoule, France. The glass composition is similar to that of the COGEMA glass R7T7
produced in the vitrification plants 'R7' and 'T7' at La Hague, France. Activity concentrations,
except for Pu, are lower in the CEA glass than in the COGEMA glass, because a different waste
was used by CEA. This high active glass product was fabricated for experimental research
programs of various laboratories within the European Union. Our product was poured in the form
of a cylindrical block, shown in Figure 1 and has been delivered by CEA to the European
Institute of Transuranium Elements (ITU) in Karlsruhe. From there it has been transferred to the
Hauptabteilung Heiße Zellen (HVT/HZ) of our research center. The total mass was ca. 1,876 kg,
the density 2.75 g/m3 and the total activity was ca. 3 x 10¹²Bq (80 Ci) at 1.1.1991. In 10 cm
distance, the dose rate was 8 Sv/h. The block had a length of 11,5 cm and a diameter of 8,6 cm.
The composition of the glass has been measured in our research program and is compared with
the nominal composition given by the CEA (Table 1). Except for Co60, the results agree well
with the values given by CEA Marcoule. The content of inactive elements is given in Table 2.
Figure 1: The highly active block of CEA-R7T7 glass and some fractured pieces in the hot cells
17
Tabic X: Content of radionuclides in the highly active glass CEA R7T7 from Marcoule. Comparison of nominal values given by the CEA with data measured at Forschungszentrum Karlsruhe (FZK). Specific activities of radionuclides are recalculated for the reference date from July 30,1992.
FZK CEA
actinides Bq/g Bq/g
Pu-238 2.4 E+8 2.6 E+8 Pu-239/240 4.4 E+6 3,8 E+6 Pu-241 no data 2,0 E+8 Np-237 1.7 E+2 no data Np-239 1.4 E+4 no data Am-24I 2.1 E+7 2.1 E+7 Ain-243 1.4 E+4 no data Cm-244 7.0 E+5 5.1 E+5
FZK CEA
fission Bq/g Bq/g products
Co-60 1.5 E+5 6,9 E+4 Sr/Y-90 6,8 E+8 6,6 E+8 Tc-99 2.0 E+4 no data Ru/Rli-106 no data 4,1 E+4 Sb-125 1.5 E+6 1.3 E+6 Cs-134 2.2 E+6 1,7 E+6 Cs-137 4.7 E+8 4.6 E+8 Cc/Pr-144 no data 6.8 E+4 Ei-154 4.1 E+6 no data Eu-155 1.0 E+7 no data
Table 2: Composition of glass components of the highly active glass CEA R7T7 ( W t % oxide), according to letter of CEA to Dr. Malow (HMI) from June 7, 1988; Actinide data corrected according to analyzes given in Table 1 (Pu(tot) = Pu241+{Pu239/240sPu239}+Pu238; Am(tot)=Am241+Am243).
Oxide W t % Oxide Wt% Oxide W t %
Si02 46.2 AI203 4.9 B2O3 14.3
Na20 9.7 Li20 2.0 CaO 4,1
ZnO 2,5 FeA» 2.7 NiO 0.4
Cr203 0.5 P205 0.3 Zr0 2 1,0
Fiss. Prod, oxides
10,6 U0 2 0.5 Pu02 0,051
Am0 2 0.019 Np0 2 0.0007
18
Experimental
Preparation of hot cells, reaction vessels and auxiliary toois.
Experiments with high active glass samples have to be performed by remote handling in shielded
cells. The entire corrosion test program was performed in two cells o f the Hot Cell department
(cell 4 and 5 a) of our research center (HVT/HZ). Time consuming installation work was
performed with emphasis on remote operations of heating cabinets and modification of stainless
steel autoclaves (60 ml volume).
Preparation of hot cells
In cell 4 all preparations for powderization of the glass were installed and in cell 5a
corrosion tests were conducted. Fir vie 2 shows the interior of cell 4. The left side of the
photograph shows a glass braking apf, JUS, in the center the centrifùgation mill and on the right
the sieving machine. Cell 5a was a nt1 cell which had to be tested for proper shielding and
tightness by radiation protection authorities prior to conducing the experiments. Also, devices
such as heating cabinets, pH-meter etc, previously used for corrosion experiments with inactive
glass [7] had to be transformed for use by remote handling. All electronic parts were detached and
were reinstalled in a controlling device outside of the cell. The heating cabinets were operated
with the door to be opened to the top. Reaction vessels could be introduced by manipulators from
the top. Time consuming testing of the devices was necessary prior to hot operation. For the
duration of the experiments, temperatures differed by less than ±2°C at the various positions
within the heating cabinets. Figure 3 shows the interior o f cell 5a. In the mirror surface at the
door of the heating cabinet, various autoclaves are seen, located at the bottom of the heating
device.
19
Figure 2: Interior of cell 4, used for preparation of glass powder. From left to right a jaw breaker for glass fracturing, the centrifugation mill and the sieving machine. In the front: coarse glass fragments
Figure 3: Interior of cell 5a, used for conducting glass corrosion tests. The mirror of the door of the heating cabinet shows autoclaves located at the bottom of the heating cabinet
20
Autoclaves
The glass corrosion tests were performed in Tantalum lined stainless steel autoclaves
(60 ml volume). PTFE (Teflon) liners used in previous corrosion experiments with inactive R7T7
glass [7] were not suitable for the active experiments, since Teflon is not resistant to large
radiation doses. Tantalum is not only radiation resistant, similarly to Teflon it is also known to be
very corrosion resistant to saline acid and slightly alkaline solutions. Rings of graphite were used
for long-term tightening the liners instead of using Teflon rings. Figure 4 shows the various parts
of the autoclaves and Figure 5 shows the entire autoclave.
The autoclaves were adapted for remote operation conditions. Loading and sampling tools
were developed for clamping the autoclave, for opening and closing the autoclave by electrical
screw drivers and for centering the sealing rings.
Figure 4: Various parts of the autoclaves used, including the corrosion and radiation resistant Ta liner and its PTFE-Teflon support
21
Figure S: View on an autoclave used for glass corrosion tests, closed by means of an electrical scren* driver
Preparation of glass powder
For corrosion experiments with fission product containing glasses, typically glass chips or
powdered glass samples are used. In the context of the present experiments, powdered samples
were used to provide sufficiently high specific surface areas of ca. 0,05 m2/g to achieve large
reaction progress values in relatively short experimental time. With relatively small solution
volumes of 25 x 10"6 m3 high solution concentrations of glass constituents will be achieved,
simulating water access to the waste glass during in a bore hole of the final disposal site.
At first the glass block was fractured in a hydraulic press. The various stages of fracturing
are shown in Figure 6a-c. The fractured glass was transferred into a centrifugal mill (Figure 7).
22
Using a sieving machine, a fraction with grain sizes between 72 pm and 100 pm and an average
grain size of 86 un was prepared to be used in the corrosion tests. The powder was washed 5
times in deionized water to remove electrostatically adhering fines. Metallic fines from the milling
device were removed by a magnetic stirrer. After complete removal of all fines, the powder has
been washed a last time in ethanol and then was dried for a minimum time of three days. The dose
rate at contact was 8,5 mSv/h for 1 g of glass powder. Figure 8 shows a micrograph of the
powder to be used in the leaching experiments. For conducting the corrosion tests, the glass
powder was transferred from cell 4 to cell 5 a.
Figure 7: Introduction of fractured glass into the mill
The composition of the salt brine ("solution 2") used for the present study is given in
Table 3 [9]. This brine is a highly concentrated CaSC>4 (anhydrite) and NaCl (halite) saturated
MgCU-rich solution. Its composition represents a class of brines encountered in natural salt
deposits and similar brines have been found also in the Gorleben site, currently under investigation
as geological host formation for a repository for German heat generating waste.
This composition is valid only for 25°C. It is recommended [9] to resaturate the solution
with halite (NaCl) for experiments to be performed at higher temperatures. For 100 g of solution
one needs at 110°C 1,7 g NaCl, at 150°C 3,3 g NaCl and at 190°C 5,25 gNaCI.
The procedure to make 1 liter of this brine 2 is given as follows: all chemicals used are of
p.a. quality. At first MgCl2 x 6H20 (937,08 g) are transferred into a 1 L flask and then, this salt is
dissolved to a significant extent in sufficient quantities of deionized water.
9 Stellungnahme 3 des Arbeitskreises HAW-Produkte des BMBF
25
Tabic 3: Composition* of solution 2 of the MgCI2 -CaCli-(NaCl-KCI)-H20 system.
Component Mol/103 Mol H20
NaCI
MgCl2
MgS04
CaCI2
CaS04
KCl
1,50
97,20
5,70
5,70
0,01
0,40
The temperature is kept at 80°C and solutions are stirred in order to enhance the rate of
salt dissolution. After dissolution is completed the other salts (4,13 g NaCI, 1,42 g KCl, 39,68 g
CaCl2 x 2H20, 0,126 g MgS04 x 7H20) are added. After three hours at 80°C all salts are entirely
dissolved. After cooling to room temperature the flask is filled up with deionized water to exactly
1 liter of solution. No precipitation is observed.
Corrosion test procedure
Glass dissolution experiments were performed in duplicates under static test conditions for
each set of temperatures and test durations selected. The experimental matrix is given in Table 4.
In each autoclave 4,8 g glass powder (Figure 9), a Ta-metal plate (ca. 0.8 g) and 25 ml of salt
brine were introduced. This resulted in the target ratio (S/V) of the sample surface area (S) to the
solution volume (V) of S/V=104m"1. A Ta-metal plate was introduced to study at test
termination sorption or precipitation of radionuclides on the Ta-liner. In one case ca. 2 g of
metallic Fe-powder (Merck, 10pm average grain size) was added to an experiment performed for
90 days at 190°C, to study the effect of a corroding canister on radionuclide release from the
glass. To avoid radiolysis of nitrogen and acidification (production of nitrous oxides and nitric
26
acid) the remaining air inside the autoclaves has been replaced with argon (6.0) by means of a
specially designed device.
Tabic 4: Experimental matrix of glass dissolution tests (test duration in days)
110°C 150°C 190°C
45 45 45
45 45 45
90 90 90
90 90 90
90(iron present)
240 240 240
240 240 240
460 463 300
460 460 450
720 720 450
720 720 720
Figure 9: Filling the autoclave with glass powder
27
Figure 10 shows an autoclave beneath a cover out of acrylic glass. Argon gas is introduced
remotely via the metal pipe shown inserted at the left beneath the lid. After terminating gas
flushing, the metal pipe is removed (Figure 11) and the lid closes under argon by gravity.
Figure 10: Introducing Ar-gas into the reaction vessel via a metal pipe beneath a cover out of acrylic glass
Figure 11: Removing Ar-gas inlet to close vessel lid
28
The lid is immediately tightened by screws. Finally the autoclave was weighted and was
introduced into the heating cabinet. Three temperatures were selected: 110°C, 150°C and 190°C.
The fluctuation in temperature during the experiment was less than ±2°C. No pressure adjustment
was performed. At test termination autoclaves were weighted and were allowed to cool down to
room temperature prior to being opened. Water loss through the seals during the experiments was
monitored by the weight loss of the autoclave at test termination.
Preparation of samples from leachates, filter residues, plate out of reaction vessel and surface alteration layers
During glass dissolution, radionuclides are either mobilized (truly dissolved or colloidal)
or are retained in immobile phases by sorption or precipitation on the reaction vessel walls (Ta),
on the surface alteration layer or in particulate matter which may remain suspended in solution. A
rather time consuming analytical procedure was established with the aim to perform a complete
mass balance. This procedure provides for the identification of the radionuclide contents of the
various samples prepared after test termination. Samples were collected from solution, solid
reaction products and from material sorbed on reaction vessels according to the scheme given in
Figure 12. To the knowledge of the authors it is the first time, that a full mass balance of
radionuclide distribution during glass corrosion is attempted with a radioactive glass.
Solution sampling is performed immediately after cooling down and opening the autoclaves, see
Figure 13 c. Despite the fact that the solutions were saturated with halite at temperature (see
above) not precipitation of salts were visible after solution quenching. Prior to the analysis of the
solution, samples were filtered through 0,45 pm filters in order to remove coarse fuel particles.
An aliquot of these filtrates was passed through an ultrafiltration membrane (pore size 18 Â) to
check for colloid formation. Both filtration steps were performed inside the hot cell under inert
gas as shown in Figure 13 d-f. Ultrafiltration of aliquots of some ml of highly concentrated salt
brines took some hours in a laboratory centrifuge. Filtrates were preserved by adding 1 M HNO3.
After pH measurement, the remaining solution was discarded.
29
d i s c a r d i n g s o l u t i o n
autoc lave f i l l e d w i t h 25 m l H 2 0 to u l t r a s o n i c bath
l e i c f f e e t 30 ml 5 n H N 0 3 + 0 .1 m l HF d u r i n g the n i g h t in the autoc lave t h a n remove the s o l u t i o n
and rlote w i t h 3 0 m l 1 n H N 0 3 + 0 . 1 m l HF
analys is o f the j o i n t s o l u t i o n
/
r i n s i n g the g l a s s f r o m the autoc lave to a g lass beaker by us ing 3 x 25 m l sa l t s o l u t i o n
r e m o v i n g the s o l u t i o n
wash ing the r e m a i n i n g g lass w i t h 25 ml H 2 0
d r y i n g the g lass in air
s e p a r a t i o n o f g lass and c o r r o s i o n layer
\ /
d i s c a r d i n g s o l u t i o n
t f i l t e r w a s h i n g w i t h 1 m l aalt s o l u t i o n
ana lys i s o f f i l t e r res idue
autoc lave 1 . w e i g h i n g
2 . o p e n i n g
3 . a d d i n g H 2 0 i f necessary
4 . p H - m e a s u r e m e n t
d i s c h a r g i n g s o l u t i o n c o m p l e t e l y
f i l t r a t i o n t h r o u g h a 4 5 0 i n f i l t e r
f i l t r a t i o n o f 2 ml t h r o u g h a 1.8 n m f l l t e
ana lys i s o f c o r r o s i o n layer
ana lys i s o f f i l t r a t e
Figure 12: Scheme of sampling after terminating the glass corrosion tests
30
In order to check whether colloidal material is retained on the ultrafilter membrane
membrane filter residues were dissolved in HNO3 and the resulting solution was analyzed
radiochemically. During ultrafiltration or after drying o f the filter residues some salt minerals may
precipitate on the membrane. These salts were washed off in 1 ml brine prior to acid dissolution.
In case colloids are not redissolved by this 1 ml of water, this method gives only upper limits of
colloid contents, because activity sorbed on the membrane during filtration is included in the
colloidal fraction.
For analyzing radionuclides sorbed on the reaction vessel, a desorption solution o f 30 ml of
1 m HNO3 was filled into the reaction vessel and was left in contact for one week. In order to
remove adhering glass grains and to distinguish between sorbed materials and residues (incl.
evaporite salts) from the aqueous solution the reaction vessel was shortly washed with destilled
water (Figure 14) prior to radionuclide desorption. It was verified that the washing step did not
remove sorbed actinides. In some cases the desorption process was repeated for another week to
ensure that all radionuclides were effectively removed from the surface o f the tantalum liner. The
radionuclide contents in the second desorption step were in general about 10 times less than those
of the first step.
31
Figure 13: Solution sampling a f ter terminating the glass corrosion tests: a) opening reaction vessel, b) removal of liner lid, c ) solution sampl ing , d) filtration through membrane of 450 nm pore size e) solution in ultrafiltration vial, 0 vial in centr i fuge f o r ultrafiltration, g) pH measurement h) pH reading
32
Figure 14: Steps after solution sampling: a) view into the reaction vessel, b) rinsing the autoclave liner, c) decanting remaining solution (waste), d) collection of corroded glass powder
A new technique was employed which allowed the separation of the pristine glass from its surface alteration layers. About 1 g of corroded glass powder was weighted within a glass beaker. Thereafter about 30 ml of ethylene glycol was added and the corroded glass was suspended for 10 to 15 min by means of an ultrasonic bath until the solution became opaque. The surface alteration layer remained in suspension for some time, whereas the unreacted glass settled down. The suspension with the surface layer was decanted and was filtered to separate the surface layer material from the ethylene glycol. The ethylene glycol filtrate was added again to the residual glass remaining in the glass beaker and the procedure was repeated by about 10 times until the solution remained clear. After drying, residual glass and corrosion layer on the filter were weighted. In order to test whether radionuclides are dissolved in ethylene glycol, some aliquots
33
were prepared for analyses. The surface layer was dissolved in HNO3/HF prior to radiochemical analyses. In some cases, no HF was added to avoid precipitation of radionuclides as sparingly soluble fluorides.
Eh/pH analyses In order to avoid air contamination (oxidation, CCVuptake of the solution) Eh and pH
values were determined only few minutes after solution sampling. Measurements were performed under N 2 -atmosphere inside the hot cell (Figure 13 g-h). Measured pH and Eh data were corrected for liquid junction potential. The liquid junction potential of the pH electrode (system Ross) was obtained by measuring the pH value of the NaCl solution after adding HCl with a resulting known activity aH+ (see [10]). This resulted in the following correction of measured pH values:
pH (measured) + ApH = pH (corrected) with ApH =1.89.
The liquid junction potential of the Eh-electrode (Pt) was determined by measuring the potential of the electrode in ^-saturated (1 atm) brine 2 at a known activity aH+. Reported pH and Eh values are consistent with Pitzer's ionic splitting convention.
1 0 Grambow B.. R. Müller. Mat. Res. Soc. Symp. Proc. Vol. 176, 229-240 (1990) 34
Radiochemical separation and analyses techniques for Te, Pu, Am and Np and other radionuclides in concentrated salt solutions
Often at least 6 samples were analyzed per experiment: two solution samples (filtered by membranes with average pore sizes of 450 and 1.8 nm), two solutions of dissolving filter residues, one solution containing the dissolved surface alteration layer and one solution containing the sorbed or precipitated material from the reaction vessel walls.
Prior to analyses, most radionuclides had to be separated both from the highly concentrated salt solution and from other nuclides. This was done by either liquid-liquid extraction or extraction chromatography procedures. For the final determination of nuclide concentrations nuclear analytical methods as a- , y-spectroscopy and liquid scintillation counting (LSC) were used. For the long-lived radionuclides U-238 and Tc-99 ICP-MS proved to be more sensitive. An overview over the complete analytical procedure is shown in Figure 15.
The radionuclides Cs-134 and Cs-137 were analyzed directly by y-spectrometry in 1000 fold diluted sample solutions. Other y-emitting nuclides such as Am-241, Ce-144, Eu-154, Eu-155, Ru-106, Ag-llOm and Sb-125 were detected after Cs removal by selective adsorption on the inorganic cation-exchanger ammonium molybdophosphate (AMP). Due to the high y-dose rate of some sample solutions the separation is carried out by adding 3 g AMP to 10 ml of the 1:10 diluted solution in a shielded alpha-box with remote handling. Cs is effectively removed from solution with decontamination factors of about ÎO^-IO^. After filtration through a membrane filter with pore diameters of 0,45 pm, all other radionuclides were determined subsequently in the filtrate. After Cs-separation, recovery rates for other nuclides in the filtrate were determined to range from 95 to 100 %. The Compton-background of the y-spectrum decreased after Cs-separation and other y-emitting isotopes like Ce-144, Eu-154/155, Am-241, Sb-125, Ag-110m
and Ru-106/Rh-106 could be detected.
35
Direct y-spectrometrio determination of Cs-134/137
Cs-separation using AMP from dilute HN03-solution
Sr-90 separation by extraction chromatography using DC-18-C-6
Tc-99 separation as TcQï by extraction chromatography using
didecyl octyi methyl ammonium nitrate
Np-237/239 separation by liquid-extraction using Thenoyitrifiuoroaceton (TTA)
after reduction with Fe(ll)
Pu-238/239/241 separation by liquid-extraction using TTA after reduction with
Fe(ll) sulfamate and oxidation with NaNC>2 iiiiminMiimmuiiim»»ua»umiii
Uranium by extraction chromatography using diamylamyl phosphonate
determination of Am-241, Ce-144, Eu-154/155, Sb-125, Ag-110m,
Ru/Rh-106 byy-spectrometry
determination of Sr-90 by liquid scintillation counting
(LSC)
determination by ICP-MS
determination of Np-237 by a-spectrometry
determination of Np-239 by •^spectrometry
determination of Pu-238/239/240 by a-spectrometry
determination of Pu-241 by Liquid Scintillation
determination by Isotope dilution ICP-Mass
Spectrometry
Figure 15: Flow sheet of the radioanalytical procedure
Radiochemical separation of Sr-90 is carried out using a chromatographic material consi-sting of an inert support and di-tert-butyl-cyclohexyl-18-crown-6 as a selective extractant for Sr. After Cs-separation 1ml of the sample solution was adjusted to 8 M HNO3 and non-radioactive Sr-tracer was added. The sample was passed through a 1 ml column and Sr eluted with 10 ml 0,05 M HNO3. An aliquot of the elute was measured immediately by LSC. The result of this measurement is verified by a second LSC-measurement after ingrowth of the daughter nuclide
36
Y90. Thus, it is possible to eliminate errors due to other co-extracted radionuclides. The separation yield was determined by ICP-AES analysis of the non-radioactive Sr and varied between 83% to 93%. Care had to be taken for cross-contamination effects from one sample to another, due to a slow kinetic of the Sr-desorption from the column. Therefore it has been necessary to wash the column after and before each separation extensively.
Conventional analyses of Tc-99 by solvent extraction of the ion-pair complex of TCO4" with tetraphenylarsonium (TPA) and subsequent determination by LSC proved to be not satisfactory. Even after excessive washing of the organic phase the ß-spectra recorded by LSC revealed the non-purity of the sample. Interferences were mainly due to high concentrations of coextracted Ru/Rh-106 and Pu-isotopes. Consequently, a new procedure was applied consisting of a separation step using didecyl octyl methyl ammonium nitrate immobilized on an inert carrier and subsequent determination by ICP-MS. To ensure that dissolved Tc was present in its heptavalent state (TcCV) H2O2 was added before separation. A sample aliquot (1-2 ml) was adjusted to 0,5 M HNO3 and passed through a column filled with approx. 1 ml of the resin. Tc-99 was sorbed as TcCV and subsequently eluted by 8 M HNO3. The chemical yield over the whole procedure was determined by y-spectrometry using Tc-95m as a tracer. After evaporation to near dryness the residue was dissolved in 0,5 M HNO3 and analyzed by ICP-MS. No overlap of the Mo-peaks at 98 and 100 AMU to the peak of Tc at 99 AMU was observed. The Mo contents in the samples result from Cs-separation by AMP and from M0O42' leached from the glass. On the basis of the 3 a error of the background count rate a detection limit of 1,3 ' 10'3 ng/ml (= 0.8310"3
Bq/ml) was calculated. For comparison LSC-analysis of a pure Tc-99 solution shows a detection limit of 7,3' 10'2 Bq/ml (1 ml sample solution measured / 68,5 % efficiency / measuring time: 60 min). Under real conditions Tc-99 samples are always contaminated after separation. Consequently real detection limits for LSC-analysis strongly depend on the sample composition and are even higher.
In order to separate Np and Pu, 1 ml aliquots of the sample solution were submitted to solvent extraction with thenoyl-trifluoracetone (TTA). An individual selective extraction of each of the two elements is facilitated by adjusting oxidation states. At first Np was reduced from its pentavalent state to the tetravalent state by means of Fe(II)sulfamat and then was extracted by
37
TTA from 1 M HNO3. Pu exists under these conditions in the trivalent oxidation state and remains in the aqueous phase. After washing the organic phase and stripping Np into 8 M HNO3,
the aqueous solution was evaporated on a stainless steel dish and analyzed by a-spectrometry. In a second aliquot of the solution Pu was reduced as described before and reoxidized to the tetravalent state with NaNC^. After re-extraction of Pu into 8 M HNO3-solution Pu-238 and Pu-239/240 were determined by a-spectrometry and Pu-241 by LSC. The separation yield for the Pu-separation was determined by using Pu-236 as an isotopic tracer.
Pu oxidation states were determined in various leachates at all temperatures after cooling. Pu(IV) was extracted with theonyl-triflouracetone (TTA) in xylene. Pu(IIl) was accounted for by oxidation to Pu(IV) with NaN0 2 and extraction of all Pu(IV) with TTA. Total Pu was determined by reduction of all species to Pu(III) using Fe(II)-sulfamat, subsequent oxidation to Pu(IV) with NaN0 2 and extraction with TTA. The sum of Pu(V) and Pu(VI) is the difference between total Pu and the sum of Pu(III) and Pu(IV). Pu activities were determined by a-spectroscopy (Pu-238,39,40,42) and liquid scintillation (Pu-241), respectively, after re-extraction of Pu into the aqueous phaseas described above.
The separation of Am-241 and Cm-242/244 performed by using an extraction chromatographic resin containing CMPO/TBP as extractant was used. Tri-, tetra- and hexavalent actinoids are sorbed from 3 M HNOj, but only the trivalent actinoids are eluted by 4 M HCl. After evaporation of the HCl-solution the residue was dissolved in H N 0 3 and analyzed by a -spectrometry.
The analysis of uranium was not possible by radiometric methods due to the low specific activity of the uranium isotopes and low concentrations in sample solutions. Therefore two methods - a compact laser fluorescence spectrometer (LFS) (SCINTREX, UA-3) and ICP-mass spectrometry (ICP-MS, Perkin-Elmer) - have been tested for their suitability of uranium trace analysis. For both methods it is necessary to separate uranium from an excess of matrix components. Especially in the case of LFS, uranium fluorescence is heavily influenced even by low salt or acid concentrations. Uranium separation has been carried out in 3 M HN03-solution by
38
extraction chromatography using diamyl-amylphosphonate sorbed on an inert support. For LFS-analysis uranium is desorbed from the column by a buffer containing 0,5 M H3PC>4/0,04 M Na4P2Û7. The phosphate/pyrophosphate buffer additionally serves as a fluorescence amplifier. After neutralization of the acidic solution the sample was filled into a quartz cuvette and fluorescence intensity was measured. The uranium concentration was quantified by the standard addition method. From the 3 a-error of the background a detection limit of 0.6 ppb was calculated.
ICP-MS offers two advantages over LFS: 1) isotope dilution analysis can be applied using U-233 as a tracer and 2) isotope ratios of uranium can be determined. After addition of U-233 as an isotopic tracer the separation from the matrix was done as described before. With 0.5 M H2C2O4 uranium was eluted and the solution directly submitted to ICP-MS analysis. A detection limit 0,01 ppb was calculated for the analytical conditions used, thus being one order of magnitude lower than LFS. Separation yields varied from 92 to 100 %. Due to the lower sensitivity of ICP-MS against matrix effects and the possibilities to apply isotope dilution analysis and to determine isotope ratios the latter method was favored over LFS analysis.
Analytical quality control
For ensuring the reliability of the analytical procedures the accuracy and reproducibility of the applied methods has been tested, where possible, by internal standardization using isotopic tracers and additionally by intercomparison of analytical results of the Institut fur Nukleare Entsorgungstechnik with the radiochemical laboratory of the Institut fur Technische Chemie (ITC) of our research center.
For most of the radiochemical separations isotopic tracers were added to the sample solution in order to verify the chemical yield of the whole procedure. This has been done for Sr-analyses using non-radioactive Sr, for Tc-analyses using Tc-95m, for Pu-analyses using Pu-236 and for U-analysis using U-233. Plausibility of Pu-analyses results was checked by comparing the total a -
39
activity of all Pu-isotopes determined by a-spectrometry with gross a-activity measured by LSC. Am-241 analyses were verified by comparing direct y-measurement after Cs-separation with alpha-spectrometric analysis. The interlaboratory comparison resulted in satisfactory agreements at sufficient distance from the detection limits and show scattering only in the lower concentration range, thus demonstrating the limits of the analytical methods.
Sample preparation and analyzes of solid reaction products
Surface alteration products on the glass and on a tantalum metal plate (representing reaction products on the liner of the reaction vessel) were analyzed by micro X-ray analyses and by SEM. Micro-X-ray analyses allows analyses of elemental composition with a volumetric resolution of about 1 pm 3. Both energy dispersive (EDX) and wavelength dispersive (WDX) techniques were used. Due to the high radiation yield of many samples, the EDX-method had shown severe limitations. For WDX analyses two crystals were used: LF (energy range 3.4 to 10 keV) and PET (energy range 1.59 to 4.8 keV). These energy ranges allow analyses of elements between Si and Am.
For sample preparation, the samples were transferred to a glove box and were mounted on a brass plate. In the preparation box of the SEM, the mounted samples were sputtered with gold or carbon.
40
Results of glass corrosion tests
The leaching behavior of CEA-R7T7 glass and the associated mobilization of radionuclides is deduced mainly from radiochemical solution analyses, but also from solid state investigations of altered surface layers.
Useful units
In order to be able to evaluate the mobilization behavior of various radionuclides in a relative manner, the measured activities of the nuclides i in the aqueous phase are normalized to the inventoiy of this nuclide i in the fuel sample and to the surface area. This "normalized elemental mass loss, NL¡" is calculated from the concentration C¡ of the nuclide in aqueous solution, the mass fraction f¡ in the glass and the ratio of the sample surface area S to the solution volume V.
NL¡-values are reported in the units of [g/m2]. f¡-values are calculated on the basis of the glass composition given in Table 2.
Using the formula
with the density p of the glass (2.75 g/cm 3) one obtains an equivalent depth d¡ from which the nuclide i is released into solution. This depth is known as "equivalent depletion depth". Equivalent depletion depth values of soluble elements such as boron are often a good approximation to the actual thickness of surface alteration layers.
NL¡ = C¡/(f-S/V) (1)
d¡ = NL¡/p (2)
41
NL¡ values can also be calculated for the mass transfer of the nuclide i from the glass phase into a secondary alteration product. The NL¡ value of a nuclide i for a given mobile or immobile phase signifies the mass of glass per unit of surface area which has been altered to account for the content of the nuclide i in the immobile phase. We can use Eq. 1 also for the radionuclides i in the secondary alteration phases, or on sorption planes of surfaces, if its content of i is devided by the solution volume. The ratio of the NL¡ values of immobile phases to those of the mobile phase is the retention factor R¡. The sum of the NL¡ values of all immobile phases together with the aqueous phase are a direct measure of the extent of matrix dissolution (gram altered glass per m 2). For all nuclides these sums should be equal, provided that a given element is not segregated from the glass matrix and is not susceptible to alkali/ion exchange and, provided, analyses were complete. Hence, a criterion for a good mass balance is the comparison of the summed NL values.
Glass dissolution processes which depend on the accumulation of dissolved glass consituents (saturation, pH evolution etc.) may also be described in terms of reaction progress values The reaction progress measures the corroded mass of the glass per solution volume. It can either be calculated from the solution concentrations C of soluble matrix bound elements, e.g., boron, divided by the mass fraction f of this element in the glass,
or it can alternatively be determined as above, by analyzing the total quantity of a sparingly soluble element in the so'iid reaction products. A related unit is the "normalized concentration" NC of a dissolved glass constituent. It is either calculated, similarly as by dividing the solution concentration of a given element i (mg/L) by the mass fraction of that element in the glass matrix, or is determined from the normalized elemental mass loss (based on solution data) of this element.
For soluble elements released by matrix dissolution (i.e. boron) NC¡ equals whereas NC¡ is larger than for glass constituents released by ion exchange (i.e. Li, Na...). For sparingly soluble elements NC¡ < £,. Equation 4 can also be used to calculate reaction progress (NC¡ = £) if NL¡ is
42
\ = C B / f B (3)
NC¡ = C¡/f¡= NL¡-(S/V) (4)
replaced by the extent of matrix dissolution calculated as the mean value of various £ NL¡ values (Eq. 5) representing the sum of elemental mass transfers from the glass to the various mobile and immobile phases:
X NL¡ =NL¡(solution) + NL¡(sorbed on liner) + NL¡(solid reaction product). (5)
Radionuclide distribution among mobile and immobile phases: mass balances
Results of radiochemical analyzes of the various filtered and ultrafiltered solution samples, of the corrosion layers and of one ore two acid strip solutions of the reaction vessel and are given in Table Al to A30 in the Appendix and Table A31 (Appendix) give a summary of analyzed solution concentrations in terms of molarity units. The radionuclide contents on the 1,8 nm filter were not analyzed in all cases because the results of many tests (see Tables A6, A7, A16, A17, A22, A24 and A27-29) have shown for all except one case (Table A29) that there were only traces of radionuclides on the filter (see discussion on colloids below). In certain cases, only the solution phase has been analyzed, whereas in other cases, a complete mass balance was performed. In certain cases plutonium contents of the ethylene glycol suspension solution has been analyzed and respective results are included in the tables A3, A5, A9, A13, A15, A18, A23, A25 and A30 for completing the mass balance.
Results of solution analyzes are given in concentration units as Bq/m 3 for radioactive elements and as g/m 3 for the inactive elements and in terms of the normalized elemental mass loss NL in [g/m2]. In order to allow direct comparison with the radionuclide contents in the various immobile phases, results of analyzing immobile phases are reported in terms of Bq(immobile phase)/m3(solution volume) and in terms of NL units. For a given radionuclide i, the NL¡ values of immobile phases are summed up together with the NL; value of the leachate to calculate mass balances (Eq.5). We used the average value of these sum values as a measure of the extent of glass matrix dissolution and calculate from these values the reaction progress according to Eq. 4. This technique is quite different from the conventional procedure where only the solution phase is analyzed and reaction progress is calculated from the NL value of a soluble element (typically
43
boron) representing the degree of matrix dissolution. In the latter case retention factors R of a radionuclide i are deduced from the NL¡ values of the dissolved fraction of i and the NL B value of dissolved boron: R=(NLB-NLi)/NLB. The drawbacks of the conventional method is (1) that any error in a boron analysis will lead to a corresponding error in the retention factor and (2) the method is not applicable if a fraction of boron is contained in immobile phases. The total mass balance method is more time consuming but refrains from selecting an element which represents the progress of the glass matrix dissolution reaction. Even though our results show that a total mass balance is possible only for few elements or nuclides (see below), the extent of matrix dissolution and corresponding reaction progress values can be based on the behavior of more elements than only of boron, independent if they are soluble or not. Moreover, the mass balance calculations allows to assess the quality of the analytical data. An error in solution analyses may remain undetected until a mass balance calculation is performed. Results of mass balance calculations are included as SNL¡ values in Table A1-A30.
Some typical results may be described as follows. The results of a glass corrosion experiment performed for a duration of 720 days at a temperature of 110°C ( Table A9, Figure 16) show rather good agreement in the summed NL values of the various nuclides (Pu, Am, Eu, Cs, Sr), indicating that the mass balance analyzes were performed successfully. The contribution to the mass balance of the radionuclides sorbed on the reaction vessels walls is always rather small. Except for Cs (see discussion on colloidal behavior below) this is also true for matter designated „colloidal", i.e. for the difference between the solution concentrations measured in 0.45 pm filtered and 1.8 nm ultrafiltered solution samples. The mean value of the summed NL values of these nuclides, i.e. the extent of matrix dissolution is 5.8 g/m 2 with a rather small variation of only ±10%. After determining the extent of matrix dissolution with fair accuracy and plausibility, we can use this value to deduce missing surface layer contents of Np and Tc from their solution concentrations only. The results show that a large fraction (>90%) of the inventory of the trivalent actinides and rare earth elements Am, Cm and Eu of the altered glass mass is retained in the surface alteration layer. Nevertheless, more than 50 % of Cs, Tc, Sr , Np and Co arc released into the aqueous phase. Surprisingly, also about half of Pu is found in solution.
44
solution <1 .8 nm
43%
colloids 2%
Am241 sorption (container) solution
2% <1.8nm 4%
colloids 0%
Sr90 solution < 1.8 nm
93%
sorption (container)
0%
sorption (container)
2%
solution <1.8 nm
48% Cs137
colloids 35%
Np237 Tc99 solution <
1.8 nm 34%
surface (calculated by difference of NL k of layer solution to extent of matrix 4QO¿ dissolution of S.82 g/m ')
colloids Total sum of all Np237 fractions is about 2-3 nooL times higher than expected from extent of
matrix dissolution, this appears to be an analytical artifact.
colloids 0 % solution
< 1.8 nm 60%
Figure 16: Example for the distribution of Am241, Pu239, Sr90, Cs l37 , Np237 and Tc99 among solid reaction products, sorbed material on the surface of the liner of the reaction vessel and the solution and colloidal phases after glass corrosion in a halite saturated Mg(Ca)Cl 2 rich brine at a temperature 110°C for 720 d.
45
For the temperature of 150°C the data of a test performed for 720 days may be described as an example for distribution of radionuclides (see Table A19, Figure 17). The mass balance for the sum of radionuclide fractions in surface layer, sorbed material and in solution shows similar results for Am, Pu, Cs and Sr. The extent of matrix dissolution deduced from these four elements was 3.75 g/m 2 ±30%. Concentrations of Np and Tc were only measured in solution, not in surface layer. Again, the radionuclide fractions contained in colloids and on the vessel wall are small. Only small fractions of Am, Np, Pu and Tc were found in solution. Almost all Pu and Am was found in the surface layer and similar behavior is deduced from the solution concentrations and the extent of matrix dissolution for Tc and Np.
The results of a test performed for 720 days at 190°C are given in Table A30 and Figure 18. The pH was 2.86, the lowest value measured in any test. The mean of the summed NL values of Co, Sr, Cs, Am and U, i.e. the extent of matrix dissolution is 7.28 g/m 2 ±10%. The high reproducibility of this value by using five values allows to use this value to deduce missing surface layer concentrations for Np and Tc from their solution concentrations only. If we compare the extent of matrix dissolution and the summed NL values for Pu we find that the mass balance for Pu is not complete. Only about 5 % of the Pu content of the altered glass mass was recovered in the analyzed phases mainly found on the surface alteration layer. The results show high mobilization of important radionuclides such as Tc, Am and Np. Only Pu is strongly retained in the surface layer.
Comparing the results of Figure 16 to Figure 18 it appears that independent of temperature most of released Sr90 is always found in the solution phase and, consequently Sr90 data are best suited as a measure for the extent of glass matrix dissolution. For those experiments were surface layers analyzes were not available, we used mainly the Sr-release data to solution as an indicator for matrix dissolution. In case Cs or other data (Np, Co...) (450 nm solution filtrate) were alike we used an average NL value for estimating the extent of matrix dissolution (Tables A1-2, A4, A7-8, A10-12, A14, A16-17, A19-21, A24 (+iron), A26, A28-29). Hence, for the present radioactive tests, Sr90 data serve the same purpose than boron release data in inactive tests.
46
150°C Pu239
solution < 1.8 nm
0%
sorption (container)
0%
solution < 1.8 nm 28%
Cs137
colloids 0%
sorption (container]
1%,
collolds 3%
Am241 sorption (container) solution <
1% 1.8 nm 8%
Sr90
colloids 0%
solution < 1.8 nm 57%
sorption (container)
0%
colloids 0%
Np237 solution <
1.8 nm 5%
surface layer
9 5 %
colloids 0%
Tc99
surface layer 100%
solution < 1.8 rim
0%
(calculated by différence to
entent of matrix dissolution)
Figure 17: Example for the distribution of Am241, Pu239, Sr90, Csl37 , Np237 and Tc99 among solid reaction products, sorbed material on the surface of the liner of the reaction vessel and the solution and colloidal phases after glass corrosion in a halite saturated Mg(Ca)CI 2 rich brine at a temperature 150°C for 720 d.
47
190°C solution < 1.8 nm
4%
Pu239 colloids
2%
sorption (container) Cs137
surface layer 0%
Mass balance is not complete: only 5% ol immobile Pu analyzed. Based on extent of matrix dissolution of 7.26 girfiand NU in solution, more than 99% of total
Pu is fixed in immobile phases.
colloids 32% solution
< 1.8 nm G7%
Am241 sorption
surface layer (container) 3%
solution < 1.8 nm
83% colloids
0%
Sr90
surface layer colloids
0%
sorption (container)
0%
Np237 surface layer
1%
colloids 0%
Tc99 colloids 9%
surface layer
17%
(calculated from extent of matrix dissolution by difference)
Figure 18: Example for the distribution of Am241, Pu239, Sr90, C s l 3 7 , Np237 and Tc99 among solid reaction products, sorbed material on the surface of the liner of the reaction vessel and the solution and colloidal phases after glass corrosion in a halite saturated ¡Vfg(Ca)Cl2 rich brine at a temperature 1 9 0 ° C for 720 d.
48
Based either on Sr90 data or on the sum of NL values of certain elements such as Cs, Co, B, etc. the results of mass balance calculations often show a deficient for Pu (Table A6, A22, A23, A25, A27, A30) and in some cases also for the trivalent rare earth and actinide elements (Tables A5, A6, A23, A25). This was probably caused by an analytical procedure of using a highly concentrated HNO3/HF solution for dissolving the corrosion layers prior to analyzes (see „Experimental"). This resulted in precipitation of sparingly soluble actinide fluorides and in a reduction of the actinide content for analyzes. Later in the project this error was avoided and corrosion layers were dissolved in a mixture of H2SO4/H2O2 . Under these conditions, the mass balance was generally much better (Tables A3, A9, A13, A15, A18) except for Pu balance at 190°C (Tables A23, A30). This improvement of the analytical methods or surface layer analyses resulted in an acceptable mass balance for the trivalent actinides and rare earth elements, indicating that the mass deficit in Tables A5, A6, A23, A25 indeed stem from the surface layer.
Glass dissolution characteristics and radionuclide behavior
The results of the present work and results from previous experiments with non-radioactive R7T7-type glass [4,5,6,7,8] are used to characterize the corrosion behavior of the glass matrix and the retention behavior of actinides and of Tc during glass corrosion. A comparison of the corrosion behavior of inactive and radioactive glasses with very similar chemical compositions shall elucidate the role of radiation and radiolysis on glass corrosion properties and shall help to answer the question, whether results from inactive glass dissolution testing are applicable to the active glass. The inactive experiments were performed at S/V ratios ranging from 10 to 10000 m' 1 for periods of as much as 3 years. A large data base was generated. At first the evolution of solution pH with reaction progress is described, thereafter the kinetics of glass matrix dissolution, the solid reaction products formed and finally, the retention behavior of radionuclides is discussed as a function of time and temperature.
Evolution of pH values with reaction progress
With increasing reaction progress, solutions became more acid. For the same reaction time, the quench-pH values of the solutions were more acid at 190°C than at 110°C. Figure 19 shows the evolution of pH in the leachate at 190°C together with data from corrosion experiments using
49
inactive glasses of R7T7 composition, obtained at a variety of S/V-ratios. At sufficient time of reaction, pH-values lower than 4 can be achieved. The figure shows that the pH values of leachates from corrosion experiments with the radioactive glass are in excellent agreement with those from experiments with the inactive glass. Both data sets show that the pH-evolution is a monotonous function of reaction progress. Acidification of the leachate during glass dissolution results from the formation of solid alteration products, in particular of Mg-silicates such as saponite [10]. In contrast, for Mg-free saline solutions it has been reported that solution become alkaline upon glass dissolution [10]. It will be shown further below that the observed pH evolution is also predicted by geochemical modeling of the reaction of the saline solution and the glass R7T7.
8 7 6
4
3 IE+2 IE+3 1E+4 1E45 1E-H>
Dissolved glass [g/m3]
Figure 19: Evolution of pH during corrosion of active and inactive CEA-R7T7 glass in halite saturated Mg(Ca)Cl2-solution at 190°C
Time dependence of reaction
The time dependence of glass corrosion (reaction progress) is shown in Figure 20 and in Table 5. Data of the active glass are compared with data of inactive corrosion experiments, executed at different S/V ratios and for different periods of time [2.4,5], All data were plotted in one diagram using an S/V.t 1 / 2 scale (log-log scale) for all temperatures. As with the pH values (Figure 19), the agreement between the results from inactive and active glass is excellent. This is true for both the time and temperature dependence of the corrosion reaction.
Table S: Extent o f glass matrix-dissolution measured in the experiments as a function o f time and temperature. Data expressed as average normalized mass loss NL of the summed release to mobile and immobile phases or as reaction progress value Ç (see Eqs. 4 , 5 and Tables A1-A30)
• 190'C, inactive • 190*C, active a 150'C, inactive A 150'C, active o 110'C, inactiv • 110'C, active
1E+6
Figure 20 : Time and temperature dependence of C E A - R 7 T 7 glass corrosion in halite saturated Mg(Ca)CI 2 -solution. Reaction progress values calculated according to Eq. 4 and plotted versus the product of the square root of time and the S / V ratio.
A linear variation of reaction progress with the product S/V.t I / 2 is obtained, once silica saturation is established in solution. The square root of time dependency indicates glass corrosion control by a diffusion process [4], There is no significant difference between the kinetic data obtained from experiments with the inactive and radioactive glass, suggesting that the corrosion mechanism is the same. Hence, the abundant information on the time dependence of glass matrix dissolution of the inactive R7T7 glass and the empirical rate law derived from these data [5] can be used to describe the behavior of the active glass. The empirical rate law for a combination of first order dissolution with a long-term diffusion process is given in integrated form by the equation (6 or 7) [4]:
52
NC i = Min NC Si.sal 1 - exp ' k+(S/V)t^
NC, Si.sal ' J 1
D. ' f f .
7Ü i>t~
NL = Min NL Si.sal 1 - exp f k+(S/V)t^
NC + 2 p.
DAt-tsai)
Si.sat ' J 71
\ lim(f„ y=>Nlaj
(J)
NC¡ or NL¡ are the normalized concentration or normalized mass loss (normalization to surface area and glass composition) of a given glass constituent i, Min(a;b) gives the minimum of the expressions a and b, NC¡,sai and NL¡,sat are the normalized concentration or the normalized mass loss of the element i at saturation, t is time, t r at is the time at which 95% of silica saturation is reached, k+ is the normalized forward reaction rate, p is the density of the glass and Deff is the apparent diffusion coefficient in the glass phase. The normalized concentration or the normalized mass loss of silica at its saturation value in solution, NCSi,ut and NLs¡,ut, are key parameters in the rate law and are in general dependent on pH and on temperature. If pH varies with reaction progress the above integrated rate equations cannot be used and have to be replaced by a numerical integration which consider explicitely the dependency of the saturation concentrations on reaction progress, i.e. on time. However, in the context of the present work, this is not necessary, because solutions remain in the acid regime, and here saturation concentrations of silica should not depend on pH because hydrolysis of orthosilicic acid starts at pH-values higher than 7. The exponential part of the integrated rate law in Eqs. 6 or 7 is only valid for low silica containing groundwaters and for conditions where saturation of silica in solution is not hindered by secondary phase formation or by sorption or release of silica of other near field materials.
The underlying rate law and its S/V dependence is consistent with those for binary and ternary glasses, i.e., initial (inter-)diffiision controlled alkali ion exchange by a square root of time rate law and subsequent rate control by matrix dissolution with a linear rate law [11, 12, 13, 14]
" Scholze, H„ Helmreich, D. and Bekardjiev, I., Glasteclin. Ber. 48, 237 (1975) 1 2 Hlavac, J. and Matej, J.; Silikaty 1. 261 (1966)
53
but these rate laws are only valid at short reaction times or in presence of large solution volumes. Steady state of glass matrix dissolution and diffusion is reached within less than a day (see Figure 20) and, thereafter, reaction rates are controlled by surface reaction (matrix dissolution). The overall corrosion process begins with a solid state diffusion process: H 2 0 or H 3 0 + [16] diffuses into the glass and alkali ions and other glass constituents mobilized by network hydrolysis move in the opposite direction. The net result is ion exchange. As the rate slows down with increasing penetration depth, the competing (parallel) process, matrix dissolution, becomes rate controlling. For nuclear waste borosilicate glasses the initial (inter-) diffusion controlled ion exchange process is not relevant and is not represented in Eqs. 6 or 7. Typically, measurements begin after 10 to 30 days of corrosion and cover, in some cases, periods of several years. A rate law shall be applicable for a time frame of many thousands of years. Therefore, the above integrated rate law goes a step beyond in order to describe glass corrosion processes which are dominant under conditions of long-term contact with limited quantities of water: saturation effects and long-term water diffusion/ion exchange. Matrix dissolution is a zero order surface reaction only in an open system. In a closed system it becomes a first order surface reaction and is controlled by the reaction affinity with reference to a saturation concentration in solution. The rate of reaction slows down by some orders of magnitude, when silica saturation is achieved. Empirically, at least for the glass R7T7 it appeared that the affinity term can be formulated with reference only to the saturation of orthosilicic acid in solution. In general, however, the effect of other glass constituents, in particular of aluminum on the affinity term may have to be considered. Only silica is considered in the exponential terms of Eq. 6 and 7. Silica saturation concentrations for the present brine are given in molality and as normalized values NCsi.«,t in Table 6 as a function of temperature. In the present experiments performed at high S/V-ratios, silica saturation was always achieved, even after 45 days of reaction.
1 3 Matej, J. and Hlavac, J., ibid., 11, 3 (1967) 1 4 El-Shamy, T. M.. Ph.D. Thesis, University of Sheffield (1966)
54
Table 6: Silica saturation concentrations for brine 2 in molality and as normalized values NCSi4.t as a function of temperature15.
C M l NCsUit [g/m 3] 110°C 0.0003 39 150°C 0.0006 78 190°C 0.0007 91
Long-term glass matrix dissolution in a silica saturated solution is assumed to be controlled by water diffusion into the glass matrix [4], The rate of matrix dissolution decreases as silica saturation is attained and diffusion of water takes over again and controls the long-term rate. There is experimental evidence to support the hypothesis of a long-term diffusion process with water being the critical species. Lodding et al. [16] and Godon et al. [17] conducted SIMS measurements on inactive CEA glass R7T7 corroded for several years in concentrated salt solutions at 90°C and found a concentration profile of a hydrogen species (H2O or H 3 0 + ) in the glass beneath the surface layer and a matching alkali (Li) profile in the opposite direction. Not only network modifying elements such as Li a?.v mobilized but also network forming elements such as boron. The curves in Figure 20 were calculated with the help of Equation 6 and the respective experimental data. Deff was not known and had to be used as a fit parameter. The resulting values are close to effective diffusion coefficients of H 2 0 in glass [4], However, Deff could be derived from SIMS concentration profiles, in which case verification of the empirical rate law would be based entirely on experimental data. There is fair agreement between the data and the calculated curves except for 110 and 150°C at high values of S/Vt 1 / 2 . Here the reaction progress is higher at 110° than at 150°C. This was considered an artifact and not discussed further in ref.[4] when the rate law was first published and compared with experiments. However, the phenomenon has now been confirmed with the radioactive glass (see Figure 20) and must be considered real. An
15 Grambow, B., in „Beiträge zum Workshop Geocheinische Modellierung, Karlsruhe, 19-20. September 1990" KÍK4976, p.86 (1991)
16 Lodding, A.R., D.E. Clark, G.G. Wicks."Leachabilities of International Waste Glasses in WIPP", EUR-15629-EM (1994)
1 7Godon, N. D. Beaufort, E.Vernaz,"R7T7 glass alteration alter 5 years in the WIPP". EUR-15629-EM (1994)
55
obvious explanation would be that a secondary phase forms at 110°C consuming silica. This would lower the silica concentration in solution and increase the corrosion rate. Further work is necessary before this effect can be understood.
Retention Behavior of Np, Am, Pu and Tc during glass corrosion
Maximum solution concentrations of actinides were rather high (Table A31, Appendix), as expected for the rather acid brine: 10"4 M for U, 7-10"5 M for Pu, 4-10"5 M for Am, 5-10"s M for Tc and 5-10'6 M for Np. In order to assess the retention behavior of various radionuclides, Figure 21 to Figure 23 show their normalized concentrations in the leachates as a function of reaction progress (log-log scales) at 110°, 150° and 190°C, respectively. The upper curve in each figure with a slope of one represents the extent of glass dissolution. Easily soluble elements such as boron or the alkali earth elements (neutral to acid conditions!) fall on this curve. An example are Strontium data included from previous inactive tests in Figure 21. Data lower than this curve indicate retention by sorption or by formation of secondary alteration products: 90% retention on a curve one logarithmic unit lower 99% retention, when 2 log units lower etc.. (see definition of retention factors above). The data for Pu and Am indicate that fractions of these glass constituents are retained to various degrees during glass corrosion in solid reaction products whereas Np, U and Tc are released in most cases congruently with the soluble elements from the glass.
56
CO E Ö )
</) c o 2 c <D O c o o c o
a^H
J 3
O </> T 3 <1) N
• w^m
75 E
1E+5
1E+4
1E+3
1E+2
1E+1
« Pu • Np237 A Am241 o U • Tc99 A Sr, inactive x Si, inactive
4A-
A * 1 B, Cs, Co, Sr, Zn,Np
* X X X X X Silica
1E+3 1E+4
Reaction Progress Ç / g/m3
1E+5
Figure 21: Release of radionuclides from high active CEA-R7T7 glass in halite saturated Mg(Ca)CI2-solution at 110°C .
57
1E+5
1 E + 4
1E+3
.E ra c o
«5 2 ** c a> u c o u c o 3 1E+2 ci U)
T3 0)
= 1E+1 (0 E
• Pu
• Np237
A Am241
o T c 9 9
• U
B, Cs, Co, Sr,
Np
1E+0 -I
1 E + 3
. . . •
É • v r -ßr-*
' A
-x; •
o \ • 4 »
> R u
U
Am
Tc
o •
1E+4
Reaction Progress Ç I g/m3
150°C
1E+5
Figure 22: Release of radionuclides from high active CEA-R7T7 glass in MgCI2- solution at 150°C
Figure 21 to Figure 23 show that there is a specific effect of temperature on the concentration of Np, Pu, Am, and Tc in the leachates. Since acidification of the salt solution during glass corrosion increases with temperature, leachates with the lowest pH are encountered at 190°C, and the effect of temperature on actinide concentrations may in reality be a pH effect or both. At 190°C, neither Np, Am nor Tc are retained to a significant extent by corrosion products or sorption on the tantalum walls and these elements are released at almost the same rate as boron. Hence, the release of Np, Am and Tc from the glass is controlled by the kinetics of glass dissolution. The decreasing rather than increasing concentrations of Pu with time and increasing reaction progress Ç (decreasing pH) are surprising and may be associated with the complex redox chemistry of Pu. The radionuclide concentrations show a quite different trend at 110°C (Figure 21). With time and increasing E, values, Pu concentrations approach the curve of congruent glass dissolution. Am concentrations indicate a high but decreasing retention of this element with increasing At 150°C, the behavior of Pu and Am is similar and is in between that at 110° and
58
190°C. Retention of Am at 110°C may be explained by the formation of Ca,REE,Am-molybdate (powellite solid solutions). These phases are known to limit concentrations of rare earth elements in solution [8].
Oxidation states of Pu and Pu mobility
In order to rationalize the behavior of Pu during glass corrosion, Pu oxidation states were measured at test termination. Table 7 shows the results. These results may not reflect exactly the distribution of Pu oxidation states at 110°, 150°, and 190°C. Oxidation states may have changed upon cooling, acidification, and storage of the samples. However, transitions between Pu(III,IV) and Pu(V,VI) oxidation states are slow because destruction or formation of oxo bonds is involved. At low Pu concentrations disequilibria between Pu oxidation states may be maintained for several months.
Distribution of the various oxidation states are quite different in the filtrates and filter residues and there is a clear effect of temperature. In the 450 nm filtrate as well as in the 1.8 nm filtrate higher Pu oxidation states, Pu(V,VI), were most abundant in leachates from experiments at 110°C. Leachates from experiments at 190°C contained Pu(III) and Pu(IV) and no Pu(Vl). The absence of a filtration effect on the distribution of Pu oxidation states with temperature indicates that it is the oxidation state of the truly dissolved matter and not of colloids which dominates the mass balance of oxidation states. In contrast, the material remaining on the 1.8 nm filter (colloids and sorbed matter) was mainly Pu(IV), independent of temperature. In particular at high temperatures (Pu(V,VI)), the colloid fraction was rather small and contributed little to the overall distribution of oxidation states in the 450 nm filtrates. In contrast, Pu(IV) and Pu(IIl) may occur as colloids in solution. This can be seen from the analyses of the 1.8 nm filter residues, listed in Table 7. Pu mobility is highest with the highest oxidation states of Pu, observed at the lowest temperature (Table 7, Figure 21). In the glass, Pu is most likely in its +IV state. In wet chemical analyses of the glass all Pu was extractable with TTA and was therefore Pu(IV). At this time, the oxidation of Pu(IV) to Pu(V) or Pu(VI) can only be explained by analogy to the release of uranium from the glass.
59
Tabic 7: Determination of oxidation states of Pu in the leachates
(450 day corrosion experiments)
Temperature Source Pu(in) Pu(IV) Pu(V+' glass sample % % %
Under oxidizing conditions, uranium is reported to be found in solution only as U(VI), independent of its oxidation state (+IV,+V,+VI) in the glass [18]. At 190°C (Figure 23), Pu concentrations are relatively low, as expected from the presence of Pu(IV) that forms insoluble Pu(hydr)oxide, part of which is in the solution in colloidal form (Table 7). The changes in Pu oxidation states are not yet well understood. Not only was Pu found in the leachates as Pu(V,VI) but also as Pu(III). The reason for Pu reduction to Pu(III) could be related to an oxidation of the autoclave's tantalum surface which would be facilitated with increasing temperature or a change in speciation as a resuit of a change in solution pH as discussed below under „Modeling".
1 8 Schreiber, H., Balazs. G. B. and Solberg, T. N., The Chemistry of Uranium in Borosilicate Glass, Part 6: Leaching of Uranium from Glass, Phys. Client. Glasses, 26, 35 (1985)
60
CO Ê O )
</> C O • MM
2 c fl> o c o o
.2 3 O </>
•O o N
• IM
rt E
1E+6
1E+5
1E+4
S 1E+3
1E+2
1E+1
• Pu • Np237 a Am241 o U • Tc99
B, Cs, Co, Sr, Np, Am,
U
190°C
1E+3 1E+4 1E+5
Reaction progress Ç / g/m3
1E+6
Figure 23: Release of radionuclides from high active CEA-R7T7 glass in halite saturated Mg(Ca)Cl2-solution at 190°C
61
Colloid formation
The mobilization of radionuclides from the glass phase may be significantly altered by the presence of pre-existing colloids or by the formation of new colloids. It was attempted to analyze the potential extent of colloid formation in the corrosion tests by means of ultrafiltration. Our analyses do not differentiate between filtration of colloids and sorption on the ultrafilter, consequently our results only give upper limits of colloid formation. Table 8 contains the results from the tests performed at 110°C in terms of the activity fractions remaining on the filters as calculated from difference of the activities measured in the two filtrates (1.8 nm to 450 nm). Alternatively colloid formation may also be estimated from the activity ratio of the filter residues to the analyses of the 450 nm solution.
Tabic 8 : Upper limits of the colloidal fraction of the activity in the 450 nm filtrate in % . Colloidal fraction inferred from the difference between the activities of the 450 nm and 1.8 nm filtrates. Blank values indicate cither that solution concentrations in the 1.8 nm filtrate were slightly larger than in the 450 nm filtrate, or only one of the two solution could be analyzed successfully.
Respective data may be directly compared within Tables Al to A30. There was in most cases a slightly higher concentration of radionuclides in the filtrate from the 450 nm filter than in the filtrate from the 1.8 nm filter. When comparing the two filtrate analyses (Table 8) about 30% or even higher percentages of the dissolved radionuclides appear to be retained on the 1.8 nm filter. However, if we base our analyzes of colloid formation on the filter residues, we find that only
62
negligibly small amounts of material is retained on the filter (Tables A1-A30). Hence, the difference in the radionuclide activities of the two filtrates may not directly be interpreted as resulting from colloid formation but may instead be attributed to an experimental artifact as a likely source of these differences. Based on the data in Table 8 the apparent colloid fraction of totally dissolved Cs would in most cases be larger than the respective fraction of Pu. This finding would contradict general understanding of colloid formation, because in particular the polyvalent cations are expected to be susceptible to colloid formation. The high difference in the Cs contents of the two filtrates may result from the ultrafiltration procedure. Normally it takes some hours (see „Experimental" above) until a saturated brine is filtered through a 1.8 nm ultrafiltration membrane. During this period, evaporation may occur. In a saturated salt brine, evaporation is always associated with precipitation of salt minerals, and it may well be that some Cs is coprecipitating with these salts. Retained Cs is not found on the 1.8 nm filter residue because the filters were washed off with 1 ml brine to remove adhering salts. The low concentrations of radionuclides found on the 1.8 nm filter residues indicate that colloid formation does not contribute significantly to the total solution concentrations of radionuclides analyzed in the 450 nm filtrates. There are two explanations for the limited significance of colloids in our tests: one is that the leachates are rather acid and the other is that the salinity of the solutions is extremely high. Colloid stability under both of these conditions is rather low.
Effect of the presence of iron
High level nuclear waste borosilicate glass will always be disposed as a canistered waste form using stainless steel as canister material and, depending on the repository design, may be other metallic overpacks (i.e. cast iron). In salt formations, the canister constitutes a mechanical barrier of only limited stability. Nevertheless, presence of corroding iron will influence the glass dissolution process chemically. There are various studies in the literature which show that glass dissolution rates are increased by the presence of iron and iron corrosion products and that most radionuclides are effectively sorbed onto the iron corrosion products. No data exist on the effect of iron on glass corrosion and radionuclide distribution in the presence of highly concentrated MgCU containing salt solutions.
63
A glass dissolution experiment was performed for 90 days at 190°C in the presence of 2.1 g iron powder (average grain size ca. 10 pm). Iron powder corrodes much faster than the steel canister would do, thus accelerating the impact on glass dissolution. The iron powder was altered to voluminous Fe-corrosion products and together with the corroded glass powder it has formed a very compact mass. It was impossible to separate it from the corroded glass. During the test more than 75% of the water content in the autoclaves was lost but sufficient water remained to continue corrosion during experimental time. This is probably due to decreased tightness of the sealing at the lid caused by high over pressures resulting from the generation of hydrogen upon iron corrosion. Nevertheless we were able to collect enough leachate for filtration through the 450 nm filter. Table A24 contains the results for the analyzed radionuclides and the corresponding NL values. In the absence of analyses results of the corrosion layer and of the contents of radionuclides sorbed onto iron or iron corrosion products, we may use the data for Cs release into solution as a semiquantitative indicator for matrix dissolution. In the various tests in the absence of iron, always more than 50% of Cs was found in solution. Release of Cs into solution in the presence of iron was quite similar than in the absence of iron (compare Tables A22 or A23 with table A24) hence, the extent of matrix dissolution may as well be considered similar and the effect of iron on the glass dissolution rate appears to be small. The concentration of Np237, Tc99 and of the trivalent actinides is significantly reduced in the presence of iron (see Figure 24). This can probably be attributed to sorption onto the iron powder or its corrosion products. At a first glance it is surprising to note that the release of Pu into solution in the presence of iron is higher than in the absence of iron. One may explain this by a change in the redox state from Pu(IV-Vl) to Pu(IIl) by reduction on iron. Trivalent Pu is the stable redox state of Pu under conditions which are both reducing and acidic. The interpretation of Pu release data as being controlled by the behavior of Pu(III) is corroborated by the similarity in the normalized elemental mass loss values into solution for Pu, Am and Cm. The presence of iron probably results in the reduction of Np (V) and Tc(VII) to sparingly soluble Np(IV) and Tc(IV) and of insoluble Pu(IV) to more soluble Pu(III) (acid conditions) while iron was oxidized [19].
19 Grambow, MRS Bulletin, No. 12, 20-23, (1994)
64
2
1,8 -1,6
1 , 4
1,2
1
1 g o Ï3
« ö S 0 , 6 c c o 0) •J= " 0,4 o Ç '
0,2
Value =1: No change
Np237 Am241 Cm244 Pu238
Figure 24 Relative change in solution concentrations i f significant radionuclides after addition of iron powder (Experiment performed for 90 days at 190°C, y-axis denote the ratio of solution concentration of a given element to a similar experiment without iron)
However, more experiments are necessary to provide an unambiguous explanation of the concentration changes of these elements in the leachates. Experiments performed in the presence of iron powder show no sign of enhanced reaction rate. Consequently, for the present conditions, glass dissolution is not expected to be enhanced by the presence of container material.
Identification of solid alteration products
A tantalum metal plate (1 cm by 0.5 cm) has been added to each experiment, in order to study plate out effects at the reaction vessel walls. For the 45 day experiment performed at 110°C, the metal plate was recovered after having terminated the experiment. The metal was rinsed with distilled water to remove the salt solution. A typical scanning electron micrograph of a small
65
fraction of a gold plated area is shown in Figure 25 and Figure 26. The metal surface is covered with pm-sized crystals. Additionally, adhering glass particles were found. This is because the metal contacted the glass powder during the experiment. EDX-analyses (Figure 27) indicate that a calcium molybdate phase (powellite) rich in rare earth elements (Nd, La) has been formed, similarly as in corresponding experiments with inactive R7T7 glass [20], The EDX system is not capable of analyzing a potential content of Am241 in this phase, as the content of Am in the glass is only 0.01 wt.%, which is much lower than that of the rare earth elements.
Figure 25: Scanning electrón micrograph of a small fraction of the surface of a tantalum plate retrieved after terminating a glass corrosion experiment for 45d at 110°C (gold plated)
Figure 26: Detail of Figure 25
2 0 Rother A., W. Lutze, P. Schubert-Bischoff,. Mater. Res. Soc. Symp. Proc. Vol. 257, 57 (1992)
66
Energy / keV
Figure 27: EDX-analyscs of crystals observed in Figure 25 : Ca-Nd-moIybdates (Powcllite)
After 90 days of glass corrosion powellite crystals were observed again by SEM/EDX analyzes (Figure 28 and 29). After 240 days no powellite was anymore observed.
Figure 28: Alteration products of corroding higly active C E A - R 7 T 7 glass at 110°C. a) powellite, b) silica rich nodules
67
Pli Cl
0 S'
ml
tí
p. NJ
P. HJ
La
Speclru«! 8 9 10 11 12 13 14 IS I
Energy (kftV)
12000 11000 toooo 9000 800« c
• 700« u
l 6000 » sooo 400« 300«
2000 1000
0. c; ^ f<
Zn
Speclruat
6 7 8 9 Eiwrja (UeV)
Figure 29: EDX-spcctra of powellitc crystal and of silica rich nodules
This shows that powellite may be a transitory product of glass corrosion and may easily dissolve, if conditions change slightly. The instability of powellite is confirmed by the experiments performed at higher temperatures. Figure 30 shows a powellite crystal formed after 90 days of corrosion in an experiment at 150°C. This crystal shows signs of a beginning dissolution process. After 240 days of glass corrosion at 150°C no powellite was observed.
68
Figure 30: Powellitc crystal formed after 90 days of corrosion of highly active R7T7 glass in Mg(Ca)-rich saline brine at 1S0°C. The crystal shows signs of a beginning dissolution process
During the experiment performed for 90 days at 190°C large variety of ciystalline phases (Figure 31) was formed. Powellite is among the smallest. Principal phases formed are clay like phases (probably saponite). Other phases observed were Si-rich flakes, CaC03 (probably calcite), CaS04 (probably anhydrite) and NaCI (halite). The presence of anhydrite and halite confirms the state of saturation of the leachant (see description of the leachant given above under „Experimental") The formation of calcite may have occurred after test termination during storage of corroded glass in air. In-situ formation of calcite in the experiment is unlikely, because calcite is not stable in an slightly acid chemical environment (the pH of the solution was about 4), the inital solution and the glass did not contain carbonate and carbonate could also not come from the atmosphere as
69
Figure 31: Various phases formed during the corrosion of highîy active R7T7 glass in a halite and anhydrite saturated concentratcd Mg(Ca)CI2 solution: a) corrodcd glass grain, h) clay mineral, c) Si-rich flakes, d) CaCOi (calcite?), e) powellitc, g) clay, g) NaCl, h) CaS0 4 (anhydrite?)
70
the experiment was performed under Ar-atmosphere, free of carbon dioxide. A parallel experiment with a simulated non-radioactive R7T7-glass was performed under the same experimental conditions for 90 days at 190°C. On the tantalum metal plate we found two phases, the well known powellite phase (Figure 32) located on top of a layer of alumo magnesium silicate (Figure 33). Figure 34 compares the EDX spectrum of this phase with the previously measured EDX spectrum of the surface alteration layer on the glass in a similar experiment. The compositions are rather similar, indicating that the gel layer which typically forms on the glass surface may also form offset of the glass surface on other, energetically preferred sites such as the vessel walls.
Figure jix S E M micrograph of a Calcium molybdate crystal (powellite type), observed on the tantalum metal plate retrieved from an inactive control experiment performed with simulated C E A - R 7 T 7 glass for 90 d at 190°C. Beneath the crystal of alumo-magncsium-silicate is seen a layer.
71
Figure 33: Details of the clay layer beneath the powellite crystal of Figure 32
gel layer 4006 +
«9
J
layer on Ta
4M i c 4mj
N SSM * M»»
25»« III»
ISM!
IM«]
M l
Energie (kcV) I FI r CAW-W <V«V>
Figure 34: EDX-Analyses of the elemental composition of the clay layer shown in Figure 32, compared with the EDX spectrum of the surface alteration layer on the glass measured in a similar experiment
72
Modeling
We may conclude from the similar behavior (time dependency of reaction and evolution of solution pH) of active and inactive glass (Figure 19 and Figure 20) that models capable to describe the reaction path and reaction kinetics of the inactive glass can also be used to describe the behavior of the active glass. The reaction path describes the kind and amount of solid alteration products (secondary minerals) and the evolution of solution composition as a function of reaction progress, i.e. of the mass of altered glass in a given solution volume. Radiolysis may modify the behavior of certain redox sensitive elements but does not modify the reaction path as a whole. Reaction path calculations for the R7T7 glass in saline solutions were already described in the literature [10], These calculations were previously performed based on the electrolyte theory of Pitzer, with the help of the geochemical code EQ3/6 for the german "reference" brines 1 and 3 for a test temperature of 190°C. Similar calculations were now performed for the "brine 2", used in the present work, and results are given below. The calculations reproduce the experimental observation (Figure 19) that solutions become progressively more acid with the proceeding reaction. The pH at 190°C is expected to level out at a value of about 4.0, similar as experimentally observed. This effect can be attributed to the formation of Mg-silicates as described in ref.[10] according to the general reaction
xSi02(glaSS) + yMg2+(aq) + Al203(glasS)+nH20 o MgyAlzSi02x + l5z +y_n{OH)2n_2y+2yH+
Figure 35 shows the paragenetic sequence of secondary minerals predicted to form upon glass dissolution. Besides anhydrite and halite, the dominant minerals predicted to form are the clay minerals Mg-saponite and Mg-montmorillonite and a SÍO2 polymorph. Essentially all these phases were observed in Figure 31. Powellite is calculated to form after a reaction progress value of about 1 g/m 3 (see discussion below: „behavior of Am Indeed Mg-saponite has been observed as an
73
alteration product on inactive glass R7T7, exposed to brine 2 at 190°C [21], However, in reality, montmorillonite and saponite are not observed as separate phases but the are found as a smectite clay mineral with a composition between saponite and montmorillonite. We can simulate this behavior by calculating solid solution formation among smectite end member with the help of the codeEQ3/6. For the calculations we used an ideal solid solution model with 13 end members: Ca, Mg, Na and K forms of beidellite, saponite and montmorillonite and H-saponite. The calculations were performed without considering the effect of Fell on clay composition (nontronite end members were ignored for simplification of the calculation). This selection allows for mixing at dioctahedral, trioctrahedral and interlayer sites and thus considers implicitly also ion exchange processes as a net result of precipitation/dissolution of end members with different interlayer cations. The calculated smectite composition is Cao.o3Nao.o3H<>.oiKo.oo7SÍ3.72Alo.63Mg2.520io(OH)2. This may be compared to the composition of Cao.o5SÍ3.94Alo.4iFeo.2iMg2.i40io(OH)2 analyzed by Abdelouas [21] as a corrosion product on a R7T7 type glass, exposed to brine 2 for about 460 days at 190°C and an S/V ratio of 20000 m"1. The agreement is excellent, considering that Na and K could not be analyzed and that Fe was not included in the model.
Mg-saponite is also a typical alteration product of basalt glass altered in sea water for millions of years and, hence, this phase may be the thermodynamically stable phase for long periods of time. The results of reaction path calculations may also be used to calculate the elemental composition of the surface alteration layer. Figure 36 shows the results in cation percentages for the main components Mg, Al, Si. For comparison included in this diagram is the composition of the alumo-magnesium-silicate layer from Figure 36 as analyzed by quantitative EDX system. It can be seen that there is quite good agreement.
Reaction path calculations with solid solution consideration reproduce also the formation of a Sr-rich barite observed in ref. [21]. An ideal solid solution model was used with Celestine and barite as endmembers. The calculated Sr-content in barite. Bao.62Sro.38S04 was about twice as high as the experimentally [21] observed composition: Bao.gSro.2SO4.
2 1 A. Abdelouas, "Etude de l'altération de verres rliyolitiques au contact de saumures naturelles (Bolivie) Application á létude du comportement á long terme du verre nucleaire R7T7" PliD-thesis, CNRS/Université Louis Pasteur, Strasbourg, France (1996)
74
1
D.8
•= 0.6
= 0.4
0.2
to
— ( -
100 . 1000
Dissolved glass [g/m3]
10000
Mf-Sipsaite
Mg-Montnorilloaita
Si02Un)
' MA-Cliaachlor«
- 14AAttiSite
Figure 35: Paragenetic sequence of secondary minerals predicted by geochemical modeling (EQ3/6) to form along the reaction path of glass dissolution
Si-190C
Si on Ta.
10 100 1000 100Ü0
Dissolved Glass [g/m3]
100000
MO- o AI-190C 190C
Mgon • AI OB Ta Ta
Figure 36: Same calculations of réaction path as in Figure 35: cation percentages for the main components Mg, Al, Si
75
Modeling and discussion of individual radionuclide behavior
The empirical data on the retention behavior of radionuclides show a rather complex picture, with retention factors depending both on temperature and on reaction progress. In order to use this information for glass performance assessments under repository relevant conditions it is necessary to rationalize the radionuclide release behavior in the context of thermodynamic and reaction path considerations. In the following, in particular the behavior of Plutonium and of trivalent actinides is discussed.
Behavior of Pu
Assessment of controls for the behavior of Plutonium during glass corrosion is complicated by the various possible oxidation states of dissolved Pu which may coexist simultaneously and by the possibility that either Pu(IV) or Pu(VI) solid phases may form. Depending of the Pu oxidation state, Pu-solubility may vary by orders of magnitude.
In order to rationalize various redox states observed in our experiment, thermodynamic calculations were performed for a reference temperature of 25°C. The reason for choosing 25°C as reference temperature instead of a temperature in the range of our experiments is the lack of pertinent thermodynamic data and the fact that Pu-separation was also performed after quenching to 25°C. Overall equilibrium was assumed. The stability field data for various Pu species (stability constants of hydrolysis species, E 0 values) given by Capdevilla et al. [22] were adapted for our highly concentrated Mg-rich brine 2, with activity coefficient corrections being made on the basis of the electrolyte theory of Pitzer. The necessary binary and ternary interaction coefficients for calculating activity coefficients for the various Pu species are not measured but are considered in first approximation identical to the respective coefficients of other actinides of the same valence states. Interaction coefficients for trivalent Pu are taken from the Cm(III)/Cl system [23], for tetravalent Pu interaction coefficients were taken from the Th/Cl system [24], respective
22 Capdevilla,H., Vitorge,P.,Giffaut,E„ Radiochimica Acta 58/59, pp 45-52 (1992) 23 Fanghänel, T, J.I. Kim, P. Paviet, R. Klenze, W. Hauser; Radiochimica Acta 66/67 81-87 (1994) 24 A.R.Felmy, D. Rai, Radiochimica Acta 48 ,29-35 (1989)
76
coefficients for pentavalent Pu were taken from the Np(V)/Cl system [25] and the coefficients for the plutonyl ion are taken from the U0 2 2 7CI system [26]. The calculated Eh/pH diagram is given in Figure 37 together with the measured Eh/pH values from our experiments and with relevant pH/Eh ranges for a repository in salt formations. "Brine 3" designates a NaCl rich halite saturated saline solution and "Fe" indicates Eh/pH ranges in the presence of the corroding iron container.
A cautious comparison of the Eh/pH data of our experiments with the data in Figure 37 suggest for the conditions of our tests that Pu 3 4 or Pu(V should be the dominant solution species. However, these calculations are only estimations, and, in particular for Pu(OH) 4(aq) the thermodynamic data are rather uncertain. The temperature of our experiments is much higher than 25°C. Moreover, radiation and redox disequilibrium etc. may lead to the formation and persistence of metastable species. In saline solutions at sufficiently high radiation doses, Pu(VI) is stabilized and lower oxidation states are oxidized by radiolysis. The data from experiments at 190°C appear to be slightly more close to the stability field of Pu + + + than those of 110°C and 150°C. This may be a result of the lower pH values achieved with higher temperatures. In order to test whether the transition of Pu(V) to Pu(III) may be a result of decreasing pH with increasing reaction progress the diagram in Figure 38 shows the calculated and experimental Pu(V)/Pu(III) ratios as a function of pH for a fixed average of oxygen fugacities measured in our experiments. Calculations were based on the same assumptions described above. Due to the large uncertainties in the calculations no attempt was made to fit experimental and calculated data. However, already a measurement value in Eh values of 100 mV would explain the discrepancy of experimental and calculated data. It becomes clear that with decreasing pH the Pu(V)/Pu(III) ratio is expected to decrease. Since Pu(III) is less mobile than Pu(V), the increasing retention of Pu with increasing temperatures may result from the higher reaction progress values.
25 Neck. V . , Th. Fangliänel, G. Rudolph and J.I. Kiin, Radiochimica Acta 69, 39-47, (1995) 2 6 Pitzer K.S., "Theory: Ion Interaction Approach" in Activity Coefficients in Electrolyte Solutions" Vol I, ed. R.M.
Pythowicz, CRC Press Inc. Boca Raton, Florida USA (1979) 77
O 2 4 6 8 10 12 14
pH
Figure 37:.Estimation of predominances of various Pu-species and valence states as a function of pH and Eh in the absence of carbonate at 25°C in brine 2 solution. Included arc experimentally measured Eh/pH data for experiments performed at • 110°C, A I5()°C and o 190°C in the absence of iron (for details see text) Eh/pH ranges for other relevant repository conditions (NaCI rich brine 3, experiments with iron) arc indicated for comparison
78
%PuV, pe+pH=15.4
%Pulll;pe+pH=15.4
- - %PuV, Eh 100mV lower than measured
• R7T7, 110°C
o R7T7, 150°C
• R7T7, 190°C
pH
Figure 38: Relative proportion of Pu(V) measured in our experiments, plotted as a function of the pH-valuc of the final Ieachate. Comparison to curves calculated for a constant nominal fugacity of oxygen (pc+pH=15.4 corresponds to log/ÍOí) = -22). Calculations were performed with the help of the programm EQ3/6 using the thermodynamic data discusscd in the text.
Under reducing conditions, i.e. when radiolytically generated oxidizing reactants were consumed by the corroding iron powder, solution concentrations of Pu appear to be much lower, than in the absence of Fe. Under these conditions the dominant solution species is trivalent Pu + + +(Figure 37).
Behavior of trivalent actinides
The distribution of trivalent actinides (Cm, Am) and trivalent rare earth elements among aqueous phase, surface layer and reaction vessel surface was in most cases (tables Al to A31) very similar, if the comparison is based on the normalized data. This is the case both, if retention in surface
79
layers is high (experiments at 110°C) or if retention is low (experiments at 190°C). Similar normalized release values imply that the ratio of the contents of trivalent elements in the various solid phases and in solution are equal to their inventory ratios in the pristine glass.
As a result of glass corrosion in halite and anhydrite saturated Mg(Ca)Cl2 rich salt brines, Calcium rare earth molybdates (powellite CaMo0 4 .nH 2 0 -type) (yellow tetragonal bipyramids) were observed both, in the present study with highly active R7T7 type glass as well as in the previous studies [20] using inactive R7T7 type glass. These phases form with Ca from solution and REE and Mo04 from the glass, ln a Ca-deficient brine (high sulfate containing brines) Ca free REE-molybdates are formed instead [27]. Due to the crystallo-chemical analogy of trivalent actinides with the rare earth elements (e.g. ionic radii of Am 3 + = 1.07 Â and for Nd 3 + = 1.15 Â) it is expected that these actinide elements could also be incorporated into the molybdate phase. The substitution of Ca in the powellite structure by trivalent elements occurs either by formation of vacancies or vacancies are filled with Na + ions, without significant structural rearrangement (the ionic radius of Ca 2 ' is 1.06 Â, close to those of the trivalent rare earth and actinide elements).
The geochemical code EQ3/6 has been used to predict the composition of powellite as a function of reaction progress £, (in g/m3). For the calculations it was assumed that powellite forms an ideal solid solution composed of the three end members powellite (CaMo0 4), Nao.sNdo.jMoO-», and Nao.sAmo.5Mo04. Stability constants for CaMo0 4 and Nao.sNdo.sMoC^, were taken from ref. [28] and the corresponding constant for Nao.sAmo.sMoOa. is considered identical to that of Na(l.5Ndo.5Mo04. The activity coefficients of M o 0 4 2 \ N a \ Ca 2 + , Nd 3 + and Am 3 + were calculated by means of the Pitzer model, taking interaction coefficients for molybdate from ref. [28], for the trivalent elements, Ca and Na from ref. [26], In the calculations Nd represents the total content of trivalent rare earth and actinide elements in the glass with the exception of Am. Calculations were performed for 25°C as thermodynamic data for higher temperature were not yet available. The calculated stoichiometry of the powellite solid solution is given in Table 9 as a function of reaction progress. This results may be compared with the reported average powellite composition of Cao.5sNao.2Ndo.2Pro.(i5La«.oiMo04 analyzed as a reaction product on inactive R7T7 glass, corroded
2 7 Grambow, B„ R. Miiller. A. Rother, W, Lutze, Rad. Chim. Acta 52/53, 501 (1991) 2 8 Grambow, B. R. Müller and A. Rollier, Rad. Cliirn. Ac(a 58/59, 71 (1992)
80
to similar reaction progress (ca. 105 g/m 3) as in the present experiments [20]. Considering the fact that no fitting or adjustment of the model was made, and that Nd represents also Pr and La, very good agreement of experimentally determined and calculated contents of Ca, Na and Nd in powellite is achieved for log Ç = 4.8 - 5.1, indicating that the ideal solid solution model and the respective thermodynamic constants for end member stability may indeed be a good approximation for predicting the change in powellite composition with reaction progress. The content of Am in powellite was not measured, but if experimental and calculated contents of Nd in powellite agree, we may expect similar Am behavior. The small contents of Am in powellite are a direct result of the small contents of Am in the glass and the present calculation result give a good explanation why it is almost impossible with solid state techniques (SEM) to analyze Am contents in powellite. Though Am is expected to be incorporated to a certain degree into powellite, the largest fraction of Am was calculated to remain in solution. This result is confirmed by experimental observations (relative large fractions of Am in solution for example were observed at 190°C, though powellite was also observed, Figure 31).
Tabic 9: Composition of an Am-containing solid solution of powellitc type, as calculated by the gcochcmical code EQ3/6 to form as part of tlic reaction path of the glass R7T7 in the halite and anhydrite saturated highly concentrated Mg(Ca)Cl2 brine of the present study. Included is the quantity (%) of Am contained in powellite relative to the total Am content of the reacted glass
log£ Stoichiometry of powellite solid solution % of AM (tot) [g/m3] in powellite
On the other hand this does not mean that powellite formation could not be the cause of the observed retention of Am at 110°C. We may recall (see discussion in ref. [28]) that retention of trivalent elements in powellite will be a quite complicated function of environmental constraints. In particular the mass balance of Ca form solution, and Mo/REE ratios must be considered. The
81
maximum quantity of trivalent elements in powellite is given by the quantity of molybdate which is not bound to Ca. Consequently in the Ca-free brine 1 [28] retention of rare earth elements was observed to be much stronger than in the present case. Any factor which influences the mass balance of Ca during glass dissolution will also influence retention behavior of trivalent actinides in powellite. Since Ca concentrations in natural brines are strongly inverse correlated with the sulfate content of the brine, high retention of actinides in powellite may be observed in sulfate rich solutions.
It may well be that some Ca is included into secondary phases not considered in the model, thus explaining higher retention of Am at 110°C. It has been reported that the apparent solubility product of REE-molybdates varies significantly with temperature, in particular in MgCl 2 solutions of high ionic strength [28] The increase in solubility with increasing temperature could explain why Am is retained at 110°C and not at 190°C.
82
Conclusions
Our data indicate that neither Np237, Crn244, Am241 nor Tc99 will be retained to a significant extent in immobile glass corrosion products if R7T7 glass is exposed to MgCh rich salt solutions. This is also true for Pu at temperatures lower than 190°C. In the absence of container material, the release of these nuclides is probably controlled by the dissolution kinetics of the glass phase and secondary phases, such as powellite, are not capable to limit the long-term release of trivalent actinides. Consequently, solution concentrations of actinides are high, in the order of ÎO^-IO'5 M. This high actinide mobility is a direct result of the low pH established in the corrosion tests. The situation is quite different if the glass corrodes in the presence of a corroding iron container. Under these conditions strong retention of actinides is observed.
As far as reaction kinetics is concerned the results clearly show that active and inactive glasses behave similar. Hence, the large data base generated for the inactive glass [4,5,6,7] can also be used quantitatively to explain results of the active experiment. Consequently, as far as the evolution of the solution composition and of the pH with time is concerned, long-term predictions of the behavior of the release properties of actinides and Tc from the active glass can be based to a large extent on the results obtained from the inactive tests.
The rate law described above can only be used for the formulation of a source term for glass performance in a repository, if its validity in presence of other engineered and natural barrier materials has been tested. Certain findings of our work are directly applicable to repository relevant conditions. Concentrations of actinides and Tc in the leachates are determined by their oxidation states which depend on the composition of the system, in particular on the presence of reducing components such as container materials (Fe, ..). Due to limited retention of Tc, Np, Pu and Am in the experiments in the absence of container materials, we can take no credit from secondary phase formation (solubility, coprecipitation) and the rate law for glass matrix dissolution must be used to estimate the long-term release of these elements, provided that the effect of the canister is neglected.
83
Since active and inactive glass have the same time and temperature dependence of corrosion, radiation damage or radiolysis are not expected to change the reaction kinetics. It has been shown in the literature [29] that inactive glass produced under laboratory conditions behaves almost identical to industrial scale full size glass canisters if exposed to the same experimental conditions. Hence, kinetic data of the inactive and active laboratory glass are directly applicable to full size radioactive glass canisters. The kinetic rate law (Eq.2) implies that the extent of long-term glass corrosion (mass of corroded glass per canister) is directly proportional to total surface area of a fractured glass canister. For t » t s a t , the extent of glass corrosion is independent on the volume of the intruding brines (2. term in Eq. 2), even though activity release of solubility limited radionuclides (NCi,saU NL¡.„t) strongly depend on solution volume. This strongly facilitates long-term extrapolations of glass behavior in a repository in salt formations, as the volumina of intruding brines are generally not known and estimations are highly dependent on assumptions and scenaria, which are difficult to validate.
Acknowledgment
The authors gratefully acknowledge the help of N. Müller, H. Truslen, A. Görtzen, F. Geyer, from INE, and V.Toth and B. Schweigel from the hot cell department.
This Appendix contains all the original data collected during this project. These are (1) activity based concentrations of radionuclides and mass concentrations of uranium and non-radioactive elements in (a) 450 nm and (b) 1.8 nm filtered solutions, (2) activities of filter residue analyses, (3) of (a) first and (b) second acid strip solutions containing sorbed nuclides from reaction vessel surface, (4) of radionuclides dissolved in ethylene glycol during sedimentation fractionation of glass and surface layer and (5) surface layer analyses. Results of solution analyzes are given in units of Bq/ml and in terms of the normalized elemental mass loss NL in [g/m2]. In order to allow direct comparison with the radionuclide contents in the various immobile phases, results of analyzing immobile phases are reported in terms of Bq(immobile phase)/ml(solution volume) and in terms of NL units. For a given radionuclide i, the NL¡ values of immobile phases are summed up together with the NL¡ value of the leachate to calculate mass balances and extents of glass alteration. The average value of these sum values is given at the bottom of each table as a measure of the extent of glass matrix dissolution. This average value is not based on all elements, because the mass balance of many elements was not complete. Criteria for the completeness or incompleteness of the mass balance of a given element could of course only be derived if many elements, e.g. Sr, Co, B, Am... show the same or, within experimental uncertainty a rather similar sum values. Incomplete mass balance normally results in lower sum values than average for the given element. In some cases, however, higher than average values are achieved (in particular for Np). Two explanations would be possible: selective leaching of that element from the glass matrix or from segregated phases or an experimental artifact. In case of Np, selective leaching is unlikely as there is less than 0.001 wt.% Np in the glass which should be as readily dissolvable in the glass phase as the other actinides whose concentration in the glass phase is much higher: 0.05 wt.% Pu or 0.5 wt.% U. At the bottom of each table it is indicated, which elements were used for the averaging.
85
The following table may serve as a guide to find for each set of experimental conditions (time and temperature) the corresponding data table number.
110°C 150°C 190°C
time [d] table time [d] table time [d] table 45 Al 45 A10 45 A20 90 A2 45 A l l 45 A21 90 A3 90 A12 90 A22
Extent of matrix dissolution (average of Sr, Cs (450nm)): 6,17
b = below detection limit n = not measured
Table A4: High active R7T7 glass in halite and anhydrite saturated concentrated Mg(Ca)Cl 2 solution. Corrosion results: 240 days, 110°C
90
Ol — C O .5 u </> > , c — •c o
r» h cc co (A « "w
Á u e >
(0 £ O)
o c o "w o ka w o o
o o
- ° 2 « I CM
a ç ; . J Ö 1
0 P 5 U Z c Ö » « -2 2 g 1 2 M I 5 i 5 </) O <•= CL
z E 3 en
E c
00
C 0 0 í 0 p > » - 0 { 0 ( 0 t - 0 0 r s r -C M C O t O C M P ^ í t O O * ! " * * « * -i - W r r O n P O O N N O
CO
J OI
<n en « OI -S? "cr CO
CO «fr CM CO CM r - O r—
o «— «— o o o o d d
ca CC
CO CD O O + + LU 111 O 00 co en o í ui
o + CO 00
o o o + + + LU O LU LU UI in co co in «fr CD r- o m en T- co
o o o o ö o
00 o o o + + + LU LU UI CO O CO CO CO T -CO «-* r-*
O O
eg o + L U W r<> co
CM
o»
a ca
CO CD «- CO O O O o
LO O + S U J ° 00 00 CM
.E D)
o m CO co co o co CM o 00 r>» o d LO T—" d * — T-" o
CM in CM r- CO CM O
O O
cr 00
O co 00 00 o CM 00 CM O O o o +
LU CO
o r— * — + + + + + + LU CO
+ + + UJ Ul LU LU UJ
+ LU CO UJ J3 J3 UJ UJ
o CM r- co
+ LU CO r- O CM
o en o CM CD r- <— d CM ai t " 00 CM"
+ UJ CM m
ira
oo o + UJ CM CD
.E O)
« E "E = ^
o oo in t
o w o c o » - o i o i n « - c o o o o n a o ^ ^ o> o > ^ n r-
O in «—' O co co O O O CM CM O"
CM
O CO CO oo o co en en m CM r— o 00 o T— o o r- r— o o o r— f— O + + + + 4- + + + + + + + + LU UJ UJ LU UJ LU LU UJ UJ UJ UJ Ul C UJ O CM CJ LO r» O CO CM o r— co LO T— C3 CO r- O i— CD CM C3 o o o «— tv d * — co Oî co CM" m" p»" LO CM 00*
^ in in to N N O ) ñ n <* r u o n ri i o o o n r
Ol
o CM
o I LU in
CM
.E O)
m in
<T in M (O CM R* FLI m m <- >- m o r> CO O O O 00 o
n O Q CO
oí U ^
_ ffl o O) "î, CM in" ^ 0 3 m T-
u 3
•M co LO r-. in
O os CM CO co in m o> CTJ " " " »— « -il ó JD ¿> C/> i 3 V) 1- to o U UJ Ul
o «a-CM
00 3) co CO CO CM CM CM £ = Z CL
* — CO CM I CM I CM 1 E < E < E
O CD J Z 0. J ro c N 3
X
"5 <0 E
c «
W —i Q} CO
Ö —
CD a>
CD •O
•O c
Table A4: High active R7T7 glass in halite and anhydrite saturated concentrated Mg(Ca)Cl 2 solution. Corrosion results: 240 days, 110°C
91
0) c 'S
H- C ° 8 O) _ c « 1 = .5 a
# z °> r - 0 0 O ) r™ CO st S o ps m co 0) en O) 00 E ci CO CM" CM" CM" O d O 3 en
CM E co CM co P^ CO l O o co ra c * ! CO CM CO t CO CM 00 l O l O
- J O d O d o d o o o o o Z
co CM O ) en CM o o o rv en « ° T— O o T— * — * — T— T— o o E + + + + + + + + + + + +
5 UJ LU C UJ LU U l LU UJ •O U l LU LU UJ LU 5 " o O en M- CO CM O o co ca t? CM co l O œ co CO CM o m O)
in* <* oo r- r " pC r— r - rC co
CM E co 10 co co CM O
"5» o O O o o W o
o o o o" o s o
a> qs <2 E -a a-
ea
r - o O en * — en en T" r -LU + UJ UJ + +
-O o UJ o o C LU - O UJ co CO CM LO O ,—
T— oí CD CD CM* CO
C J3
CM E
E c
OO
O en 00 en CM CM LO LO to CM* co CM o" o"
en co O CM CM o o T- T— r— + + + + + + UJ UJ c n uj UJ u n C LU UJ o CM o o O o co CM 00 00 co co" «—" « f r oo" * — CM*
•Q C .Q
C O ••p 3 O OT
•o ° ^ • O O Q N J
<D ~ . . J s 1
.2 * 3 « 2 c P « o .S S g
P l | a o g Z W o m a.
CM E co ra ^
OO »— to o o to co LO co o CO* CM" CM" CM" o" o* o"
en co o «-+ + I i i UJ
_ cr o LO o ca co r-m » -«i ^
«= co E E c C J3
o co CD CM O o O T— T"" r— + + + + + +
Ul u j ja £S UJ UJ U l LU o o O t O O co CM o T— O lO * — LO T" 00
.O .Q
® ö 3 C O '•S a OC
LO r - . t LO P» 0 0 O o
en en CM CO co LO t o 00 co
( D o en en * — T— T— «— CM 1 CM
à • 6 - Ó ¿n 00 3 3 a 3 u co h- V) (J O LU U l "Z. a.
o nf CM
3 Q.
R— co ••a-CM 1 CM i CM i E < E < E
O
t CO O
I + (O CJ CM"
E c o LO
en O
CO
œ o> ta w o > S c
•S .t; ¿ 2 C o = w c en o
1 0 S .S o> 11 O >/ co - a ro 5 5
'S o ~ ® c
§ 11 11 u n e
•o d) 1 ^ 3 eu co co a>
E 4-* O c
Table A4: High active R7T7 glass in halite and anhydrite saturated concentrated Mg(Ca)Cl 2 solution. Corrosion results: 240 days, 110°C
Co-60 b b b Sr-90 2,07E + 13 6,10 1,40E + 13 4,11 n Tc-99 n n n Sb-125 b b b Cs-134 1,20E + 11 5,44 8,25E + 10 3,75 1,20E + 09 0,05 Cs-137 2,93E + 13 6,23 1,609E + 1 3 3,42 2.50E11 0,05 Eu-154 b b 2,00E + 09 0,05 Eu-155 b b 5,00E + 09 0,05 Np-237 11970000 7,04 n n Pu-238 7,38E + 1 2 3,08 7,25E + 12 3,02 1.92E11 0,08 Pu-239/240 1,32E +11 2,99 1,22E + 11 2,78 3,8E + 09 0,09 Am-241 2.26E+11 1,08 b 2.68E10 0,13 Am-243 b n n Cm-244 b b 0
Extent of matrix dissolution (average of Sr, Cs, Np (450nm)): 6,19 + - 0,66
b = below detection limit n = not measured
Table A4: High active R7T7 glass in halite and anhydrite saturated concentrated Mg(Ca)Cl 2 solution. Corrosion results: 240 days, 110°C
93
corrosion time: 720 d Nr. 173 temperature: 110°C pH (corrected): 4,87
Extent of matrix dissolution (average of Sr, Cs (450nm)): 0.60 + - 0,18 b = below detection limit n = not measured
Table A14: High active R7T7 glass in halite and anhydrite saturated concentrated Mg(Ca)Cl2 solution. Corrosion results: 240 days, 150°C
98
CJ5 00
r« H r> cc
Ol Ê —j X 2 o o « c o '55 o t o o
_ CJ ti o n ° S en m w
g, ~
ß Ö o a ° n e o 0 g fc 1 â S 5 i l o £¡ a
¿ÍIOi-IBIOIOOlúrlOhn N CO f* 0) CO 00 £ CM ¿Ohr»(r)r-r-OIÜ)COnCOO C (O f- r- Cl . N E« * * * « « * « « J» » » • « % % « % % M « rOOOr-r - « -OOMOOr- Q O N O O O Ï Ï r 3 « N
a co oo
OlO IC CT " 00 ö S N
CO co CO co co CT1 CO m T* CO CO CO r- co co co co m o CO O) o co CO o o o o tí CO o o o o rC ui
en OS at w in CO CO ,— CO r-T Ti-CO in CM 05 re CM CO r- en co" CO in CM CO 00 O CO CO en CM CM N r r> 0] r~ in CO CO Tí- CM in t in CO CO Tt «t r- . — O r- CO CO CO 00 t O CO CO -•a-CM »—
• f l - CO CO eo CO CO CM f CO CO Ol P r» O ra Is-CM m f— o m f— O o
O) o O CM .E 01
ca
O T-o o
8 ° co ta co o co
CM E i— r™ ,— ,— r— r" CM 01 o O O o o O o O O O
o o O o o" o o o o o o z c le M I i
o oo co o 00 00 o co 05 00 co M I i T-» o o f— o o r— o O o cs 3 M I i + c + + + + + c + + + c + cs
3 er a Ul Ul Ul Ul Ul UJ Ul UJ Ul UJ CM
er a co CM CO •«f co CM co CM N .E as CM co co CM co t co CO r>. 01 """I T— ' — »— .— »— r— r™ CM t— .— _l o O O o o O Ö O O O o
a Z e 1c •2 o 5 + ,— 05 05 05 o O o r O) cn •2 o 5 + O O r— a o o CQ
3 •2 o 5 + + c + + + + + c + + + + + CQ
3 ¿Í UJ « CO UJ UJ UJ UJ Ul UJ Ul LU UJ UJ LU r- ¿Í UJ « CO Tt CM co co in co r— CO CM CM
° 0) o CM , ai 05 co tri CM T— CM r» o O CM Ifl o O o CM CM r- CM _l CM r-" o O Ö O o" O o O Ö d O O Z w O ai CM 00 05 CM 05 05 r" as o 00 ,
te m ° E + •5 UJ ,— O O ,— o O o r- O T— O O
E m ° E + •5 UJ + LO + + + + + + + + + + "E + E m ° E + •5 UJ Ul co UJ UJ UJ LU UJ Ul Ul UJ LU UJ "E UJ c a- m CO CM en O) CM in co oo <35 oo "S <n 03 ea o o CM CD «t in in 05 CM cq "S
«t co* «t CM co" 00 in in ai CM co N E co 05 r— CM CM O r» in co O o 05 co co co r}-0 e! tn O co 00 o o CM CM I— 05 in co CM CM -I CM o" O O O O o" ö Ö o" O o o" O r™ o O o r-T O Z
» m CM PN CO O CM 05 05 co O) o 00 Sí _ o E + -S uj
o O w— o o o O o O g
_ o E + -S uj + + + + + + + + + + + + O O Tí co 5 O + c _ o E + -S uj Ul UJ Ul 111 Ul Ul LU Ul Ul UJ Ul Ul Ti- r--5 m m a- as c» in CM in co 00 r» in co p» 0) in co Tt CM o m <f ai co 05 05 00 r 05 CM CM r- 05 o I-. CM co co CM O o m <f co CM CM T— co" cm' r»" iri 05 cm" co"
rt CO CM co a o O T* o o O o o O
co r-. r* o o o tn lil m UJ 05 CM 05 co ' — a> t— r» «— o CM r» O CO co ai o
o 73
If ID O a u
o T)-JM gjCp^r^^-T^-rj-vMCMCM t i i l / lh lOUOll I l l lZLl<<( (J
«t r-O
OO r» o
— 2 »--i Z a. co c _ -i N 3
a S-o u + E c o in «r CL Z CO a (A co
ai es a > ca e o 3
•a X 's E O s o s Ul
c •BT, O eu (P h a> M •a œ 5 « a> o XI c
Table A1 4 : High active R7T7 glass in halite and anhydrite saturated concentrated Mg(Ca)Cl2 solution. Corrosion results: 240 days, 150°C
99
Sample No. 29 corrosion time: 240 d temperature: 150 ° C pH (corrected):
Extent of matrix dissolution (average of Sr, Cs.Pu (450nm)): 1,20 + - 0,09
b = below detection limit n = not measured
Table A14: High active R7T7 glass in halite and anhydrite saturated concentrated Mg(Ca)Cl 2 solution. Corrosion results: 240 days, 150°C
100
r> cc
ra à o o > «3 U
Ol !ë c o M o h. o o
oo u „ o <2 |v O _ CO r "í O M in '
E 3 en
ai ~ •ë s ® A -s S. **
- i f g 18 M I s i I 0) O ^ Q
49 s "5 a c o ï a ce
(fi o o r» i» o m $ r- co »o > » n N h N 3 m co w *T f" r* n i'i ' « n i " * P i n O N r r r r ^ O O «—
.E Ol
0 01 -51 "o1 m
iDia^u)MO)ooo)iooocM Q OD ^ a» C5 o » I IN r-. LO ri O O N O o' f ' <-"" o" ö
o o g o o m i o n r h O o o S i Soirs + oo tv . r1 co CO Q CO CM <- Ç?
- C^ CM CD ¡Ó CÖ CM *—
(O m
O O c oo o CM
.E Ol
o-m c: c c c c c c:
rv CM o co o o o o'
c c | § oo ^
01
r
C ai 00
co 00 •«t o r» in OS O 00 CM CM 00 O O o O o
00 co 05 CM o O o tr— o O + UJ 00 oo 00
T— + ¡Ü -O
+ + + + UJ 00 oo 00 + +
¡Ü -O + C UJ -O Ul Ul
+ UJ 00 oo 00 LU
+ ¡Ü -O SI UJ 05 (0
+ UJ 00 oo 00 |v co 00 05 Tj-
+ UJ 00 oo 00 Tí* m co 00 rv r— CM rv
rv IV 00 co o o
E O)
a
C D-o m m
m m o oo o « q o
Tj* 00 CM O CD rv CM CM O O Ö Ö
CM « -o o m o o CM o o o
CM IÍ5 O CM 05 o co co o 05 * — O T— i— o r— o o f— o + + + + + + + + + + UJ UJ .Q UJ UJ UJ LU J2 111 LU UJ C LU o O o m rv IV OO 00 LO O |v 00 «t co 00 05 en CO in 05 * — ci co r-" co" in
MO SI (S h O I-co »- co co co CM r N O* O' O* N r
C C C C C C
c c c c c c c:
.E c c c oi
rv m os co iv oj «-00 CO C0 CD r- O t-" CM o O o" CM O
" e O O -|<- Ori OI co CM M
cq in co o 2 OO 00 O 2 CM œ ' in
co'
o -a-CM o SoO5cMc000inir)00 00 00clS|S — 9 K O ) ' - ' - ' - T - T - W C M C > 4 ¿ . V i i i i ' 1 i ' JL « i c C c a w i - w o u û j i i i 2 û . a . < < o co S Z a. co c _l M 3
X Q]
i 1 •s I CD C -q S » UL
3 œ « ra o E
Table A15: High active R7T7 glass in halite and anhydrite saturated concentrated Mg(Ca)CI2 solution. Corrosion resultó: 240 days, 150°C
Extent of matrix dissolution (average of Co, Sr, Cs (450nm)): 1,99 + - 0,30 b = below detection limit n = not measured
Table A14: High active R7T7 glass in halite and anhydrite saturated concentrated Mg(Ca)Cl 2 solution. Corrosion results: 240 days, 150°C
107
oc CS "DI
à o o > 0 «-CS J= 01 'JE ë •S . E œ « ° o * S ô g Z c ¿ o 'i o .S S g g ñ. « o 5
O •O o s ° Oí m
o o f i I f
<» S
E 3 n
00 00 es o) ci CM inooirf(o<riD(orocoo n n o co ID ro N N r n œ o" ri N o' o' M* O* O* N O >-'
. f Ol
er ta
O O O R * « - » I - O I W I N R - O I C M C M C O o - o O N ^ N w n o o n o N o' o' o o' o' o o' o" cí o' o" o" o' o'
E "w
er co
05 O) R- O) o co o co r— o o R- o o o
JO UJ Tí c + UJ + UJ UJ I-; + UJ
UJ CM + UJ
UJ CM + UJ
PÍ in CO O) CM TÍ 00
oo co oo 00 co oo o O en C3 o o o o O o o o R— o O o O o o o o o o
r- O O Sí + +
«— O O o o o"
00 00 <J> »— en OS en o oo o o O .— o o «— o O + C J3 + + + + + E + + + XI + UJ UJ UJ UJ UJ UJ UJ UJ UJ OI R*. in CM co co OI TÍ CM <—
OI
er ea
^ • - r t - o n o o m o n o o o o o o o o o o CÍOOOOOOCDOC)
CO O CO CO T— CT) O CO O «- O O «- O t- o + + + + + + + + AÚJ}J)UIUIUIUáUIUJUlHU o o o o o o o o co r - cq n n o O) TÍ CO CC> CM CÎ «-
OI o o Ti- r-» o> 05 R— TÍ O «a- o 0) co co co CM o o CM m o í CM" o ' o " o o " o * o " o o T -
or m
m CM o CM o O M o oo CO 0) o CM ,— T— o o ,— O o + UJ _ -o co + + + + + + + + + +
UJ UJ _ -o co JQ UJ UJ UJ UL UJ UJ UJ UJ UJ UJ o UJ _ -o co O O o O o o o O o o co O o LT) en o in co R—
CÔ CM co * - co UÎ co CM OÎ pí
•i 01
I I o co m
o CO in o 05 TÍ in 05 f». rv CO co CM CO CM o r» m in in o o p» co co CO CM o CM o o o o o co r -
CM en o + UJ UJ o oo « 05
O +
rv co
o OI o O co y— 05 00 05 .— r— T*» »— o o i— o O + + + + + + + + + + UJ UJ UJ UJ UJ UJ UJ Ul LU Ul o o o o o o O O o o Ti T CM in o r* o CO r* co TÍ 00 CM' NI ro co TÍ oí
CD M o i z o S¡ o.
"3 3 C O •5 ca ce
o ÇM
o 0 encMcocominçococoSSS 'ProO'TT 7 7 V ^ ' í " ¿ ¿ ; 0 ¿ 0 J 3 W W 3 3 a 3 ¿ C C E
Radionuclide Bq/m3 NL g / m 2 Bq/m3 N L g / m Bq/m3 NL g /m2 Bq/m3 N L g / m Bq/m3 NL g / m 2 Bq/m NL g /m sum NL * C o - 6 0 5 . 2 E 8 0 , 3 7 n b n 1 .2 E 8 0 , 0 8 5 n 0 , 4 6 Sr-90 n n n n n n T c - 9 9 b n b n b n S b - 1 2 5 b n b n 5 . 2 E 8 0 , 0 3 5 n 0 , 0 3 5 Cs -134 3 . 4 E10 1 ,64 n 5 . 8 E 8 0 , 0 2 8 n 1 .8 E 9 0 , 0 8 7 n 1 ,76 Cs -137 6.1 E12 1 ,38 n 1 .2 E11 0 , 0 2 7 n 3 . 8 E11 0 , 0 8 6 n 1 , 4 9 Eu-154 8 . 0 E 9 0 ,21 n 4 . 0 E 8 0 ,01 n 3 . 2 E 9 0 , 0 8 3 n 0 , 3 Eu-155 1.9 E10 0 . 2 n 8 . 0 E 8 0 , 0 0 9 n 8 . 4 E 9 0 , 0 9 n 0 , 3 Np-237 b n m n n n Pu-238 2 . 6 E11 0 , 1 2 n 1.5 E10 0 ,01 n 2 . 3 E11 0,1 n 0 , 2 3 P u - 2 3 9 / 2 4 0 5 . 6 E 9 0 , 1 3 n 3 . 3 E 8 0 ,01 n 4 . 0 E 9 0,1 n 0 , 2 4 Am-241 2 .5 E10 0 , 1 3 n 2 . 0 E 9 0,1 n 2 . 2 E10 0 ,11 n 0 , 3 4 A m - 2 4 3 n n n n n n Cm-244 6 . 0 E 8 0 , 0 9 n 6 . 0 E 7 0 ,01 n 1 .0 E 8 0 , 0 2 n 0 , 1 2
Extent of matrix dissolution ca. 3 g / m 2 b = b e l o w detection limit n = not measured
Extent of matrix dissolution (average of Co, Sr, Cs(450nm)): 6,10 + - 1 , 2 6
b = below detection limit n = not measured
Table A14: High active R7T7 glass in halite and anhydrite saturated concentrated Mg(Ca)Cl 2 solution. Corrosion results: 240 days, 150°C
115
a> H. a o a g C .£ o tfí u •is
CO I 00 O o ; rC 2 n E
z o OWIOO eo C t . * r - CO fN 0> P> co S Is" (O* «
00* CM* CM* O « co vt
CM J 2 IX. CO co 0) O CM CM U) o CD o o o o CM ' — O r— CM
o d o ö O O d O o O Z m CO CO tn Tí m o in Tf in o o o o O o o o O o
SI + + + + + + + + + + B1 C Ul c UJ LU UJ UJ UJ UJ Ul Ul UJ C c c CO o CM O T— O) CM CM o> CM o CO 00 m Tí CO o O O LO CM co tn CO P-* Tí « - r™ CM* CO CM
CM Ë o CO O O CM CO CO CO co eo a a> o O O _i Z O T- O O O
tn Tí Tí in o O o O o + + + + + M C c c xi UI UI Ul Ul C C C UJ c c c c
CO CO tn CM CM o Tí CM O CM * - " CO
CM J CO Tí co co Ol o o O co co 00
o o o d o" o Z
Im Q) 00 co o o r-co o o t— <— r—
e B + + + + + + t •5 C c c UJ UJ UJ UJ Ul C c c tu c c c c c o- o px O 00 o tn o G0 00 CM p CM co m r— CO co CM
co o r» r - Px co r— r " o Ti Ol ^ in p-. O ^ O O en CM !>• -I to z
LO in in CM" CM" r— F— o O Tí Tt CO
O en co en r— CO o IX. o co CM O CM ¡H o <— o I— R— O r— O r— T— O e + 4- + + + + + + + + + + "e + e CO Ul Ul Ul XI UI UJ Ul LU LU LU UJ Ul UJ .E UJ c E o 01 CO in o O) CO en r eo CO m Ol rx co 00 o o Tí Ti R— en CO p<-o en O) R- ca en * - * CM oo" CM* CM* CM* CM*
CM £ o in a ^ o P". CO CO
z
T í r - C O r - S r - r - r O T- m ro in "i o o co co pC CM CM" 2 o o in
co O eo o> eo o o 00 CM O r" r— O T— r— O r— o T— r— + + + + + + + + + + + + LU Ul UJ LU UJ Ul Ul UJ UJ UJ UJ UJ O) in co o Tí co CM co T— t— CM co in in 00 CO 00 T- ^
CM eo en* CM' »— co' . co'
o -E c o
o o
.. f ® s p » c e S OOS «1 o o g Q S o i z u «S a
o "3 3 C O •S ca OC
m Tí p» o en CM CO co en Oî '— ' — C. 6 _D Ô) Ú w t- C/5 u u
ri in CD m in CO CO CM CM 3 3 â S LU LU z CL
r— co Tí Tí »Í 'S" CM CM CM É ë ë < < u b
3 O i + co CM
E < w v> O O U 0 01 ca h-a J c o •«s S 1 o v) c ÇA o "O o 0) s = 03 t/> es ro - ^ a) •s J E " tu a c -o = S II » m £ c
'S X i E
Table A 1 4 : High active R7T7 glass in halite and anhydrite saturated concentrated Mg(Ca)Cl2 solution. Corrosion results: 240 days, 150°C
116
Summary: Reaction progress Ç and molarities as a Function of Temperature and Time
110°C Elemental concentrations [Molarities] t PH % Pu Np Am Tc U d g/m3
Table 31: Summary of solution concentrations of actinides and Tc in measured in leachates resulting from corrosion tests with highly active R7T7 type glass in a halite and anhydrite saturated Mg(Ca)Cl 2 rich brine


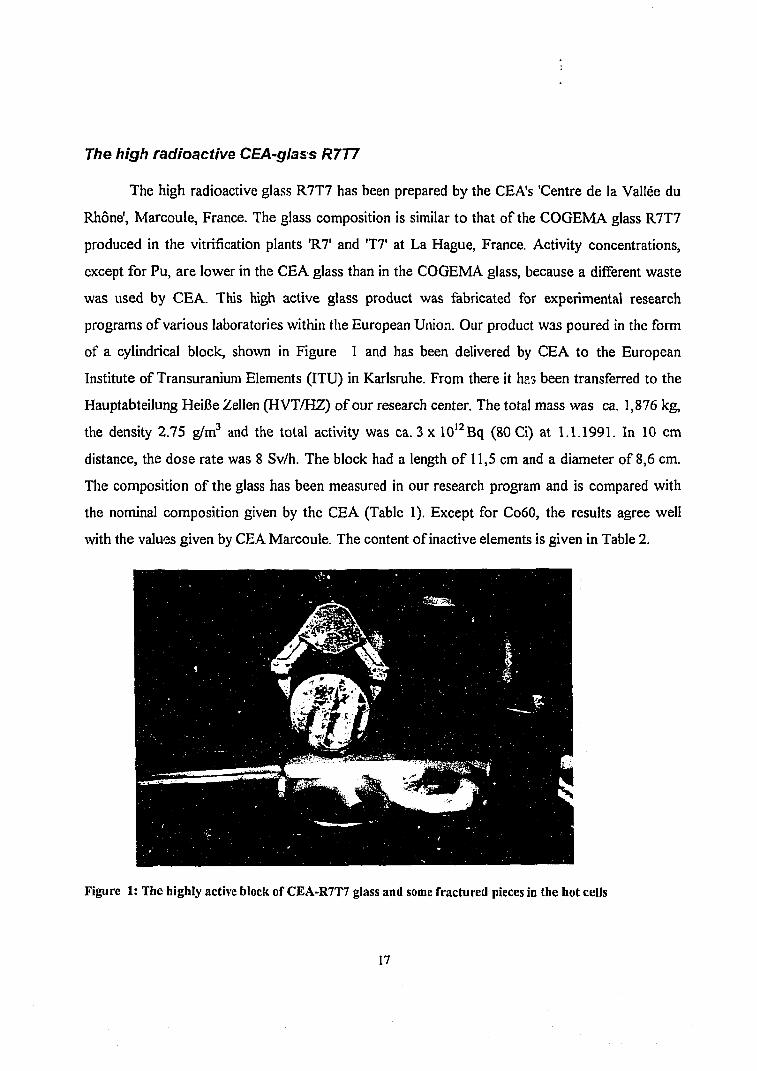


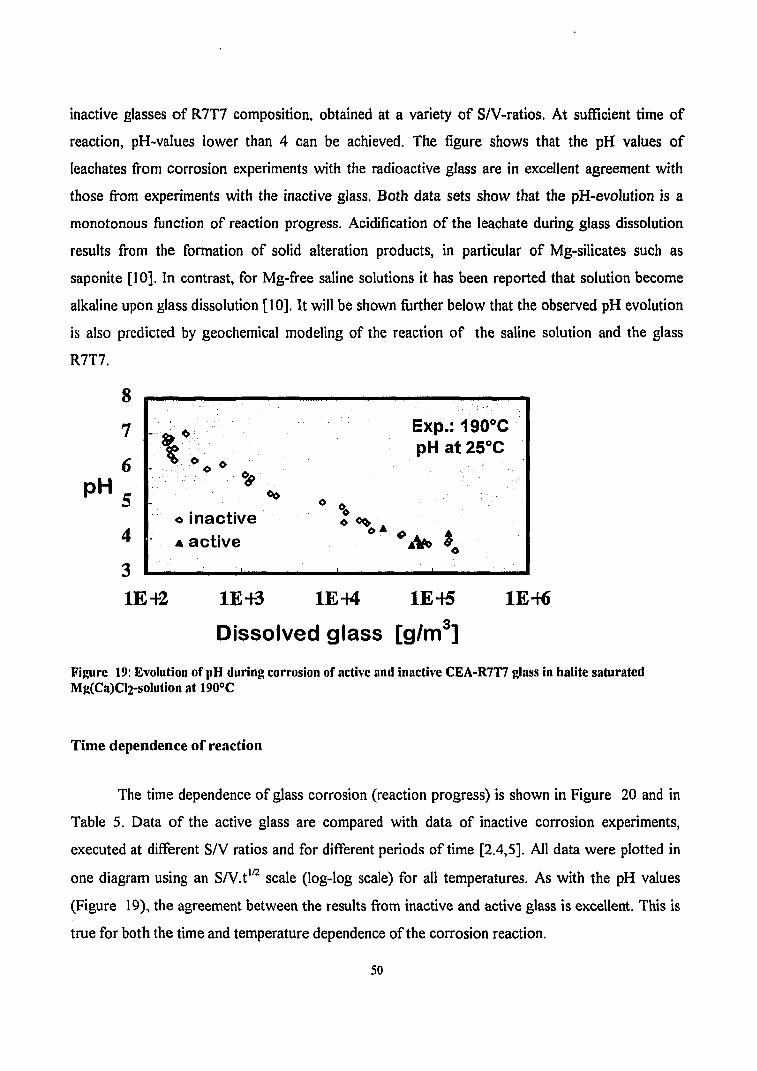


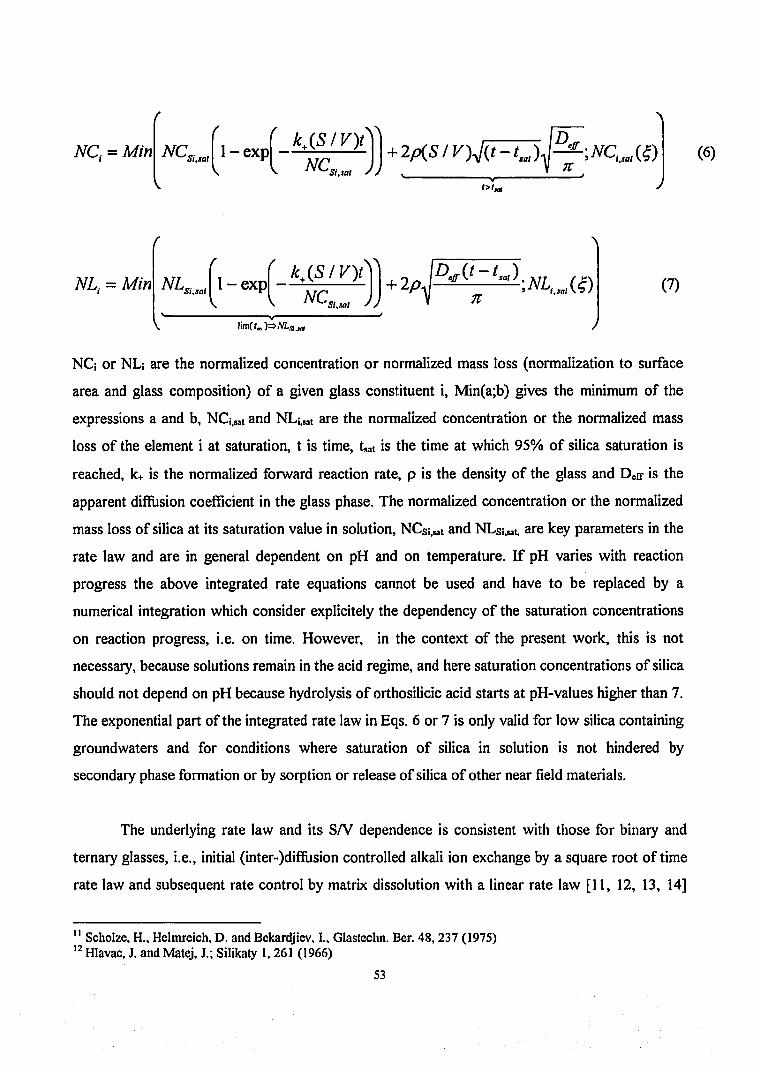

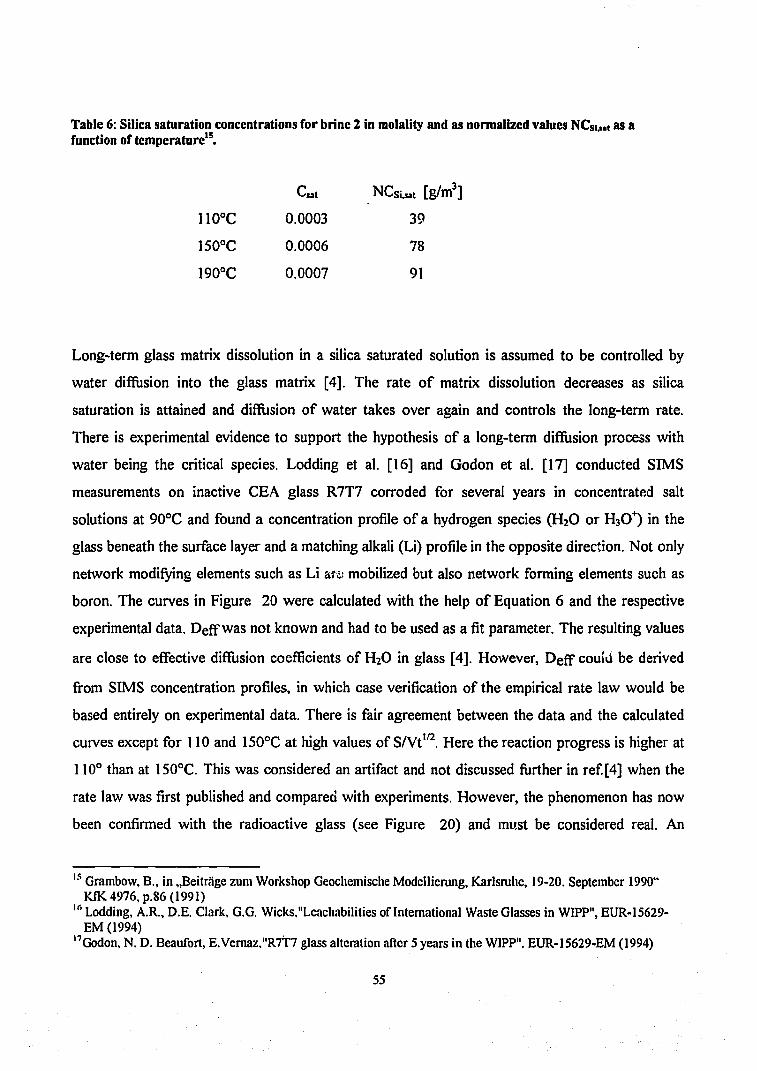


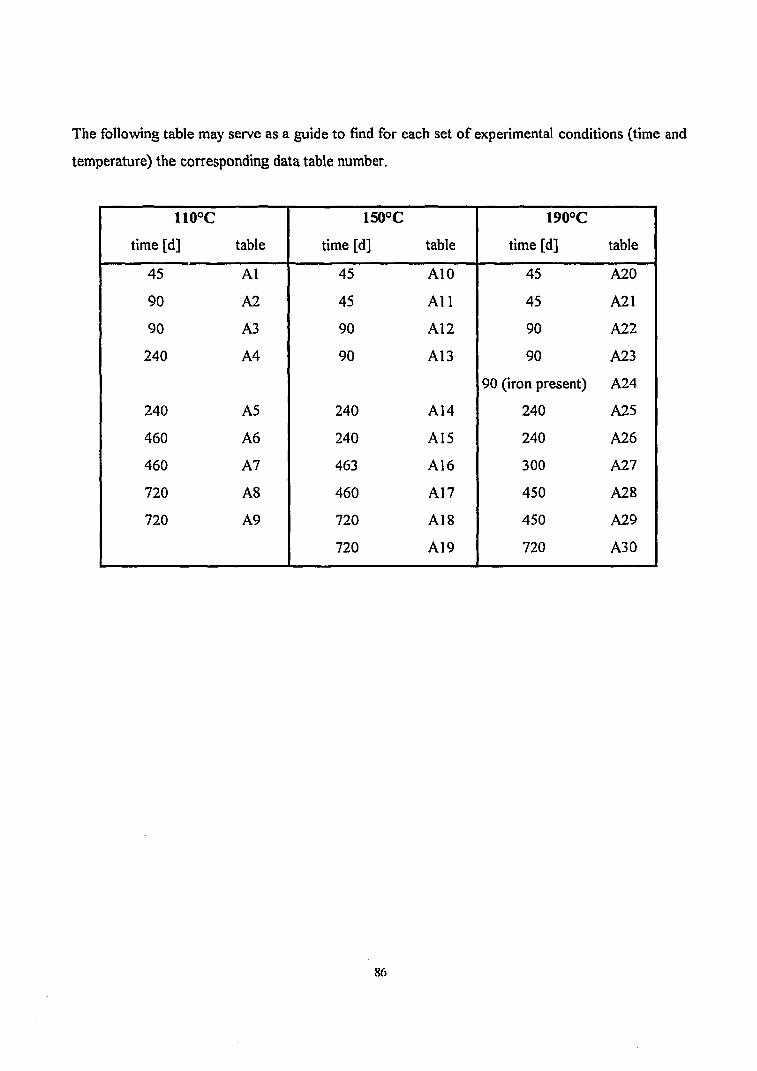


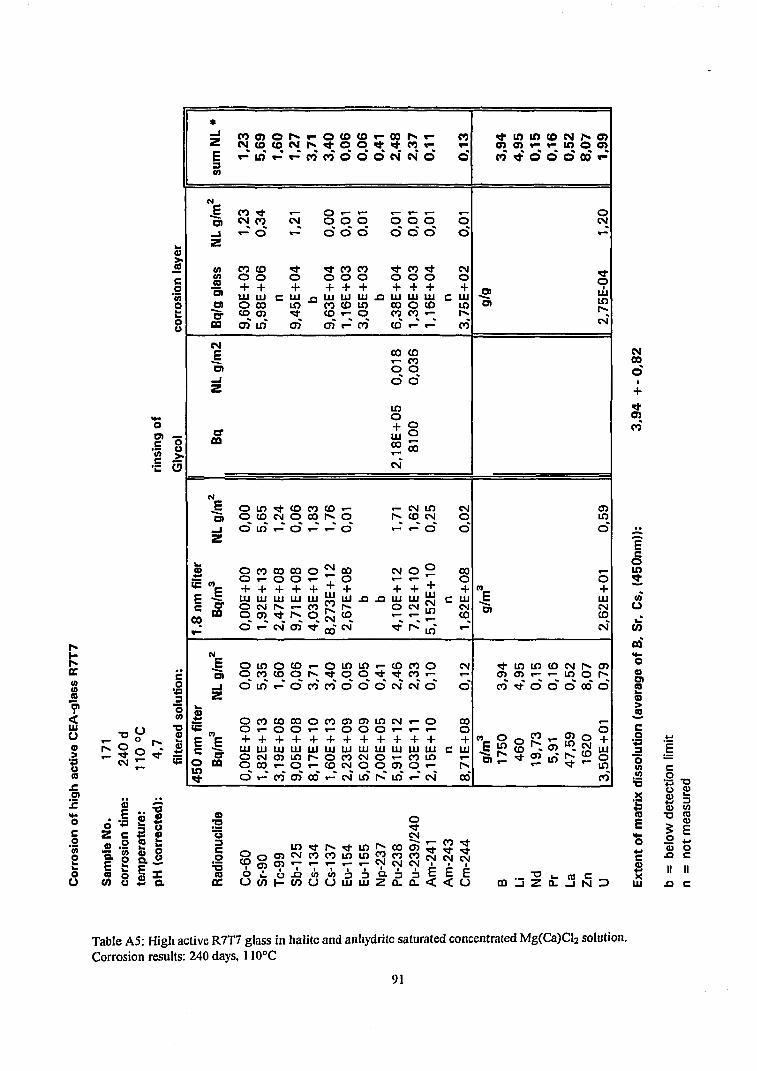


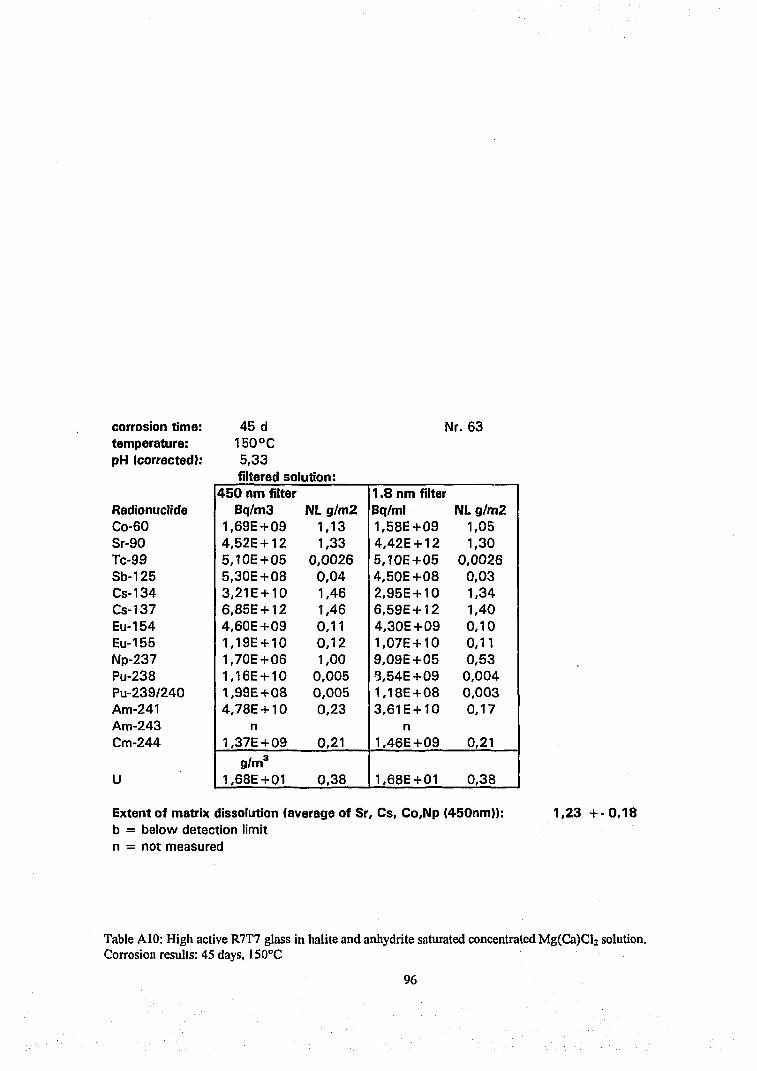


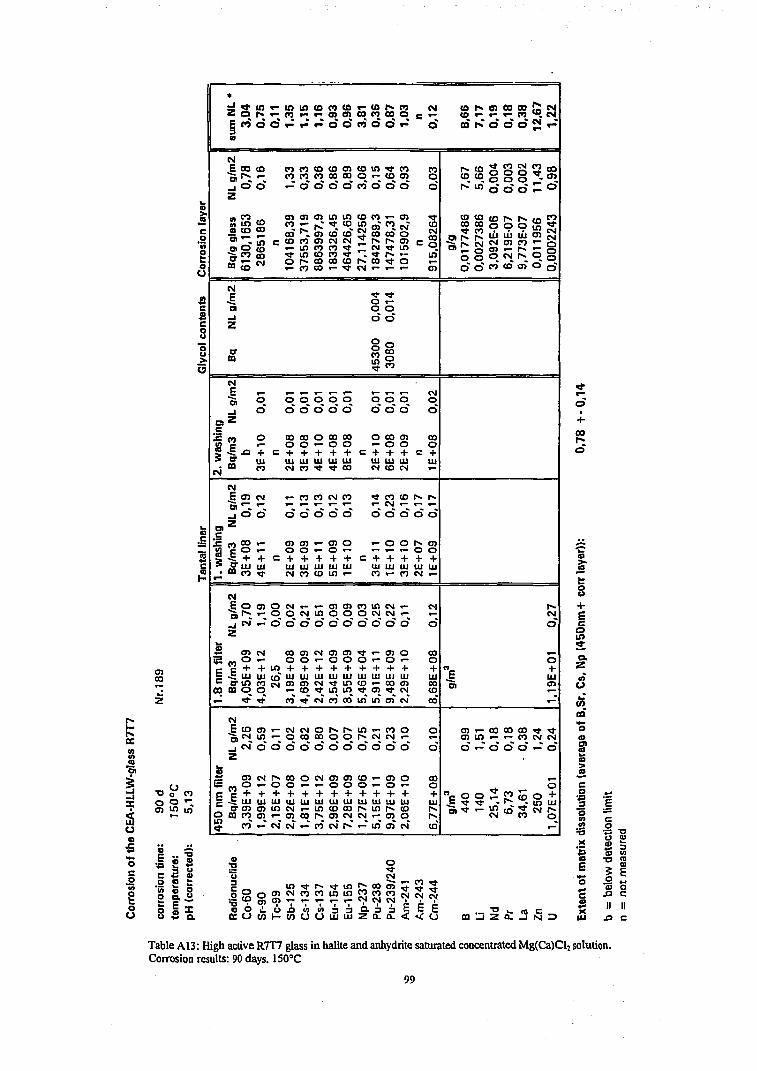


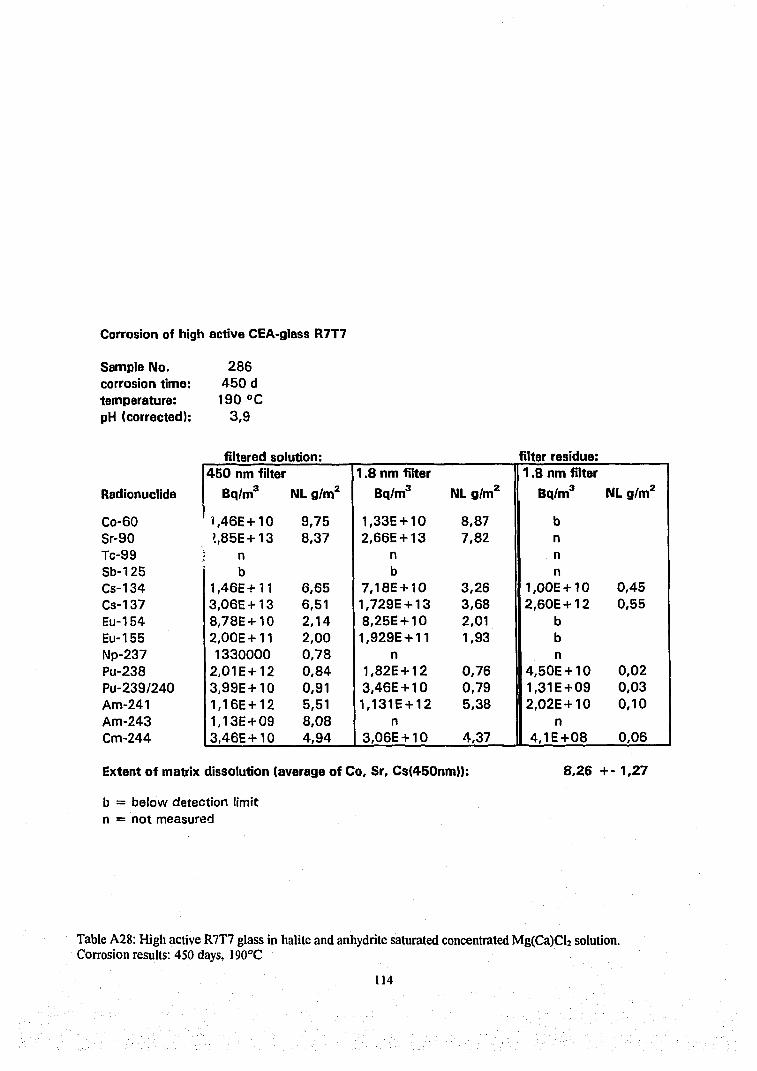

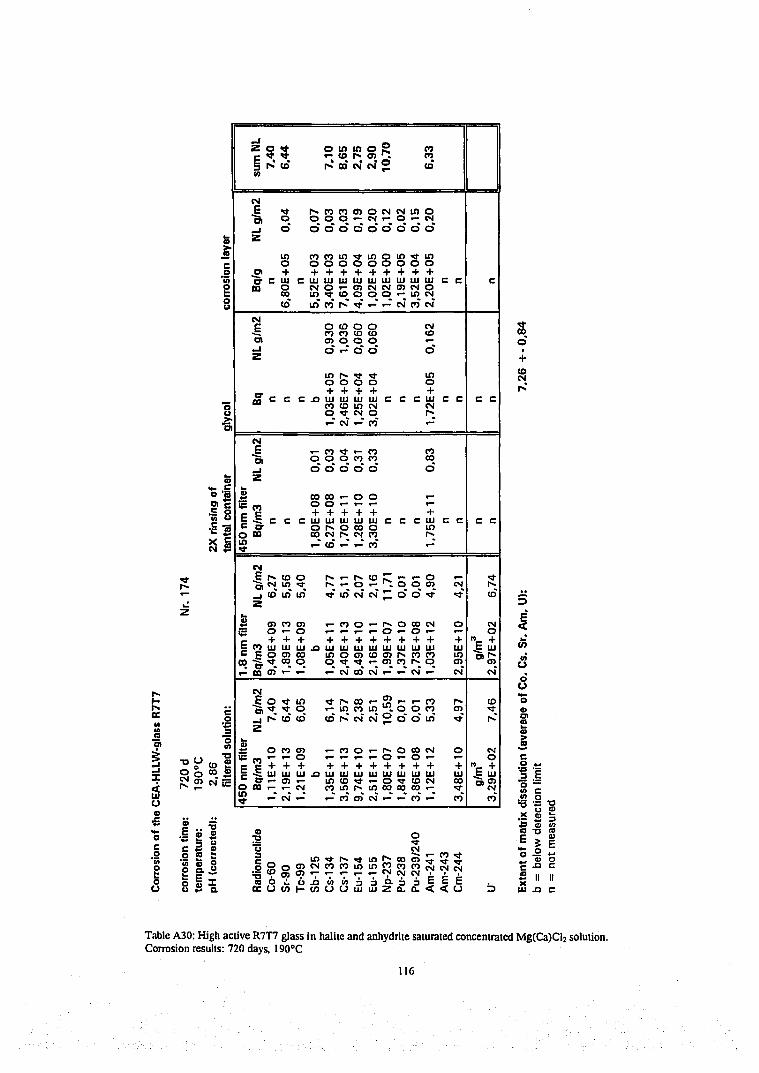


![[Lasse Ringius] Radioactive Waste Disposal at Sea](https://static.documents.pub/doc/80x56/5695d07b1a28ab9b0292a17e/lasse-ringius-radioactive-waste-disposal-at-sea.jpg)


![Monitoring and Surveillance of Radioactive Waste Disposal ... · Waste [2] sets out disposal options corresponding to the recognized classes of radioactive waste as specified in Ref.](https://static.documents.pub/doc/80x56/5f2d4d06daa93177f315d1f0/monitoring-and-surveillance-of-radioactive-waste-disposal-waste-2-sets-out.jpg)


