Page 1
Iowa DOT Project HR-275 ER! Project 1795 !SU-ER!-Ames-86205
T. J. Wipf K. Jeyapalan
J. T. Neiderhiser
Long-Term Structural Movement February 1986
f:i,'16. Iowa Department .,..., of Transportation
Sponsored by the Iowa Department of Transportation, Highway · Division, and the Iowa Highway Research Board
College of Engineering
Iowa State U sity
Page 2
The opinions, findings, and conclusions expressed in this publication are those of the authors and not necessarily those of the Highway Division of the Iowa Department of Transportation.
Page 3
Iowa DOT HR-275 ER! Project 1795 ISU-ERI-Ames-86205
T. J. Wipt K. Jeyapalan
J. T. Neiderhiser
Long-Term Structural Movement February 1986
Submitted to the Highway Division of
the Iowa Department of Transportation and the Iowa Highway Research Board
Department of Civil Engineering Engineering Research Institute
Iowa State University, Ames, Iowa 50011
Page 4
TABLE OF CONTENTS
LIST OF FIGURES
LIST OF TABLES
1. INTRODUCTION
1.1. Statement of the Problem
1.2. Background
1.3. Objective and Scope
2. LITERATURE REVIEW
2.1. Structural Engineering Applications
2.2. Surveying Applications
2.3. Evaluation of Methods
3. DESCRIPTION OF TESTS
3.1. General Testing Program
3.2. Description of Test Members
4. TESTS AND TEST PROCEDURES
4.1. Column Tests 1 and 2
4.2. Beam Tests 1, 2, and 3
4.3. Beam Test 4
5. TEST RESULTS AND ANALYSIS
5.1. Member Deformation Measurements and Calculation
5.2. Column Tests 1 and 2
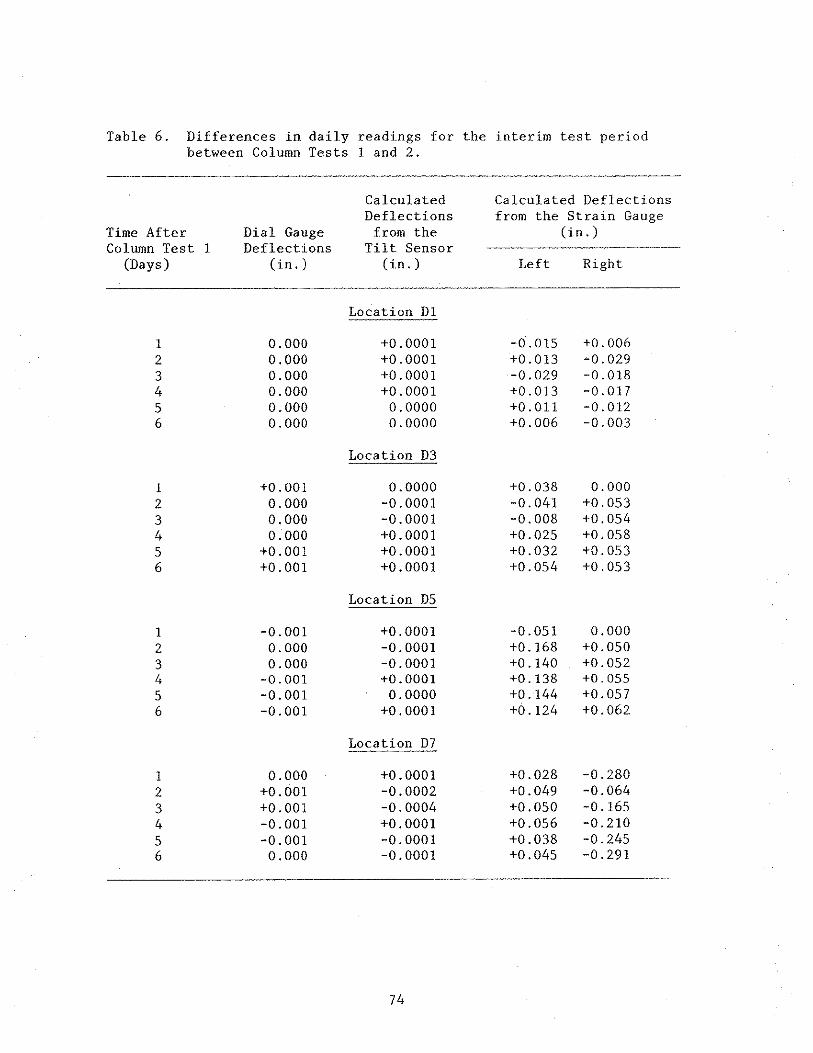
5.3. Interim Test
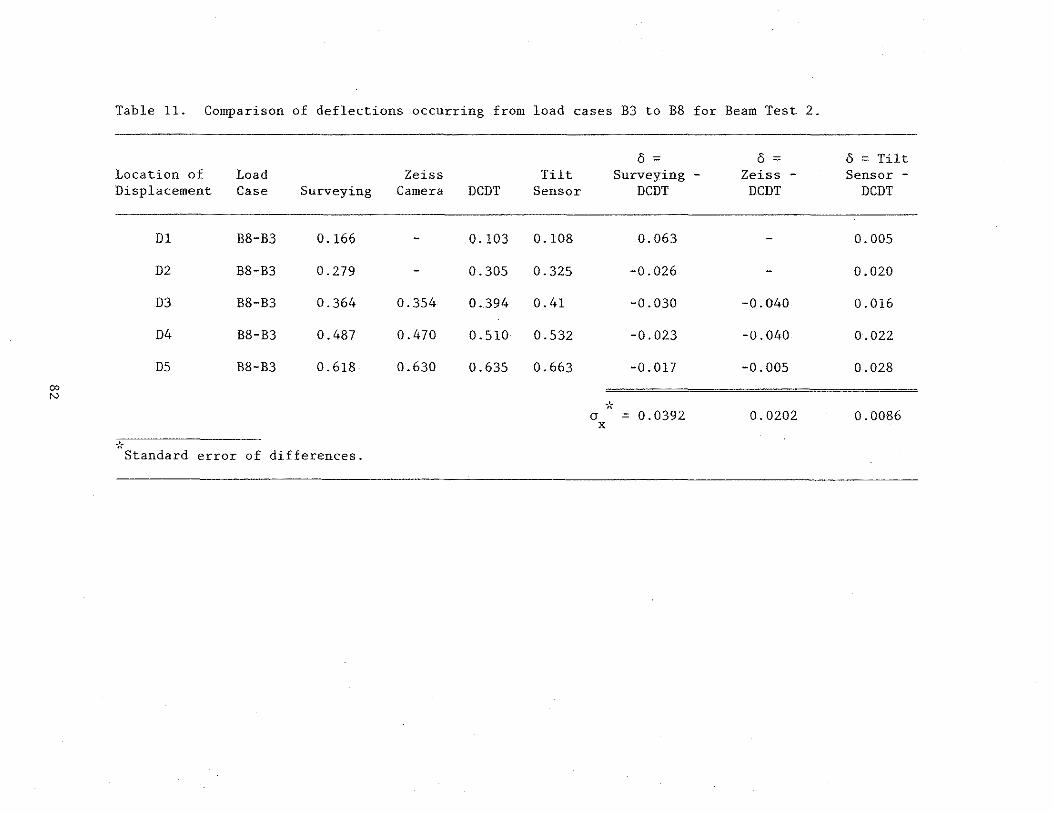
5.4. Beam Tests 1 and 2
5.5. Beam Test 3
5.6. Beam Test 4
iii
v
vii
1
1
2
3
5
5
11
13
21
21
37
45
45
53
57
63
63
64
73
75
86
89
Page 5
6. SUMMARY AND CONCLUSIONS
6.1. Summary
6.2. Conclusions
7. RECOMMENDED STUDIES
8. ACKNOWLEDGMENTS
9. REFERENCES
10. APPENDIX A: RECOMMENDATIONS AND PROCEDURES FOR FIELD APPLICATION OF BRIDGE MEASUREMENT
11. APPENDIX B: DISCUSSION OF EXPECTED ACCURACY FOR MEASUREMENT METHODS USED IN COLUMN AND BEAM TESTS
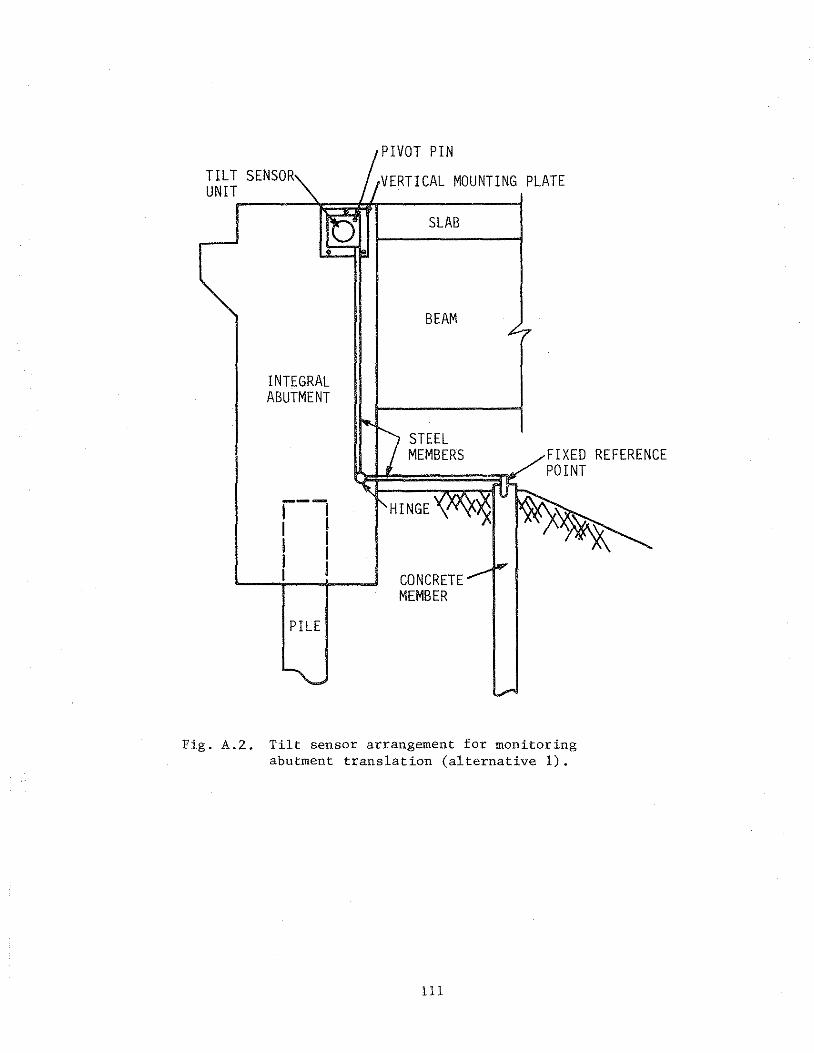
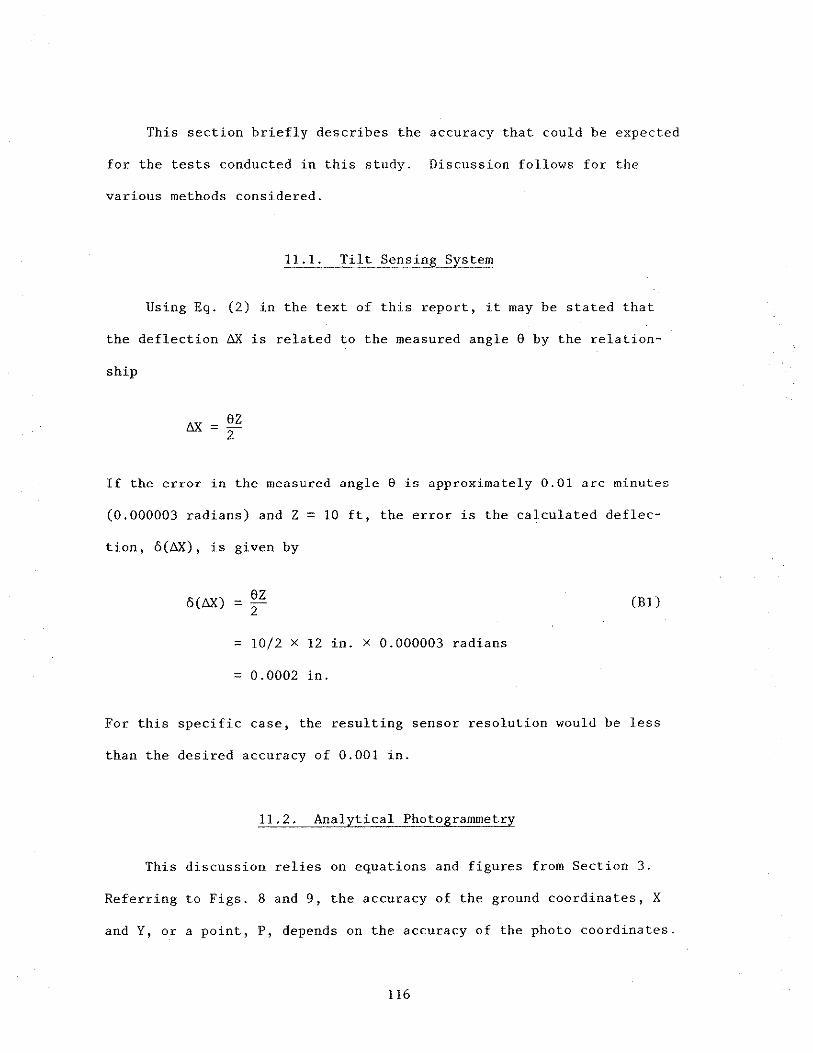
11.1. Tilt Sensing System
11.2. Analytical Photogrammetry
11.3 Surveying
iv
95
95
98
101
103
105
107
115
116
116
119
Page 6
LIST OF FIGURES
Figure 1. Detail of assembly used in California study [5] to measure longitudinal movement because of temperature change. 7
Figure 2. Tilt sensing equipment: (a) power source, (b) recorder, and (c) tilt sensor and mounting plate. 24
Figure 3. Details of tilt sensor mounting to the plate: (a) pivot hole, (b) brass mounting pad, and (c) alignment mechanism. 25
Figure 4. Description of rigid body rotation for calculating deflections from tilt sensor data. 26
Figure 5. Description of member curvature for calculating deflections from tilt sensor data. 28
Figure 6. Wild STK~l stereocomparator. 30
Figure 7. Zeiss stereometric camera on a tripod. 31
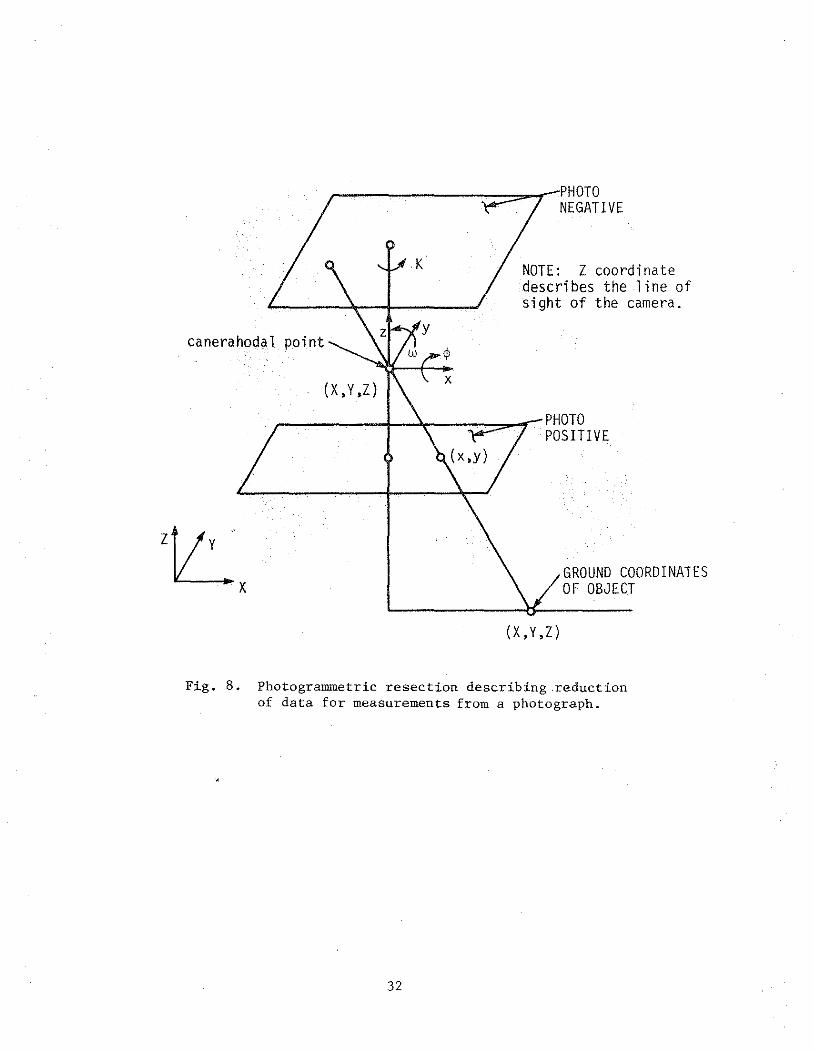
Figure 8. Photogrammetric resection descrihing reduction of data for measurements from a photograph. 32
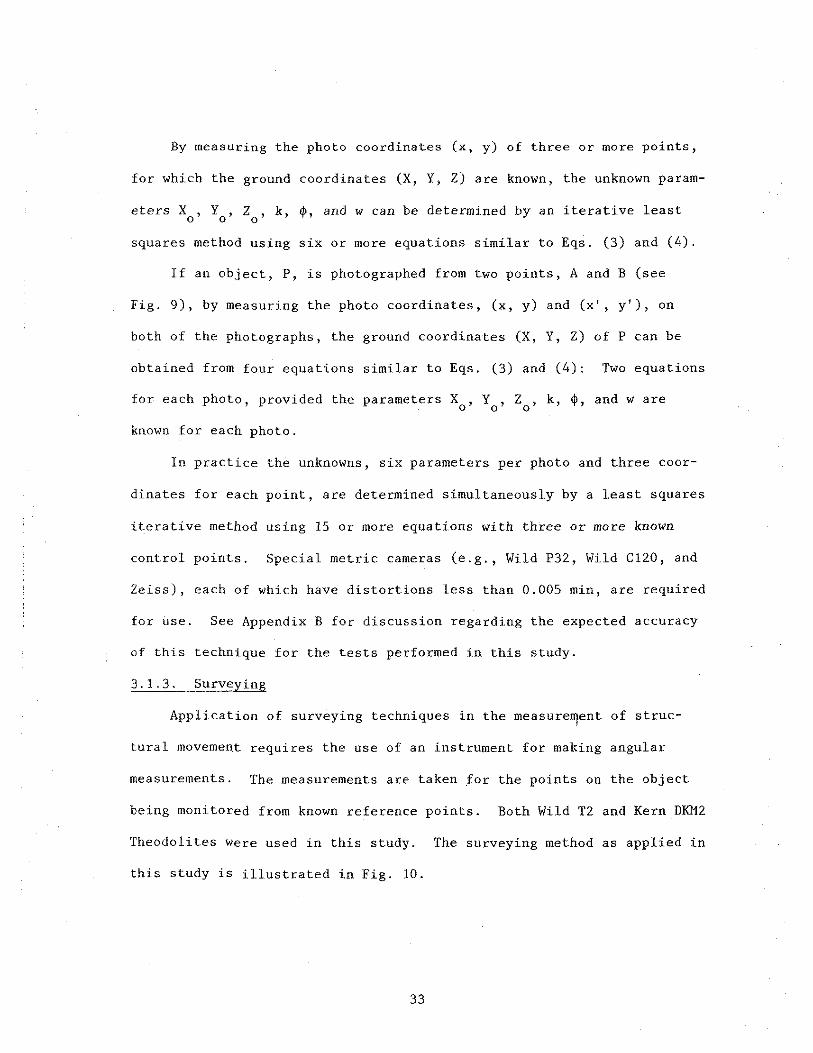
Figure 9. Plan view of a photogrammetric intersection. 34
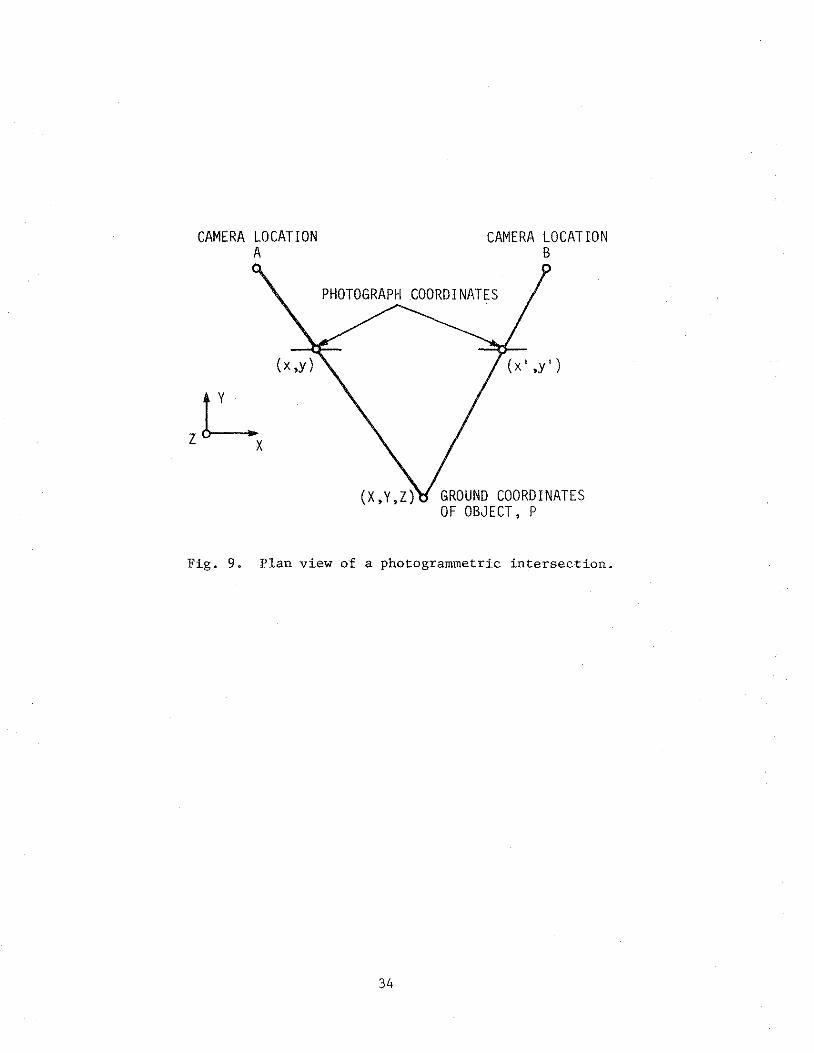
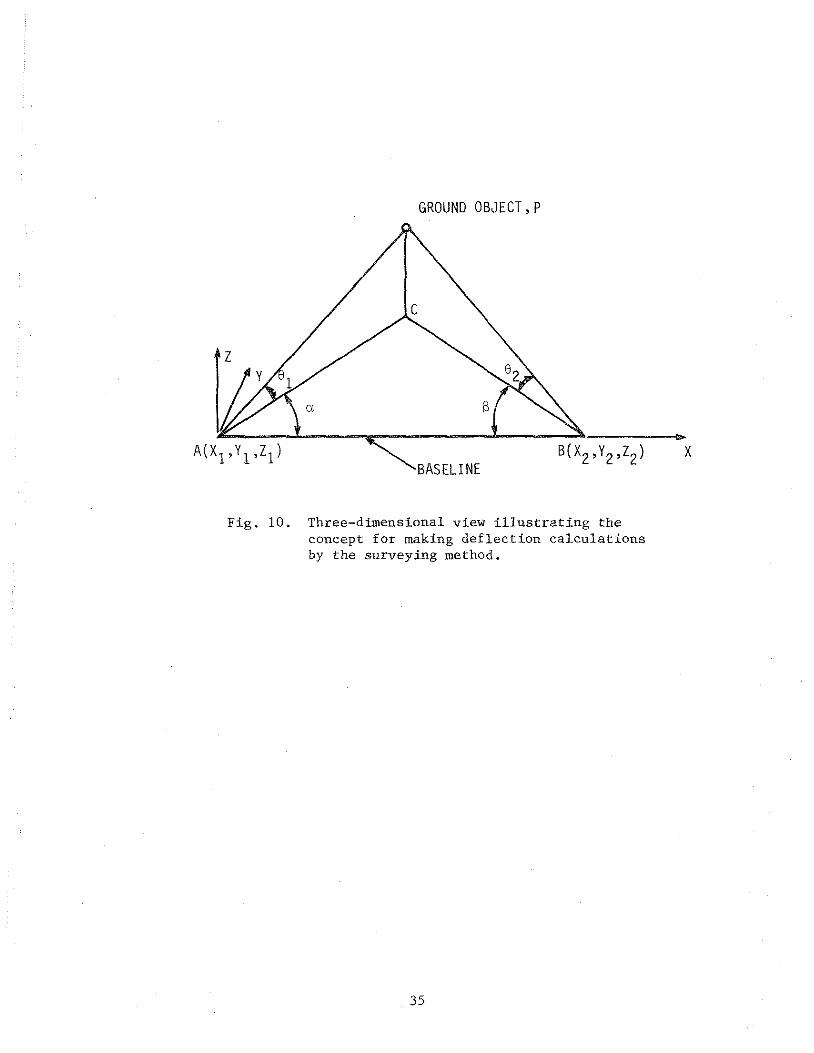
Figure 10. Three-dimensional view illustrating the concept for making deflection calculations by the surveying method. 35
Figure 11. Frame details for Column Tests 1 and 2. 38
Figure 12. Member details for Beam Tests 1' 2, and 3. 41
Figure 13. Member details for Beam Test 4. 43
Figure 14. Test setup and instrumentation for Column Tests 1 and 2. 46
Figure 15. Details and dimensions of the vertical mounting plate attachment to the column. 48
Figure 16. Baseline and test setup for photogrammetric and surveying methods. 49
v
Page 7
Figure 17. Test setup illustrating locations of column targets and laboratory wall targets. 52
Figure 18. Instrumentation setup and location for Beam Tests 1 and 2. 54
Figure 19. Details and dimensions of the vertical mounting plate attachment to the beam member. 56
Figure 20. Test setup for Beam Test 3.
Figure 21. Test setup for Beam Test 4.
Figure 22. Test layout for Beam Test 4.
Figure 23. Locations of monitored positions for Column Tests 1 and 2.
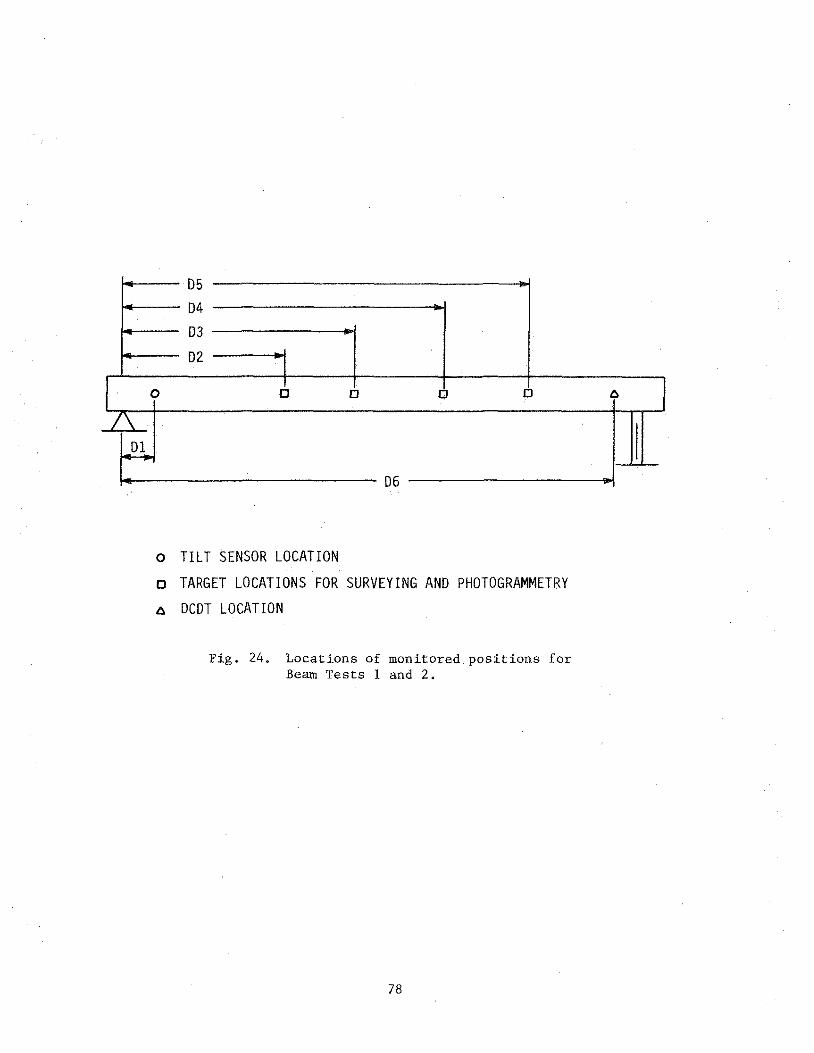
Figure 24. Locations of monitored positions for Beam Tests 1 and 2.
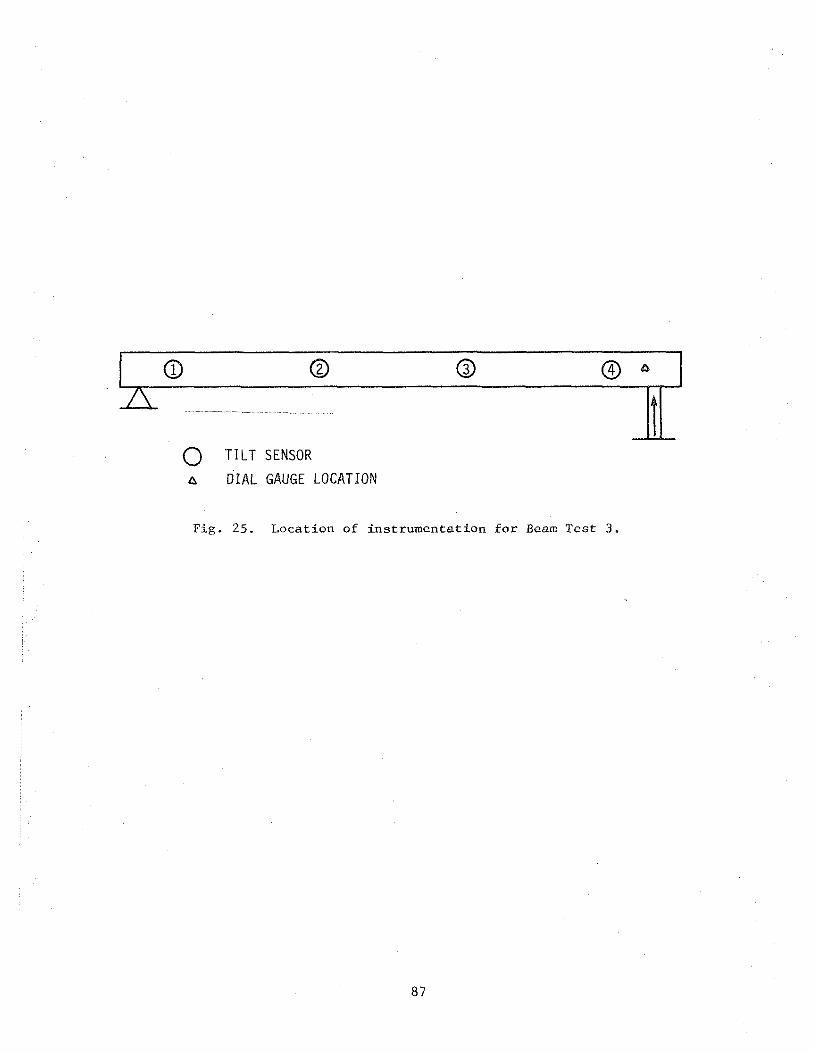
Figure 25. Location of instrumentation for Beam Test 3.
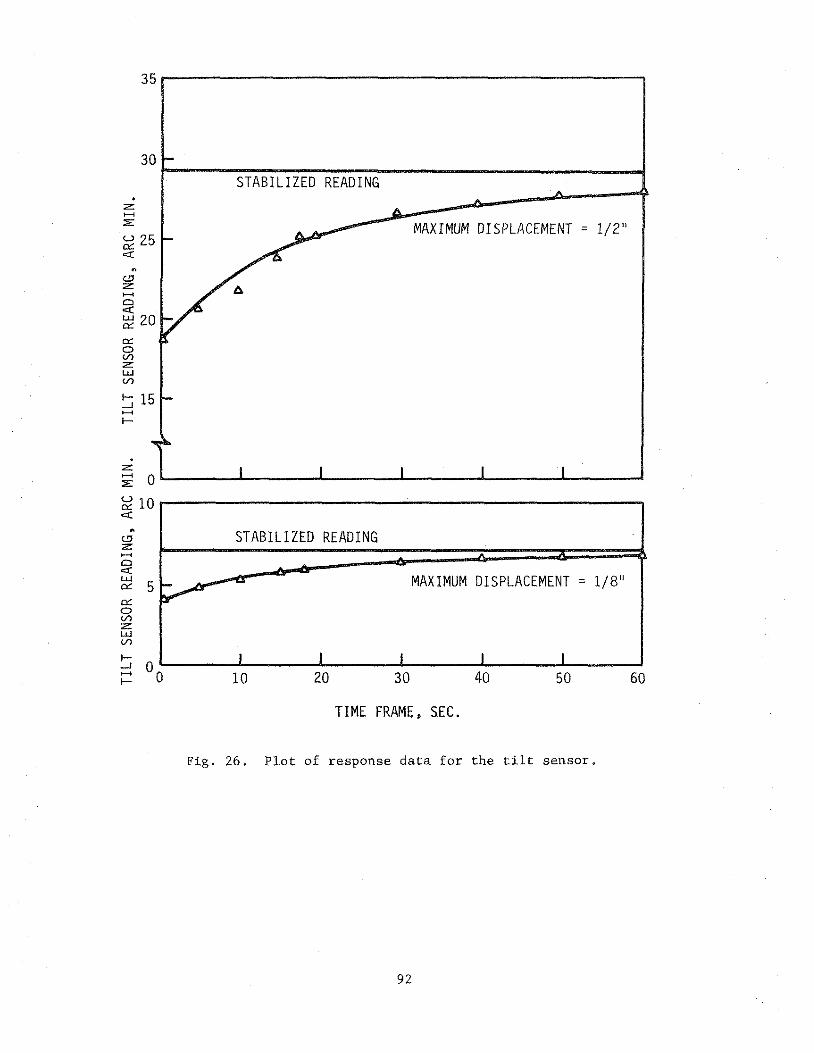
Figure 26. Plot of response data for the tilt sensor.
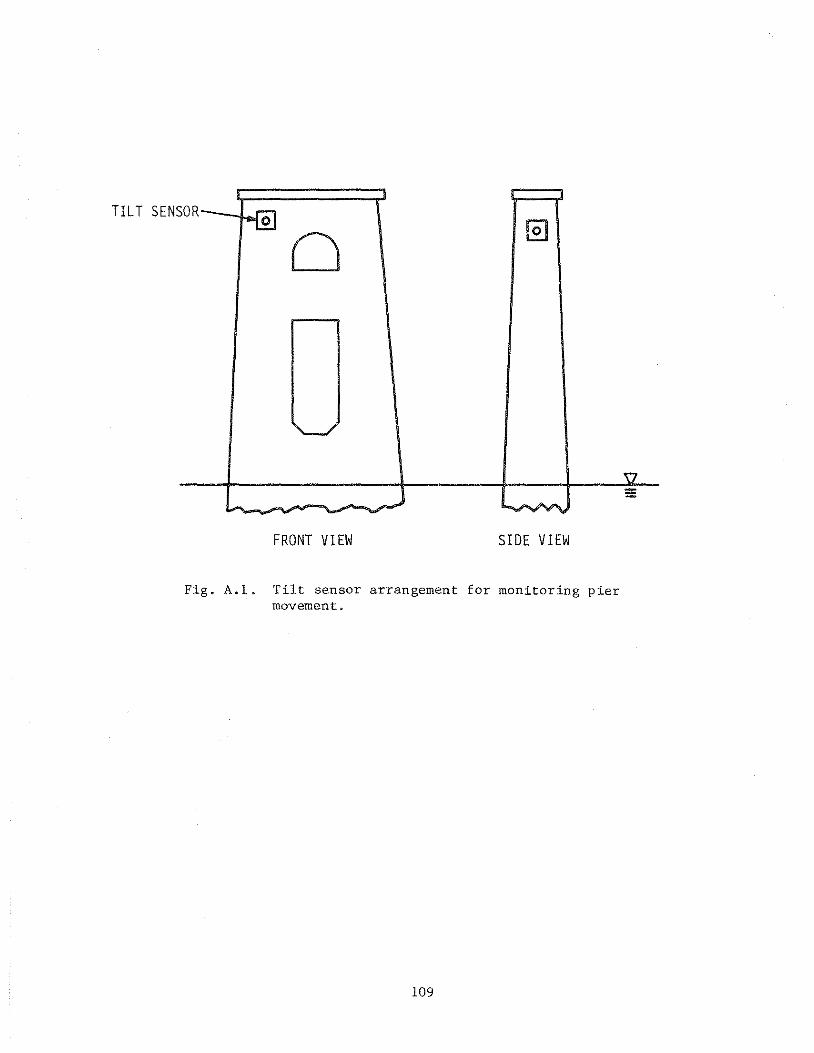
Figure A.l. Tilt sensor arrangement for monitoring pier
58
59
60
65
78
87
92
movement. 109
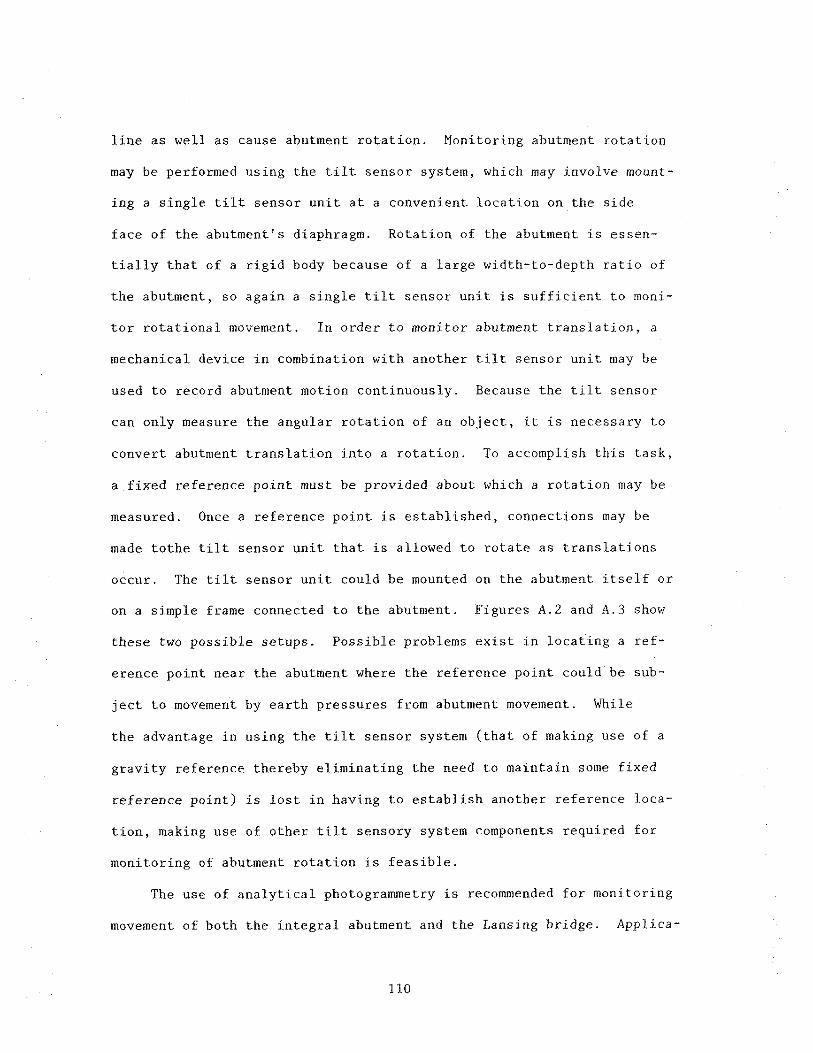
Figure A.2. Tilt sensor arrangement for monitoring abutment translation (alternative 1). 111
Figure A.3. Tilt sensor arrangement for monitoring abutment translation (alternative 2). 112
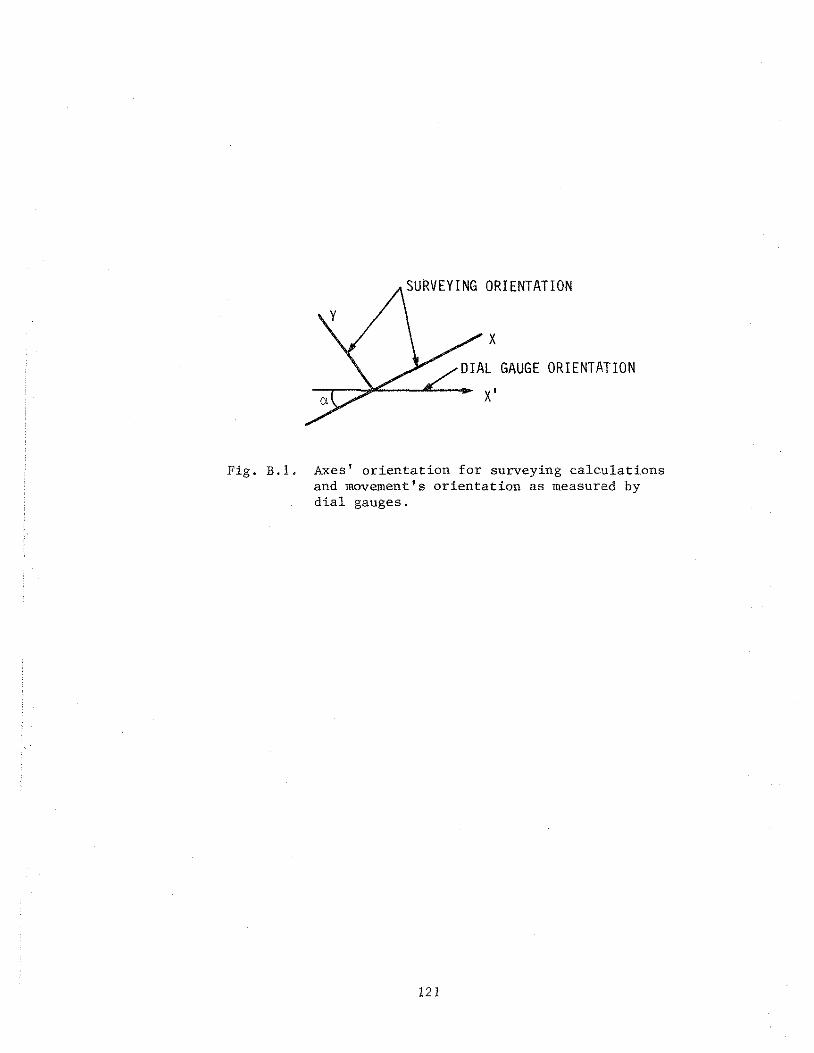
Figure B.1. Axes' orientation for surveying calculations and movement's orientation as measured by dial gauges. 121
vi
Page 8
LIST OF TABLES
Table 1. Physical properties of the cameras used in this study. 51
Table 2. Comparison of measured and calculated deflections for load cases C2 and C4 of Column Test 1. 67
Table 3. Comparison of measured and calculated deflections for load cases Cl and C3 of Column Test 1. 6B
Table 4. Comparison of measured and calculated deflections for load cases C2 and C4 of Column Test 2. 69
Table 5. Comparison of measured and calculated deflections for load cases Cl and C3 of Column Test 2. 70
Table 6. Differences in daily readings for the interim test period between Column Tests 1 and 2. 74
Table 7. Interim test data for photogrammetry and surveying collected between Column Tests 1 and 2. 76
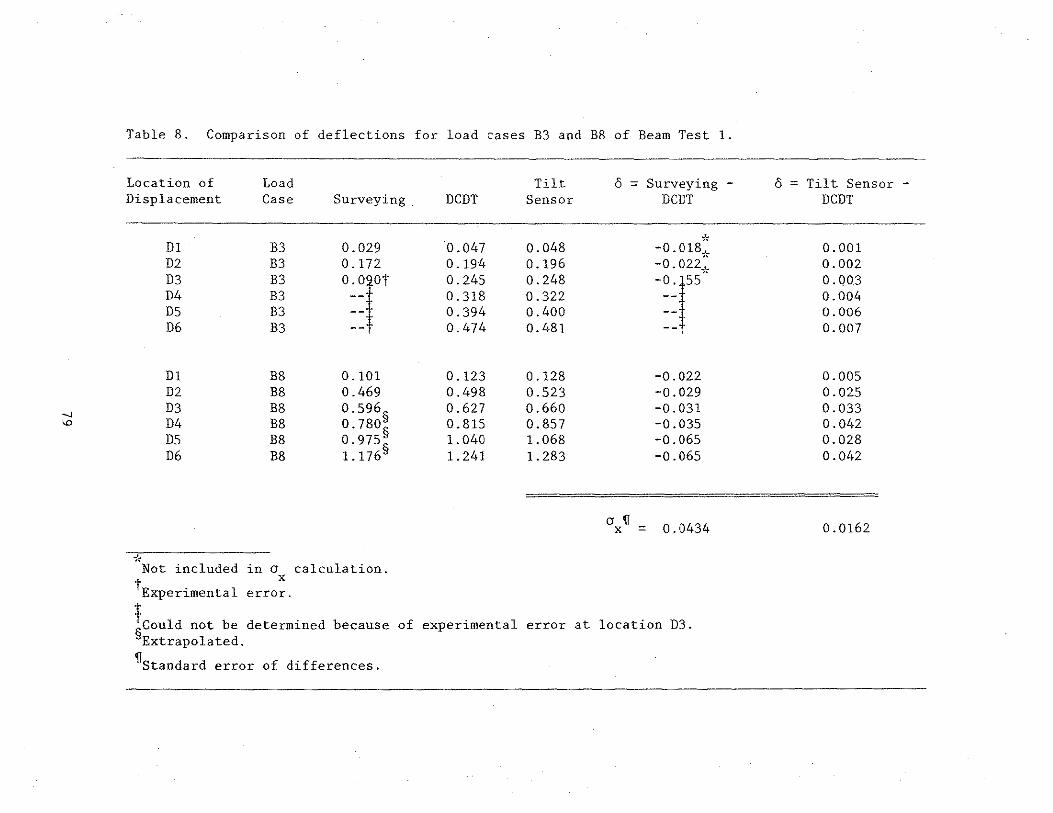
Table B. Comparison of deflections for load cases B3 and BB of Beam Test 1. 79
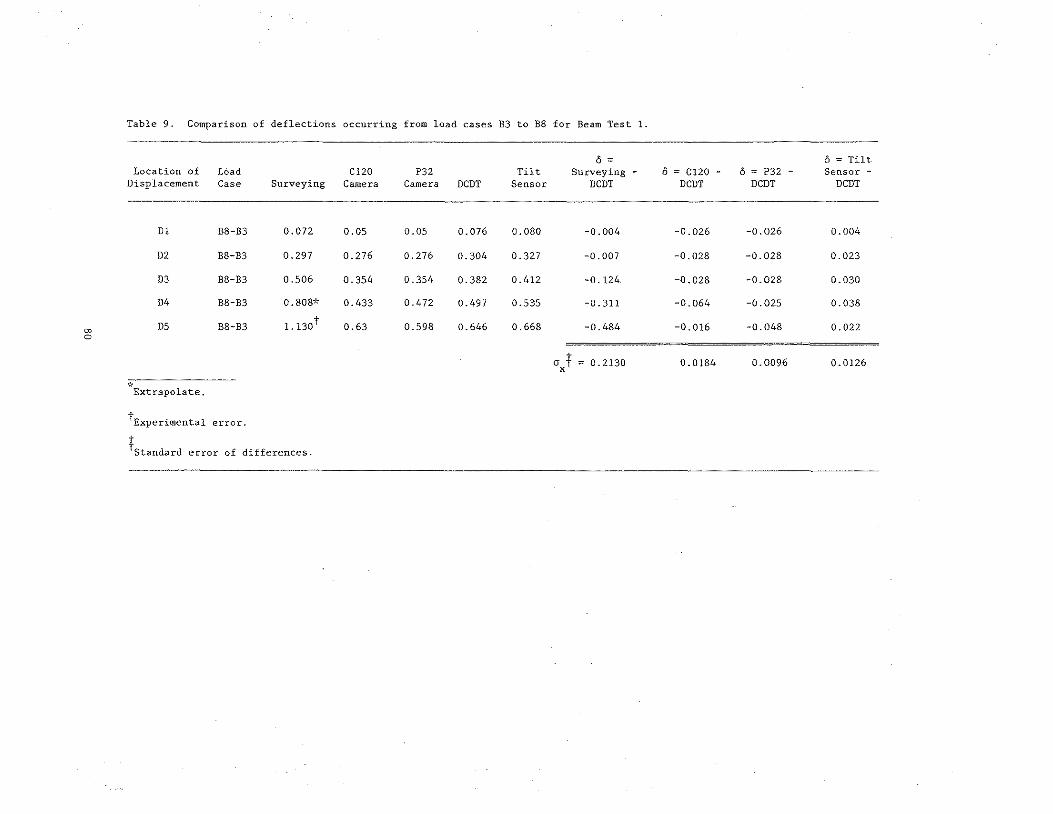
Table 9. Comparison of deflections occurring from load cases B3 to BB for Beam Test 1. BO
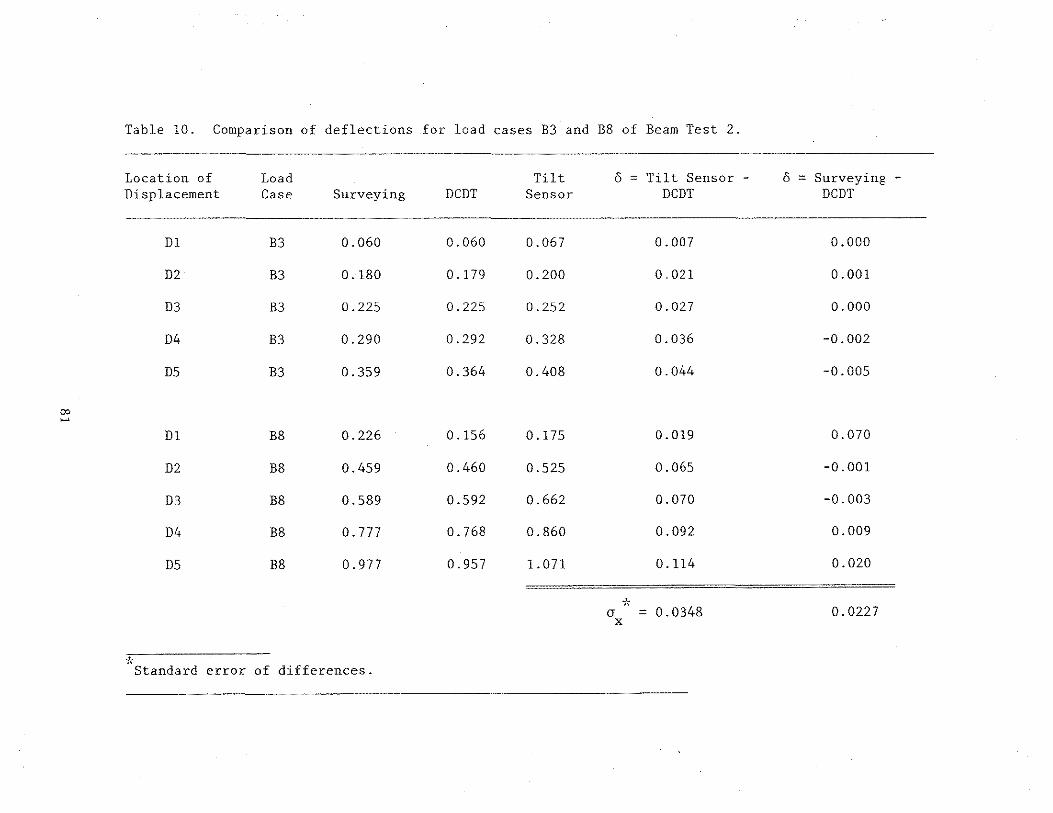
Table 10. Comparison of deflections for load cases B3 and BB of Beam Test 2.
Table 11. Comparison of deflections occurring from load cases B3 to BB for Beam Test 2.
Table 12. Angles measured by the tilt sensor for B.eam Test 1 compared to angles calculated from DCDT data.
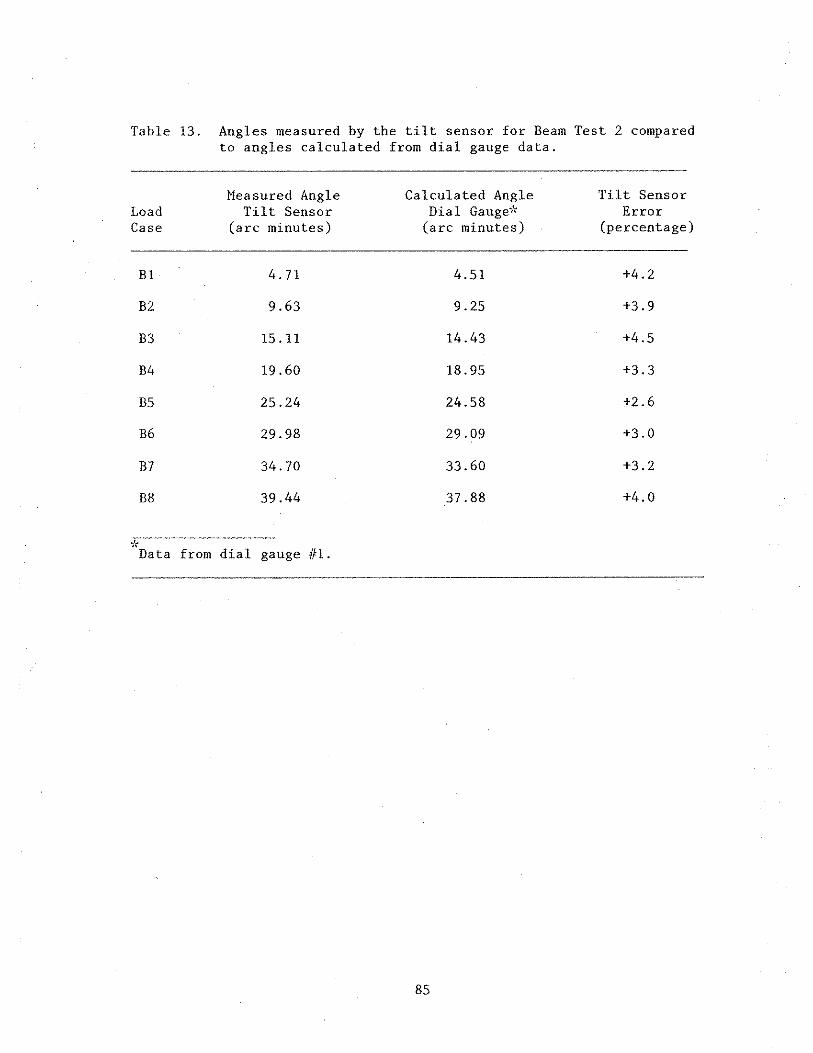
Table 13. Angles measured by the tilt sensor for Beam Test 2 compared to angles calculated from dial gauge data.
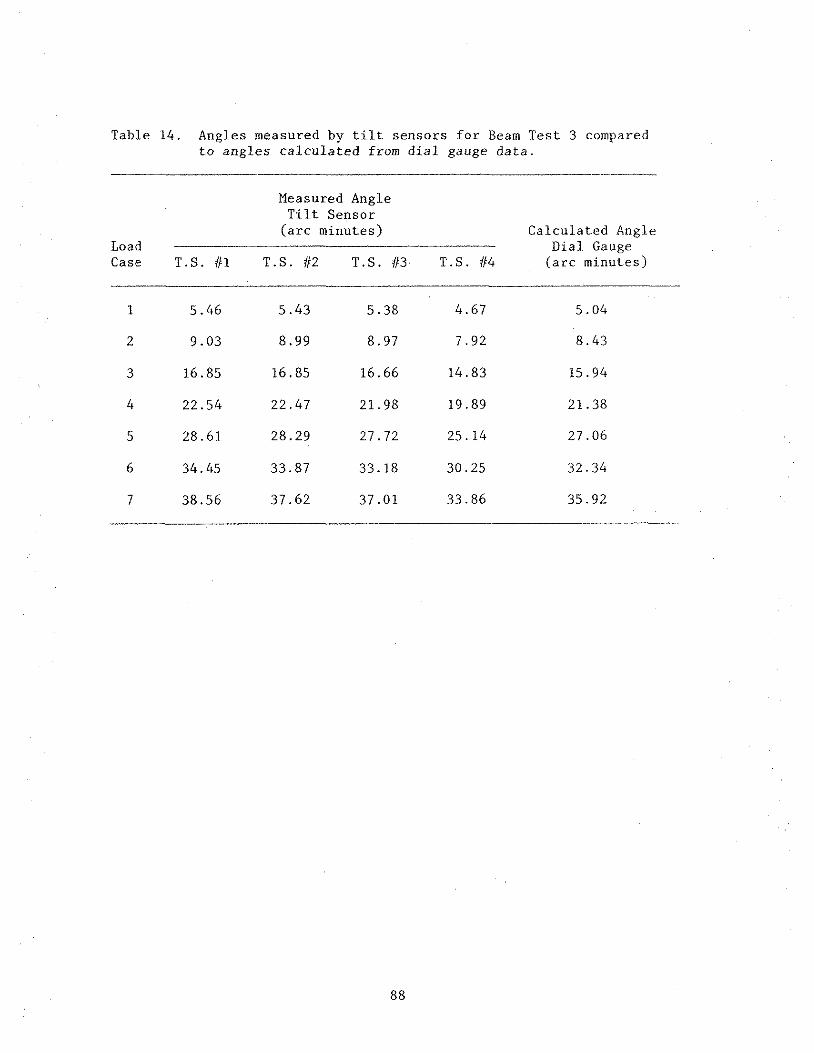
Tahle 14. Angles measured by tilt sensors for Beam Test 3
Bl
B2
84
B5
compared to angles calculated from dial gauge data. BB
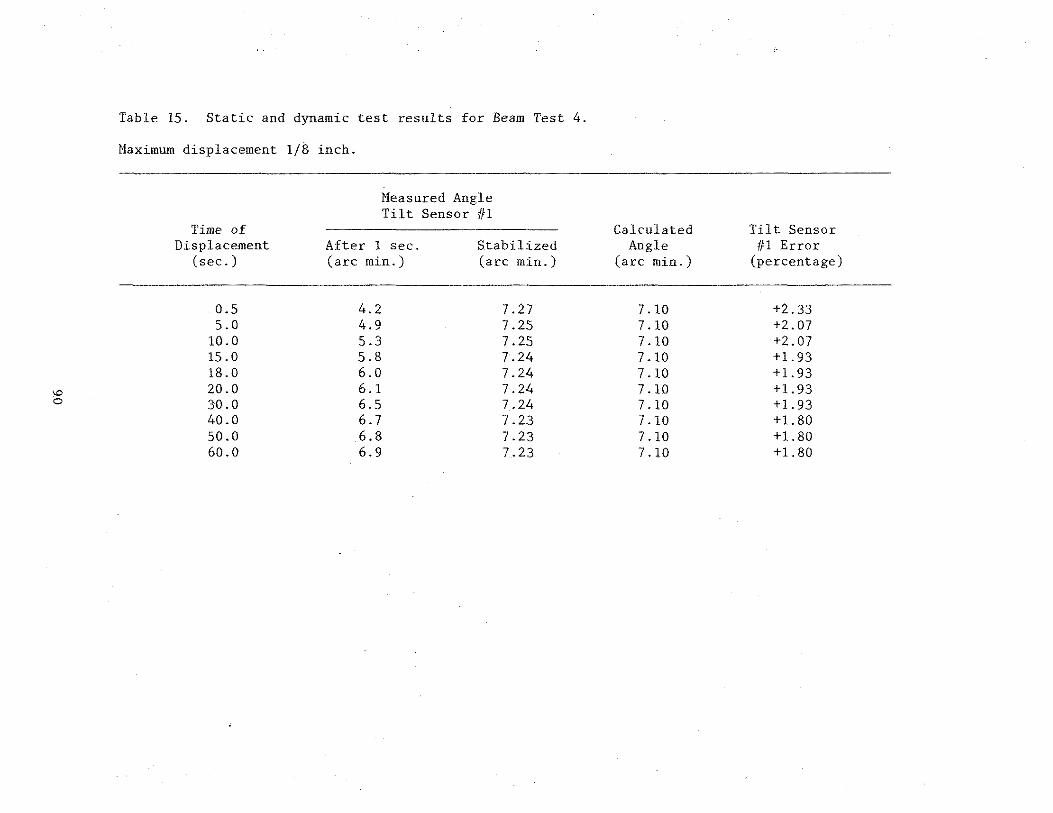
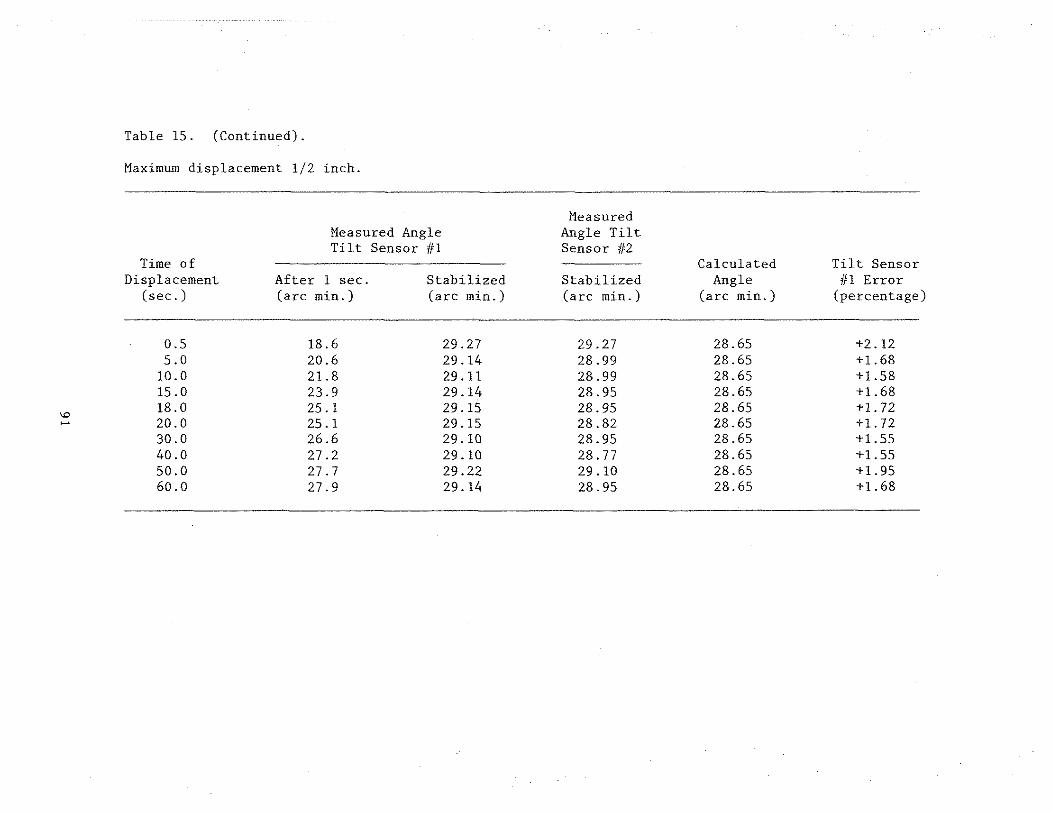
Table 15. Static and dynamic test results for Beam Test 4. 90
vii
Page 9
1. INTRODUCTION
1.1. Statement of the Problem
Structural movements may occur over relatively short or long time
periods. Directly applied loads such as traffic and wind, as well as
daily temperature fluctuations, would be classified as causes of short
term bridge movement. Although detecting these movements may not be
an easy task (as is true for obtaining any field information), it is
easier and more accurate than detecting movements classified as long
term.
Long-term movements may be caused by annual seasonal temperature
extremes, which cause thermal expansion and contraction of highway
bridges. In addition, any movement that occurs from infrequent dis
turbances or from unintentional means, such as from navigable river
traffic, could be classified as long-term movements since the time
between occurrences may be great. Bridge designers recognize the inter
action between the substructure and superstructure and have established
a range of bridge types that are suitable for specific limits of move
ment. Depending upon the bridge's span length and construction material,
the bridge's tolerance to movement without sustaining structural damage
is variable. Studies have indicated the types and magnitudes of move
ments that most frequently result in structural damage [l].
Measurement of movement associated with bridges must be known in
order to determine the effects on the structure. Finding techniques
that can accurately obtain long-term movement data is difficult. Field
applications using standard laboratory methods have severe limitations
Page 10
for various reasons. In general, a nondrifting electrical reference
point is difficult to achieve over a long time period. Harsh environ
mental conditions can also affect the accuracy of laboratory techniques.
The use of mechanical devices is hindered by the difficulty of maintain
ing a fixed reference point. Recent technological advances have made
the use of sophisticated equipment, such as the Navigational Global
Positioning System (NGPS), possible. However, the costs associated
with such systems are prohibitively large and rule out their common
use. Potential measurement systems that are both reliable and cost
effective for field use are needed.
1.2. Background
There are many cases where the need to obtain long-term struc
tural movement data exists. Each situation has to be reviewed care
fully to determine any unique problems that may exist. Two specific
applications that require attention in Iowa have been recognized and
are addressed in this study. Before attempting field applications, a
study was performed to address problems that may be associated with
field applications and to determine how reliable and accurate data can
be obtained.
A case of possible bridge movement related to impact from barge
traffic occurred at the Mississippi River Bridge in Lansing, Iowa.
Over the past few years these instances of impact have resulted in
some visible damage to the main span concrete pier. However, the mag
nitude of additional pier and bridge damage is unknown.
2
Page 11
Long-term structural movement data are also needed for the integral
abutment bridge. This type of bridge has been used for short and moder
ate spans in Iowa and has been used increasingly in other states. The
integral abutment eliminates the use of expansion devices, but in so
doing piling stresses in the abutments are induced because of displace
ments caused by temperature changes. Recent studies at Iowa State
University [2,3] have found that large lateral abutment movements can
reduce the vertical load-carrying capacity of the pile. Before a design
technique can be developed, the bridge's amount of movement due to
temperature changes needs to be quantified.
1.3. Objective and Scope
This research is the first phase of a proposed two-phase research
project. The first phase started with a literature study to determine
methods of obtaining long-term structural movement data that have prac
tical application based upon reliability and accuracy. Then the methods
were tested in the laboratory to determine both the accuracy that could
be attained and their applicability for field use. The results and
conclusions of these tests are summarized in this report. Recommenda
tions for specific applications have been made to address the proposed
second phase of this study. Methods found to be feasible in the first
phase of this project will be used in the field during the second phase.
3
Page 12
2. LITERATURE REVIEW
A literature review was made to identify methods that have practi
cal application for measurement of long-term structural movement. The
scope of the review was limited to methods that had been applied in
conditions identified as occurring over a relatively long time period.
The literature review that follows has been subdivided into three
sections: methods related to structural engineering applications,
methods related to surveying applications, and a discussion evaluating
these various methods relative to the applications outlined in this
study.
2.1. Structural Engineering Applications
Although numerous studies relating to the monitoring of structural
deformation are available, far fewer exist that are related to long-term
structural movement. Methods that involve strain gauges, displacement
transducers, dial gauges, and accelerometers (for dynamic application)
have been used. In addition, a number of methods involving innovative
use of mechanical devices have been employed.
In a study related to temperature-induced movements and stresses
in an integral abutment bridge [4], a 450-ft prestressed concrete box
beam structure in North Dakota was monitored using slope indicators
placed on the bridge piling. The indicators were attached near the
top and bottom of the piles, and they measured the slope change between
the two pile locations. Piling stresses were monitored with electrical
5
Page 13
resistance strain gauges that were protected from moisture. Measure
ments were taken monthly over a one-year period. However, unexpected
high water levels caused erratic gauge readings and made the data un
usable.
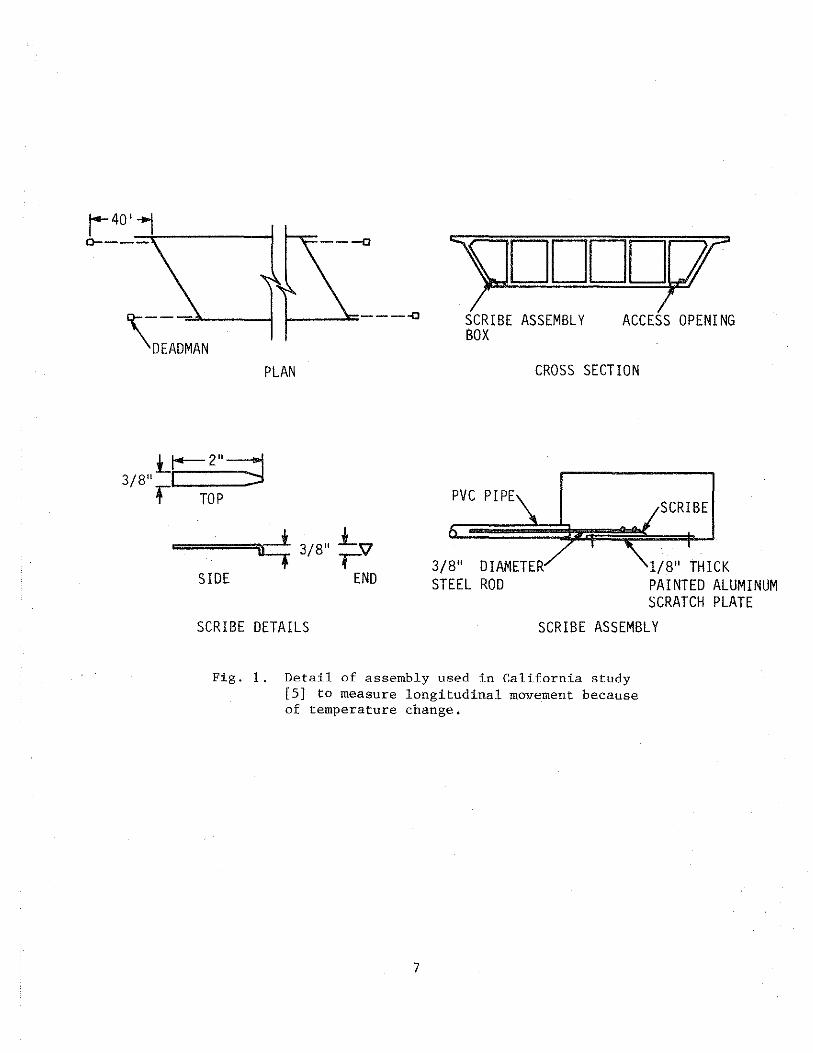
In a California study [5], the longitudinal movement of 12 con
crete box girder bridges was monitored using a scratching scribe.assembly
installed at the abutments. This technique consisted of anchoring a
steel rod approximately 40 ft behind the abutment in the approach fill.
It was believed that this distance was great enough so that there would.
be no influence from active abutment movement. The scratching scribe
assembly was attached to the other end of the rod and rested on a painted
plate located inside the box girder. The rod was enclosed in a plastic
pipe placed between the anchorage and scribe assembly. Figure 1 shows
the details of the scribe assembly. Problems with this included loose
connections and settlement of approach fills that caused deflection of
the rods and subsequent raising of the scribes off the plate.
Tilt sensor instrumentation has been utilized to monitor settlement
induced rotations of treatment plant structures. According to a report
by Cape [6], sensors were mounted on settling tank sidewalls and the
angular change was continuously monitored in able to recognize when
excessive tilt occurred. A threshold limit of the equipment was set
to activate an alarm when a desired angular change occurred. The con
tinuous monitoring feature of the sensor equipment was an essential
feature for this project. The results to date have given no indication
of problems with equipment accuracy or reliability.
6
Page 14
1----=----0
PLAN
:ll-2"=;J 3/8" I
"f TOP
===~_i 3/8" j_57 "+ r SIDE END
SCRIBE DETAILS
"')JDDDD10'"
SCRIBE ASSEMBLY ACCESS OPENING BOX
CROSS SECTION
PVC PIPE
3/8" DIAMETER STEEL ROD
SCRIBE
1/8" THICK PAINTED ALUMINUM SCRATCH PLATE
SCRIBE ASSEMBLY
Fig. 1. Detail of assembly used in California study [SJ to measure longitudinal movement because of temperature change.
7
Page 15
Tilt sensing equipment was used to monitor long-term movements in
a study of the Zilwaukee Bridge in Michigan [7]. Sensors were placed
on the superstructure, on the bottom of one column, and two sensors
were located at right angles to each other at the top of the column.
The two sensors on the column top allowed monitoring of both longitudinal
and transverse movement. Continuous monitoring took place, and a n1ajor
data logging system was used to record the sensor data. Temperature
induced movements were recorded by the sensors, but since no temperature
data were recorded, only qualitative checks of temperature versus time
was used to verify this was the source of the movement. One conclusion
of this study was that structural movement can be monitored to a high
degree of accuracy using tilt sensing instrumentation. The system
data compared closely with data obtained from mechanical measuring
devices.
A study by Clarke and Jewell [8] involved monitoring a reinforced
concrete reservoir using a number of different types of instrumentation.
The reservoir was monitored during construction and periodically over
a two-year service period. Both mechanical and vibrating-wire strain
gauges were used to measure strains in the concrete. Modified labora
tory dial gauges along with surveying levels were used to measure deflec
tion. Conclusions related to the instrumentation were that the measured
strains were strongly influenced by humidity changes. From this study
the vibrating-wire gauge appears to be a very accurate method for making
measurements, but it is sensitive to temperature. It is therefore
necessary to measure the gauge temperature accurately. With regard to
measured deflections, it was noted that fixed instrumentation was more
8
Page 16
stable than equipment that was demounted and re-set for each stage of
monitoring, as was done with the levels and dial gauges. In general,
the accuracy of the instrumentation was such that the results of the
tests were questionable.
Over a one-year period Hoffman et al. [9] obtained deflection
data on box beams using dial gauges in a study that was performed to
address a temperature problem in a prestressed box-girder bridge.
Temperature readings were also taken using thermocouples, and the data
were correlated with deflection data to give an indication of temperature
effects. The deflection data were reduced to obtain curvatures along
the beams in order to determine temperature distribution behavior.
The dial gauge data were taken on a daily basis with the gauges initi
alized at the beginning of each day. Since the gauges were reiniti
alized daily, no information related to long-term accuracy is available.
A study by Shiu [10] also attempted to determine seasonal and
diurnal behavior of concrete box-girder bridges by obtaining longitudinal
strain data and deflections. Readings were taken seasonally for a
period of five years. In addition, four sets of 24-hour continuous
readings were taken to monitor diurnal bridge behavior in the different
seasons. No information regarding the accuracy of these methods is
available.
For a period of six to nine months Burdette and Goodpasture [11]
gathered data on temperature, strain, and abutment movement for a con
tinuous, prestressed, concrete box structure with a total length of
2,700 ft. The bridge was made up of 29 spans, and the only provisions
made for expansion were at the abutments. Continuous strain data were
9
Page 17
obtained from weldable strain gauges that were monitored by a Carlson
Strain Meter. Longitudinal deflections were obtained using Stevens'
Type F (Model 68) water level recorders that were adapted for use in
measuring the relative movement between the abutment and selected girders.
The recorder provided a continuous record of water level versus time,
which was translated into longitudinal movement of the bridge deck.
Thermocouples were also installed at various locations to obtain contin
uous temperature data. However, the only consistent information obtained
throughout the entire testing procedure were the data related to abutment
movement obtained from the Stevens' recordings. The electrical storms
that damaged electrical equipment caused the data obtained by the strain
gauges and thermocouples to be unreliable. Strain data were obtained
manually after the storms until several gauges unexplicably quit working
then all collection of data was terminated.
In a study by Nicu et al. [12], a pile-supported abutment bridge
was instrumented to permit deflection measurements to be made. The
piles were monitored for approximately nine months during the bridge's
construction. A number of techniques were used to determine abutment
movement. One method required modifying the piles by welding pipes to
them. The pipes served as protection for the instrumentation used to
monitor changes in angle of the pile. Aluminum casings were installed
inside the pipes and were used with slope inclinometers to determine
pile deflections. The piles also were instrumented with strain gauges
that were placed just below the pile cap. In addition, several points
on the abutments were monitored by surveying methods using a triangula
tion process. Nicu's study indicated that the strain data obtained
10
Page 18
were reliable and consistent with the observed behavior of the bridge.
The inclinometer gave reasonable results that were in qualitative agree
ment with strain data. It was noted, however, that by comparison to
strain data, the deflection readings were low. Perhaps the discrepency
was due to yielding and the possible loss of the sand filling the annular
space between the inclinometer guide casing and the protective steel
pipe. The surveying results were unusable because permanent monuments
used to gain control were accidentally disturbed.
2.2. Surveying Applications
Surveying applications of bridge movement utilize equipment and
techniques generally associated with surveying. This may include
measurement by steel tape, level instruments, transits or theodolites,
electronic distance measuring (EDM) devices, and photogrammetry tech
niques.
In the North Dakota study mentioned earlier [4], surveying tech
niques were also used to monitor bridge movement. A steel tape was
placed between two permanent markers, and temperatures were taken in
order to make corrections. A level was also used to obtain vertical
movement data. A level circuit was run nearby to serve as a control.
Because the magnitudes of the movements were so small, the data which
were obtained were questionable.
Surveying techniques were employed in a study by Hilton [13] using
a Wild N-III level and thermocouples to monitor temperature. In the
study, long-term camber loss was monitored in the bridges heat-curved
11
Page 19
girders. The level was mounted on a trivet set in stationary bronze
lugs on top of a pier cap. Specially designed scales were installed
at various girder locations and were adjusted vertically to intersect
the level line of sight. There was excellent agreement between the
measured and theoretical dead load girder deflection. Also, at a number
of monitored locations, the measured thermal deflections were reasonably
close to those calculated.
In 1979, the U.S. Army Corps of Engineers undertook a project to
determine the practical and economical potential of using analytical
photogrammetry for monitoring structural deformation [14]. The metho
dology consisted of photographing suspect movement areas at regular
intervals and measuring the coordinates of targets. The relative dis
placement of these targets were then determined by a computation process.
A modified Wild BC-4 ballastic camera was used to take the 100% overlap
convergent photographs from three to five camera stations. The orienta
tion angles of the photographs were measured by a Wild T4 theodolite
and by a striding level. A Wild A-7 autograph was used as a monocom
parator to measure the photo coordinates. One conclusion of the study
was that for field investigation the base error should not exceed
±0.0lm.
Close-range photogrammetry was used to monitor bridge deflection
in a study by Bales [15]. Before monitoring bridges in the field, a
laboratory test was performed on a test beam. Deflection was measured
from metric camera photographs by use of a comparator and was compared
to manually obtained measurements. A number of bridges were then moni
tored using the photogrammetry technique, as well as a leveling pro-
12
Page 20
cedure, to determine vertical deformations of the girders. Although
Bales' study did not consider effects or possible problems associated
with long-term measurements, the study concluded that the photogrammetry
technique has promise for measuring structural movement. However, the
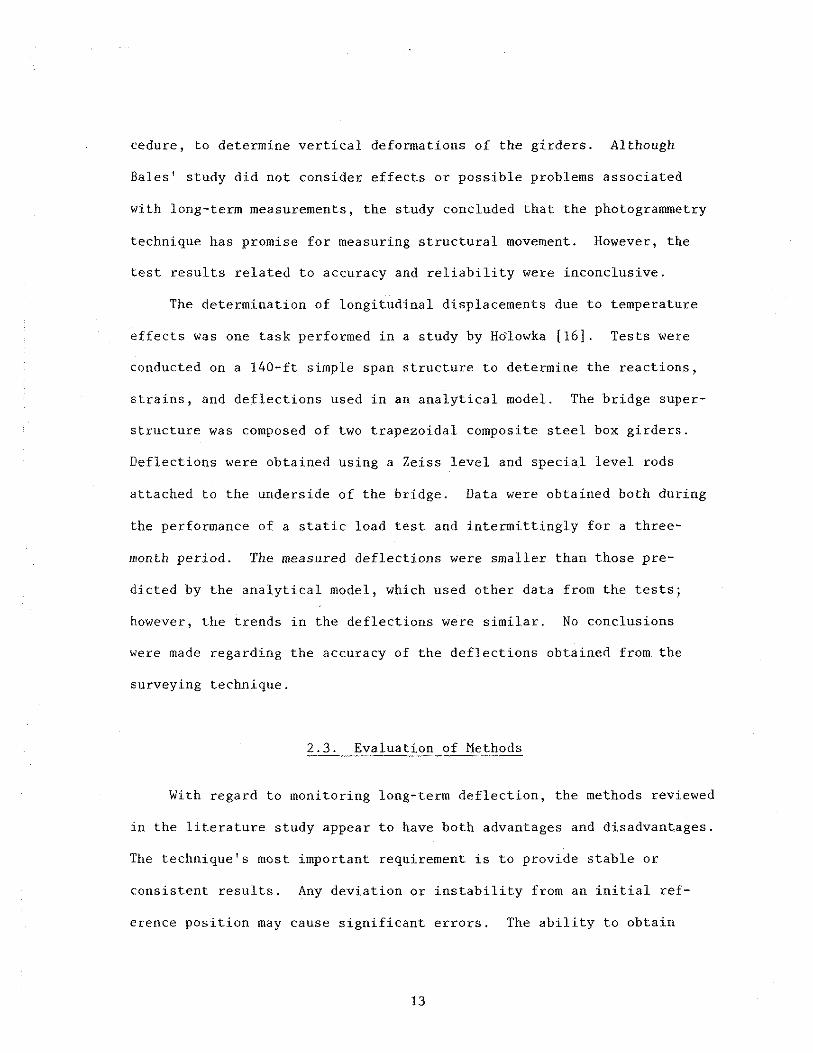
test results related to accuracy and reliability were inconclusive.
The determination of longitudinal displacements due to temperature
effects was one task performed in a study by Hdlowka [16]. Tests were
conducted on a 140-ft simple span structure to determine the reactions,
strains, and deflections used in an analytical model. The bridge super
structure was composed of two trapezoidal composite steel box girders.
Deflections were obtained using a Zeiss level and special level rods
attached to the underside of the bridge. Data were obtained both during
the performance of a static load test and intermittingly for a three
month period. The measured deflections were smaller than those pre
dicted by the analytical model, which used other data from the tests;
however, the trends in the deflections were similar. No conclusions
were made regarding the accuracy of the deflections obtained from the
surveying technique.
2.3. Evaluation of Methods
With regard to monitoring long-term deflection, the methods reviewed
in the literature study appear to have both advantages and disadvantages.
The technique's most important requirement is to provide stable or
consistent results. Any deviation or instability from an initial ref
erence position may cause significant errors. The ability to obtain
13
Page 21
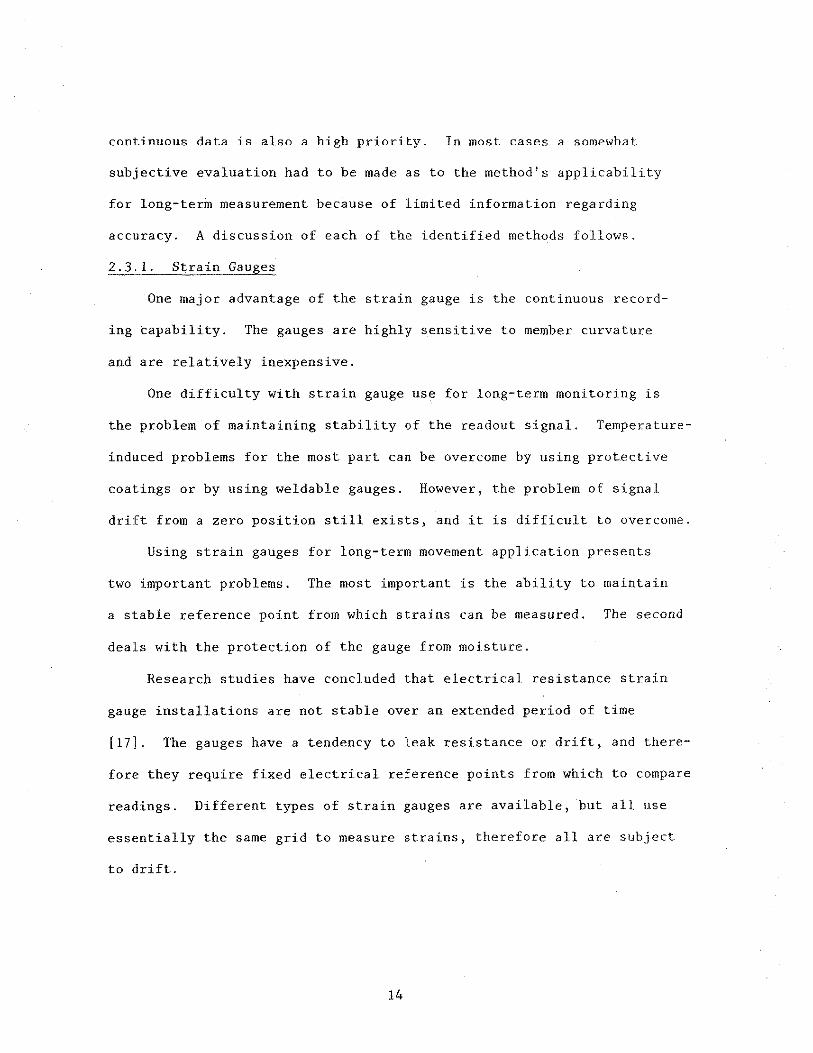
continuous data is also a high priority. In most cases a somewhat
subjective evaluation had to be made as to the method's applicability
for long-term measurement because of limited information regarding
accuracy. A discussion of each of the identified methods follows.
2.3.1. Strain Gauges
One major advantage of the strain gauge is the continuous record
ing capability. The gauges are highly sensitive to member curvature
and are relatively inexpensive.
One difficulty with strain gauge use for long-term monitoring is
the problem of maintaining stability of the readout signal. Temperature
induced problems for the most part can be overcome by using protective
coatings or by using weldable gauges. However, the problem of signal
drift from a zero position still exists, and it is difficult to overcome.
Using strain gauges for long-term movement application presents
two important problems. The most important is the ability to maintain
a stable reference point from which strains can be measured. The second
deals with the protection of the gauge from moisture.
Research studies have concluded that electrical resistance strain
gauge installations are not stable over an extended period of time
[17]. The gauges have a tendency to leak resistance or drift, and there
fore they require fixed electrical reference points from which to compare
readings. Different types of strain gauges are available, but all use
essentially the same grid to measure strains, therefore all are subject
to drift.
14
Page 22
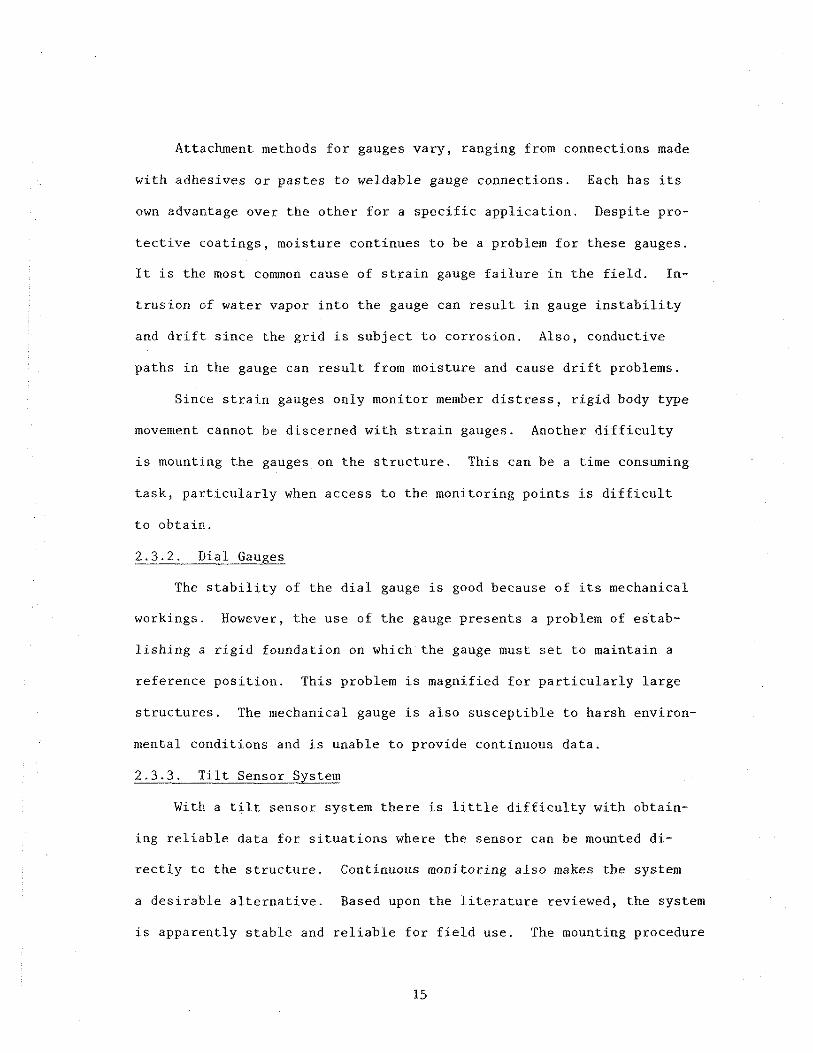
Attachment methods for gauges vary, ranging from connections made
with adhesives or pastes to weldable gauge connections. Each has its
own advantage over the other for a specific application. Despite pro
tective coatings, moisture continues to be a problem for these gauges.
It is the most common cause of strain gauge failure in the field. In
trusion of water vapor into the gauge can result in gauge instability
and drift since the grid is subject to corrosion. Also, conductive
paths in the gauge can result from moisture and cause drift problems.
Since strain gauges only monitor member distress, rigid body type
movement cannot be discerned with strain gauges. Another difficulty
is mounting the gauges on the structure. This can be a time consuming
task, particularly when access to the monitoring points is difficult
to obtain.
2.3.2. Dial Gauges
The stability of the dial gauge is good because of its mechanical
workings. However, the use of the gauge presents a problem of estab
lishing a rigid foundation on which the gauge must set to maintain a
reference position. This problem is magnified for particularly large
structures. The mechanical gauge is also susceptible to harsh environ
mental conditions and is unable to provide continuous data.
2.3.3. Tilt Sensor System
With a tilt sensor system there is little difficulty with obtain
ing reliable data for situations where the sensor can be mounted di
rectly to the structure. Continuous monitoring also makes the system
a desirable alternative. Based upon the literature reviewed, the system
is apparently stable and reliable for field use. The mounting procedure
15
Page 23
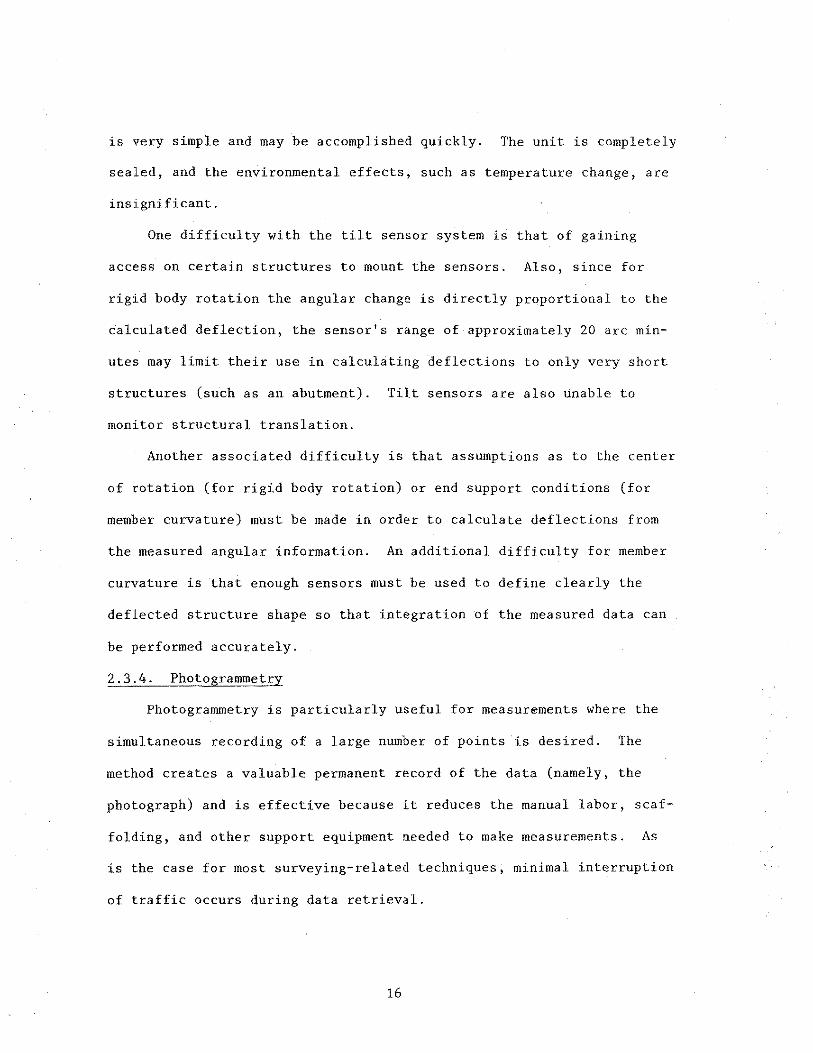
is very simple and may be accomplished quickly. The unit is completely
sealed, and the environmental effects, such as temperature change, are
insignificant.
One difficulty with the tilt sensor system is that of gaining
access on certain structures to mount the sensors. Also, since for
rigid body rotation the angular change is directly proportional to the
calculated deflection, the sensor's range of approximately 20 arc min
utes may limit their use in calculating deflections to only very short
structures (such as an abutment). Tilt sensors are also unable to
monitor structural translation.
Another associated difficulty is that assumptions as to the center
of rotation (for rigid body rotation) or end support conditions (for
member curvature) must be made in order to calculate deflections from
the measured angular information. An additional difficulty for member
curvature is that enough sensors must be used to define clearly the
deflected structure shape so that integration of the measured data can
be performed accurately.
2.3.4. Photogrammetry
Photogrammetry is particularly useful for measurements where the
simultaneous recording of a large number of points is desired. The
method creates a valuable permanent record of the data (namely, the
photograph) and is effective because it reduces the manual labor, scaf
folding, and other support equipment needed to make measurements. As
is the case for most surveying-related techniques, minimal interruption
of traffic occurs during data retrieval.
16
Page 24
Disadvantages of the technique include its requirement for good
lighting conditions and the inability to do continuous monitoring.
Photogrammetry depends on gaining and maintaining vertical and hori
zontal control of the area to be measured and is therefore directly
dependent on the surveying methods used to gain that control. The
control is particularly important when the cameras are reset on control
locations.
2.3.5. Surveying
According to the literature studies investigated, apparently reli
able results have been obtained using surveying techniques. As in
photogranunetry, interruption to traffic is minimal, and little support
equipment is needed. However, continuous monitoring is possible, and
there is a chance of human error occurring in the recording and observing
of the data. The time required to make the measurements is relatively
large, which certainly may affect the accuracy. The accuracy is also
greatly dependent upon gaining and maintaining horizontal and vertical
control.
2.3.6. Mechanical Methods
In the literature review some innovative methods were identified
that will be defined as mechanical methods. Other variations other
than those found could also be possible. These methods may be classi
fied as a combination or variation of surveying and structural instru
mentation type techniques that may require construction of a mechanical
type device. The application of the device or method of making measure
ments most likely employs the surveying and/or structural instrumentation
principles. One major advantage of this method is that it is designed
17
Page 25
for a specific application and therefore is well suited to obtain the
data in an effective manner.
One general difficulty with this method is that components making
up the device may fail to function properly. The more degrees of free
dom associated with the device, the greater the likelihood of error.
Subsequently it is difficult to obtain data that are consistent and
reliable. Maintaining a stable reference point from which data must
be obtained is another problem.
A number of measuring techniques for monitoring long-term struc
tural movement exist, each with advantages and disadvantages. Since
the discussions have been kept very general, no one method stands out
as the best solution for obtaining accurate data for any condition
that may be encountered. In order to select the best method for a
field application, the type of information that is needed must be iden
tified. This study is concerned with two applications that have been
mentioned earlier: the determination of possible pier movement due to
accidental barge impact (Mississippi River Bridge in Lansing, Iowa)
and the determination of overall longitudinal movement of integral
abutment bridges due to temperature differences. Based on these appli
cations, measurement methods have been selected for further laboratory
investigation. These methods are:
e tilt sensing system
e photogrammetry
e surveying
Additional laboratory information regarding accuracy, ease of use, and
reliability has been examined to learn more about what to expect in field
18
Page 26
application. Appendix A discussed specific applications that have been
made.
19
Page 27
3. DESCRIPTION OF TESTS
3.1. General Testing Program
The laboratory investigation consisted of tests performed on both
a vertical column and horizontal beam members. The intent of the tests
were to determine the accuracy and reliability of various methods for
making typical structural measurements. The column test was devised
to create a condition of significant member curvature to allow a number
of locations along the member to be monitored. Rigid body rotation
was also desired, and the beam tests were designed to allow this.
A number of techniques, including those identified for possible
field application, were used to monitor movements of the column. The
methods included dial gauges, DCDTs, electrical resistance strain
gauges, and tilt sensing devices. In addition, surveying and photogram-
rnet.ric Lecl1uiques were en1ploye<l. The .:I-' , U..li.:1..L gauge data ar1d DCDT data
served as the reference by which all other methods were compared.
In the beam tests, rigid body rotation was monitored by the tech-
niques used in the column tests, excluding the strain gauges. The
beam was not subjected to any significant external loading (only beam
dead load and tilt sensor weight) and member curvature was therefore
minimized to the point where only rigid body rotation was assumed to
contribute to the deflections. As in the column tests, a displacement
gauge served as the reference for the actual beam movement.
Two tests involving both the beam and the column were conducted
and will be referred to as Beam Tests 1 and 2 and Column Tests 1 and
2, respectively. These tests were performed at one-week intervals in
21
Page 28
order to determine the repeatability of the various measuring techniques.
Two additional tests, referred to as Beam Tests 3 and 4, were performed
to obtain additional information about the capabilities of the tilt
sensing system.
A brief description of the methods used for measuring structural
movements of the test members is provided below.
Dial gauges Standard laboratory mechanical dial gauges were used
that consisted of a spring-loaded sliding arm and dial face.
Using these gauges, measurements are accurate to the nearest
0.001 in.
Direct Current Displacement Transducers (DCDT) They operate much
like the mechanical dial gauge in that movement is monitored
through use of a sliding arm. As the arm is displaced, an elec
trical resistance signal is sent to and processed by a computerized
data acquisition system (DAS). A direct readout is possible to
the nearest 0.001 in.
Electrical Resistance Strain Gauges These devices are standard
laboratory strain gauges used for steel members. A resistance is
measured by a DAS or standard strain indicator box and strains,
which are accurate to the nearest 10-9 in./in. may be obtained.
These devices were not studied for possible field applications
but were used only to obtain additional laboratory data by which other
methods could be evaluated. The methods that were determined to have
practical field application and were subsequently studied are briefly
discussed below.
22
Page 29
3.1.1. Tilt Sensing System
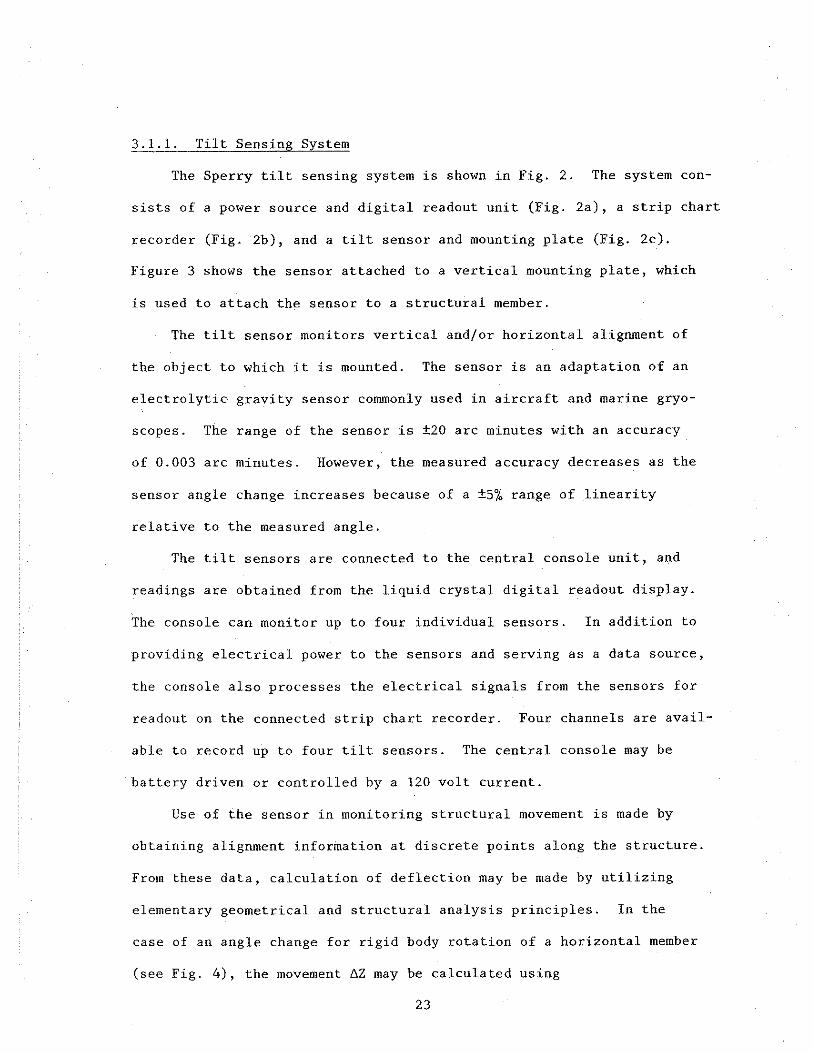
The Sperry tilt sensing system is shown in Fig. 2. The system con
sists of a power source and digital readout unit (Fig. 2a), a strip chart
recorder (Fig. 2b), and a tilt sensor and mounting plate (Fig. 2c).
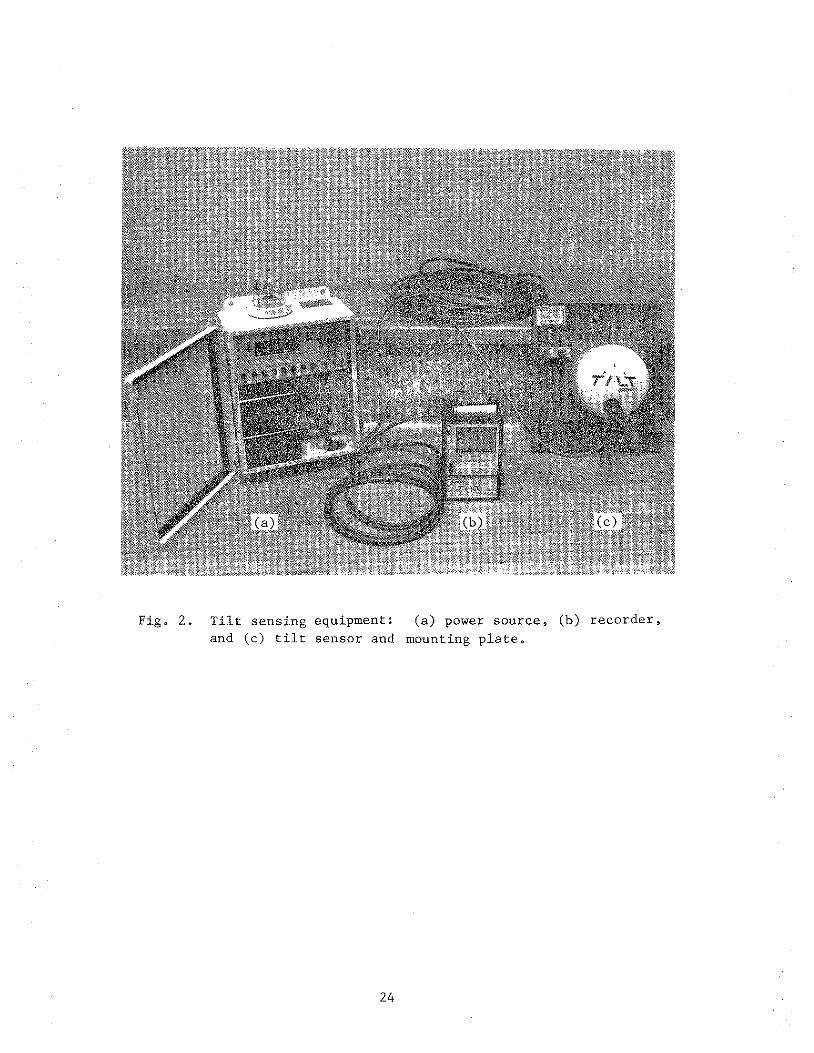
Figure 3 shows the sensor attached to a vertical mounting plate, which
is used to attach the sensor to a structural member.
The tilt sensor monitors vertical and/or horizontal alignment of
the object to which it is mounted. The sensor is an adaptation of an
electrolytic gravity sensor commonly used in aircraft and marine gryo
scopes. The range of the sensor is ±20 arc minutes with an accuracy
of 0.003 arc minutes. However, the measured accuracy decreases as the
sensor angle change increases because of a ±5% range of linearity
relative to the measured angle.
The tilt sensors are connected to the central console unit, and
readings are obtained from the liquid crystal digital readout display.
The console can monitor up to four individual sensors. In addition to
providing electrical power to the sensors and serving as a data source,
the console also processes the electrical signals from the sensors for
readout on the connected strip chart recorder. Four channels are avail
able to record up to four tilt sensors. The central console may be
battery driven or controlled by a 120 volt current.
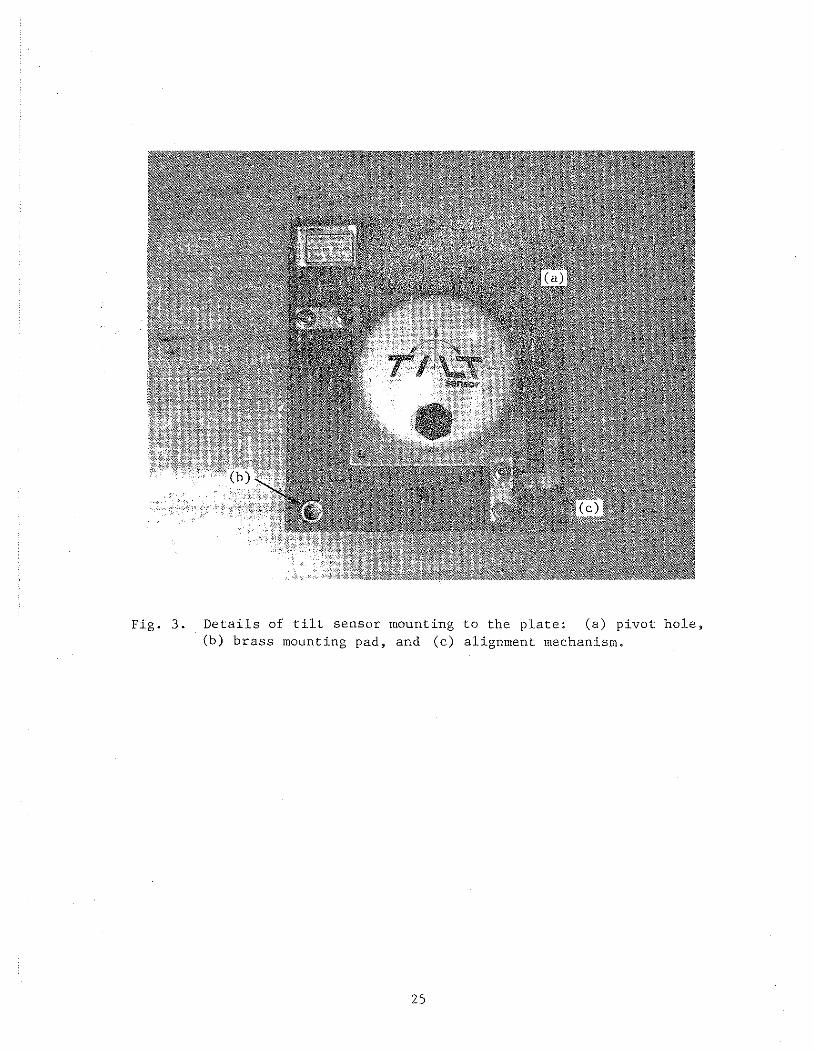
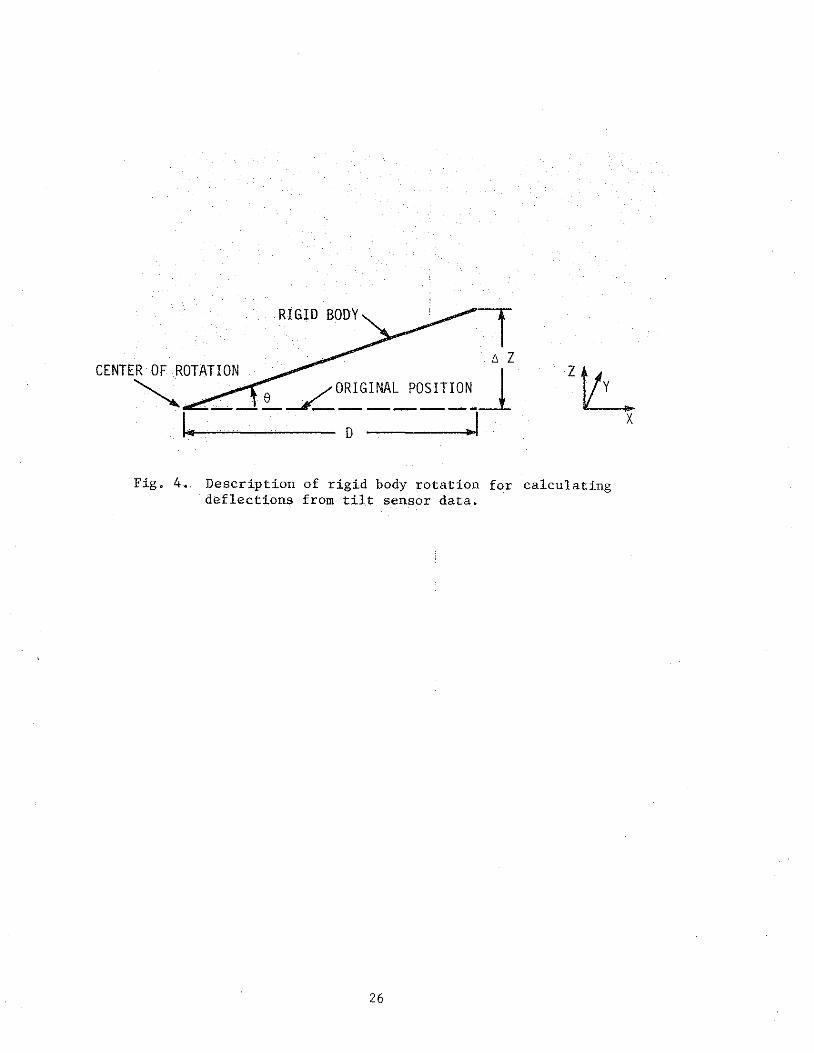
Use of the sensor in monitoring structural movement is made by
obtaining alignment information at discrete points along the structure.
From these data, calculation of deflection may be made by utilizing
elementary geometrical and structural analysis principles. In the
case of an angle change for rigid body rotation of a horizontal member
(see Fig. 4), the movement ~Z may be calculated using
23
Page 30
Fig. 2. Tilt sensing equipment: (a) power source, (b) recorder, and (c) tilt sensor and mounting plate.
24
Page 31
Fig. 3. Details of tilt sensor mounting to the plate: (a) pivot hole, (b) brass mounting pad, and (c) alignment mechanism.
25
Page 32
RIGID BODY
ztt_ D
Fig. 4. Description of rigid body rotation for calculating deflections from tilt sensor data.
26
x
Page 33
LiZ = DO (1)
where D is the horizontal length of the member and e is the angle of
rotation obtained with the tilt sensor unit.
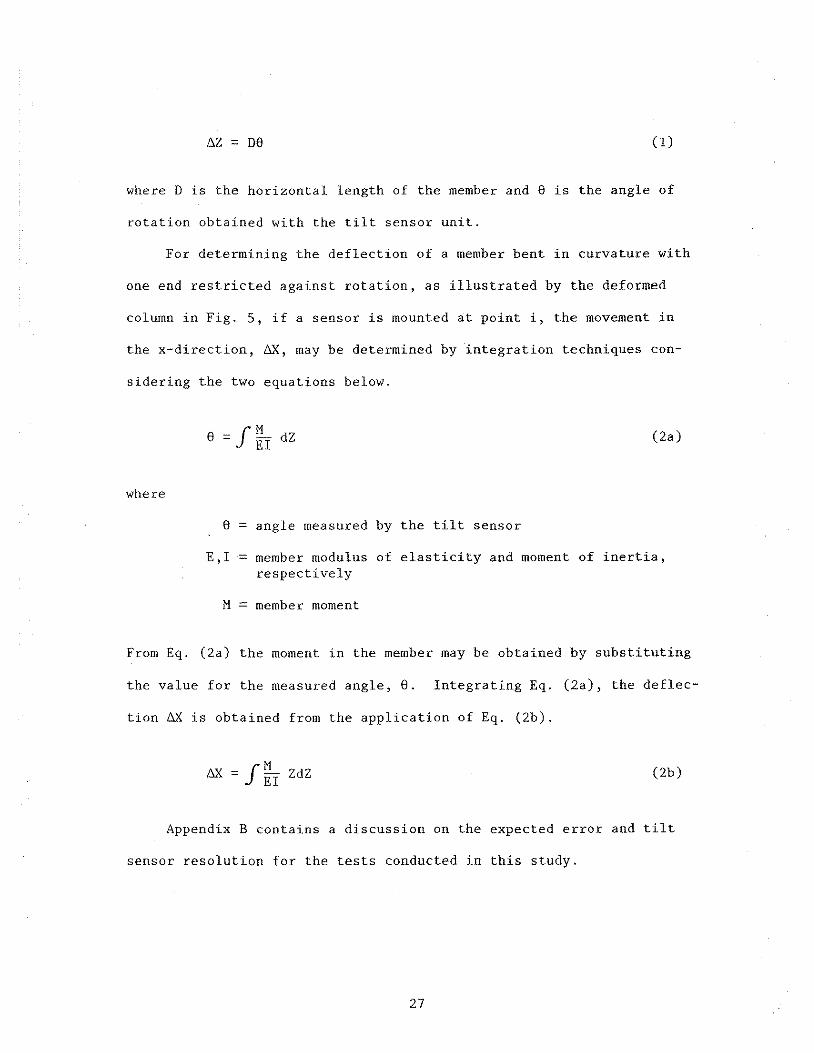
For determining the deflection of a member bent in curvature with
one end restricted against rotation, as illustrated by the deformed
column in Fig. 5, if a sensor is mounted at point i, the movement in
the x-direction, LiX, may be determined by integration techniques con-
sidering the two equations below.
where
e = f ~ dZ EI
8 = angle measured by the tilt sensor
(2a)
E,I member modulus of elasticity and moment of inertia, respectively
M = member moment
From Eq. (2a) the moment in the member may he obtained by substituting
the value for the measured angle, e. Integrating Eq. (2a), the deflec-
tion LiX is obtained from the application of Eq. (2b).
LiX = f ~ ZdZ EI (2b)
Appendix B contains a discussion on the expected error and tilt
sensor resolution for the tests conducted in this study.
27
Page 34
DEFORMED COLUMN
6 x --<of
~ORIGINAL COLUMN POSITION
11t--... !l
~1
l 'le x
Fig. 5. Description of member curvature for calculating deflecti.on from tilt sensor data~
28
Page 35
3.1.2. Analytical Photogrammetry
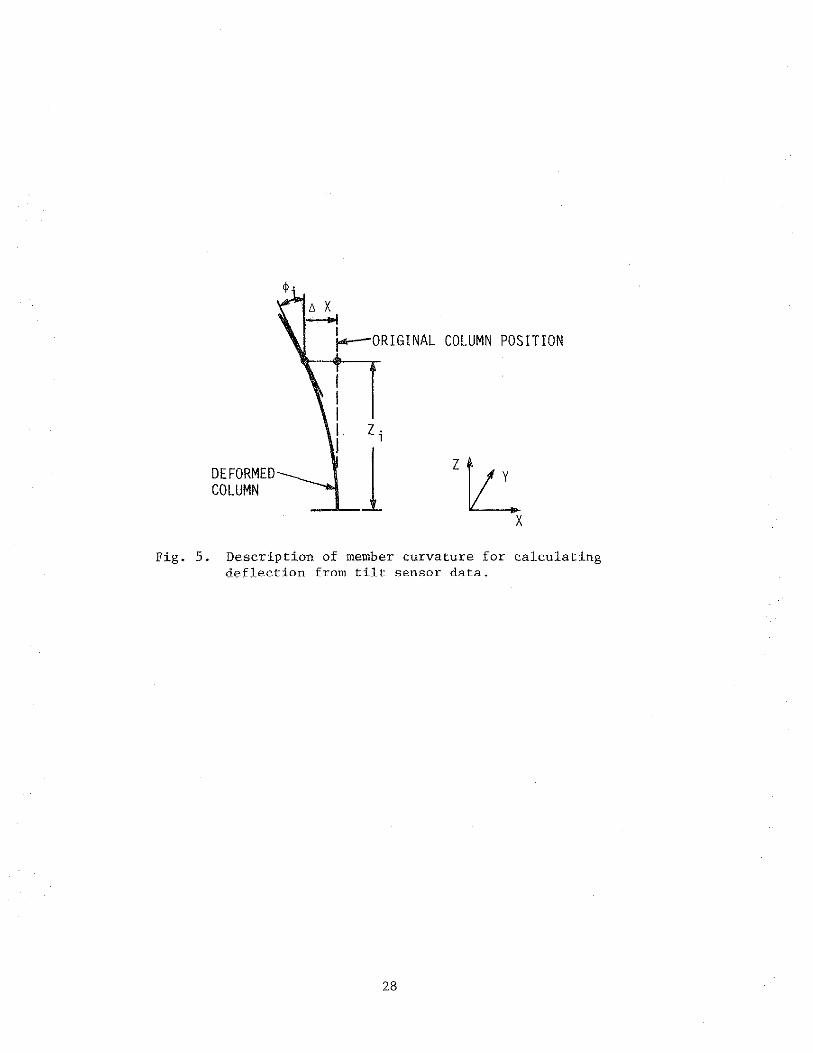
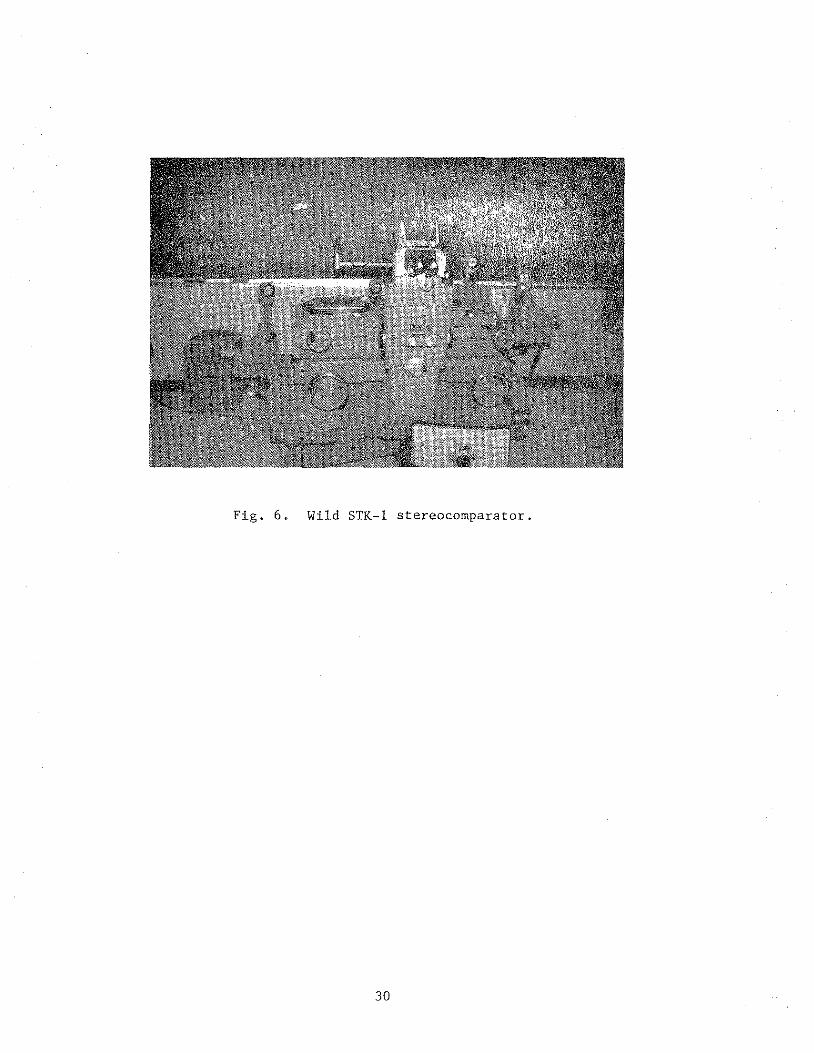
The photogrammetry technique uses a stereocomparator to take
measurements from a photograph. A stereocomparator is shown in Fig. 6.
Figure 7 shows a typical stereo camera used to take photographs. The
camera produces a negative on a glass plate for image stability, flat-
ness, and enhanced accuracy for making measurements.
The concept for taking measurements using this technique may be
illustrated by considering Fig. 8. The photo coordinates of a point
(x, y) are related to the ground coordinates (X, Y, Z) by central pro-
jection. Thus,
All (X - x ) + A12 (Y - y ) + A13 (Z - z ) f 0 0 0 (3) x =
A31 (X - x ) + A32 (Y - y ) + A32 (Z - z ) 0 0 0
A21 (X - x ) + A22 (Y - y ) + A23 (Z - z ) f 0 0 0 (4) y = (X - x ) (Y - y ) (Z - z ) A32 + A32 + A33 0 0 0
where
f = the camera focal length, and
(X , Y , Z ) = 0 0 0
the ground coordinates of the camera nodal point,
and
All Al2 A13 cos k -sin k 0 cos <I> 0 sin <I> 1 0
A21 A22 A23 = sin k cos k 0 0 1 0 0 cos
A31 A32 A33 0 0 1 -sin <I> 0 cos <I> 0 sin
w
w
The terms w, cJ>, and k are rotation angles about the (X, Y, Z) axis that
are required to rotate the photo coordinate system (x, y, z) parallel
to the ground coordinate system (X, Y, Z).
29
0
sin w
cos w
Page 36
Fig. 6. Wild STK-1 stereocomparator.
30
Page 37
Fig. 7. Zeiss stereometric camera on a tripod.
31
Page 38
K
canerahodal
ztc_ x
NOTE: Z coordinate describes the line of sight of the camera.
(X,Y,Z)
GROUND COORDINATES OF OBJECT
Fig. 8. Photogrammetric resection describing reduction of data for measurements from a photograph.
32
Page 39
By measuring the photo coordinates (x, y) of three or more points,
for which the ground coordinates (X, Y, Z) are known, the unknown param-
eters X , Y , Z , k, <jJ, and w can be determined by an iterative least 0 0 0
squares method using six or more equations similar to Eqs. (3) and (4).
If an object, P, is photographed from two points, A and B (see
Fig. 9), by measuring the photo coordinates, (x, y) and (x', y'), on
both of the photographs, the ground coordinates (X, Y, Z) of P can be
obtained from four equations similar to Eqs. (3) and (4): Two equations
for each photo, provided the parameters X0
, Y0
, Z0
, k, <jJ, and ware
known for each photo.
In practice the unknowns, six parameters per photo and three coor-
dinates for each point, are determined simultaneously by a least squares
iterative method using 15 or more equations with three or more known
control points. Special metric cameras (e.g., Wild P32, Wild Cl20, and
Zeiss), each of which have distortions less than 0.005 min, are required
for use. See Appendix B for discussion regarding the expected accuracy
of this technique for the tests performed in this study.
3.1.3. Surveying
Application of surveying techniques in the measure~ent of struc-
tural movemen.t requires the use of an instrument for making angular
measurements. The measurements are taken .for the points on the object
being monitored from known reference points. Both Wild T2 and Kern DKM2
Theodolites were used in this study. The surveying method as applied in
this study is illustrated in Fig. 10.
33
Page 40
CAMERA LOCATION A
L z x
CAMERA LOCATION B
PHOTOGRAPH COORDINATES
GROUND COORDINATES OF OBJECT, P
Fig. 9. Plan view of a photogrammetric intersection.
34
Page 41
GROUND OBJECT, P
BASELINE
Fig. 10. Three-dimensional view illustrating the concept for making deflection calculations by the surveying method.
35
x
Page 42
The horizontal ~ngles (a, 13) and vertical angles (9 1 , e2) are
measured from two stations, A and B, to a point, P. The coordinates
(X, Y, Z) of P are given by
therefore,
Also
therefore,
and
therefore,
x = x1
+ AC cos a
= X2 BC sin 13
Xmean = ~ (X1 + Ac cos a + x2 - BC sin 13)
y = yl + AC sin a
y = y2 + BC sin ll
Y = ~ (Y1 + AC sin a + Y2 + BC sin 13) mean
z = z1 + AC tan 81
= z2 + BC tan 82
z = ~(Z + AC tan 81 + 22 + BC tan e2) mean 1
(5)
(6)
(7)
where (X1
, Y1
, Z1
) and (X2
, Y2 , z2) are the coordinates of A and B,
respectively.
Also from triangle ABC we have
___ _:::AB=---~ = AC = BC sin (180 - a - 13) sin ll sin a
36
(8)
Page 43
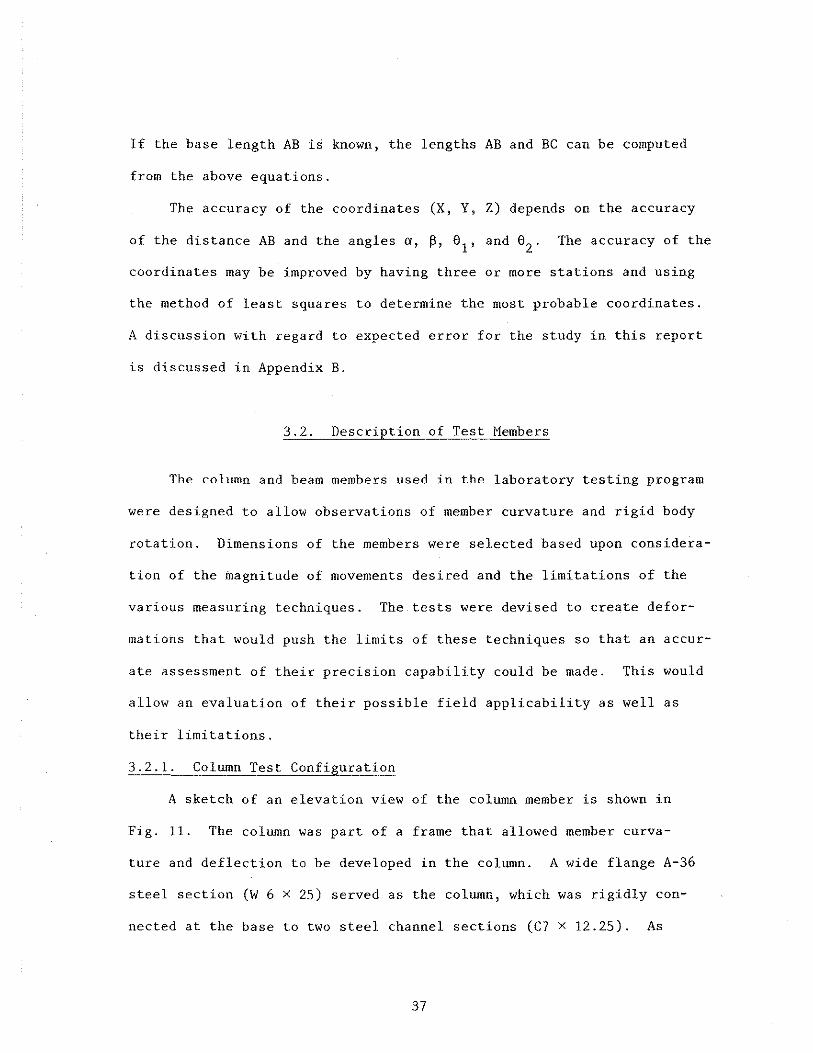
If the base length AB is known, the lengths AB and BC can be computed
from the above equations.
The accuracy of the coordinates (X, Y, Z) depends on the accuracy
of the distance AB and the angles a, ~' e1 , and e2 . The accuracy of the
coordinates may be improved by having three or more stations and using
the method of least squares to determine the most probable coordinates.
A discussion with regard to expected error for the study in this report
is discussed in Appendix B.
3.2. Description of Test Members
The column and beam members used in the laboratory testing program
were designed to allow observations of member curvature and rigid body
rotation. Dimensions of the members were selected based upon considera
tion of the magnitude of movements desired and the limitations of the
various measuring techniques. The tests were devised to create defor
mations that would push the limits of these techniques so that an accur
ate assessment of their precision capability could be made. This would
allow an evaluation of their possible field applicability as well as
their limitations.
3.2.1. Column Test Configuration
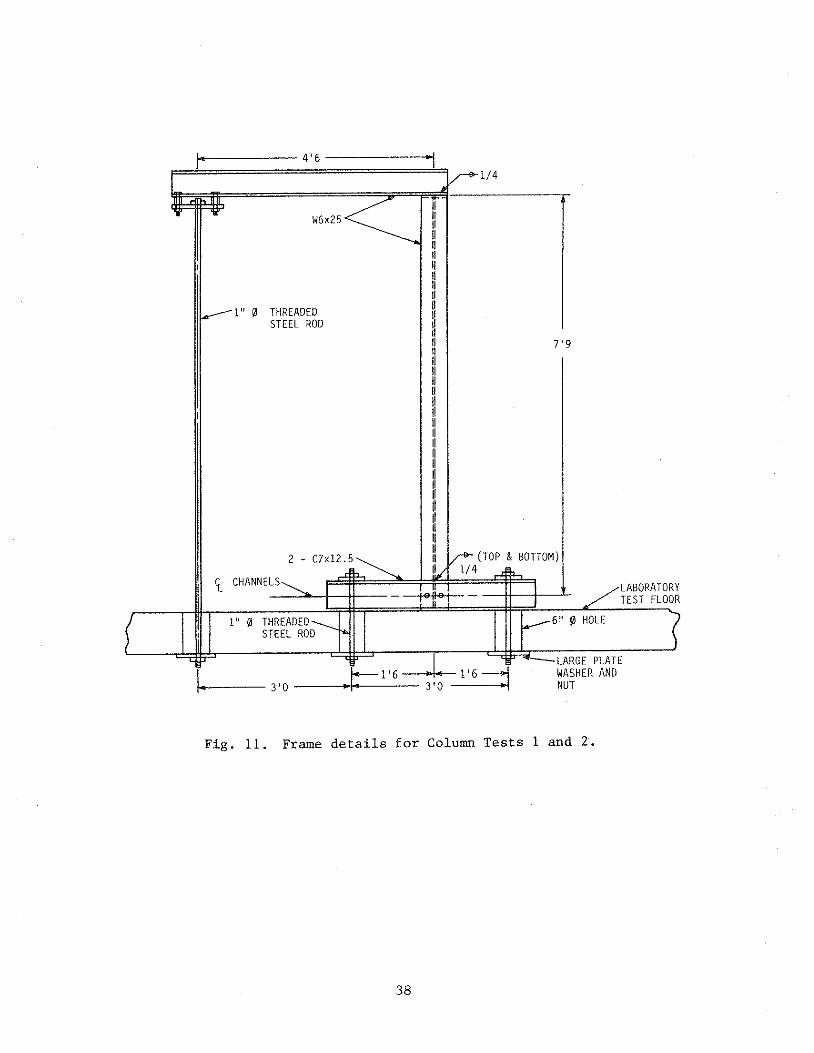
A sketch of an elevation view of the column member is shown in
Fig. 11. The column was part of a frame that allowed member curva
ture and deflection to be developed in the column. A wide flange A-36
steel section (W 6 x 25) served as the column, which was rigidly con
nected at the base to two steel channel sections (C7 x 12.25). As
37
Page 44
------ 4'6 -------i
W6x25
I" 0 THREADED STEEL ROD
2 - C7xl2.5
G. CHANNELS --""-4-~i---
1" 0 THREADED STEEL ROD
• I . • ~1'6 i.o---- 3 'O ---•-I-<~~--- 3'0
1/4
1'6=:1
7'9
6" 0 HOLE
LABORATORY TEST FLOOR
LARGE PLATE WASHER AND NUT
Fig. 11. Frame details for Column Tests 1 and 2.
38
Page 45
shown in the sketch, the rigid base connection was created by welding
the top and bottom flanges of the channel to the column flanges. In
addition, two 1/2-in. diameter bolts were used to complete the connec
tion. The channels were fastened to the laboratory test floor by use
of a detail that allowed bearing on a large steel plate washer (attached
across the top of the two channel flanges) by a one-inch diameter rod.
The rod was secured to the underside of the test floor at a tie down
location with a large plate washer and nut. For purposes of deflec
tion calculation, the base of the column was assumed to be fixed.
The beam member of the frame also consisted of a W 6 x 25 section,
which was attached through a bottom flange connection to the top of the
column. A steel plate welded to the column end at the top acted as a
bearing plate for the beam through which the bolted connection was made.
The beam-column connection was assumed to create a joint rigid enough
so that calculations of member deformations could be made assuming a
fully rigid connection.
Loads were applied to the frame through a rod attached to the
bottom flange of the beam and secured to the underside of the labora
tory test floor at a tie down location. The threaded steel rod was
attached to the floor with a large plate washer and nut assembly. By
tightening the nut with a wrench, the load was applied to the frame in
a manner that provided a very stable condition during the testing.
Selection of the column length was based on measurement limitations
of the tilt sensors. The ±20 arc minute range of the sensors allows a
maximum column top deflection of approximately 1/4 inch using a column
39
Page 46
length of 7'9". This deflection was felt to be of such magnitude that
an accurate evaluation could be made of the various measuring techniques.
3.2.2. Beam Test Configuration
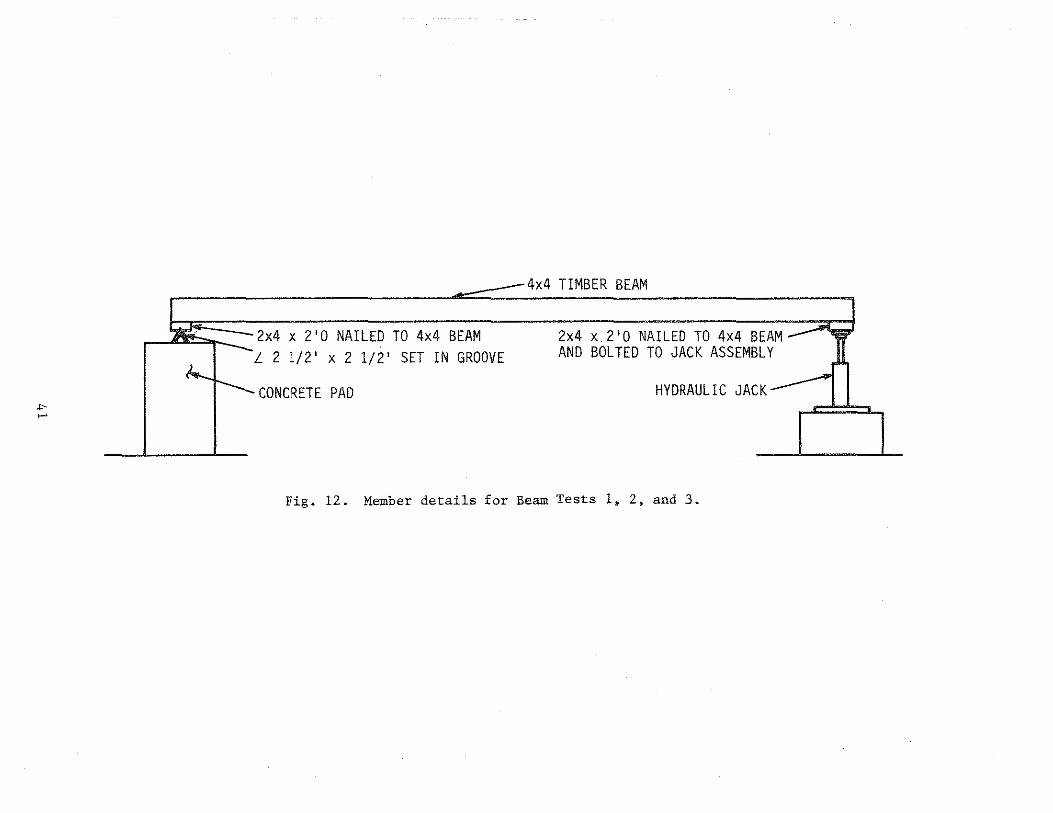
Figure 12 illustrates the layout for Beam Tests 1' 2, and 3. The
tests were designed to achieve rigid body rotation. A 4 x 4 timber
served as the beam member that was supported at one end on a rigid base
with the freedom to rotate and was supported at the other end by a hy-
draulic jack, which allowed control of the vertical movement. The con
figuration allowed a rotation of the whole member in a vertical plane
relative to the rigid base end. As shown in Fig. 12, a section of
2 x 4 lumber was carefully grooved and supported on a steel angle
member laid 011 end to foru1 an inverted vee shape. This detail created
a hinge-type support that allowed rotation of the member end. At the
opposite beam end, a hydraulic jack rigidly connected to the beam was
used to raise the member to cause the member rotation. The jack was
placed on a steel bearing pad, which rested on top of a concrete abut
ment.
Selection of the beam length was based upon two considerations.
The desire to mount four sensors simultaneously for a portion of the
testing dictated the beam length be relatively long. In addition,
given the limited angular range of the tilt sensors, the rotation through
which the beam could be rotated was limited. For ease in measuring
displacements with photogrammetric and surveying methods, a relatively
long member was required. Specifications for mounting the sensors for
angular measurement require that the sensors be mounted in a plane
within 5° of vertical of the planar rotation of the structure. This
40
Page 47
..,_ ....
1 «.........., -_ 2x4 x 2 'O NAILED TO 4x4 BEAM
L 2 1/2' x 2 1/2' SET IN GROOVE
CONCRETE PAD
4x4 TIMBER BEAM
2x4 x 2'0 NAILED TO 4x4 BEAM AND BOLTED TO JACK ASSEMBLY
HYDRAULIC JACK
Fig. 12. Member details for Beam Tests 1, 2, and 3.
Page 48
ensures any difference between the actual structure angular movement
and the sensor movement will be insignificant. By using the relatively
long beam member, it was also felt that exact planar movement of the
beam throughout the range of angular movement would be difficult to
achieve and therefore would provide some insight into the adequacy of
the sensor mounting specifications.
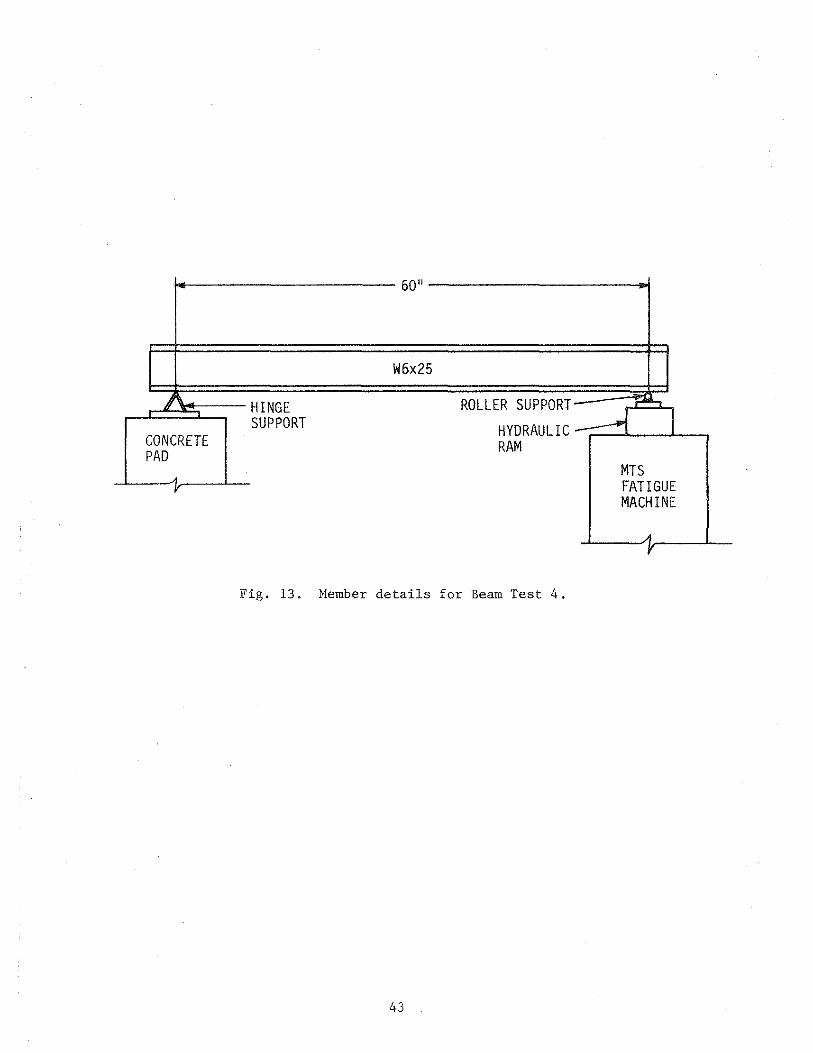
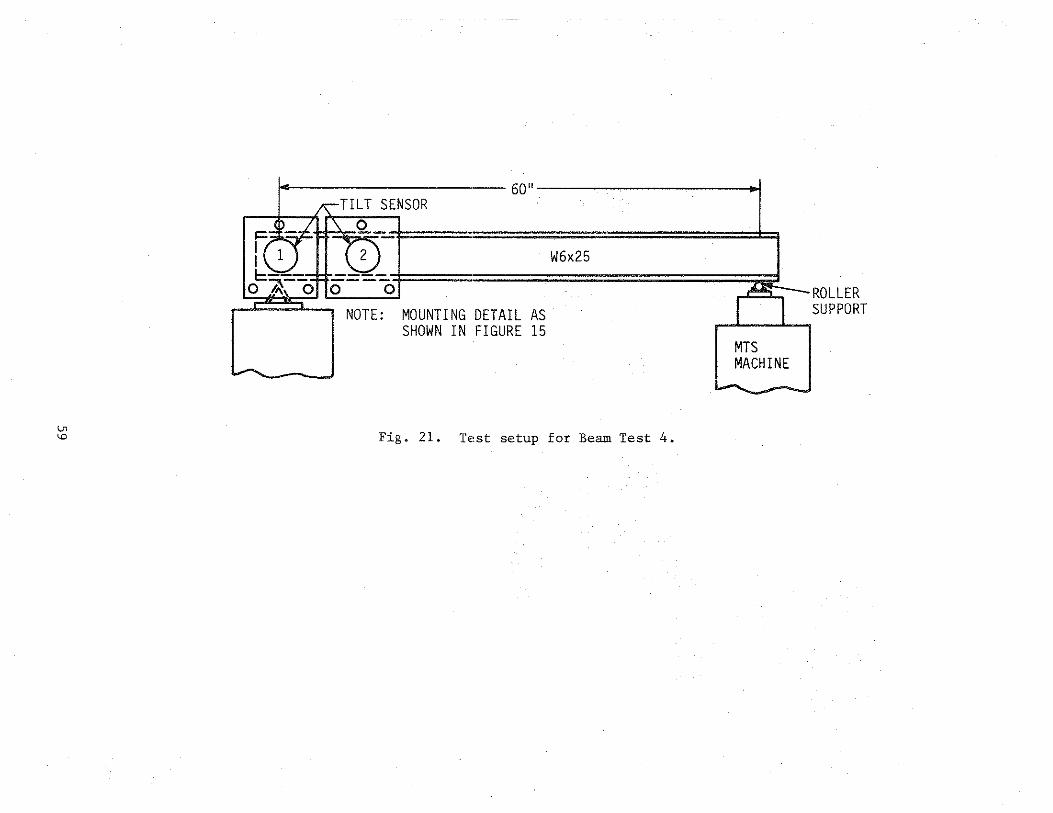
The beam member used in Beam Test 4 is shown in Fig. 13. As
shown, it consisted of a six-inch wide flange steel section that was
simply supported. One end was idealized as a hinge support, while the
other end was supported on a roller on the hydraulic load ram of the
MTS fatigue testing machine. The ram end of the member was displaced
to cause rigid body rotation. The MTS machine was used so that a dynamic
displacement could be applied and the response time of the sensors
could be studied.
The relatively short member length was selected to contrast with
the long dimension used in Beam Tests 1, 2, and 3. In these tests pos
sible out-of-plane rotation of the member was more likely to occur; so
the short member length was selected for Beam Test 4 to reduce the
possibility of the same thing happening again.
42
Page 49
60"
W6x25
,~ HINGE ROLLER SUPPORT- -~
SUPPORT .J I HYDRAULIC - I CONCRETE RAM PAD
MTS ' v FATIGUE
MACHINE
A y
Fig. 13. Member details for Beam Test 4.
43
Page 50
4. TESTS AND TEST PROCEDURES
Instrumentation utilized in the laboratory tests consisted of six
independent measuring systems: (1) dial gauges, (2) direct current
displacement transducers (DCDTs), (3) electrical resistance strain
gauges, (4) tilt sensors, (5) surveying instruments, and (6) photo-
grammetry equipment.
Strain gauges were attached to the steel members with recommended
surface preparations and adhesives. Lead wires from the strain gauges
were connected to computerized data acquisition system (DAS), which
read and stored the strain levels. The DCDTs utilized the DAS in a
similar way by monitoring and storing deflection data. The tilt sensor
readings were taken from the central console digital display and recorded
by hand. Measurements observed using the dial gauges and surveying
instruments were read and recorded by hand. The computerized control
panel for the MTS fatigue t.esting equipment was used to monitor the
deflections and to control the rate of displacement. Photographs,
which were taken during the testing utilizing photogrammetry techniques,
were processed and analyzed·using a Wild STK-1 Stereocomparator.
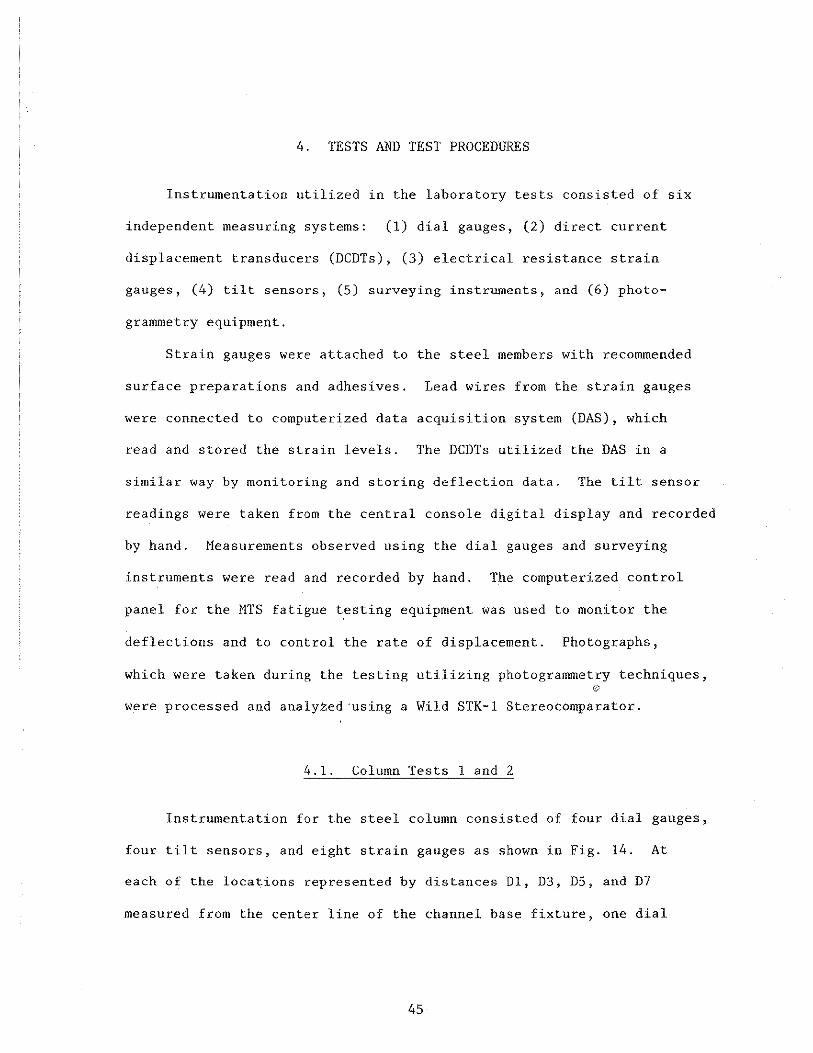
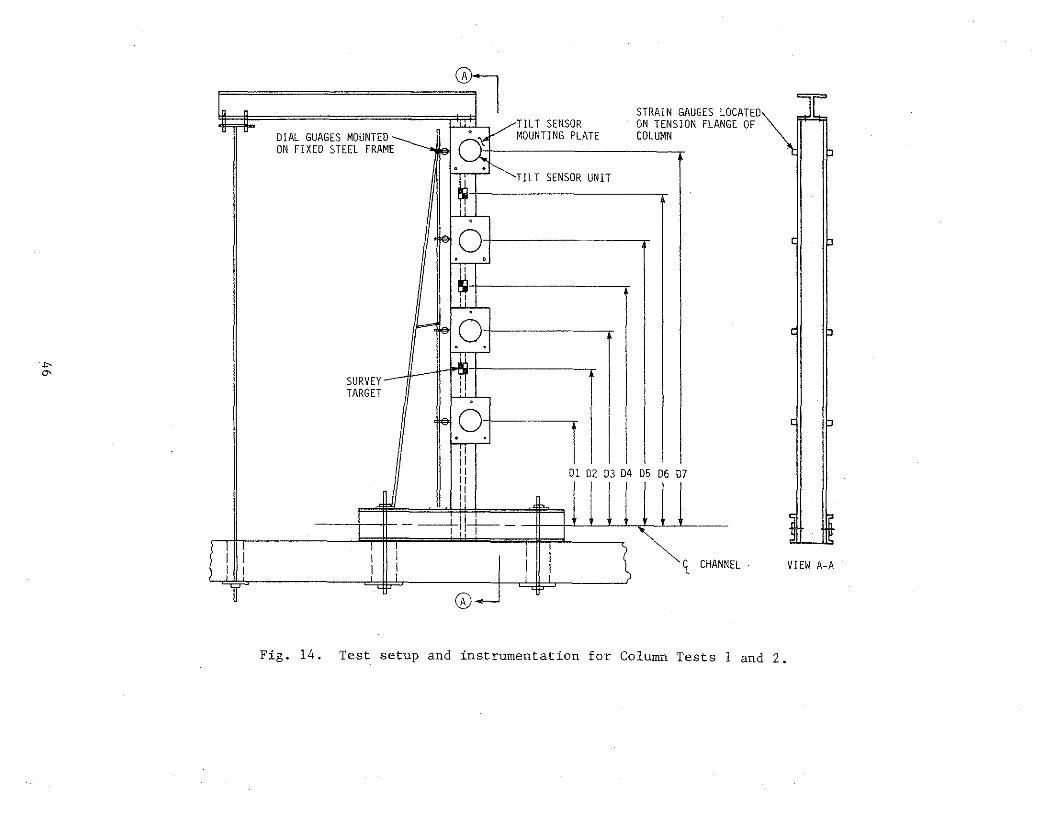
4.1. Column 1 and 2
Instrumentation for the steel column consisted of four dial gauges,
four tilt sensors, and eight strain gauges as shown in Fig. 14. At
each of the locations represented by distances Dl, D3, DS, and D7
measured from the center line of the channel base fixture, one dial
45
Page 51
,,. "'
" "
1F Fil'"
I I I I ! I
DIAL GUAGES MOUNTED ON FIXED STEEL FRAME
SURVEY TARGET
I -I
I I I I I l
~ ""'''"'~" unv\JL....> ._
., . ' VTIL T SENSOR ON TENS JON FLANC d MOUNTING PLATE COLUMN ~ I@
·~ •~TILT SENSOR UNIT
i1 . I@ 0 . . ~ 1: .
"' 0 . . ll
]l ,1 .
1€ 0 . ,, rl II Dl 02 D3 D4 D5 D6 D7 Ir 11 :1
----LI 1--L- - I I ' I 1 ; I
I I
\ I I l t CHANN . ,
©
CATED E OF
EL VIEW A-A
Fig. 14. Test setup and instrumentation for Column Tests 1 and 2.
Page 52
gauge, one tilt sensor, and two strain gauges were utilized to measure
column movements.
As shown in Fig. 14, the dial gauges were mounted on a steel frame,
which that was constructed and positioned independent of the test column.
The stem of each. of the dial gauges was set to bear on the centerline
of the column web.
Strain gauges were attached to both flanges of the column on the
tension side of the neutral axis. Using two strain gauges at each
location provided not only a check on the readings but an indication
of any unsymmetrical bending of the column about the axis of bending.
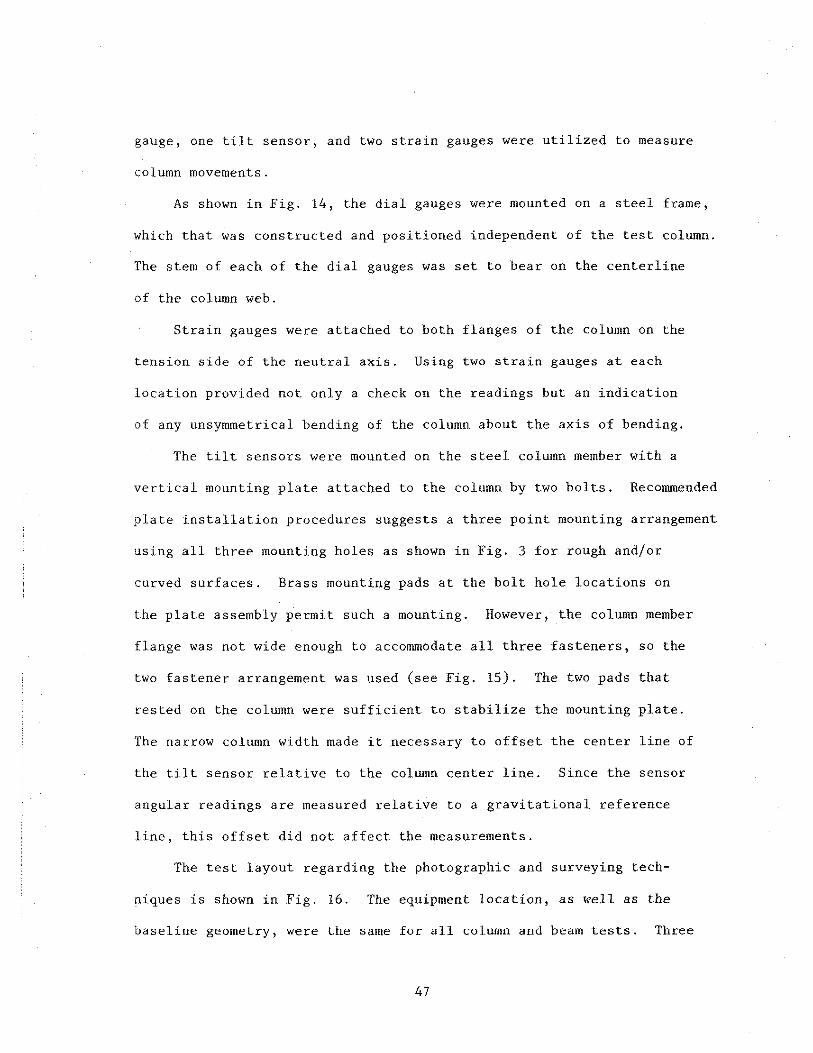
The tilt sensors were mounted on the steel column member with a
vertical mounting plate attached to the column by two bolts. Recommended
plate installation procedures suggests a three point mounting arrangement
using all three mounting holes as shown in Fig. 3 for rough and/or
curved surfaces. Brass mounting pads at the bolt hole locations on
the plate assembly permit such a mounting. However, the column member
flange was not wide enough to accommodate all three fasteners, so the
two fastener arrangement was used (see Fig. 15). The two pads that
rested on the column were sufficient to stabilize the mounting plate.
The narrow column width made it necessary to offset the center line of
the tilt sensor relative to the column center line. Since the sensor
angular readings are measured relative to a gravitational reference
line, this offset did not affect the measurements.
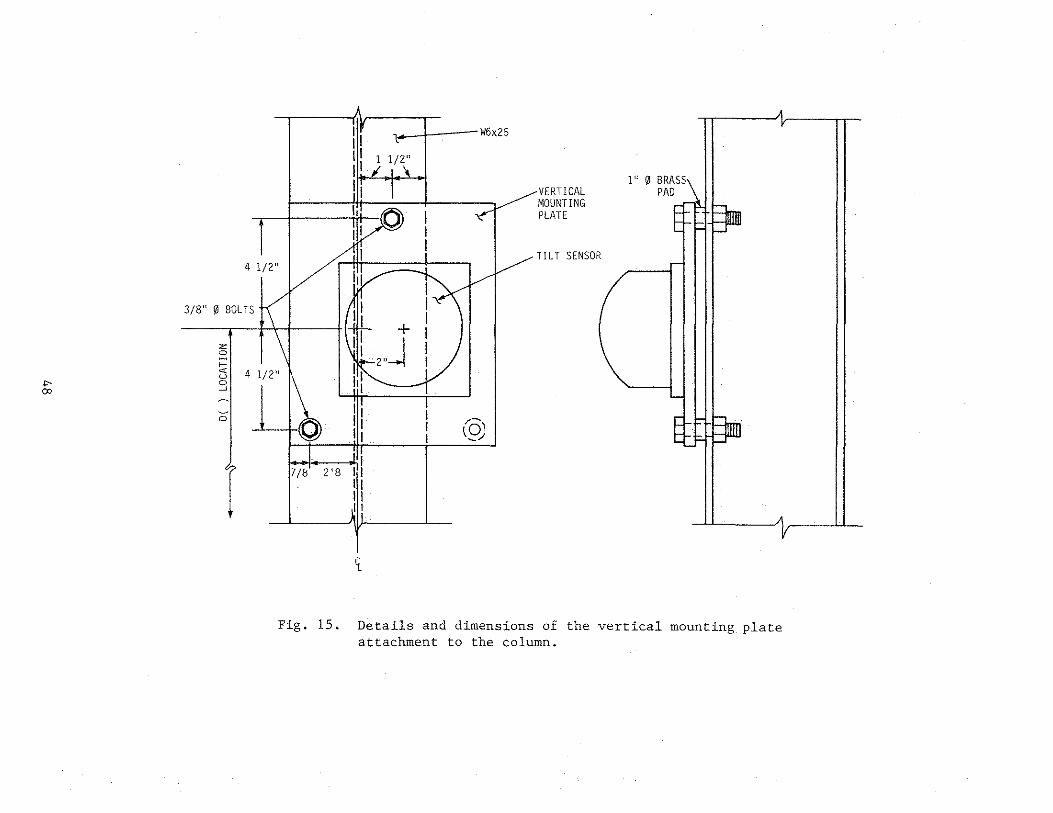
The test layout regarding the photographic and surveying tech
niques is shown in Fig. 16. The equipment location, as well as the
baseline geon1eLry, were the san1e for all column and beam tests. Three
47
Page 53
.p-
"'
1 r W6x25 1 I 11 1 1/2" 11 I 1 VERTICAL
1' 0 BRASS PAD
11, (Q) I MOUNTING PLATE
I I
4 112" I /rin I ~ TI LT SENSOR
11 I
3/8" 0 BOLTS t( I 't z 0
>-
"" u 0 ~
o I
I +
4 }/2"1
11 j I I 2"
1,1
: ·~ 1
I 1
-a I 1 ' ''(31 l 1
1 I l_,,
T
7/8' 2'8 :11 11 11
'i_
Fig. 15. Details and dimensions of the vertical mounting plate attachment to the column.
Page 54
TEST BEAM
KERN DKM2
THEODOLITE
I l
F
I I
I
/
II
I I
I
I a 1
a1, a2 - measured angles
/
TEST COLUMN
/"'\ TARGET
I ' ' I ', I I
I I
~ig. 16. Baseline and test setup for photogrammetric and surveying methods.
49
WILD T2 THEODOLITE
Page 55
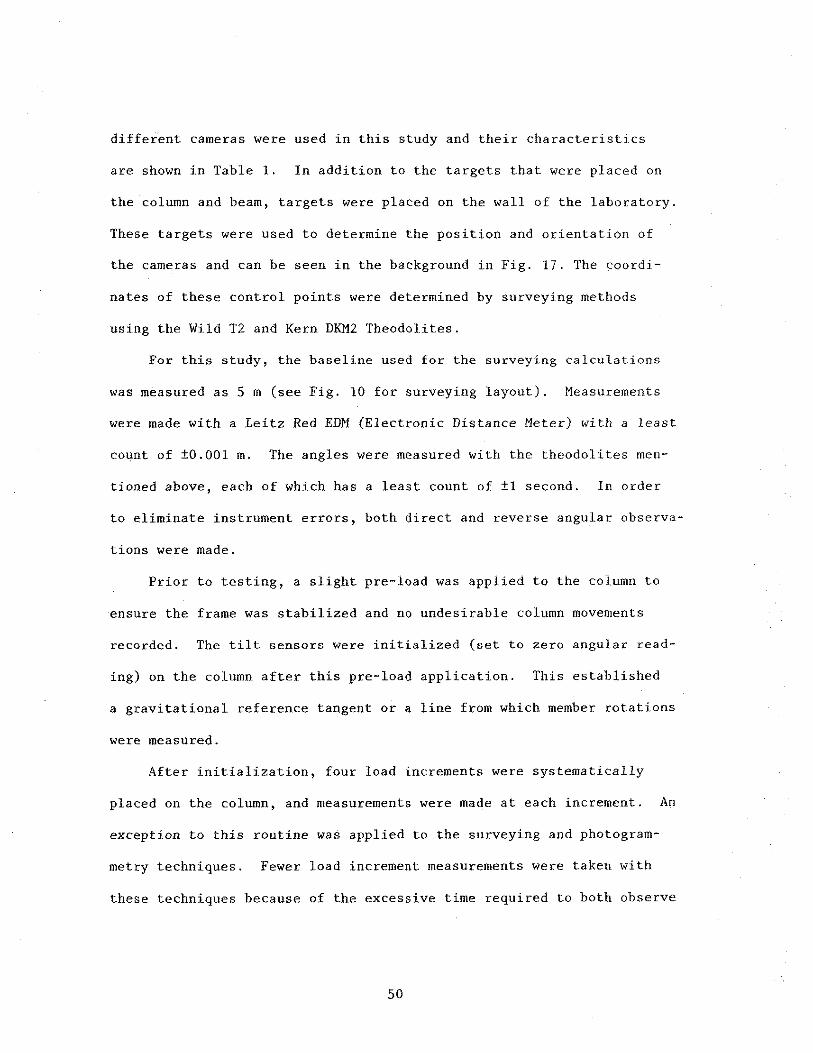
different cameras were used in this study and their characteristics
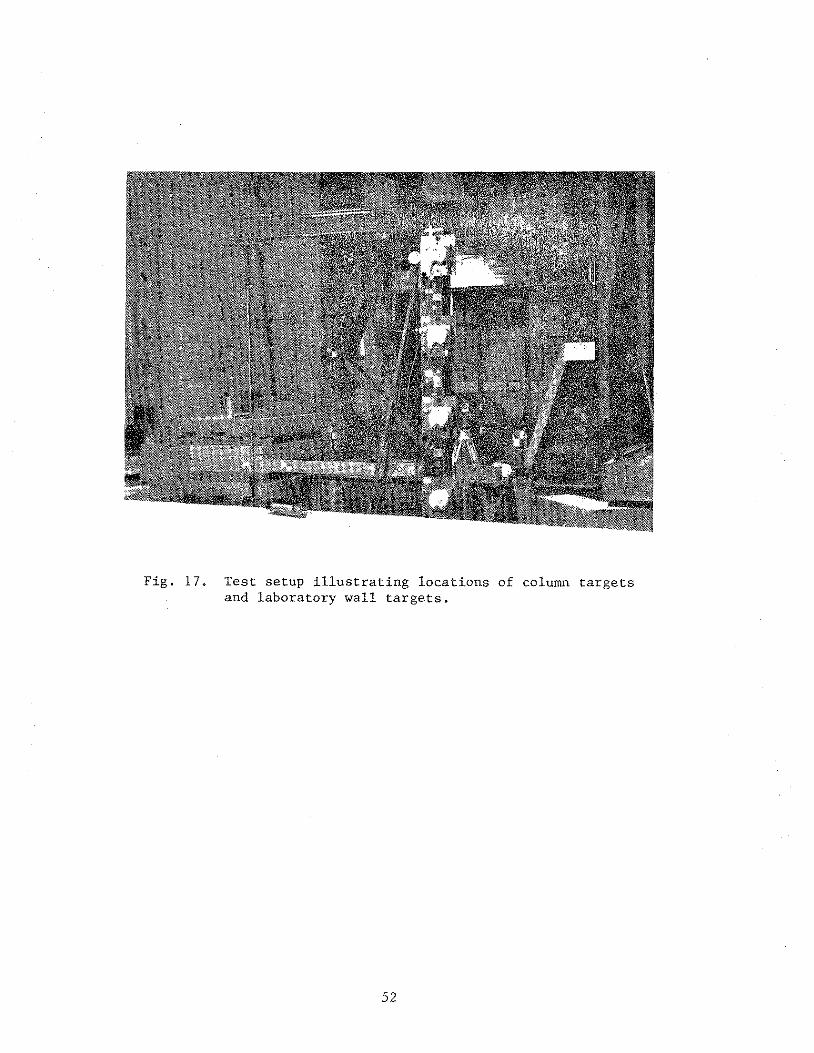
are shown in Table 1. In addition to the targets that were placed on
the column and beam, targets were placed on the wall of the laboratory.
These targets were used to determine the position and orientation of
the cameras and can be seen in the background in Fig. 17. The coordi
nates of these control points were determined by surveying methods
using the Wild T2 and Kern DKM2 Theodolites.
For this study, the baseline used for the surveying calculations
was measured as 5 m (see Fig. 10 for surveying layout). Measurements
were made with a Leitz Red EDM (Electronic Distance Meter) with a least
count of ±0.001 m. The angles were measured with the theodolites men
tioned above, each of which has a least count of ±1 second. In order
to eliminate instrument errors, both direct and reverse angu.lar observa
tions were made.
Prior to testing, a slight pre-load was applied to the column to
ensure the frame was stabilized and no undesirable column movements
recorded. The tilt sensors were initialized (set to zero angular read
ing) o~ the column after this pre-load application. This established
a gravitational reference tangent or a line from which member rotations
were measured.
After initialization, four load increments were systematically
placed on the column, and measurements were made at each increment. An
exception to this routine was applied to the surveying and photogram
metry techniques. Fewer load increment measurements were taken with
these techniques because of the excessive time required to both observe
so
Page 56
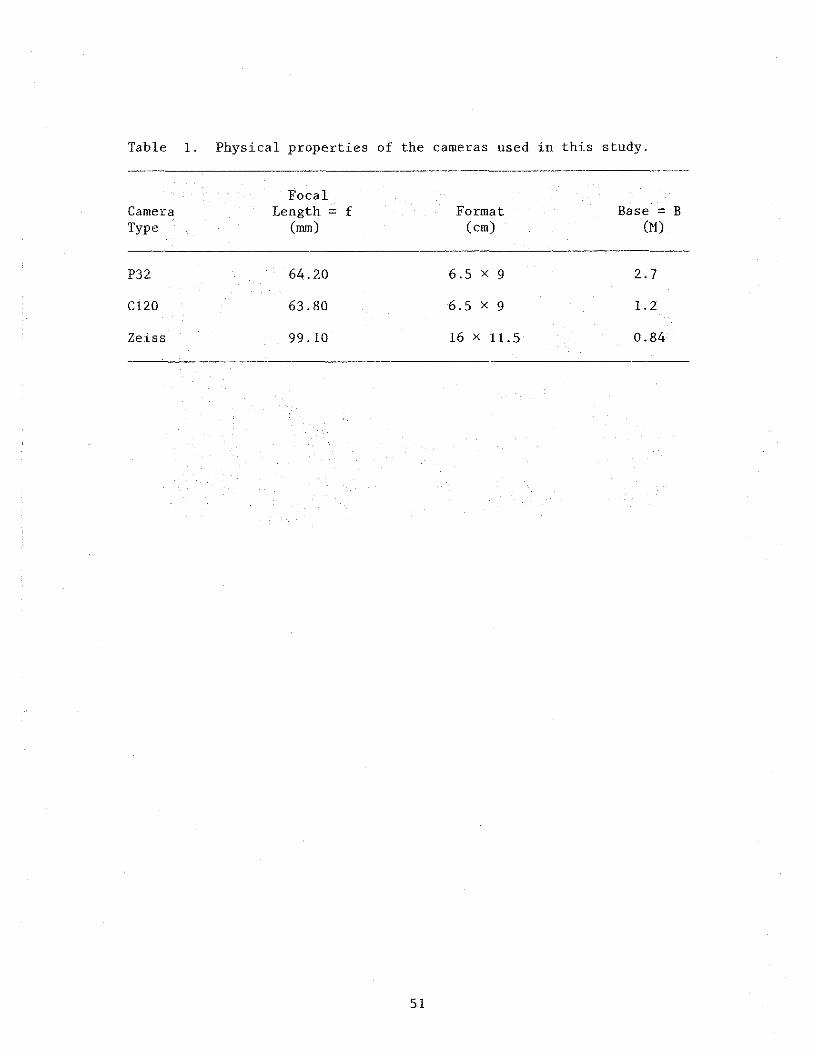
Table 1. Physical properties of the cameras used in this study.
Focal Camera Length = f Format Base = B Type (mm) (cm) (M)
P32 64.20 6.5 x 9 2.7
Cl20 63.80 6.5 x 9 1.2
Zeiss 99. 10 16 x 11.5 0.84
51
Page 57
Fig. 17. Test setup illustrating locations of column targets and laboratory wall targets.
52
Page 58
and interpret the data. Load increments were established based upon
approximately 5 arc minute readings of the top sensor.
After completion of Column Test 1 and Beam Test 1, the fourth
load increment was left on the column. During the one-week period
that passed between the performance of Column and Beam Tests 1 and
Column and Beam Tests 2, movements of the colwnn were monitored. This
included daily observations of the dial gauges, strain gauges, and tilt
sensors. The movements were also continuously monitored through the
use of the recorder unit for the tilt sensors. A strip chart recording
of angular movement versus time was obtained during the interim period.
Before the performance of Column and Beam Tests 2 and with the fourth
load movement from Tests 1 still applied, data of the column position
were recorded by all measurement techniques. The load was then released.
A preload was applied, and Tests 2 were performed following the same
procedure as in Tests 1.
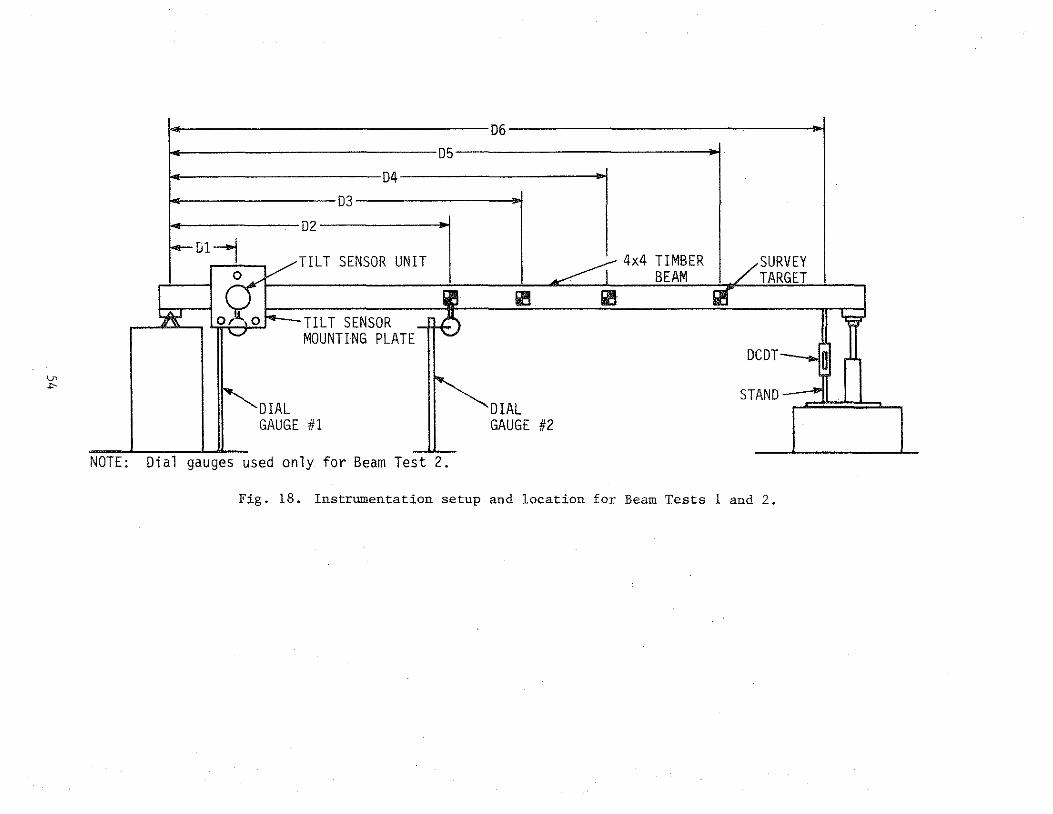
4.2. Beam Tests 1, 2, and 3
Figure 18 shows the setup used for Beam Tests 1, 2, and 3 and the
locations that were monitored for movement. Different arrangements of
the instrumentation were utilized for each of the three tests performed
on the beam. The instrumentation consisted of dialgauges, DCDTs, tilt
sensors, and surveying and photogrammetry techniques.
The dial gauges were located under the beam, and their stems were
placed at the beam center line. The DCDT located at one end of the
member was positioned beneath the member center line and was placed on a
53
Page 59
en ..,_
14-~~~~~~~~~~~~~-06~~~~~~~~~~~~~---!~
i.-~~~~~~~~~~~05~~~~~~~~~~~-.i
i.-~~~~~~~~-04~~~~~~~~~~
,.._~~~~~~-03~~~~~~~+1
i.-~~~~~02~~~~~~
TILT SENSOR UNIT
TILT SENSOR MOUNTING PLATE
DIAL GAUGE #1
NOTE: Dial gauges used only for Beam Test 2.
la la
DIAL GAUGE #2
4x4 TIMBER BEAM
SURVEY TARGET
OCDT--...11
sTANo-;::n 1 1 ,
Fig. 18. Instrumentation setup and location for Beam Tests 1 and 2.
Page 60
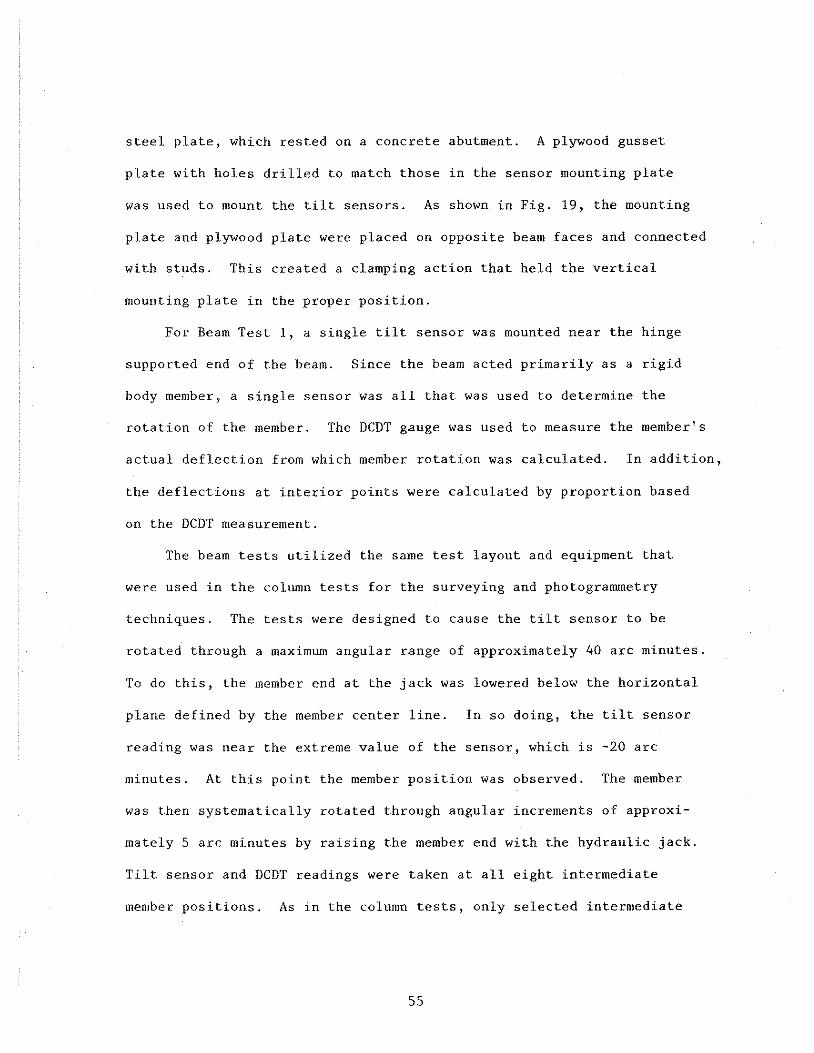
steel plate, which rested on a concrete abutment. A plywood gusset
plate with holes drilled to match those in the sensor mounting plate
was used to mount the tilt sensors. As shown in Fig. 19, the mounting
plate and plywood plate were placed on opposite beam faces and connected
with studs. This created a clamping action that held the vertical
mounting plate in the proper position.
For Beam Test 1, a single tilt sensor was mounted near the hinge
supported end of the beam. Since the beam acted primarily as a rigid
body member, a single sensor was all that was used to determine the
rotation of the member. The DCDT gauge was used to measure the member's
actual deflection from which member rotation was calculated. In addition,
the deflections at interior points were calculated by proportion based
on the DCDT measurement.
The beam tests utilized the same test layout and equipment that
were used in the column tests for the surveying and photogrammetry
techniques. The tests were designed to cause the tilt sensor to be
rotated through a maximum angular range of approximately 40 arc minutes.
To do this, the member end at the jack was lowered below the horizontal
plane defined by the member center line. In so doing, the tilt sensor
reading was near the extreme value of the sensor, which is -20 arc
minutes. At this point the member position was observed. The member
was then systematically rotated through angular increments of approxi
mately 5 arc minutes by raising the member end with the hydraulic jack.
Tilt sensor and DCDT readings were taken at all eight intermediate
member positions. As in the column tests, only selected intermediate
55
Page 61
V> G-
~---+---0
4 1/2"
T- -tt---t--<':-
4 1/2" ______ .....,. __________ ...., __
t 10 0
~
VERTICAL MOUNTING PLATE
TlL T SENSOR
3/8" 0 THREADED ROD
4x4 ?"' TIMBER/ BEAM
Fig. 19. Details and dimensions of the vertical mounting plate attachment to the beam member.
1/2" PLYWOOD GUSSET PLATE
Page 62
readings were taken by the surveying technique because of the excessive
time required to observe and interpret the data.
Additional deflection data were collected during Beam Test 2 for
ease of comparing data obtained from the different measurement tech
niques. Dial gauges were placed at locations Dl and D3 shown in Fig. 18.
These locations correspond to tilt sensor and survey target locations,
respectively. These locations were in addition to the instrumentation
that was in place for Beam Test 1.
Beam Test 3 was conducted to study both the capabilities of the
tilt sensing system and their sensitivity for out-of-plane movement.
With the realization that the sensors could not be positioned so that
they were able to monitor rotation in exact vertical planes practically
(at least not within the high range of precision we were hoping to
achieve), the tests were performed and comparisons made of each sensor
reading.
Before performing Beam Test 3, the timber member was planed to
ensure no unwanted warpage existed. In addition, an improved detail
was utilized at the hinge support to eliminate any possible out-of
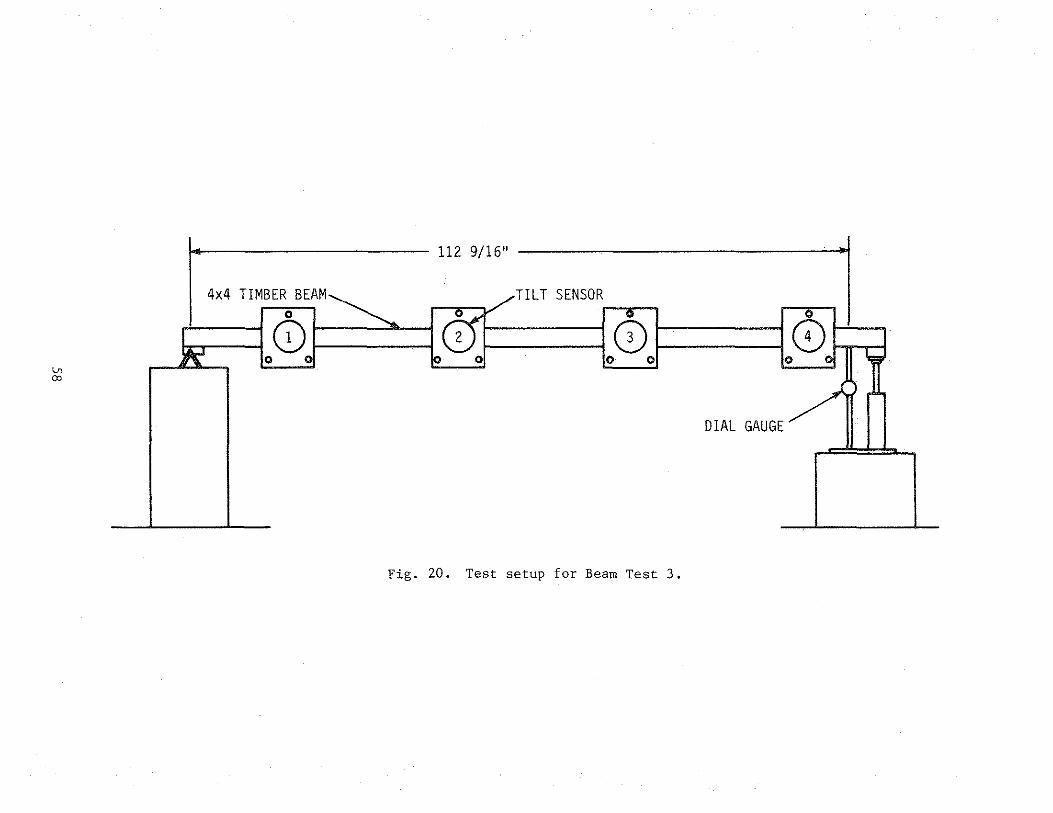
plane movement of the member. Figure 20 illustrates the test layout.
The same procedure used in Beam Tests 1 and 2 for rotating the member
through a wide angular range was employed. Neither the surveying or
photogrammetry techniques were used during Beam Test 3.
4.3. Beam Test 4
The instrumentat'ion used in Beam Test 4 is shown in Fig. 21, and
the test layout is illustrated in Fig. 22. Beam Test 4 used the MTS
57
Page 63
>rj
I-
'· O
Q
N
0 .....
.....
N
<O
...... .....
°'
>-l
ro "' ..., "' -4
~
r -4
ro ..., " "" (/)
,,, :z
'"" 0 '"' (/)
0 ::0
"'
08
ro &
>-l
0 ro {!
) ..., w
0 ~
>
r "' > c "' ,,, 08
Page 64
\.,n
"'
i=-) /
'_(21 L---o ~~o
...........
60" ,......... TILT SENSOR
' 0
~ CQ W6x25
0 0
NOTE: MOUNTING DETAIL AS SHOWN IN FIGURE 15
Fig. 21. Test setup for Beam Test 4.
I I MTS MACHINE
..........
- ROLLER SUPPORT
Page 65
( J-1
Fig. 22. Test layout for Beam Test 4.
60
Page 66
fatigue testing machine to apply displacements to the simply supported
member end at selected rates of displacement. The tilt sensors were
attached at the hinge-supported end of a W 6 x 25 steel section. The
sensors were connected to the member using the same procedure as Be·am
Tests 1, 2, and 3 and are shown in Fig. 19. The roller-supported end
of the member was supported on the load-displacement cylinder of the
MTS machine. The displacements and rates of displacement were controlled
and monitored by the computerized control console of the machine.
Two objectives of this test were (1) to determine the sensor's
ability to respond to nonstatic displacements and (2) to determine the
sensor's accuracy and reliability to static displacement. Two tests
were conducted: one test representing a relatively large angular motion
and the other a relatively small angular motion. The test procedure
involved the application of a selected displacement and displacement
rate. After a one-second interval, which corresponds to the recording
rate of the recorder, the sensor reading was taken manually from the
console readout display. At the end of each displacement, the sensor
was allowed to settle down completely, and a static reading was taken.
The procedure was followed for each of the displacement rates considered.
61
Page 67
5. TEST RESULTS AND ANALYSIS
Experimental results of tests performed will be presented in this
section. Member deformations, either measured or calculated by the
various techniques investigated, will be compared, and a determination
will be made as to their accuracy.
5.1. Member Deformation Measurements and Calculation
Member deformation for both the column and beam tests were obtained
by using various techniques that included dial gauges, DCDT, strain
gauges, tilt sensors, survey instruments, and analytical photogrammetry
equipment. A summary of how measurements were made and/or calculated
is given below for the various techniques.
Dial Gauges and DCDT
Column deflection observed with the dial gauges and DCDT served
to indicate the true position of the members. Dial gauges were read
by hand, and the DCDT was read directly from a computerized DAS.
Strain Gauges.
Integration techniques were used to calculate column deflections
from the strain gauge data. To do this, strain gauges were placed at
known distances from the column center line, and columns were assumed
to be fixed at the base.
Tilt Sensors
Tilt sensor data were reduced by using direct integration of
measured rotations to calculate member deflection.
63
Page 68
Analytical. Photogrammetry
Data were obtained using various stereometric cameras. The reduc
tion of the data involved determining the coordinates of the targets
by analytical photogrammetric techniques using the photocoordinates
obtained by observing the photographs with a stereocomparator. Dis
placements were computed in three, mutually perpendicular directions.
Surveying
Displacements were calculated for the three mutually perpendicular
directions used in the analytical photogrammetry technique. A baseline
was established from which coordinates for targets on the members could
be set by measuring the angles from the baseline to the established
reference points. The angular measurements were made by theodolites.
5.2. Column Tests 1 and 2
Data from Column Tests 1 and 2 consisted of measured deflections,
strains, and rotations at various locations along the column length.
Four load increments were applied in sequence to the column to cause
member deformation. These increments will be referred to as Load Cases
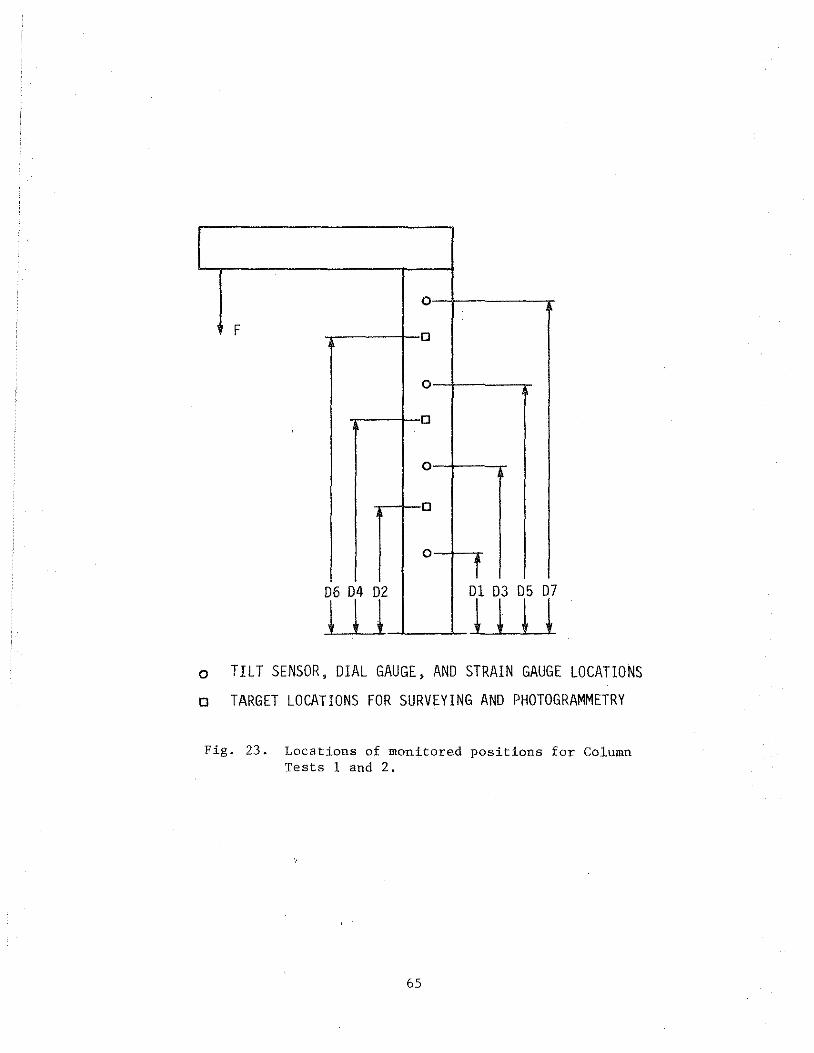
Cl, C2, C3, and C4. Figure 23 indicates the monitoring positions.
Positions Dl, D3, DS, and D7 correspond to tilt sensor, strain gauge,
and dial gauge locations. Because of unavoidable obstructions in the
laboratory, location DI was not monitored by either the photogrammetry
or surveying techniques. Targeted locations D2, D4, and D6 were used
for use by the cameras and theodolites.
64
Page 69
0
F 0
0
0
0
0
0
f D6 D4 D2 Dl D3 05 D7
ill l ! l l o TILT SENSOR, DIAL GAUGE, AND STRAIN GAUGE LOCATIONS
o TARGET LOCATIONS FOR SURVEYING AND PHOTOGRAMMETRY
Fig. 23. Locations of monitored positions for Column Tests 1 and 2.
65
Page 70
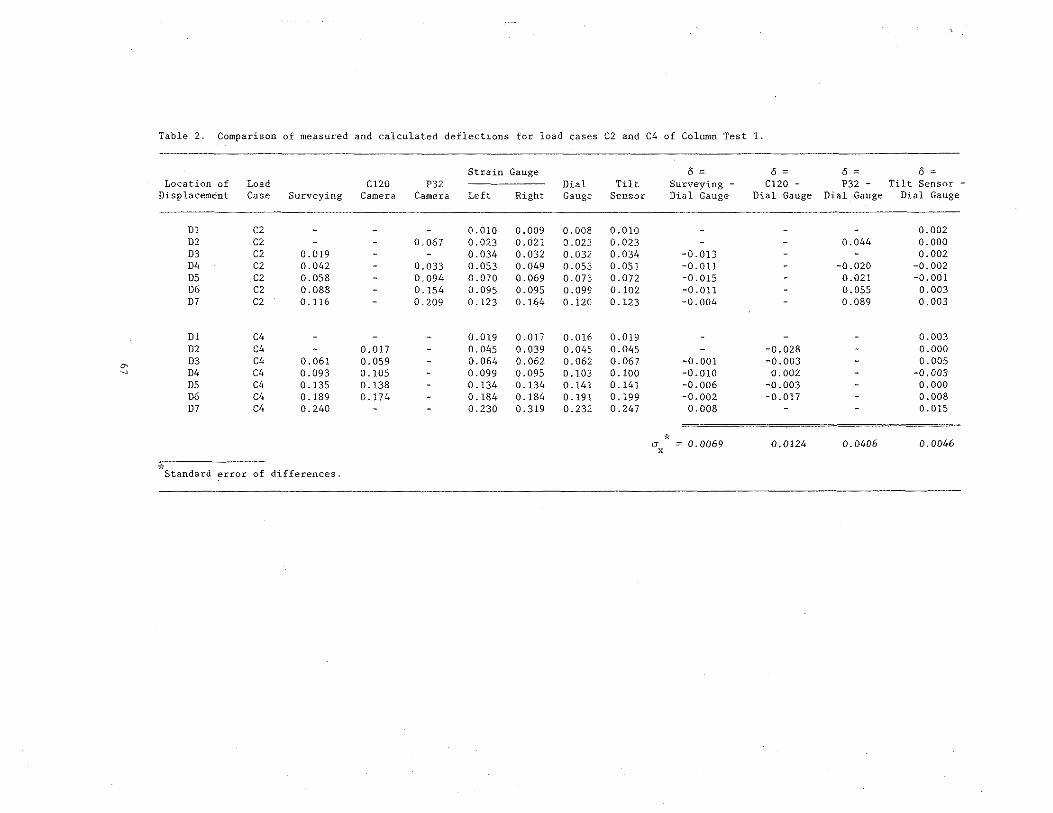
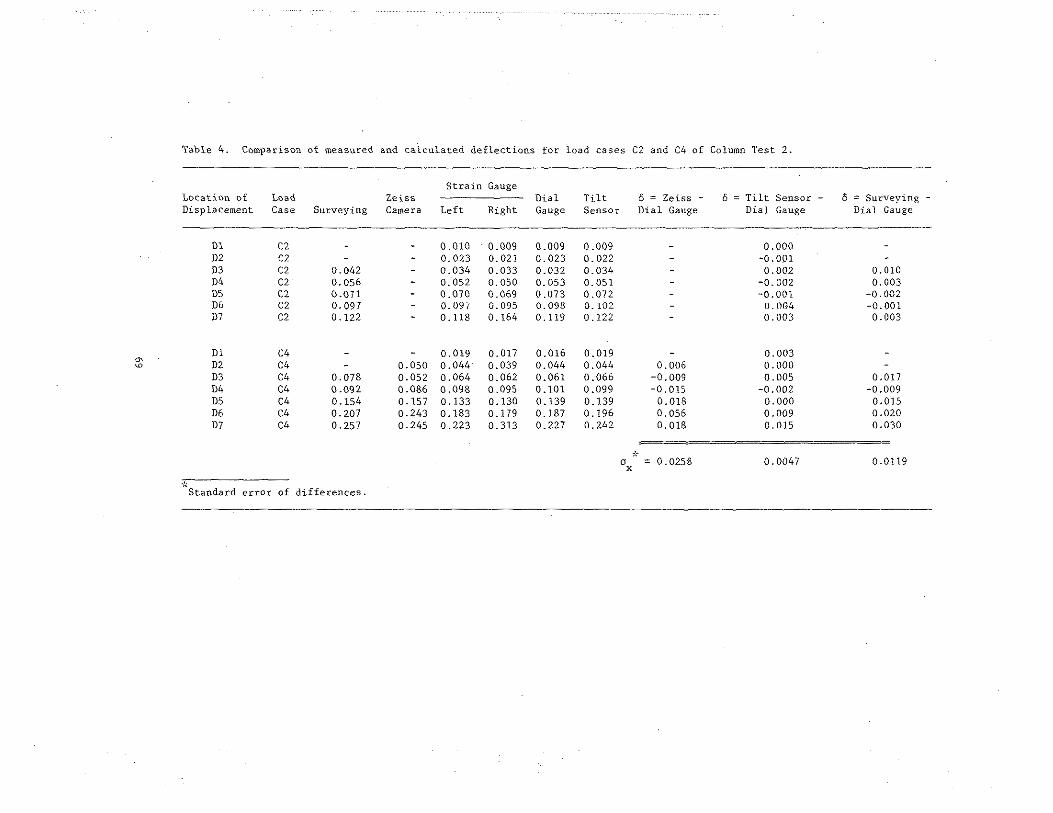
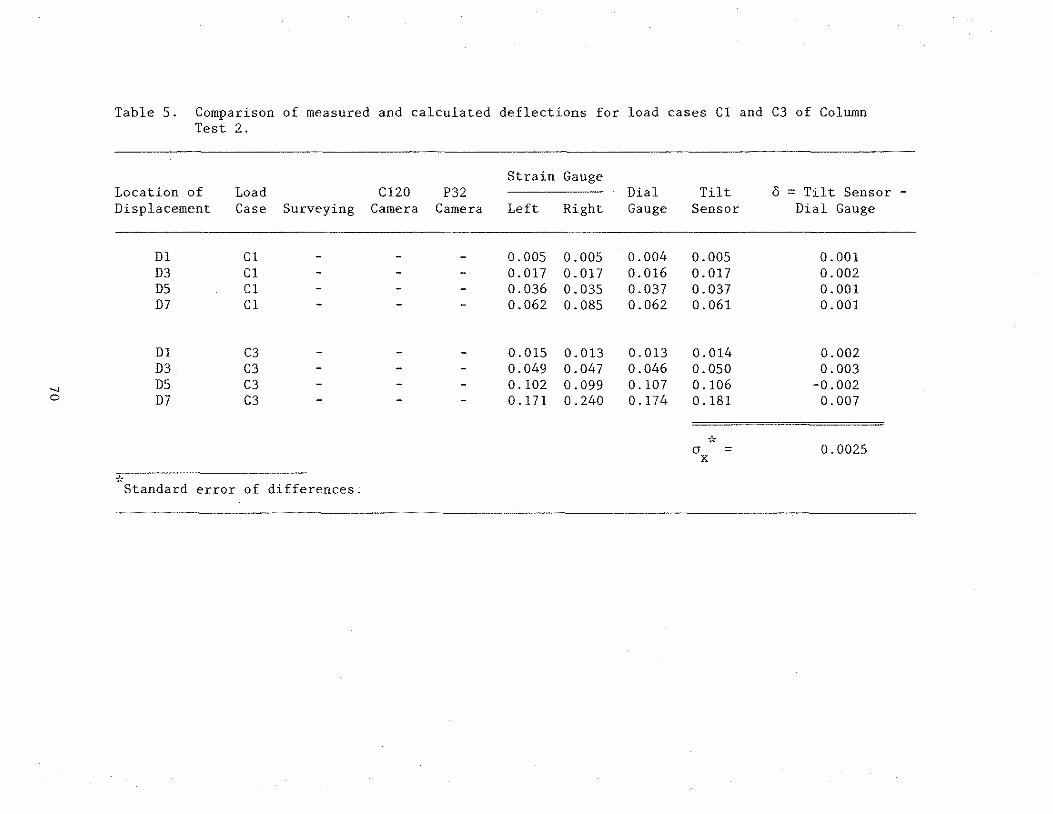
Tables 2 through 5 summarize data from the column tests and indi
cate comparisons of accuracy between the various techniques. As shown
in Tables 3 and 5, camera and theodolite data were excluded. Because
of the extensive amount of time required to make measurements and inter
pret the data, the number of observations by these methods was limited.
Observations by these methods were obtained for Load Cases C2 and C4
and one given in Tables 2 and 4. Also note that some interpolation of
gauge and sensor data was necessary in order to make comparisons at all
deformation locations.
As seen in all four tables, correlation between assumed actual
deflections (as obtained from dial gauge data) and the other techniques
was quite good. In general, the correlation between strain gauge and
tilt sensor data relative to the dial gauge data is better than corre
lations between surveying and photogrammetry relative to the dial gauges.
For Column Test 1, as shown in Table 2, very consistent results were
obtained with the strain gauges and tilt sensors at all monitoring
locations. The exception to this was the strain gauge data obtained
for Load Cases C2 and C4 at location D7 where a relatively large discrep
ency occurred. The apparent cause of the error was unexpected twisting
at the top of the column, most likely because of some small load eccen
tricity caused by the fabrication of the frame. This is shown by the
differences in the strain readings at location D7 on either side of
the neutral axis. This twisting would cause the frame to move out of
plane, which may not have been recorded by the tilt sensor or dial
gauges. A similar result was found in Column Test 2 as shown in Table 4.
The same discussions above for Table 2 also apply in general to results
in Table 4.
66
Page 71
Table 2. Comparison of measured and calculated deflections for load cases C2 and C4 of Column Test 1.
Strain Gauge 0 = 0 = 0 = 0 = Location of Load C120 P32 Dial Tilt Surveying C120 P32 - Tilt Sensor -
Displacement Case Surveying Camera Camera Left Right Gauge Sensor Dial Gauge Dial Gauge Dial Gauge Dial Gauge
DI C2 0.010 0.009 0.008 0.010 0.002 D2 C2 0.067 0.023 0.021 0.023 0.023 0.044 0.000 D3 C2 0.019 0.034 0.032 0.032 0.034 -0.013 0.002 D4 C2 0.042 0.033 0.053 0.049 0.053 0.051 -o .011 -0.020 -0.002 D5 C2 0.058 0.094 0.070 0.069 0.073 0.072 -0.015 0.021 -0.001 D6 C2 0.088 0.154 0.095 0.095 0.099 o. 102 -0.011 0.055 0.003 D7 C2 0. 116 0.209 0.123 0.164 0.120 0.123 -0.004 0.089 0.003
DI C4 0.019 0.017 0.016 0.019 0.003 D2 C4 0.017 0.045 0.039 0.045 0.045 -0.028 0.000
& D3 C4 0.061 0.059 0.064 0.062 0.062 0.067 -0.001 -0.003 0.005
~ D4 C4 0.093 0.105 0.099 0.095 0.103 0.100 -0.010 0.002 -0.003 D5 C4 0.135 0.138 0.134 0.134 0.141 0.141 -0.006 -0.003 0.000 D6 C4 0.189 0.174 0.184 0.184 0.191 0. 199 -0.002 -0.017 0.008 D7 C4 0.240 0.230 0.319 0.232 0.247 0.008 0.015
=
* a = 0.0069 0.0124 0.0406 0.0046 x
* Standard error of differences.
Page 72
C°' co
Table 3. Comparison of measured and calculated deflections for load cases Cl and C3 of Column Test 1.
Strain Gauge Location of Load Cl20 P32 Dial Tilt 6 = Tilt Sensor -Displacement Case Surveying Camera Camera Left Right Gauge Sensor Dial Gauge
Dl Cl - - - 0.005 0.004 0.004 0.005 0.001 D3 Cl - - - 0.017 0.016 0.015 0.017 0.002 D5 Cl - - - 0.034 0.036 0.036 0.037 0.001 D7 Cl - - - 0.059 0.085 0.060 0.061 0.001
Dl C3 - - - 0.015 0.013 0.012 0.014 0.002 D3 C3 - - - 0.050 0.047 0.048 0.051 0.002 D5 C3 - - - 0.105 0.104 0.110 0.108 -0.002 D7 C3 - - - 0.184 0.244 0.180 0.187 0.007
;'::: (J = 0.0025
x
* Standard error of differences.
Page 73
Table 4. Comparison of measured and calculated deflections for load cases C2 and C4 of Column Test 2.
Strain Gauge Location of Load Zeiss Dial Tilt 6 = Zeiss - 6 = Tilt Sensor - 6 = Surveying Displacement Case Surveying Camera Left Right Gauge Sensor Dial Gauge Dial Gauge Dial Gauge
Dl C2 0.010 0.009 0.009 0.009 0.000 D2 C2 0.023 0.021 0.023 0.022 -0.001 D3 C2 0.042 0.034 0.033 0.032 0.034 0.002 0.010 D4 C2 0.056 0.052 0.050 0.053 0.051 -0.002 0.003 DS C2 0.071 0.070 0.069 0.073 0 .072 -0.001 -0.002 D6 C2 0.097 0.097 0.095 0.098 0.102 0.004 -0.001 07 C2 0.122 0. 118 0. 164 0.119 0.122 0.003 0.003
Dl C4 0.019 0.017 0.016 0.019 0.003 "' D2 C4 0.050 0.044 0.039 0.044 0.044 0.006 0.000 "' D3 C4 0.078 0.052 0.064 0.062 0.061 0.066 -0.009 0.005 0.017
D4 C4 0.092 0.086 o.098 o.095 0.101 0.099 -0.015 -0.002 -0.009 DS C4 0.154 o.157 0.133 0.130 0.139 0.139 0.018 0.000 0.015 D6 C4 0.207 o.243 0.183 0.179 0.187 0.196 0.056 0.009 0.020 D7 C4 0.257 o.245 0.223 0.313 0.227 0.242 0.018 0.015 0.030
* a ; 0.0258 0.0047 0.0119 x
·!< Standard error of differences.
Page 74
.._, 0
Table 5. Comparison of measured and calculated deflections for load cases Cl and C3 of Column Test 2.
Strain Gauge Location of Load Cl20 P32 Dial Tilt 6 = Tilt Sensor -Displacement Case Surveying Camera Camera Left Right Gauge Sensor Dial Gauge
DI Cl - - - 0.005 0.005 0.004 0.005 0.001 D3 Cl - - - 0.017 0.017 0.016 0.017 0.002 D5 Cl - - - 0.036 0.035 0.037 0.037 0.001 D7 Cl - - - 0.062 0. 085 0.062 0.061 0.001
Dl C3 - - - 0.015 0.013 0.013 0.014 0.002 D3 C3 - - - 0.049 0.047 0.046 0.050 0.003 D5 C3 - - - 0.102 0.099 0.107 0.106 -0.002 D7 C3 - - - 0.171 0.240 0.174 0.181 0.007
... ~ (J = 0.0025
x
* Standard error of differences.
Page 75
The tilt. sensor dala comparisons wiLh the dial gauge data are
very good, but as shown in Tables 2 and 4, the comparisons become worse
as the column displacements increase. The trend is apparent when the
deflection differences from location DI to location D7 are observed for
each load case. The locations nearer the bottom of the column (e.g.,
location Dl) show a better comparison than at points near the top of the
column (e.g., location D7). As previously mentioned, the tilt sensors
have a linear range (or are accurate) to within ±5% of the measured angle.
Since the smaller column deflections correspond to smaller angular read
ings for the test column, the range of error allowed because of the ±5%
linearity range is less than for larger deflections. It is therefore
noted that as the measured angle increases, the accuracy of the tilt
sensor may decrease for use in measurement of deflections. In all
cases, the results obtained by the tilt sensors fell within the toler-
ance of the sensors.
Deflections obtained by surveying techniques indicated good agree
ment with dial gauge data on occasion, but the agreement was noL cor1-
sistent. There was no discernible pattern to the errors found; some
observations were higher than the actual deflections and others were
lower.
The photogrammetry data followed essentially the same pattern as
it did for the surveying method: A scattering of observed deflections
fell at random points in relation to the dial gauge data. Some obser
vations compared very well with actual column deflections, while others
were in error approximately ±10%.
71
Page 76
In addition to showing comparison of deflections for various methods,
Tables 2 and 4 also show the computed standard error of differences
used for evaluating the accuracies of the various methods. The
standard error of difference, ax' is computed by the equation
where
a2 = x n -
6. = the difference of the ith term 1
6 = the mean of the differences
n = the number of differences
(9)
By computing the standard error of difference in this way, any first
order systematic error is eliminated by computing the accuracies between
the ti;·10 methods being compared.
As shown in Tables 2 and 4, standard error of differences were
computed for the various methods relative to results obtained by the
dial gauges. The accuracy of the tilt sensor method was approximately
0.005 inches. The accuracy of the photogrammetry method varied from
approximately 0.01 to 0.04 inches depending on the camera used, with
the Cl20 camera giving the best results and the P32 camera the worst.
One possible problem with accuracy of the P32 camera may have been im-
proper lighting arrangements: a glare that made it difficult to aim ac-
curately. The surveying accuracy varied from approximately 0.007 inches
to 0.02 inches.
72
Page 77
By performing essentially the same tests at a one-week interval,
a check of the repeatability of the individual measurement methods was
possible. The additional test (Column Test 1) also provided additional
data for determining relative accuracies of the methods. Since results
from both tests were similar, it may be concluded that the repeatability
of the methods is good.
5.3. Interim Test
As previously mentioned, after the completion of Column Test 1
the load from increment C4 was maintained on the column for a one-week
period prior to performing Column Test 2. The primary purpose was to
check the stability of the tilt sensor and strain gauges. In addition,
this test was used to determine the repeatability performance of the
surveying and photogrammetry techniques, which would be highly dependent
upon relocating the same control points as used in Column Test 1.
During the one-week period the tilt sensors and gauges were con
tinuously monitored. The strip chart recorder was used to monitor the
tilt sensor, and in addition periodic readings were taken on the console
display. Table 6 shows observed differences between readings taken
daily at the end of Column Test 1 and prior to Column Test 2.
As shown, a significant drift occurred in the strain gauge readings
at all locations, while the dial gauge and tilt sensor readings were
quite stable. The electrical drift of the strain gauges occurred even
though the usual problem of "zeroing" the gauge readings was eliminated
by keeping the strain indicator box constantly connected during the
interim test period.
73
Page 78
Table 6. Differences in daily readings for the interim test period between Column Tests I and 2.
Calculated Calculated Deflections Deflections from the Strain Gauge
Time After Dial Gauge from the (in.) Column Test I Deflections Tilt Sensor
(Days) (in.) (in.) Left Right
Location DI
I 0.000 +0.0001 -0.015 +0.006 2 0.000 +0.0001 +O. 013 •0.029 3 0.000 +0.0001 -0.029 -0.018 4 0.000 +0.0001 +0.013 -0.017 5 0.000 0.0000 +O. 011 -0.012 6 0.000 0.0000 +0.006 -0.003
Location
I +0.001 0.0000 +0.038 0.000 2 0.000 -0.0001 -0.041 +0.053 3 0.000 -0.0001 -0.008 +0.054 4 0.000 +0.0001 +0.025 +0.058 5 +0.001 +0.0001 +0.032 +0.053 6 +0.001 +0.0001 +0.054 +0.053
Location D5
1 -0.001 +0.0001 -0.051 0.000 2 0.000 -0.0001 +O. 168 +0.050 3 0.000 -0.0001 +0. 140 +0.052 4 -0.001 +0.0001 +0. 138 +0.055 5 -0.001 0.0000 +o .144 +0.057 6 -0.001 +0.0001 +O. 124 +0.062
Location D7
1 0.000 +0.0001 +0.028 -0.280 2 +0.001 -0.0002 +0.049 -0.064 3 +0.001 -0.0004 +0.050 -0. 165 4 -0.001 +0.0001 +0.056 -0.210 5 -0.001 -0.0001 +0.038 -0.245 6 0.000 -0.0001 +0.045 -0.291
74
Page 79
The changes in the X, Y, and 2 coordinates (the X coordinate cor-
responds to in-plane column movement) from the surveying and photo-
grammetry techniques are shown in Table 7. Standard error of differ-
ences are computed in each coordinate direction and indicate that with
the surveying method, repeatability may be obtained with an accuracy
of CT , CT , and CT of 0.039 inches, 0.197 inches, and 0.039 inches, x y z
respectively. The large error denoted by CT is most likely due to a y
centering error of the theodolite. For the photogrammetry method using
the Zeiss camera, the accuracy of repeatability was marked by values
of 0. 15 7 inches, 0. 079 inches, and 0. 079 inches for CTx, CT , and CT , y z
respectively. The large error in o is most likely due to a pointing x
error caused by using an engraved marking on the tilt sensor. The
markings were not well defined and caused some difficulty in making
photographic measurements.
Although it is not shown in the Table 7, standard error of differ-
ences were computed for the other two cameras (P32 and Cl20) relative
to the surveying method. The results for CT , CT , and CT were 0.354 inches, x y z
0.079 inches, and 0.079 inches, respectively, for the P32 camera and
0.394 inches, 0.472 inches, and 0.079 inches, respectively, for the C120
camera. Thus it appears that a large format camera with a long focal
length, namely Zeiss, gives better accuracy in the X and Y directions.
Thus, for practical application, the Zeiss camera is desirable.
5.4. Beam Tests 1 and 2
Data from Beam Tests 1 and 2 consisted of measured deflections
and rotations at various locations along the beam. Eight displacement
75
Page 80
Table 7. Interim test data for photogrammetry and surveying collected between Column Tests 1 and 2.
---------------------------·----·-----
Difference in Coordinates
Coordinate
x y
z
x y z
x y z
x y z
Surveying (in.)
Location Dl
0.000 -0. 15 7 0.039
Location D3
0.000 -0. 15 7 0.039
Location D5
0.000 -0. 15 7 0.039
Location D7
-0.039 -0. 15 7 0.000
·;';; (J = 0.039
x
(J = 0. 197 y
(J = 0.039 z
;, Standard error of differences.
76
Photogrammetry (in. )
0.039 0. 15 7
-0.079
0.079 0. 15 7
-0.079
0. 118 0.000
-0.039
0.079 0.039
-0.118
,., (J = 0. 15 7
x
(J = 0.079 y
(J = 0.079 z
Page 81
increments, identified as Load Cases Bl through BS, were applied at
the beam end to create a rigid body rotation. The monitoring locations
are shown in Fig. 24. Positions DJ and D6 correspond to tilt sensor
and DCDT locations, respectively. Additionally, positions D2, D3, D4,
and D7 reference the target locations utilized by surveying and photo
grammetry equipment.
In making comparisons of the various measuring techniques, angular
data from the tilt sensor were reduced to deflections at all monitored
positions by assuming the member had rigid body rotation. In a similar
manner, deflections at all positions were calculated based upon the
DCDT and dial gauge data by a proportion based upon the assumption of
rigid body rotation. Tables 8 through 11 summarize the results of the
tests and show a comparison of deflection computed by the various tech
niques. As in Column Tests J and 2, a limited number of Load Cases
were considered for the surveying and photogrammetry technique. The
cases reported in Tables 8 through 11 correspond only to Load Cases B3
and BS. Photo data are excluded in Tables 8 and 10 because of an experi
mental error in obtaining the initial data. These tables include deflec
tions measured and/or calculated at the end of Load Cases B3 and B8.
Tables 9 and JJ include deflections determined by all the measuring
techniques and correspond to differences in deflections that result
from Load Case B3 to Load Case B8.
The comparisons between surveying, DCDT, and tilt data in Tables 8
and 10 indicate that the methods yield very consistent results. At
each location except DJ in Beam Test 2, the surveying results were
smaller and the tilt sensor results larger than deflections measured
77
Page 82
I
D5 D4 D3 DZ
0 0 0 0 0
/\ Dl - D6
o TILT SENSOR LOCATION
o TARGET LOCATIONS FOR SURVEYING AND PHOTOGRAMMETRY ti. DCDT LOCATION
Fig. 24. Locations of monitored positions for Beam Tests 1 and 2.
78
A I I
Page 83
-.J '.D
Table 8. Comparison of deflections for load cases B3 and B8 of Beam Test 1.
Location of Load Displacement Case Surveying
DI B3 0.029 D2 B3 0.172 D3 B3
o;~lot D4 B3 DS B3 D6 B3
Dl B8 0.101 D2 B8 0.469 D3 B8 0.596§ D4 B8 0.780§ D5 B8 0.975§ D6 B8 1.176
*Not included in a calculation. t x Experimental error.
Tilt DCDT Sensor
0.047 0.048 0.194 0.196 0.245 0.248 0.318 0.322 0.394 0.400 0. 474 0.481
0.123 0.128 0.498 0.523 0.627 0.660 0.815 0.857 1.040 1.068 1.241 1.283
6 = Surveying -DCDT
i• -0.018~
-o. 022~;
-~;rs
-0.022 -0.029 -0.031 -0.035 -0.065 -0.065
(J 'il - 0.0434 x -
!could not be determined because of experimental error at location D3. Extrapolated.
'i!Standard error of differences.
6 = Tilt Sensor -DCDT
0.001 0.002 0.003 0.004 0.006 0.007
0.005 0.025 0.033 0.042 0.028 0.042
0.0162
Page 84
Table 9. Comparison of deflections occurring from load cases B3 to B8 for Beam Test 1.
/j = 6 = Tilt Location of Load C120 P32 Tilt Surveying o = Cl20 6 = P32 - Sensor
Displacement Case Surveying Camera Camera DCDT Sensor DCDT DCDT DCDT DCDT
Dl B8-B3 0.072 0.05 0.05 0.076 0.080 -0.004 -0.026 -0.026 0.004
D2 B8-B3 0.297 0.276 0.276 0.304 0.327 -0.007 -0.028 -0.028 0.023
D3 B8-B3 0.506 0.354 0.354 0.382 0.412 -0.124 -0.028 -0.028 0.030
D4 B8-B3 0.808* 0.433 0.472 0.497 0.535 -0.311 -0.064 -0.025 0.038
'" D5 B8-B3 1.1301 0.63 0.598 0.646 0.668 -0.484 -0.016 -0.048 0.022
0 ~
a)= 0.2130 0.0184 0.0096 0.0126
* Extrapolate.
1Experimental error.
t 1Standard error of differences.
Page 85
Table 10. Comparison of deflections for load cases B3 and B8 of Beam Test 2.
Location of Load Tilt 6 = Tilt Sensor - 6 = Surveying -Displacement Case Surveying DCDT Sensor DCDT DCDT
Dl B3 0.060 0.060 0.067 0.007 0.000
D2 B3 0.180 0 .179 0.200 0.021 0.001
D3 B3 0.225 0.225 0.252 0.027 0.000
D4 B3 0.290 0.292 0.328 0.036 -0.002
D5 B3 0.359 0.364 0.408 0.044 -0.005
co ,_. Dl B8 0.226 0.156 0.175 0.019 0.070
D2 B8 0.459 0.460 0.525 0.065 -0.001
D3 B8 0.589 0.592 0.662 0.070 -0.003
D4 B8 0. 777 0.768 0.860 0.092 0.009
D5 B8 0. 977 0.957 1.071 0.114 0.020
;';;
(J = 0.0348 0.0227 x
Standard error of differences.
Page 86
Table 11. Comparison of deflections occurring from load cases B3 to B8 for Beam Test 2.
6 = 6 = 6 = Tilt Location of Load Zeiss Tilt Surveying - Zeiss - Sensor -Displacement Case Surveying Camera DCDT Sensor DCDT DCDT DCDT
Dl B8-B3 0.166 - 0.103 0.108 0.063 - 0.005
D2 B8-B3 0.279 - 0.305 0.325 -0.026 - 0.020
D3 B8-B3 0.364 0.354 0.394 0.41 -0.030 -0.040 0.016
D4 B8-B3 0.487 0.470 0.510 0.532 -0.023 -0.040 0.022
D5 B8-B3 0.618 0.630 0.635 0.663 -0.017 -0.005 0.028
"" N
* a = 0.0392 0.0202 0.0086 x
'" Standard error of differences.
Page 87
by the DCDTs. The resulting accuracy indicated by the standard error
of differences, a , for surveying method was approximately 0.02 to x
0.04 inches. Tilt sensor data indicated accuracies from approximately
0.02 inches to 0.03 inches.
Comparisons between all the methods used in Beam Tests 1 and 2
are shown in Tables 9 and 11. These data correspond to differences
caused by incremental loading from Load Cases B3 to B8. As shown in
Table 9, the data obtained from the two cameras (Cl20 and P32) and the
tilt sensor indicate consistent differences relative to the DCDT data;
whereas, the surveying data are erratic at locations D3, D4, and DS.
The accuracy of the methods is illustrated by the calculated standard
error of differences, a , shown in the table. The large difference of x
0.21 for the surveying method was caused by an observation error at
location D3 using the theodolite. The differences indicate accuracies
of 0.01 to 0.02 inches for photogrammetry.
In order to assess the accuracy of the tilt sensors further, the
angular measurement was compared to an angle calculated from DCDT data
and is shown in Table 12. Eight load cases and the angle calculated
from the DCDT data based upon rigid body rotation are shown. In all
cases the tilt sensor recorded angles greater than those calculated
for rigid body rotation. However, the discrepency may be accounted
for by considering that the values are within the ±5% linearity range
associated with the sensors. Similar results were found for Beam Test 2
as shown in Table 13.
83
Page 88
Table 12. Angles measured by the tilt sensor for Beam Test 1 compared to angles calculated from DCDT data.
Measured Angle Calculated Angle Tilt Sensor Load Tilt Sensor DCDT Error Case (arc minutes) (arc minutes) (percentage)
Bl 4.91 4.57 +6.9
B2 9.52 9.58 +0.6
B3 14.74 14.64 +0.6
B4 19.66 19.50 +0.8
BS 24.85 24.29 +2.3
B6 29.79 28. 96 +2.8
B7 34. 71 33.39 +3.8
B8 39.32 37.20 +5.4
84
Page 89
Table 13. Angles measured by the tilt sensor for Beam Test 2 compared to angles calculated from dial gauge data.
Measured Angle Calculated Angle Tilt Sensor Load Tilt Sensor Dial Gauge'" Error Case (arc minutes) (arc minutes) (percentage)
Bl 4. 71 4.51 +4.2
B2 9.63 9.25 +3.9
B3 15 .11 14.43 +4.5
B4 19.60 18.95 +3.3
BS 25.24 24.58 +2.6
B6 29.98 29.09 +3.0
B7 34.70 33.60 +3.2
BS 39.44 37.88 +4.0
from dial gauge #1.
85
Page 90
5.5. Beam Test 3
Test 3 involved the simultaneous testing of the tilt sensors by
mounting the sensors at different locations along the horizontal member
(see Fig. 25). No surveying or photogrammetric data were taken. As
was the case in Beam Tests 1 and 2, the member end was systematically
raised through an angular range corresponding to the limits of the
sensor equipment. The increments of member end displacement are denoted
as Load Cases 1 through 7. The member end deflections were recorded
by a dial gauge and based on the assumption of rigid body rotation of
the member, an angle of rotation was calculated. This angle was com
pared to the sensor angular readings.
Table 14 summarizes Beam Test 3 results. Each of the four sensor
readings were consistently different from each other, with all but
Tilt Sensor #4 recording angles larger than those calculated from the
dial gauge readings. In all but a few cases, the difference between
the tilt sensor and dial gauge readings were within ±5% of the measured
angle. The problem with these specific cases could be attributed to
experimental error. In some cases during the test, vibrations in the
laboratory were apparently detected by the sensors, and these vibrations
made it difficult to obtain a stable reading. On these occassions,
the reading would fluctuate approximately 0.05 arc minutes, which is
great enough to account for the discrepency mentioned above.
Note that in comparing the tilt sensor readings, two different
sensors may disagree by as much as 10% of the angular measurement and
still work properly because of their linearity range. One reading may
86
Page 91
(D 0 @ @ ll
l 0 TILT SENSOR
ll DIAL GAUGE LOCATION
Fig. 25. Location of instrumentation for Beam Test 3~
87
Page 92
Table 14. Angles measured by tilt sensors for Beam Test 3 compared to angles calculated from dial gauge data.
Load Case
1
2
3
4
5
6
7
T.S. Ill
5.46
9.03
16.85
22.54
28.61
34.45
38.56
Measured Angle Tilt Sensor
(arc minutes)
T. S. 112 T. S. 113
5.43 5.38
8.99 8.97
16.85 16.66
22.47 21. 98
28.29 27.72
33.87 33.18
37.62 37.01
88
T. S. 114
4.67
7.92
14.83
19.89
25.14
30.25
33.86
Calculated Angle Dial Gauge
(arc minutes)
5.04
8.43
15. 94
21.38
27.06
32.34
35.92
Page 93
be 5% lower and the other 5% higher relative to the correct angle.
Considering that the angular range in this test was approximately 40 arc
minutes, the two sensor readings may differ by as much as 4.0 arc min
utes. This explains the wide disparity between Tilt Sensors #1 and #4 .
. 6. Beam Test 4
Data from Beam Test 4 consist of angles that were measured and
calculated to determine the sensor's reliability and accuracy due to
both static and nonstatic loading. Ten different displacement rates
were applied to the end of the test member to create rigid body rota
tion to assess the accuracy relative to the nonstatic loading. Two
limiting end displacements were considered (1/8 in. and 1/2 in.), and
comparisons were made between the sensor angular measurement and the
angle calculated from member end displacements based upon rigid body
rotation. Table 15 summarizes the test results and shows the compari
sons. Plots of the response data are shown in Fig. 26.
As the data in the plots indicate, and as was expected in the
smaller movement cases, the tilt sensor reading was more accurate than
the large movement case. The sensors have a settling time of 15 seconds,
and it is apparent that the readings will be closer to the actual
stabilized values given more time for the full movement to occur. If
the load rate and the recorder angular value are known, a qualitative
assessment may be made from these data as to the actual member displace
ment. Table 15 also shows the measured angle after the tilt sensor is
stabilized. This angle is compared to the angle calculated for rigid
89
Page 94
"' 0
Table 15. Static and dynamic test results for Beam Test 4.
Maximum displacement 1/8 inch.
Time of Displacement
(sec.)
0.5 5.0
10.0 15.0 18.0 20.0 30.0 40.0 50.0 60.0
Measured Angle Tilt Sensor ifl
After 1 sec. Stabilized (arc min.) (arc min.)
4.2 7.27 4.9 7.25 5.3 7.25 5.8 7 .24 6.0 7.24 6.1 7.24 6.5 7.24 6.7 7.23 6.8 7.23 6.9 7.23
Calculated Tilt Sensor Angle Ill Error
(arc min.) (percentage)
7.10 +2.33 7.10 +2.07 7.10 +2.07 7.10 +1. 93 7.10 +1. 93 7.10 +1.93 7.10 +1.93 7.10 +1.80 7.10 +1.80 7.10 +1.80
Page 95
Table 15. (Continued).
Maximum displacement 1/2 inch.
Measured Measured Angle Angle Tilt Tilt Sensor #1 Sensor #2
Time of Calculated Tilt Sensor Displacement After 1 sec. Stabilized Stabilized Angle #1 Error
(sec.) (arc min.) (arc min.) (arc min.) (arc min.) (percentage)
0.5 18.6 29.27 29.27 28.65 +2.12 5.0 20.6 29 .14 28.99 28.65 +1.68
10.0 21.8 29 .11 28.99 28.65 +1.58 15.0 23.9 29.14 28.95 28.65 +1.68
"" 18.0 25. I 29.15 28.95 28.65 +1.72
~ 20.0 25.1 29.15 28.82 28.65 +1.72 30.0 26.6 29.10 28.95 28.65 +1.55 40.0 27.2 29.10 28. 77 28.65 +1.55 50.0 27. 7 29.22 29 .10 28.65 +l. 95 60.0 27.9 29.14 28.95 28.65 +1.68
Page 96
30 STABILIZED READING .
z: ..... ::;;:: MAXIMUM DISPLACEMENT 1/2" ~ 25 < . (!) z: ..... Cl < :i! 20
"' 0 (/)
z: LU (/)
i::; 15 ..... f-
. z: ..... 0 ::;;::
~ 10 < . STABILIZED READING (!) z: ..... Cl < LU
5 MAXIMUM DISPLACEMENT 1/8" "' ~ "' 0 (/)
z: LU (/)
f- I l l I I _J
00 ..... 10 20 30 40 50 60 f-
TIME FRAME, SEC.
Fig. 26. Plot of response data for the tilt sensor.
92
Page 97
body motion using the displacement data obtained from the MTS trans
ducers. As shown for all cases, the difference in the angular readings
is quite small and is well within the ±5% range associated with the
sensors. The data from these tests further illustrate the excellent
repeatability of the sensors' performance.
When the tests in this study were being set up, a concern was
expressed that a possible error might exist in measurement if the tilt
sensors and the member rotate through different vertical planes. When
the sensor results were compared for all the beam tests, Beam Test 4
results were the best. This may be because Beam Test 4 conditions
were the most favorable for eliminating possible out-of-plane movement.
93
Page 98
6. SUMMARY AND CONCLUSIONS
6.1. Summary
The accurate measurement of long-term moveme.nt is very difficult
to achieve in the field. Environmental conditions can create problems
with instrumentation, and maintaining fixed reference points from which
to make measurements is extremely difficult. Instrumentation and tech
niques that are used successfully in the laboratory are inadequate in
many cases for field use.
Two specific applications have been identified in Iowa where long
term movement data are needed. One example involves the Mississippi
River Bridge in Lansing, Iowa. Accidental barge impacts have occurred
with the main span pier over the past few years, and concern exists as
to whether any permanent pier misalignment has occurred. In another
case, the magnitude of stresses induced in an abutment piling of integral
abutment bridges is the concern. In prior studies sponsored by the
Iowa DOT, analytical models have been developed to predict pile stress
behavior that is due to bridge longitudinal movement. Field informa
tion on actual overall bridge movement is needed in order to validate
the model.
The literature study identified a number of methods and types of
instrumentation for monitoring field movements. Techniques related to
surveying, dial gauges, strain gauges, tilt sensors, and methods that
could be classified as mechanical in nature were included in the study.
These mechanical methods are best described as involving combinations
of the previously mentioned methods and instruments. An assessment
95
Page 99
was made of these methods as to their feasibility in making measurements
for the applications identified earlier.
The laboratory testing program, which was set up to study the
applicability of photogrammetry and tilt sensor instrumentation and
techniques in the field, was effective. Tests were devised to evaluate
these methods' reliability, accuracy, and ease of use. Tests also deter
mined shortcomings regarding possible use of the various methods. Ver
tical column and horizontal beam members served as the test members and
allowed member curvature and rigid body rotation to be simulated. Lab
oratory dial gauges and strain gauges provided reference data to verify
deflection determined by various methods.
The tilt sensors were found to be very precise and sensitive instru
ments. They were simple to operate, and their repeatability performance
was excellent. The entire sensing system has the capability of contin
uously monitoring, which, along with its excellent stability over time,
makes it very useful for making long-term measurements. However, an
important limitation of the system is its inability to monitor direct
translations. The sensor monitors tilt or angular change and, therefore,
requires knowledge of the center of rotation or the type of member end
conditions. Because of the tilt sensors' inherent tolerance in angular
measurement, which is directly proportional to the measured angle,
more accurate measurements of deflections are possible if small angles
are involved. The effect of the structure's out-of-plane movement to
the in-plane movement as measured by the sensors is minimal and may be
neglected. The sensors are intended for measurement of static movement
and will yield inaccurate results if applied in a nonstatic environment.
96
Page 100
Analytical photogrammetry proved to be a feasible method for making
accurate measurements provided that a sensitive camera was used. Three
cameras were used in the study, two of which were stereo cameras. The
Zeiss stereo camera was shown to be the most accurate. The photographs
from this camera were of the highest quality and made data reduction
with a comparator easier to perform. The camera's accuracy for long
term movement will be greatly dependent upon being able to reestablish
the camera control point. Also, the method is very dependent upon ac
curately establishing and maintaining additional control points. The
type of target used is important to the accuracy attained with this
method. Background lighting is also an important parameter for making
accurate measurement·.
The surveying method provided accuracies similar to the photo
grammetry method, except for a few cases where human error caused signi
ficant errors. Many of the problems associated with photogrammetry
also apply to surveying methods, since gaining and maintaining control
and using proper targets for accurate sighting are common concerns.
The method's accuracy may be improved by establishing a larger base
line for horizontal control. Obtaining data by surveying is much more
time conswning compared to the photogrammetry method.
Recommendations for field application procedures have been made
for the methods considered in this study. It is clear from this study
that no one method of obtaining long-term movement data would provide
the best results for every application. The problems associated with
obtaining movements for a typical integral abutment bridge are obviously
different than those associated with a major river crossing structure,
97
Page 101
such as the Mississippi River bridge in Lansing, Iowa. However, using
the recommended field application procedures, a proposal could be written
and detailed procedures could be designed to obtain data in the field.
6.2. Conclusions
The following conclusions were developed as a result of this study:
1. Tilt sensors are very stable, precise, and sensitive instruments.
2. Tilt sensors will provide better accuracy if angular movements are small when measuring deflection.
3. Tilt sensors are unable to monitor nonstatic movement accurately.
4. Tilt sensors should provide accuracy within approximately 0.02 inches when measuring deflections, provided that reasonably accurate assumptions are made regarding the member's center of rotation.
5. Analytical photo gramme try accuracy is related to lighting, the type of target, and the ability to gain control of the camera setup point and background reference points.
6. Photogrammetry data indicated that the camera orientation changed slightly for each exposure. Care must be taken to restrict the camera 1 s orientation.
7. A large format stereo camera with large focal length provides the best accuracy.
8. Photogrammetry should provide accuracy within 0.02 inches in measured deflections. Accuracy attainable in the field will be dependent upon the distance the camera is located from structure.
9. Since photogrammetry accuracy may be determined within 0.02 inches when the camera is located approximately 10 meters from the member, it is expected that movement may be detected within an accuracy of 0.02 inches when the camera is 100 meters from the member.
10. The most probable error in the surveying method was centering the theodolite. This could be improved by using well-defined survey stations.
11. The accuracy of the surveying method was about 0.03 inches. This may be improved by using a least squares adjustment method using three or more stations, as well as using first order triangulation procedures with theodolites that make measurements to an accuracy of 0.2 seconds of arc.
98
Page 102
12. The most probable error in the photogrammetry method was due to a pointing error on the target. This could be improved by using targets with better defined reference lines.
99
Page 103
7. RECOl111ENDED STUDIES
This study has shown that tilt sensor and analytical photogrammetry
techniques can be used accurately in the measurement of long-term struc
tural movements. In view of the results of this study, the following
is recommended:
e One or more bridges should be monitored for long-term movement
utilizing the tilt sensing system and analytical photogrammetry
methods. Monitoring should occur over a time frame of 1 1/2
to 2 years.
• Additional laboratory testing should be performed to determine
the feasibility of using tilt sensors as displacement trans
ducers to measure deflections directly for certain applications.
This recommendation also applies to other possible transducers,
such as a linear variable displacement transducer (LVDT) or
any mechanical-type method.
101
Page 104
8. ACKNOWLEDGMENTS
The study presented in this report was conducted by the Engineering
Research Institute of Iowa State University and was sponsored by the
Highway Division, Iowa Department of Transportation, through the Iowa
Highway Research Board under Research Project HR-275.
The authors wish to extend appreciation to the engineers of the
Iowa DOT for their support and cooperation. Sincere appreciation is
extended to Vernon J. Marks, Research Engineer, Iowa DOT; and Lowell
F. Greimann, F. Wayne Klaiber, and Wallace W. Sanders, Jr., Professors
of Civil Engineering at Iowa State University. Appreciation is also
extended to the following firms who provided services in the laboratory
investigation: Dennett, Muessig, Ryan and Associates of Cedar Rapids,
Iowa, and Aerometric Engineering of Sheboygan, Wisconsin.
Special thanks are given to the following students for their assis
tance in various tasks of the project: Douglas L. Wood, Paul Free,
Marlee Morse, Edward Kasper, and Supachi Sirayanone.
103
Page 105
9. REFERENCES
1. Moulton, L. K. and Kula, J. R., ''Bridge Movements and Their Effects.'' Public Roads. Vol. 44, No. 2, September 1980. pp. 62-75.
2. Wolde-Tinsae, A. M., Griemann, L. F. and Yang, P. S., Nonlinear Pile Behavior in Integral Abutment Bridges, Final Report, DOT Project HR-227, ISU-ERI-Ames 82123, February 1982.
3. Yang, P. S., Wolde-Tinsae, A. M. and Greimann, L. F., Nonlinear Finite Element Study of Piles in Integral Abutment Bridges, Final Report, DOT Project HR-227, ISU-ERI-Ames 83068, September 1982.
4. Jorgenson, J. L., "Behavior of Abutment Piles in an Integral Abutment Bridge," Engineering Experiment Station, North Dakota State University, November 1981.
5. Stewart, C. F., "Long Highway Structures Without Expansion Joints," Final Report, Report No. FHWA/CA/SD-82-08, California Department of Transportation, May 1983.
6. Cape, James, "When Treatment Tanks Lift and Tilt," Public Works, February 1984.
7. Ness, B. W., "Monitoring Movement of the Zilwaukee Bridge," Research Report No. R-1250, Testing and Research Division, Michigan Department of Transportation, January 1985.
8. Clarke, J. L. and Jewell, R. G., "Monitoring of a Reinforced Concrete Reservoir," Technical Report Cement and Concrete Association, March 1984.
9. Hoffman, P. C., McClure, R. M. and West, H. H., "Temperature Problem in a Prestressed Box-Girder Bridge," TRB Transportation Research Record 982.
10. Shiu, K. N., "Seasonal and Diurnal Behavior of Concrete BoxGirder Bridges," TRB Transportation Research Record 982.
11. Burdette, E. G. and Goodpasture, D. W., "Thermal Movements of Continuous Concrete and Steel Structures,'' Research Project No. 77-27-2, Tennessee Department of Transportation, University of Tennessee, Final Report, January 1982.
12. Ni cu, N. D. , Antes, D. R. and Kessler, R. S. , "Field Measurement on Instrumented Piles Under an Overpass Abutment," Highway Research Record, Number 354, 1971, pp. 90-102.
105
Page 106
13. Hilton, M. H., "Deflections and Camber Loss in Heat-Curved Girders," TRB Transportation Research Record 950, Vol. 2, 1984, pp. 51-59.
14. Erlandson, J. P., and Veress, S. A., "Methodology and Standards for Structural Surveys." Symposium on Close-Range Photogrammetric Systems, University of Illinois, Champaign, Illinois, July 28 -August 1, 1975, 575-596.
15. Bales, F. B. , "Close Range Photogrammetry for Bridge Measurement," TRB Transportation Research Record 950, Vol. 1, 1984. pp. 39-44.
16. Holowka, M., "Analysis and Testing of a Trapezoidal Box-Gir.der Bridge," TRB Transportation Research Record 665, Vol. 2, 1978, pp. 81-89.
17. Downey, G. L. and Ekstrom, R. E., "Strain-gage Embedment Techniques for Long-term Measurements in Concrete," Experimental Techniques. October 1982, pp. 6-11.
106
Page 107
10. APPENDIX A:
RECOMMENDATIONS AND PROCEDURES FOR FIELD
APPLICATION OF BRIDGE MEASUREMENT
107
Page 108
This section briefly describes the procedures used to make field
measurements using the instrumentation investigated in this study. The
recommendations are based on the literature review and the laboratory
testing.
It is anticipated that any direct translations of the pier on the
Lansing Bridge are small. Therefore, the primary cause of deflection
will come from the pier's rotation because of the barge's impact. While
the magnitude and direction of the applied force is uncertain as is the
resulting pier displacement, the pier's movement may be resolved in
directions parallel and perpendicular to the center line of the bridge.
It is suggested that the tilt sensor system be used to monitor these
movements. Proposed instrumentation of the pier is shown in Fig. A.I.
Two tilt sensor units, one attached on the pier's side face and another
on the pier's front face, could monitor anticipated pier movements.
Because of the massive size of the pier, little if any member
curvature can be assumed to occur. Pier displacement may be probably
best described as rigid body rotation. Therefore only one tilt sensor
unit is necessary to monitor pier movement in each direction as sug
gested. In this case the pier's base is assumed to be stationary with
rotation occurring about this location. Movement of the pier foundation
is not considered probable given the relative size of the structnre
and the assumed foundation support.
In considering movements of the integral abutment bridges, both
the abutment's translation and rotation must be considered. Temperature
effects causing expansion and contraction of the bridge superstructure
can displace the entire abutment horizontally along the bridge's center
108
Page 109
TILT SENS .
OR-~ @]
0
. . - . . - - .... ...., .,,,. ...
FRONT VIEW SIDE VIEW
Fig. A.1. Tilt sensor arrangement for monitoring pier movemento
109
'<"7
=
Page 110
line as well as cause abutment rotation. Monitoring abutment rotation
may be performed using the tilt sensor system, which may involve mount
ing a single tilt sensor unit at a convenient location on the side
face of the abutment's diaphragm. Rotation of the abutment is essen
tially that of a rigid body because of a large width-to-depth ratio of
the abutment, so again a single tilt sensor unit is sufficient to moni
tor rotational movement. In order to monitor abutment translation, a
mechanical device in combination with another tilt sensor unit may be
used to record abutment motion continuously. Because the tilt sensor
can only measure the angular rotation of an object, it is necessary to
convert abutment translation into a rotation. To accomplish this task,
a fixed reference point must be provided about which a rotation may be
measured. Once a reference point is established, connections may be
made tothe tilt sensor unit that is allowed to rotate as translations
occur. The tilt sensor unit could be mounted on the abutment itself or
on a simple frame connected to the abutment. Figures A. 2 and A. 3 show
these two possible setups. Possible problems exist in locating a ref
erence point near the abutment where the reference point could be sub
ject to movement by earth pressures from abutment movement. While
the advantage in using the tilt sensor system (that of making use of a
gravity reference thereby eliminating the need to maintain some fixed
reference point) is lost in having to establish another reference loca
tion, making use of other tilt sensory system components required for
monitoring of abutment rotation is feasible.
The use of analytical photogrammetry is recommended for monitoring
movement of both the integral abutment and the Lansing bridge. Appl.ica-
110
Page 111
TILT SENSOR UNIT
INTEGRAL ABUTMENT
r-1 I I I I I I I I
PILE
PIVOT PIN
VERTICAL MOUNTING PLATE
SLAB
BEAM
CONCRETE MEMBER
FIXED REFERENCE POINT
Fig. A.2. Tilt sensor arrangement for monitoring abutment translation (alternative 1).
111
Page 112
FIXED CONNECTION
STEEL MEMBERS
INTEGRAL BEAM ABUTMENT
,--, I I I I I I I
PILE
TILT SENSOR .s;:~:"'f' UNIT
VERTICAL MOUNTING PLATE
CONCRETE MEMBER
Fig. A.3. Tilt sensor arrangement for monitoring abutment translation (alternative 2).
J.12
Page 113
tion of the method would require the establishment of a minimum of six
permanent survey control markers on one side of the bridge. In addition,
two camera stations would be required on the opposite side of the bridge.
The control markers will need to be monitored to ensure no unknown
move~ent occurs.
The Zeiss stereocameras should be used, and the coordinates of the
camera stations should be determined by three-dimensional triangulation.
Distances as large as possible should be maintained between camera
stations. Coordinates of all other control points should be determined
by using first-order triangulation, trilateration, and precise leveling.
The collected data should be processed by an analytical dynamic
calibration mode, which would give the X, Y, and Z coordinates of the
points that are monitored on the pier together with their standard errors.
Using periodic measurement it will be possible to determine their three
dimensional displacements and their statistical confidence level.
113
Page 114
11. APPENDIX B:
DISCUSSION OF EXPECTED ACCURACY FOR MEASUREMENT
METHODS USED IN COLUMN AND BEAM TESTS
115
Page 115
This section briefly describes the accuracy that could be expected
for the tests conducted in this study. Discussion follows for the
various methods considered.
11.1. Tilt Sensing System
Using Eq. (2) in the text of this report, it may be stated that
the deflection fil( is related to the measured angle 8 by the relation-
ship
ez 2
If the error in the measured angle e is approximately 0.01 arc minutes
(0.000003 radians) and Z = 10 ft, the error is the calculated deflec-
tion, 6(Lll(), is given by
ez 6(Lll() = 2
= 10/2 x 12 in. x 0.000003 radians
= 0.0002 in.
(Bl)
For this specific case, the resulting sensor resolution would be less
than the desired accuracy of 0.001 in.
11.2. Analytical Photogrammetry
This discussion relies on equations and figures from Section 3.
Referring to Figs. 8 and 9, the accuracy of the ground coordinates, X
and Y, or a point, P, depends on the accuracy of the photo coordinates.
116
Page 116
If k = $ = w = X = Y : Z = 0 (thereby implying that no error exists 0 0 0
in camera nodal points resulting in a perfect camera setup), we have
from Eqs. (3) and (4)
therefore,
x = x f z
6X = Z 6x f
or X z = f x
(B2)
Assuming that the measurement of the photo coordinate is performed
with a comparator having an accuracy of 0.005 mm, the error in the
X-ground coordinate, oX, for a focal length of f = 60 mm and a distance
from the object P to the camera of Z = 6 m is
6X z (0.005) = f 6 (0.005) = 60
= 0.0005 m
= 0.02 in.
Thus, the accuracy obtained by analytical photogrammetry of the X and
Y coordinates is about 0.0005 m. This is less than the desired accuracy
of approximately 1 mm or 0.039 in.
The accuracy of the Z coordinate can also be determined from
Eg. (B2), although it is not of great interest since this coordinate
refers to out-of-plane movement.
= w = 0 for photo #1, then
As before, if X = Y = Z = k = $ 0 0 0
117
Page 117
x = ix z
and if X = B (the distance between the lenses on the stereo cameras), 0
Y = Z = k = ~ = w = 0 for photo #2, then 0 0
x' = ~ (X - B)
Taking the difference between x and x', we obtain
x - x' = i B z or Z = x - x
Calling p = x - x', Eq. (B3) can be written as
fB z = p
Then the error in the Z coordinate, 6Z, is given by
Selecting Z = 6 m, f = 60 mm, and B = 2 m, we obtain
p = 20 mm
I .,., 2 and if dp = 'I/ dx + dx2 = O.OOS m, then from Eq. (BS)
6Z = fB d 2 p p
= 60 x 2 (O.OOS) 0. OOlS m = 400
118
(B3)
(B4)
(BS)
Page 118
For B = 1 m, we obtain
oz = ~~ x (0.005) = 0.003 m
Thus the obtainable accuracy in the Z coordinate is about 1 mm to 3 mm
depending on the distance B, which is a stereo camera variable. By
substituting Eq. (B4) into Eq. (BS), we obtain
z2 62 = fB dp (B6)
Note that the accuracy in the Z direction increases with increasing Z
and decreases with increasing f.
11.3. Surveying
As mentioned in the description of the test setup in Section 4,
the baseline for calculations by this method was measured as 5 m.
Also, the angles were measured with instruments with least counts of
±1 second (0.000005 radians) and distance measurements were made with
an instrument with a least count of ±0.001 m. It may be concluded that
since the distances AC and BC are approximately 6 m (see Fig. 10), the
accuracy of distances AC and BC is likewise correct to within ±0.001 m.
The accuracy of the X coordinate of the object P, based upon the loca-
tion defined by the coordinates (X1
, Y1
, z1), is given by
ox = ox1 = AC(cosa)oa + (sina)o(AC) (B7)
If a= 60° (as in the tests conducted in this study, a 1 = a 2 = 60°) and
the other actual test values are considered .for the parameters in Eq. (B7)
119
Page 119
i.e.> oa = 0.000005 radians
AC = ~ 6 m
o(AC) = 0.001 units
we obtain
oX = 0.0005 m (assuming oX1 = O)
Thus for a and B approximately equal to 60°, the errors in the X and Y
coordinates is less than a desired value of 1 mm or 0.039 in.
For the tests performed in this study, the vertical angle, 8, is
less than 30°, and hence the error in the Z coordinate (because of
instrumental error) is also less than 1 mm. However, the vertical
angle is affected by refraction. The maximum error due to refraction
is known to be about 20 seconds (0.0001 radians). The error in the
Z coordinate, oz, is given by
2 oZ = AC sec 8 de
- AC de (BS)
for AC - 6 m and de = 0.0001 radians, we obtain
oz = 0.0006 m
This is also less than the desired maximum of 1 mm. In conclusion,
the error in the measured coordinates X, Y, Z are less than 1 mm
(0.039 in.) for the given test conditions.
The baseline for making surveying measurements was not parallel
to the axes in which the member deflections were taken (see Fig. B.1).
The relation that was used to correct this misalignment was
120
Page 120
SURVEYING ORIENTATION
x DIAL GAUGE ORIENTATION
x'
Fig. B.l. Axes' orientation for surveying calculations and movement's orientation as measured by dial gauges.
121
Page 121
b.X' = b.X cosa - ~y sina (B9)
where
b.X, ~y = survey coordinate deflections
b.X' =deflection along dial gauge axes, X
a = angle between surveying and dial gauge axes
122