108

TECH LIBRARY KAFB, NM
NASA Technical Paper 1977
1982
NASA National Aeronautics and Space Administration
Scientific and Technical Information Branch
llllllllllll rlllllllllll~llllllllillr ,I 0068347
Long-Term Thermal Degadation and Alloying Constituent Effects on Five Boron/Aluminum Composites
George C . Olsen Langley Research Center Hampton, Virginia
SUMMARY
The e f f e c t s of thermal exposures on the p rope r t i e s of f i v e boron/aluminum com- p o s i t e systems w e r e experimentally inves t iga ted . Composite specimens were f ab r i ca t ed with 49 volume percent boron f i b e r s (203 pm diameter) i n aluminum-alloy matr ices , 1100 A l , 2024 Al, 3003 Al, 5052 Al, and 6061 Al. In addi t ion , specimens of matxix a l l o y only were i d e n t i c a l l y fabr ica ted . The specimens w e r e t e s t e d as-fabricated, a f t e r isothermal exposures of up t o 10 000 hours a t 500 K and 590 K, up to 500 hours a t 730 K, and a f t e r thermal cycl ing exposure of up t o 2000 thermal cycles between 200 K and 590 K. Composite longi tudina l and t ransverse t e n s i l e s t rengths , longi tu- d ina l compression s t rength , and in-plane shear s t r eng th w e r e determined i n each condi t ion by mechanical t e s t i n g . None of the systems was severely degraded by the long-term exposure a t 590 K. The bes t performing system w a s B/2024 AI. with no t rans- verse t e n s i l e s t r eng th degradation due t o in t e rac t ion and less than 10 percent longi- tud ina l t e n s i l e s t r eng th degradation due t o in t e rac t ion .
The e f f e c t s of matr ix a l l o y s on the degradation mechanisms of the composite mater ia l s were experimentally inves t iga ted . Composite specimens and ind iv idua l f i b e r s were meta l lurg ica l ly analyzed with a scanning e l ec t ron microscope and an elec- t ron microprobe t o determine f a i l u r e c h a r a c t e r i s t i c s , chemical element d i s t r i b u t i o n , and reac t ion layer morphology. Alloying cons t i t uen t s were found t o a f f e c t the com- p o s i t e degradation mechanisms as follows: a l l o y s containing i ron , but without manga- nese a s a s t a b i l i z e r , caused increased low-temperature degradation; a l l o y s containing magnesium, i ron , or manganese caused increased degradation; and a l l o y s containing copper caused increased f i b e r s t rength .
INTRODUCTION
Technological advances i n the aerospace indus t ry continuously demand s t ronger , s t i f f e r , l i g h t e r weight s t r u c t u r a l mater ia l s capable of long serv ice l i f e a t e levated temperatures. Often these demands cannot be e f f i c i e n t l y m e t by metal a l loys . As one a l t e r n a t i v e , boron/aluminum composite technology began t o develop 25 years ago. Improvements i n the technology have included the evolut ion of 203-p-diameter boron f i b e r s with less core-flaw s e n s i t i v i t y ( r e f . 1) and improved d i f fus ion bonding tech- niques ( r e f . 2 ) . Currently boron/aluminum composites have strength-to-weight and s t i f fness- to-weight r a t i o s th ree t i m e s higher than aluminum and t i tanium a l loys .
I n i t i a l l y , t he accepted temperature f o r long-term use of boron/aluminum compos- i t es w a s 590 K ( r e f s . 3 and 4 ) . This l imi t a t ion w a s imposed by the aluminum matrix p rope r t i e s and considered t o be below the po in t of s e r ious i n t e r a c t i o n problems ( r e f . 4 ) . Most thermal degradation s tud ie s w e r e t he re fo re confined t o temperatures typ ica l of f ab r i ca t ion and secondary processing operat ions. However, a m o r e recent study of boron/6061 aluminum degradation a t exposure temperatures of 450 K, 560 K, and 700 K f o r up t o 10 000 hours reported severe s t r eng th degradation and recommended a maximum use temperature of 450 K ( r e f . 5 ) .
Fiber-matrix bonding and composite property degradation have been a t t r i b u t e d t o an aluminum-boron r eac t ion 'forming AIBZ ( r e f . 6 ) . a l l o y s w e r e s a i d t o be less reac t ive with boron than aluminum and w e r e not considered s i g n i f i c a n t cont r ibu tors t o composite degradation ( r e f . 2 ) . As a r e s u l t , aluminum
Other cons t i t uen t s of aluminum
matrix a l loys have been se l ec t ed on the b a s i s of bonding c h a r a c t e r i s t i c s , f r a c t u r e toughness, creep forming capab i l i t y , s t r eng th , and corrosion r e s i s t ance ( r e f . 2 ) without concern about t he e f f e c t of t h e i r a l loy ing cons t i t uen t s . However, recent work on boron/6061 aluminum composites ( r e f s . 7 and 8) suggests magnesium, an al loy- i n g cons t i t uen t i n the matrix, is an ac t ive r eac t an t with the f i b e r . I f magnesium s i g n i f i c a n t l y cont r ibu tes t o thermal degradation of boron/aluminum composites, it could account f o r t he extremely d i f f e r e n t degradation rates f o r composites with d i f - f e r e n t a l loys reported i n the l i t e r a t u r e ( r e f s . 9 and 10). In addi t ion , t h i s theory r a i s e s quest ions about t he e f f e c t of o ther a l loy cons t i t uen t s on composite de gr ada t i on.
This i nves t iga t ion had two purposes. One was t o determine the e f f e c t s of long- t e r m thermal exposure and cyc l i c thermal exposure on the mechanical p rope r t i e s of boron/aluminum composites. The o ther w a s t o determine the e f f e c t s of the aluminum- a l l o y cons t i tuents on the degradation mechanisms i n boron/aluminum composites. To accomplish these purposes boron/aluminum composites made from f i v e commercially ava i l ab le aluminum-alloy f o i l s were s tud ied . The composites were exposed f o r up t o 10 000 hours a t 500 K and 590 K t o study behavior i n the an t i c ipa t ed use range and f o r up t o 500 hours a t 730 K t o study behavior a t an over-temperature condi t ion. Composites were thermally cycled f o r up t o 2000 cycles between 200 K and 530 K t o study e f f e c t s of rap id temperature r eve r sa l s .
Mechanical property t e s t s including longi tudina l and t ransverse t e n s i l e t e s t s , longi tudina l compression t e s t s , and in-plane shear tests were conducted on the com- p o s i t e specimens. Composite specimens and ind iv idua l f i b e r s were meta l lurg ica l ly analyzed with a scanning e lec t ron microscope and an e l ec t ron microprobe t o determine f a i l u r e c h a r a c t e r i s t i c s , chemical element d i s t r i b u t i o n s , and reac t ion layer morphology.
MATERIALS AND EXPOSURE CONDITIONS
Materials and T e s t Specimens
Boron-aluminum composites made from f i v e d i f f e r e n t aluminum a l loys were inves t i - gated. The a l loys , i n the form of 115-pm-thick f o i l s , were 1100 Al (a commercially pure aluminum), 2024 Al (a hea t - t rea tab le aluminum-copper-magnesium a l l o y ) , 3003 Al (an aluminum-manganese a l l o y ) , 5052 A l (an aluminum-magnesium a l l o y ) , and 6061 A 1 (a hea t - t rea tab le aluminum-magnesium-silicon a l l o y ) . The nominal composition, ten- s i le s t rength i n the o r i g i n a l temper condi t ion, and t e n s i l e s t r eng th i n the f u l l y annealed condition of each of these a l l o y s a re l i s t e d i n t a b l e I ( r e f . 11). The 203-pm-diameter boron f i b e r s a r e amorphous boron vapor deposited on a 12-pm-diameter tungsten wire subs t ra te . In the v i rg in s t a t e t he f i b e r s t r eng th was 3.78 GPa ( t h e mean of 25 measurements) and the e l a s t i c modulus was 400 GPa (vendor suppl ied d a t a ) .
Composite panels, 500 mm by 300 mm by 2 mm t h i ck , were f ab r i ca t ed with the com- ponent mater ia l s . Alternate layers of aluminum f o i l and boron f i b e r s were l a i d up t o form eight-ply laminates with 49 volume percent f i b e r s (except f o r B/3003 Al which had 47 volume percent f i b e r s ) . Separate panels were f ab r i ca t ed with f i b e r s o r i en ted e i t h e r un id i r ec t iona l ly or a t f45O. These panels were consol idated by a hot press d i f fus ion bonding process. The bonding parameters f o r each a l l o y system a r e l i s t e d i n t a b l e 11. The a l loys with more aluminum content have more coherent oxide layers which o f fe r more r e s i s t ance t o d i f fus ion . A s a r e s u l t , these a l loys requi re higher processing temperatures and longer processing times t o produce well-bonded
2

I
composites. In addi t ion t o the composite panels , panels of the aluminum a l loys w e r e f ab r i ca t ed i n exac t ly t h e same manner as the composite panels except no boron re in- fo rc ing f i b e r s w e r e used.
T e s t specimens, i n t h e configurat ions l i s t e d i n table 111, w e r e cu t from the panels with diamond cut-off wheels. Sets of t h ree r e p l i c a t e specimens f o r each tes t and exposure condi t ion w e r e prepared. Each specimen w a s cleaned, inspected, and sys temat ica l ly numbered and measured. After thermal exposure, t o be described l a t e r , s t r a i n gages were bonded t o the specimens. An epoxy adhesive w a s used f o r specimens t o be t e s t e d a t room temperature and a ceramic base adhesive was used f o r specimens t o be t e s t e d a t e leva ted temperature. Four gages w e r e bonded t o each specimen, t w o back t o back on the cen te r l i n e t o measure longi tudina l s t r a i n and two back t o back on t h e center l i n e t o measure t ransverse s t r a i n . In addi t ion , compression specimens w e r e equipped with epoxy-bonded aluminum gripping t abs f o r room-temperature t e s t i n g and ceramic-bonded t i t an ium t abs f o r e levated temperature t e s t i n g .
Thermal Exposures
Continuous isothermal exposures.- Continuous isothermal exposures w e r e conducted i n a i r - c i r c u l a t i n g e l e c t r i c ovens. Exposure temperatures were 500 K, 590 K, and 730 K. A t 500 K, specimens w e r e exposed f o r 5000 and 10 000 hours. A t 590 K, speci- mens were exposed f o r 2500, 5000, 7500, and 10 000 hours. A t 730 K, specimens were exposed f o r 100, 300, and 500 hours. After removal from the ovens, specimens were allowed t o cool i n ambient a i r .
Cycl ic thermal exposures.- Cyclic exposures w e r e conducted i n a dual chamber apparatus. Specimens, mounted on a mechanically driven s l i d i n g t r a y , were alter- na te ly in se r t ed i n an a i r - c i r cu la t ing , e l e c t r i c a l l y heated 590-K hot chamber and a liquid-nitrogen-cooled 200-K cold chamber. A f u l l cycle w a s 29 minutes long with exposures of 21 minutes i n t h e hot chamber and 8 minutes i n t h e cold chamber required t o approach the t e s t temperatures. A schematic drawing of the apparatus and a typ i - c a l specimen temperature p r o f i l e f o r one cycle a r e shown i n f i g u r e 1. Sets of specimens w e r e exposed t o 500 and 2000 cycles.
~~
TEST PROCEDURES
Mechanical Property T e s t s
Longitudinal and t r ansve r se t e n s i l e tests were performed on a l l f i v e of the com- p o s i t e mater ia l s . Longitudinal compression and in-plane shear tests were performed on the B/1100 Al, B/3003 Al, and B/6061 Al composite systems. Tensi le t e s t s were performed on the a l l o y specimens (specimens with no boron reinforcement). The t e s t s tandards followed, the properties determined, and load r a t e used f o r each of the tests are shown i n t a b l e I V . Room-temperature tests w e r e conducted i n a 245-kN hydraul ic tes t frame equipped with hydraulic grips. The hydraul ic g r ips w e r e used f o r tension and shear tests. Minimum gripping pressure w a s appl ied, and a c e t a t e i n s e r t s pro tec ted the specimen sur faces from damage by the gr ips . An IITFU wedge g r ip f i x t u r e ( f i x t u r e descr ' iption i n r e f . 12) w a s used f o r compression tests. Elevated temperature t e s t s w e r e conducted i n a 490-kN hydraul ic t es t frame equipped with an e l e c t r i c a l l y heated environmental test chamber. Longitudinal t e n s i l e specimens w e r e t e s t e d with mechanical c l e v i s g r ips , and t ranverse t e n s i l e and shear specimens w e r e t e s t e d with wedge gr ips . Elevated temperature compression tests a l s o
3

I I I 1 I1 Ill1 llIIl11ll11.11111l11ll11ll1l1l
used t h e I I T R I compression f ix tu re . A l l load and s t r a i n data w e r e processed through an on-line data acqu i s i t i on system programmed t o record, reduce, and p l o t the data .
F ibers w e r e chemically removed from t h e i r aluminum matrix with a heated NaOH so lu t ion (ASTM Standard D 3553-76). Individual f i b e r breaking stresses w e r e de te r - mined experimentally using t h e f i b e r bend-test f i x t u r e shown schematically i n f ig - ure 2. Fibers approximately 100 mm long w e r e bent around the successively smaller mandrels of t he tes t f i x t u r e u n t i l they f a i l e d . The mandrel on which the f i b e r f a i l e d corresponds t o a stress range determined by t h e equation f o r e l a s t i c bending stresses i n a beam, %ax = E f ( r f / G ) ( r e f . 13) , where umax is the maximum stress, Ef i s t h e f i b e r e l a s t i c modulus, rf is the f i b e r radius , and I$, i s the mandrel rad ius . A minimum of 40 f i b e r s were tested from each specimen. Strength d i s t r i b u - t i o n s were determined f o r f i b e r s removed from as- fabr ica ted specimens t h a t w e r e not mechanically t e s t e d and compared with the range and mean of the v i rg in f i b e r s t r eng th d i s t r i b u t i o n (vendor-supplied da t a ) . In addi t ion , r e s idua l f i b e r s t r eng th d i s t r ibu - t i o n s w e r e determined f o r a l l systems a f t e r mechanical t e s t i n g of t he composite. These f i b e r populat ions a r e biased by composite mechanical t e s t i n g (i.e. weaker f i b e r s are removed) but s t i l l show changes i n upper bound s t rengths and v a r i a t i o n s i n mean f i b e r s t r eng th and d i s t r ibu t ion .
Metal lurgical Analysis
Representative specimens of each composite system i n the as - fabr ica ted condi- t i o n , a f t e r isothermal exposures of up t o 10 000 hours a t 500 K, up t o 10 000 hours a t 590 K, up t o 500 hours a t 730 K, and a f t e r thermal cycl ing exposure of 2000 ther - m a l cycles between 200 K and 590 K w e r e me ta l lu rg ica l ly examined. Longitudinal and t ransverse t e n s i l e f r a c t u r e sur faces of the composites w e r e examined with a scanning e l ec t ron microscope (SEM) t o determine f r a c t u r e modes. Polished and etched ( K e l l e r ' s reagent) cross-sect ions from longi tudina l t e n s i l e specimens w e r e analyzed with an e l ec t ron microprobe t o q u a l i t a t i v e l y determine chemical element d i s t r i b u t i o n . Reso- lu t ion of the microprobe is approximately 5 pm so t h a t reac t ion l aye r s th inner than 5 pn could not be inves t iga ted .
Fibers w e r e chemically removed from t h e composite matrix (by d iges t ing the alu- minum i n a heated NaOH so lu t ion ) f o r fu r the r examination. Reaction layer morphology w a s examined by f i r s t e tch ing one end of the f i b e r s with Murakami's reagent t o remove the reac t ion layer . Then the in t e r f aces between t h e etched and unetched regions of t h e f i b e r s w e r e examined with an SEM and the chemical elements i n the reac t ion layer determined with an energy dispers ion ana lys i s of X-rays ( E D A X ) . Boron, a c e r t a i n cons t i t uen t of the r eac t ion layer , cannot be de tec ted by energy dispers ion techniques (elements with atomic numbers l e s s than 11 are t ransparent to X-rays, boron's atomic number is 5 ) .
Reaction l aye r s on chemically removed f i b e r s w e r e analyzed f o r c r y s t a l l i n e s t r u c t u r e using X-ray d i f f r a c t i o n techniques. Fibers were l a i d up s i d e by s i d e t o form a sample f o r ana lys i s . Other f i b e r s were ground and s ieved t o produce a powder sample higher i n r eac t ion product concentration. Some of the powder sample w a s f u r t h e r concentrated by chemically leaching away the boron f i b e r p a r t i c l e s with Murakami's reagent. X-ray d i f f r a c t i o n p a t t e r n s w e r e made from these samples using a copper Ka inc ident X-ray b e a m , a d i f f r a c t e d beam monochromator, a d i f f rac tometer , and a goniometer.
4
.. . . ~ ..-.. .... -. .. ._ .. . .- ... .. . . ... .~ , . . 1

RESULTS AND DISCUSSION
Results of a l l mechanical property t e s t s are shown i n t a b l e s V through X. Typical s t r e s s - s t r a i n curves f o r each condition a r e shown i n appendixes A through E. Trends i n these data are i l l u s t r a t e d i n the following sec t ions of the repor t by graphic p lo t s . These p l o t s w e r e prepared i n the following manner: mean values of the da ta were p l o t t e d and f i t t e d with s t r a i g h t l i n e segments f o r t h e well-behaved data ( a l l o y t e n s i l e data and the composite t ransverse t e n s i l e and in-plane shear data e spec ia l ly ) . Data t h a t exhib i ted l a rge s c a t t e r o r deviated s i g n i f i c a n t l y from a s t r a i g h t l i n e (composite longi tudina l t e n s i l e and compression data , p r i n c i p a l l y ) were f i t t e d with a f i r s t - or second-order polynomial i n a least-squares regression analy- sis. Data po in t s whose s tandardized r e s idua l s w e r e more than two standard deviat ions from zero w e r e dropped as out-lying poin ts and t h e mean value ca l cu la t ion and regres- s ion ana lys i s repeated f o r t h e remaining points . Those data dropped as out-lying poin ts are i d e n t i f i e d i n the t a b l e s by an a s t e r i s k .
As-Fabricated Material
Fabricat ion e f f e c t s on matrix strength.- The e f f e c t of the d i f fus ion bonding process on the matrix material s t r eng th can be seen by comparing the s t r eng th of t h e d i f fus ion bonded matrix-only specimens ( t a b l e X) with the tempered and annealed s t rengths of the a l l o y s ( t a b l e I) . Fabricat ion temperatures and t i m e s ( t a b l e 11) required t o produce well-bonded composite mater ia l s w e r e s u f f i c i e n t t o f u l l y anneal the non-heat-treatable strain-hardened 1100 A l and 3003 A l a l l o y s . The remaining strain-hardened a l l o y , 5052 Al, consolidated a t a s l i g h t l y l o w e r temperature and shor te r t i m e , approached the annealed condition (approximately 81 percent annealed) . The hea t - t rea tab le a l loys , 2024 Al and 6061 Al, were p a r t i a l l y annealed (approxi- mately 31 percent ) during f ab r i ca t ion .
Fabricat ion e f f e c t s on f i b e r strength.- Fiber s t r eng th d i s t r i b u t i o n s f o r f i b e r s chemically removed from specimens a f t e r f ab r i ca t ion without performing mechanical property tests are shown i n f i g u r e 3. Before f ab r i ca t ion , the v i r g i n f i b e r mean s t rength w a s 3.78 GPa normally d i s t r i b u t e d over t he range of 3.26 GPa t o 4.14 GPa a s ind ica ted i n t h e f igure . After exposure t o the f a b r i c a t i o n process, f i b e r s t rength d i s t r i b u t i o n s ranged from s i m i l a r t o the v i r g i n f i b e r s t o r a d i c a l l y a l t e r e d . Fibers from the 1100 Al system ( f i g . 3 ( a ) ) showed only minor degradation. Fibers from the 2024 A l system ( f i g . 3 ( b ) ) had a s l i g h t l y higher mean value but the lower l i m i t of s t r eng th w a s lower and the upper l i m i t w a s s i g n i f i c a n t l y higher. This broadened range suggests t h a t a t least two mechanisms w e r e funct ioning, one which weakened the f i b e r s and another which strengthened them. F ibers from t h e 3003 Al system ( f i g . 3 ( c ) ) su f fe red a uniform degradation i n s t r eng th of 15 t o 20 percent a s a r e s u l t of the f a b r i c a t i o n process. Fibers from t h e 5052 Al system ( f i g . 3 ( d ) ) w e r e r ad ica l ly a l t e r e d , t h e i r mean s t r eng th w a s l o w e r , t h e i r upper l i m i t was higher, and t h e i r lower l i m i t was s i g n i f i c a n t l y lower. Again, as with the f i b e r s from t h e 2024 Al system, dual mechanisms are suggested but i n t h i s a l l o y the degradation mech- anism w a s more a c t i v e and t h e s t rengthening mechanism was less ac t ive . The mean s t rength of f i b e r s from the 6061 A l system ( f i g . 3 ( e ) ) increased approximately 10 percent without any s i g n i f i c a n t change i n the lower l i m i t but a s i g n i f i c a n t increase i n the upper l i m i t . This upward s h i f t suggests t h a t a s t rengthening mech- anism w a s ac t ive .
5

Reaction l aye r s on ind iv idua l f i b e r s w e r e enhanced by par t ia l etching. These f i b e r s w e r e s tudied i n an SEM and the elemental composition of the r eac t ion l a y e r s determined by EDAX (recall that boron, a c e r t a i n cons t i t uen t of the reac t ion l aye r cannot be detected by EDAX). SEM photomicrographs of the f i b e r r eac t ion l aye r s are shown i n f igu re 4. F ibe r s from the 1100 A l system ( f i g . 4 ( a ) ) have a d e n d r i t i c reac- t i o n layer composed of aluminum with a trace of s i l i c o n . In te rspersed l ight-colored par t ic les are i r o n r ich. F ibers from the 2024 Al system ( f i g . 4 ( b ) ) have a reac t ion l aye r composed of approximately 1 part aluminum and 0.2 p a r t magnesium with t r a c e s of s i l i c o n and copper. In te rspersed l ight-colored par t ic les are 1.4 parts magnesium to 1 p a r t aluminum. F ibers from the 3003 A 1 system ( f i g . 4 ( c ) ) have a r eac t ion l a y e r of dark spher ica l p a r t i c l e s composed of aluminum and manganese with a trace of sili- con and l i g h t spher ica l particles r i c h i n i ron . F ibers from the 5052 A 1 system ( f i g . 4 ( d ) ) have a th ick reac t ion layer of approximately 1.7 parts magnesium t o 1 part aluminum with t r a c e s of s i l i c o n , chromium, i ron , and copper. In te rspersed l i g h t particles are i r o n r ich. F ibers from the 6061 Al system ( f i g . 4 ( e ) ) have a th ick reac t ion l aye r with equal aluminum and magnesium content and traces of s i l i c o n , chromium, i ron , and copper.
Pol ished c ross sec t ions of as - fabr ica ted specimens w e r e scanned with an e l ec t ron microprobe t o determine elemental gradients . Traces ac ross r eac t ion zones did no t i n d i c a t e any increased elemental concentrat ions a t the reac t ion zones. Gradients of boron and aluminum concentrat ions a t the i n t e r f a c e s did not have p l a t eaus i n d i c a t i n g t h e reac t ion zone. The lack of these p l a t eaus only i n d i c a t e s t h a t the reac t ion zone w a s smaller than the reso lu t ion of the microprobe (5 pn) .
I f these observed e f f e c t s of f ab r i ca t ion on the f i b e r s t r eng th d i s t r i b u t i o n s are compared with the a l loy ing cons t i t uen t s shown i n t a b l e I, severa l hypotheses can be proposed. F i r s t , only minor degradation i n f i b e r s t r eng th occurred during fabr ica- t i o n a s a r e s u l t of reac t ion with commercially pure aluminum. Second, manganese as the only a l loy ing element i n 3003 A 1 contr ibuted to a uniform degradation of f i b e r s t rength. t i o n i n the 2024 A 1 and 5052 A 1 a l l oys , caused the f i b e r s t r eng th degradation and lower l i m i t reduction noted i n those systems. The order of increas ing magnesium con- t e n t of these a l l o y s corresponds to the order of increased s t r eng th degradation observed. I s o l a t i o n of the lower s t rength f i b e r s , e spec ia l ly i n the 5052 Al a l loy , suggests the degradation w a s not uniform b u t a loca l i zed phenomena probably depen- dent on p a r t i c l e contac t with the f i b e r . Magnesium i s a l s o an a l loy ing cons t i t uen t i n 6061 Al, but there it is bound i n MgZ$i p a r t i c l e s and not ava i l ab le f o r f u r t h e r reac t ion . F ina l ly , increased mean f i b e r s t r eng th and upper l i m i t of the f i b e r s t rength d i s t r i b u t i o n s w e r e noted i n the 2024 A l , 5052 A l , and 6061 Al a l loys . These are copper bear ing a l l o y s with copper p re sen t i n the form of CuA12 or i n s o l i d so lu t ion . The order of increas ing copper content of these a l l o y s corresponds t o the order of increased s t rength observed; this suggests t h a t copper con t r ibu te s to a f i b e r strengthening mechanism.
Third, magnesium, usual ly present i n the form of Mg5Alg o r i n s o l i d solu-
Room-temperature composite propert ies . - Typical room-temperature as - fabr ica ted s t r e s s - s t r a i n curves f o r each composite and tes t type are shown i n f i g u r e 5. The f i r s t - s t a g e longi tudina l e l a s t i c moduli (when both f i b e r and matrix a r e e l a s t i c ) and the second-stage elastic moduli (when the matrix i s p l a s t i c and con t r ibu te s l i t t l e t o the composite s t rength) correspond t o the rule-of-mixture (ROM) p red ic t ion f o r moduli. Longitudinal t e n s i l e s t rengths , however, do not agree with ROM ca lcu la t ions based on mean f i b e r s t rength. Transverse t e n s i l e s t rengths ( f i g . 5 ( b ) ) w e r e similar t o the matrix a l l o y s bu t with much lower s t r a i n s t o f a i l u r e because of f i b e r r e s t r i c - t ion. S t r a i n hardening steps typ ica l of s t r a i n hardenable aluminum a l l o y s are pres- e n t i n the plastic region of the B/5052 A 1 t ransverse t e n s i l e curve and the B/6061 A 1
6
system t ransverse t e n s i l e and in-plane shear curves ( f i g . 5 ( d ) ) . This phenomenon, as w e l l as ea r ly f i b e r f a i l u r e s , may have contr ibuted t o t h e per turba t ions seen i n t h e l a t t e r s tages of some of t h e longi tudina l t e n s i l e curves. The B/6061 Al composite, a w e l l character ized composite system, is used as a b a s i s of comparison f o r the o the r systems. Mean values of room-temperature as - fabr ica ted mechanical proper t ies f o r each composite system as w e l l as i ts percentage d i f f e rence ( i n parentheses) compared with those f o r B/6061 Al a r e l i s t e d i n t a b l e X I . The longi tudina l t e n s i l e s t r eng th of t he B/1100 A l system is only 11 percent l e s s than t h e B/6061 A l system although t h e matrix-dominated t r ansve r se t e n s i l e s t rength , longi tudina l compression s t rength , and in-plane shear s t r eng th are 63, 37, and 33 percent less, respec t ive ly . The lon- g i t u d i n a l t e n s i l e s t r eng th of t h e B/2024 A1 system is only 7 percent less than t h e B/6061 Al system and i ts t ransverse t e n s i l e s t r eng th i s 27 percent grea te r . The B/3003 Al system longi tudina l t e n s i l e s t rength , t ransverse t e n s i l e s t rength , longi- t ud ina l compression s t r eng th , and in-plane shear s t r eng th are 27, 53, 29, and 32 per- cen t less than t h e B/6061 Al system, respec t ive ly . The longi tudina l t e n s i l e s t rength of t he B/5052 A1 system is 29 percent less than t h e B/6061 A l system but i ts t r ans - verse t e n s i l e s t r eng th is only 2 percent less.
Longitudinal t e n s i l e f r a c t u r e surfaces of a l l f i v e systems w e r e macroscopically i r r e g u l a r with matrix shear steps typ ica l ly causing 5 mm va r i a t ions i n the f a i l u r e planes. However, no f i b e r pu l lou t is evident i n the microscopic f ractographs ( f i g . 6 ) . The B/1100 Al system f r a c t u r e sur face ( f i g . 6 ( a ) ) has high necking t e a r r idges typical of the commercially pure highly d u c t i l e a l loy . The B/3003 A 1 ( f i g . 6 ( c ) ) , B/5052 Al ( f i g . 6 ( d ) ) , and the B/6061 A l ( f i g . 6 ( e ) ) systems show less d u c t i l i t y and u l t imate matrix f a i l u r e by the dimpled rupture mode. The B/2024 A 1 system ( f i g . 6 ( b ) ) shows l i t t l e d u c t i l i t y and a s t rong dimpled rupture mode r e s u l t i n g from i ts higher a l l o y content . A l l these fractographs show s o m e evidence of incom- plete matrix-matrix bonding.
Transverse t e n s i l e f r a c t u r e surfaces , f o r a l l bu t the B/6061 A1 system, w e r e macroscopically f l a t f o r t he most part but with s o m e tendency toward a 45O f a i l u r e plane; t h i s i nd ica t e s a mixed f a i l u r e mode t h a t w a s p r imar i ly t e n s i l e but with s o m e l o c a l shear f a i l u r e . The B/6061 A l systems f a i l e d on 45O planes; therefore , a matrix shear mode f a i l u r e w a s indicated. Additional f r a c t u r e sur face d e t a i l s a r e shown i n the microscopic f ractoqraphs i n f igu re 7. The B/1100 A l system ( f i g . 7 ( a ) ) f a i l e d i n tens ion through t h e matrix. Some bare f i b e r appears i n the f r a c t u r e surface, prob- ably as a r e s u l t of incomplete bonding. The B/2024 Al system ( f i g . 7 ( b ) ) f a i l e d e n t i r e l y a t t h e f iber-matr ix in t e r f ace . The B/3003 Al ( f i g . 7 ( c ) ) and the B/5052 A l ( f i g . 7 ( d ) ) systems f a i l e d i n the mixed modes of matrix and i n t e r f a c e tension f a i l - ures . The B/6061 A l system ( f i g . 4 ( e ) ) f a i l e d i n t h e matrix with elongated dimples; thus, a shear f a i l u r e w a s ind ica ted .
Residual f i b e r s t r eng th d i s t r i b u t i o n s ( f i b e r s removed from composite specimens a f t e r t e n s i l e t e s t i n g ) are shown i n f igu re 8. The r e s idua l d i s t r i b u t i o n s are approx- imately the s a m e as those obtained from untested specimens ( f i g . 3) except that t h e lower bounds have been modified by the f a i l u r e of l o w s t r eng th f i b e r s during compos- i t e t e n s i l e t e s t ing . Fiber stresses a t the composite f a i l u r e s t r a i n a r e ind ica ted f o r each system and show t h a t composite f a i l u r e occurs when only a few percent of f i b e r s have f a i l e d .
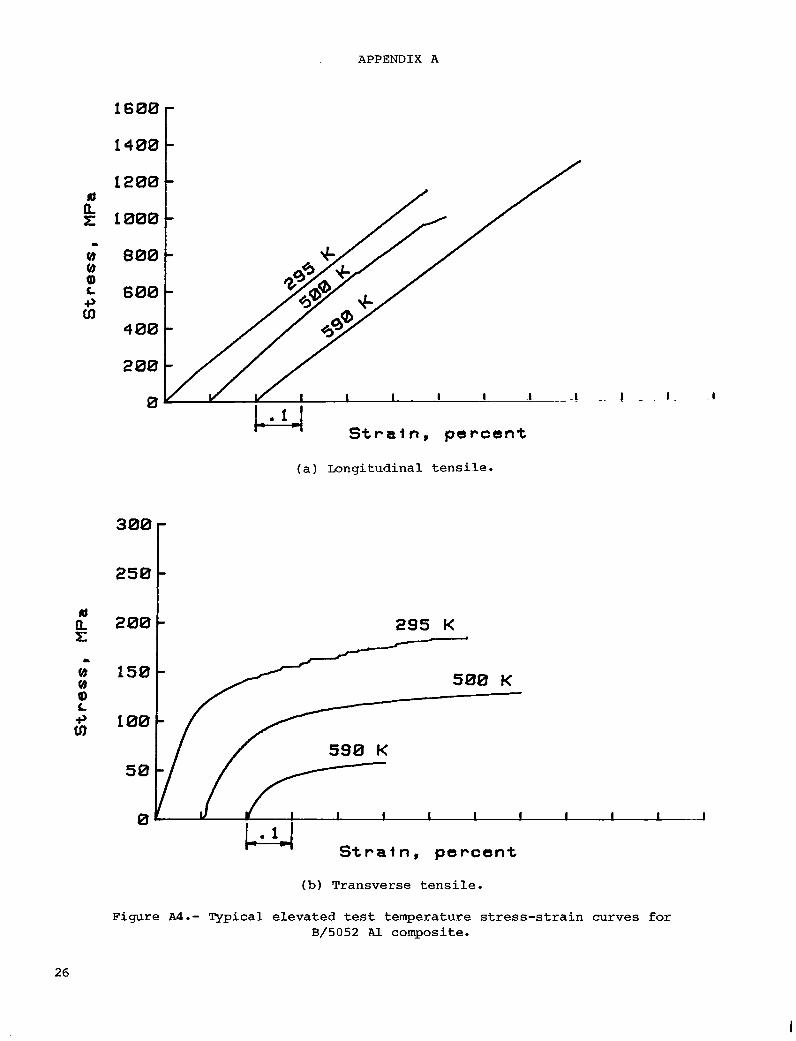
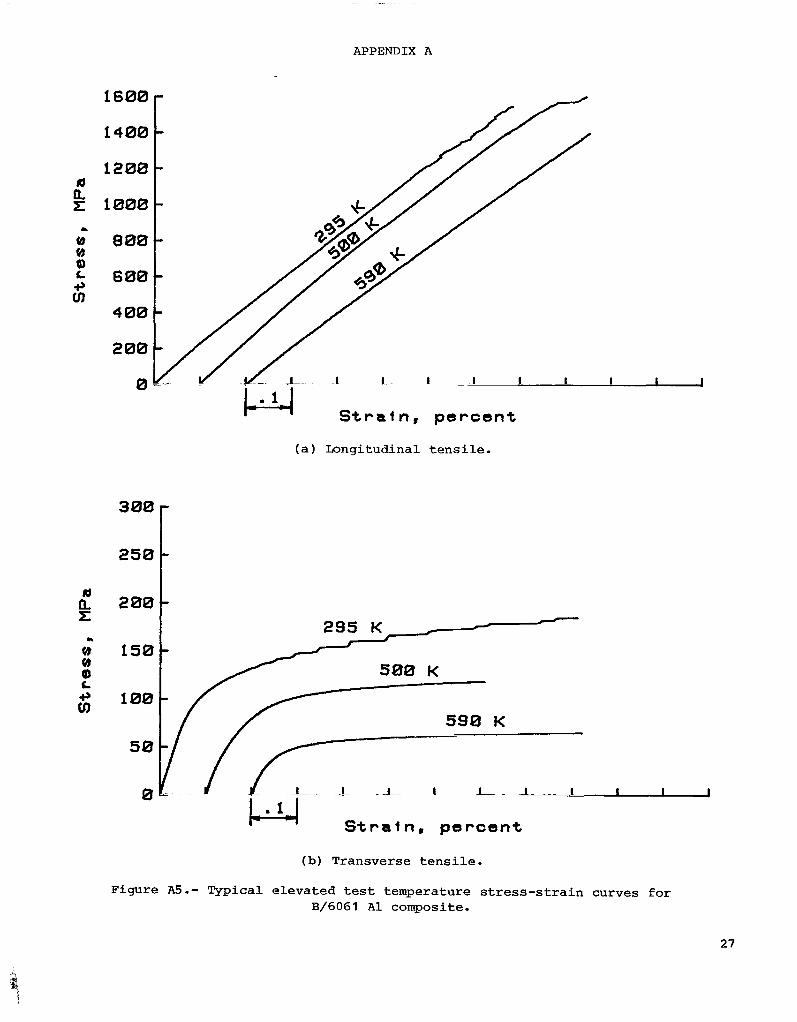
Effect- of e leva ted tes t temperature.- As-fabricated specimens from each compos- i t e system were mechanically t e s t e d a t room-temperature (295 K ) , 500 K, and 590 K. Typical s t r e s s - s t r a i n curves f o r each tes t condi t ion and composite system are shown i n appendix A. The e f f e c t s of tes t temperature on the mean u l t imate s t r eng ths of the composite systems are shown i n f igu re 9. The matrix a l l o y s alone ( f i g . 9 ( a ) ) , though
7
I I 11.11.11111111111111lll I II I
varying from 70 MPa t o 368 MPa a t 295 K, tend toward the same s t r eng th as tes t t e m - pe ra tu re increases with the v a r i a t i o n a t 590 K only 20 MPa t o 66 MPa. The composite t r ansve r se t e n s i l e s t r eng ths ( f i g . 9 ( b ) ) behaved i n t h e same manner as the a l loys . Fiber dominated longi tudina l t e n s i l e s t r eng ths ( f i g . 9 ( c ) ) of t he B/1100 Al, ~ / 2 0 2 4 Al, R/3003 Al, and B/6061 Al systems had only small losses i n s t r eng th with increas ing test temperature, whereas the B/5052 Al system had an anomalous inc rease i n s t r eng th a t 590 K. This increase probably r e s u l t e d from improved d i f fus ion bond- ing which occurs during t h e 2 hours required t o br ing the specimen and equipment t o thermal equilibrium a t 590 K. Longitudinal compression s t r eng ths ( f i g . 9 ( d ) ) f o r t h e B/1100 Al, B/3003 Al, and B/6061 A l systems a t 590 K w e r e 70 t o 80 percent less than t h e i r room-temperature s t rengths . In-plane shear s t r eng ths f o r t he same materials w e r e only s l i g h t l y decreased by the elevated temperatures ( f i g . 9 ( e) ) . These da ta show t h a t matrix-dominated s t r eng th p rope r t i e s of t h e composite system tended t o con- verge as test temperature increased, but i n general the order of h ighes t to lowest s t r eng th was maintained throughout the temperature range.
Ef fec ts of Isothermal Exposures
Exposure a t 500 K.- The e f f e c t s of isothermal exposure f o r up t o 10 000 hours a t 500 K on the t e n s i l e s t r eng ths of the matrix a l l o y s and the longi tudina l and t r ansve r se t e n s i l e s t r eng ths of the composites are shown i n f i g u r e 10. In addi t ion , t y p i c a l s t r e s s - s t r a i n curves f o r each composite material and each tes t type are shown i n appendix B. Matrix t e n s i l e s t r eng ths ( f i g . 1 0 ( a ) ) of t he non-heat- t r e a t a b l e a l loys ind ica t e 1100 Al and 3003 Al w e r e not a f f ec t ed by the 500 K expo- s u r e and 5052 Al reached its f u l l y annealed condi t ion ea r ly i n the exposure per iod and remained constant t h e r e a f t e r . The hea t - t r ea t ab le a l l o y s , 2024 A1 and 6061 Al, approached t h e i r f u l l y annealed s t rengths during t h e exposure period. Composite t ransverse t e n s i l e s t r eng ths ( f i g . 10 (b ) ) behaved i n t h e s a m e manner as the matr ix a l l o y s alone and t h e i r s t r eng th lo s ses may be a t t r i b u t e d e n t i r e l y t o matr ix anneal- ing. Composite longi tudina l t e n s i l e s t rengths ( f i g . l O ( c ) ) show los ses of 22 per- cen t f o r t he B/1100 A1 system, 17 percent f o r t h e B/6061 A l system, and 10 percent f o r the B/2024 Al and B/3003 A1 systems. Most of t he lo s ses occur i n the f i r s t 5000 hours of exposure. The B/5052 Al system long i tud ina l t e n s i l e s t r eng th w a s not degraded by the 500 K exposure.
Residual f i b e r s t r eng th d i s t r i b u t i o n s f o r f i b e r s removed from specimens a f t e r 10 000 hours exposure a t 500 K and t e n s i l e t e s t i n g are shown i n f i g u r e 11. Fiber s t r e s s a t t he composite f a i l u r e s t r a i n is indica ted f o r each system. Comparison of these res idua l s t r eng ths with the as-fabricated r e s idua l s t r eng ths ( f i g . 8 ) shows uniform degradation of approximately 5 percent i n the upper bound and mean s t r eng th of f i b e r s from the B/1100 Al system and a 10-percent reduct ion i n f i b e r stress a t f a i l u r e . Mean s t r eng th of f i b e r s from the B/2024 A l system w a s degraded but the upper bound of t h e s t r eng th d i s t r i b u t i o n and f i b e r stress a t f a i l u r e w e r e unchanged. The mean and upper bound of B/3003 Al system f i b e r s t r eng th were unchanged but the f i b e r stress a t f a i l u r e w a s degraded approximately 6 percent . The upper bound of f i b e r s t rength from the B/5052 Al system w a s degraded but there w e r e only small l o s ses i n mean s t r eng th and s t r e s s a t f a i l u r e . Mean f i b e r s t r eng th of t h e B/6061 Al system w a s degraded approximately 10 percent and stress a t f a i l u r e w a s degraded 18 percent.
Longitudinal t e n s i l e f r a c t u r e sur faces w e r e macroscopically and microscopically s i m i l a r t o t he as-fabricated specimens. Transverse t e n s i l e f r a c t u r e sur faces f o r t h e ~ / 1 1 0 0 Al, R/3003 Al, and B/5052 Al systems w e r e macroscopically i r r e g u l a r i nd ica t ing mixed mode f a i l u r e s as i n the as-fabricated composites. The B/2024 Al and B/6061 A1
8
I

systems f a i l e d on 450 planes ind ica t ing a matrix shear mode f a i l u r e . Additional f r a c t u r e surface d e t a i l s are shown i n the microscopic f ractographs i n f igu re 12. The B/1100 A l system ( f i g . 1 2 ( a ) ) f a i l u r e occurred more a t t h e i n t e r f a c e than i n t he matrix as i n the as - fabr ica ted case ( f i g . 7 ( a ) ) . The B/2024 Al s y s t e m ( f i g . 12 (b ) ) f a i l e d e n t i r e l y by matrix shear , a change from t h e i n t e r f a c e f a i l u r e seen i n the as-fabricated specimens. The remaining system f a i l u r e s w e r e s imi l a r t o t h e as - fabr ica ted system f a i l u r e s .
Exposure a t 590 K.- The e f f e c t s of isothermal exposure f o r up t o 10 000 hours a t 590 K on the matrix a l l o y s t e n s i l e s t rength and the composite system s t rengths are shown i n f igu re 13. In addi t ion , t yp ica l s t r e s s - s t r a i n curves f o r each composite mater ia l and each tes t type are shown i n appendix C. The e f f e c t of 590 K thermal exposure on the matrix a l l o y s t r eng th ( f ig . 1 3 ( a ) ) was similar t o the e f f e c t of 500 K exposure except t he 2024 A l , 5052 A l l and 6061 Al a l l o y s reached t h e i r f u l l y annealed condi t ion during t h e f i r s t 2500 hours of exposure and remained constant t h e r e a f t e r . Composite t ransverse t e n s i l e s t rength degradations ( f i g . 1 3 ( b ) ) were again s i m i l a r t o t h e matrix materials and may be a t t r i b u t e d e n t i r e l y t o matrix annealing. The longi tudina l t e n s i l e s t r eng ths of a l l the composite systems w e r e degraded by the long t e r m 590 K exposure ( f i g . 1 3 ( c ) ) , with m o s t of the lo s ses occurr ing i n the f i r s t 2500 hours of exposure. Strength losses over the 10 000 hours exposure f o r t h e B/1100 A l , B/2024 Al, B/3003 A l , B/5052 A l , and B/6061 A1 systems w e r e 10, 14, 10, 8, and 14 percent , respec t ive ly .
Longitudinal compression s t rengths ( f i g . 1 3 ( d ) ) of t h e 1100 Al, 3003 Al, and 6061 A 1 systems degraded i n an approximately l i n e a r manner over t he 10 000 hours exposure with a maximum loss of 38 percent. In-plane shear s t rengths ( f i g . 13(e) ) of the B/1100 A l and B/3003 Al systems were unaffected by the 590 K exposure. The B/6061 Al system l o s t 22 percent of its in-plane s t r eng th i n t h e f i r s t 2500-hour period, probably the r e s u l t of annealing, but then increased l i n e a r l y over t h e remaining 7500 hours f o r a ne t increase i n s t r eng th of 8 percent.
Longitudinal t e n s i l e f r a c t u r e surfaces f o r t he 590 K exposure specimens were similar both macroscopically and microscopically t o the as - fabr ica ted specimens. Transverse t e n s i l e f r a c t u r e surfaces of specimens exposed f o r 10 000 hours a t 590 K ( f i g . 14) a r e unchanged from the as-fabricated specimens except f o r t he B/2024 Al system ( f i g . 1 4 ( b ) ) which f a i l e d i n matrix shear . The t r a n s i t i o n of t he f a i l u r e mode from i n t e r f a c i a l t o matr ix shear occurred i n the i n i t i a l 2500-hour exposure per iod a s a r e s u l t of matrix annealing.
Residual f i b e r s t r eng th d i s t r i b u t i o n s f o r f i b e r s removed from specimens a f t e r 10 000 hours exposure a t 590 K and t e n s i l e t e s t i n g are shown i n f i g u r e 15. The mean s t r eng th and stress a t composite f a i l u r e s t r a i n of f i b e r s from t h e B/1100 A l system w e r e degraded approximately 5 percent when these d i s t r i b u t i o n s a r e compared with t h e r e s idua l d i s t r i b u t i o n s from as-fabricated specimens ( f i g . 8 ) . Fiber stress a t com- p o s i t e f a i l u r e s t r a i n of f i b e r s from the B/2024 Al system w a s degraded approxi- mately 7 percent by t h e exposure even though the mean . s t rength apparently increased. Mean s t rength of f i b e r s from t h e B/3003 Al system w a s degraded approximately 15 per- cen t bu t t he stress a t composite f a i l u r e s t r a i n w a s degraded only 8 percent . S t r e s s a t composite f a i l u r e s t r a i n of f i b e r s from the B/6061 Al system w a s not degraded by t h e exposure but t he mean s t r eng th dropped approximately 7 percent .
Reaction l aye r s on ind iv idua l f i b e r s are shown i n f i g u r e 16. Thermal exposure has increased the th ickness and densi ty of t h e r eac t ion layer i n the B/1100 Al system ( f i g . 1 6 ( a ) ) but t h e EDAX r e s u l t s i nd ica t e the makeup, aluminum with a t r a c e of s i l i- con and iron-rich particles, is the s a m e as the as - fabr ica ted specimens. Fibers from
9
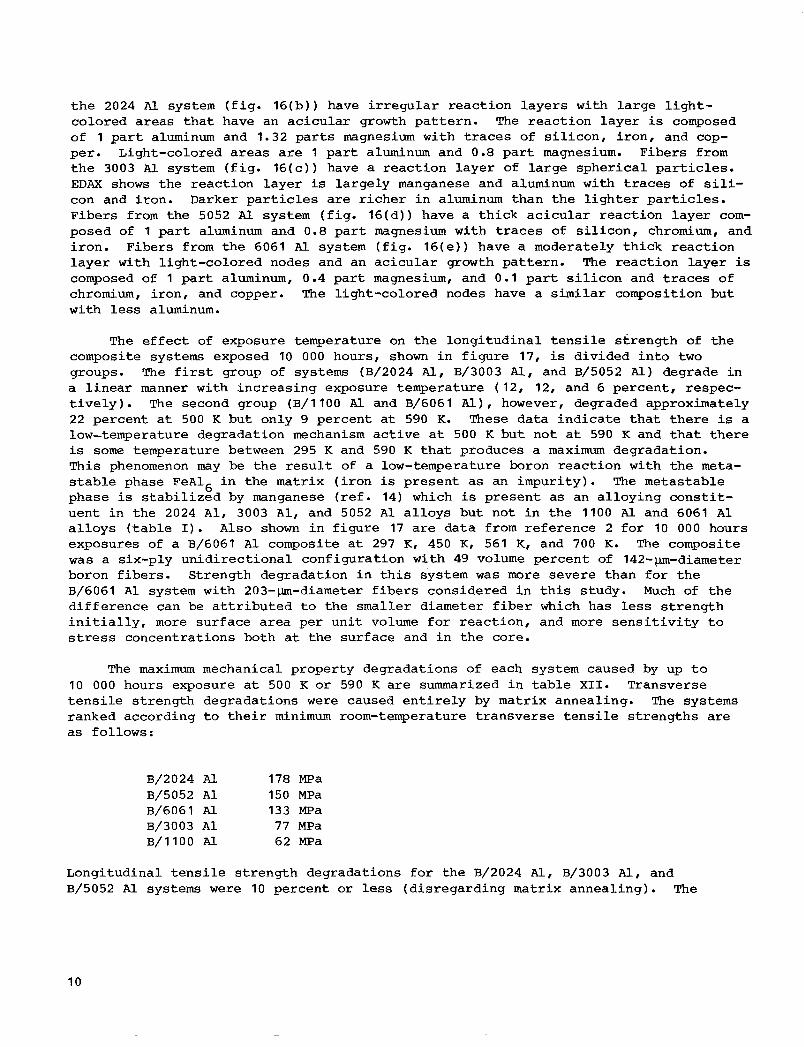
t h e 2024 Al system ( f i g . 1 6 ( b ) ) have i r r e g u l a r r eac t ion l aye r s with l a rge l i g h t - colored areas t h a t have an ac i cu la r growth p a t t e r n . The reac t ion l aye r is composed of 1 part aluminum and 1.32 parts magnesium with traces of s i l i c o n , i ron , and cop- per. Light-colored areas a r e 1 part aluminum and 0.8 part magnesium. Fibers from t h e 3003 Al system ( f i g . 1 6 ( c ) ) have a r eac t ion l a y e r of l a rge sphe r i ca l p a r t i c l e s . EDAX shows the reac t ion l aye r is l a rge ly manganese and aluminum w i t h t r a c e s of s i l i- con and i ron . Darker p a r t i c l e s are r i c h e r i n aluminum than t h e l i g h t e r particles. Fibers from the 5052 Al system ( f i g . 16 (d ) ) have a th i ck a c i c u l a r reac t ion l aye r com- posed of 1 part aluminum and 0.8 part magnesium with traces of s i l i c o n , chromium, and i ron . Fibers from the 6061 A l system ( f i g . 16( e ) ) have a moderately th i ck r eac t ion l a y e r with l ight-colored nodes and an a c i c u l a r growth pa t t e rn . The r eac t ion layer is composed of 1 part aluminum, 0.4 p a r t magnesium, and 0.1 part s i l i c o n and traces of chromium, i ron , and copper. The l ight-colored nodes have a s i m i l a r composition but with less aluminum.
The e f f e c t of exposure temperature on the longi tudina l t e n s i l e s t r eng th of t he composite systems exposed 10 000 hours, shown i n f i g u r e 17, is divided i n t o t w o groups. The f i r s t group of systems (B/2024 A l , W3003 Al, and B/5052 A l l degrade i n a l i n e a r manner with increas ing exposure temperature (12, 12, and 6 percent , respec- t i v e l y ) . The second group (B/1100 Al and B/6061 A l l , however, degraded approximately 22 percent a t 500 K but only 9 percent a t 590 K. These da ta i n d i c a t e t h a t t he re is a low-temperature degradation mechanism ac t ive a t 500 K bu t not a t 590 K and t h a t t he re is some temperature between 295 K and 590 K t h a t produces a maximum degradation. This phenomenon may be t h e r e s u l t of a low-temperature boron r eac t ion with the meta- s t a b l e phase F e A 1 6 i n t he matrix ( i r o n is present as an impuri ty) . phase is s t a b i l i z e d by manganese ( r e f . 14) which is p resen t as an a l loy ing c o n s t i t - uent i n the 2024 A l , 3003 A l , and 5052 A 1 a l l o y s but not i n the 1100 A l and 6061 A 1 a l l o y s ( table I) . A l s o shown i n f igu re 17 are da ta from reference 2 f o r 10 000 hours exposures of a B/6061 A l composite a t 297 K, 450 K, 561 K, and 700 K. The composite was a six-ply un id i r ec t iona l configurat ion with 49 volume percent of 142-p-diameter boron f i b e r s . Strength degradation i n t h i s system w a s more severe than €or the B/6061 A 1 system with 203-p-diameter f i b e r s considered i n t h i s study. Much of t h e d i f f e rence can be a t t r i b u t e d t o the smaller diameter f i b e r which has less s t r eng th i n i t i a l l y , more sur face a rea per u n i t volume f o r reac t ion , and more s e n s i t i v i t y t o stress concentrat ions both a t t he sur face and i n the core.
The metastable
The maximum mechanical property degradations of each system caused by up t o 10 000 hours exposure a t 500 K o r 590 K a r e summarized i n t a b l e X I I . Transverse t e n s i l e s t rength degradations w e r e caused e n t i r e l y by matrix annealing. The systems ranked according t o t h e i r minimum room-temperature t ransverse t e n s i l e s t r eng ths are as follows:
B/2024 A l 178 m a B/5052 A1 150 MPa B/6061 Al 133 MPa B/3003 A1 77 MPa B/1100 Al 62 MPa
Longitudinal t e n s i l e s t r eng th degradations f o r t he B/2024 Al, R/3003 A l , and B/5052 A 1 systems w e r e 10 percent or l e s s (d is regard ing matrix anneal ing) . The
10
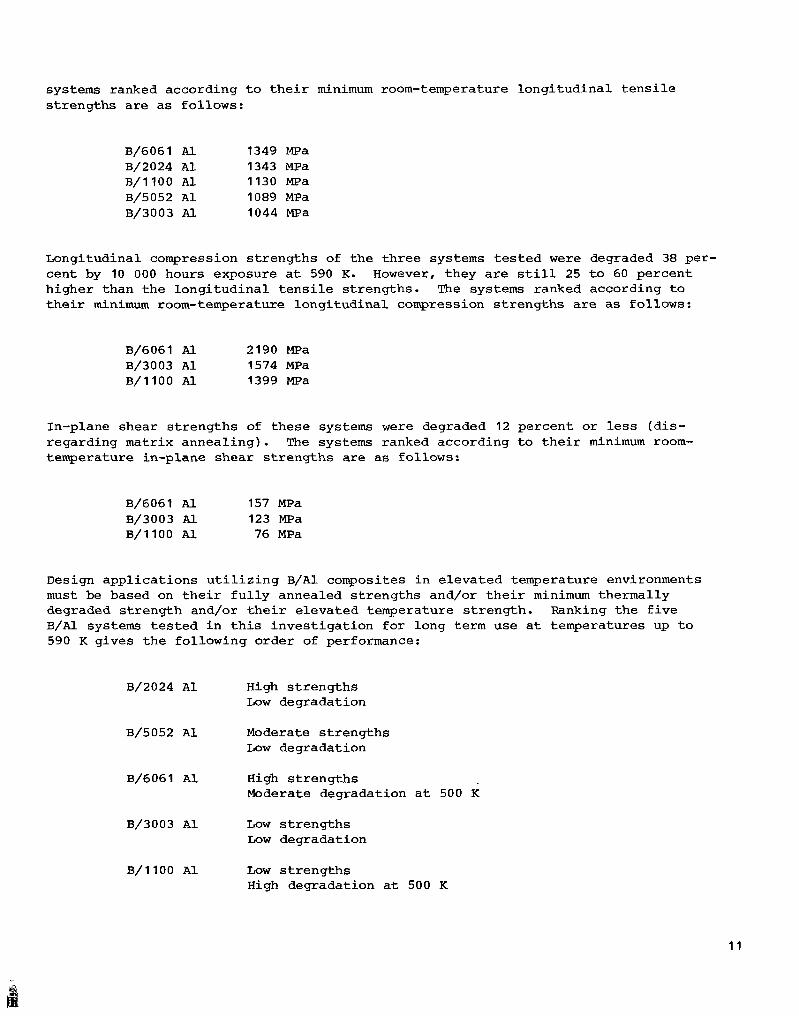
systems ranked according t o t h e i r minimum room-temperature longi tudina l t e n s i l e s t rengths a r e as follows:
B / 6 0 6 1 Al 1 3 4 9 MPa B/2024 A1 1 3 4 3 MPa B / 1 1 0 0 Al 1 1 3 0 MPa B / 5 0 5 2 A1 1 0 8 9 MPa B / 3 0 0 3 A l 1 0 4 4 MPa
Longitudinal compression s t r eng ths of t h e th ree systems t e s t e d w e r e degraded 38 per- cent by 10 000 hours exposure a t 590 K. However, they are s t i l l 25 t o 60 percent higher than t h e longi tudina l t e n s i l e s t rengths . The systems ranked according t o t h e i r minimum room-temperature longi tudina l compression s t r eng ths are as follows:
B / 6 0 6 1 A l 2 1 9 0 MPa B/3003 A 1 1 5 7 4 MPa B / 1 1 0 0 Al 1 3 9 9 m a
In-plane shear s t r eng ths of these systems w e r e degraded 1 2 percent or less (d is - regarding matrix annea l ing) . The systems ranked according t o t h e i r minimum room- temperature in-plane shear s t rengths are as follows:
B/6061 A 1 1 5 7 MPa B / 3 0 0 3 Al 1 2 3 MPa B/1100 A1 76 MPa
Design app l i ca t ions u t i l i z i n g B/A1 composites i n e leva ted temperature environments must be based on t h e i r f u l l y annealed s t rengths and/or t h e i r minimum thermally degraded s t r eng th and/or t h e i r e levated temperature s t rength . Ranking the f i v e B/Al systems t e s t e d i n t h i s i nves t iga t ion f o r long t e r m use a t temperatures up t o 590 K gives the following order of performance:
B / 2 0 2 4 A1 High s t r eng ths Low degradation
B / 5 0 5 2 Al Moderate s t r eng ths Low degradation
B/6061 A1 High s t r eng ths Moderate degradation a t 500 K
B / 3 0 0 3 Al Low s t r eng ths Low degradation
B / 1 1 0 0 A1 Low s t r eng ths High degradation a t 500 K
11

Exposure -att 730-3.- The effects of isothermal exposure for up t o 500 hours a t 730 K on the matrix a l l o y s t e n s i l e s t r eng th and t h e composite systems s t r eng th a r e shown i n f igu re 18. In addi t ion , t y p i c a l s t r e s s - s t r a i n curves f o r each composite material and each test type are shown i n appendix D. Tensi le s t r eng ths of t he non- hea t - t rea tab le a l l o y s ( f ig . 1 8 ( a ) ) behaved i n t h e s a m e manner as noted i n the lower temperature exposures, 1100 Al and 3003 A l w e r e unaffected by the exposure and 5052 A1 reached t h e f u l l y annealed condi t ion e a r l y i n t h e exposure and then remained constant . The t e n s i l e s t rengths of t he hea t - t r ea t ab le a l l o y s 2024 Al and 6061 A1 exposed a t 730 K d id not behave i n t h e same manner as observed a t 500 K and 590 K. The s t r eng th of t he 2024 Al a l l o y w a s not degraded a t a l l by the 730 K exposure. Strength degradation f o r t h e 6061 Al a l loy a t 730 K w a s one-third less than a t t h e lower temperatures. L e s s s t rength loss occurred a t t he higher temperature because a t 730 K t hese materials a r e i n t h e i r so lu t ion hea t t r e a t i n g regime. In t h i s regime, t he s o l u b i l i t y l i m i t s f o r t h e i r s t rengthening phases are increased and less precipi- t a t i o n occurs.
Transverse t e n s i l e s t rengths of t h e composite systems ( f i g . 18( b ) ) again behaved i n a manner s i m i l a r t o the nonreinforced matrix mater ia l except t h a t t he B/2024 A1 system s t r eng th degraded l i n e a r l y with exposure time. After 500 hours exposure a t 730 K the t ransverse t e n s i l e s t r eng ths of t h e B/2024 Al, B/5052 Al, and B/6061 A1 systems w e r e degraded 12, 16, and 11 percent , respec t ive ly .
Composite longi tudina l t e n s i l e s t r eng th degradations w e r e more severe f o r t h e 730 K exposure ( f i g . 1 8 ( c ) ) than f o r t h e lower temperature exposures. The B/1100 Al, B/2024 Al, B/3003 Al, B/5052 Al, and B/6061 Al system s t r eng ths w e r e degraded by 53, 58, 32, 37, and 45 percent , respec t ive ly . The B/1100 Al and B/6061 Al systems degraded i n a l i n e a r manner with exposure t i m e . The o ther systems degraded i n a nonl inear manner with t h e r a t e of degradation decreasing with increas ing exposure t i m e . The B/3003 A1 and B/5052 A1 systems reached t h e i r minimum s t r eng th a f t e r 300 hours and remained constant through 500 hours. Because longi tudina l t e n s i l e s t rength , a key property of these mater ia l s , w a s severe ly degraded, t hese materials are not s u i t a b l e f o r long- l i fe appl ica t ions a t 730 K.
Longitudinal compression s t rengths of t he composite systems exposed a t 730 K ( f i g . 1 8 ( d ) ) var ied i n a nonl inear manner with exposure time i n i t i a l l y decreasing then increasing. During the i n i t i a l exposure per iods t h e B/1100 Al, B/3003 Al, and B/6061 A1 system s t r eng ths degraded 13, 2, and 18 percent , respec t ive ly . During t h e l a t e r per iod the s t r eng th recovered 4, 13, and 12 percent , respec t ive ly . Compression s t r eng th relies on matrix support of t he f i b e r t o prevent buckling. One poss ib le cause of the observed s t r eng th recovery is t h a t t he r eac t ion zone formed a t 730 K provides improved f i b e r support.
In-plane shear s t r eng th of the B/1100 Al, B/3003 Al, and B/6061 Al systems degraded l i n e a r l y 25, 25, and 40 percent , respec t ive ly , during t h e 500 hours exposure.
Longitudinal t e n s i l e f r a c t u r e sur faces of the specimens exposed 500 hours a t 730 K were macroscopically f l a t and did not have the irregular shear s t eps noted f o r t h e as-fabricated specimens. Microscopically, however, t he 730 K specimens and t h e as-fabricated specimens w e r e similar. Transverse t e n s i l e f r a c t u r e sur faces of speci- mens exposed 500 hours a t 730 K are shown i n f i g u r e 19. The B/llOO Al and B/3003 A l f r a c t u r e surfaces ( f i g s . 19(a) and 19 (c ) , r e spec t ive ly ) a r e not s i g n i f i c a n t l y d i f - f e r e n t from the as-fabricated specimens ( f i g s . 7 ( a ) and 7 ( c ) ) . The B/2024 Al speci- men ( f i g . 1 9 ( b ) ) , however, has severa l unique f ea tu res . It f a i l e d pr imar i ly a t t h e i n t e r f a c e of t he r eac t ion layer and the matrix, l eav ing the heavy reac t ion layer
12
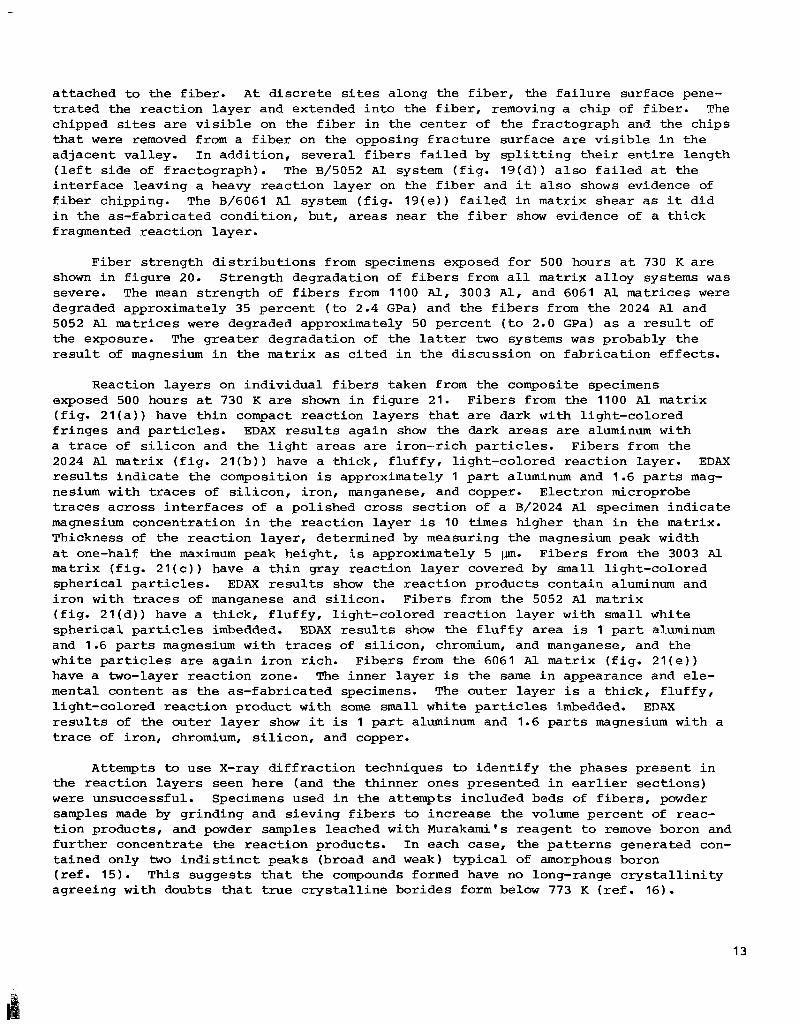
a t tached to the f i b e r . A t discrete s i t e s along the f i b e r , the f a i l u r e surface pene- t r a t e d the reac t ion l a y e r and extended i n t o the f i b e r , removing a chip of f i b e r . The chipped sites are v i s i b l e on the f i b e r i n the center of the fractograph and the chips t h a t w e r e removed from a f i b e r on the opposing f r a c t u r e sur face are v i s i b l e i n t h e ad jacent val ley. I n add i t ion , severa l f i b e r s f a i l e d by s p l i t t i n g t h e i r e n t i r e length ( l e f t s ide of f rac tograph) . The B/5052 A1 system ( f i g . 1 9 ( d ) ) a l s o f a i l e d a t the i n t e r f a c e leaving a heavy r eac t ion layer on the f i b e r and it a l s o shows evidence of f i b e r chipping. The B/6061 Al system ( f i g . 1 9 ( e ) ) f a i l e d i n matrix shear as it d id i n the as-fabricated condi t ion, but, a reas near the f i b e r show evidence of a thick fragmented reac t ion layer .
F iber s t rength d i s t r i b u t i o n s from specimens exposed f o r 500 hours a t 730 K are shown i n f igu re 20. Strength degradation of f i b e r s from a l l m a t r i x a l l o y systems w a s severe. The mean s t r eng th of f i b e r s from 1100 A l , 3003 A l , and 6061 A l matrices w e r e degraded approximately 35 percent ( t o 2.4 GPa) and the f i b e r s from the 2024 A1 and 5052 Al matrices w e r e degraded approximately 50 percent ( t o 2.0 GPa) as a r e s u l t of the exposure. The g rea t e r degradation of the la t ter two systems was probably the r e s u l t of magnesium i n the matrix as c i t e d i n the discussion on f ab r i ca t ion e f f e c t s .
Reaction l aye r s on ind iv idua l f i b e r s taken from the composite specimens exposed 500 hours a t 730 K are shown i n f igu re 21. F ibers from the 1100 Al matrix ( f i g . 21 ( a ) ) have t h i n compact reac t ion l aye r s t h a t are dark with l ight-colored f r i n g e s and p a r t i c l e s . EDAX r e s u l t s again show the dark areas are aluminum with a t r ace of s i l i c o n and the l i g h t a reas are i ron-r ich particles. F ibers from the 2024 A l matrix ( f i g . 2 1 ( b ) ) have a thick, f l u f f y , l ight-colored reac t ion layer . EDAX r e s u l t s i nd ica t e the composition i s approximately 1 p a r t aluminum and 1.6 parts mag- nesium with traces of s i l i c o n , i ron, manganese, and copper. Electron microprobe t r a c e s across i n t e r f a c e s of a pol ished cross sec t ion of a B/2024 A1 specimen ind ica t e magnesium concentrat ion i n the reac t ion l aye r is 10 t i m e s higher than i n the matrix. Thickness of the r eac t ion layer , determined by measuring the magnesium peak width a t one-half the maximum peak height , i s approximately 5 p. Fibers from the 3003 A l matrix ( f i g . 2 1 ( c ) ) have a t h i n gray reac t ion layer covered by s m a l l l ight-colored spher ica l p a r t i c l e s . EDAX r e s u l t s show the reac t ion products contain aluminum and i r o n with t r aces of manganese and s i l i con . F ibe r s from the 5052 Al matrix ( f i g . 2 1 ( d ) ) have a th ick , f l u f f y , l ight-colored reac t ion l aye r with small white sphe r i ca l particles imbedded. EDAX r e s u l t s show the f l u f f y area i s 1 par t aluminum and 1.6 parts magnesium with traces of s i l i c o n , chromium, and manganese, and the white particles are again i r o n r ich. F ibers from the 6061 A l matrix ( f i g . 21 ( e ) ) have a two-layer r eac t ion zone. The inner l aye r i s the s a m e i n appearance and ele- mental content as the as - fabr ica ted specimens. The outer l aye r i s a th ick , f l u f f y , l ight-colored r eac t ion product with some small white particles imbedded. EDAX r e s u l t s of the ou te r l aye r show it is 1 p a r t aluminum and 1.6 parts magnesium with a t r a c e of i ron , chromium, s i l i c o n , and copper.
A t t e m p t s to use X-ray d i f f r a c t i o n techniques t o i d e n t i f y the phases present i n the reac t ion l aye r s seen here (and the thinner ones presented i n earlier sec t ions ) w e r e unsuccessful. Specimens used i n the a t t e m p t s included beds of f i b e r s , powder samples made by gr inding and s ieving f i b e r s to increase the volume percent of reac- t i o n products, and powder samples leached with Murakami's reagent t o remove boron and fu r the r concentrate the r eac t ion products. In each case, the p a t t e r n s generated con- ta ined only two i n d i s t i n c t peaks (broad and weak) t y p i c a l of amorphous boron ( r e f . 15). This suggests t h a t the compounds formed have no long-range c r y s t a l l i n i t y agreeing with doubts t h a t t r u e c r y s t a l l i n e borides form below 773 K ( r e f . 16).
13
Effec t s of Thermal Cycling
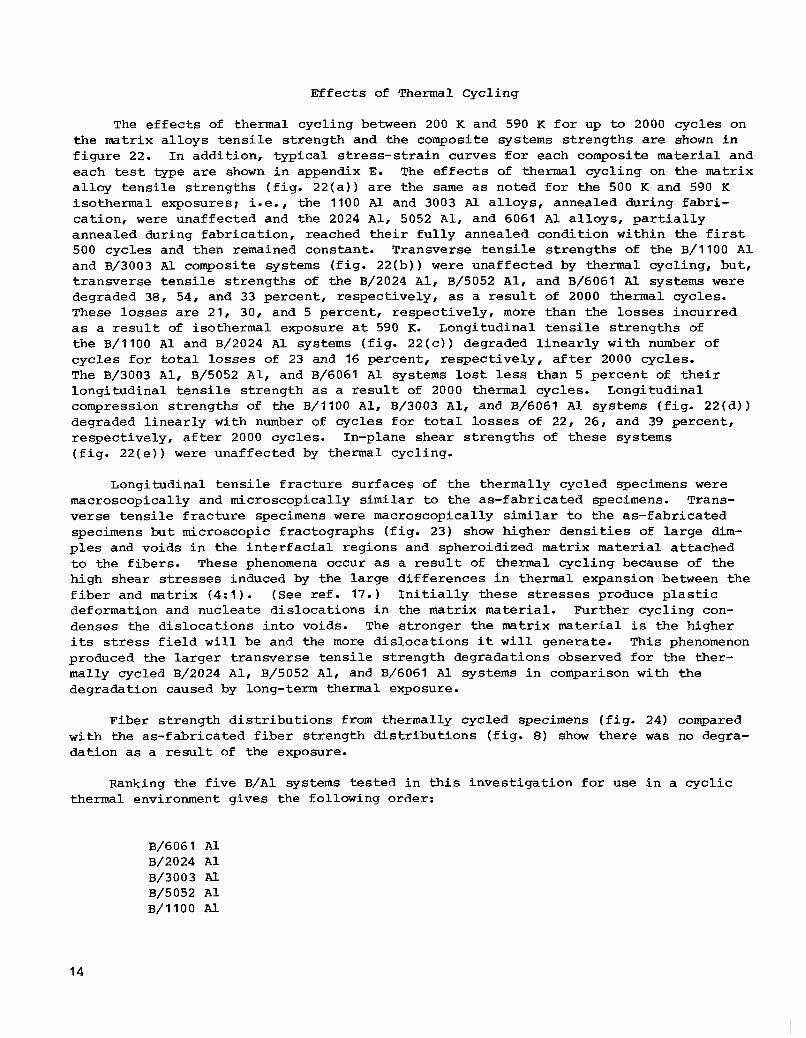
The e f f e c t s of thermal cycl ing between 200 K and 590 K f o r up to 2000 cycles on the matrix a l l o y s t e n s i l e s t rength and the composite systems s t r eng ths are shown i n f i g u r e 22. I n addi t ion , t yp ica l s t r e s s - s t r a i n curves f o r each composite material and each test type are shown i n appendix E. The e f f e c t s of thermal cyc l ing on the matrix a l l o y t e n s i l e s t r eng ths ( f i g . 2 2 ( a ) ) are the same as noted f o r the 500 K and 590 K isothermal exposures; i.e., the 1100 Al and 3003 Al a l loys , annealed during f a b r i - ca t ion , were unaffected and the 2024 Al, 5052 Al, and 6061 A 1 a l loys , p a r t i a l l y annealed during f ab r i ca t ion , reached t h e i r f u l l y annealed condi t ion within the f i r s t 500 cycles and then remained constant. Transverse t e n s i l e s t r eng ths of the B/1100 A 1 and B/3003 A l composite systems ( f i g . 2 2 ( b ) ) w e r e unaffected by thermal cycl ing, but, t ransverse t e n s i l e s t r eng ths of the B/2024 Al, ~ / 5 0 5 2 Al, and B/6061 A 1 systems w e r e degraded 38, 54, and 33 percent , respec t ive ly , as a r e s u l t of 2000 thermal cycles. These lo s ses are 21, 30, and 5 percent , respec t ive ly , more than the losses incur red as a r e s u l t of isothermal exposure a t 590 K. Longitudinal t e n s i l e s t r eng ths of the B/1100 A 1 and B/2024 A1 systems ( f i g . 2 2 ( c ) ) degraded l i n e a r l y with number of cyc le s f o r to ta l losses of 23 and 16 percent , respec t ive ly , a f t e r 2000 cycles. The B/3003 Al, B/5052 Al, and B/6061 A 1 systems lo s t less than 5 percent of t h e i r longi tudina l t e n s i l e s t r eng th as a r e s u l t of 2000 thermal cycles. Longitudinal compression s t r eng ths of the B/1100 Al, B/3003 AI, and B/6061 Al systems (f ig . 22 (d ) ) degraded l i n e a r l y with number of cycles f o r total l o s s e s of 22, 26, and 39 percent, respec t ive ly , a f t e r 2000 cycles. In-plane shear s t r eng ths of these systems ( f i g . 2 2 ( e ) ) were unaffected by thermal cycling.
Longitudinal t e n s i l e f r a c t u r e surf aces of the thermally cycled specimens w e r e macroscopically and microscopically s i m i l a r to the as - fabr ica ted specimens. Trans- verse t e n s i l e f r a c t u r e specimens w e r e macroscopically s i m i l a r to the as-f ab r i ca t ed specimens bu t microscopic f ractographs ( f i g . 23) show higher d e n s i t i e s of l a rge d i m - ples and voids i n the i n t e r f a c i a l regions and spheroidized matrix material a t tached t o the f ibe r s . These phenomena occur as a r e s u l t of thermal cyc l ing because of the high shear stresses induced by the la rge d i f f e rences i n thermal expansion between the f i b e r and matrix (4: 1 ) . (See r e f . 17. ) I n i t i a l l y these stresses produce p l a s t i c deformation and nucleate d i s loca t ions i n the matrix material. Further cyc l ing con- denses the d i s loca t ions i n t o voids. The s t ronger the matrix material i s the higher i t s s t r e s s f i e l d w i l l be and the more d i s loca t ions it w i l l generate. This phenomenon produced the l a r g e r t ransverse t e n s i l e s t r eng th degradations observed f o r the ther- mally cycled B/2024 A l , B/5052 Al, and B/6061 Al systems i n comparison with the degradation caused by long-term thermal exposure.
Fiber s t rength d i s t r i b u t i o n s from thermally cycled specimens ( f i g . 24) compared wi th the as-fabricated f i b e r s t rength d i s t r i b u t i o n s ( f i g . 8) show there w a s no degra- da t ion as a r e s u l t of the exposure.
Ranking the f i v e B/A1 systems t e s t ed i n this inves t iga t ion f o r use i n a c y c l i c thermal environment gives the following order:
B/6061 Al B/2024 A 1 B/3003 Al B/5052 AI B/1100 A l
14

Constituent Effects
The reactions occurring within the B/Al composite systems are functions of the constituents, concentrations, temperatures, and time. Identification of these reac- tions is complicated by their short-range structures, low concentrations, and boron transparency to X-rays. As a result, direct identification of the reaction products using the available equipment and techniques was not possible. However, the fore- going metallurgical analyses, elemental identifications, and mechanical property data together with data gleaned from the literature provide a basis from which the effects of the various elemental constituents can be deduced.
Boron.- The amorphous boron fibers retain the same basic icosahedral (12 atom) cluster structure found in crystalline borons. The icosahedral clusters, however, are randomly oriented in the amorphous form (ref. 18) . In the crystalline form long- range order leaves large inter-icosahedral spaces. These spaces host the metal atoms in boron-rich metal borides (ref. 19). Random orientation leaves even larger inter- icosahedral spaces and higher energy sites to accept metal atoms.
Boron fibers are the primary source of strength in the composites. Failure of the fiber-dominated longitudinal tensile specimens occurred catastrophically without evidence of an accumulation of fiber failures (i.e., no change in elastic modulus near failure). The failures occurred when the fibers were loaded near the lower bound of their strength distribution ranges and were not a function of reaction layer thickness (for exposure up to 590 K). This behavior corresponds to the critical energy release rate theory of B/Al composites (ref. 20) where the critical rate is exceeded as soon as fibers in the main body of the distribution range begin to fail. Because the lower bound of fiber strength governs the composite failure, localized reactions between the fiber and matrix that cause stress concentrations and reduce the lower bound of fiber strength are more detrimental to ultimate composite strength than are uniform reactions which lower the entire strength distribution.
Aluminum.- Aluminum/boron reactions are inevitable in the B/Al composite sys- tem. However, at temperatures up to 590 K, the slow uniform noncrystalline reaction causes little degradation even after 10 000 hours. At the composite fabrication temperature (770 K to 840 K), the reactions occur more rapidly but short exposure times minimize the effects. Long-term exposure at 730 K caused severe degradation and clearly is beyond the useful temperature range of B/A1 composites. Aluminum forms the boron-rich borides A1B2, A1B4, and AlB12 with a wide range of stoichiometry (ref. 19). The diboride phase, the one usually expected, has a hexagonal crystalline form dominated by the metal structure. However, at the reaction temperatures in this study, the boron atoms probably take up random interstitial sites in the face- centered-cubic aluminum structure resulting in a distorted structure. This, compounded by a wide range of stoichiometry and the ability of the other diboride- forming constituent metals to enter into isostructural diborides with aluminum, prevent the phase from forming any long-range structure. The higher borides, if they are formed, have structures dominated by the icosahedral cluster structure of boron with the metal atoms taking positions in the relatively large inter-cluster spaces. Their formation would require diffusion of aluminum into the boron and would probably be restricted to the surface or near-surface of the boron fiber and would assume the amorphous boron structure.
Iron.- Iron is not an alloying constituent in any of the alloys tested but it is present as an impurity (<1 percent) in all commercial alloys. Iron-rich particles were found in the fiber reaction layers and probably formed where iron bearing parti- cles in the matrix were next to the fibers. These highly localized reaction sites
15
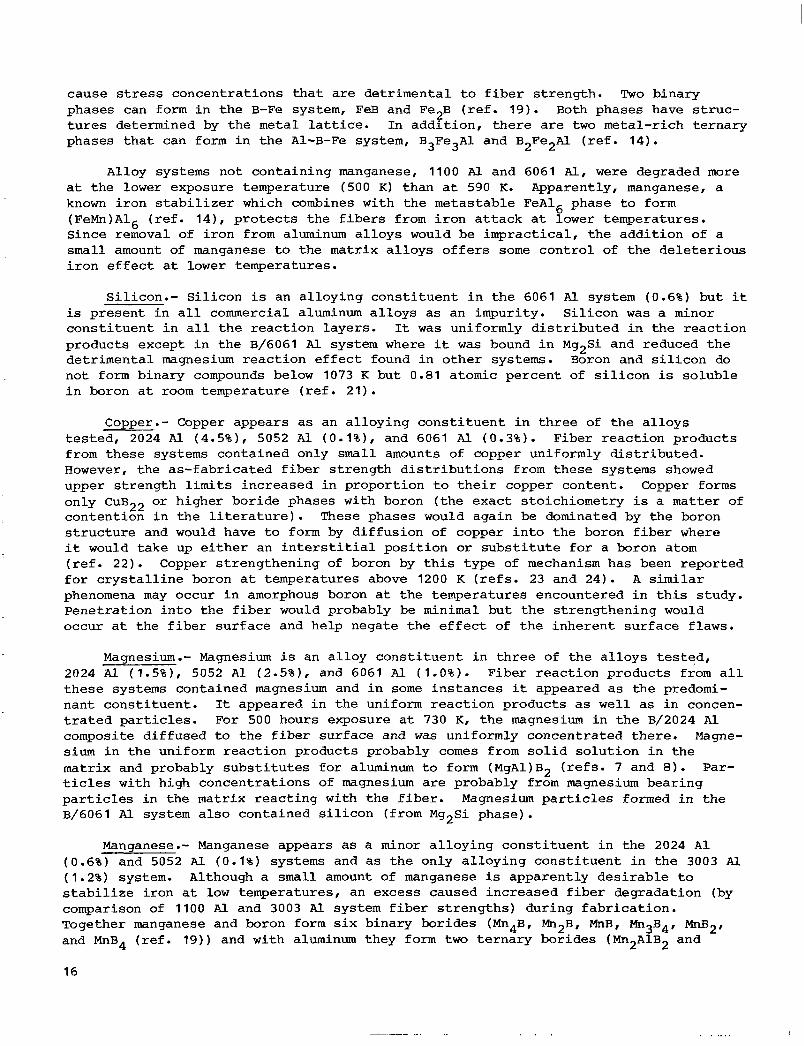
cause stress concentrations that are detrimental to fiber strength. Two binary phases can form in the B-Fe system, FeB and Fe2B (ref. tures determined by the metal lattice. In addition, there are two metal-rich ternary phases that can form in the A1-B-Fe system, B3Fe3Al and B2Fe2Al (ref.
19). Both phases have struc-
14).
Alloy systems not containing manganese, 1100 Al and 6061 Al, were degraded more at the lower exposure temperature (500 K) than at 590 K. Apparently, manganese, a known iron stabilizer which combines with the metastable FeA16 phase to form (FeMn)A16 (ref. Since removal of iron from aluminum alloys would be impractical, the addition of a small amount of manganese to the matrix alloys offers some control of the deleterious iron effect at lower temperatures.
14), protects the fibers from iron attack at lower temperatures.
Silicon.- Silicon is an alloying constituent in the 6061 Al system (0.6%) but it is present in all commercial aluminum alloys as an impurity. Silicon was a minor constituent in all the reaction layers. It was uniformly distributed in the reaction products except in the B/6061 A l system where it was bound in Mg2Si and reduced the detrimental magnesium reaction effect found in other systems. Boron and silicon do not form binary compounds below 1073 K but 0.81 atomic percent of silicon is soluble in boron at room temperature (ref. 21).
Copper.- Copper appears as an alloying constituent in three of the alloys tested, 2024 Al (4.5%), 5052 Al (0.1%), and 6061 Al (0.3%). Fiber reaction products from these systems contained only small amounts of copper uniformly distributed. However, the as-fabricated fiber strength distributions from these systems showed upper strength limits increased in proportion to their copper content. Copper forms only C ~ B ~ ~ or higher boride phases with boron (the exact stoichiometry is a matter of contention in the literature). These phases would again be dominated by the boron structure and would have to form by diffusion of copper into the boron fiber where it would take up either an interstitial position or substitute for a boron atom (ref. 22). Copper strengthening of boron by this type of mechanism has been reported for crystalline boron at temperatures above 1200 K (refs. 23 and 24). A similar phenomena may occur in amorphous boron at the temperatures encountered in this study. Penetration into the fiber would probably be minimal but the strengthening would occur at the fiber surface and help negate the effect of the inherent surface flaws.
Magnesium.- Magnesium is an alloy constituent in three of the alloys tested, 2024 Al (1.5%), 5052 Al (2.5%), and 6061 Al (1.0%). Fiber reaction products from all these systems contained magnesium and in some instances it appeared as the predomi- nant constituent. It appeared in the uniform reaction products as well as in concen- trated particles. For 500 hours exposure at 730 K, the magnesium in the B/2024 Al composite diffused to the fiber surface and was uniformly concentrated there. Magne- sium in the uniform reaction products probably comes from solid solution in the matrix and probably substitutes for aluminum to form (MgA1)B2 (refs. 7 and 8). ticles with high concentrations of magnesium are probably from magnesium bearing particles in the matrix reacting with the fiber. Magnesium particles formed in the ~/6061 Al system also contained silicon (from Mg2Si phase).
Par-
Manganese.- Manganese appears as a minor alloying constituent in the 2024 A1 (0.6%) and 5052 Al (0.1%) systems and as the only alloying constituent in the 3003 Al (1.2%) system. Although a small amount of manganese is apparently desirable to stabilize iron at l o w temperatures, an excess caused increased fiber degradation (by comparison of 1100 Al and 3003 Al system fiber strengths) during fabrication. Together manganese and boron form six binary borides (Mn4B, m2B, MnR, Mn3B4, M ~ B ~ , and MnB4 (ref. 19)) and with aluminum they form two ternary borides (Mn2A1B2 and
16
. . . . . .
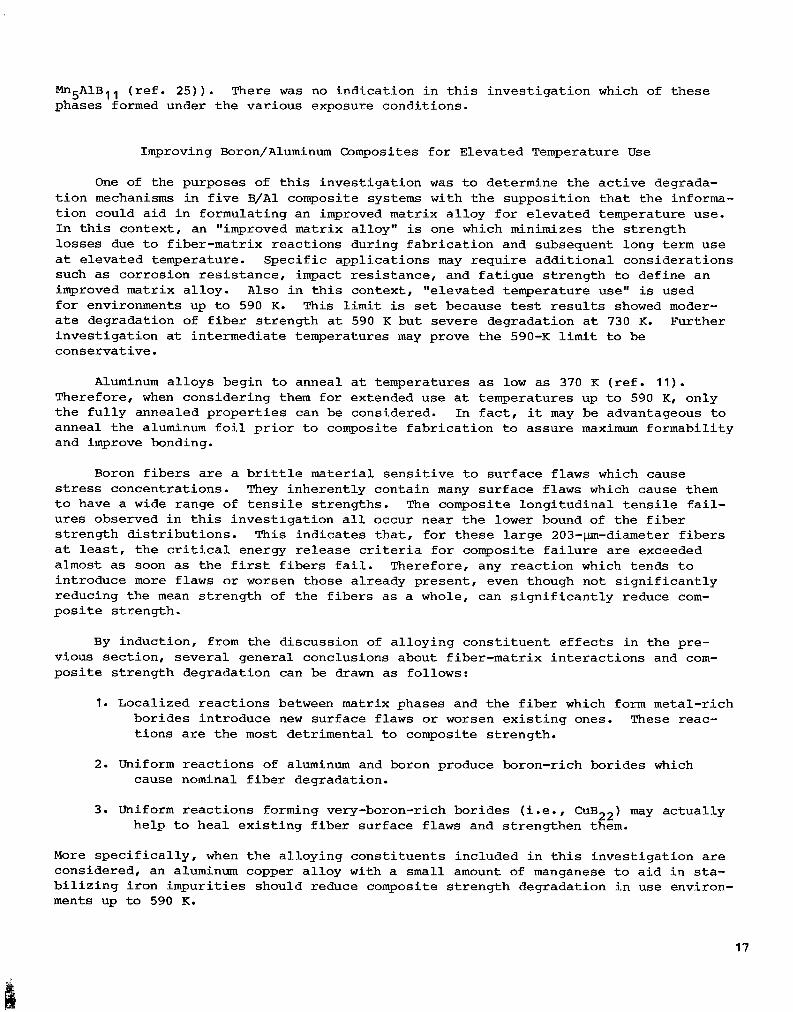
W5A1Bl1 (ref. 25)). There was no indication in this investigation which of these phases formed under the various exposure conditions.
Improving Boron/Aluminum Composites for Elevated Temperature Use
One of the purposes of this investigation was to determine the active degrada- tion mechanisms in five B/A1 composite systems with the supposition that the informa- tion could aid in formulating an improved matrix alloy for elevated temperature use. In this context, an "improved matrix alloy" is one which minimizes the strength losses due to fiber-matrix reactions during fabrication and subsequent long term use at elevated temperature. Specific applications may require additional considerations such as corrosion resistance, impact resistance, and fatigue strength to define an improved matrix alloy. Also in this context, "elevated temperature use" is used for environments up to 590 K. This limit is set because test results showed moder- ate degradation of fiber strength at 590 K but severe degradation at 730 K. Further investigation at intermediate temperatures may prove the 590-K limit to be conservative.
Aluminum alloys begin to anneal at temperatures as low as 370 K (ref. 11). Therefore, when considering them for extended use at temperatures up to 590 K, only the fully annealed properties can be considered. In fact, it may be advantageous to anneal the aluminum foil prior to composite fabrication to assure maximum formability and improve bonding.
Boron fibers are a brittle material sensitive to surface flaws which cause stress concentrations. They inherently contain many surface flaws which cause them to have a wide range of tensile strengths. The composite longitudinal tensile fail- ures observed in this investigation all occur near the lower bound of the fiber strength distributions. This indicates that, for these large 203-p-diameter fibers at least, the critical energy release criteria for composite failure are exceeded almost as soon as the first fibers fail. Therefore, any reaction which tends to introduce more flaws or worsen those already present, even though not significantly reducing the mean strength of the fibers as a whole, can significantly reduce com- posite strength.
By induction, from the discussion of alloying constituent effects in the pre- vious section, several general conclusions about fiber-matrix interactions and com- posite strength degradation can be drawn as follows:
1. Localized reactions between matrix phases and the fiber which form metal-rich borides introduce new surface flaws or worsen existing ones. These reac- tions are the most detrimental to composite strength.
2. Uniform reactions of aluminum and boron produce boron-rich borides which cause nominal fiber degradation.
3. Uniform reactions forming very-boron-rich borides (i.e., CUB22) may actually help to heal existing fiber surface flaws and strengthen them.
More specifically, when the alloying constituents included in this investigation are considered, an aluminum copper alloy with a small amount of manganese to aid in sta- bilizing iron impurities should reduce composite strength degradation in use environ- ments up to 590 K.
17

There are three existing aluminum-copper alloys, none of which exactly con- forms to the suggested composition. They are aluminum alloys 2011, 2025, and 2219 (ref. 11). Aluminum 2011 contains 5.5 percent copper but no manganese, it also con- tains 0.5 percent lead and 0.5 percent bismuth. Lead is reportedly insoluble in boron and forms no phases with it (ref. 21) and no confirmed bismuth phases appear in the literature (ref. 16). Aluminum 2025 contains 4.5 percent copper and 0.8 percent manganese but it also contains 0.8 percent silicon. HoweverI the results of this study indicate that the effects of small concentrations of silicon are probably not significant in composite strength degradation. Aluminum 2219 contains 6.3 percent copper and 0.3 percent manganese, it also contains 0.15 percent zirconium and 0 . 1 percent vanadium. Both zirconium and vanadium form metal-rich borides (ref. 19) and are probably undesirable as alloying constituents.
The results also suggest another method for improving composite strength. If, as postulated, the formation of very-boron-rich borides such as CUB^^ does "heal" existing fiber flaws, then the vapor deposition of a small amount of copper on the surface of the fiber could improve its strength. This operation could be added as a final step to the vapor deposition process for fabricating the fibers.
CONCLUSIONS
Boron-aluminum composites were investigated to determine the effects of long- term thermal exposure on the composite mechanical properties and the effects of the matrix alloying constituents on the degradation mechanisms. Five aluminum alloys, 1100 AI, 2024 AI, 3003 AI, 5052 Al, and 6061 Al, were used as matrix materi- als. Eight-ply composite panels of each matrix material reinforced with 49 volume percent boron fibers were fabricated by diffusion bonding. The 203-pn-diameter boron fibers were oriented unidirectionally or at f450. The composites were investigated in the as-fabricated condition, after isothermal exposures of up to 10 000 hours at 500 K, up to 10 000 hours at 590 K, up to 500 hours at 730 K, and after thermal cycl- ing exposure of up to 2000 cycles between 200 K and 590 K. Mechanical properties, including longitudinal, transverse, and f450 tensile, and longitudinal compression, were measured in each condition. Fibers, chemically removed from the matrices, were individually bend tested to determine their strength distributions. Composite speci- mens and individual fibers were metallurgically analyzed with a scanning electron microscope and an electron microprobe to determine failure characteristics, chemical element distributions, and reaction layer morphology.
The following conclusions are made from the results of this investigation:
1. The five B/Al composite systems had good mechanical strength retention after long-term exposures of up to 10 000 hours at 500 K and 590 K. Specific findings were as follows:
Transverse tensile strengths of all the composite systems were unaffected by the exposures (except for matrix annealing).
Longitudinal tensile strengths of the B/2024 Al, R/3003 Al, and B/6061 Al systems were degraded by 10 percent or less by the exposures.
Longitudinal tensile strengths of the B/1100 Al and B/6061 Al systems were degraded more (22 and 13 percent, respectively) by exposure at 500 K than at 590 K.
18
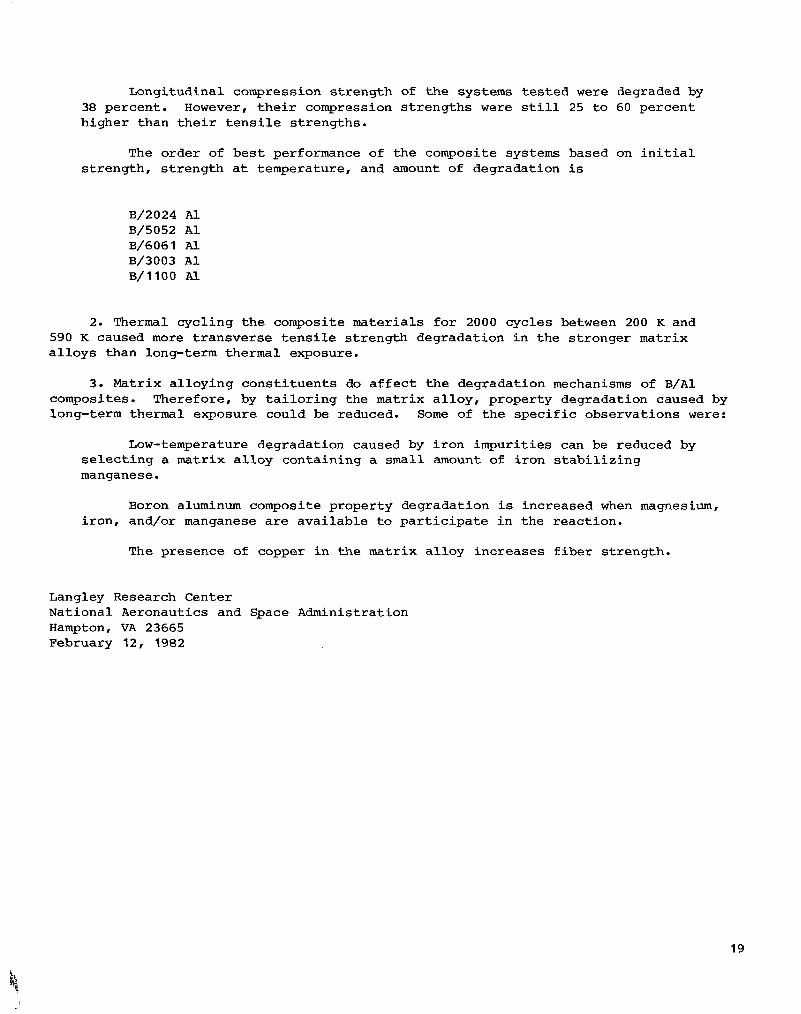
Longitudinal compression strength of the systems tested were degraded by 38 percent. However, their compression strengths were still 25 to 60 percent higher than their tensile strengths.
The order of best performance of the composite systems based on initial strength, strength at temperature, and amount of degradation is
B/2024 Al B/5052 Al B/6061 A l B/3003 A1 B/1100 Al
2. Thermal cycling the composite materials for 2000 cycles between 200 K and 590 K caused more transverse tensile strength degradation in the stronger matrix alloys than long-term thermal exposure.
3. Matrix alloying constituents do affect the degradation mechanisms of B/A1 composites. Therefore, by tailoring the matrix alloy, property degradation caused by long-term thermal exposure could be reduced. Some of the specific observations were:
Low-temperature degradation caused by iron impurities can be reduced by selecting a matrix alloy containing a small amount of iron stabilizing manganese.
Boron aluminum composite property degradation is increased when magnesium, iron, and/or manganese are available to participate in the reaction.
The presence of copper in the matrix alloy increases fiber strength.
Langley Research Center National Aeronautics and Space Administration Hampton, VA 23665 February 12, 1982
19
APPENDIX A
AS-FABRICATED SPECIMENS TESTED AT 295 K, 500 K, and 590 K
The mechanical property data €or a l l t he B/A1 composite tests conducted i n this i nves t iga t ion a r e given i n t a b l e s V through IX. Typical s t r e s s - s t r a i n curves for t h e as - fabr ica ted specimens t e s t e d a t 295 K, 500 K, and 590 K a r e presented i n appendix A.
20
I

. . . . .
APPENDIX A
300
250
200
150
100
1600 r
- - - -
-
d
z VI VI Q) L -P tn
a a
d
a
VI VI 0 L 4 u7
1400 - 1200 - 1000 - 000 - 600 -
- 1 1 I I I
S t r a t n , percent
(a) Longitudinal tensile.
S 9 0 K -
0 I 500Kl I I I I I I
S t r a i n , percent
(b) Transverse tensile.
Figure Ala- Typical elevated test temperature stress-strain curves €or B/1100 Al composite.
21
I

APPENDIX A
2000 - 1500 -
I L L- -1-_
S t r a i n , p e r c e n t
I . I I . . - - -
(c) Longitudinal compression.
7 0
6 0 295 K 50 -
500 K
590 K
I I I I I I I I 1
Shear s t r a i n , p e r c e n t
(dl In-plane shear.
Figure A1 .- Concluded.
22
........... , .. 1.. . .11~1111 .11
APPENDIX A
1600 r
a
v) VI Q) c +, M
1400
1200
1000
800
600
400
200
0
300
250
a I: a 200
c +, 100 cn
I 1
L L /
(a) Longitudinal tens i le .
t /295 K
S t r a f n , p e r c e n t
5 0
0
S t r a t n , p e r c e n t
(b) Transverse tensi le .
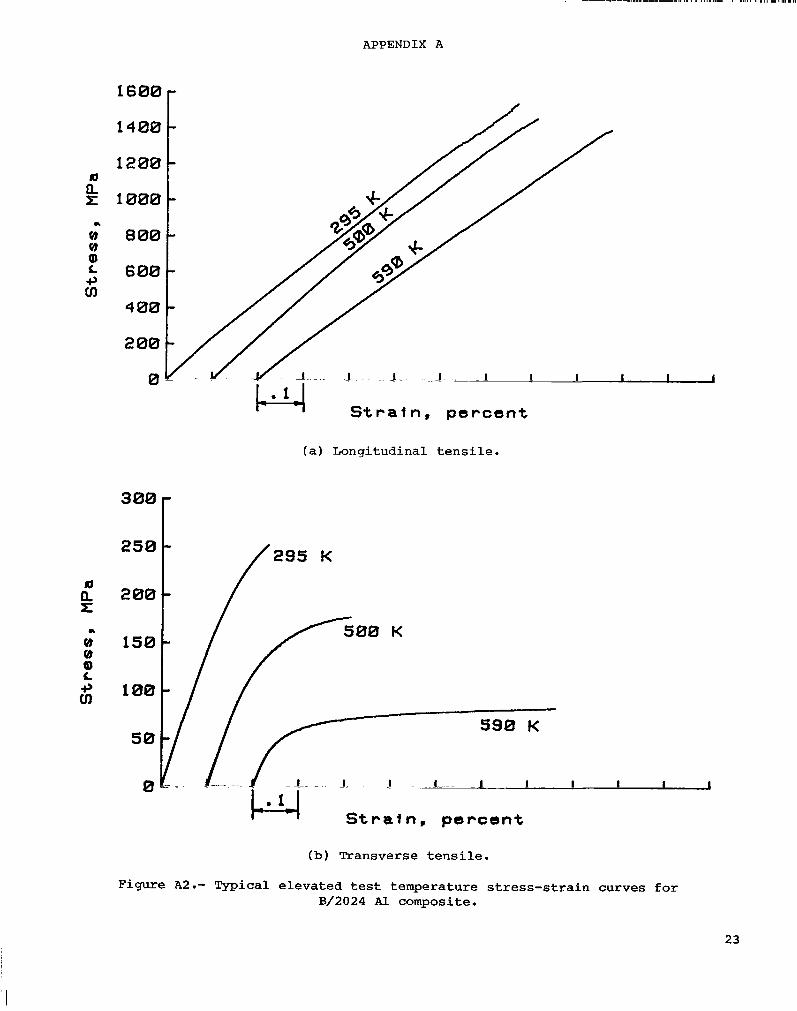
Figure A2.- Typical elevated t e s t temperature stress-strain curves for B/2024 Al composite.
23
.L
Q Q a c 4 cn
300
250
200
150
1600
1400
1200
1000
800
600
400
200
0
-
-
-
-
100
50
0
I I I I I I I I l1l11ll1lll1l1ll11l1ll11l11l1111l1l1l1~l1l111l1l11ll111l I1
APPENDIX A
I L I I I J
S t r a f n , p e r c e n t
( a ) Longitudinal t e n s i l e .
295 K
591 500 K
I I I I I I I I I I
I 4 S t r a i n , p e r c e n t
(b) Transverse t e n s i l e .
0 K
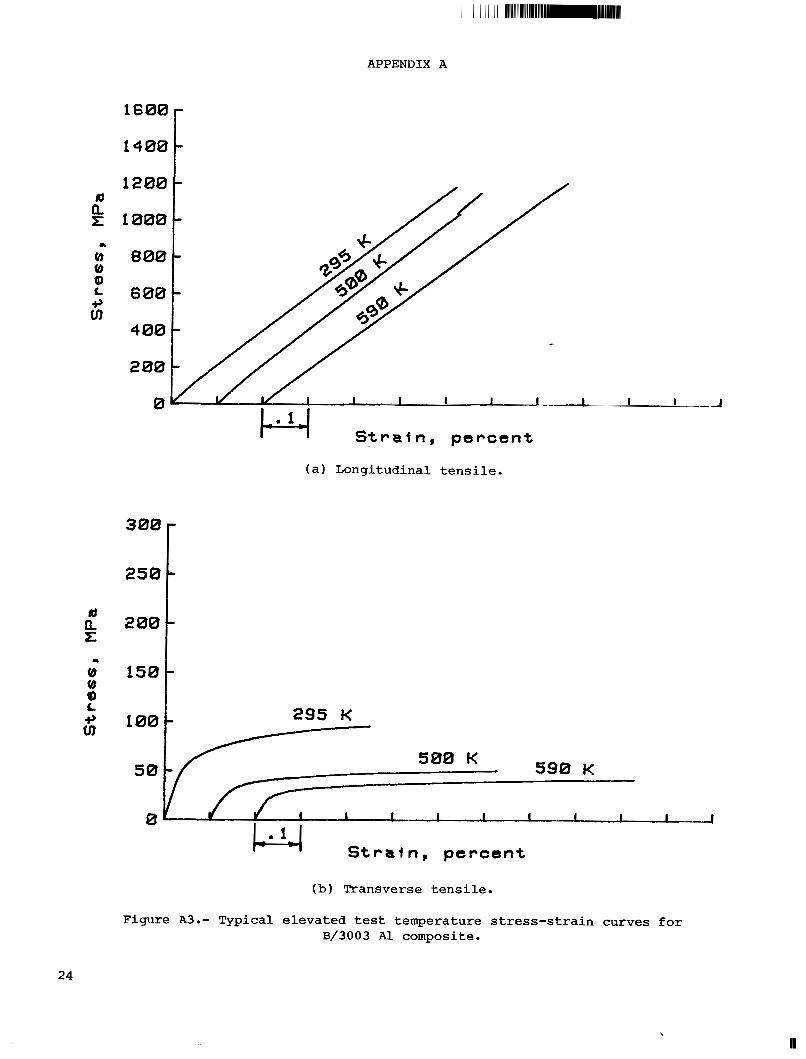
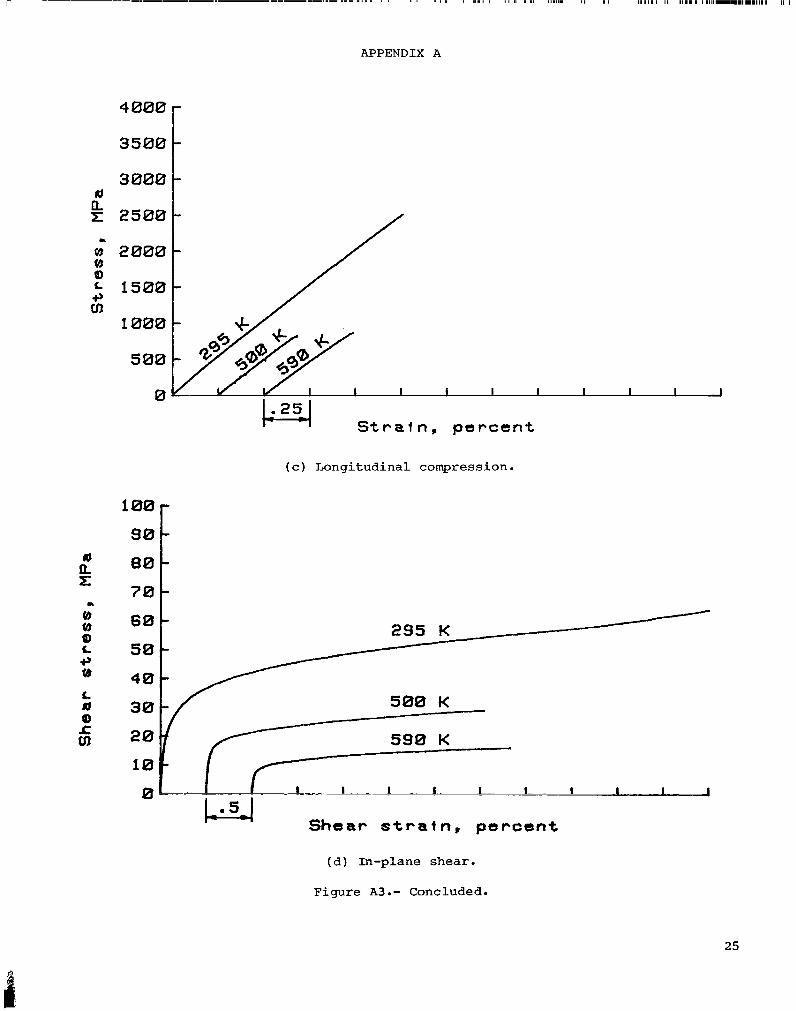
Figure A3.- Typical e levated tes t temperature s t r e s s - s t r a i n curves for B/3003 A1 composite.
24
,
1111111 I I 111.1 111111111.111.11111 I 1 I __.__..._-.-.__-.- --_...-.-...- ..... .. . . . I . I . I . I I S . I I I I I, m .I 11111111 I, I I 1 -
APPENDIX A
3000 Id
E 2500
ci, 1000
500
0 274
S t r a f n , p e r c e n t
( c ) Longitudinal compression.
100
90
80
7 0
6 0
5 0
4 0
30
20
10
0
295 K
5- I l - 4 -.A=--- S h e a r L s t r a i n , p e r c e n t I I I I I
( d ) In-plane shear.
Figure A3.- Concluded.
25
APPENDIX A
1400 16001 d
.. 8 0 Q) c 3, cn
I
.. 0) 0 ) Q) c 3, cn
1200
1000
800
600
400
200
0
I /
t /
I I . . J I 1 ~- . I
1 S t r a i n , percent
( a ) Longitudinal t e n s i l e .
250 3001 200
150
100
50
0
! - ! -!
295 K
500 K
590 K
I I I I I I _ _
S t r a i n , percent
(b) Transverse t e n s i l e .
Figure A4.- Typical e levated test temperature s t r e s s - s t r a i n curves €or B/5052 Al composite.
26
I
~~ . .. . .. .
APPENDIX A
m
.L
8 8 0) c 4 cn
1600
1400
1200
1000
800
600
400
200
0
S t r a f n , p e r c e n t
( a ) Longitudinal t e n s i l e .
250 3001 a z II 200
o 150 8 0) c +, 100 cn
50
0
c
590 K
I I I
S t r a t n , p e r c e n t
(b) Transverse t e n s i l e .
Figure A5.- Typical e levated tes t temperature s t r e s s - s t r a i n curves f o r B/6061 Al composite.
27

APPENDIX A
VI a c +, Ln
d n z
Q VI a c +, 8
c d a z: #
a
4000
3500
3000
!k 2500
2000
1500
1000
500
0
d
L. 254 Strafn, percent
( c ) Longitudinal compression.
100
90
80
70
60
50
40
30
20
10
0
.I- . .- I c I
- - -
500 K
590 K
- I I I I I I I I - I I
Shear strain, percent
(d ) In-plane shear .
Figure A5.- Concluded.
28
I

APPENDIX B
SPECIMENS EXPOSED UP TO 10 000 HOURS AND 500 K
The mechanical property data for all the B/A1 composite tests conducted in this investigation are given in tables V through IX. Typical stress-strain curves for the specimens exposed up to 10 000 hours at 500 K and tested at room temperature are presented in appendix B.
29
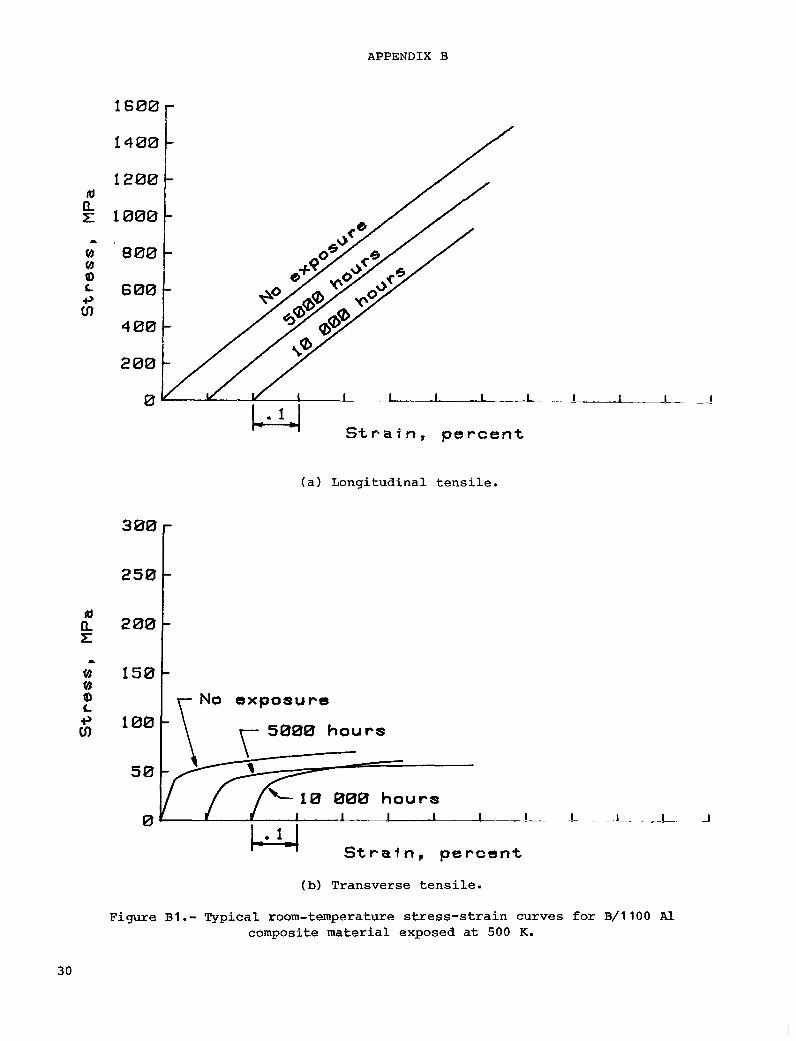
APPENDIX B
1400
1200
1000
800
600
4 00
200
0
b
/
l - 4 S t r a i n , p e r c e n t
(a) Longitudinal tensile.
250 3001 II) 100t \ 5000 hours
I
I 4 S t r a i n , p e r c e n t
0 l l
(b) Transverse tensile.
1 - I I
Figure B1.- Typical room-temperature stress-strain curves for B/1100 Al composite material exposed at 500 K.
30
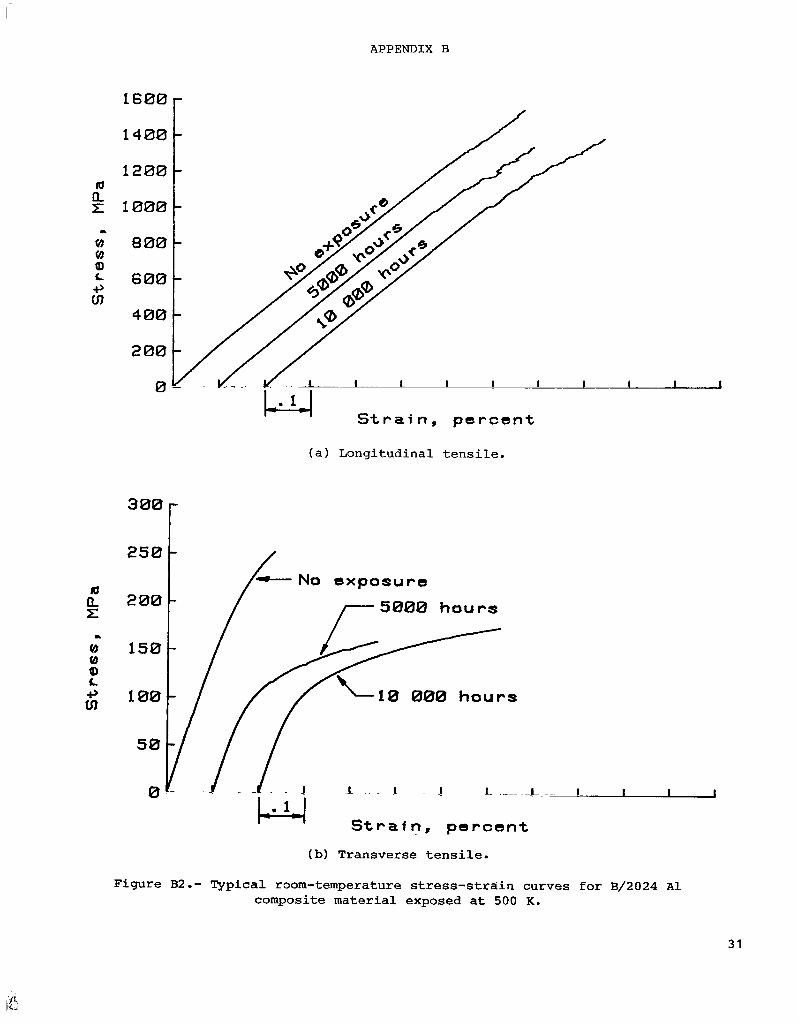
APPENDIX B
1 4 0 0 c
E 4 S t r a i n , p e r c e n t
(a) Longitudinal tensile.
S t r a f n , p e r c e n t
(b) Transverse tensile.
Figure B2.- Typical room-temperature stress-strain curves for B/2024 Al composite material exposed at 500 K.
31

APPENDIX B
c a L 680
m II z
(a) Longitudinal tensile.
200 2=01 150 - No e x p o s u r e
5000 h o u r s
I 0 000 h o u r s
1 - I 1 - I 1
S t r a f n , p e r c e n t
(b) Transverse tensile.
Figure B3.- Typical room-temperature stress-strain curves for B/3003 Al composite material exposed at 500 IC.
32
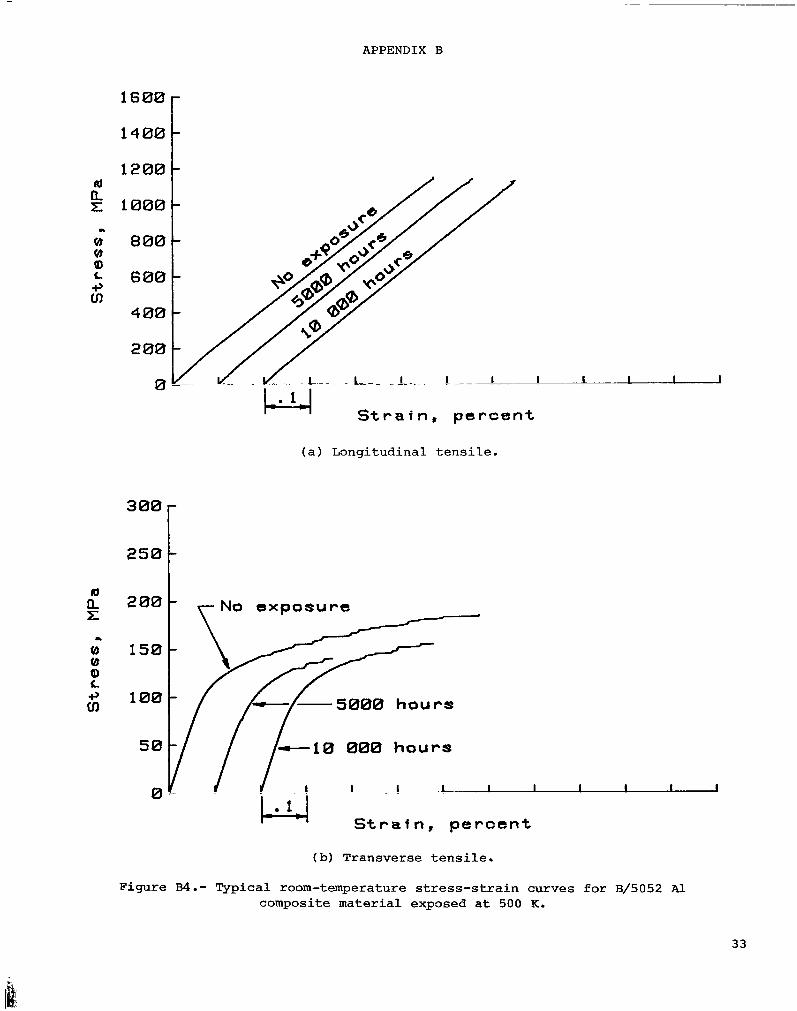
APPENDIX B
rd a z
# # a, c 3, CD
a
0 # a, c 3 cn
1600
1400
1200
1000
800
600
4 00
200
0
S t r a i n , p e r c e n t
(a) Longitudinal tensile.
200
150
100
50
0
1 r N o exposure t ‘I 5000 h o u r s
-10 000 hours
I
LJJ S t r a i n , p e r c e n t
(b) Transverse tensile.
Figure B4.- Typical room-temperature stress-strain curves for B/5052 Al composite material exposed at 500 K.
33
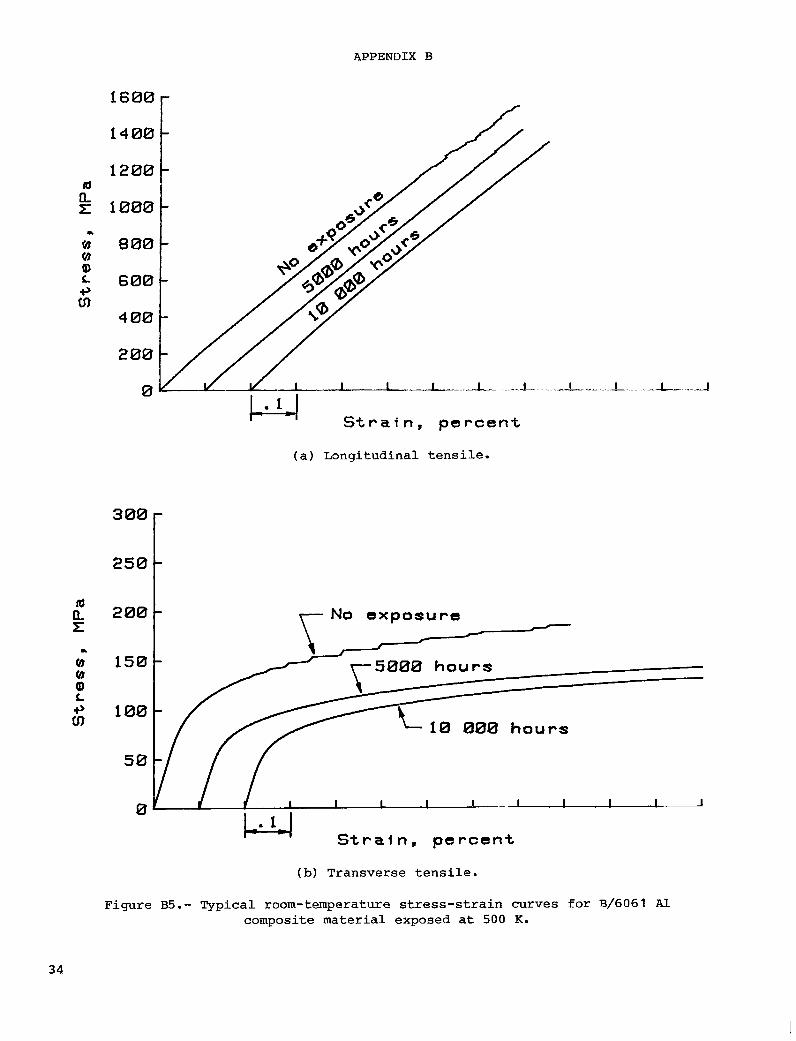
1600
APPENDIX B
1400
1200 m E 1000
L
v) 800 v) a, L 600 3 CD
4 00
200
0
S t r a i n , p e r c e n t
(a) Longitudinal tensile.
m E a a
v) v) a L +, CD
200
150
100
50
0
.L.
- No exposure
-
I I 1
S t r a i n , p e r c e n t
(b) Transverse tensile.
Figure B5.- Typical room-temperature stress-strain curves for B/6061 A l composite material exposed at 500 K.
34

APPENDIX C
SPECIMENS EXPOSED U P TO 10 000 HOURS AT 590 K
The mechanical property data for all the B/A1 composite tests conducted in this investigation are given in tables V through IX. Typical stress-strain curves for the specimens exposed up to 10 000 hours at 590 K and tested at room temperature are presented in appendix C.
35
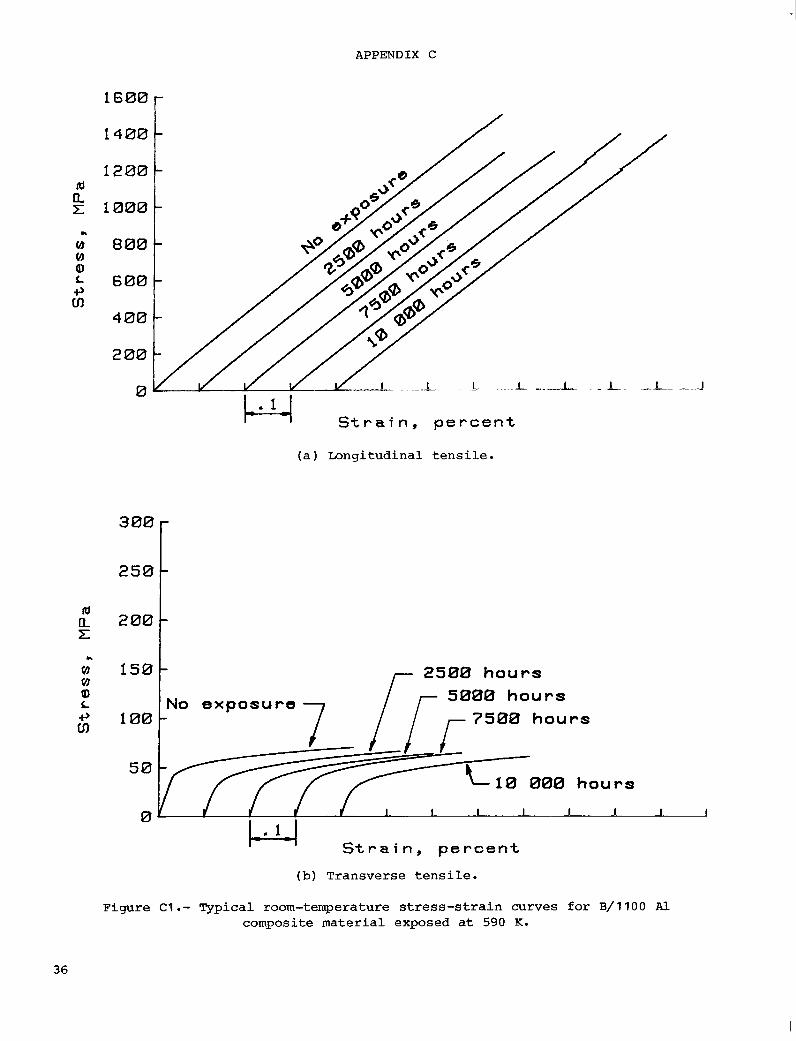
APPENDIX C
a *> 100- cn L
1600 r
5000 h o u r s NO e x p o s u r e 7 7500 h o u r s
L
v) v) a L 3 cn
1400
1200
1000
800
600
4 00
200
0
S t r a i n , p e r c e n t
(a) Longitudinal tensile.
250 3001 L
v) v) 1501 2500 h o u r s r
Figure C1.- Typical room-temperature stress-strain curves for B/1100 composite material exposed at 590 K.
36
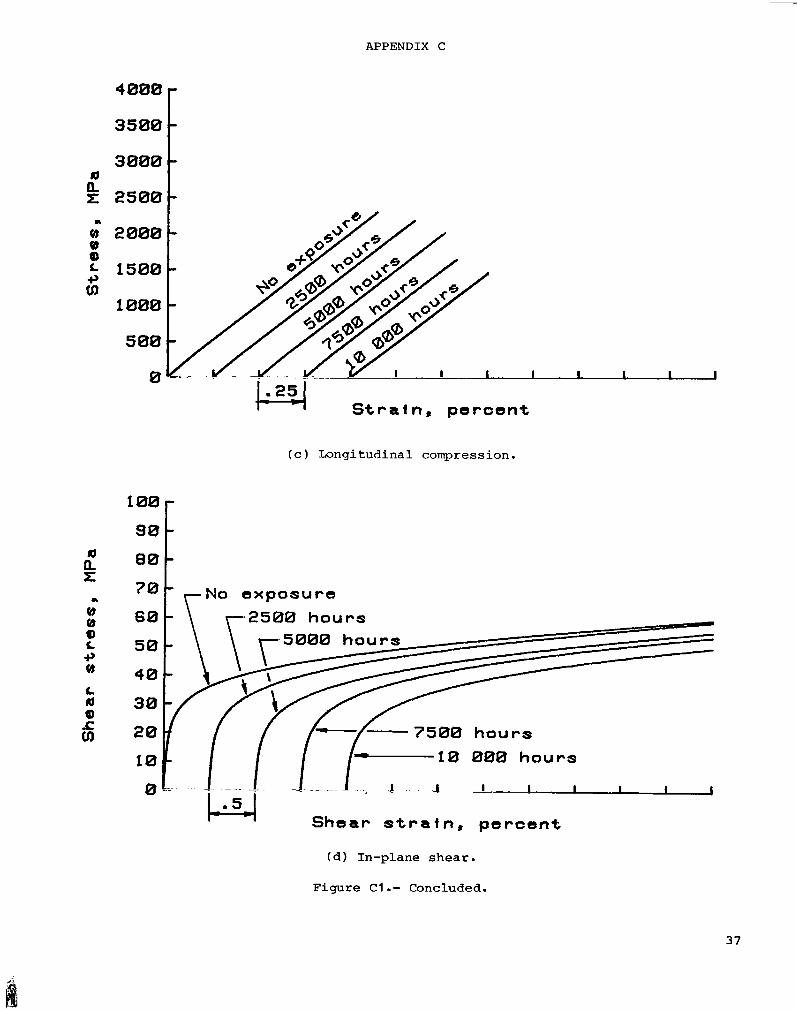
APPENDIX C
; 2000 (b 0
1500 +)
ci, 1000
500
0
a a IT
61 61 Q c e v)
c a 0)
a
&
- -
I I I I 1
S t r a t n , p e r c e n t
(c) Longitudinal compression.
100
NO e x p o s u r e 2588 hours
7500 h o u r s -10 880 h o u r s
Shear s t r a t n , p e r c e n t
(a) In-plane shear .
Figure C1.- Concluded.
37

APPENDIX C
1600 r
n
L
8 8 a> L 4 cn
n z a
1400
1200
1000
800
600
4 00
200
0
I 4 S t r a i n , p e r c e n t
300
250
200
150
100
50
0
1
(a) Longitudinal tensile.
No exposure h- hours
h o u r s
S t r a i n , p e r c e n t
(b) Transverse tensile.
Figure C2.- Typical room-temperature stress-strain curves for B/2024 A 1 composite material exposed at 590 K.
38

~
APPENDIX C
300
250
Id
z a 200-
L
1600
1200
1000
800
600
4 00
200
0
-
-
m n r:
(a) Longitudinal tensile.
(b) Transverse tensile.
Figure C3.- Typical room-temperature stress-strain curves for B/3003 A 1 composite material exposed at 590 K.
39
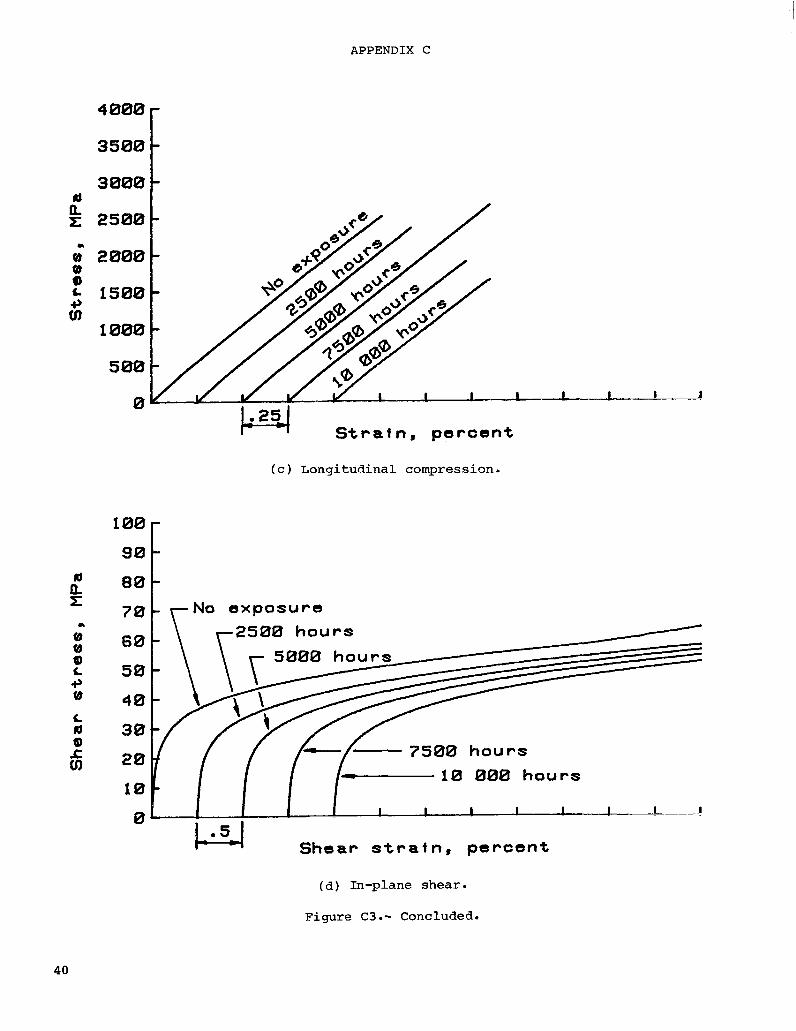
APPENDIX C
4000
3500
3000
E 2500 10
in 1000
500
0
100
90
80
70
60
50
40
30
20
10
0
I I I l _ . - 1
254 S t r a f n , percent
(c) Longitudinal compression.
- - r N o exposure
2500 hours
7500 hours 10 000 hours
I L I
151 Shear s t r a f n , percent
(d) In-plane shear.
Figure C3 .- Concluded.
40
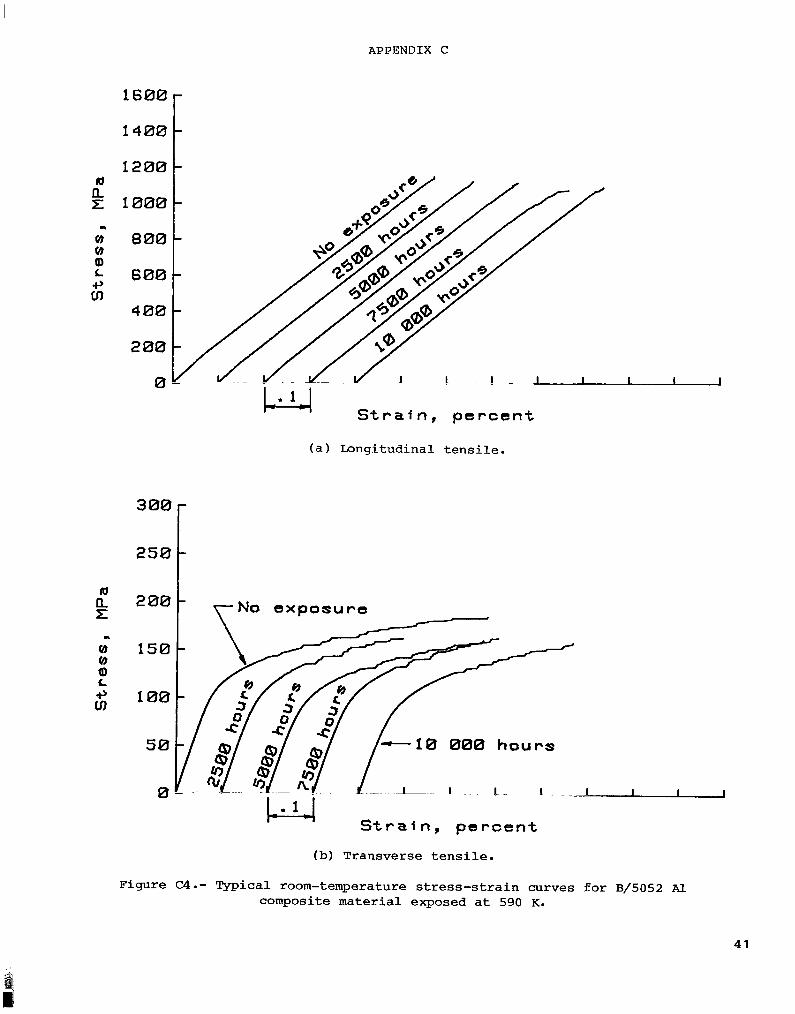
APPENDIX C
1600
14001
1200
m
v) v) a, L 3, ul
lu II
.. v) v) a, L 3, #
1000
800
600
400
200
0
- - -
1 - -1- L- I I I
LJ S t r a i n , p e r c e n t
(a) Longitudinal tensile.
1 250
-10 080 hours
__ I 1 1 - 1 - I _L I I
S t r a i n , p e r c e n t
(b) Transverse tensile.
Figure C4.- Typical room-temperature stress-strain curves for B/5052 Al composite material exposed at 590 K.
4 1
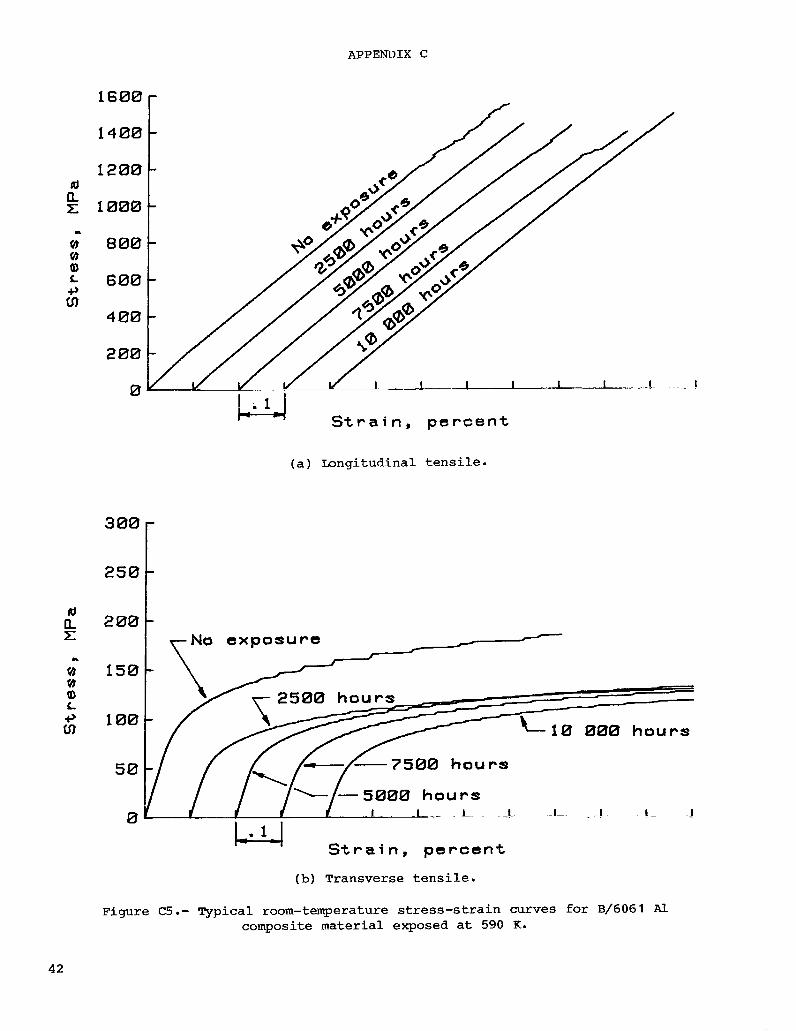
APPENDIX C
m
.. v) 8 a c e cn
1600
1400
1200
1000
800
600
4 00
200
0 1 - 0 ';I
S t r a i n , percent
(a) Longitudinal tensile.
200
150
100
50
0
- NO exposure
000 hours
7500 hours
.L - L -L -L -1 1- I
M S t r a i n , percent
(b) Transverse tensile.
Figure C5.- Typical room-temperature stress-strain curves for B/6061 Al composite material exposed at 590 K.
42
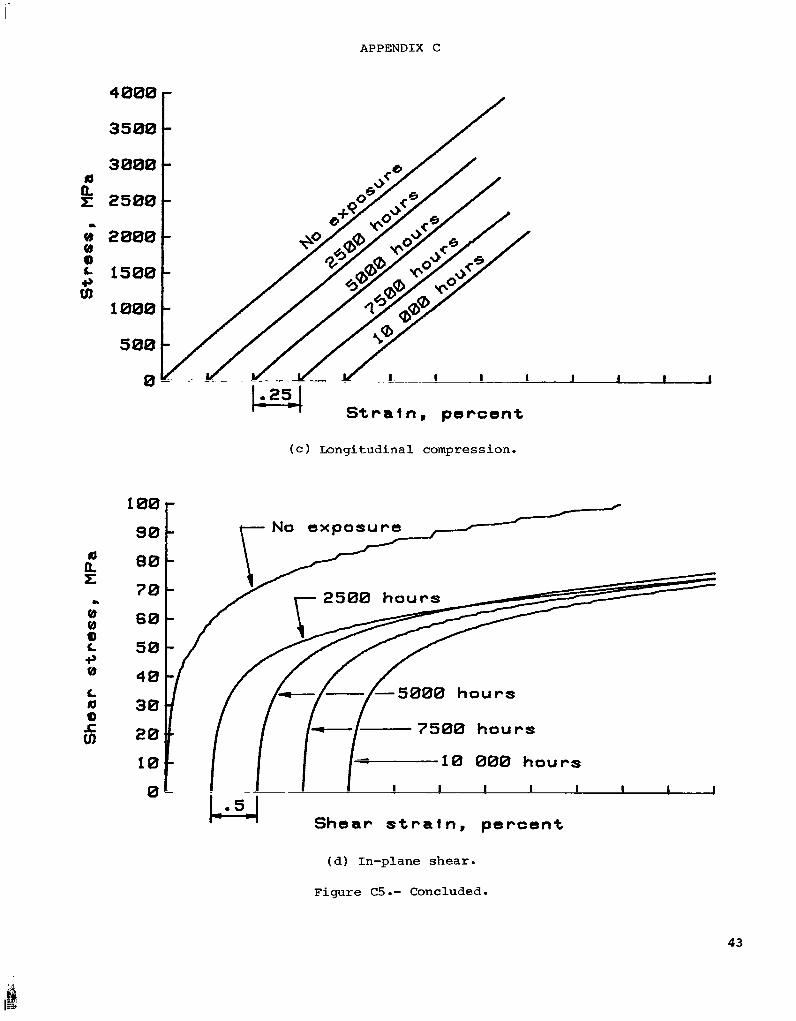
APPENDIX C
/ .. a x
3500 4000F 3000
2500
2000
1500
1000
500
0 254
S t r a l n , p e r c e n t
(c) Longitudinal compression.
. J I I I
7580 h o u r s
1 8 880 h o u r s I I I I I I I I
/ /-/ 7580 h o u r s
10 I I I I I
Lsl Shear s t r a l n , p e r c e n t
(d) In-plane shear .
Figure C5. - Concluded.
43
I
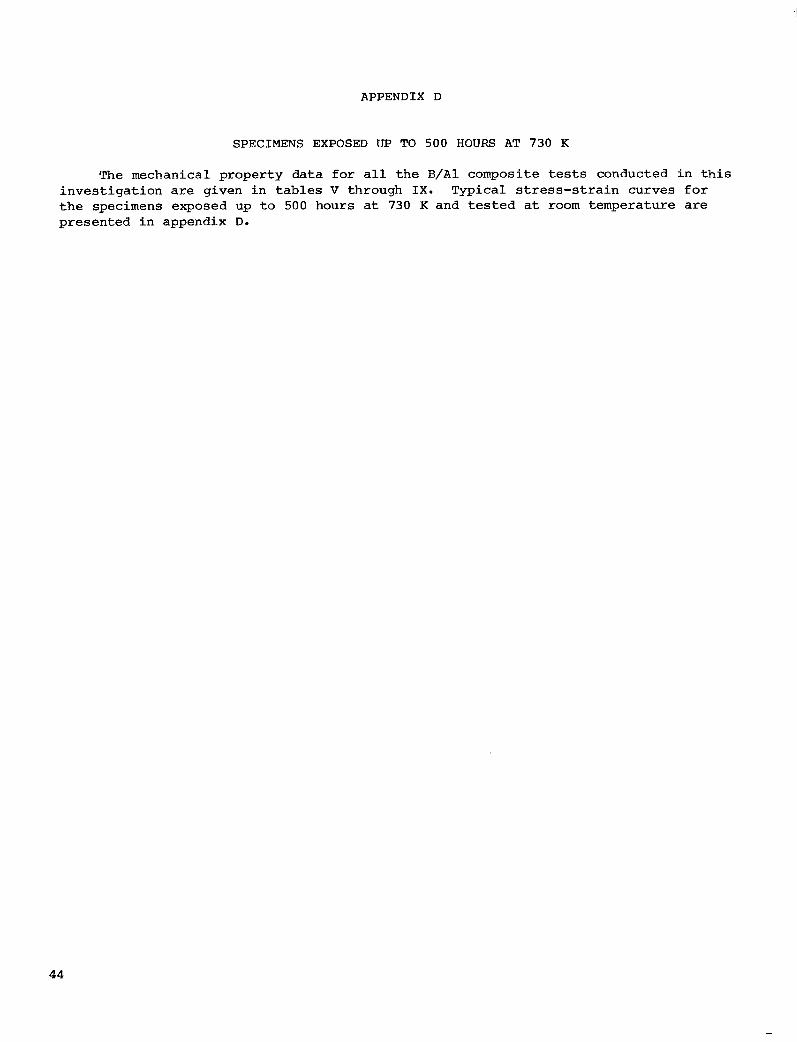
APPENDIX D
SPECIMENS EXPOSED UP TO 500 HOURS AT 730 K
The mechanical property data f o r a l l t he B/A1 composite tests conducted i n t h i s i nves t iga t ion are given i n t a b l e s V through I X . Typical s t r e s s - s t r a i n curves f o r t h e specimens exposed up t o 500 hours a t 730 K and t e s t e d a t room temperature are presented i n appendix D.
44

APPENDIX D
300
250
a x n 200-
m
1400
1200
1000
800
600
400
200
0
-
-
S t r a t n , p e r c e n t
(a) Longitudinal tensile.
(b) Transverse tensile.
Figure D1.- Typical room-temperature stress-strain curves for B/llOO Al composite material exposed at 730 K.
45
. 111111111111111-1111111111111111 I I I1111.11.11 I
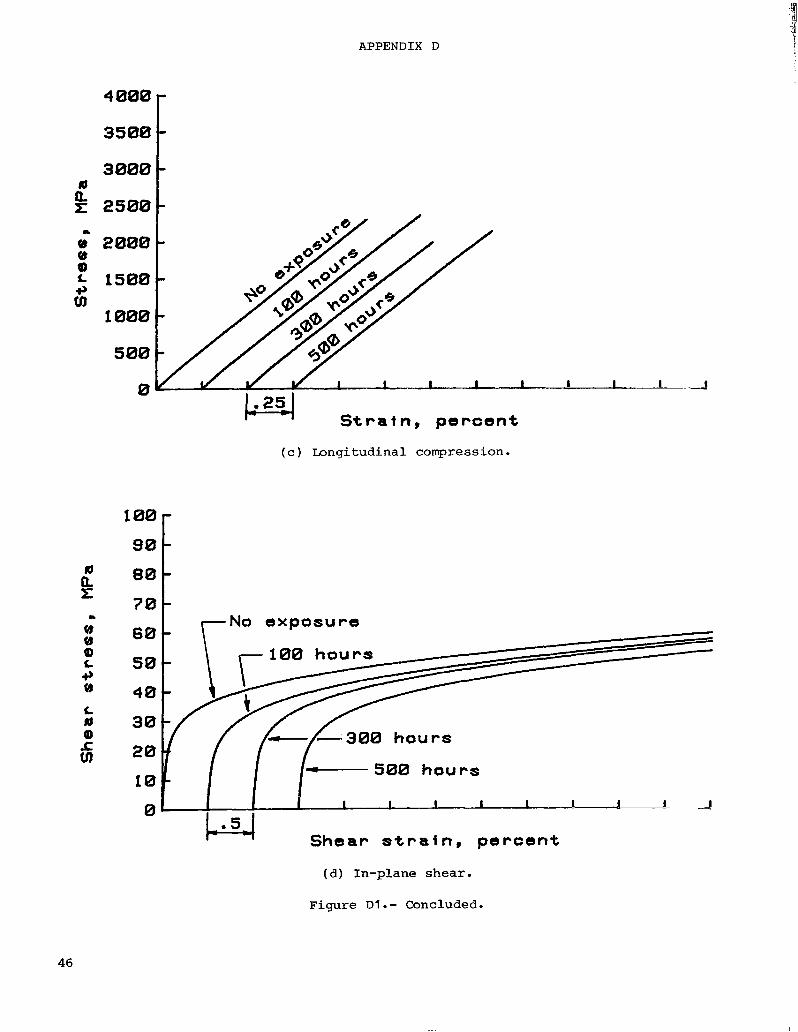
APPENDIX D
3000 d
& 2500
0" 2000 9 0 t 1500 +, m
1000
500
0
I- -
I I I 1 I
S t r a f n , p e r c e n t
( c ) Longitudinal compression.
lBOF 90
80 7 0 t d a z No e x p o s u r e a
0 (b 0) c e (b
c d 0)
8 I I I I I I I I 4
Shear s t r a f n , p e r c e n t
(d) In-plane shear .
Figure D1. - Concluded.
46

APPENDIX D
Al a z a
VI VI Q) c e cn
1600 - 1400 - 1200 - 1000 - 800 - 600 -
I I I
(a) Longitudinal tensile.
NO exposure
100 hours 250
:
/ p- 300 hours ld
z 500 hours
a I f f / /
(b) Transverse tensile.
Figure D2.- Typical room-temperature stress-strain curves for B/2024 A1 composite material exposed at 730 K.
47
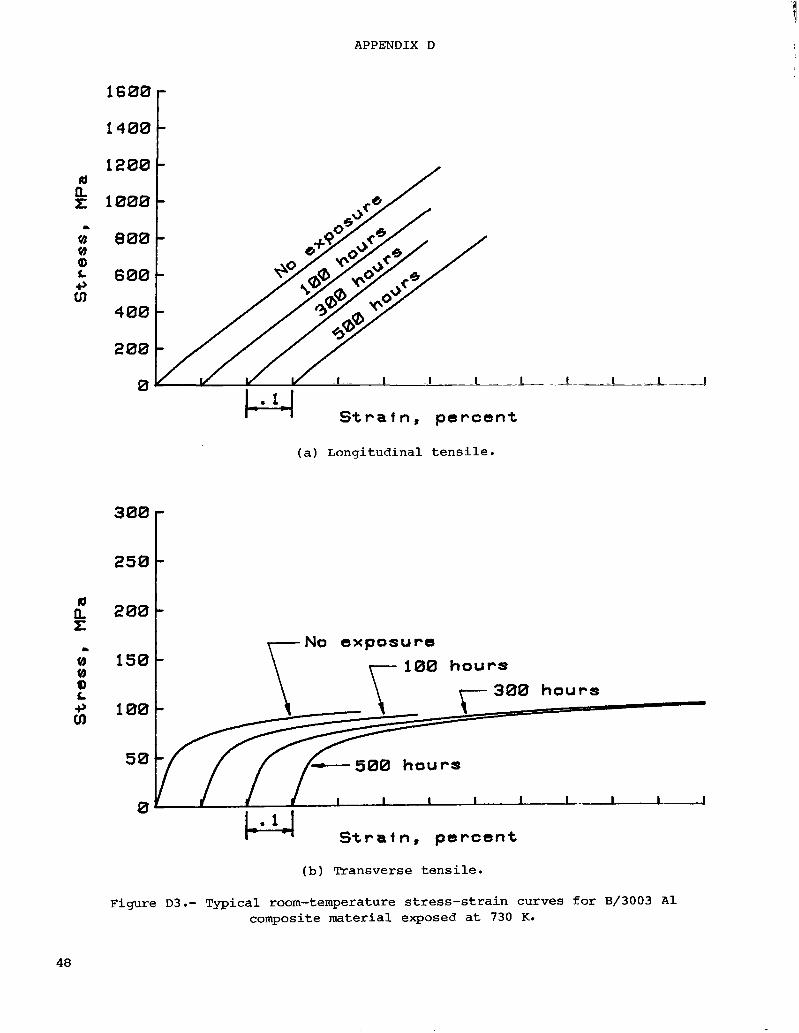
APPENDIX D
d
x 200-
.L
8 8 a3 c e cn
1600
1400
1200
1000
800
600
400
200
0
S t r a i n , p e r c e n t
(a ) Longitudinal tens i le .
3001 250
(b ) Transverse tensi le .
Figure D3.- Typical room-temperature stress-strain curves for B/3003 A1 composite material exposed a t 730 K.
48
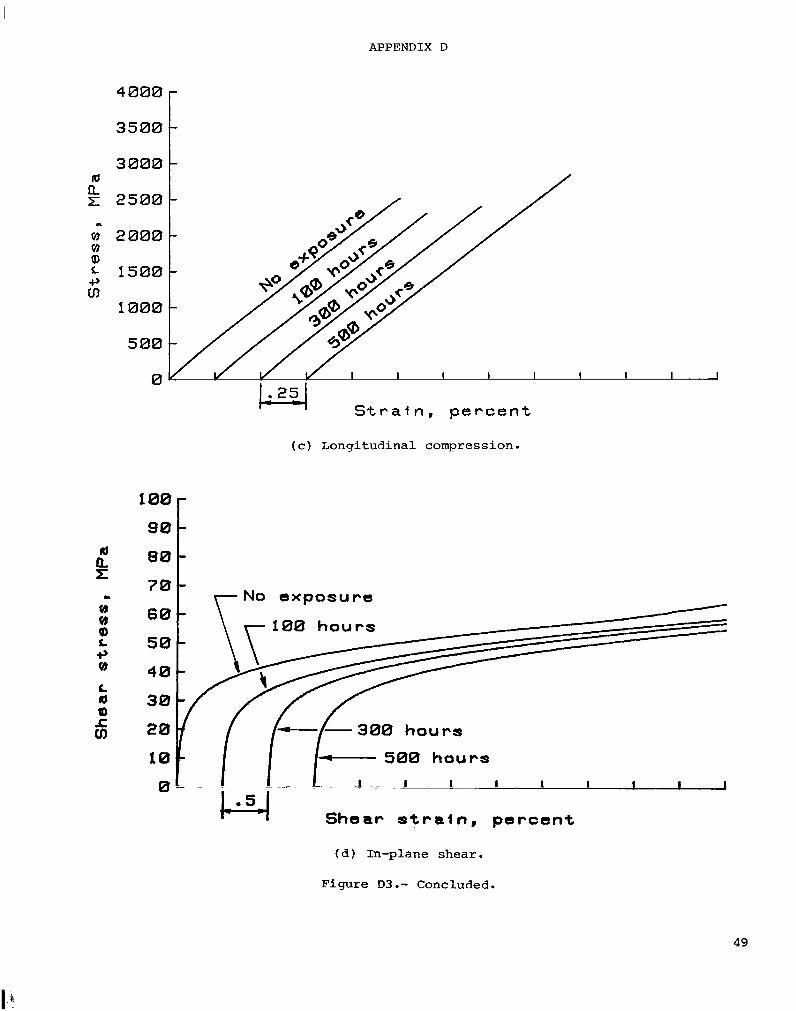
APPENDIX D
3000
2500 Id
I-
5 2000 VI
til 1000
500
0 1; 251 S t r a i n , p e r c e n t
(c) Longitudinal compression.
100
80
7 0
6 0
5 0
4 0
30
20 10
0
L - No exposure
180 hours
- . - .
Shear s t r a t n , percent
(d) In-plane shear.
Figure D3 .- Concluded.
49
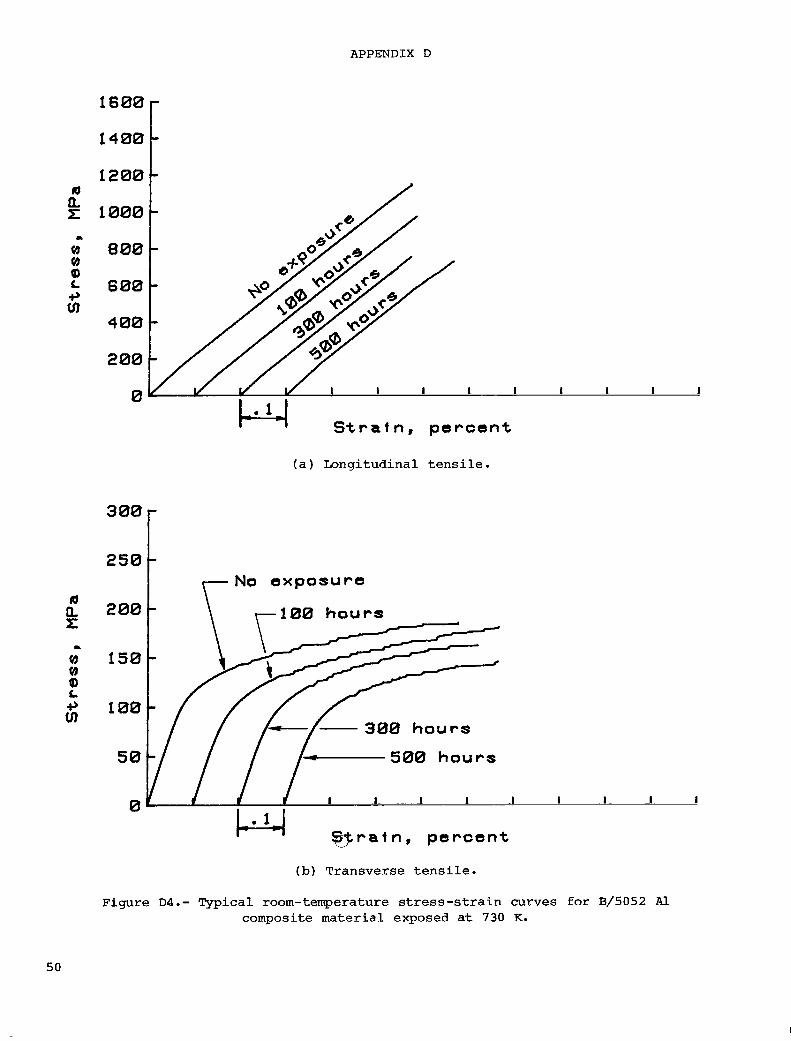
1600
1400
1200 d
APPENDIX D
L 1000
a C 600 i, a
400
200
0
P+I S t r a i n , p e r c e n t
( a ) Longitudinal t e n s i l e .
300 r
a
v) v) a c i, a
250
200
150
100
50
0
108 h o u r s
388 h o u r s
I. ._ _I 1 I I I
% r a i n , p e r c e n t
(b) Transverse t e n s i l e .
J.
Figure D4.- Typical room-temperature s t r e s s - s t r a i n curves for B/5052 A l composite material exposed a t 730 K.
50

APPENDIX D
td a r .L
v) v) Q) L +, m
1600
1400
1200
1000
800
600
400
200
0
(a) Longitudinal tensile.
250 3001 200
150
100
50
0
No exposure
100 hours
300 hours
1 - 1 1 1 I I I
S t r a i n , percent
(b) Transverse tensile.
Figure 05.- Typical room-temperature stress-strain curves for B/6061 Al composite material exposed at 730 K.
51
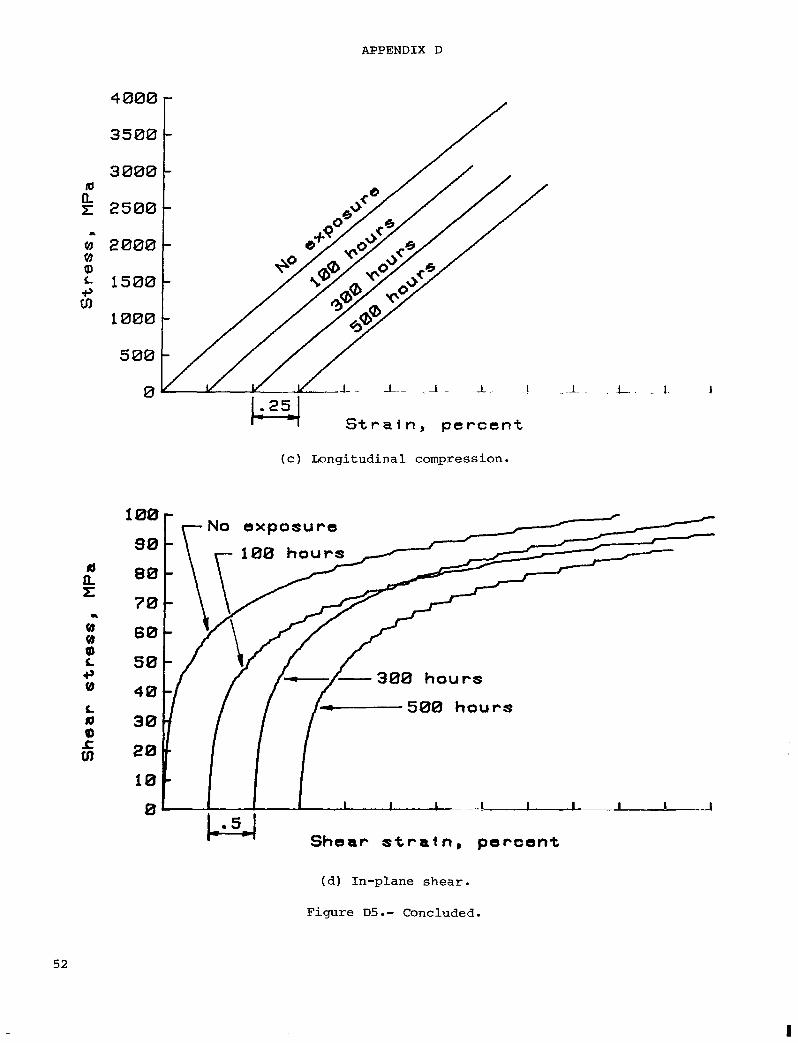
APPENDIX D
Strain, p e r c e n t
( c ) Longitudinal compression.
N o e x p o s u r e 100 -
388 h o u r s
1 0 - 0 I I I I - I I I I - -_ I c. q
S h e a r s t r a t n , p e r c e n t
(d ) In-plane shear .
Figure D5. - Concluded.
52
I
APPENDIX E
SPECIMENS THERMALLY CYCLED U p TO 2000 CYCLES BETWEEN 200 K AND 590 K
The mechanical property data f o r a l l t h e B/A1 composite tests conducted i n t h i s i nves t iga t ion a r e given i n t a b l e s V through I X . Typical s t r e s s - s t r a i n curves for t h e specimens thermally cycled up t o 2000 cycles between 200 K and 590 K and t e s t e d a t room temperature a r e presented i n appendix E.
53

m
300
250
200
150
a
VI VI a c 3, #
r
-
-
-
1 4 0 0
1200
1000
800
600
4 0 0
200
0
/
1- . ..
S t r a t n , p e r c e n t
(a) Longitudinal tensile.
! 1. !
100t\ r;OO cycles
ta I
S t r a t n , p e r c e n t
(b) Transverse tensile.
Figure El .- Typical room-temperature stress-strain curves for B/1100 Al composite material thermally cycled between 200 K and 590 K.
54
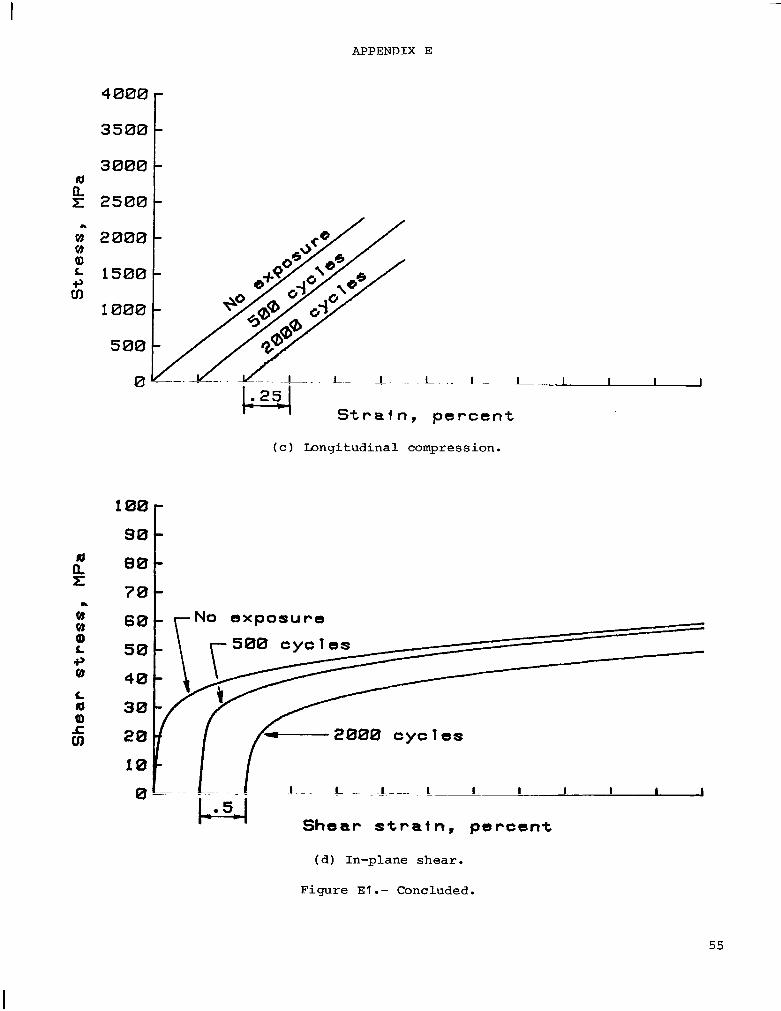
APPENDIX E
k251 S t r a f n , p e r c e n t
( c ) Longitudinal compression.
'""1 90
No exposure
I I 1 I I I
(d ) In-plane shear .
F igure E l . - Concluded.
55

APPENDIX E
d
a
v) (b Q c 3 cn
1600
1400
1200
1000
800
600
400
200
0 J---
S t r a f n , p e r c e n t
(a) Longitudinal tensile
200
150
100
50
0
LA S t r a f n , p e r c e n t
(b) Transverse tensile.
1 es
. .l . -. - _ 1 ;
Figure E 2 . - Typical room-temperature stress-strain curves €or B / 2 0 2 4 A1 composite material thermally cycled between 200 K and 590 K.
56

APPENDIX E
300
250
200
150
1600
14001
1200
1000
800
600
400
200
0
-
- -
m
# # Q) L *, cn
(a) Longitudinal tensile.
N o e x p o s u r e
2000 cycles
100 -
50 -
S t r a i n , p e r c e n t S t r a i n , p e r c e n t
(b) Transverse tensile.
I
Figure E3.- Typical room-temperature stress-strain curves for B/3003 A 1 composite material thermally cycled between 200 K and 590 K.
57

a z L
8 8 Q) L 3 CD
2500
2000
1500
1000
500
0 J
254 S t r a i n , p e r c e n t
(c) Longitudinal compression.
d n z 8 8 a c +, 69
L 10 a I co
a
100
90
80
70
60
5 0
4 0
30
20
10
0
4
2000 cycles
1- .L ,J - 1 _ _ 1 -_L._I___--- -
Shear s t r a i n , p e r c e n t
(a) In-plane shear.
Figure E3.- Concluded.
58
I 1 1 1 1 I I
I 1 I1 I I 1 I I 1111111. I
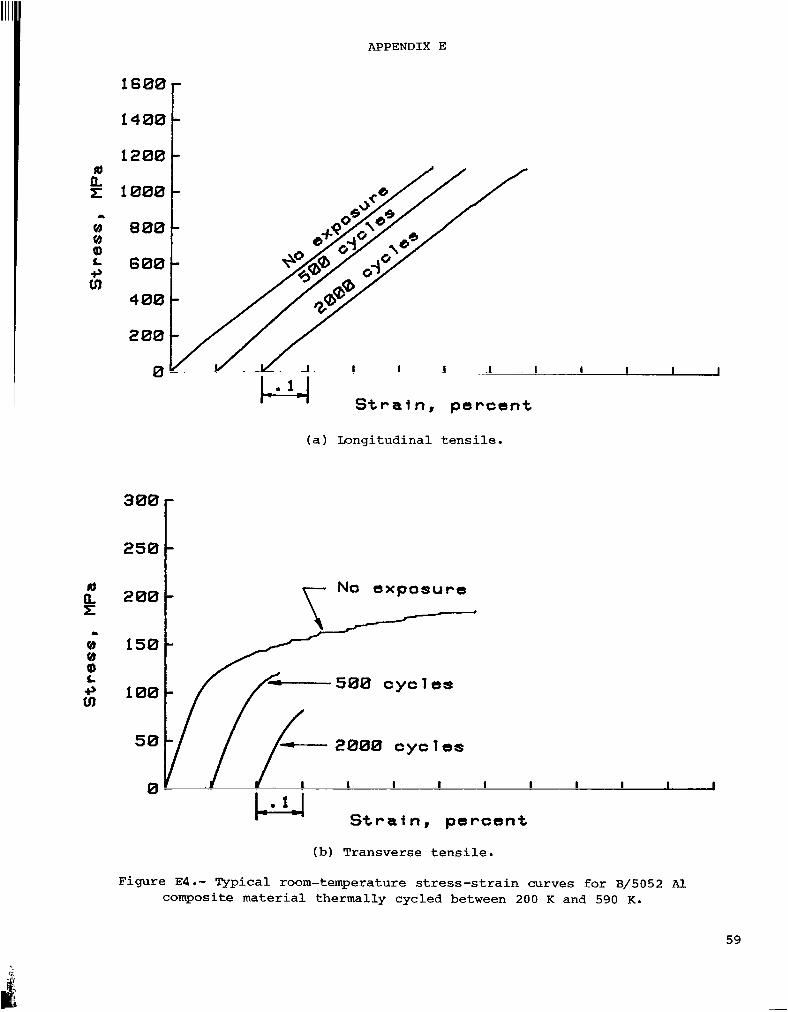
APPENDIX E
1
a
(b (b a c 3, m
1600
1400
1200
1000
800
600
400
200
0
c
- - -
1 . L I I I I
S t r a i n , percent
- - -
1 . L I I I I
S t r a i n , percent
(a) Longitudinal tensile.
250 3001 Na exposure
200 - ,
150 -
50
I I I I I I I I I 0
PJ S t r a i n , percent
(b) Transverse tensile.
Figure E4 .- Typical room-temperature stress-strain curves for B/5052 Al composite material thermally cycled between 200 K and 590 K.
59

APPENDIX E
1600
1400
1200
1000
800
600
400
200
0
(a) Longitudinal tensile.
200 No exposure -
000 cycles
I - I I J- - --_I - _
S t r a t n , percent
(b) Transverse tensile.
Figure E5 .- Typical room-temperature stress-strain curves €or B/6061 Al composite material thermally cycled between 200 K and 590 K.
60
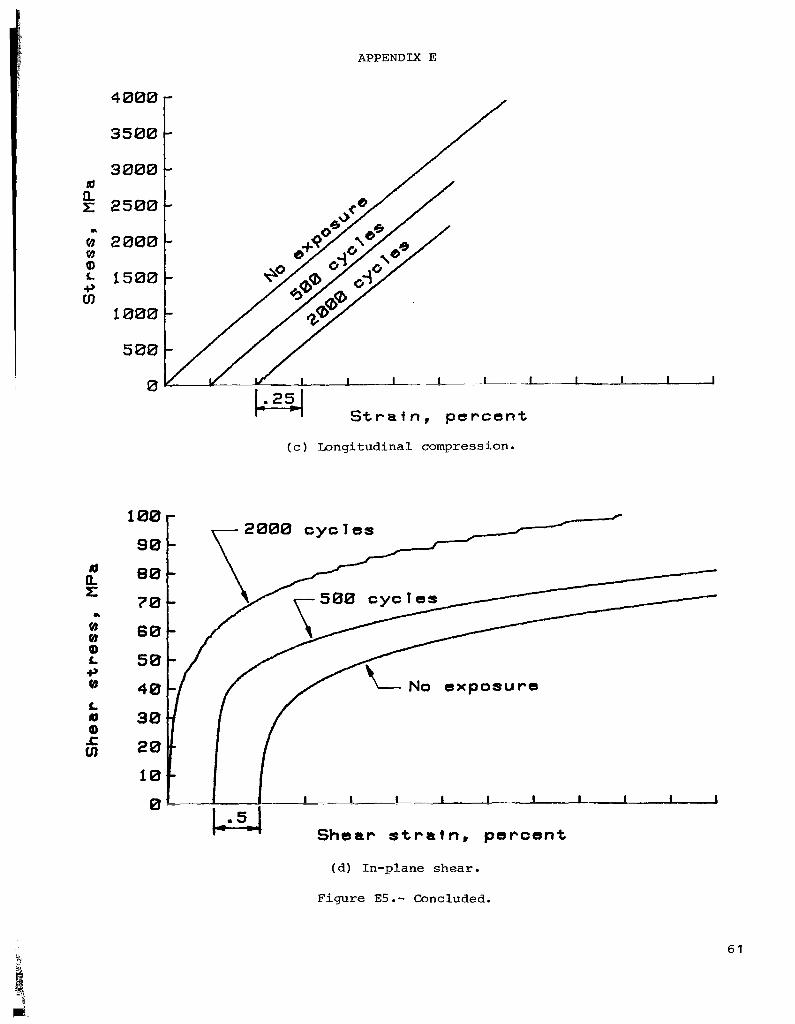
APPENDIX E
1000
500
#
z @ VI @ L +, VI
L
a
a a
m r a
100
90
80
7 0
60
5 0
4 0
30
20
1 0
0
(c) Longitudinal compression.
S h e a r s t r a t n , p e r c e n t
(d ) In-plane shear.
Figure E5 .- Concluded.
6 1
REFERENCES
1. Krukonis, V: I. Chemical Vapor Deposition of Boron Filament. Boron and Refractory Borides, V. I. Matkovich, ed., Springer-Verlag, 1977, pp. 517-540.
2. Kreider, Kenneth G.; and Prewo, K. M.: Boron-Reinforced Aluminum. Meta l l ic Matrix Composites, Kenneth G. Kreider, ed., Academic Press, Inc., 1974, pp. 399-471.
3. Toth, I. J.; Brentna l l , W. D.; and Menke, G. D.: A Survey of Aluminum Matrix Composites. Composites: S t a t e of the A r t , J. W. Weeton and E. Scala , eds., Metall. SOC. AIME, C.1974, pp. 139-207.
4. Lynch, C. T.; and Kershaw, J. P.: M e t a l Matrix C o m p o s i t e s . CRC press, c.1972.
5. K e r r , J. R.; and Haskins, J. F.: Time-Temperature-Stress Capab i l i t i e s of Com- posite Materials f o r Advanced Supersonic Technology Application - Phase I. NASA CR-159267, 1980.
6. Metcalfe, Arthur G. ; and Klein, Mark J. : Effec t of t h e In t e r f ace on Longitudinal Tensi le Proper t ies . In te r faces i n Metal Matrix C o m p o s i t e s , Arthur G. Metcalfe, ed., Academic Press, Inc., 1974, pp. 125-168.
7. Olsen, George C.; and Tompkins, Stephen S.: E f fec t s of Continuous and Cycl ic Thermal Exposures on Boron- and Borsic-Reinforced 6061 Aluminum Composites. NASA TP-1063, 1977.
8. Olsen, George C.; and Tompkins, Stephen S.: Continuous and Cyclic Thermal Exposure Induced Degradation i n Boron Reinforced 6061 Aluminum Composites. Fa i lu re m d e s i n Composites N, J a m e s A. Cornie and Frank W. Crossman, eds., Metall. SOC. AIME, c.1979, pp. 1-21.
9. Shahinian, P.: Thermal Fatigue of Aluminum-Boron Composites. SAMPE Q., vol. 2, no. 1, Oct. 1970, pp. 28-35.
10. Wright, M. A. : The Effec t of Thermal Cycling on the Mechanical Properties of Various Aluminum Alloys Reinforced With Unid i rec t iona l Boron Fibers . Metall. Trans., vol. 6A, no. 1, Jan. 1975, pp. 129-134.
11. Van Horn, Kent R., ed.: Aluminum. Volume I. P rope r t i e s , Physical Metallurgy and Phase Diagrams. American Soc. Metals, c.1967.
12. C l a r k , Ronald K.; and Lisagor, W. Barry: Ef fec ts of Method of Loading and Specimen Configuration on Compressive Strength of Graphite/Epoxy C o m p o s i t e Materials. NASA TM-81796, 1980.
13. Popov, E. P.: Mechanics of Materials. Prentice-Hall Inc., c.1952.
14. Mondolfo, L. F.: Aluminum Alloys: S t ruc ture and Proper t ies . Butterworth Pub., Inc., 1976.
15. Metterties, Earl L.: The Chemistry of Boron and Its Compounds. John Wiley & Sons, Inc., c.1967.
62
16. T h o m p s o n , Raymond: The C h e m i s t r y of M e t a l B o r i d e s and R e l a t e d C o m p o u n d s . Pro- gress i n B o r o n C h e m i s t r y , V o l u m e 2, R. J. B r o t h e r t o n and H. Steinberg, eds., P e r g a m o n Press, Inc. , c.1970, pp. 173-230.
17. D a r d i , Louis E.; and K r e i d e r , K e n n e t h G.: Thermal C y c l i n g i n B o r o n - A l u m i n u m C o m p o s i t e s . New H o r i z o n s i n Materials and Processing, V o l u m e 16 of N a t i o n a l SAMPE S y m p o s i u m and Exhib i t ion SOC. A d v a n c e . Mater. 6 Process Eng., A p r . 1973, pp. 125-139.
18. Moorjani, K.; and Feldman, C.: V. A m o r p h o u s B o r o n F i l m s . B o r o n and R e f r a c t o r y B o r i d e s , V. I. Matkovich, ed., S p r i n g e r - V e r l a g , 1977, pp. 581-596.
19. G r e e n w o o d , N. N.; Parish, R. V.; and Thornton, I?.: Metal B o r i d e s Q. R e v . ( L o n d o n ) , vol. 20, no. 3, 1966, pp. 441-464.
20. H o o v e r , W i l l i a m R. : The C r i t i c a l E n e r g y R e l e a s e Rate as a F a i l u r e C r i t e r i o n for B/A1 C o m p o s i t e s . Failure Modes i n C o m p o s i t e s 111, T. T. C h i a o and D. M. Schuster, eds., Metall. SOC. AIME, c.1976, pp. 304-318.
21. Makarenko, G. N.: V I I . B o r i d e s i n the IVb G r o u p , B o r o n and R e f r a c t o r y B o r i d e s , V. I. Matkovich, ed., S p r i n g e r - V e r l a g , 1977, pp. 310-330.
22. G u r i n , V. N.; and K o r s u k o v a , M. M.: V I . Ib and I I b Subgroup B o r i d e s . B o r o n and R e f r a c t o r y B o r i d e s , V. I. Matkovich, ed., S p r i n g e r - V e r l a g , 1977, pp. 293-309.
23. Perry, A. J.; N i c o l l , A. R. ; P h i l l i p s , K.; and S a h m , P. R.: The C o p p e r - B o r o n E u t e c t i c - U n i d i r e c t i o n a l l y Sol idif ied. J. Mater. Sci., vol. 8, 1973, pp. 1340-1 348
24. C a r l s s o n , J.-0. ; and LundstrGm, T. : The So lu t ion H a r d e n i n g of B e t a - R h o m b o h e d r a l B o r o n . J. L e s s - C o m m o n M e t . , vol. 22, no. 3, N o v . 1970, pp. 317-320.
25. C h a b a n , N. F.; and K u z ' m a , Yu. B.: The Ternary S y s t e m s C h r o m i u m - A l u m i n u m - B o r o n and M a n g a n e s e - A l u m i n u m - B o r o n . Izv. A k a d . N a u k S S S R , N e o r g . Mater., vol. 9, no. 11, Nov. 1973, pp. 1908-1911.
63
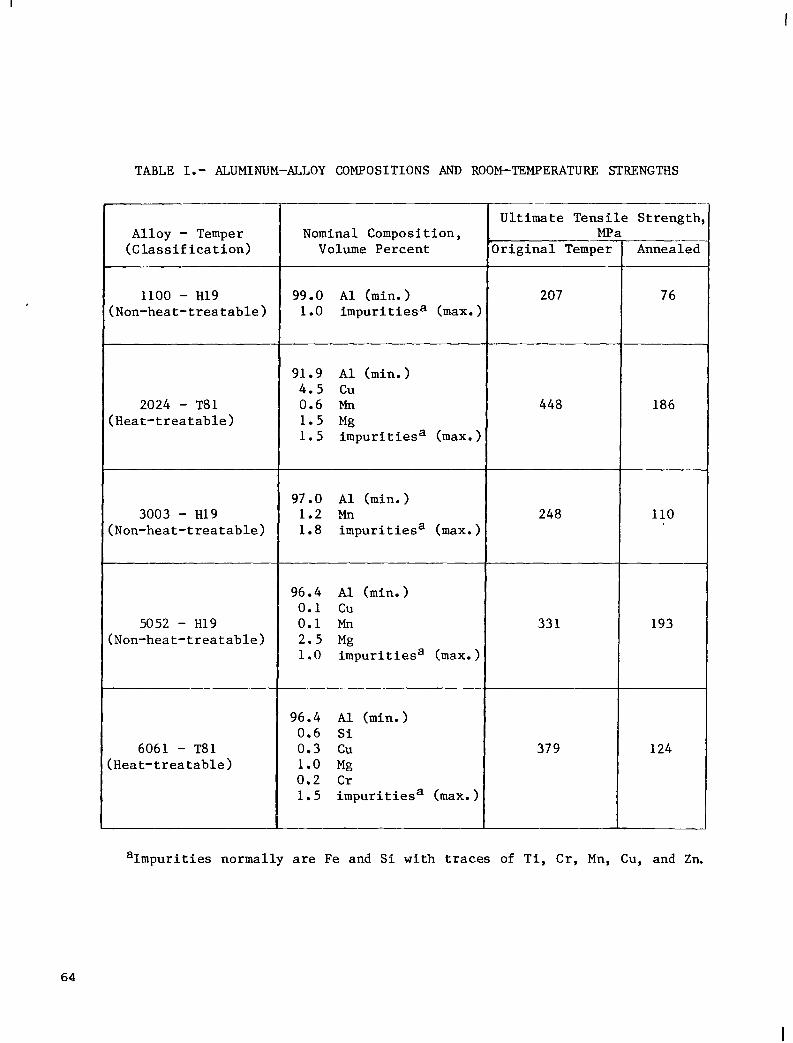
TABLE I.- LUMINUM-ALLOY COMPOSITIONS AND ROOM-TEMPERATURE STRENGTHS
Alloy - Temper (Classification)
1100 - H19 (Non-heat-treatable)
2024 - T81 (Heat-treatable)
3003 - H19 (Non-heat-treatable)
5052 - H19 (Non-heat-treatable)
6061 - T81 (Heat-treatable)
Nominal Composition, Volume Percent
99.0 A1 (min. ) 1.0 impuritiesa (max.:
91.9 A1 (min.) 4.5 cu 0.6 Mn 1.5 Mg 1.5 impuritiesa (max. 1
97 .O A1 (min. 1.2 Mn 1.8 impuritiesa (max.;
96.4 A 1 (min. ) 0.1 cu 0.1 Mn 2.5 Mg 1.0 impuritiesa (max.)
96.4 A1 (min. 0.6 Si 0.3 Cu 1.0 Mg 0.2 Cr 1.5 impuritiesa (max. )
~~ ~~ ~
Ultimate Tensile Strength MP
Original Temper
207
448
248
33 1
37 9
___--.
Anne a led
76
186
110
193
124
aImpurities normally are Fe and Si with traces of Ti, Cr, Mn, Cu, and Zn.
64
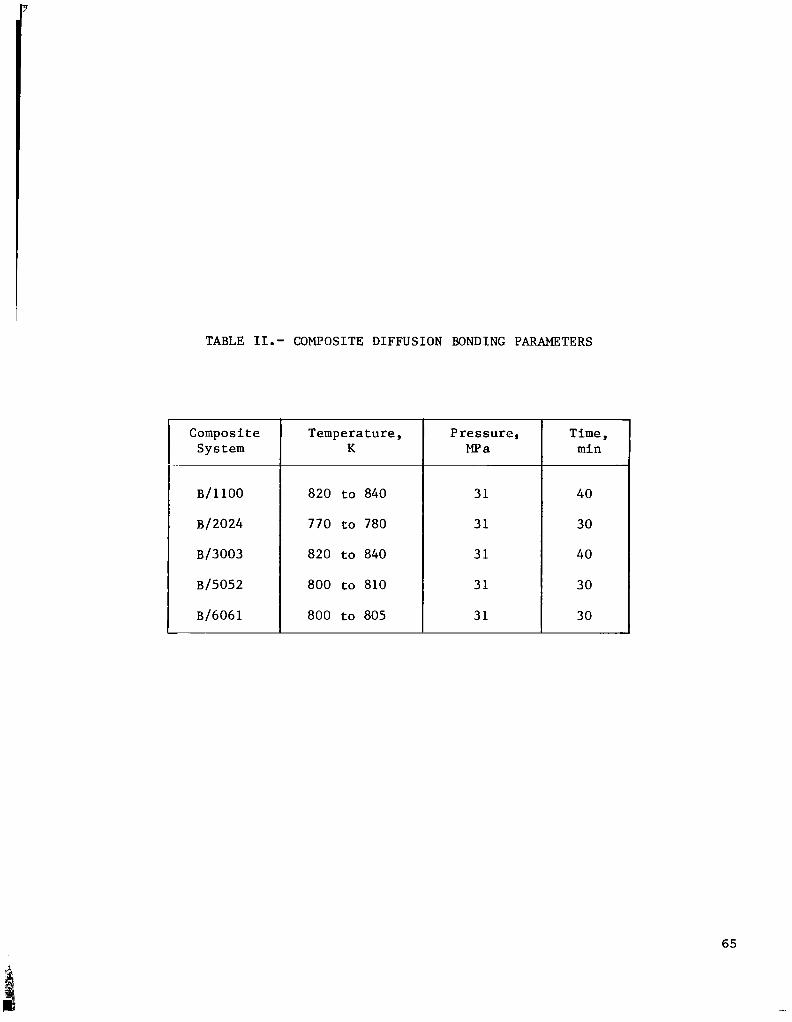
TABLE 11. - COMPOSITE DIFFUSION BONDING PARAMETERS
B/1100
B/2024
B/3003
B/5052
B/6061
Temperature, Pressure, I System I K Composite
820 to 840
770 to 780
820 to 840
800 to 810
800 to 805
31
31
31
31
31
Time, min
40
30
40
30
30
65

TABLE 111. - SPECIMEN CONFIGURATION
T e s t Type
Longi-
Tensile t ud ina l
Trans- verse
Tensi le
Longi- t ud ina l
Compres- sion
In-Plane Shear
aDis
- ~
Material Tested
__
B/1100 Al B/2024 A l B/3003 Al B/5052 A1 B/6061 A l
1100 A l 2024 A 1 3003 A l 5052 Al 6061 A l
_ -
B/1100 Al B/2024 A l B/3003 A l B/5052 Al B/6061 Al
B/1100 Al B/3003 A I B/6061 A l
B/1100 A 1 B/3003 Al B/6061 A l
.ance between
Fiber Orientat ion
-~
0"
.. ~~ ... - . -
Not Applicable
. - -
90 "
- - ..~ .
0"
+45" -
: r ips .
Nomi Length
300
300
_.
130
150
150
31.Spe Width
25.0
25.0
25.0
12.5
25.0
imen-Dime rhicknes s
2.0
1.0
2.0
2.0
2.0
si.ons% mm Gage Lengtl
a100
a100
a 50
12
- .
a50
66
I

TABLE 1V.- MECHANICAL PROPERTY TESTS
Test
Composite Longitudinal Tensile
Composite Transverse Tensile
Composite Longitudinal Compress ion
Composite In-Plane Shear
_. . . ~-
Alloy Tensile
Fiber Orientation
O 0
90 O
O 0
+45" -
Not Applicable
Test Standard
ASTM D-3552
ASTM D-3552
'9C
ASTM D-3410
b ASTM -3518
d ASTM D-3552
Properties Reported
Load Rate, N/sec
110
90
75
90
15
aci - ultimate longitudinal tensile strength
ci - ultimate transverse tensile strength
ci - ultimate longitudinal compressive strength
ci - ultimate tensile strength (alloy only)
T - ultimate in-plane shear stress
El - longitudinal elastic modulus
E2 - transverse elastic modulus
G 1 2 - in-plane shear modulus
It
tt
IC
t
12
bResin matrix composite standard (no metal matrix standard
dTested in the same manner as composites. IITRI modification of fixture used.
established).
67

TABLE V.- B/1100 Al COMPOSITE TENSILE, COMPRESSION, AND SHEAR PROPERTIES
100 Hours at
1296
300 Hours a t
500 Hours a t
500 Cycles 200 K t o 590 K
2000 Cyc les 200 K t o 590 K
295
295
295
295
951 912 968
613 590 824
1151 1254 1470
1125 1030 1174
-
Elas t i c Modulus
GP a
23 1 23 2 226
227 23 1 224
~ -~
189 192 186
226 222 224
223 222 219
23 1 226 229
232 228 226
225 226 218
225 223 218
--- 222 224
223 228 23 1
230 229 228
233 23 1 228
214 215 216
~
T r a n s v e r s e T e n s i l e
I l t i m a t e S t r e s s ,
MPa
67 66 70
51 47 50
26 26 27
79 57 47
82 61 58
91 66 69
64 68 63
64 74 63
61 72 52
74 76 80
93 85 92
87 77 66
71 67 45
64 62 38
~ -~
3 l a s t i c l o d u l u s
GP a
138 137 133
I-
112 118
106
11 1
130 124 136
124 137 136
127 137
--
-- 133 130 135
137 13 1 135
139 134 133
140 14 1 139
136 130 132
130 134 132
132 120 128
48 127 114
J It i m a t e Zompres-
s i o n S t r e s s ,
MPa
2528 2294 1867
917 1169 1251
474 539 426
2796 2180 1949
2407 1917 2021
1529 1638 1724
1274 1469 1454
2169 1783
2029 1832 1982
2133 1641 2347
2203 2234 2402
1717
1776 ---
S h e a r
I l t ima t e S t r e s s ,
MPa
14 1 134 131
125 134 135
106 111 103
---
---
163 129 132
130 122 13 1
125 123 126
115 117 125
115 113 113
100 107 96
105 104 98
137 130 133
110 118 127
~~
Clastic lodulua
GP a
51 53 50
49 46 44
32
35 --
--
---
54 56 --
55 52 56
54 55 54
56 52 53
54 53 54
55 53 53
54 53 54
54 55 52
48 49 48
68
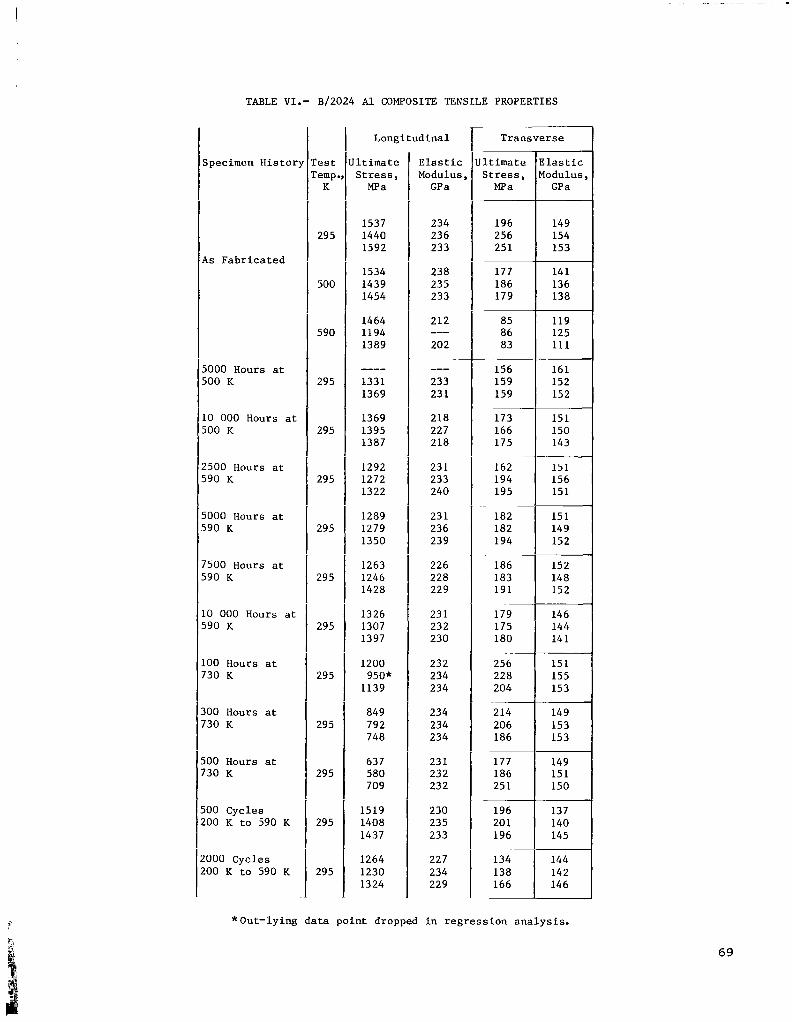
TABLE VI . - B/2024 Al COMPOSITE TENSILE PROPERTIES
Specimen Histor)
As Fabricated
5000 Hours at 500 K
10 000 Hours at 500 K
2500 Hours at 590 K
5000 Hours at 590 K
7500 Hours at 590 K
10 000 Hours at 590 K
100 Hours at 730 K
300 Hours at 730 K
500 Hours at 730 K
500 Cycles 200 K to 590 K
,000 Cycles 200 K to 590 K
.'est :empa K
29 5
500
590
295
295
295
295
295
295
295
295
295
295
295
Longitudinal
lltimate Stress,
MPa
1537 1440 1592
1534 1439 1454
1464 1194 1389
--- 1331 1369
1369 1395 1387
1292 1272 1322
1289 1279 1350
1263 1246 1428
1326 1307 1397
1200
1139
849 792 748
637 580 709
1519 1408 1437
1264 1230 1324
950"
Elastic Modulus , GPa
234 236 233
238 235 233
212
202 ---
--- 233 23 1
218 227 218
23 1 233 240
23 1 236 239
226 228 229
23 1 232 230
232 234 234
234 234 234
23 1 232 232
230 235 233
227 234 229
Transverse
Jltimate Elastic Stress, Modulus MPa I GPa
196 256 25 1
177 186 179
85 86 83
156 159 159
173 166 175
162 194 195
___
-
182 182 194
186 183 191
179 175 180
256 228 204
~ ~~
214 206 186
149 154 153
14 1 136 138
119 125 111
161 152 152
151 150 143
151 156 15 1
15 1 149 152
152 148 152
146 144 14 1
151 155 153
149 153 153
196 20 1 140 196 145
138 166
* Out-lying data point dropped in regression analysis.
69
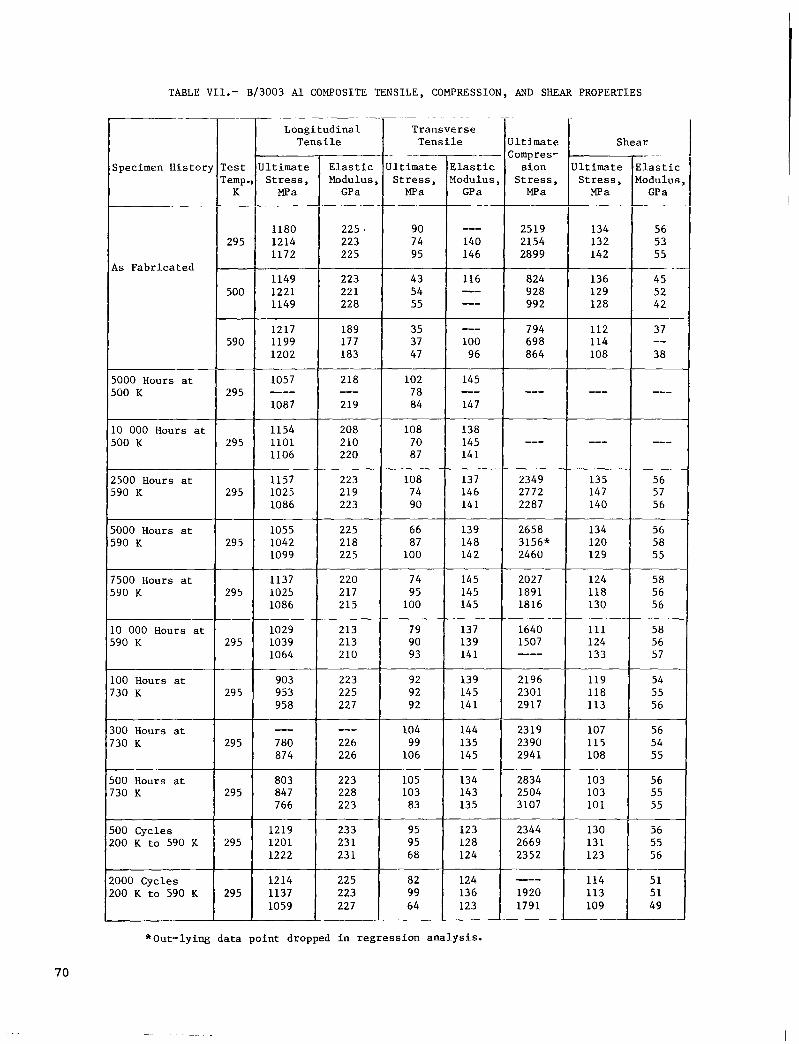
TABLE VT.1.- B/3003 Al COMPOSITE TENSILE, COMPRESSION, AND SHEAR PROPERTIES
___ - --. -
T r a n s v e r s e T e n s i l e U It i m a t e
Compres-
90 -- 2519 74 140 2154 95 146 2899
43 116 824 928 54
55 -- 992
794 35 37 100 698
---
--
47 96 a64
102 145
S h e a r -~ __
Ultimate E l a s t i c
MF'a GP a S t r e s s , Modulus,
. --_ -
134 56 132 53 142 55
136 45 129 52 128 42
112 37 114
.-
-- loa 38
I I I
295
500
590
1180 225 1214 223 1172 225
1149 223 1221 22 1 1149 228
1217 189 1199 177 1202 183
5000 Hours a t 500 K
10 000 Hours a t 500 K
1057 218 --- 295 --- 1087 219
1154 208 295 1101 210
1106 220
loa 74 90
66
100 a7
137 2349 135 56 146 2772 147 57 141 2287 140 56
139 2658 134 56
142 2460 129 55 148 3156* 120 58
295
__
295
295
__
295
74 95 100
79 90 93
92 92 92
104 99 106
105 103 a3
95 95 68
145 2027 124 58 145 1891 iia 56 145 1816 130 56
137 1640 111 58 139 1507 124 56 141 133 57
139 2196 119 54 145 2301 iia 55 14 1 2917 113 56
144 2319 107 56 135 2390 115 54 145 294 1 108 55
134 2834 103 56 143 2504 103 55 135 3107 101 55
123 2344 130 56 128 2669 13 1 55 124 2352 123 56
---
_ _ _ _ ~ _ _ _ _ _
500 Cycles 200 K t o 590 K
lo00 Cycles !OO K t o 590 K
1219 233 295 1201 23 1
1222 23 1
1214 225 295 1137 223
1059 227
Specimen H i s t o r y T e s t Temp.
K
E l a s t i c Modulus
GP a
U l t i m a t e S t r e s s ,
MPa
A s F a b r i c a t e d
2500 Hours a t 590 K
, 223 219 223
1157 1025
1055 1042 1099
295
__
295 225 218 225
5000 Hours a t 590 K
7500 Hours a t 590 K
1137 1025 1086
1029 1039 1064
220 217 215
213 213 210
10 000 Hours a t 590 K
100 Hours a t 730 K
903 953 958
223 225 227
295
300 Hours a t 730 K
a03
766 223
j00 Hours a t 730 K
*Out- lying d a t a p o i n t dropped i n r e g r e s s i o n a n a l y s i s .
70
. .

TABLE VII1.- B/5052 Al COMPOSITE TENSILE PROPERTIES
Transverse
Jltimate Elastic Stress, Modulus, MPa GP a
~
189 146 185 145 169 145
115 108 132 114
. -~
--- -- ~ _ - - -- 66
66 102 61 92
140 151 131 148 150 150
155 147 155 146 169 144
162 146 143 139 165
191 143 160 143 151 139
163 145 160 142 164 138
158 139 159 137 133 137
181 144 190 145 138 147
180 141 162 149 147 146
178
-
-
-- -
~~
-
--_
- ._
Specimen History
I s Fabricated
5000 Hours at 500 K
LO 000 Hours at 500 K
!500 Hours at i90 K
io00 Hours at i90 K
-_ '500 Hours at i90 K
.O 000 Hours at i90 K
.OO Hours at '30 K
100 Hours at '30 K
~ - _ _ _ - 100 Hours at '30 K
.~~ ._ ~ .__
100 Cycles 100 K to 590 K
- - . - - DO0 Cycles 9 0 K to 590 K
- Longitudinal
Test Ultimate Temp., Stress, - K j Iva
1130 -
1100
1217
295 1 :::: 1168
1121 1094 1131
1072 1114 1117
. --
Elastic Modulus, GPa
230 230 230
228 227 230
199 194 200
. - .
230 228 233
233 230 229
-_ -
236 235 236
236 235 239
23 1 23 1 229
233 234 226
230 232 232
23 1 23 1 230
230 233 230
- _ _ _
____
.. -
228 23 L 234
23 1 232 232
.
-
71
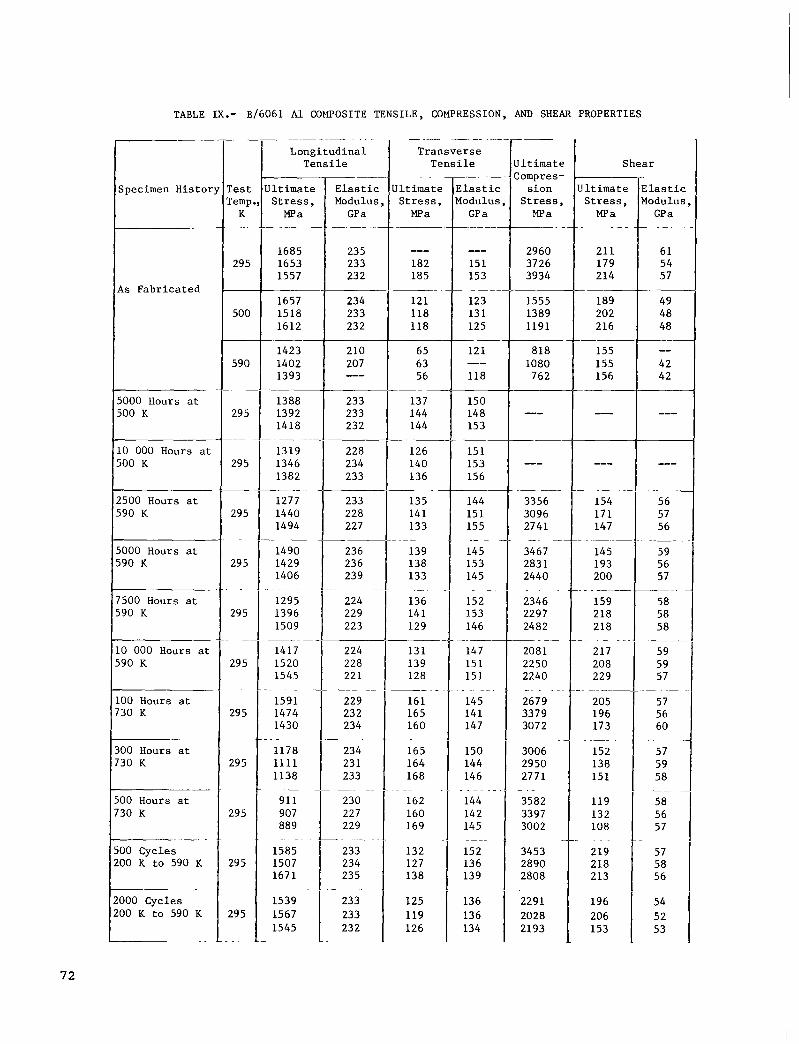
TABLE IX.- B/6061 A l COMPOSITE TENSILE, COMPRESSION, AND SHEAR PROPERTIES
r- test ITe:p
___ . .. - L o n g i t u d i n a l
T e n s i l e T r a n s v e r s e
T e n s i l e U It i m a t E C ompre s-
s i o n S t r e s s ,
MPa ~. .
2960 3726 3934
S h e a r ____ IElas t i c Modulus
GP a
____ I
Elast ic Modulus
GPa _ _ _ _ -
235 233 23 2
. -
U It i m a t e S t r e s s ,
MPa
U It i m a t e S t r e s s ,
MPa - -.
211 179 214
Clastic lodu lus
GP a . -
61 54 57
49 48 48
-- 42 42
---
--- - 56 57 56
59 56 57
58 58 58
59 59 57
57 56 60
57 59 58
58 56 57
57 58 56
54 52 53
__-
_ _ ~
___
_ _
U It i m a t e S t r e s s ,
MPa
1685 1653 1557
Specimen H i s t o r
~ --
-- 182 185
I-
15 1 153
123 13 1 125
121
118
-
____
--
295
4s F a b r i c a t e d 1657 1518 1612
1423 1402 1393
__-
189 202 216
155 155 156
.___
234 233 232
210 207 --- 233 233 232
228 234 233
233 228 227
1555 1389 1191
818 1080 762
121 118 118
65 63 56
137 144 144
126 140 136
135 141 133
-.
~ . -
500
-
590
5000 Hours at 500 K
1388 1392 1418
150 148 153
15 1 153 156
___
295 ---
---
154 171 147
1319 1346 1382
LO 000 Hours a t j00 K 295
!500 Hours a t i90 K
1277 1440 1494
144 15 1 155
145 153 145
152 153 146
.- -
.~
3356 3096 2741
3467 283 1 2440
2346 2297 2482
-. ~-
295
..
295
. .
295
- ~ -.
29 5
295
295
295
295
29 5
1490 1429 1406
1295 1396 1509
1417 1520 1545
1591 1474 1430
1178 1111 1138
911 907 889
1585 1507 1671
1539 1567 1545
-._ .
__--
. _ - . -
-. .
~
_ _
236 236 239
224 229 223
_. -
139 138 133
145 193 200
159 218 218
. . . -
io00 Hours at i90 K
'500 Hours a t i90 K
136 141 129
.O 000 Hours a t 190 K
224 228 22 1
229 232 234
234 23 1 233
230 227 229
233 234 235
233 233 23 2
_ - _ _ _ _
- -_
___. _ _
__-.
- _
131 139 128
161 165 160
165 164 168
162 160 169
132 127 138
125 119 126
___
. _ _
147 15 1 15 1
145 141 147
150 144 146
144 142 145
. . .
. . ~~ ~.
2081 2250 2240
2679 3379 3072
3006 2950 2771
3582 3397 3002
3453 2890 2808
2291 2028 2193
- . ..
_ .
217 208 229
205 196 173
.. _ ~ ~ _ _ 00 Hours a t 30 K
100 Hours a t 30 K
152 138 151
119 132 108
219 218 213
196 206 153
~.
00 Hours a t 30 K
.
00 Cyc les 00 K t o 590 K
152 136 139
136 136 134
000 Cyc les 00 K t o 590 K
72
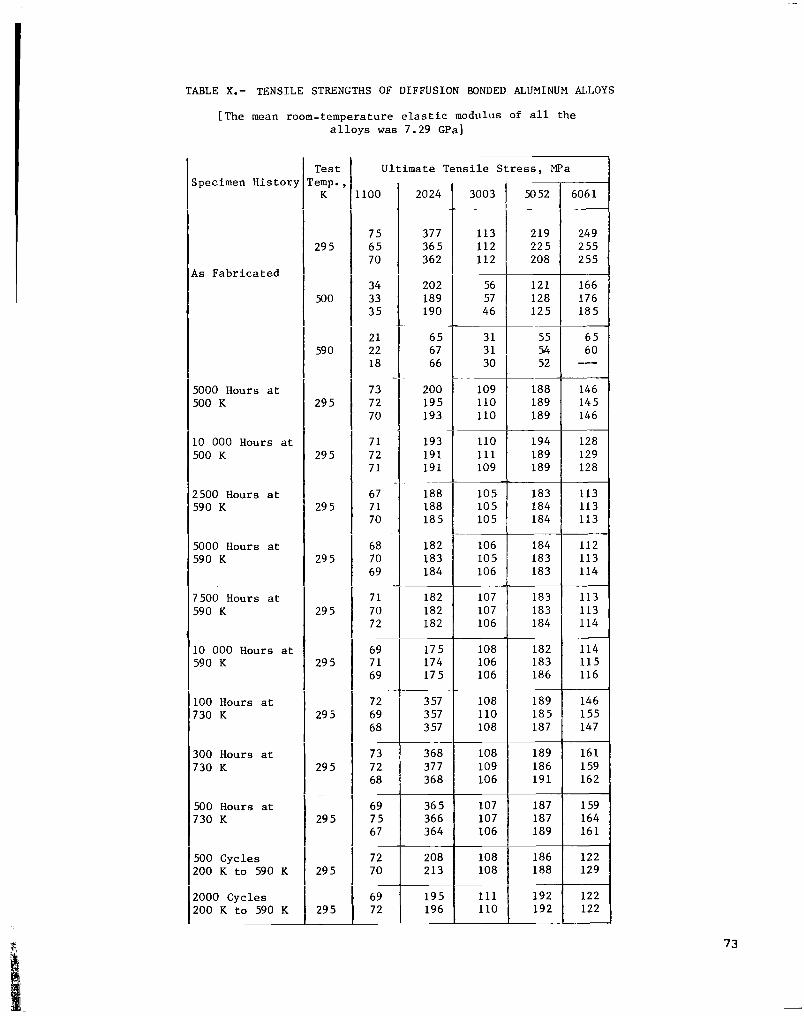
TABLE X.- TENSILE STRENGTHS OF DIFFUSION BONDED ALUMINUM ALLOYS
55 5.4 52
188 189 189
194 189 189
183 184 184
184 183 183
[The mean room-temperature elastic modulus of all the alloys was 7.29 GPa]
65 60 ---
146 145 146
128 129 128
113 113 113
112 113 114
Test 'emp. K
29 5
500
59 0
29 5
29 5
29 5
29 5
29 5
29 5
29 5
29 5
Ultimate Tensile Stress, MF'a Specimen History
3003 100
75 65 70
34 33 35
21 22 18
73 72 70
71 72 71
67 7 1 70
68 70 69
71 70 72
69 71 69
72 69 68
~
2024
377 36 5 362
202 189 190
65 67 66
200 195 193
193 191 191
188 188 185
182 183 184
~ ~~~
113 112 112
is Fabricated 56 57 46
31 31 30
109 110 110
~
5000 Hours at 500 K
110 111 109
LO 000 Hours at 500 K
105 105 105
1500 Hours at 590 K
106 10 5 106
5000 Hours at 590 K
182 182 182
107 107 106
183 113 183 I 113 184 114
7500 Hours at 590 K
17 5 174 17 5
108 106 106
108 110 108
~
10 000 Hours at 590 K
3 57 3 57 3 57
100 Hours at 730 K
73 72 68
69 75 67
~
108 109 106
300 Hours at 730 K
368 377 368
36 5 366 364
107 107 106
500 Hours at 730 K 29 5
29 5
29 5
187 189
72 70
208 213
108 108
500 Cycles 200 K to 590 K
69 72
195 196
111 110
2000 Cycles 200 K to 590 K
73
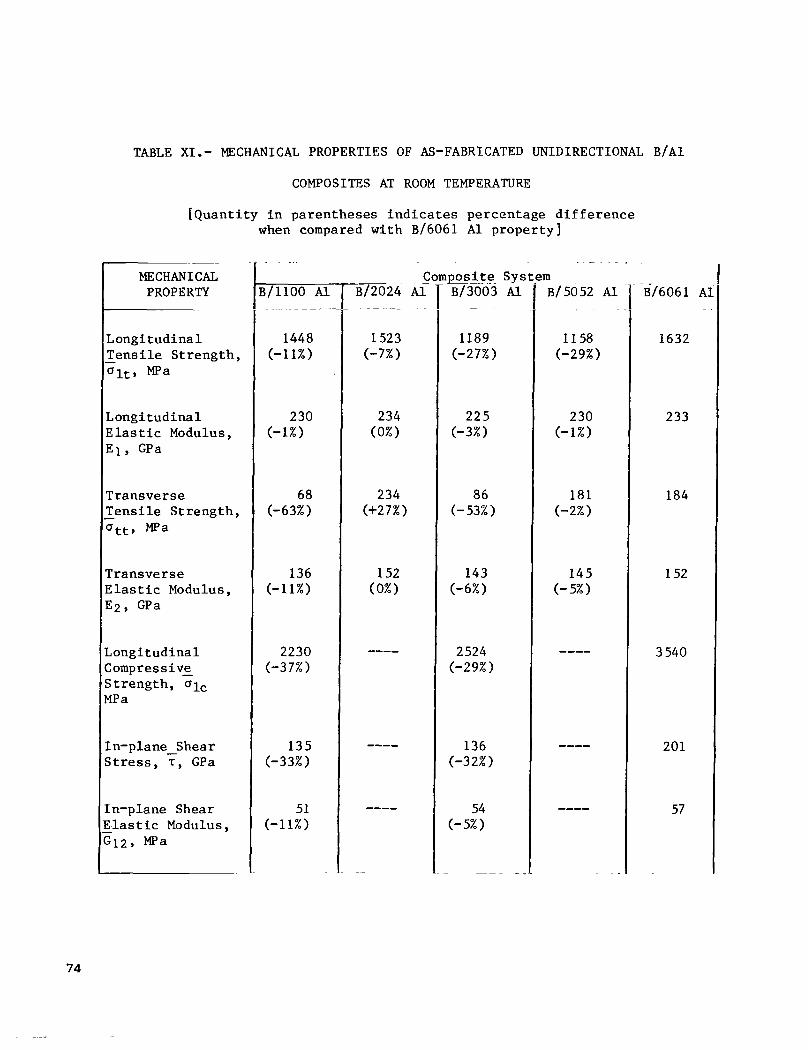
TABLE XI.- MECHANICAL PROPERTIES OF AS-FABRICATED UNIDIRECTIONAL B / A 1
COMPOSITES AT ROOM TEMPERATURE
[Quantity in parentheses indicates percentage difference when compared wlth B/6061 Al property]
MECHANICAL PROPERTY
Longitudinal - Tensile Strength, Glt, m a
Longitudinal Elastic Modulus, El, GPa
Transverse Tensile - Strength, Qtt, m a
rransverse Elastic Modulus, E2, GPa
Long i t udina 1 Zompressive Strength, ulc *a
Cn-plane-Shear Stress, T , GPa
Cn-plane Shear - 5.las t ic Modulus, :12, m a
1448 (-11%)
230 (-1%)
68 (-63%)
136 (-11%)
2230 (-3 7% )
135 (-33%)
51 (-1 1%)
lposite- sy: B/3003 . Al - -.
1189 (-27%)
225 (-3%)
8 6 (-53%)
143 (-6%)
2 524 (-29%)
136 (-32%)
54 (-5%)
!m B/5052 A 1
-
1158 (-29%)
230 (-1%)
181 (-2%)
1 4 5 (- 5%)
----
----
----
~.
B/606 1
1632
233
184
152
3 540
201
57
74
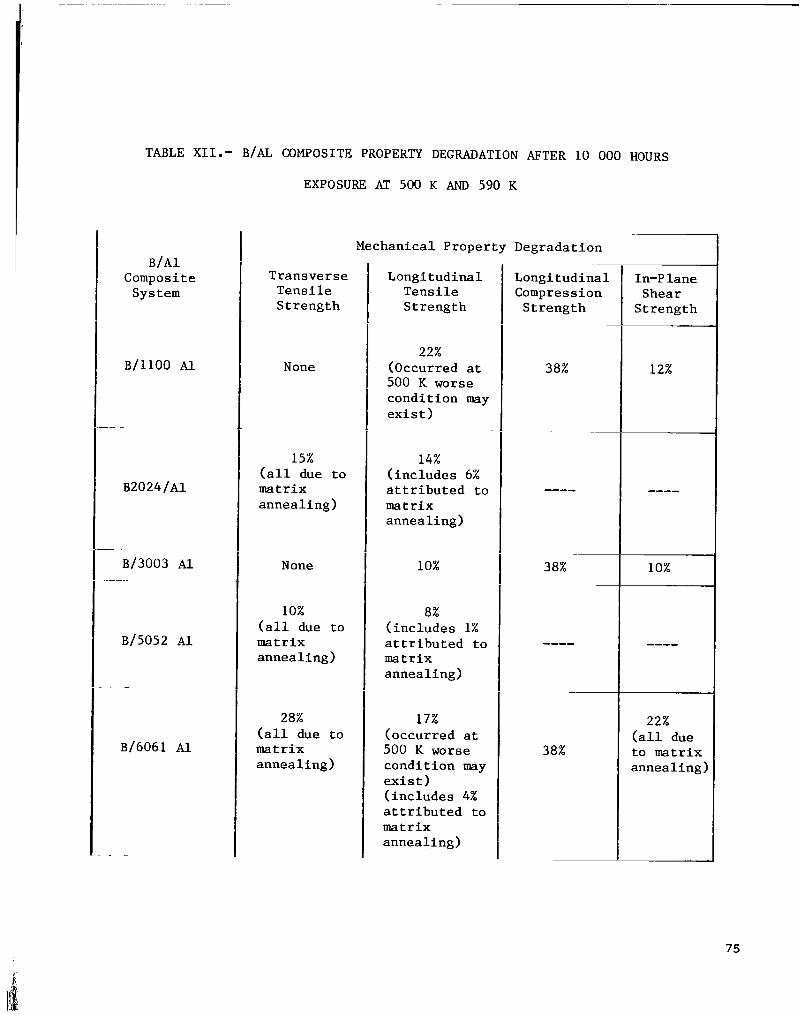
TABLE XI1.- B/AL COMPOSITE PROPERTY DEGRADATION AFTER 10 000 HOURS
EXPOSURE AT 500 K AND 590 K
B / A ~ Compos it e System
B/1100 Al
_ _
B2024/A1
B/3003 Al _ _
B/5052 Al
-
B/6061 Al
. -
Transverse Tensile Strength
None
15% (all due to matrix annealing)
None
10% (all due to matrix annealing)
28% (all due to matrix annealing)
Mechanical Property Degradation
Longitudinal Tensile Strength
22% (Occurred at 500 K worse condition may exist)
14% (includes 6% attributed to matrix annea ling )
10%
8% (includes 1% attributed to matrix annealing)
17% (occurred at 500 K worse condition may exist) (includes 4% attributed to matrix annealing)
Longi tudi Compres si Strength
38%
----
~~
38%
----
~~
38%
_____
In-P lane Shear Strength
12%
----
10%
22% (all due to matrix annealing)
75
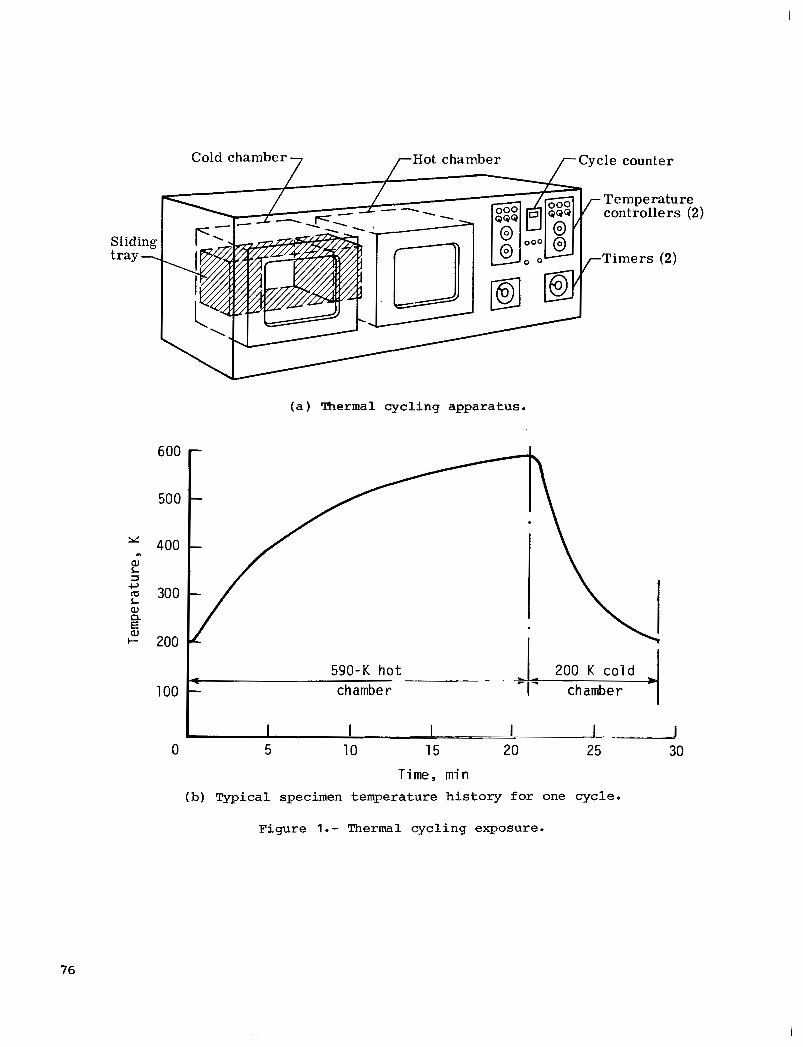
Cold chamber
( a ) Thermal cycling apparatus.
2
aJ L 7 c, tu L aJ E aJ I-
n
n
600
500
400
30 0
200
100
1 1 1 - -~ . - 1 0 5 10 15 20 25 30
Time, min (b) Typical specimen temperature h i s to ry f o r one cycle.
Figure 1.- Thermal cycling exposure.
76
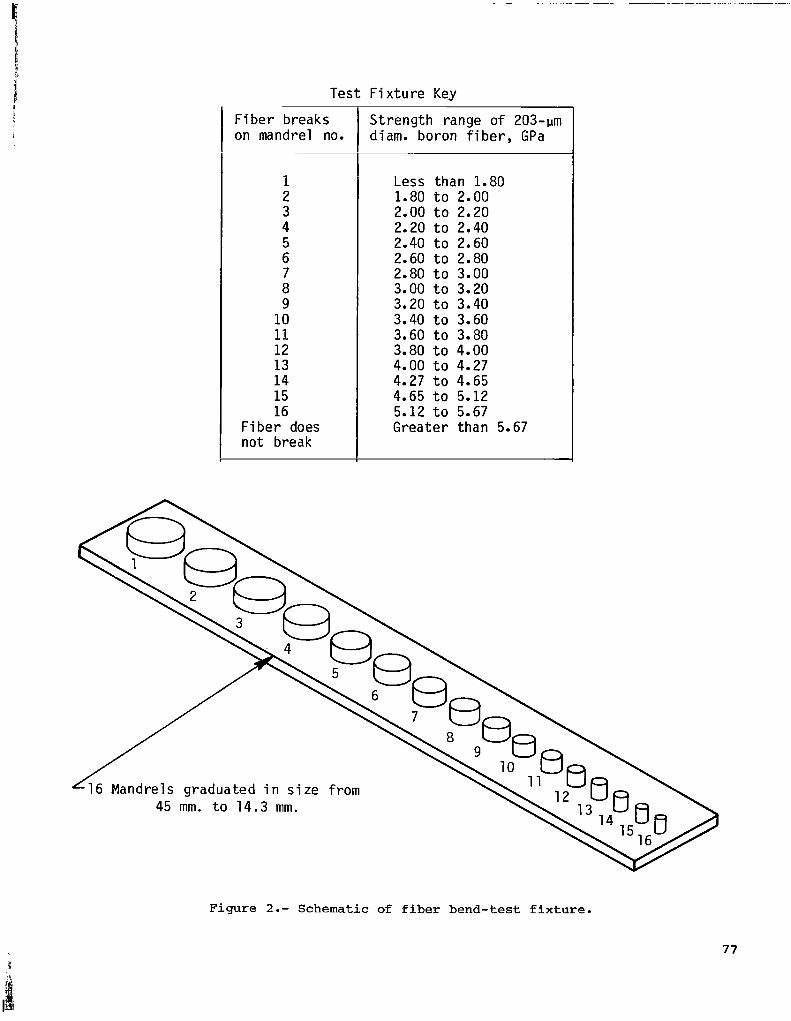
Test F i x t u r e Key
F i b e r breaks on mandrel no.
1 2 3 4 5 6 7 8 9
10 11 12 13 14 15 16
F i b e r does 1 not break
St rength range o f 203-pm diam. boron P i ber, GPa
Less than 1.80 1.80 t o 2.00 2.00 t o 2.20 2.20 t o 2.40 2.40 t o 2.60 2.60 t o 2.80 2.80 t o 3.00 3.00 t o 3.20 3.20 t o 3.40 3.40 t o 3.60 3.60 t o 3.80 3.80 t o 4.00
4.27 t o 4.65 4.65 t o 5.12 5.12 t o 5.67 Greater than 5.67
4.00 t o 4.27
Figure 2.- Schematic of fiber bend-test fixture.
77

Mean v i r g i n f iber - I s t r e n g t h 3.78 GPa L o w e r b o u n d - t+L U p p e r b o u n d
6 0
20
0 I 1 .. i. -1 - - -
60
4 o F 20
0 (b) B/2024 Ale
40
20
0 (c) B/3003 A l e
60
4 o F
d - 4 P
20
0 (d) B/5052 A l e
6ol 40
20
0 2 4 6 S t r e s s , GPa
(e) B/6061 Al.
Figure 3.- Fiber strength distributions for as-fabricated composites.
78
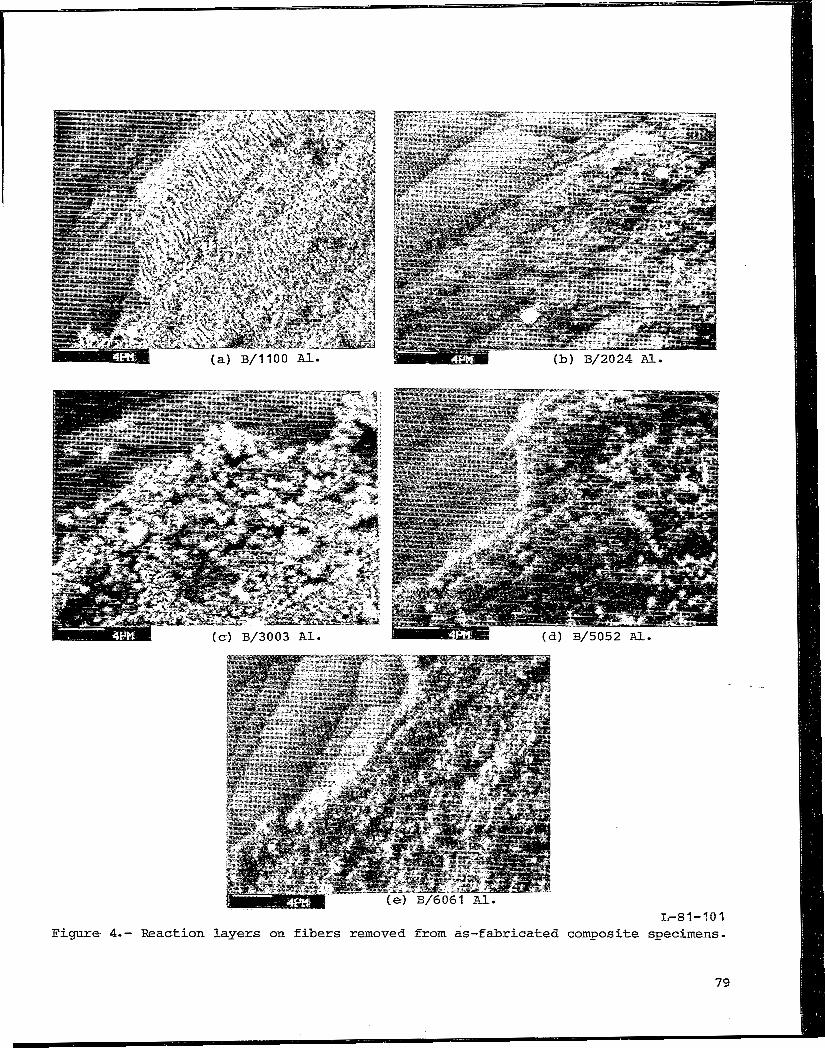
k81-102 Figure 4. - Reaction l aye r s on f i b e r s removed from as- fabr ica ted composite specimens.

1600
1400
1200
1000 ld
# 800
600
400
# 0)
+, m
200
0
S t r a i n , p e r c e n t
(a) Longitudinal tensile.
300 -
250 -
m a 200- E
v) 1 5 0 - I,
# Q c., +, 100- m
50
0
S t r a i n , p e r c e n t
(b) Transverse tensile.
Figure 5.- Typical room-temperature stress-strain curves for as-fabricated B/A1 composites.
80

( c ) Longitudinal compression.
d II z - Q Q a c +, 8
c d a 6
100
80
W 3 0 0 3 f l l
- B/6061 R l 20 10
I 1 - 1 4 1 1 - I I I I
Shear s t r a i n , percent
(d) In-plane shear.
Figure 5. - Concluded.
81
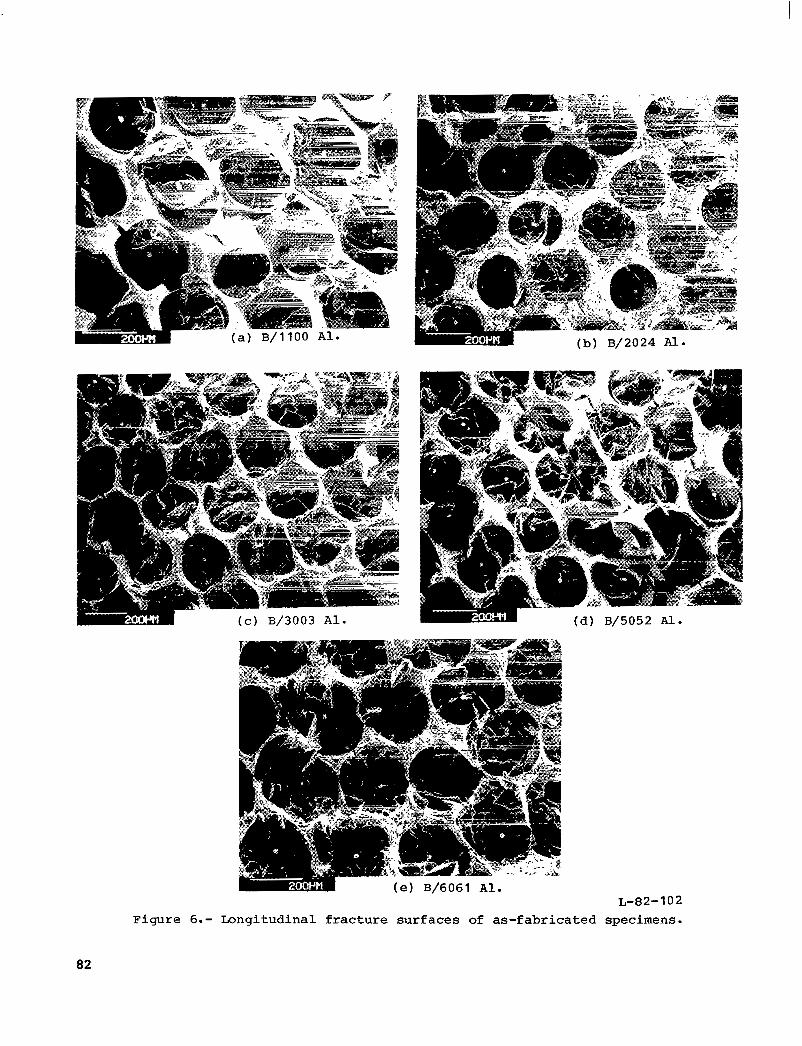
(a) B/5052 A l e
L-82- 10 2 Figure 6.- Longitudinal fracture surfaces of as-fabricated specimens.
a2
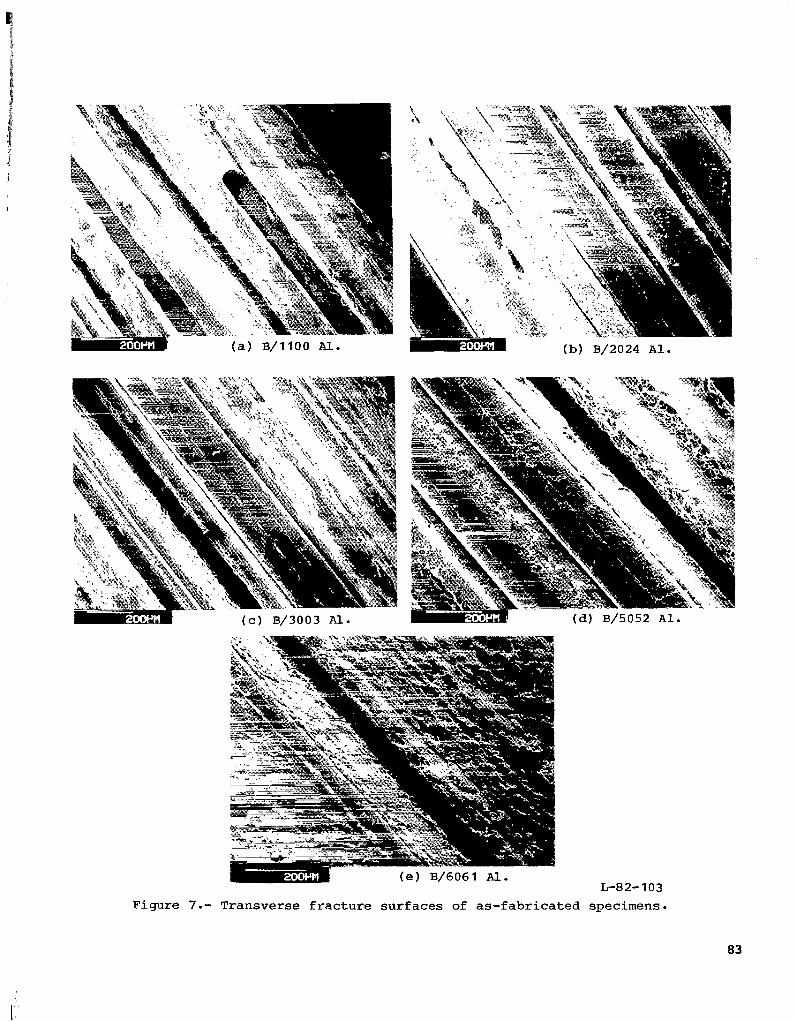
L-82- 103 Figure 7 . - Transverse f r a c t u r e sur faces of as - fabr ica ted specimens.
83
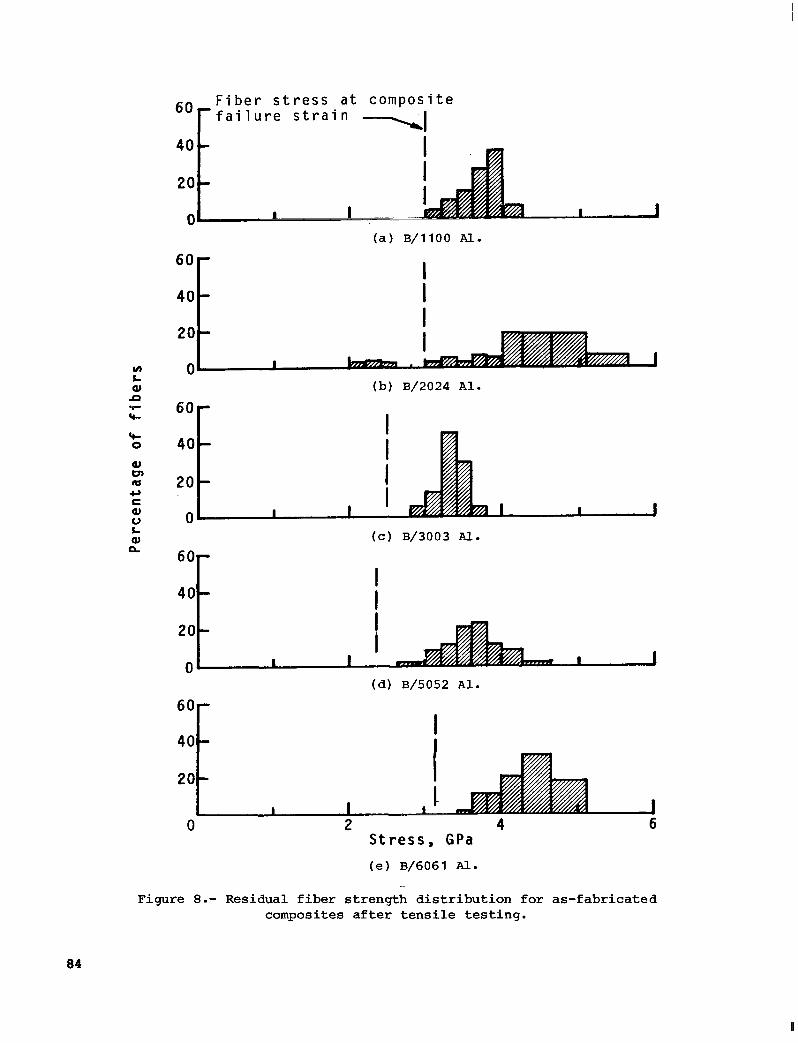
Fiber s t r e s s a t composite
6 0 r f a i l u r e s t r a i n -I 40
20
0
““c 40
20
0 (b) B/2024 Ale
60
40
20
0 ( c ) B/3003 A l e
6ol 40
20
0 (d) B/5052 Al.
6 0 r
0 2 4 Stress , G P a (e) B/6061 Al.
6
Figure 8.- Residual fiber strength distribution for as-fabricated composites after tensile testing.
84
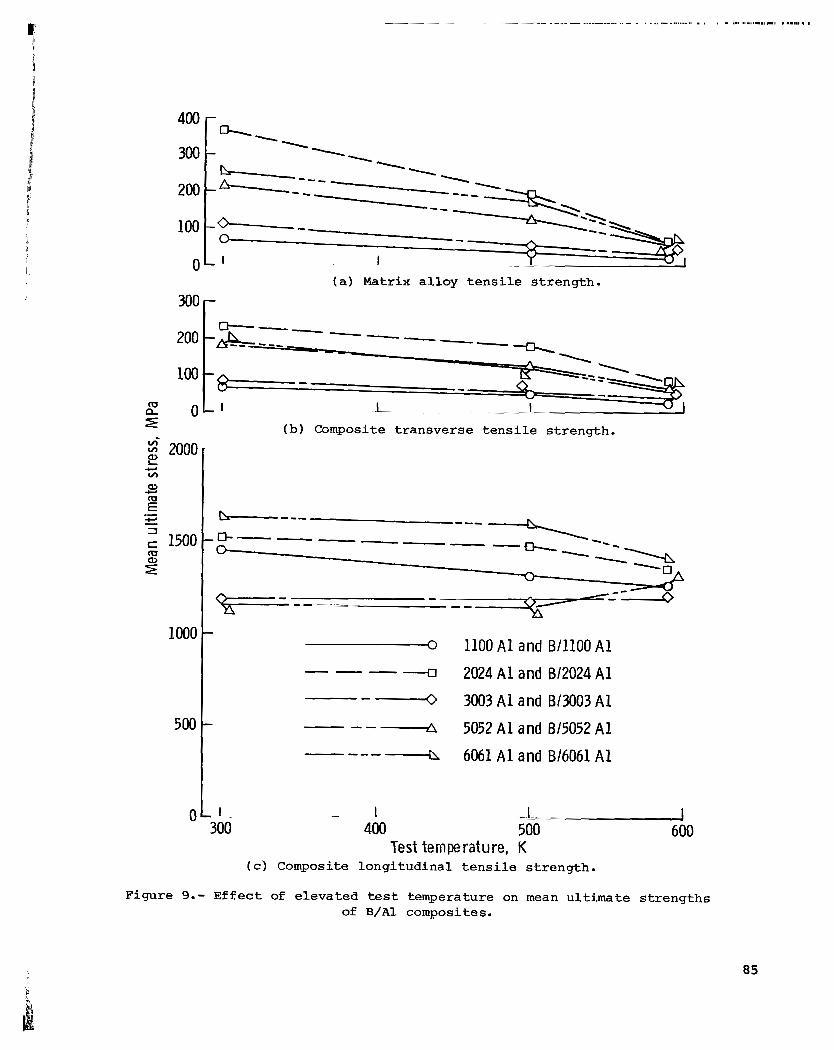
(a) Matrix alloy tensi le strength.
(b) Composite transverse tensile strength.
n
. I - I 300 400
1100 A1 and Bll lOO A 1
2024 A 1 and 612024 A 1
3003 A 1 and BIU103 A 1
5052 A 1 and B/5052 A1 6061 A 1 and B16061 A 1
500 600 Test temperature, K
( c) Composite longitudinal tensi le strength.
Figure 9.- Effect of elevated t e s t temperature on mean ultimate strengths of B/AL composites.
85

3600
3200
2800
2400
2000
1600
1200
800
400
0
300 r
\
-~ 3 BlllOOAl
-4 B13003 A1
I I I ~~ L -. - ~
( d ) Composite longi tudina l compression strength.
I 400 500
L A 3b0
Test temperature, K (e) Composite in-plane shear s t rength .
._I 600
Figure 9.- Concluded.
86
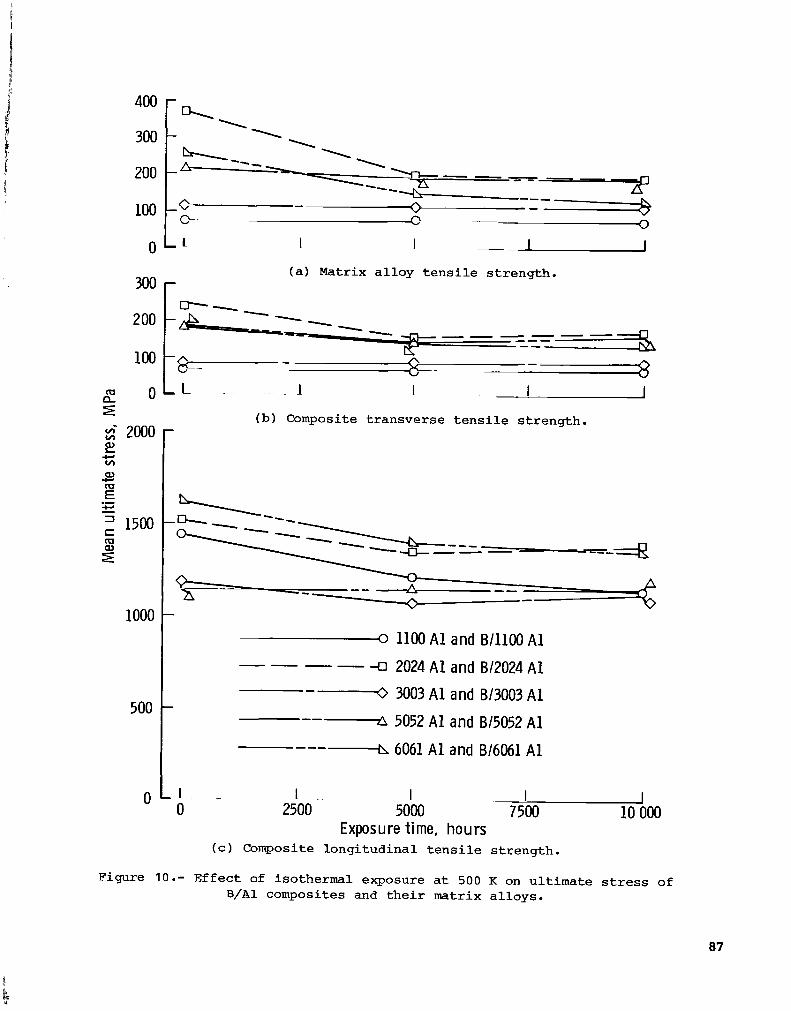
300
200
100
400
300
200
100 " c--- 0 0
1 I - 1 I
300 r 2 00
100
( a ) Matrix a l loy t e n s i l e s t rength .
-
1000
500
0
(b) Composite t ransverse t e n s i l e s t rength .
v 1100 A1 and B l l l 0 0 A1
---- -u 2024 A1 and BIZ024 A1 -V 3003 A1 and B13003 A1
--LS 5052 A1 and B15052 A1
--- - 6061 A1 and B16061 A1
I - I I I 0 2500 5000 7500 10
Exposure time, hours ( c ) Composite longi tudina l t e n s i l e s t rength .
Figure 10.- Ef fec t of isothermal exposure a t 500 K on u l t imate stress of B/A1 composites and t h e i r matrix a l loys .
87
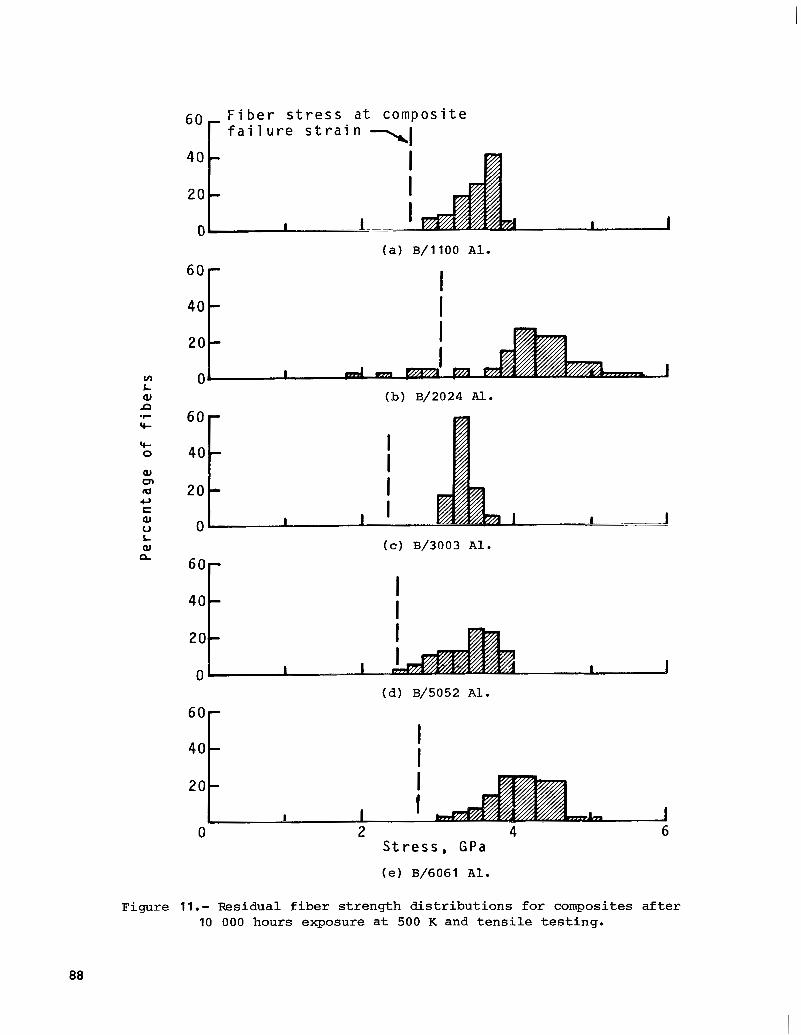
60 Fiber s t r e s s a t composite r f a i l u r e s t r a i n -1 40
20
0
60
40
20
v) 0
n .I- 60
L aJ (b) B/2024 A l e
+ rc 0 40 aJ cn CFI c, c aJ 0
20
0 (c) B/3003 Ale
40
20
0 ( d ) B/5052 Al.
20
0 S t r e s s , G P a
(e ) B/6061 A l .
F i g u r e 1 1 . - Residual f iber strength distributions for composites after 10 000 hours exposure a t 500 K and t e n s i l e t e s t i n g .
88
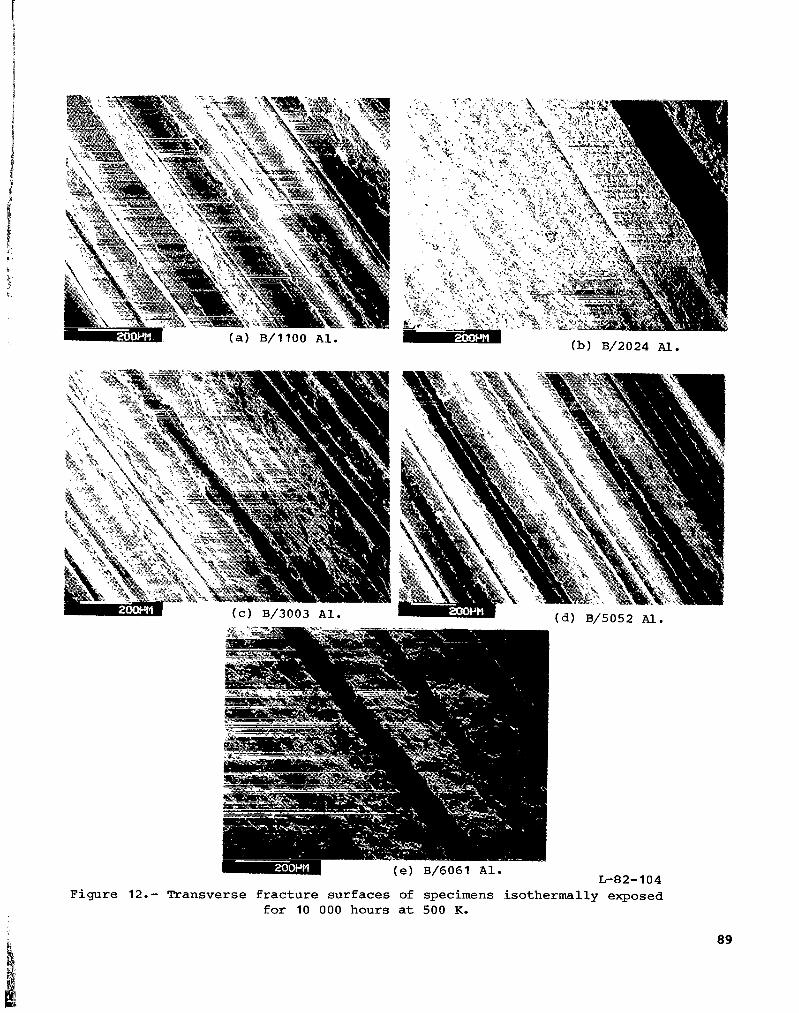
L-82-104 F i g u r e 12.- Transverse fracture surfaces of specimens isothermally exposed
for 10 000 hours at 500 K.
89

400
300
200
100
0
300
200
100
0
2000
1500
1000
500
0
r
(b) Composite transverse t e n s i l e strength.
_A 1100 A1 or BlllOO A1
2024 A1 o r BE024 A1
-Y 3003 A1 or B13003 A1
--- 5052 A1 o r B/5052 A1
6061 A1 o r B16061 A1
--
---- I I I I _I 0 2500 5000 7500 10 000
Exposure time, hours ( c ) Composite longitudinal t e n s i l e strength.
Figure 13.- E f f e c t of isothermal exposure a t 590 K on ultimate stress of B/A1 composites and the ir matrix a l loys .
90

3600
3200
2800
2400
2000 m
2 5 1600 e + v)
Q1 * .- 2 1200 = 3 c m 9 800
400
- h
-
-
-
-
-
0 -
- B l l l O O A1
-___O B/3003 A1 - ---- d B/6061 A1
0-- - 1 L I

L-82- 105 Figure 14.- Transverse fracture surfaces of specimens isothermally exposed
for 10 000 hours at 590 K.
92

i
failure strain
( a ) B/1100 A l .
40
20
v) 0 L (b) B/2024 A l .
60
20
0 aJ n
6or 40t 20
0 (d ) B/5052 A l .
0 2 4 6 S t r e s s , GPa (e ) B/6061 A l .
Figure 15.- Residual f i b e r s t rength d i s t r i b u t i o n s f o r composites a f t e r 10 000 hours exposure a t 590 K and t e n s i l e t e s t i n g .
93
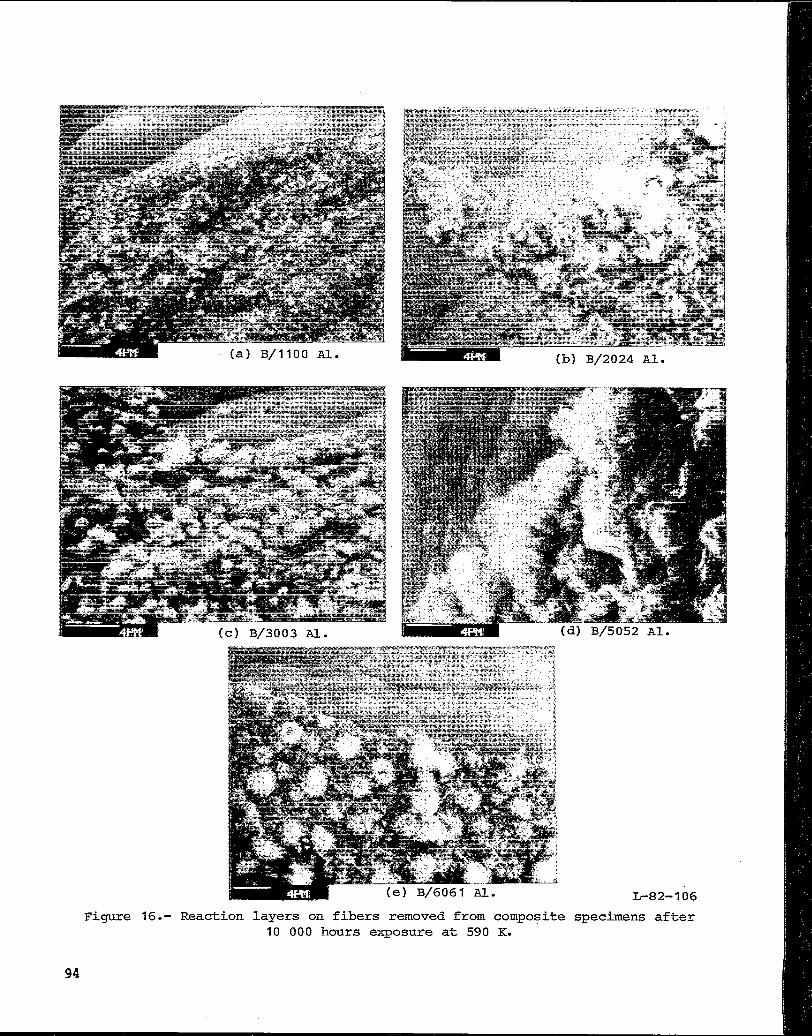
L-82-106 Figure 16.- Reaction layers on f ibe r s removed from composite specimens after
10 000 hours exposure a t 590 K.
94
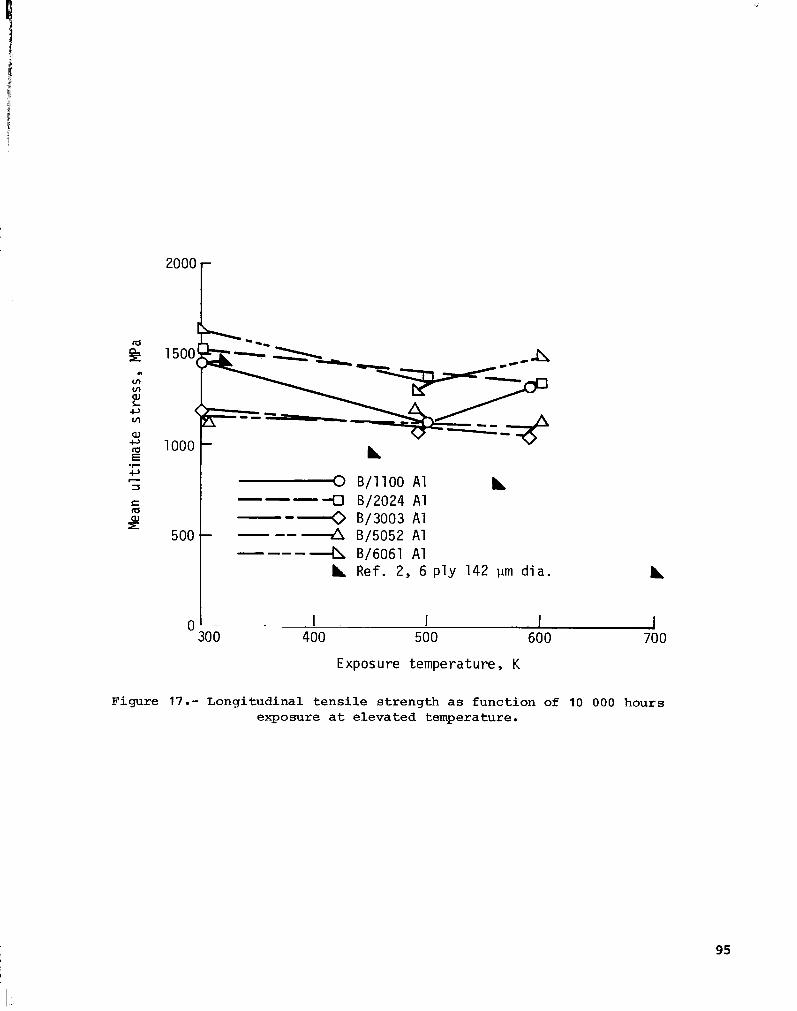
2000
L 1000 -
5 00
B/1100 A1 Ir -I7 B/2024 A1 ,-o B/3003 A1 4 B/5052 A1 4 B/6061 A1
--- -- - --- - -- -
L Ref. 2, 6 p l y 142 pm d i a . L
0 ' 1 ~ _ _ I I i 30 0 400 500 600 70 0
Exposure temperature, K
Figure 17.- Longitudinal tensile strength as function of 10 000 hours exposure a t elevated temperature.
95

200 m
2 100
a,
2000 .- Y
1500
1000
500
0
------- U &-- -El------
A A** d --- -- , \ --=--A 3 - , I I I
(b ) Composite t ransverse t e n s i l e s t rength .
A 1100 A1 or BlllOO A1
-o 2024 A1 or B/2024 A1
-- 3003 A1 or B/3003 A1
-----A 5052 A l or B/5052 A1
---- 6061 A1 or B/6061 A1
----
I ., -1 0 100 200 300 400 500
Exposure time, hours ( c ) Composite longi tudina l t e n s i l e s t rength .
Figure 18.- Effec t of isothermal exposure a t 730 K on u l t imate stress of B/A1 composites and t h e i r matrix a l loys .
96
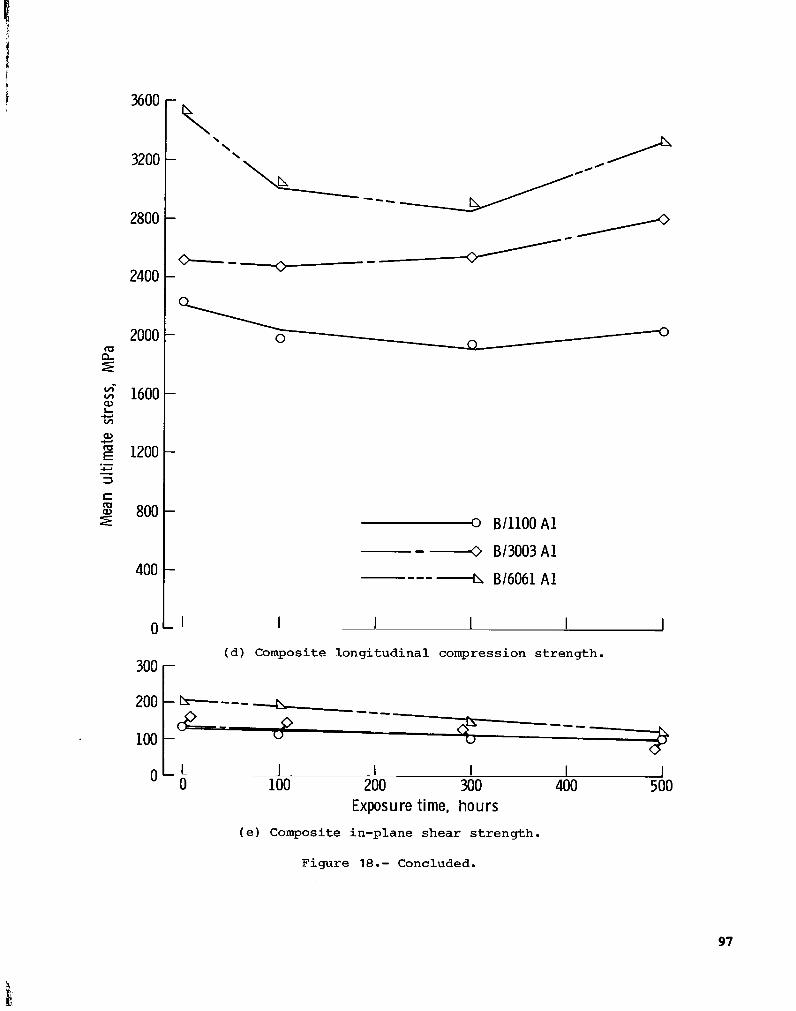
xnn
B l l l O O A l
-4 B/3003Al
* B/6061 A1 ----
OL ' 1 1 1 I I ( d ) Composite longi tudina l compression s t rength .
300 r
I I I I I 100 200 300 400 500
Exposure time, hours (e ) Composite in-plane shear s t r eng th .
Figure 18. - Concluded.
97

L-82- 107
Figure 19.- Transverse fracture surfaces of specimens isothermally exposed for 500 hours at 730 K.
98

Fiber s t r e s s a t composite f a i l u r e s t r a i n
(a) B/1100 Al.
(b) B/2024 Ale
6or I 40
20
0 (c) B/3003 Al.
601-
40
20
0 (d) B/5052 Al.
6oL 40
20
0 2 4 S t r e s s , GPa
(e) B/6061 Al.
6
Figure 20.- Residual fiber strength distributions for composites after 500 hours exposure at 730 K and tensile testing.
99

L-82- 108 -~ _.___ . (e) B/6061 Al.
Figure 27.- Reaction layers on f ibers removed from composite specimens after 500 hours exposure at 730 K.
--- --
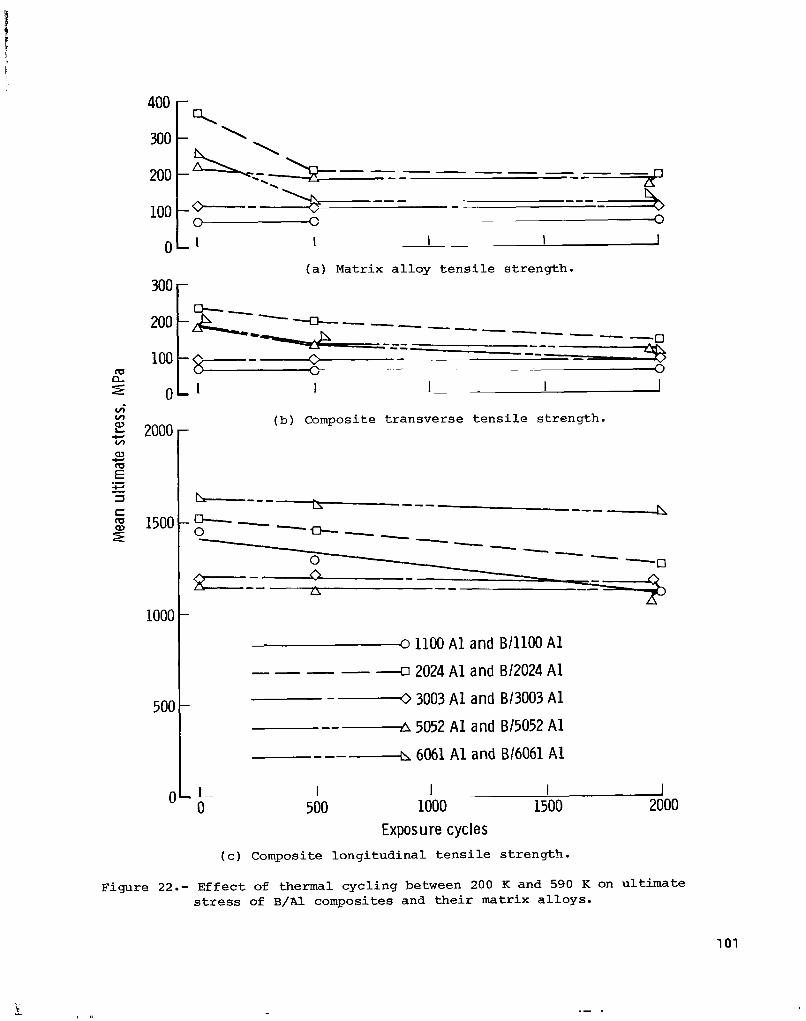
100
I I I 1
( a ) Matrix a l l o y t e n s i l e s t r eng th .
3oo r 200
100
1 1 I
2000
1500
1000
500
c
( b ) Composite t r a n s v e r s e t e n s i l e s t r eng th .
- 0 1100 A1 and BlllOO A1
---- 4 2024 A1 and BE024 A 1
- 0 3003 A1 and B/3003 A1
--A 5052 A1 and B/5052 A1
- -- + 6061 A1 and 8/6061 A1
I 500
1 1000
I I 1500 2000
Exposure cycles ( c) C o m p o s i t e l ong i tud ina l t e n s i l e s t r eng th .
Figure 22.- E f f e c t of thermal cyc l ing between 200 K and 590 K on u l t i m a t e stress of %/A1 composites and t h e i r mat r ix a l l o y s .
101
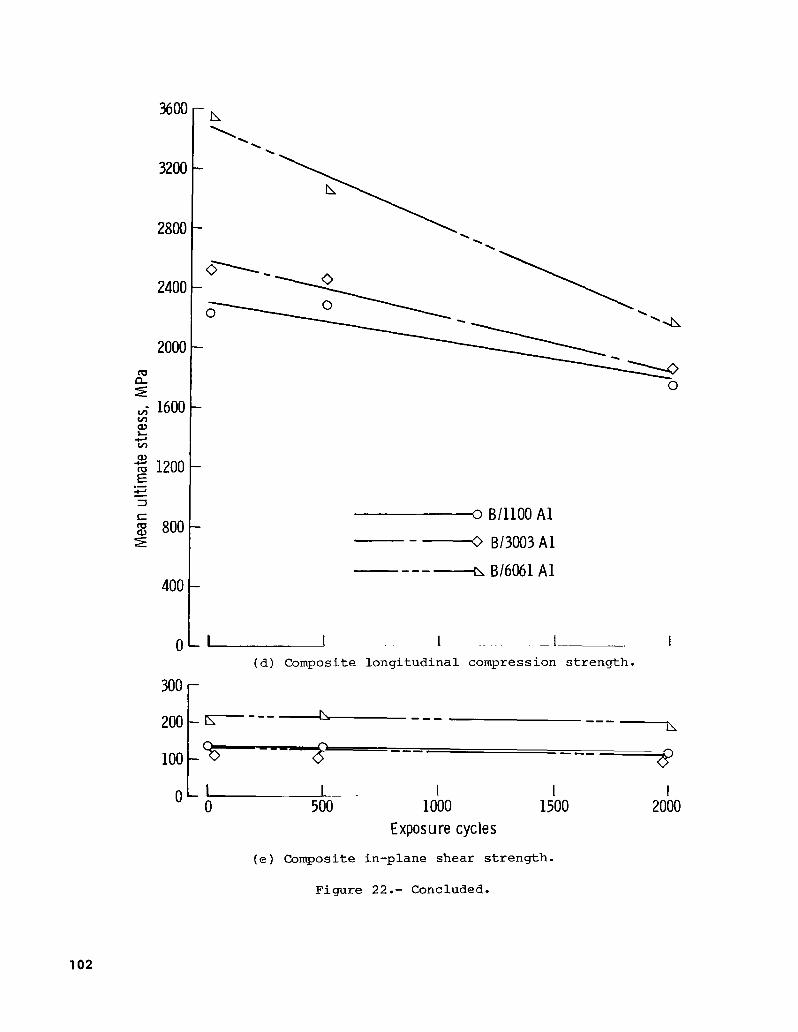
3600
3200
2800
2400
2000 m
2 6 1600 E v)
w In
2 1200 E .- = 3 c m 800 8
400
0
h '-.
~~ --3 BlllOOAl
- Bl3003 A 1
---- ___h B16061 A 1
I I I L I ( d ) Composite l ong i tud ina l compression s t r eng th .
L I L O O 500
1 1 I 1000 1500 2000
Exposure cycles
( e ) Composite in-plane shear s t r e n g t h .
Figure 22.- Concluded.
102
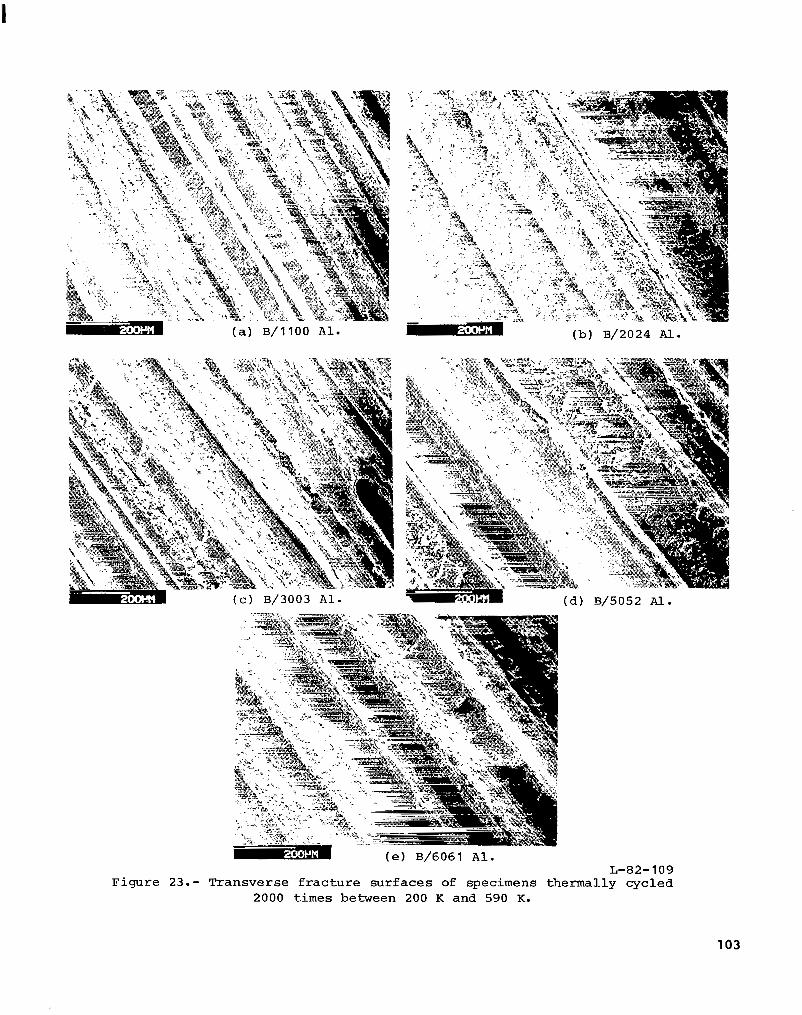
L-82-109 Figure 23.- Transverse f r a c t u r e sur faces of specimens thermally cvcled - -
2000 t i m e s between 200 K and 590 K.
103
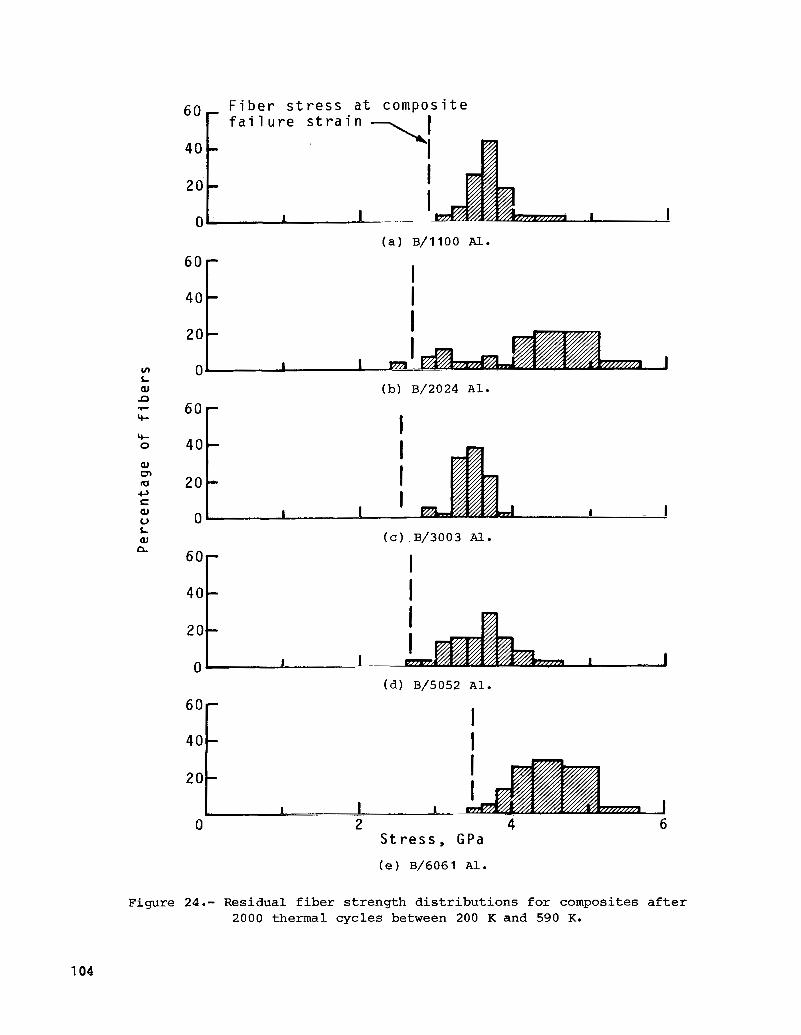
40
20
0
“L 40
- f a i l u r e s t r a i n -
I I
- 1 -L-
20
0 (b) B/2024 A l e
60
40
20
0 (c).B/3003 Al.
6oL 40
(d) B/5052 Al.
0 2 4 6 S t r e s s , G P a (e) B/6061 Al.
Figure 24.- Residual fiber streng-th distributions for composites after 2000 thermal cycles between 200 K and 590 K.
104

I
1. Report No.
NASA TP-1977 2. Government Accession No.
._ __ - _-
LONG-TERM THERMAL DEGRADATION AND ALLOYING CONSTITUENT EFFECTS ON FIVE BORON/ALUMINUM COMPOSITES
-
7 . Author(s1
George C. Olsen
~
3. Recipient's Catalog No.
L- 14779
I 8. Performing Organization Report No.
506-5.3-23-0 1 . - - _ _ ~ _ _
12. Sponsoring Agency Name and Address
National Aeronautics and Space Administration Washington, DC 20546
NASA Langley Research Center Hampton, VA 23665
....~ - -___ 2
1 I 13. Type of Report and Period Covered
Technical Paper
14. Sponsoring Agency Code ~
. - ~ _ _ ~
I t . Contract or Grant No. I-
21. No. of Pages
105 I 9. Security Classif. (of this report) 20. Security Classif. (of this page)
Unclassif ied 1 -
Unclassified
1
22. Rice
I__
A06
16. Abstract
Thermal exposure e f f e c t s on the proper t ies of f i v e boron/aluminum composite systems w e r e experimentally invest igated. The composite systems w e r e 49 volume percent boron f i b e r s (203 p di'ameter) i n aluminum-alloy matrices 1100 A l , 2024 Al, 3003 Al, 5052 A l , and 6061 Al. Specimens w e r e thermally exposed up t o 10 000 hours a t 500 K and 590 K, up t o 500 hours a t 730 K, and up t o 2000 thermal cycles between 200 K and 590 K. Composite longi tudinal and t ransverse t e n s i l e s t rengths , longi tudinal com- pression s t rength, and in-plane shear s t rength w e r e determined. None of t he systems w a s severely degraded by exposure a t 590 K. The bes t performing system was B/2024 Al. Effects of matrix a l loys on degradation mechanisms w e r e experimentally invest igated. Composite specimens and individual f i b e r s w e r e metal lurgical ly analyzed with a scanning e lec t ron microscope and an e lec t ron microprobe t o determine f a i l u r e cha rac t e r i s t i c s , chemical element d i s t r ibu t ion , and react ion layer morphol- ogy. Alloying cons t i tuents w e r e found t o a f f e c t t he composite degradation mechanisms as follows: a l loys containing i ron , but without manganese a s a s t a b i l i z e r , caused increased low-temperature degradation; a l loys containing magnesium, i ron , or manga- nese caused increased degradation; and a l loys containing copper caused increased f i b e r s t rength.
-_ __ ~~
7. Key Words (Suggested by Author(s1)
Metal matrix composite Boron/a luminum Thermal degradation Thermal fa t igue
~ ._.
18. Distribution Statement
Unclassif ied - Unlimited
Subject Category 24 .. - ____ < - ..
For sale by the National Technical Information Service, Springfield, Virginia 22161 w - ~ ~ ~ ~ 1 ~ ~ , 1982
Space Administration
Washington, D.C. 20546 Official Business
Penalty for Private Use, $300
c
' POSTMASTER:^ ' If Undeliverable (Sectioil 153 Postal Manual) Do No! Retmn
P
I . . . I
' - !


