Page 1
Longer Hours and Larger Waistlines? The Relationship between Work Hours and Obesity*
By: Charles Courtemanche
Courtemanche, C. (2009). ―Longer Hours and Larger Waistlines: The Relationship Between Work Hours and
Obesity.‖ Forum for Health Economics and Policy, 12(2), Article 2.
Made available courtesy of Berkley Electronic Press http://www.bepress.com/
The original publication is available at http://dx.doi.org/10.2202/1558-9544.1123
***Note: This version of the document is not the copy of record.
Abstract:
Additional work hours may lead to weight gain by decreasing exercise, causing substitution from meals
prepared at home to fast food and pre-prepared processed food, or reducing sleep. Substitution toward
unhealthy convenience foods could also influence the weight of one’s spouse and children, while longer work
hours for adults may further impact child weight by reducing parental supervision. I examine the effects of adult
work hours on the body mass index (BMI) and obesity status of adults as well as the overweight status of
children. Longer hours increase one’s own BMI and probability of being obese, but have a smaller and
statistically insignificant effect on these outcomes for one’s spouse. Mothers’, but not mother’s spouse’s, work
hours affect children’s probability of being overweight. My estimates imply that changes in labor force
participation account for only 1.4% of the rise in adult obesity in recent decades, but a more substantial 10.4%
of the growth in childhood overweight.
KEYWORDS: work hours, obesity, body weight, employment, labor force
Article:
1 Introduction
A person is considered clinically obese if he or she has a body mass index (BMI = weight in kg divided by
height in meters squared) of 30 or greater. Despite the fact that technological advancements in medicine
generally improved the health of the population in the past half-century, the percentage of adults in America
who are classified as obese rose dramatically during this time, from 12.8% in 1960-62 to 32.2% in 2003-04
(Flegal et al, 1998; Ogden et al 2006). The outlook is no more encouraging for children and young adults. In
1963-70, 4% of children ages 6-11 and 5% of adolescents ages 12-19 were overweight.1 By 1999-2002, these
percentages had risen to 16% for each (Hedley et al, 2004). Excessive weight has become a critical public
health concern. Obesity is now the second-leading cause of preventable deaths in the country behind smoking,
accounting for approximately 112,000 deaths per year, and studies have linked it to high blood pressure,
diabetes, heart disease, stroke, and a number of other adverse health conditions (Flegal et al, 2005).
Consequences of obesity also include an estimated $117 billion in medical and related costs per year (U.S.
Department of Health and Human Services, 2001).
Another obvious trend in the U.S. in the second half of the 20th Century was the widespread movement of
women into the labor force. In 1950, the labor force participation rate for women ages sixteen and older was
34%; by 2004, this percentage had risen to 59%. While men reduced their market work somewhat in response,
the labor force participation rate for the entire adult population still rose from 59% to 66% during this time
(Bureau of Labor Statistics, 2007).
The fact that America's weight gain has coincided with the increase in labor force participation (see Figure 1)
suggests that a causal relationship between these trends may be possible. Weight gain is caused by an imbalance
between calories consumed and calories expended. If an individual works more hours, her leisure time drops,
which could increase her weight through three mechanisms. First, she might exercise less, decreasing calories
Page 2
expended and leading to weight gain. Second, she might devote less time to food preparation, causing a
substitution from home-prepared meals to unhealthy convenience food, such as fast food and pre-prepared
processed food. This substitution could increase caloric intake, as a variety of research links a higher frequency
of eating fast food to greater consumption of calories, fat, and saturated fat (i.e. Satia et al, 2004), and also to
obesity (i.e. Jefferey et al, 2006). Chou et al (2004) found that both an increase in restaurant prevalence and a
decrease in restaurant price were associated with higher body weights, further suggesting that eating out leads to
weight gain. A third potential mechanism is sleep. Additional work may reduce time available for sleep, and
research suggests that sleep deprivation is associated with weight gain (i.e. Gangwisch et al, 2005; Taheri et al,
2004). While it not clear if this relationship is causal, short sleep duration appears to lead to changes in hormone
levels — reduced leptin and elevated ghrelin — that are likely to increase appetite and therefore caloric intake
(Taheri et al, 2004).
Working longer hours could also impact the weights of an individual's spouse and children. Since families tend
to eat together, if one family member substitutes toward unhealthy convenience food the others might as well.
Also, if a person works more her spouse and children may have to perform a larger share of the household
duties and therefore have less time for exercise and sleep. Child weight could further being affected through a
drop in parental supervision. Older children may be left unsupervised while a parent works, and they may make
more unhealthy eating and exercise decisions than if their choices were monitored. Parents are less likely to
leave younger children alone, but baby-sitters and day-care workers may not value the long-term health of a
child as much as the child's parent.
Page 3
In this paper, I examine the relationship between adult work hours and the BMI and obesity status of adults as
well as the overweight status of children. Applying long differencing methods to panel data from the National
Longitudinal Survey of Youth (NLSY) and NLSY Child Supplement (NLSYCS), I find that an increase in a
man or woman's work hours increases the person's own BMI and probability of being obese. The effect on one's
spouse is positive as well in most specifications but smaller and statistically insignificant. I also find that
mothers', but not fathers', work hours affect the probability of being overweight of children. My estimates imply
that if all U.S. adults permanently increase their work weeks by 10 hours, adult obesity and childhood
overweight would increase by 4.1 % and 11.1 %, respectively. The results also suggest that changing
employment patterns account for only 1.4% of the rise in adult obesity between 1961 and 2004 but a more
substantial 10.4% of the increase in overweight children between 1968 to 2001.
2 Literature Review
When studying reasons for America's rising obesity rate, economists have placed much of the blame on
technological progress. Philipson and Posner (1999) suggested that technology increased the efficiency of food
production, leading to lower prices and therefore more food consumption, while also causing jobs to be much
less physically strenuous, meaning that people burn fewer calories at work. Both of these changes widen the gap
between calories consumed and calories burned, leading to a society-wide rise in weight. Lakdawalla and
Philipson (2002) found empirical evidence supporting this theory.
Cutler et al (2003) argued that technological advances have lowered the time costs of food preparation and
cleaning, leading to increased food consumption. These innovations, which include vacuum packing, improved
preservatives, deep freezing, artificial flavors, and microwaves, allow food to be mass-prepared far from the
time and place of consumption. Though decreases in opportunity costs are typically beneficial, the authors show
that if people have self-control problems, as modeled by a hyperbolic discount rate while eating, then for some
people these advances actually reduce utility.
Another possible way in which technological progress affected obesity is by improving labor market
opportunities, thereby increasing work hours, particularly for women. Three recent papers examined the effect
of maternal employment on childhood obesity. Using data from the NLSY matched with the NLSYCS,
Anderson, Butcher, and Levine (2003) (ABL) found that a mother working 10 additional hours per week over
the course of a child's life (ages 3 to 11) is associated with a 1 percentage point increase in the probability that
the child is overweight. ABL argued that estimates of the work hour effect could suffer from unobserved
heterogeneity. Mothers who work may simply be those who are less concerned with their children's health,
creating a spurious negative relationship. On the other hand, ambitious mothers may both work and value
health, biasing the effect upward. ABL therefore implemented long differences and instrumental variables
approaches, but these estimates were similar to those using a simple linear probability model, suggesting that
the extent of the unobserved heterogeneity is minimal.
Ruhm (2004) estimated the relationship between a mother's work hours and several outcomes for children ages
10 and 11, including body weight. He usesd the same NLSYCS data as ABL. Ruhm found that 20 additional
mother's work hours per week over the course of the child's life were associated with approximately a 2
percentage point increase in the child's probability of being overweight and a 3 percentage point increase in its
probability of being at risk of becoming overweight (BMI above the 85th percentile). He also showed that the
effect is stronger for children in higher socioeconomic status families.
Fertig et al (2006) attempted to determine the mechanisms through which maternal employment affects
childhood obesity. Using data from the Child Development Supplement of the Panel Study of Income
Dynamics, they found that mother's work hours affect children's weight primarily by influencing supervision
and nutrition.
The relationship between work hours and adult weight is not as well explored. Chou et al (2004) used data from
the Behavioral Risk Factor Surveillance System (BRFSS) to estimate the relationship between a variety of state-
Page 4
level characteristics and weight. In the working paper version of this paper (2002), they also found a correlation
between state-level measures of hours worked and wages and the weight of individuals living in the state.2 They
interpreted this as evidence that improved labor market opportunities, reflected by the movement of women into
the labor force, have contributed to the growth in obesity. They hypothesized that improved earning potential
led to more work hours and therefore less time for food preparation, stimulating demand for convenience food.
In an effort to explain his finding that smoking and obesity fall in recessions, Ruhm (2005) conducted a similar
estimation of the relationship between state-level work hours and individual weight and obtained similar results.
Ko et al (2007) found a positive association between work hours and BMI in adults in Hong Kong with cross-
sectional data. However, the study did not make an attempt to distinguish between correlation and causality, and
the authors wrote that "further studies are needed to investigate the underlying mechanisms of this
relationship... " (p. 254).
Lakdawalla and Philipson (2007) used NLSY panel data to study a related but different question: how do the
physical demands of one's job affect body weight? They showed that working at sedentary or strength
demanding (and therefore muscle building) occupations is associated with a higher weight than working at
fitness demanding occupations.
In this paper, I contribute to the literature primarily by providing a more complete analysis of the link between
work hours and adult weight. To my knowledge, this is the first paper to estimate the effect of individual-level
work hours on adult body weight using panel data to eliminate time-invariant sources of omitted variable bias in
the estimators. Additionally, I differentiate between work hour effects on the basis of gender, marital status,
spouse work status, and employment sector. Finally, I show that work hours affect only the weight of
individuals who are at risk for obesity, suggesting that the effect of work hours on weight is particularly
hazardous to health.
My primary contribution to the childhood obesity literature lies in exploring the impact of mothers' spouses'
work hours, instead of only mothers' work hours, on child weight. In response to increases in female
employment, the percentage of adult men who work fell from 83% in 1950 to 73% in 2004 (Bureau of Labor
Statistics, 2007). If men are perfect substitutes for women in terms of child care, the effect of more women
working on the prevalence of overweight children would be partially offset by the fact that more men stay at
home. I also contribute by utilizing a broader range of data than previous authors, as I include children ages 3 to
17 as well as four more waves of NLSY data than ABL (1998, 2000, 2002, and 2004).
3 Data
For regressions of adult body weight, I use data from the 1979 cohort of the National Longitudinal Survey of
Youth. The NLSY includes data from 6,111 randomly-chosen U.S. youths, plus a supplemental sample of 5,295
minority and economically disadvantaged youths and 1,280 military youths. The NLSY first conducted
interviews in 1979, at which time all respondents were between fourteen and twenty-two years of age.
Subsequent interviews occurred each year until 1994, and then every two years until 2004. The respondents'
reported their weight in 1981, 1982, 1985, 1986, 1988, 1989, 1990, 1992, 1993, 1994, 1996, 1998, 2000, 2002,
and 2004 and their height in 1981, 1982, and 1985. Given the age of respondents, I assume height in 1985 to be
adult height and use it as height for all subsequent years. The long differences models utilized in this paper —
described in section 4.1— restrict the sample to the years 1994 and later. Although the retention rate of the
NLSY79 was high, not all youths were followed for the duration of the sample; therefore, my data are an
unbalanced panel. After dropping pregnant women as well as observations with missing data, my sample
consists of 7,674 individuals and 22,444 observations.3 Table 1 reports summary statistics for variables used in
the adult regressions.
I obtained data on children from the NLSY79CS, which features interviews with children of mothers found in
the NLSY79. Children's height and weight were only recorded in even-numbered years from 1986-2004;
therefore, these are the years included in my sample. Other variables used in regressions of children's weight are
information about the child's mother matched from the NLSY.4 The sample for the baseline long differences
Page 5
model used in section 5 consists of each child's last observation before turning 18, since at that age young adults
become less likely to live with their parents. After eliminating observations with missing data, the sample size is
7,261. Table 2 summarizes the variables taken from the NLSYCS.
The first dependent variable in my adult regressions is body mass index, which is equal to weight in pounds
divided by height in inches squared, multiplied by 703. Following convention in the literature, I also use a
binary variable for whether or not the individual is obese. The average BMI in the sample is 27.4, while the
obesity rate is 25.8%. Using BMI for children is inappropriate since the medically optimal BMI is different for
children and young adults of different ages. For example, a 10-year-old boy is overweight if his BMI is above
22, while a 15- year-old boy would not be overweight until his BMI reached 27. Therefore, for regressions of
child weight, my dependent variable is whether or not the child is overweight, which I construct using age- and
gender-specific CDC growth charts.5 14.3% of the sample is overweight. My independent variables of interest
are the person's (child's mother in children's regressions) average hours worked per week since the last
interview and spouse's average hours worked per week in the past year. Following ABL, I use units of 10 hours.
The sample means for hours and spouse's work hours (in units of 10) are 3.7 and 2.3, respectively. The mean for
spouse's work hours is smaller because I impute values of zero for single people.
Page 6
In some regressions, I group hours worked by occupation type: blue collar, white collar, or service. I consider
an individual to be "blue collar" if her primary occupation is classified as "craftsman, foremen, and kindred;"
"armed forces;" "operatives and kindred;" "laborers, except farm;" "farmers and farm managers;" or "farm
laborers and foremen." I label an individual "white collar" if her occupation is "professional, technical, and
kindred;" "managers, officials, and proprietors;" "sales workers;" or "clerical and kindred" and "service" if her
occupation is "service workers, except private household" or "private household."
In other regressions, I stratify the sample on the basis of overweight status (BMI 25) at the beginning of the
panel in order to discern whether the impact of additional work hours on weight is stronger for people who were
already at risk of becoming obese. To do this, I create an indicator variable "at risk" that is equal to 1 if the
individual had a BMI of at least 25 in 1985. I use 1985 as the beginning year instead of 1981 or 1982 because
all respondents were adults in 1985. 52% of the sample is classified as "at risk."
The wide range of questions asked by the NLSY survey allows me to include as control variables other factors
that could be expected to influence adult weight: hourly rate of pay, highest grade completed, marital status,
age, number of children, and whether or not the respondent has any health conditions that limit the amount or
type of work she can perform.6 I do not include time-invariant controls such as race, gender, and intelligence
because the differencing estimation strategy utilized in this paper eliminates the variation in these variables. In
regressions of children's weight, I include these same characteristics as well as indicator variables for whether
or not the child's mother is overweight or obese.
4 Adults
4.1 Models
I conduct a reduced-form estimation of the relationship between own and spouse work hours and body mass
index and obesity status. I estimate a reduced-form model — as opposed to a structural model in which weight
is a function of eating at restaurants, exercise, and sleep, which are in turn functions of own and spouse's work
hours — for three reasons. First, the NLSY contains very limited information on the frequency of eating out,
amount of exercise, and amount of sleep. Second, even if detailed information on these variables was available,
estimating the structural model would require a third instrument in addition to own and spouse's work hours.
Third, it is possible that eating at restaurants, exercise, and sleep are not the only mechanisms through which
work hours affect weight, in which case the exclusion restrictions in a structural model would not hold. For
example, working more may create stress, which has been linked to overeating and weight gain (Greeno and
Wing, 1994). Also, additional work hours could affect weight by creating additional income. (Since I include
hourly rate of pay as a control instead of income, the reduced-form model allows part of the effect of work
hours on weight to occur through changes in income.) Finally, working more may cause weight to fall simply
by leaving less time for eating.
Page 7
I estimate the impacts of own and spouse's work hours on weight using a strategy designed to address two
important issues. First, body weight is a capital stock in that it depreciates over time but is replenished by new
"investment" in the form of perpetual caloric intake. If an individual changes her daily eating or exercise habits,
her weight will not change all at once. Instead, it will change slowly, eventually reaching a new steady state
after months or possibly years.7 Weight therefore depends on both contemporaneous and lagged values of its
determinants.
In the maternal employment and child weight literature, ABL and Ruhm (2004) addressed this issue by
converting independent variables to averages of their values over the child's entire life. Since I focus on adults,
whom I do not observe from birth, I apply a variation of this approach by averaging over the individual's
entire adult life, which I define as being at least 23 years old.8 Formally, define the average of variable Z over
individual i's entire adult life up to period t as
(1)
where WKij is the number of weeks since the respondent's last interview (or 52 for the first interview).
A second issue is that work hours are endogenous, so ordinary least squares estimators of the effects of own and
spouse's work hours on weight may be biased even after including control variables. People who are ambitious
may both work a large number of hours and maintain a healthy weight, biasing the estimator for own work
hours downward. Since people tend to choose spouses who are similar to themselves, the estimator for spouse's
work hours could also suffer from bias. Additionally, hard-working, financially successful individuals may
marry thin spouses, in which case the estimator for spouse's work hours may be biased downward.
To account for sources of endogeneity that are constant over time, ABL used a long differences approach in
which they differenced between the child's last and first years in the sample. Since the independent variables of
interest were averages over the child's life, their differences reflected changes in the variable averages over
time. Because they used children in the age range 3 to 11, the differences were over up to an eight-year period.
Since weight likely responds gradually to changes in work hours, a long differences approach may be more
appropriate than first differences or fixed effects. ABL also argued that long differencing reduces the extent of
bias from measurement error. In order to apply a similar estimation technique to adults, I difference between the
current year and eight years ago. Since most adults are in the sample for twenty years, differencing between the
last and first years would likely be excessive in accounting for the gradual nature of weight changes. Also, by
allowing each individual to be in the sample more than once, I retain the degrees of freedom and extra
information from the additional observations.9 I restrict the sample to observations where the person was at least
28 years old in the initial period. This ensures that the averages in each initial period are based on at least five
years' worth of data, and therefore not driven by one atypical year.10
My long differenced regression equation is:
ΔWit = β0 + β1Δ it + β2Δ it + β3ΔAGEit + β4Δ it + ΔTt +Δεit (2)
where Wit is a measure of weight (BMI or obesity status)11
for individual i in year t; is average weekly work
hours in units of 10; is spouse's average weekly work hours in units of 10; is a set time-variant controls
that includes marital status, health limitations, hourly rate of pay, education, and number of children; age is the
respondent's age (which I include separately since it is not averaged); and T is a year fixed effect.
1 and 2 are unbiased estimators under the assumption that changes in work hours are uncorrelated with
changes in the error term. While I cannot be completely certain of the validity of this assumption, the most
likely sources of bias, such as ambition, are relatively stable over time. Also, failure to account for changes in
Page 8
ambition over time should result in downward bias, inwhichcase my results are a lower bound.12
Assigning a
causal interpretation to 1 and 2 also requires the assumption that work hours affect weight instead of the other
way around. Reverse causality is a potential concern, as obesity may reduce work hours, both through health
limitations and labor market discrimination.13
Controlling for health limitations and modeling weight as a
function of average work hours over a long time period mitigate this concern to some degree. Additionally, 1
would actually understate the work hour effect if obese people work less than others because of discrimination.
Furthermore, ABL employed both long differences and instrumental variable approaches and obtained similar
results with each, suggesting that a long differences estimator of the effect of mother's work hours on child
weight does not suffer from omitted variable bias or reverse causality. Nonetheless, I cannot be certain that
these findings apply to adult weight.
A limitation with averaging the independent variables is each period is weighted equally. Since body weight is a
depreciating capital stock, recent values of the independent variables may influence weight more strongly than
values in the distant past. On the other hand, eating and exercise habits may not respond immediately to changes
in the regressors, in which case past values would have more predictive power than contemporaneous values. I
therefore also estimate a model that relaxes the assumption that the independent variables have the same effects
in all periods. I replace each averaged variable with three averaged variables: the average over the current year
and last year, the average over two and three years ago, and the average over the remainder of one's adult life.
14 Formally, for a variable Z, define the three averages 1, 2, and 3 as
(3)
(4)
(5)
The regression equation becomes
ΔWit = β0 + jit +
jit + β3ΔAGEit +
jit + ΔTt + Δεit (6)
Comparing the coefficient estimates for the three averages will help to understand the timing of the effect. For
instance, if 11 is large but 12 and 13 are close to zero, then the entire work hour effect occurs quickly. If,
however, 11 and 12 are small while β13 is large, the effect is mostly delayed. The long-run effect of, for
example, a permanent 10-hour-per-week increase in work hours is given by 11 + 12 + 13. In equation (2), the
long-run effect of a permanent 10-hour-per- week increase in work hours is 1. If 11 + 12 + 13 differs
substantially from 1, then the assumption that all periods are weighted equally is likely leading to a misleading
estimate of the long-run effect in (1).
(2) and (6) both assume that the effect of one's work hours on weight is the same for married and single people.
However, people who are married have a spouse to assist with meal preparation; therefore, the work hour effect
may be smaller for them than for singles. Alternatively, marrying often introduces a new set of responsibilities,
ranging from home ownership to raising children. If married individuals face tighter time constraints than
singles, marrying may exacerbate the work hour effect. (2) and (6) also assume that the effect of one's work
hours on weight does not depend on how much one's spouse works, and that the effect of spouse's work hours
on weight does not depend on own work hours. If a person whose spouse does not work begins to work more,
the spouse may be able to compensate by handling more of the food preparation duties. If the spouse also
Page 9
works, this becomes more difficult, suggesting that the work hour effect depends on spouse's work hours, and
(analogously) that the spouse work hour effect depends on own work hours.
I next relax these assumptions by interacting work hours with marital status and spouse's work hours and adding
these terms to the baseline model given by (2):
ΔWit = β0 + β1Δ it + β2Δ it + β3Δ( it * it) +β4Δ( it * it) + β5ΔAGEit + β6Δ it +
ΔTt + Δεit (7)
The effect of ten additional work hours per week is β1 + β3 for singles, β1 for married people whose spouses do
not work, and β1 + 4β4 for married people whose spouses work 40 hours per week. The spouse work hour effect
is β2 for people who do not work and β2 + 4β4 for those who work 40 hours per week.
In the remaining regressions for adults, I further investigate potential heterogeneity of the work hour effects.
First, I run separate regressions for men and women to determine if the effects vary on the basis of gender.
Second, I estimate the baseline model (2) restricting the sample to people with a work history ( > 0) in order
to isolate the effects on workers. Next, I differentiate between the effects of work hours on the weight of people
who were "at risk" of obesity at the start of the panel and those who were not by dividing the two groups into
subsamples. If working only increases the weight of people who initially were within the healthy weight range,
then such a weight gain may not worsen health. Gaining weight could even improve the health of people who
were initially underweight. Alternatively, if working only increases the weight of those who were already at risk
of obesity, then the effects on health would be especially severe. Next, I differentiate between the work hour
effects of white collar, blue collar, and service workers using the following regression equation:
ΔWit = β0+β1Δ( it* it)+β2Δ( it* it) +β3Δ( it * it) + β4Δ it + β5ΔAGEit
+β6Δ it + ΔTt + Δεit (8)
where represents the proportion of time since age 23 the respondent has held a white collar job,
represents a blue collar job, and represents a service occupation. A finding that β3 > β2 and β1
> β2 would provide evidence that shifts in employment over time from blue collar to white collar and service
professions may have increased the average work hour effect.
4.2 Results
Tables 3 and 4 report the coefficient estimates for the work hour variables in the regressions given by (2), (6),
and (7).15 Table 3 uses BMI as the dependent variable, while table 4 uses obesity status. The "baseline" column
indicates the baseline long differences regression (2), "3 averages" indicates the regression (6) that includes
three averages for the independent variables, and "interactions" indicates the regression (7) that adds the
interaction terms * and * . At the bottom of the tables, I compute the estimated long-run
effects of work hours for people who are single, married with a spouse who does not work, and married with a
spouse who works 40 hours per week, as well as the long-run effects of spouse's work hours for people who
work and those who do not work. In brackets, I convert the coefficient estimates to pounds at the sample mean
height of 67.89 inches in order to allow for easier interpretation.
In the baseline BMI regression, a permanent 10 hour per week increase in work hours is associated with a
statistically significant increase of 0.18 units BMI, or 1.2 pounds. Since this model assumes that the work hour
effect is homogenous, the effects on single people, married people with spouses who do not work, and married
people whose spouses work are all the same. 10 additional spouse's work hours increase weight by 0.08 units
BMI, or 0.53 pounds. The p-value is 0.105, so spouse's work hours are not quite significant at the 10% level.
Again, the model assumes homogeneity, so the effect of spouse's work hours is the same regardless of one's
work status.
Page 10
In the BMI regression with three averages, the estimates for all three own work hours variables are positive. 10
additional hours over the past two years increase BMI by a statistically insignificant 0.025 units, 10 additional
hours over the two years before that increase BMI by a significant 0.031 units, and 10 additional hours over all
years before that increase BMI by a significant 0.086 units.
Page 11
The evidence therefore suggests that the work hour effect is largely delayed. The total long-run effect on BMI is
a statistically significant 0.142 units, and the effect is assumed to be the same for all individuals. 0.142 is well
within one standard deviation of the estimated long-run effect from the baseline regression, so there is no
evidence that weighting each period equally in the baseline regression led to a misleading estimate. The
coefficient estimates for each of the three spouse's work hour variables are between 0.02 and 0.03, and one of
the three is significant at the 10% level. The total long-run effect, which is assumed the same for everyone, is a
slightly insignificant 0.07 units BMI. This is again similar to the long-run effect estimated in the baseline
model.
Adding the interaction terms reveals that the effect of own work hours on BMI is weaker for people who are
single, implying that the impact of facing additional constraints on time after marrying outweighs the impact of
having an additional person to share with the food preparation. The effect of 10 additional work hours over an
individual's entire adult life is 0.5 pounds for singles, 1.4 pounds for people who are married to a spouse who
does not work, and 1.8 pounds for people who are married to a spouse who works. The interaction term work
hours*spouse's work hours is positive, as expected. The effect of 10 additional spouse's work hours is 0.2
pounds for people who do not work and 0.6 pounds for people who work. Neither interaction term is significant,
however, so these findings are inconclusive.
In the baseline obesity status regression, 10 work hours increase P(Obese) by a statistically significant 1.3
percentage points. Spouse's work hours, though, have essentially no effect on P(Obese). Using three averages,
Page 12
the majority of the effect of own work hours is again largely delayed. The total long-run effect of 10 work hours
on P(Obese) is a significant 1.2 percentage points. The coefficient estimates for all three spouse work hour
variables are small and insignificant, and the total long-run effect is close to zero. In the regression that adds the
interaction terms, the sign of the coefficient estimate for unmarried*work hours is again negative, while that for
work hours*spouse's work hours is now negative but very small. Both interaction terms are statistically
insignificant. The effect of 10 additional work hours per week on the probability of becoming obese is 0.9
percentage points for singles, 2.0 percentage points for married people with non-working spouses, and 1.6
percentage points for married people with working spouses. The spouse work hour effect is 0.4 percentage
points for those who do not work and 0.03 percentage points for those who do.
Tables 5 and 6 show the results for the subsamples. As discussed in the preceding paragraphs, the total effects
estimated using three averages were similar to those obtained using only one average, while the impacts of the
interaction terms were inconclusive. I therefore use the simplest model, baseline long differences, for all
subsample regressions. Table 5 divides the sample into women and men. The work hour effect appears stronger
for women than men when using BMI as the dependent variable, but becomes stronger for men when obesity
status is used. Neither difference is statistically significant at the 5% level. For both genders, one's spouse
working causes a modest increase in BMI but essentially no change in P(Obese). In short, there does not appear
to be an obvious difference in how own or spouse's work hours impact the weight of the two genders.
Table 6 shows the results for people with positive average work hours, people who were overweight (or obese)
at the beginning of the panel and were therefore "at risk" for obesity, and those who were not. Only 353
individuals have no average work hours, so the estimates for the sample of workers are very similar to those for
the full sample. The effects of own work hours on the BMI of the "at risk" group are positive, large, and
significant. 10 additional work hours are associated with a weight gain of 0.3 8 units BMI, or 2.5 pounds at the
sample mean height. However, the effects on the BMI of people who did not begin the panel overweight are
small and insignificant. One possible explanation for the discrepancy is that people who place a high value on
health may make a special effort to maintain healthy eating and exercise habits after their work hours rise. For
example, they may still eat more fast food but choose the healthiest items on the menu. However, it is also
possible that all people make less healthy decisions, but only those who are genetically prone to weight gain
actually gain a noticeable amount of weight. In either case, the fact that the impact of work hours on weight is
substantially stronger for people who are at risk for obesity means that the work hour effect is particularly
hazardous to public health.
Page 13
In table 7, I report results for the regressions with work hours grouped by occupation type. The work hour effect
does appear strongest for white-collar workers, but the effect on blue-collar workers is also positive. Only
service workers do not appear affected by additional work. When interpreting these findings, note that BMI
does not distinguish between fat and muscle mass. It is possible that blue-collar workers, who often engage in
strenuous on-the-job exercise, may actually be adding muscle instead of fat. In contrast, the jobs of service
workers likely involve only low-intensity exercise, such as walking, which builds little or no muscle. If the
weight gain of blue-collar workers is in fact muscle instead of fat, then my results may overstate the health
consequences of additional work.
5 Children 5.1 Models
I next analyze the effect of parents' work hours on the overweight status of children and young adults. My
estimation approach for children is virtually identical to the long differences strategy used by ABL, except for
three main changes. First, they only utilize up to the 1996 NLSY wave, so my data set includes an additional
four waves: 1998, 2000, 2002, and 2004. Second, I include mother's spouse's work hours as a regressor in
addition to mother's work hours. Third, my sample consists of all children and young adults between the ages of
3 and 17, whereas their sample excludes those over 11.
I estimate a linear probability model using whether or not the child is overweight (O) as the dependent variable.
I again convert the independent variables (besides age and the year effects) to averages according to equation
(1). I average over all periods, up to and including the current period, for which the child is observed. Most
children are observed from birth; for these children, the independent variables are averages over their entire
lives. The model is long differenced, using the child's first observation after turning three as the "initial period"
and her last observation before turning eighteen as the "final period." Few children are in the sample from birth
to the age of eighteen; the average length of time between initial and final periods is seven years. The regression
equation is
ΔOit = β0 + β1Δ it + β2Δ it + β3Δ it + β4Δ it + β5Δ it +ΔTt + Δεit (9)
Page 14
where AGE is the child's mother's age, CHAGE is the child's age, and X is the set of control variables that vary
over time: mother's household wage, education, marital status, overweight status, and obesity status and the total
number of children under the age of 18 living in the home.
For 1and 2 to have causal interpretations, changes over time in work hours must be uncorrelated with changes
over time in the error term, and child overweight status must not determine parent work hours. ABL's finding that
the estimated effect of mother's work hours on a child's P(Overweight) using a long differences model was
statistically indistinguishable from estimates obtained using instrumental variables models provides some
evidence to support these assumptions. However, I cannot completely rule out the possibilities of omitted
variable bias and reverse causality. Omitted variable bias may result if a lack of concern for child health both
leads parents to work more and children to gain weight, or if general ambition causes parents to work more and
also closely monitor their children's health habits. Differencing mitigates these concerns, as concern for children's
health and ambition should be relatively stable over time. Reverse causality would result if the health problems of
overweight children cause parents to work less, in which case 1and 2 would understate the true causal effects
of work hours.
I also estimate several variations of this model.16
First, I include the interaction terms and
. Next, I conduct separate regressions for boys and girls to determine if the work hour effects differ on the
basis of the child's gender. Finally, I examine whether the work hour effects are different for different age ranges.
I estimate (9) differencing between the child's last observation before turning 12 and her first observation after
turning 3. I then estimate (9) differencing between the child's last observation before turning 18 and her first
observation after turning 11.17
I use the age ranges 3 to 11 and 11 to 17 because this allows for a direct
comparison to ABL's results, as they used the range 3 to 11.
5.2 Results
I report the coefficient estimates for the work hour variables in table 8. At the bottom of the table, I use these
estimates to compute mother's work hour effects if the mother is single, married with a spouse who does not
work, and married with a spouse who works 40 hours per week. I also compute mother's spouse's work hour
effects if the mother does not work and if the mother works 40 hours per week. Estimating the baseline model (9)
reveals that 10 additional mother's work hours per week over the course of the child's life are associated with a
statistically significant 1.6 percentage point increase in P(Overweight), but mother's spouse's work hours have
essentially no effect. This suggests that mothers pay more attention to the eating and exercise habits of their
children than fathers. The model assumes that the effect of mother's work hours is the same regardless of whether
the mother is married and whether the spouse works, and also that the effect of mother's spouse's work hours is
the same regardless of whether the mother works.
Page 15
After adding the interaction terms, the work hour effect is slightly stronger for children of unmarried mothers,
and slightly weaker for children of married mothers whose spouses work. The long-run impact of a mother
working an additional 10 hours per week on her child's P(Overweight) is 2.5 percentage points for single
mothers, 1.8 percentage points for married mothers whose husbands do not work, and 1.4 percentage points for
married mothers whose husbands work. If a mother's spouse works an additional 10 hours per week, her child's
P(Overweight) rises by 0.3 percentage points if the mother works and falls by 0.1 percentage points if she does
not. Both interaction terms are insignificant.
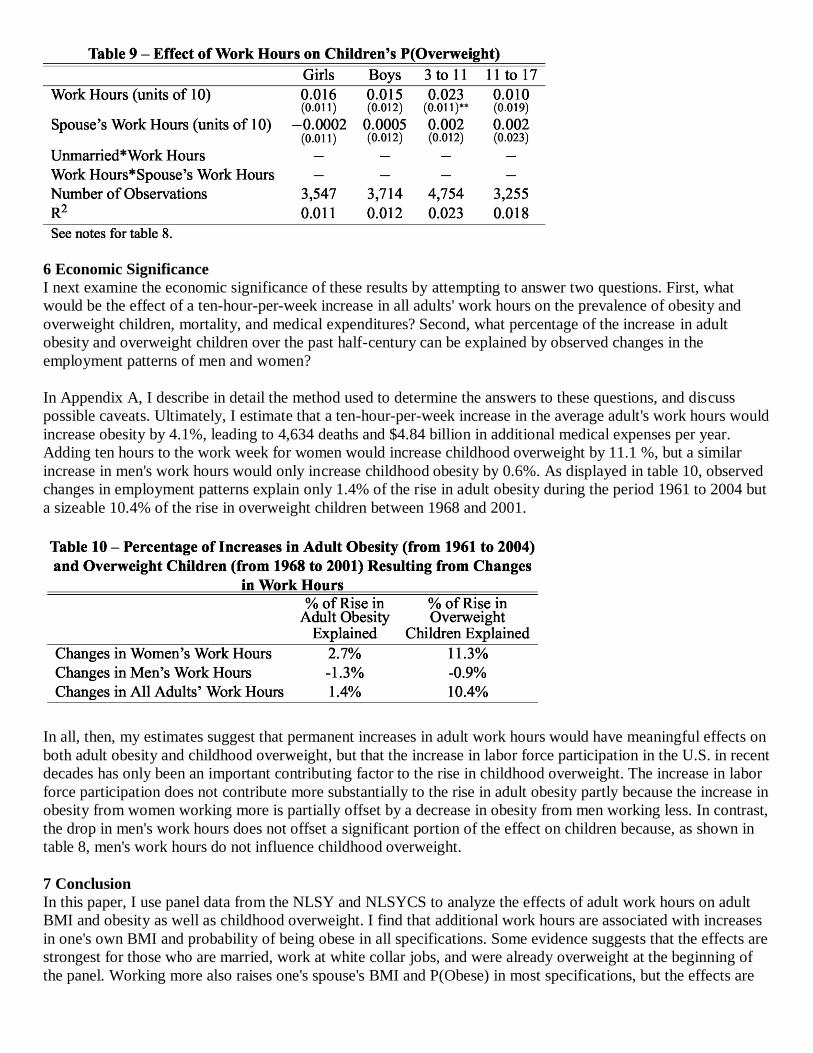
Table 9 displays the coefficients of interest for the regressions that divide the sample into girls and boys and into
the two age ranges. The results are very similar for the two genders. The impact of mother's work hours on a
child's P(Overweight) appears to be strongest in the early stages of development. Ten additional mother's work
hours are associated with a statistically significant increase in P(Overweight) of 2.3 percentage points for children
between the ages of 3 and 11, but a statistically insignificant increase of only 1 percentage point between the ages
of 11 and 17. Mother's spouse's work hours have practically no effect for either age group. In their long
differences regression, ABL, who only used the NLSY waves up to 1996, estimated the impact of 10 mother's
work hours on the P(Overweight) of 3 to 11 year olds to be only 1.5 percentage points. The effect therefore
appears to have become stronger over time.
Page 16
6 Economic Significance
I next examine the economic significance of these results by attempting to answer two questions. First, what
would be the effect of a ten-hour-per-week increase in all adults' work hours on the prevalence of obesity and
overweight children, mortality, and medical expenditures? Second, what percentage of the increase in adult
obesity and overweight children over the past half-century can be explained by observed changes in the
employment patterns of men and women?
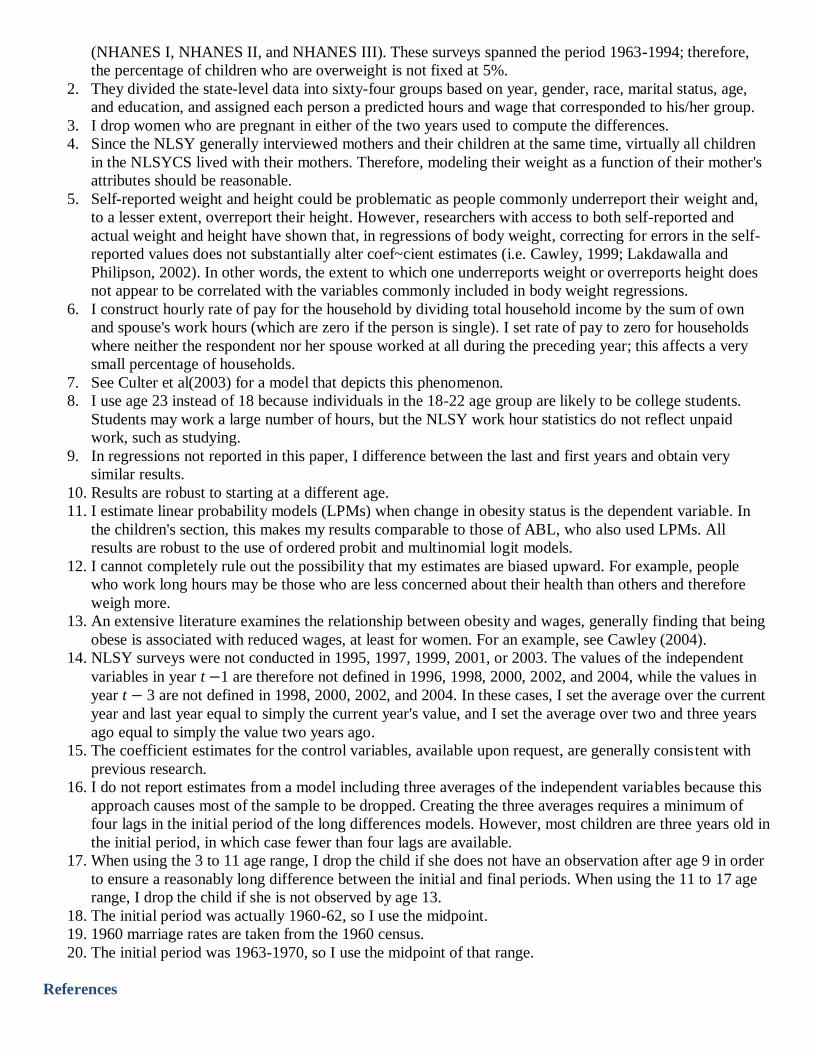
In Appendix A, I describe in detail the method used to determine the answers to these questions, and discuss
possible caveats. Ultimately, I estimate that a ten-hour-per-week increase in the average adult's work hours would
increase obesity by 4.1%, leading to 4,634 deaths and $4.84 billion in additional medical expenses per year.
Adding ten hours to the work week for women would increase childhood overweight by 11.1 %, but a similar
increase in men's work hours would only increase childhood obesity by 0.6%. As displayed in table 10, observed
changes in employment patterns explain only 1.4% of the rise in adult obesity during the period 1961 to 2004 but
a sizeable 10.4% of the rise in overweight children between 1968 and 2001.
In all, then, my estimates suggest that permanent increases in adult work hours would have meaningful effects on
both adult obesity and childhood overweight, but that the increase in labor force participation in the U.S. in recent
decades has only been an important contributing factor to the rise in childhood overweight. The increase in labor
force participation does not contribute more substantially to the rise in adult obesity partly because the increase in
obesity from women working more is partially offset by a decrease in obesity from men working less. In contrast,
the drop in men's work hours does not offset a significant portion of the effect on children because, as shown in
table 8, men's work hours do not influence childhood overweight.
7 Conclusion
In this paper, I use panel data from the NLSY and NLSYCS to analyze the effects of adult work hours on adult
BMI and obesity as well as childhood overweight. I find that additional work hours are associated with increases
in one's own BMI and probability of being obese in all specifications. Some evidence suggests that the effects are
strongest for those who are married, work at white collar jobs, and were already overweight at the beginning of
the panel. Working more also raises one's spouse's BMI and P(Obese) in most specifications, but the effects are
Page 17
smaller and statistically insignificant. I also find that an increase in mother's, but not mother's spouse's, work
hours is associated with a higher probability that a child is overweight.
In the past half-century, female employment in the U.S. has risen while male employment has fallen by a lesser
amount. I estimate that these changing employment patters account for only 1.4% of the rise in adult obesity
between 1961 and 2004 but a more substantial 10.4% of the increase in overweight children from 1968 to 2001.
Looking forward, my results imply that a permanent 10 hour per week increase in the work week would
eventually have meaningful effects on both adult obesity and childhood overweight, as it would increase the
former by 4.1 % and the latter by 11.1 %. Anecdotal evidence suggests that many Americans are working longer
hours than ever, and that employees in some professions routinely work sixty to eighty hours per week or more.
Such long work weeks could have a detrimental effect on health by increasing the obesity rate.
The results of this study should not be interpreted to mean that the increase in women's labor force participation
has harmed society, or that women today should reduce their work hours. The expansion of women's rights that
contributed to this rise in female employment was obviously one of the great advancements of the 20th Century.
My findings instead indicate that people who work long hours should realize the potential health consequences
and take steps to prevent them from occurring.
Appendix A — Economic Significance Calculations
A.1 Adults
In this section, I assess the economic significance of my results by estimating the impact of a ten-hour-per-week-
per-adult increase in work hours on adult obesity, as well as the percentage of the recent rise in adult obesity that
can be explained by changing employment patterns.
Since the results from splitting the sample into women and men were inconclusive, in this section I assume that
the work hour effect and spouse work hour effect are the same for both genders. Additionally, since I was unable
to reach a definitive conclusion about whether or not the work hour effect is different for singles and married
people, I assume that the work hour effect does not depend on marital status. Finally, since I found that the work
hour effect was similar for married people whose spouses work and those whose spouses do not work, I assume
the same effect for the two groups. Therefore, I calibrate the equations in this section using the results from the
first column in the right half of table 3, in which I estimated that ten work hours per week increases P(Obese) by
0.013 percentage points, and that ten spouse work hours increases P(Obese) by 0.0006 percentage points.
The overall effect of an increase in women's work hours on obesity is equal to its effect on women plus its effect
on men. The derivative of the obesity rate with respect to women's work hours is therefore:
= PW
+ PMMM
(10)
where O is the obesity rate, HW is the average hours worked per week for women, PW is the proportion of the
adult population that is female, PM is the proportion of the adult population that is male, MM is the proportion of
adult men who are married, and dO/dH and dO/dHS are the derivatives of the obesity rate with respect to own
work hours and spouse's work hours. Similarly, the change in obesity with respect to a change in men's work
hours is:
= PM
+ PWMW
(11)
(10) and (11) reduce to:
=
+ M
(12)
Page 18
where H is average hours worked by all adults and M is the proportion of the adult population that is married.
After calibrating (12) using the estimates from this paper along with the marriage rate from the 2000 census, it
becomes:
= 0.013 + 0.54(0.0006) = 0.013324
Dividing this result by the 2004 obesity rate of 0.322 shows that a ten-hourper-week increase in the average
adult's weekly hours worked would increase the obesity rate by approximately 4.1 %. Using the estimated costs
of obesity from the introduction, these numbers translate to 4,634 deaths and $4.84 billion in medical
expenditures per year.
I next estimate the percentage of the increases in adult obesity (from 1961- 2004) that can be explained by
changes in work hours during the periods.18
The proportion of adults who are obese because of women's work
hours (OHW) in period t is simply dO/dHW multiplied by the average hours worked by women in t:
OHWt = HWt
(13)
I approximate average weekly work hours for adult women using the percentage of single and married women
employed part- and full-time combined with the average work hours for part- and full-time workers:
HWt = WSt (SWFtHF + SWPtHP) + WMt (MWFtHF + MWPtHP) (14)
where t is 1961 or 2004, WS is the proportion of women who are single, SWF is the proportion of single women
who are employed full time, HF is the average weekly work hours (in units of 10) for full-time employees, SWP is
the proportion of single women who are employed part time, HP is the average weekly work hours for part-time
employees, and married (M) replaces single in the second half of the expression. Combining (10), (13), and (14),
I obtain:
OHWt = [WSt (SWFtHF + SWPtHP) + WMt (MWFtHF + MWPtHP)]
(15)
The equation for men is analogous. Calibrating the parameters using data from the Current Population Survey
yields the following set of equations:19
OHW,1961 = [(0.34)(0.34*4.48+0.11*2.15)+0.66(0.23*4.48 +0.08*2.15)] [0.53 *0.013+0.47*0.69*0.0006]
= 0.010
OHM, 1961 = [(0.31)(0.49*4.48+0.04*2.15)+0.69(0.83*4.48 +0.07*2.15)] [0.47*0.013+0.53 *0.66*0.0006]
= 0.021
OHW,2004 = [(0.49)(0.40*4.48+0.14*2.15)+0.51(0.43*4.48 +0. 15*2.15)][0.52*0.013+0.48*0.56*0.0006]
= 0.015
OHM,2004 = [(0.44)(0.55*4.48+0.07*2.15)+0.56(0.67*4.48 +0.08*2.15)][0.48*0.013+0.52*0.51 *0.0006]
= 0.019
Between 1960 and 2004, the adult obesity rate rose by 19.4 percentage points. The percentages of this rise
explained by changes in female and male employment patterns are:
and
Page 19
Therefore, the rise in female employment accounted for 2.7% in the rise in adult obesity between 1961 and 2004,
while the concurrent drop in male employment offset almost half of this increase. In total, changes in work hours
accounted for 1.4% of the rise in obesity during the period.
A.2 Children
I next conduct a similar analysis for children. Given the lack of conclusive results when adding the interaction
terms and splitting the sample into girls and boys, in this section I assume that the work hour effect is the same
for girls and boys, as well as children of single and married mothers and children of married mothers whose
husbands work and married mothers whose husbands do not work. Therefore, I calibrate the equations in this
section using the results from the first column of table 6. The effect of a mother working ten hours per week on
her children's P(Overweight) is 0.016, while the effect for the mother's spouse is 0.001.
The following equation expresses the change in the percentage of children who are overweight if women's work
hours increase by ten per week:
(16)
where OC is the proportion of children who are overweight, PCW is the proportion of children who live with their
mothers (or another female guardian), and dOC/dHWK is the change in the "overweight rate" of children who live
with their mothers with respect to a change in women's work hours. The effect of a change in men's work hours
is, similarly:
(17)
where dOC/dHSP is the mother's spouse work hour effect. Calibrating (16) and (17), again using data from the
2000 census, yields:
= 0.95(0.016) = 0.015 and
= 0.76(0.001) = 0.00008
Dividing by the 0.135 rate of overweight children, I find that a 10 hour rise in the average woman's work hours
increases the prevalence of overweight children by 11.1%, while such a rise in men's hours increases it by only
0.06%.
I next estimate the percentage of the rise in overweight children from 1968- 2001 that can be explained by
changes in adult work hours.20
The proportion of children who are overweight because of maternal employment
(OCHW) in period t is:
(18)
where HWKWC is the average weekly hours worked by women who live with children.
HWCt = WCSt (SWFtHF + SWPtHP) + WCMt (MWFtHF + MWPtHP) (19)
where WCS is the proportion of women with children who are single and WCM is the proportion who are
married. Combining (16), (18), and (19) yields:
OCHWt = [WCSt (SWFtHF + SWPtHP) + WCMt (MWFtHF + MWPtHP)]
(20)
Page 20
The equation for men is analogous. I calibrate (20) using data from the Current Population Survey:
OCHW,1968 = [0. 11(0.36* 4.48+ 0.12* 2.15)+ 0.89(0.26* 4.48+ 0.09* 2.15)] *0.99 * 0.016
= 0.022
OCHM,1968 = [0.01(0.48* 4.48+ 0.04* 2.15)+ 0.99(0.81 *4.48+0.07*2.15)] *0.89 * 0.001
= 0.003
OCHW,2001 = [0.26(0.41* 4.48+ 0.14* 2.15)+ 0.74(0.45* 4.48+ 0.15* 2.15)] *0.95 * 0.016
= 0.035
OCHM,2001 = [0.26(0.41* 4.48+ 0.14* 2.15)+ 0.74(0.45* 4.48+ 0.15* 2.15)] *0.95 * 0.001
= 0.002
The proportion of children who are overweight rose by 11.5 percentage points between 1968 and 2001. The
percentages of this increase that can be explained by changes in female and male employment are:
Table 10 summarizes the percentages of the rise in adult obesity and childhood overweight that can be attributed
to changing employment patterns. Limitations in the data force me to make three potentially problematic
assumptions in the calculations in this table. First, I assume that average hours worked per week for both full- and
part-time workers are constant over time. Popular consensus is that the work week has lengthened; this would
mean my results understate the true effect. Also, I assume that people work the same number of hours regardless
of whether or not they have children. Since having children often causes one or both parents to reduce work
hours, the change in mothers' work hours may be smaller than the change in women's work hours; therefore, my
results for children may be exaggerated. Finally, I assume that the derivatives estimated in this paper are constant
over time. People today have far greater access to fast food and other unhealthy pre-prepared food than they did
forty years ago, suggesting that the work hour effect may be stronger today, and that the impact of changes in
labor force participation in the 1960's and 1970's on body weight may have been smaller than my results suggest.
On the other hand, it is possible that increased work hours induced demand for convenience food that, once
created, was consumed by all. If this is the case, my derivatives understate the true effect of changing labor
markets on obesity. Because of these limitations, the results in table 10 should be viewed as rough estimates and
not exact calculations.
Notes
*Department of Economics, Bryan School of Business and Economics, University of North Carolina at
Greensboro. P.O. Box 26165, Greensboro, NC 27402. E-mail: [email protected] . Phone: (336)334-3910. Fax:
(336)334-4089. I am grateful to Sebastian Galiani, Daifeng He, Edward Greenberg, Michael Grossman, Patrick
McAlvanah, Jeremy Meiners, Charles Moul, Donald Nichols, Bruce Petersen, Michael Plotzke, Paul Rothstein,
and Chris Ruhm for valuable suggestions. I also thank seminar participants at Washington University in St.
Louis, as well as the editor and two anonomous referees. This research was conducted using restricted data from
the Bureau of Labor Statistics. The views expressed in this paper do not reflect those of the BLS. All errors are
my own.
1. Children and adolescents are classified as "overweight" if they have a BMI at or above the 95th percentile
based on age- and gender-specific growth charts. With children and adolescents, the term "obese" is used
interchangeably with "overweight;" I use the term overweight in this paper. Percentiles are determined
using child BMI data from the second and third National Health Examination Surveys (NHES II and
NHES III) and from the first, second, and third National Health and Nutrition Examination Surveys
Page 21
(NHANES I, NHANES II, and NHANES III). These surveys spanned the period 1963-1994; therefore,
the percentage of children who are overweight is not fixed at 5%.
2. They divided the state-level data into sixty-four groups based on year, gender, race, marital status, age,
and education, and assigned each person a predicted hours and wage that corresponded to his/her group.
3. I drop women who are pregnant in either of the two years used to compute the differences.
4. Since the NLSY generally interviewed mothers and their children at the same time, virtually all children
in the NLSYCS lived with their mothers. Therefore, modeling their weight as a function of their mother's
attributes should be reasonable.
5. Self-reported weight and height could be problematic as people commonly underreport their weight and,
to a lesser extent, overreport their height. However, researchers with access to both self-reported and
actual weight and height have shown that, in regressions of body weight, correcting for errors in the self-
reported values does not substantially alter coef~cient estimates (i.e. Cawley, 1999; Lakdawalla and
Philipson, 2002). In other words, the extent to which one underreports weight or overreports height does
not appear to be correlated with the variables commonly included in body weight regressions.
6. I construct hourly rate of pay for the household by dividing total household income by the sum of own
and spouse's work hours (which are zero if the person is single). I set rate of pay to zero for households
where neither the respondent nor her spouse worked at all during the preceding year; this affects a very
small percentage of households.
7. See Culter et al(2003) for a model that depicts this phenomenon.
8. I use age 23 instead of 18 because individuals in the 18-22 age group are likely to be college students.
Students may work a large number of hours, but the NLSY work hour statistics do not reflect unpaid
work, such as studying.
9. In regressions not reported in this paper, I difference between the last and first years and obtain very
similar results.
10. Results are robust to starting at a different age.
11. I estimate linear probability models (LPMs) when change in obesity status is the dependent variable. In
the children's section, this makes my results comparable to those of ABL, who also used LPMs. All
results are robust to the use of ordered probit and multinomial logit models.
12. I cannot completely rule out the possibility that my estimates are biased upward. For example, people
who work long hours may be those who are less concerned about their health than others and therefore
weigh more.
13. An extensive literature examines the relationship between obesity and wages, generally finding that being
obese is associated with reduced wages, at least for women. For an example, see Cawley (2004).
14. NLSY surveys were not conducted in 1995, 1997, 1999, 2001, or 2003. The values of the independent
variables in year t 1 are therefore not defined in 1996, 1998, 2000, 2002, and 2004, while the values in
year t 3 are not defined in 1998, 2000, 2002, and 2004. In these cases, I set the average over the current
year and last year equal to simply the current year's value, and I set the average over two and three years
ago equal to simply the value two years ago.
15. The coefficient estimates for the control variables, available upon request, are generally consistent with
previous research.
16. I do not report estimates from a model including three averages of the independent variables because this
approach causes most of the sample to be dropped. Creating the three averages requires a minimum of
four lags in the initial period of the long differences models. However, most children are three years old in
the initial period, in which case fewer than four lags are available.
17. When using the 3 to 11 age range, I drop the child if she does not have an observation after age 9 in order
to ensure a reasonably long difference between the initial and final periods. When using the 11 to 17 age
range, I drop the child if she is not observed by age 13.
18. The initial period was actually 1960-62, so I use the midpoint.
19. 1960 marriage rates are taken from the 1960 census.
20. The initial period was 1963-1970, so I use the midpoint of that range.
References
Page 22
Anderson P., Butcher K., and Levine P., 2003. "Maternal employment and overweight children." Journal of
Health Economics 22: 477-504.
Bureau of Labor Statistics, 2007. "Labor Force Statistics from the Current Population Survey." Available
http://data.bls.gov/PDQ/outside.jsp?survey=ln.
Cawley J., 1999. "Addiction and the Consumption of Calories: Implications for Obesity." Working paper.
Cawley J., 2004. "The Impact of Obesity of Wages." Journal of Human Resources 39(2): 451-474.
Chou S., Grossman M., and Saffer H., 2002. "An Economic Analysis of Adult Obesity: Results from the
Behavioral Health Factor Surveillance System." National Bureau of Economic Research Working Paper
9247.
Chou S., Grossman M., and Saffer H., 2004. "An Economic Analysis of Adult Obesity: Results from the
Behavioral Health Factor Surveillance System." Journal of Health Economics 23: 565-587.
Cutler D., Glaeser E., and Shapiro J., 2003. "Why Have Americans Become More Obese?" Journal of Economic
Perspectives 17(3): 93-118.
Fertig A., Glomm G., Tchernis R., 2006. "The Connection Between Maternal Employment and Childhood
Obesity: Inspecting the Mechanisms." Working paper, Center for Applied Economics and Policy
Research, Indiana University.
Flegal K., Carroll M., Kuczmarski R., and Johnson C., 1998. "Overweight and Obesity in the United States:
Prevalence and Trends, 1960-1994." International Journal of Obesity 22(1): 39-47.
Gangwisch J., Malaspina D., Boden-Albala B., Heymsfield S.. "Inadequate sleep as a risk factor for obesity:
analyses of the NHANES I." Sleep 28(10): 1289-1296.
Greeno C. and Wing R., 1994. "Stress-Induced Eating." Psychological Bulletin 115(3): 444-464.
Hedley A., Ogden C., Johnson C., Carroll M., Curtin L., and Flegal K., 2004. "Overweight and Obesity Among
U.S. Children, Adolescents, and Adults, 1999-2002." Journal of the American Medical Association 291:
2847-50.
Jefferey R., Baxter J., McGuire M., and Linde J., 2006. "Are fast food restaurants an environmental risk factor for
obesity?" International Journal of Behavioral Nutrition and Physical Activity 3:2.
Ko G. et al, 2007. "Association between Sleeping Hours, Working Hours and Obesity in Hong Kong Chinese: the
'Better Health for Better Hong Kong' Health Promotion Campaign." International Journal of Obesity 31:
254–260.
Lakdawalla D. and Philipson T., 2002. "The Growth of Obesity and Technological Change: A Theoretical and
Empirical Examination." National Bureau of Economic Research, working paper 8946.
Lakdawalla D. and Philipson T., 2007. "Labor Supply and Weight." Journal of Human Resources 42(1): 85-116.
Ogden C., Carroll M., Curtin L., McDowell M., Tabak C., and Flegal K., 2006. "Prevalence of Overweight and
Obesity in the Unived States, 1999-2004." Journal of the American Medical Association 295: 1549-1555.
Philipson T. and Posner R., 1999. "The Long-Run Growth in Obesity as a Function of Technological Change."
National Bureau of Economic Research, working paper 7423.
Ruhm C., 2004. "Maternal Employment and Adolescent Development." National Bureau of Economic Research
Working Paper 10691.
Ruhm C., 2005. "Healthy Living in Hard Times." Journal of Health Economics 24(2): 341-363.
Satia J., Galanko J., and Siega-Riz A., 2004. "Eating at Fast-food Restaurants is Associated with Dietary Intake,
Demographic, Psychosocial and Behavioural Factors among African Americans in North Carolina."
Public Health Nutrition 7: 1089- 1096.
U.S. Department of Health and Human Services, 2001. "The surgeon general's call to action to prevent and
decrease overweight and obesity."
Taheri S., Lin L., Austin D., Young T., and Mignot E., 2004. "Short sleep duration is associated with reduced
leptin, elevated ghrelin, and increased body mass index — A population-based study." PLoS Medicine
1(3): 210-217.
Young L., Nestle M., 2002. "The Contribution of Expanding Portion Sizes to the U.S. Obesity Epidemic."
American Journal of Public Health, 92: 246-249.