IOSR Journal of Engineering (IOSRJEN) www.iosrjen.org ISSN (e): 2250-3021, ISSN (p): 2278-8719 Vol. 05, Issue 08 (August. 2015), ||V4|| PP 11-21 International organization of Scientific Research 11 | P a g e Longitudinal Analysis and Prospective of Medical Cost for Hypertensive Diseases: Case of Mexico Dora Elena Ledesma-Carrión 1 , Lidia Hernández-Hernández 2 and María Teresa Leonor Muciño-Porras 3 1 Instituto Nacional de Estadística y Geografía (INEGI) Av. Patriotismo 711, Col. San Juan Mixcoac, C.P. 03730, Del. Benito Juárez, México D.F., Tel.: 52781000, ext.1624 2 Instituto Nacional de Estadística y Geografía (INEGI) Av. Patriotismo 711, Col. San Juan Mixcoac, C.P. 03730, Del. Benito Juárez, México D.F., 3 Instituto Nacional de Estadística y Geografía (INEGI) Av. Patriotismo 711, Col. San Juan Mixcoac, C.P. 03730, Del. Benito Juárez, México D.F., Abstract: - The treatment unit costs are similarly between men and women, but there are more men than women with hypertension and increasing the medical costs. Medical costs are calculated for hypertensive diseases for all age groups of Mexican people and sex into range of 2012-2050. Probabilities of entrance or disease detection, permanence or in treatment and departure or death are calculated for each age group and sex. The maximum probabilities for each case are 1.92% (60-64), 53.31% (85+) and 3.13% (85+) for male. Analogously, for female are 2.45% (60-64), 72.46% (85+) and 2.27% (85+), respectively. The maximum number of people in treatment is between 20 and 29 years old, decreasing up to 65-69 (male) and 60-64 (female) years of age and, 70+ (male) and 65+ (female) increases again because of other sickness appear linking with hypertension. Keywords: - aging, health, hypertension, medical costs, prospective. I. INTRODUCTION Mexican food is varied but rich in carbohydrates and fats, recent advances in medicine have shown that the change of cane sugar by fructose as a sweetener in the Mexican diet is largely responsible along with hereditary factors of physical deterioration of the Mexican population: obesity, diabetes mellitus, hypertensive diseases (HD) and chronic-disease degenerative[1], [5]. This work shows the economic impact over a horizon of 2012-2050 of HD in terms of percentages of gross domestic product (GDP), for the three scenarios: base, optimal and worse. The base scenario is calculated by adjusting a model AR(2)MA(2)[2] with weighting, the other two are given by experts and both depend on the effect of energy and labor reforms. The available information is from public institutions: Ministry of Health (Secretaría de Salud, SS[3], [8], [9], [11]), National Population Council (Consejo Nacional de Población, CONAPO[12]), Mexican Institute of Social Security (Instituto Mexicano del Seguro Social, IMSS[4], [6], [7]), National Institute of Statistics and Geography (Instituto Nacional de Estadística y Geografía, INEGI[10]) and private: Mexican Association of Insurance Institutions (AMIS) and hospitals. Population projections by CONAPO whose methodology appears on the official website[12] and decadal cohort of number of patients and unit costs for some diseases IMSS beneficiaries were used[6], [7]. IMSS information is not showed by age group neither sex (patients in treatment). New cases information appears since 1980 up to 1990 by big age group and sex and 1991-2011 by age group. Deceased people by HD is presented by age and sex. The cost of this disease is high for its treatment and its duration. As insured persons by IMSS represent 40% of the population, IMSS data are taken as sampling. The Mexican health system (SS) covers the following institutions: IMSS, Institute for Social Security and Services for State Workers (Instituto de Seguridad y Servicios Sociales de los Trabajadores del Estado, ISSSTE), Popular Insurance (Seguro Popular, SP-IMSS), Oil Company (Petróleos Mexicanos, PEMEX), Ministry of Defense (Secretaría de la Defensa Nacional, SEDENA), Ministry of Navy (Secretaría de Marina, SEMAR), private institutions and other public institutions, so the numbers of deaths and new cases are representative of the population. II. METHODOLOGY The proposed model is stochastic[2] with entrance, in treatment and death probabilities by HD, population, number of patients and unitary cost at time t by age group and sex (stock). The probabilities are calculated for each year, t, as
Transcript
IOSR Journal of Engineering (IOSRJEN) www.iosrjen.org
ISSN (e): 2250-3021, ISSN (p): 2278-8719
Vol. 05, Issue 08 (August. 2015), ||V4|| PP 11-21
International organization of Scientific Research 11 | P a g e
Longitudinal Analysis and Prospective of Medical Cost for
Hypertensive Diseases: Case of Mexico
Dora Elena Ledesma-Carrión1, Lidia Hernández-Hernández
2 and
María Teresa Leonor Muciño-Porras3
1Instituto Nacional de Estadística y Geografía (INEGI)
Av. Patriotismo 711, Col. San Juan Mixcoac, C.P. 03730, Del. Benito Juárez, México D.F.,
Tel.: 52781000, ext.1624 2Instituto Nacional de Estadística y Geografía (INEGI)
Av. Patriotismo 711, Col. San Juan Mixcoac, C.P. 03730, Del. Benito Juárez, México D.F., 3Instituto Nacional de Estadística y Geografía (INEGI)
Av. Patriotismo 711, Col. San Juan Mixcoac, C.P. 03730, Del. Benito Juárez, México D.F.,
Abstract: - The treatment unit costs are similarly between men and women, but there are more men than women
with hypertension and increasing the medical costs. Medical costs are calculated for hypertensive diseases for
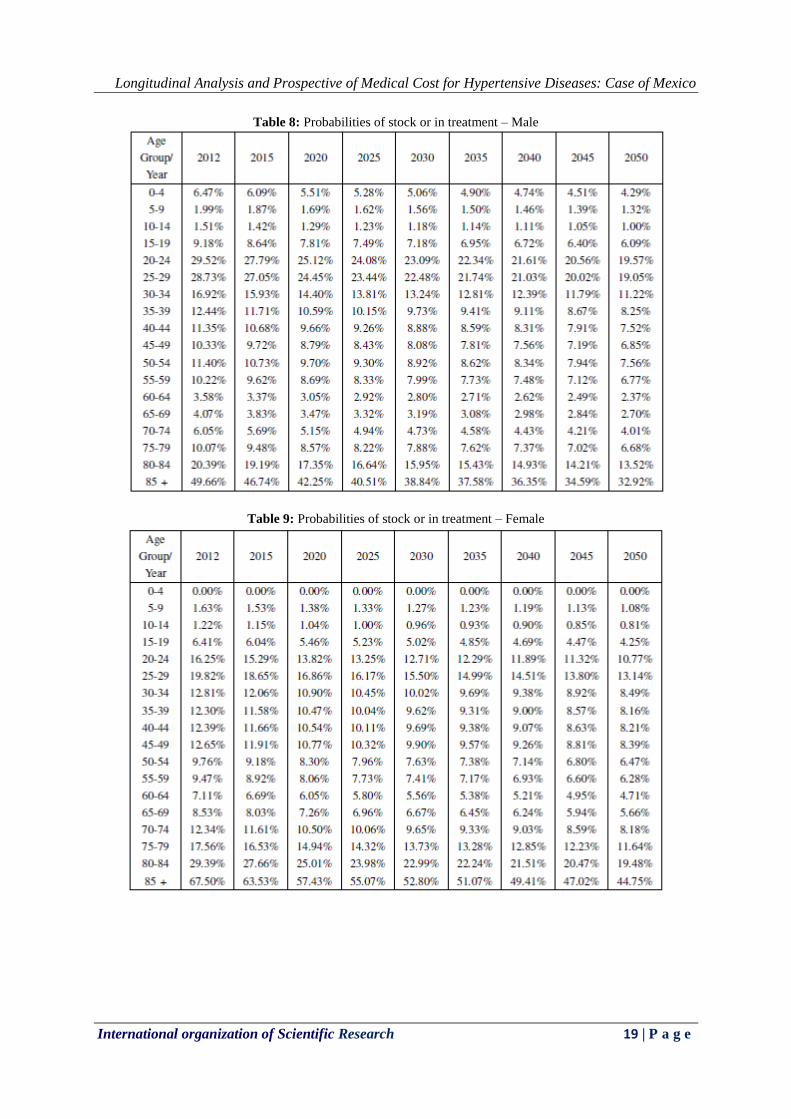
all age groups of Mexican people and sex into range of 2012-2050. Probabilities of entrance or disease
detection, permanence or in treatment and departure or death are calculated for each age group and sex. The
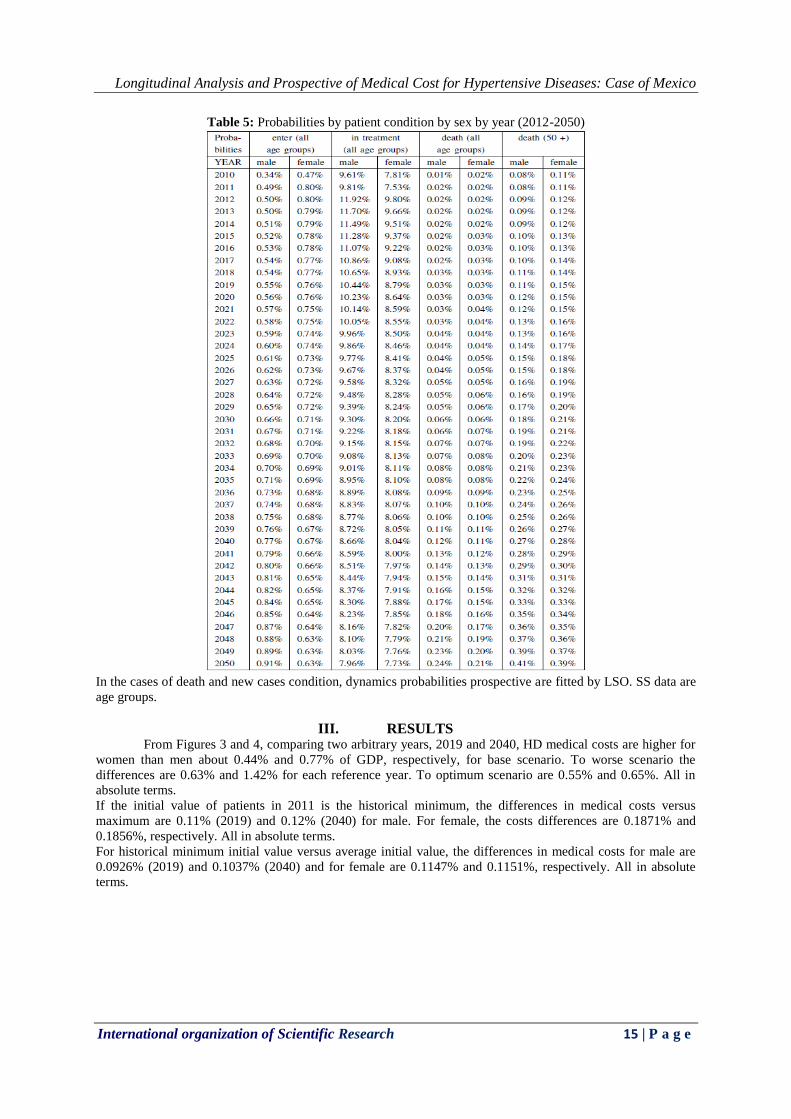
maximum probabilities for each case are 1.92% (60-64), 53.31% (85+) and 3.13% (85+) for male. Analogously,
for female are 2.45% (60-64), 72.46% (85+) and 2.27% (85+), respectively. The maximum number of people in
treatment is between 20 and 29 years old, decreasing up to 65-69 (male) and 60-64 (female) years of age and,
70+ (male) and 65+ (female) increases again because of other sickness appear linking with hypertension.
Keywords: - aging, health, hypertension, medical costs, prospective.
I. INTRODUCTION Mexican food is varied but rich in carbohydrates and fats, recent advances in medicine have shown that
the change of cane sugar by fructose as a sweetener in the Mexican diet is largely responsible along with
hereditary factors of physical deterioration of the Mexican population: obesity, diabetes mellitus, hypertensive
diseases (HD) and chronic-disease degenerative[1], [5].
This work shows the economic impact over a horizon of 2012-2050 of HD in terms of percentages of gross
domestic product (GDP), for the three scenarios: base, optimal and worse. The base scenario is calculated by
adjusting a model AR(2)MA(2)[2] with weighting, the other two are given by experts and both depend on the
effect of energy and labor reforms.
The available information is from public institutions: Ministry of Health (Secretaría de Salud, SS[3],
[8], [9], [11]), National Population Council (Consejo Nacional de Población, CONAPO[12]), Mexican Institute
of Social Security (Instituto Mexicano del Seguro Social, IMSS[4], [6], [7]), National Institute of Statistics and
Geography (Instituto Nacional de Estadística y Geografía, INEGI[10]) and private: Mexican Association of
Insurance Institutions (AMIS) and hospitals.
Population projections by CONAPO whose methodology appears on the official website[12] and decadal cohort
of number of patients and unit costs for some diseases IMSS beneficiaries were used[6], [7]. IMSS information
is not showed by age group neither sex (patients in treatment). New cases information appears since 1980 up to
1990 by big age group and sex and 1991-2011 by age group. Deceased people by HD is presented by age and
sex.
The cost of this disease is high for its treatment and its duration. As insured persons by IMSS represent
40% of the population, IMSS data are taken as sampling. The Mexican health system (SS) covers the following
institutions: IMSS, Institute for Social Security and Services for State Workers (Instituto de Seguridad y
Servicios Sociales de los Trabajadores del Estado, ISSSTE), Popular Insurance (Seguro Popular, SP-IMSS), Oil
Company (Petróleos Mexicanos, PEMEX), Ministry of Defense (Secretaría de la Defensa Nacional, SEDENA),
Ministry of Navy (Secretaría de Marina, SEMAR), private institutions and other public institutions, so the
numbers of deaths and new cases are representative of the population.
II. METHODOLOGY The proposed model is stochastic[2] with entrance, in treatment and death probabilities by HD, population,
number of patients and unitary cost at time t by age group and sex (stock).
The probabilities are calculated for each year, t, as
Longitudinal Analysis and Prospective of Medical Cost for Hypertensive Diseases: Case of Mexico
International organization of Scientific Research 12 | P a g e
Pr(death; age; sex; t)= (# death by the disease(age; sex; t))/(# death by the disease(age; sex; t)) (1)
Pr(new cases; age; sex; t)= (# new cases or #detected disease(age; sex; t))/(# death by the disease(age; sex; t))
(2)
Pr(+1; age; sex; t)= (# death by the disease(age; sex; t)# permanence or #people who have survived the disease
one more year(age; sex; t))/(# death by the disease(age; sex; t)) (3)
The model diagram is showed in Figure 1. Several considerations must be taken by each patient’s condition.
Deaths. It works with the records of the SS with respect to age, sex and cause key, excluding unspecified. It has
the historical 1990 to 2011. Curve fitting are applied to these data by ordinary least-squares (OLS) after the
transformation of equation (4). In most cases it is the exponential. The growth rates are denoted as λ´s.
Prospective is constructed following behavior given these rates, for 2012-2050 taken as input data 2011.
The correlation coefficient of curve fitting are showed in Table 1.
deatht= death0eλt ⇒ Ln(deatht )=Ln(death0e
λt )=Ln(death0 )+ λt (4)
The equation (1) is calculated using both prospective, the population and the exponential behavior of
deaths by HD. This latter based on the high correlation coefficients by age group and sex shown in Table 1.
Behavior of deaths was analyzed. The age groups 40+ showed an exceptional exponential behavior with
correlation coefficients greater than 92% for female and 94% for male.
New cases. From the database of the SS tables of major diseases are obtained by age group (<1, 1-4, 5-9, 10-14,
15-19, 20-24, 25-44, 45-49, 50-59, 60-65 & 65+). Information was obtained from 1990-2011 data which its
trend behavior and basic statistics (mean and standard deviation) was analyzed. In case non-trend was chosen to
simulate an exponential growth between the extreme values for the entire period. As a base scenario was chosen
the trend values as first option and minimum among all the options as second choice.
The equation (2) is calculated using both prospective, the population and the exponential behavior of new cases
by HD.
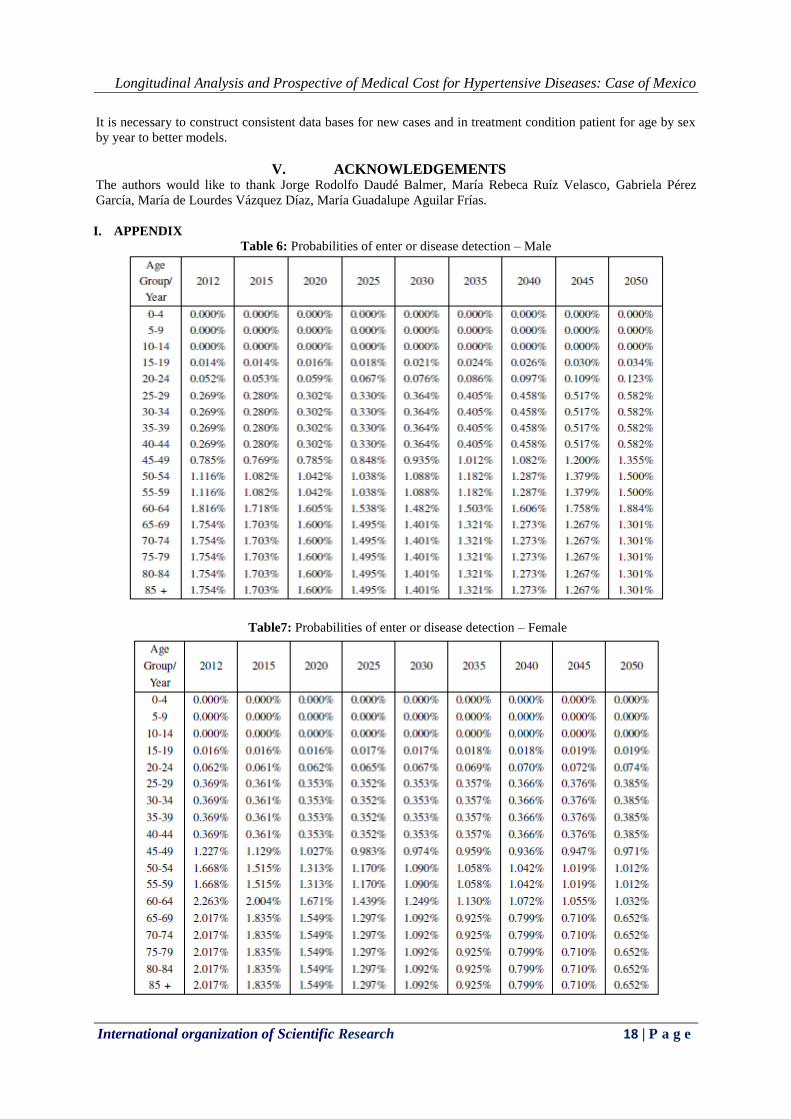
For new cases exhibit this behavior with correlations of 25% for women and 83.39% for men in
general. The probabilities of entrance, in treatment and death to HD are dynamics and they are different in each
stage. Their dynamic changes are gotten by LSO. Table of these dynamic changes by age group are shown in the
appendix.
In treatment. IMSS data were used to rebuild the intermediate years. The method Runge-Kuta was applied to
the exponential growth rates per period. Then data were redistributed according to death rates of SS for age
groups. Subsequently normalized with respect to the prospective of the IMSS. The initial value is the amount of
the average proportion of deaths[1] by age group by sex (2003-2011) multiplied by the number of patients
treated according to IMSS prospective.
Data from 2011 patients in treatment are obtained by extrapolating the values of 2012 compared to
exponential growth rates (2012-2020) of its prospective. The cases of initial values are the maximum, minimum
and average in the period. After these are distributed by age and sex as mentioned in the previous paragraph.
The equation (3) is calculated using both prospective, the population and the exponential behavior of in
treatment patients by HD. As the number of in treatment patients are IMSS data (sample), these were analyzed
and calculated their behavior and prospective of both beneficiaries of the IMSS and beneficiaries who have
survived the disease one more year. Latter, the probabilities by age group by sex by each year were gotten
applying equation (3). After, these probabilities were input to make inference to population.
Redistribution by age group (2012-2050) can be calculated using standard growth rates (about the death)
following the general prospective IMSS or initial value using any of the three values obtained from the ratios of
deaths by group age by sex by disease (1990-2012): average, maximum or minimum. And from the initial value
to apply the before mentioned growth rates. The scenarios I, II and III use the average, maximum and minimal
values as initial value (2011), respectively.
Longitudinal Analysis and Prospective of Medical Cost for Hypertensive Diseases: Case of Mexico
International organization of Scientific Research 13 | P a g e
Figure 1: Schematic model. Started CONAPO population projections estimated population with hypertensive
diseases, new cases and dying from this disease from 2012 to 2050.
Table 1: Correlation coefficients for exponential behavior (Death)
2.1 Gross Domestic Product scenarios: Basis, optimal and worse.
Base Scenario. Quarterly gross domestic product (GDP) data since 1996-I up to 2012-IV current prices are
applied to AR(2)MA(2) model (Eq. (5)). Adjusted data are deflated to base year 2012.