Roland Götz Long Long Long Long-Term Term Term Term and and and and Medium Medium Medium Medium-Term Problems Term Problems Term Problems Term Problems and and and and Perspectives Perspectives Perspectives Perspectives of the of the of the of the Russian Economy Russian Economy Russian Economy Russian Economy FG 5, 2005/05, June 2005 Working paper Research Unit Russia/CIS Stiftung Wissenschaft und Politik German Institute for International and Security Affairs Working papers are papers in the subject area of a Research Unit which are not officially published by SWP. These papers are either preliminary studies that later become papers published by SWP or papers that are published elsewhere. Your comments are always welcome.
Transcript
Roland Götz
LongLongLongLong----Term Term Term Term and and and and MediumMediumMediumMedium----Term Problems Term Problems Term Problems Term Problems and and and and Perspectives Perspectives Perspectives Perspectives of the of the of the of the Russian EconomyRussian EconomyRussian EconomyRussian Economy FG 5, 2005/05, June 2005
Working paper Research Unit Russia/CIS Stiftung Wissenschaft und Politik German Institute for International and Security Affairs Working papers are papers in the subject area of a Research Unit which are not officially published by SWP. These papers are either preliminary studies that later become papers published by SWP or papers that are published elsewhere. Your comments are always welcome.
LONG-TERM AND MEDIUM-TERM PROBLEMS AND PERSPECTIVES OF THE RUSSIAN ECONOMY
Roland Götz
Introduction The aim of this text is to discuss the main economic problems and challenges facing the Russian economy � that is, the problems of Russian economic security � in a long-term and a medium-term perspective. In the medium term � approximately in the period 2005�2020 � some fundamental shortcomings of the present Russian economy are likely to lead either to economic crises or at the very least to disappointment with the course of economic development among large sections of Russian society.
Long-term economic problems There are some problems which will threaten Russia�s economic security in the long run. The three gravest are ecological problems, the depletion of energy resources and negative demographic development.
Ecological problems Environmental problems are one of the painful legacies of the Soviet era, when the ideology of economic growth dominated ecological considerations. Since 1990 economic decline and the closing down of most of the heavy industries have reduced pollution, but the same fundamental disregard of environmental concerns persists. Approximately 60 million Russians live in environmentally hazardous conditions and 250,000 people die prematurely every year from health problems caused by environmental conditions. In 1999, air quality in 120 cities was recorded to be less than one-fifth Russian standards.1
The fuel and energy sector is the main source of environmental degradation in Russia. It releases 70 per cent of total greenhouse gas emissions. Pipeline leaks alone generate some 35 millions tonnesmetric tonnes of methane emissions alone each year. Over 3.5 billion cubic metres (bcm) of natural gas are burned annually on the oilfields. Untreated waste water with oil and other contaminants is discharged into natural depressions in the landscape rather than into dumps. The negative environmental impacts that are typical for oil and gas extraction are multiplied in Russia by the use of outdated equipment, bad operational practices, and lack of control over activities in remote oil- and gas-producing regions.2
Economic security is affected indirectly by the repercussions of a deterioriation in health on the numbers and quality of the labour force. On the other hand, concern about the environmental impact of industrial projects can obviously hinder growth in these sectors. A reorientation of economic policy in favour of ecological concerns will
1 Data of the former Russian State Committee for Environmental Protection (Goskomekologii), cited in US Energy Information Administration, ‘Country analysis briefs: Russia, Environmental issues’, August 2001 (http://www.eia.doe.gov/emeu/cabs/russia.html). 2 Baranova, Irina, ‘Leaking operations’, CEE Bankwatch Network, 2001 (http://www.bankwatch.org/ downloads/ leakingoperations.pdf).
4
demand a longer process of rethinking and therefore cannot be expected to occur in the short or medium term.
Depletion of energy resources The question of depletion will be treated here only with regard to energy resources. At first sight, Russia�s energy resources are vast and the possibility of their running out should be only a question of the very distant future. The giant and scarcely touched Siberian coal reserves will last for hundreds of years. The remaining oil reserves of Russia are in the range of 100�150 gigabarrels (Gb) and are larger than those of Iraq or Iran.3 Gas reserves are 47 trillion cubic metres (tcm) by official data, or 18�20 tcm if only the economically feasible reserves are counted.4 They are on the same scale as the gas reserves of Iran. However, even in Soviet times energy was �the story of a paradox� and a synonym for �crisis amid plenty�.5 The Soviet Union was the only major industrial country to be fully self-sufficient in energy while at the same time being constantly threatened with shortages and bottlenecks, which it could only prevent through massive capital investment in the energy sector. The fall in industrial production after the beginning of economic transformation and the corresponding fall of demand for energy for some time only disguised the inherent problems of the energy sector.
Following a Russian long-term forecast, oil and gas production will increase until 2020�2030 and then decrease because of deterioration of the reserves. According to these projections, oil production in Russia will peak at 370�375 million tonnes per year in 2010�2020 and then decrease to about 310 million tonnes per year in 2030.6 In 2060 oil production will reach 210�215 million tonnes per year and by then will therefore hardly meet internal demand. This means that in the second half of the century Russia will become an oil-importing country if the current structure of energy demand and economic growth persists.
The maintenance of gas production and the growth of production during the period until 2030 will depend on major investments being made in the development of infrastructure and the transport network from remote fields. Under the most optimistic scenario, in 2030 gas production will peak at a level of 830�840 bcm per year, including 650�660 bcm of onshore gas and 180 bcm of offshore gas. After 2030, it will decrease. Following this forecast, in 2075 gas production will reach about 550 bcm per year, an amount hardly sufficient for internal demand, if the present structure of energy consumption persists.
Provided that internal energy consumption does not decrease sharply, Russia will have to stop oil and gas exports in the second half of the century, and later it will have to switch to renewable energy sources to satisfy its energy demand.
3 Campbell, Colin J. et al., Ölwechsel! Das Ende des Erdölzeitalters und die Weichenstellung für die Zukunft [The end of the oil age and the position of points for the future], Munich: DTV, 2002. Here the official Russian data concerning oil reserves are corrected upwards. 4 von Hirschhausen, Christian, ‘Modernising infrastructure in transition economies’, Cheltenham: Edward Elgar, 2002. 5 Gustafson, Thane, Crisis Amid Plenty: The Politics of Soviet Energy Under Brezhnev and Gorbachev, Princeton, N.J.: Princeton University Press, 1989. 6 Gritsenko, Aleksandr, Nikolai Krylov, Victor Alenin and Vasily Stupakov, ‘Oil and Gas of Russia in the XXI century: Forecast of production and development of the resource base’, Mineral Resources of Russia, 3, 2001 (http://www.geoinform.ru/english/mrr.files/issues/3-2001.html).
5
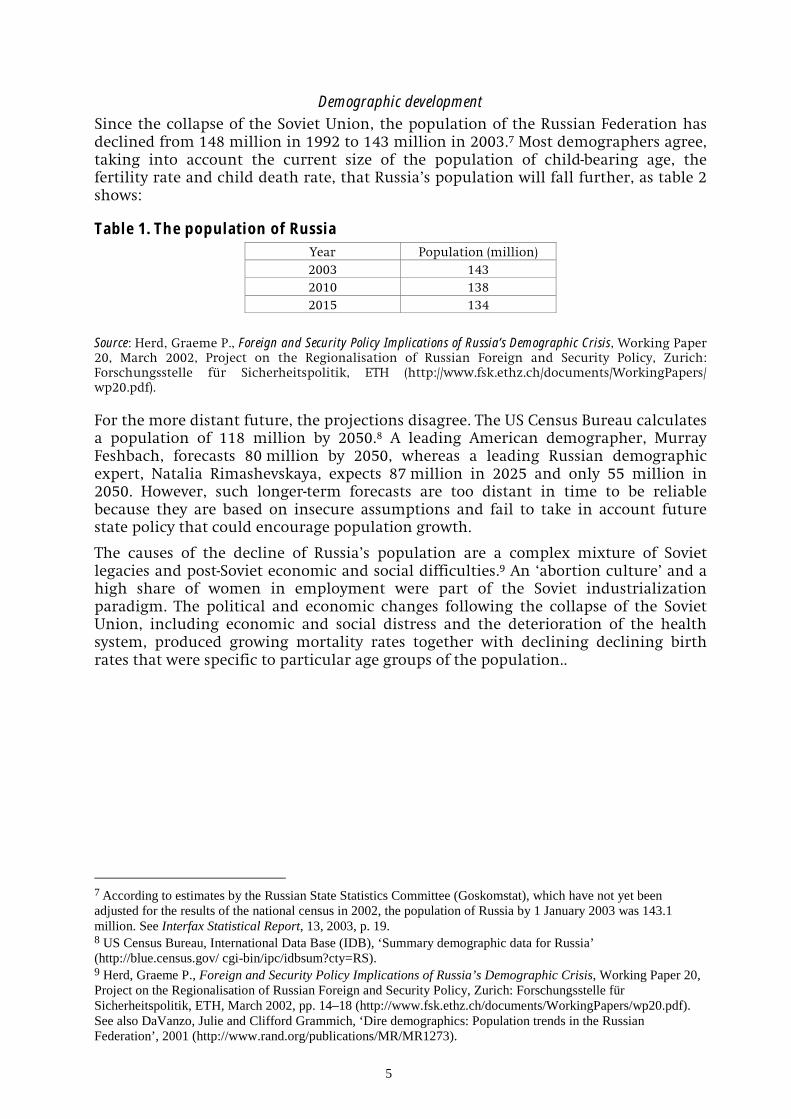
Demographic development Since the collapse of the Soviet Union, the population of the Russian Federation has declined from 148 million in 1992 to 143 million in 2003.7 Most demographers agree, taking into account the current size of the population of child-bearing age, the fertility rate and child death rate, that Russia�s population will fall further, as table 2 shows:
Table 1. The population of Russia Year Population (million) 2003 143 2010 138 2015 134
Source: Herd, Graeme P., Foreign and Security Policy Implications of Russia’s Demographic Crisis, Working Paper 20, March 2002, Project on the Regionalisation of Russian Foreign and Security Policy, Zurich: Forschungsstelle für Sicherheitspolitik, ETH (http://www.fsk.ethz.ch/documents/WorkingPapers/ wp20.pdf). For the more distant future, the projections disagree. The US Census Bureau calculates a population of 118 million by 2050.8 A leading American demographer, Murray Feshbach, forecasts 80 million by 2050, whereas a leading Russian demographic expert, Natalia Rimashevskaya, expects 87 million in 2025 and only 55 million in 2050. However, such longer-term forecasts are too distant in time to be reliable because they are based on insecure assumptions and fail to take in account future state policy that could encourage population growth.
The causes of the decline of Russia�s population are a complex mixture of Soviet legacies and post-Soviet economic and social difficulties.9 An �abortion culture� and a high share of women in employment were part of the Soviet industrialization paradigm. The political and economic changes following the collapse of the Soviet Union, including economic and social distress and the deterioration of the health system, produced growing mortality rates together with declining declining birth rates that were specific to particular age groups of the population..
7 According to estimates by the Russian State Statistics Committee (Goskomstat), which have not yet been adjusted for the results of the national census in 2002, the population of Russia by 1 January 2003 was 143.1 million. See Interfax Statistical Report, 13, 2003, p. 19. 8 US Census Bureau, International Data Base (IDB), ‘Summary demographic data for Russia’ (http://blue.census.gov/ cgi-bin/ipc/idbsum?cty=RS). 9 Herd, Graeme P., Foreign and Security Policy Implications of Russia’s Demographic Crisis, Working Paper 20, Project on the Regionalisation of Russian Foreign and Security Policy, Zurich: Forschungsstelle für Sicherheitspolitik, ETH, March 2002, pp. 14–18 (http://www.fsk.ethz.ch/documents/WorkingPapers/wp20.pdf). See also DaVanzo, Julie and Clifford Grammich, ‘Dire demographics: Population trends in the Russian Federation’, 2001 (http://www.rand.org/publications/MR/MR1273).
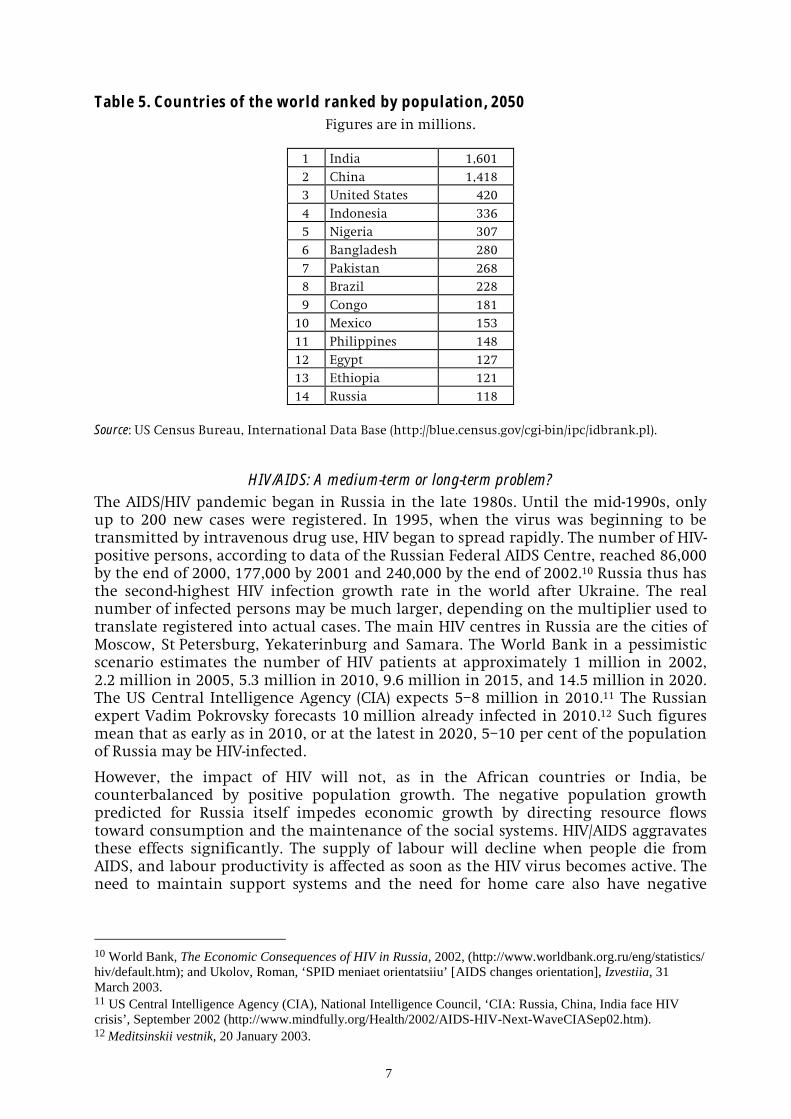
Source: Statistical Yearbook of Russia, 2001, Part 5; and Interfax Statistical Report, 13, 2003, p. 19. The implications of the demographic problems are widespread. Above all the fall in the proportion of the population that is working cannot but have repercussions on economic growth. Thus, in the long run the labour supply will become one of the limiting factors of Russian economic development, while in the short- and medium-term perspective the labour force of Russia is a reservoir of growth and development. The population decline is also important in a geopolitical context and it affects military security. As data of the US Census Bureau also show, Russia will gradually lose its place in the first dozen population-rich countries (see tables 4, 5 and 6).
Table 3. Countries of the world ranked by population, 2003 Figures are in millions.
1 China 1,287 2 India 1,050 3 United States 290 4 Indonesia 235 5 Brazil 182 6 Pakistan 150 7 Russia 144
Source: US Census Bureau, International Data Base (http://blue.census.gov/cgi-bin/ipc/idbrank.pl).
Table 4. Countries of the world ranked by population, 2020 Figures are in millions.
1 China 1,424 2 India 1,297 3 United States 336 4 Indonesia 288 5 Brazil 212 6 Pakistan 200 7 Bangladesh 190 8 Nigeria 189 9 Russia 139
Source: US Census Bureau, International Data Base (http://blue.census.gov/cgi-bin/ipc/idbrank.pl).
7
Table 5. Countries of the world ranked by population, 2050 Figures are in millions.
1 India 1,601 2 China 1,418 3 United States 420 4 Indonesia 336 5 Nigeria 307 6 Bangladesh 280 7 Pakistan 268 8 Brazil 228 9 Congo 181
Source: US Census Bureau, International Data Base (http://blue.census.gov/cgi-bin/ipc/idbrank.pl).
HIV/AIDS: A medium-term or long-term problem? The AIDS/HIV pandemic began in Russia in the late 1980s. Until the mid-1990s, only up to 200 new cases were registered. In 1995, when the virus was beginning to be transmitted by intravenous drug use, HIV began to spread rapidly. The number of HIV-positive persons, according to data of the Russian Federal AIDS Centre, reached 86,000 by the end of 2000, 177,000 by 2001 and 240,000 by the end of 2002.10 Russia thus has the second-highest HIV infection growth rate in the world after Ukraine. The real number of infected persons may be much larger, depending on the multiplier used to translate registered into actual cases. The main HIV centres in Russia are the cities of Moscow, St Petersburg, Yekaterinburg and Samara. The World Bank in a pessimistic scenario estimates the number of HIV patients at approximately 1 million in 2002, 2.2 million in 2005, 5.3 million in 2010, 9.6 million in 2015, and 14.5 million in 2020. The US Central Intelligence Agency (CIA) expects 5�8 million in 2010.11 The Russian expert Vadim Pokrovsky forecasts 10 million already infected in 2010.12 Such figures mean that as early as in 2010, or at the latest in 2020, 5�10 per cent of the population of Russia may be HIV-infected.
However, the impact of HIV will not, as in the African countries or India, be counterbalanced by positive population growth. The negative population growth predicted for Russia itself impedes economic growth by directing resource flows toward consumption and the maintenance of the social systems. HIV/AIDS aggravates these effects significantly. The supply of labour will decline when people die from AIDS, and labour productivity is affected as soon as the HIV virus becomes active. The need to maintain support systems and the need for home care also have negative
10 World Bank, The Economic Consequences of HIV in Russia, 2002, (http://www.worldbank.org.ru/eng/statistics/ hiv/default.htm); and Ukolov, Roman, ‘SPID meniaet orientatsiiu’ [AIDS changes orientation], Izvestiia, 31 March 2003. 11 US Central Intelligence Agency (CIA), National Intelligence Council, ‘CIA: Russia, China, India face HIV crisis’, September 2002 (http://www.mindfully.org/Health/2002/AIDS-HIV-Next-WaveCIASep02.htm). 12 Meditsinskii vestnik, 20 January 2003.
8
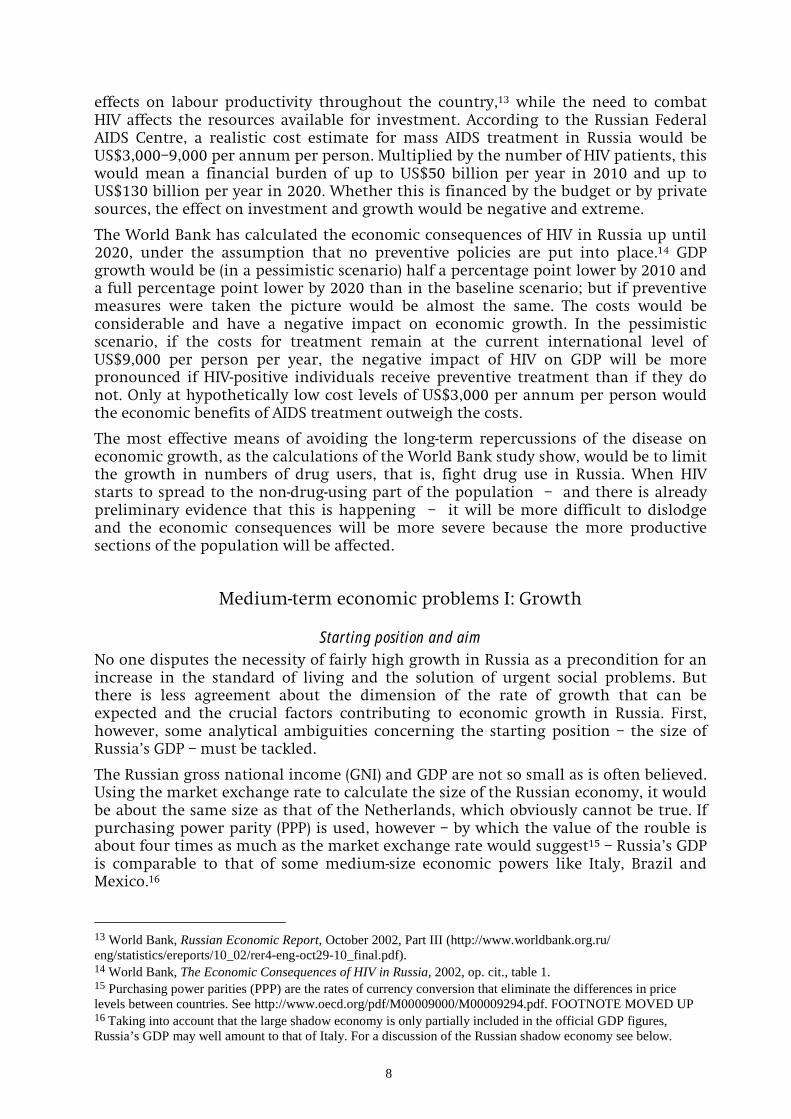
effects on labour productivity throughout the country,13 while the need to combat HIV affects the resources available for investment. According to the Russian Federal AIDS Centre, a realistic cost estimate for mass AIDS treatment in Russia would be US$3,000�9,000 per annum per person. Multiplied by the number of HIV patients, this would mean a financial burden of up to US$50 billion per year in 2010 and up to US$130 billion per year in 2020. Whether this is financed by the budget or by private sources, the effect on investment and growth would be negative and extreme.
The World Bank has calculated the economic consequences of HIV in Russia up until 2020, under the assumption that no preventive policies are put into place.14 GDP growth would be (in a pessimistic scenario) half a percentage point lower by 2010 and a full percentage point lower by 2020 than in the baseline scenario; but if preventive measures were taken the picture would be almost the same. The costs would be considerable and have a negative impact on economic growth. In the pessimistic scenario, if the costs for treatment remain at the current international level of US$9,000 per person per year, the negative impact of HIV on GDP will be more pronounced if HIV-positive individuals receive preventive treatment than if they do not. Only at hypothetically low cost levels of US$3,000 per annum per person would the economic benefits of AIDS treatment outweigh the costs.
The most effective means of avoiding the long-term repercussions of the disease on economic growth, as the calculations of the World Bank study show, would be to limit the growth in numbers of drug users, that is, fight drug use in Russia. When HIV starts to spread to the non-drug-using part of the population � and there is already preliminary evidence that this is happening � it will be more difficult to dislodge and the economic consequences will be more severe because the more productive sections of the population will be affected.
Medium-term economic problems I: Growth
Starting position and aim No one disputes the necessity of fairly high growth in Russia as a precondition for an increase in the standard of living and the solution of urgent social problems. But there is less agreement about the dimension of the rate of growth that can be expected and the crucial factors contributing to economic growth in Russia. First, however, some analytical ambiguities concerning the starting position � the size of Russia�s GDP � must be tackled.
The Russian gross national income (GNI) and GDP are not so small as is often believed. Using the market exchange rate to calculate the size of the Russian economy, it would be about the same size as that of the Netherlands, which obviously cannot be true. If purchasing power parity (PPP) is used, however � by which the value of the rouble is about four times as much as the market exchange rate would suggest15 � Russia�s GDP is comparable to that of some medium-size economic powers like Italy, Brazil and Mexico.16
13 World Bank, Russian Economic Report, October 2002, Part III (http://www.worldbank.org.ru/ eng/statistics/ereports/10_02/rer4-eng-oct29-10_final.pdf). 14 World Bank, The Economic Consequences of HIV in Russia, 2002, op. cit., table 1. 15 Purchasing power parities (PPP) are the rates of currency conversion that eliminate the differences in price levels between countries. See http://www.oecd.org/pdf/M00009000/M00009294.pdf. FOOTNOTE MOVED UP 16 Taking into account that the large shadow economy is only partially included in the official GDP figures, Russia’s GDP may well amount to that of Italy. For a discussion of the Russian shadow economy see below.
9
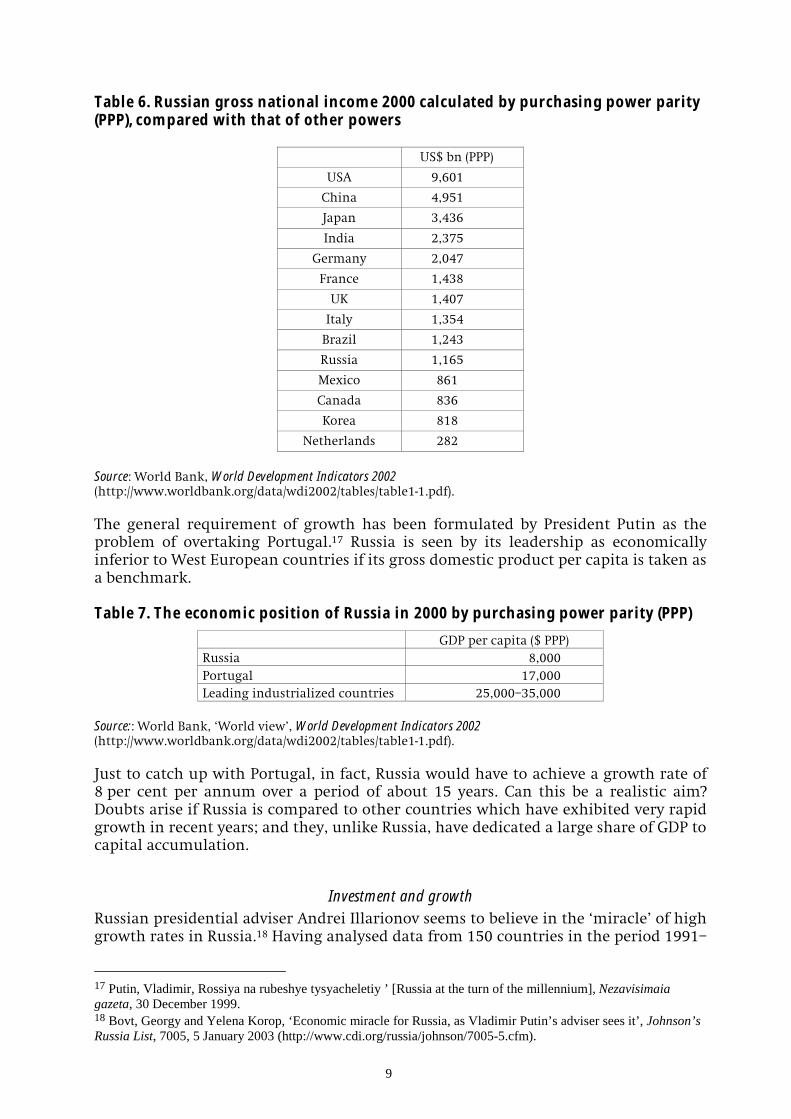
Table 6. Russian gross national income 2000 calculated by purchasing power parity (PPP), compared with that of other powers
US$ bn (PPP)
USA 9,601
China 4,951
Japan 3,436
India 2,375
Germany 2,047
France 1,438
UK 1,407
Italy 1,354
Brazil 1,243
Russia 1,165
Mexico 861
Canada 836
Korea 818
Netherlands 282
Source: World Bank, World Development Indicators 2002 (http://www.worldbank.org/data/wdi2002/tables/table1-1.pdf). The general requirement of growth has been formulated by President Putin as the problem of overtaking Portugal.17 Russia is seen by its leadership as economically inferior to West European countries if its gross domestic product per capita is taken as a benchmark. Table 7. The economic position of Russia in 2000 by purchasing power parity (PPP)
GDP per capita ($ PPP) Russia 8,000 Portugal 17,000 Leading industrialized countries 25,000�35,000
Source:: World Bank, �World view�, World Development Indicators 2002 (http://www.worldbank.org/data/wdi2002/tables/table1-1.pdf). Just to catch up with Portugal, in fact, Russia would have to achieve a growth rate of 8 per cent per annum over a period of about 15 years. Can this be a realistic aim? Doubts arise if Russia is compared to other countries which have exhibited very rapid growth in recent years; and they, unlike Russia, have dedicated a large share of GDP to capital accumulation.
Investment and growth Russian presidential adviser Andrei Illarionov seems to believe in the �miracle� of high growth rates in Russia.18 Having analysed data from 150 countries in the period 1991�
17 Putin, Vladimir, Rossiya na rubeshye tysyacheletiy ’ [Russia at the turn of the millennium], Nezavisimaia gazeta, 30 December 1999. 18 Bovt, Georgy and Yelena Korop, ‘Economic miracle for Russia, as Vladimir Putin’s adviser sees it’, Johnson’s Russia List, 7005, 5 January 2003 (http://www.cdi.org/russia/johnson/7005-5.cfm).
10
2001, he found that only the size of the public sector was responsible for high or low growth. At the same time, Illarionov failed to discover any consistent statistical linkage between economic growth and factors such as capital investment. By contrast, most students of the Russian economy believe that capital accumulation and the institutional setting are very important, if not the most important, determinants of growth in the country�s production potential. This point of view is corroborated by recent studies of the medium-term prospects of the Russian economy. Some of them are overly optimistic, but all underline the crucial role of capital accumulation.
Thus, the Moscow branch of the World Bank, in its positive scenario of Russian economic development, expects an average growth rate of the Russian economy of 5.2 per cent per year in the period 2002�2010.19 The positive scenario assumes an oil price of US$23 per barrel, continued implementation of reforms and a 17 per cent increase (!) in annual investment. At least the latter assumption seems to be highly unrealistic.
The International Monetary Fund (IMF), in a publication of April 2002, tried to show that Russia could achieve GDP growth of 5�6 per cent per year in the period 2005�2020 provided it could achieve an investment rate of 26 per cent of GDP and a fairly high growth rate of total factor productivity (TFP).20 However, the assumptions under-lying these calculations give rise to doubt. Above all the assumption concerning the contribution of technological progress to growth � a growth rate of TFP in the range of 4 per cent per year � seems to be over-optimistic. Because this factor alone determines the result of the growth calculations by 70 per cent, the IMF calculations have a rather arbitrary character. Apart from this the second assumption � an investment rate of 26 per cent � is just as optimistic (see the table below).
A team at the Bank of Finland�s Institute for Economies in Transition (BOFIT) has calculated Russia�s expected long-term per capita GDP growth rate by using parameter values of econometric research and applying them to Russia.21 In accordance with the growth literature they took into account as independent variables (a) initial per capita GDP, which is negatively correlated with growth, as initially poorer countries tend to grow faster; (b) the secondary school enrolment rate, which is positively correlated with growth; and (c) the capital investment ratio, which is also positively correlated with growth. Thus, the growth rate per capita can be estimated for different assumed investment ratios, which according to the study can be interpreted as a proxy for economic reforms, protection of property rights, political stability and attitudes to foreign investment.
Table 8. Rates of growth of the Russian economy at different rates of investment
Per capita GDP growth Share of investment in GDP 2.0% Pessimistic assumption: 15% 3.0% Baseline assumption: 21% 4.7% Optimistic assumption: 30%
Source Komulainen, Tuomas et al., �Russia: Growth prospects and policy debates�, Bofit Online, March 2003 (http://www.bof.fi/bofit/fin/7online/03abs/03pdf/bon0303.pdf)
19 World Bank Group in Russia, Russian Economic Report, May 2002 (http://www.worldbank.org.ru/ eng/statistics/ereports/05_02/RER3-English-05-30-02.pdf). 20 International Monetary Fund (IMF), ‘Russian Federation: Selected issues and statistical appendix’, IMF Country Report 02/75, April 2002 (http://www.imf.org/external/pubs/ ft/scr/2002/ cr0275.pdf), pp. 82–6. 21 Komulainen, Tuomas et al., ‘Russia: Growth prospects and policy debates’, Bofit online, 3, 2003 (http://www.bof.fi/bofit/fin/7online/03abs/03pdf/bon0303.pdf). The source of the parameter values was Levine, Ross and David Renelt, ‘A sensitivity analysis of cross-country growth regressions’, American Economic Review, 1992.
11
The conclusion of the Finnish study is that �Russia can only achieve high growth if investment picks up considerably from its present level.�22 Using a similar econometric approach, a team from Deutsche Bank Research supplemented the factors affecting the growth potential by an explicit indicator for the quality of institutional conditions.23 This approach catches an important aspect of Russian reality: since 2000 some institutional reforms have been implemented, for instance tax reform and land reform, but other important reforms are still lacking, in particular in the energy, housing and municipal sectors. The Deutsche Bank study, using an econometric specification by Ali and Crain as well as data of the Fraser Institute, yielded the following estimates for 2010 as shown in table 10.24
Table 10. Russia in 2010 under different scenarios GDP growth per capita Investment/GDP Institutional quality
Republic 2002) Source: Deutsche Bank Research, 31 March 2003. Both the Finnish and the German research arrive at nearly identical results for the baseline and the optimistic scenario, whereas for the pessimistic case the German research finds an even lower result for GDP growth, presumably influenced by the low institutional quality factor.
It is interesting to note that the assumptions of the pessimistic cases of both studies � but not the resulting growth rate � coincide with the Russian reality in 2002 if the investment share is calculated in purchasing power parity (PPP) terms. This brings us to the peculiarities of the distribution of the Russian GDP valuation..
The real investment share The relative sizes of the components of the Russian GDP are determined by prices, which differ considerably from world market prices. Goods and services destined for state consumption have a low valuation, whereas investment goods are overvalued compared to world market prices. In such cases the calculation of GDP aggregates in terms of purchasing power parities (PPPs) instead of market exchange rates seems to be adequate.25 Table 11 shows the uses to which the Russian GDP is put, calculated in national prices and PPP. If calculated on the basis of PPP, the structure of Russian GDP 22 Kumolainen et al., op. cit, p. 6. 23 Deutsche Bank Research, ‘Russia 2010: It’s a bear, not a bull!’ (http://www.dbresearch.de/PROD/999/ PROD0000000000053432.pdf). 24 The Deutsche Bank group also calculated a ‘chaos scenario’, which is omitted here. 25 By establishing purchasing power equivalence, where one dollar purchases the same quantity of goods and services in all countries, PPP conversions allow cross-country comparisons of economic aggregates on the basis of physical levels of output, free of price and exchange rate distortions. See (http://web.worldbank.org/ WBSITE/EXTERNAL/DATASTATISTICS/ICPEXT/) for further information on the technical aspects of the calculation of PPPs.
12
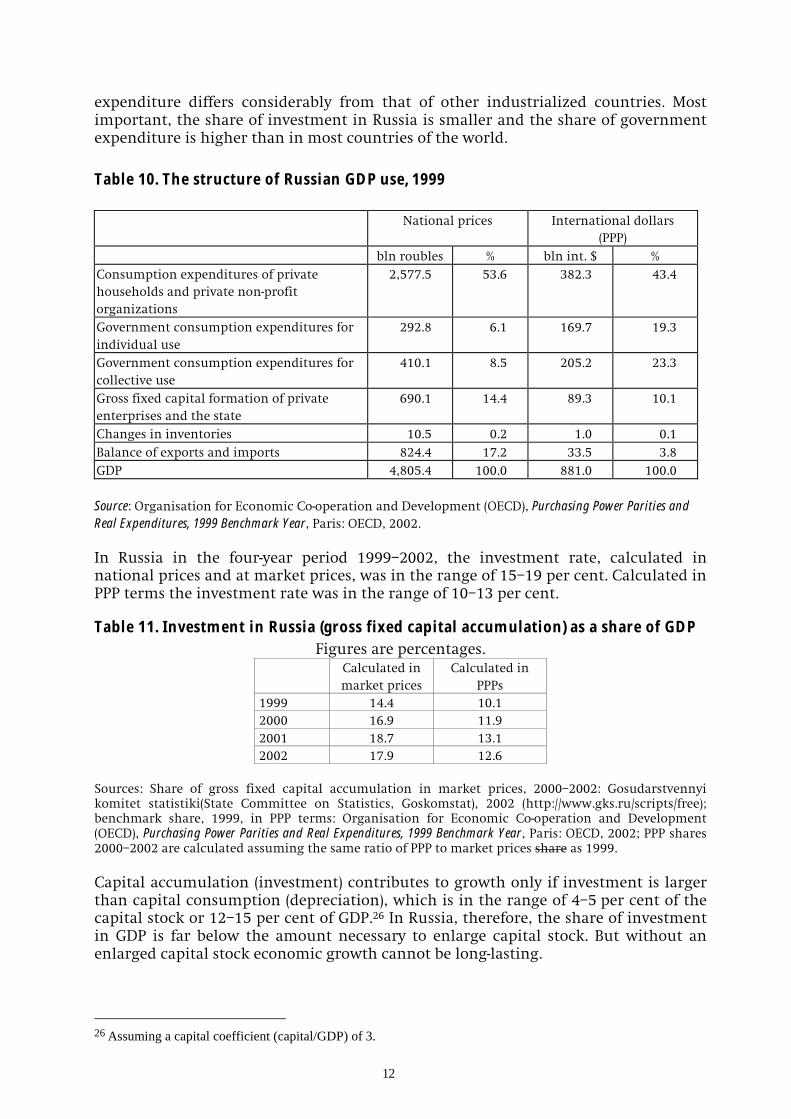
expenditure differs considerably from that of other industrialized countries. Most important, the share of investment in Russia is smaller and the share of government expenditure is higher than in most countries of the world.
Table 10. The structure of Russian GDP use, 1999
National prices International dollars (PPP)
bln roubles % bln int. $ % Consumption expenditures of private households and private non-profit organizations
2,577.5 53.6 382.3 43.4
Government consumption expenditures for individual use
292.8 6.1 169.7 19.3
Government consumption expenditures for collective use
410.1 8.5 205.2 23.3
Gross fixed capital formation of private enterprises and the state
690.1 14.4 89.3 10.1
Changes in inventories 10.5 0.2 1.0 0.1 Balance of exports and imports 824.4 17.2 33.5 3.8 GDP 4,805.4 100.0 881.0 100.0 Source: Organisation for Economic Co-operation and Development (OECD), Purchasing Power Parities and Real Expenditures, 1999 Benchmark Year, Paris: OECD, 2002. In Russia in the four-year period 1999�2002, the investment rate, calculated in national prices and at market prices, was in the range of 15�19 per cent. Calculated in PPP terms the investment rate was in the range of 10�13 per cent.
Table 11. Investment in Russia (gross fixed capital accumulation) as a share of GDP Figures are percentages.
Sources: Share of gross fixed capital accumulation in market prices, 2000�2002: Gosudarstvennyi komitet statistiki(State Committee on Statistics, Goskomstat), 2002 (http://www.gks.ru/scripts/free); benchmark share, 1999, in PPP terms: Organisation for Economic Co-operation and Development (OECD), Purchasing Power Parities and Real Expenditures, 1999 Benchmark Year, Paris: OECD, 2002; PPP shares 2000�2002 are calculated assuming the same ratio of PPP to market prices share as 1999. Capital accumulation (investment) contributes to growth only if investment is larger than capital consumption (depreciation), which is in the range of 4�5 per cent of the capital stock or 12�15 per cent of GDP.26 In Russia, therefore, the share of investment in GDP is far below the amount necessary to enlarge capital stock. But without an enlarged capital stock economic growth cannot be long-lasting.
26 Assuming a capital coefficient (capital/GDP) of 3.
13
Growth potential under different assumptions As country studies and econometric studies show, high rates of economic growth are often correlated with high rates of investment, although these studies cannot answer the questions of causality.27 It is not at all clear whether high investment induces high economic growth or whether high growth induces high investment, or which other factors affect both. Under these restrictions, the method of �growth accounting� makes it possible to calculate the contributions of capital accumulation, labour input and technological progress to economic growth.28 Capital accumulation alone can explain only less than half of economic growth, which is founded significantly on technological progress or the growth of TFP. What creates TFP growth and how big it can be expected to be in the future is an unresolved question.
Growth accounting depicts the growth rate of production as a function of the growth rates of:
� technological progress; � capital stock; and � labour input.
Capital stock growth can be formulated as a function of investment or the share of investment in GDP, which in the Russian case is actually very modest and will probably remain below 20 per cent in the next few years. Labour growth in Russia will probably become negative as a result of the decreasing population. So, labour will not be a driving force of economic growth in the medium-term future, if only quantities are taken into account. The possible improvement in labour quality can be captured by the productivity or technological progress component. Technological progress in the sense of total factor productivity (TFP) is a very artificial concept.29 It is difficult to predict the future increase of TFP in Russia and any predictions will be highly uncertain. In the past, in different countries very different values of TFP have been observed, varying from 1 per cent to 6 per cent per year. A realistic estimate of the growth rate of technological progress in Russia possibly will be in the range of 2�3 per cent per year.
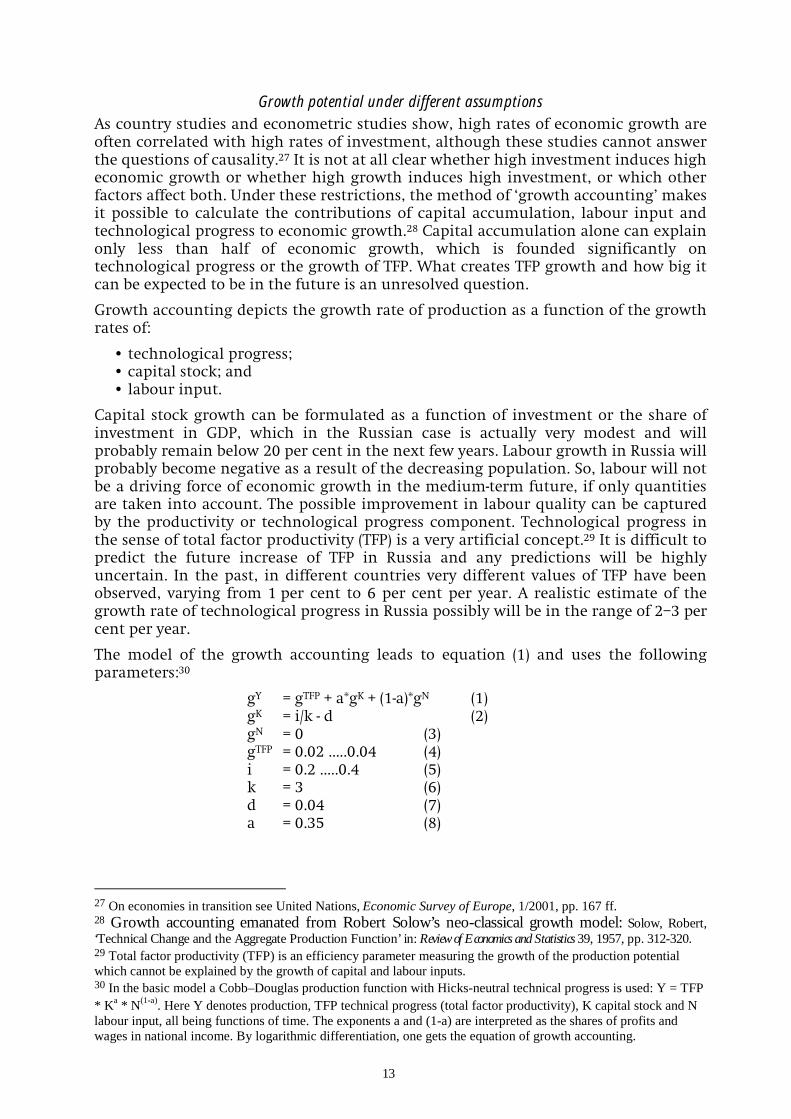
The model of the growth accounting leads to equation (1) and uses the following parameters:30
gY = gTFP + a*gK + (1-a)*gN (1) gK = i/k - d (2) gN = 0 (3) gTFP = 0.02 .....0.04 (4) i = 0.2 .....0.4 (5) k = 3 (6) d = 0.04 (7) a = 0.35 (8)
27 On economies in transition see United Nations, Economic Survey of Europe, 1/2001, pp. 167 ff. 28 Growth accounting emanated from Robert Solow’s neo-classical growth model: Solow, Robert, ‘Technical Change and the Aggregate Production Function’ in: Review of Economics and Statistics 39, 1957, pp. 312-320. 29 Total factor productivity (TFP) is an efficiency parameter measuring the growth of the production potential which cannot be explained by the growth of capital and labour inputs. 30 In the basic model a Cobb–Douglas production function with Hicks-neutral technical progress is used: Y = TFP * Ka * N(1-a). Here Y denotes production, TFP technical progress (total factor productivity), K capital stock and N labour input, all being functions of time. The exponents a and (1-a) are interpreted as the shares of profits and wages in national income. By logarithmic differentiation, one gets the equation of growth accounting.
14
Equation (1) defines the growth rate of the potential production � gY � as the sum of the growth rates of TFP gTFP, the capital stock gK , multiplied by the profit share a, and the labour force gN, multiplied by the labour share (1-a). Equation (2) is a tautological relationship between the growth rate of the capital stock, the investment share i, the capital coefficient k and the rate of depreciation d.31
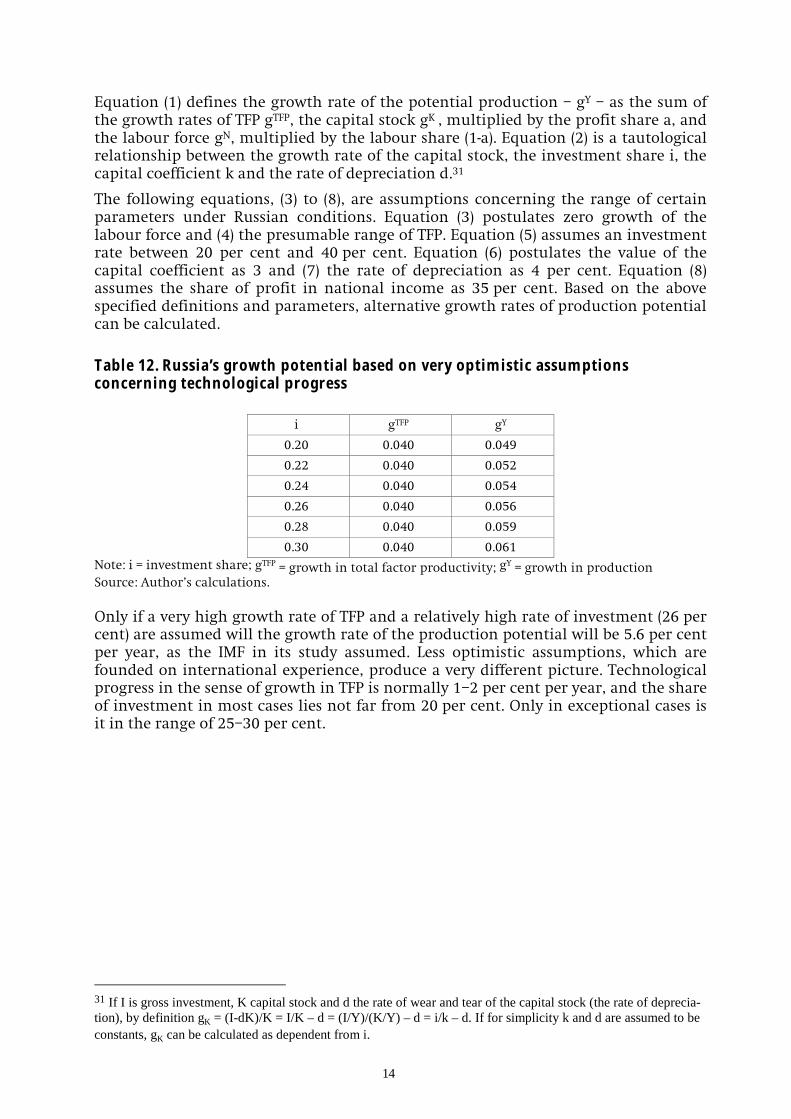
The following equations, (3) to (8), are assumptions concerning the range of certain parameters under Russian conditions. Equation (3) postulates zero growth of the labour force and (4) the presumable range of TFP. Equation (5) assumes an investment rate between 20 per cent and 40 per cent. Equation (6) postulates the value of the capital coefficient as 3 and (7) the rate of depreciation as 4 per cent. Equation (8) assumes the share of profit in national income as 35 per cent. Based on the above specified definitions and parameters, alternative growth rates of production potential can be calculated.
Table 12. Russia’s growth potential based on very optimistic assumptions concerning technological progress
i gTFP gY
0.20 0.040 0.049
0.22 0.040 0.052
0.24 0.040 0.054
0.26 0.040 0.056
0.28 0.040 0.059
0.30 0.040 0.061 Note: i = investment share; gTFP = growth in total factor productivity; gY = growth in production Source: Author�s calculations. Only if a very high growth rate of TFP and a relatively high rate of investment (26 per cent) are assumed will the growth rate of the production potential will be 5.6 per cent per year, as the IMF in its study assumed. Less optimistic assumptions, which are founded on international experience, produce a very different picture. Technological progress in the sense of growth in TFP is normally 1�2 per cent per year, and the share of investment in most cases lies not far from 20 per cent. Only in exceptional cases is it in the range of 25�30 per cent.
31 If I is gross investment, K capital stock and d the rate of wear and tear of the capital stock (the rate of deprecia-tion), by definition gK = (I-dK)/K = I/K – d = (I/Y)/(K/Y) – d = i/k – d. If for simplicity k and d are assumed to be constants, gK can be calculated as dependent from i.
15
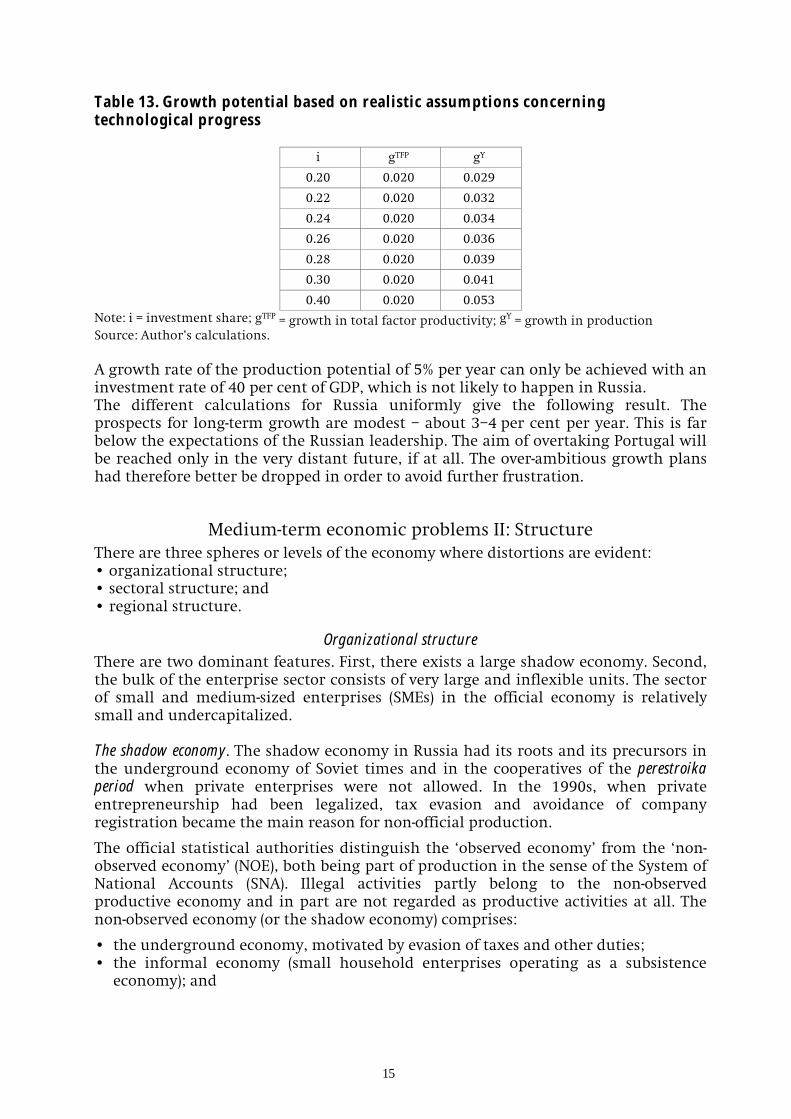
Table 13. Growth potential based on realistic assumptions concerning technological progress
i gTFP gY
0.20 0.020 0.029
0.22 0.020 0.032
0.24 0.020 0.034
0.26 0.020 0.036
0.28 0.020 0.039
0.30 0.020 0.041
0.40 0.020 0.053 Note: i = investment share; gTFP = growth in total factor productivity; gY = growth in production Source: Author�s calculations. A growth rate of the production potential of 5% per year can only be achieved with an investment rate of 40 per cent of GDP, which is not likely to happen in Russia. The different calculations for Russia uniformly give the following result. The prospects for long-term growth are modest � about 3�4 per cent per year. This is far below the expectations of the Russian leadership. The aim of overtaking Portugal will be reached only in the very distant future, if at all. The over-ambitious growth plans had therefore better be dropped in order to avoid further frustration.
Medium-term economic problems II: Structure There are three spheres or levels of the economy where distortions are evident: � organizational structure; � sectoral structure; and � regional structure.
Organizational structure There are two dominant features. First, there exists a large shadow economy. Second, the bulk of the enterprise sector consists of very large and inflexible units. The sector of small and medium-sized enterprises (SMEs) in the official economy is relatively small and undercapitalized. The shadow economy. The shadow economy in Russia had its roots and its precursors in the underground economy of Soviet times and in the cooperatives of the perestroika period when private enterprises were not allowed. In the 1990s, when private entrepreneurship had been legalized, tax evasion and avoidance of company registration became the main reason for non-official production.
The official statistical authorities distinguish the �observed economy� from the �non-observed economy� (NOE), both being part of production in the sense of the System of National Accounts (SNA). Illegal activities partly belong to the non-observed productive economy and in part are not regarded as productive activities at all. The non-observed economy (or the shadow economy) comprises:
� the underground economy, motivated by evasion of taxes and other duties; � the informal economy (small household enterprises operating as a subsistence
economy); and
16
� the illegal economy (the production and distribution of drugs and non-licensed alcohol, smuggling, income from prostitution and bribes, etc.).32
In Russia, the informal economy of small household enterprises does not have the same importance as it does in some developing countries. In contrast, the underground and illegal economies are extensive. The Russian statistical authority Goskomstat (Gosudarstvennyi komitet statistiki, State Committee on Statistics) includes the underground economy, but not the illegal economy, in its calculations of GDP: the underground economy has a modest share of 23 per cent of GDP. Other experts believe that the shadow economy comprises up to 50 per cent of GDP. A study of the Russian consumer market indicates that official statistics heavily underestimate private consumption spending and the corresponding income, and concludes that the share of the shadow economy is 45�50 per cent of GDP and that the figures for GDP have to be increased by 40�45 per cent to reflect its full extent.33 Further clarification is expected to result from a joint research project of the World Bank and the Moscow Bureau of Economic Analysis.34
There is no question that the widespread shadow sector has negative effects on the Russian economy. In a certain sense the shadow economy reflects market incentives as the drive to the service sector. On the other hand, the underground economy is a barrier to the evolution of efficient companies because the companies working in it have to invest resources in order to have good relations with the state bureaucracy instead of investing in technology or the training of their staff. Because they fear detection they are not interested to grow over a certain limit and for this reason too, economic growth is hampered. Moreover, the shadow economy uses public infra-structure without paying for it and in this way increases the tax burden for the official economy. The network of informal relations between the enterprises of the shadow economy and the state bureaucracy is also a stumbling block to successful implementation of the government�s reforms.35
Small and medium-sized enterprises (SMEs). In Russia the share of SMEs in total employment36 is stagnant at less than 20 per cent. This is far less than in Western market economies, where SMEs form the basis of economic activity (see table 15).37
32 Organisation for Economic Cooperation and Development (OECD), Measuring the Non-Observed Economy: A Handbook, Paris: OECD, 2002 (http://www.oecd.org/pdf/M00035000/M00035196.pdf). 33 Interactive Research Group, ‘Top 100 emerging companies of the Russian consumer market’, Moscow, 2003 (http://www.intrg.com/pdf/Top_100_eng_final.pdf). See also the Russian version where the higher values of the shadow economy are given (http://www.intrg.com/pdf/Top_100_rus_final.pdf). 34 World Bank, Russia Country Office, ‘Interview with Christof Rühl’, August 2003 (http://www.worldbank.org.ru/ eng/news/speeches). 35 World Bank Russia, Country Office, ‘Interview with Christof Rühl’, op. cit. 36 Small and medium-size enterprises (SMEs) in Russia are defined as follows: the number of employees does not exceed 100 persons in industry, transport and construction industry, 60 in agriculture, 30 in wholesale trade and services, and 50 in other branches. 37 Russian SME Resource Centre (http://www.rcsme.ru/stat).
17
Table 14. Small and medium-sized enterprises (SMEs) in Russia, 2000 Total
number Number per
1,000 inhabitants
Employees (millions)
Share in total employment
(%)
Share in GDP (%)
EU countries 15,770 45 68 72 63�67 USA 19,300 74 70 54 50�52 Russia 844 6 8 13 10�11 Source: Russian SME Resource Centre (http://www.rcsme.ru/stat). In Russia SMEs are not the main driving forces of economic growth, as they have proved to be in the other transition economies in Central and Eastern Europe. In Russia, in contrast to other transition countries, SMEs have not been growing as fast as larger businesses.38 Surveys reveal the causes of their poor performance. Previously corruption and criminal rackets were the main obstacles to their business; currently excessive paperwork, taxes and government regulations rank at the highest level of impact are the greatest obstacles to their growth. A table published by the World Bank indicates that, it order of importance, the general problems of SMEs are levels of taxes; tax administration; macroeconomic instability; regulation; level of competition; access to credit; anti-competitive barriers; corruption; and criminal rackets.39
In 2001, the SMEs surveyed reported arbitrary harassment by individual government agencies. Efforts at deregulation therefore had to be targeted at reducing the discretionary authority of bureaucrats to harass firms. The Russian government began to implement a set of new legal acts (a �deregulation package�) which is designed to set clearer boundaries for bureaucratic intervention. The main target areas of the measures are registration, licensing, certification and inspections of companies. When the new acts came into effect, there existed a huge gap between existing regulatory practices and the benchmarks set out in the new law.40 Only time will show to what extent the new legislation will be able to improve the situation.
The survey data revealed a positive linkage between company size and the costs of regulatory burdens: the larger the firm, the more it has to pay and the more time its management has to spend in order to meet the regulatory requirements. This evidence would suggest that there are strong regulatory obstacles preventing small firms from growing to medium size. In some municipalities local administrations try to block the entry of new firms to the market and to create protected positions for such incumbent firms as have close ties to the political elites, occupy dominant positions in the local labour market or enjoy other monopolistic positions.
Nor do Russia�s more than 1,300 banks support the creation of SMEs effectively. Regional banks are small and can give only small loans to SMEs, if at all. Because the deposits in the banking system are mostly for one year or less, banks prefer to give only short-term loans, which are unsuited for investment projects. Where the banks have capital to lend to SMEs, they are reluctant to grant loans because of lack of security. Thus, at present the main sources of SME finance is the international financing institutions or private donors. Capital flows from Russian commercial banks depend on investment guarantees for small firms, which extended by the Russian government that would compensate them in case of default. These so-called
38 World Bank, Russian Economic Report, October 2002, Part III (http://www.worldbank.org.ru/ eng/statistics/ereports/10_02/rer4-eng-oct29-10_final.pdf). 39 World Bank, Russian Economic Report, October 2002, op. cit. 40 World Bank, Russian Economic Report, October 2002, op. cit.
18
credit guarantee schemes are developed under the auspices of the European Union (EU) TACIS [Technical Assistance to the Commonwealth of Independent States] programme.
Sectoral structure: the ‘Dutch disease’ and other consequences of resource abundance Only a limited range of Russian goods, such as energy, metals and timber, are competitive on world markets and are therefore the main export products. The reverse side of this �resource bias� is an underdeveloped manufacturing sector. There is the danger that this one-sided structure of the Russian economy will be permanently preserved. The currency tends to appreciate and financial resources as well as qualified manpower tend to be concentrated in the raw material sector. In the theoretical economic literature this constellation is discussed as the �Dutch disease�. The remedy may be an intelligent industrial policy, perhaps following the Norwegian example. In the long run, the resource bias � the bias towards the raw materials sector � will become less severe as resources will deplete.
If there is an inverse relationship between natural resource abundance and economic growth, this will be true for Russia as well as for other countries. It is therefore worthwhile to study the theoretical insights and empirical results of research in the field. The term �Dutch disease� refers to the symptoms of deindustrialization as a result of the appreciation of the Dutch currency that followed the discovery of large natural gas deposits in the North Sea in the late 1950s. As a consequence, manufacturing and service exports were reduced, although only for a short period of time.41 The first symptom associated with the Dutch disease was an overvalued currency. Other symptoms are big fluctuations of world market prices for raw materials, creating exchange rate volatility and instability of export earnings.
Usually the raw materials sector can pay higher wages than other industries. For that reason, it the manpower with the highest qualification and sets the tone for wage negotiations in other industries as well. As a result, the manufacturing sectors can become (or remain, as in the Russian case) uncompetitive because of high wages and/or an overvalued currency and will not attract enough investment. In sum, the lagging performance of the manufacturing sector can hurt economic growth in the medium and long run.
There are other ways in which natural resource abundance can hinder economic growth.42 The resource abundance may lead to rent-seeking behaviour on the part of politically powerful interest groups in and around the resource industries. These groups may try, often with great success, to acquire ownership of state-owned property at a low price. Rent seeking can take the forms of import protection, corruption and cronyism, all of which tend to impede economic growth and efficiency. The struggle for resource rents may lead to economic and political power becoming concentrated in the hands of elites, resulting in a weakening of the political system and slow economic growth.43 In primary production the demands on the quality of labour, which the exception of certain high-technology jobs � for example, in oil drilling � are generally lower than in other branches of industry. As empirical 41 Gylfason, Thorvaldur, Lessons from the Dutch Disease: Causes, Treatment, and Cures, Working Paper of the Institute of Economic Studies, August 2001 (http://www.ioes.hi.is/publications/wp/w0106.pdf), p. 2. See also the many other works of the same author, e.g., ‘Resources, agriculture, and economic growth in transition economies’, Kyklos, 4, 2000 (http://www.hi.is/~gylfason/pdf/kyklos3.pdf). 42 Gylfason, ‘Lessons from the Dutch disease’, op. cit., pp. 5–8. 43 Auty, Richard M. (ed.), Resource Abundance and Economic Development, Oxford: Oxford University Press, 2001.
19
studies show, public expenditure on education and training relative to national income is inversely related to natural resource abundance. Resource abundance may also weaken the attention of governments to business-friendly policies and bureaucratic efficiency. In general, incentives to create wealth through good policies and good institutions may wane because it is apparently possible to extract wealth from the soil effortlessly.44
In the last instance, resource abundance may, as Gylfason and Zoega have tried to show, weaken private (and public) incentives to save and invest, thus reducing future economic growth.45 Under the strong assumptions of a neo-classical growth model it can also be shown that the greater the income share of the raw materials sector, the lower the saving and investment rate,46 although a more disaggregated analysis may cast doubt on this conclusion. As Russian statistical data show, the ratio between investment and production in the energy sector is far higher than it is in other industries, so that an increase in the scope of the raw material sector tends to increase capital investment in the economy.47
However, it is not inevitable that a rich natural endowment prevents economic development, for the problem is not the existence of natural wealth but rather the failure to avert the dangers of resource abundance The Netherlands recovered fairly quickly from the Dutch disease, and Norway has not yet shown any symptoms of it. One explanation for this may be that the Netherlands and Norway were both already well-developed countries with mature political, financial and social systems at the time of their big oil and gas discoveries. In Norway, which became the world�s second-largest oil exporter (after Saudi Arabia and recently Russia), the state absorbs up to 80 per cent of the oil revenues by a corporate tax, several resource taxes, royalties, area fees and a carbon dioxide tax. A government-owned oil fund (the Norwegian Petroleum Fund) has been created where a large part of the oil revenue is invested for the benefit of the older population as well as future generations. The examples of the Netherlands and Norway clearly show the way out of the resource curse dilemma.
Regional structure In the context of distorted economic structures, the regional structure of the Russian economy also deserves attention. Russia is characterized by many large settlements in northern areas with a cold climate and by the great distances between settlements in all parts of the country. Furthermore, Russia also has an �inner� hinterland, the glubinka, beyond the metropolitan centres.48 Both these facts result in high energy and transport costs, which make production there uncompetitive. The �dead space� as well as the �burden of the cold� are not only the consequences of geography; to a certain extent they are also the legacy of Soviet policy, which moved industry and people from the west to the east of the country. Exorbitant transport, distribution and com-munication costs, on the one hand, and excessive heating and other �consumption costs� on the other, account for �spatial inefficiency�, which constitutes a permanent
44 See Gylfason, ‘Lessons from the Dutch disease’, op. cit., p. 7 and the sources cited there. 45 Gylfason, Thorvaldur and Gylfi Zoega, ‘Natural resources and economic growth. The role of investment’, CEPR Discussion Paper, March 2001 (http://www.hi.is/~gylfason/pdf/natinvest45.pdf). 46 Gylfason and Zoega, op. cit., pp. 15–17, show this corrolary for the optimal (consumption maximizing) saving rate on the transition to a Solovian steady state. 47 In 2001 the ratio of investment to gross production was 32 per cent in the fuel sector as compared to 10 per cent in industry in general (including the fuel sector). See Starodubrovskii, V., ‘Krivaia doroga priamych investitsii’ [The crooked way of direct investment], Voprosy ekonomiki, 1, 2003, pp. 73–95 (here table 2, p. 93). 48 Dienes, Leslie, ‘Reflections on a geographic dichotomy: Archipelago Russia’, Eurasian Geography and Economics, 6, 2002, pp. 443–58.
20
loss of welfare. One researcher has formulated a hypothetical allocation of industry and population in Russia which is free of spatial inefficiency and calculated the corresponding welfare gain.49 A population-weighted temperature index (temperature per capita, TPC) reveals that as a result of Soviet settlement policy Russia has become about 1.5º C colder in comparison with an alternative distribution of the population. This means extra energy use, a deterioration in health and lower productivity. The TCP difference translates into a 4.5 per cent increase in electricity consumption and at least a 0.2 per cent loss of GDP. The only way out of this situation seems to be to give up some of those northern settlements and to resettle people to other areas.
Medium-term economic problems III: Energy Are Russia�s energy reserves sufficient for domestic consumption and export obligations in the medium term? Answers to this question can be provided as follows.
∑ Coal. There are ample reserves; coal production and the domestic consumption of coal are rapidly rising, and pollution will rise, too. There are only modest export possibilities.
∑ Gas. Russian domestic gas consumption is extremely high compared with that of other gas-producing countries (about 70 per cent of gas production). The expansion of gas production will depend on very expensive investment projects (for instance, on the Yamal Peninsula and in the Barents Sea), with an overall investment requirement of about US$200 billion and with unclear profitability prospects. As long as the pipeline network and gas transport tariffs are controlled by the quasi-state company Gazprom, independent gas producers will hardly feel encouraged to compete. All these factors result in a relatively small export volume compared to the import needs of European countries.
∑ Oil. The domestic consumption ratio is low (about 50 per cent) and the volume of exports is correspondingly high. Future production development will be dependent on an influx of foreign direct investment (FDI). The export outlook is good, with China and the USA as potential new export areas. Because the pipeline network is in the hands of the state company Transneft, the future of some pipeline projects, such as the Murmansk pipeline, is cannot be predicted.
∑ Nuclear energy. Uranium reserves are sufficient for 50 years at present levels of electricity production, using customary thermal nuclear reactors. The Russian Ministry of Atomic Energy (Minatom) is pleading for a switch to fast neutron reactors, which would need almost no uranium input, beginning in 2020.
The main current problem of the Russian energy sector can be defined as follows. Gas production will relatively soon become insufficient to meet domestic consumption requirements and Russia�s export obligations at the same time. The gas problem is a direct consequence of an improper price policy. There exists a distorted structure of internal energy demand as a consequence of the distorted structure of energy prices. Gas is far too cheap on the domestic market at US$20 per 1,000 cubic metres instead of the market price of $50�100 per 1,000 cubic metres, because the gas price is regulated by the state commission for tariffs and the parliament. If the gas price were set in accordance with production costs and investment needs, domestic demand would be considerably reduced.
49 Mikhailova, Tatiana, ‘Where Russians should live: A counterfactual alternative to Soviet location policy’, undated (http://econ.la.psu.edu/JobMarket/2002-2003/mikhailova_candidate.html); and ‘The cost of the cold’, Brookings Policy Brief, 99, May 2002 (http://www.brook.edu/dybdocroot/comm/policybriefs/pb99.pdf). OK?? Yes
21
Conclusions Important parameters of the Russian economy such as the rate of capital accumulation, the rate of technological progress and the improvement of institutional design suggest modest economic growth in the medium term. As long as the Russian economy is characterized by the many structural distortions such as a large shadow economy, the small size of the SME sector, the resource bias and spatial inefficiency, there will be no quick breakthrough to a genuinely modern economy and society. The important energy sector is hampered by state intervention into the price structure on the domestic market. The expansion and use of the pipeline network is also negatively affected by state intervention. Environmental problems, the decreasing population, the spread of HIV/AIDS and finally the depletion of energy resources will burden Russia�s economic development, particularly in the long run. Russia may play today the role of a great power in world politics, but it will rest on very weak economic foundations for some time to come.
22
Bibliography
Books and journals Auty, Richard M. (ed.), Resource Abundance and Economic Development, Oxford: Oxford
(http://www.bankwatch.org/downloads/leakingoperations.pdf) Bovt, Georgy and Yelena Korop, �Economic miracle for Russia, as Vladimir Putin�s
adviser sees it�, Johnson’s Russia List, 7005, 5 January 2003 (http://www.cdi.org/ russia/johnson/7005-5.cfm)
Campbell, Colin J. et al., �Ölwechsel! Das Ende des Erdölzeitalters und die Weichen-stellung für die Zukunft� [The end of the oil age and the position of points for the future], Munich: DTV, 2002
DaVanzo, Julie and Clifford Grammich, �Dire demographics: Population trends in the Russian Federation�, 2001 (http://www.rand.org/publications/MR/MR1273/)
Deutsche Bank Research, �Russia 2010: It�s a bear, not a bull!� (http://www. dbresearch.de/PROD/999/PROD0000000000053432.pdf)
Dienes, Leslie, �Reflections on a geographic dichotomy: Archipelago Russia�, Eurasian Geography and Economics, 6, 2002, pp. 443�58
Economist Intelligence Unit (EIU), Country Report Russia, London: EIU, March 2003 Gritsenko, Aleksandr, Nikolai Krylov, Victor Alenin and Vasily Stupakov, �Oil and gas
of Russia in the XXI century: Forecast of production and development of the resource base�, Mineral Resources of Russia, 3, 2001 (http://www.geoinform.ru/english/ mrr.files/issues/3-2001.html)
Gustafson, Thane, Crisis Amid Plenty: The Politics of Soviet Energy under Brezhnev and Gorbachev, Princeton, N.J.: Princeton University Press, 1989
Gylfason, Thorvaldur, Lessons from the Dutch Disease: Causes, Treatment and Cures, Working Paper of the Institute of Economic Studies, August 2001 (http://www.ioes.hi.is/ publications/wp/w0106.pdf)
��, �Resources, agriculture, and economic growth in transition economies�, Kyklos, 4, 2000 (http://www.hi.is/~gylfason/pdf/kyklos3.pdf)
�� and Gylfi Zoega, �Natural resources and cconomic growth: The role of investment�, CEPR Discussion Paper, March 2001 (http://www.hi.is/~gylfason/pdf/natinvest45. pdf)
Herd, Graeme P., Foreign and Security Policy Implications of Russia’s Demographic Crisis, Working Paper 20, Project Regionalisation of Russian Foreign and Security Policy, Zürich: Forschungsstelle für Sicherheitspolitik, ETH, March 2002, (http://www. fsk.ethz.ch/documents/WorkingPapers/wp20.pdf)
von Hirschhausen, Christian, �Modernising infrastructure in transition economies�, Cheltenham: Edward Elgar, 2002
International Monetary Fund (IMF), �Russian Federation: Selected issues and statistical appendix�, IMF Country Report 02/75, April 2002 (http://www.imf.org/external/pubs/ ft/scr/2002/cr0275.pdf)
Interactive Research Group, �Top 100 emerging companies of the Russian consumer market�, Moscow, 2003 (http://www.intrg.com/pdf/Top_100_eng_final.pdf)
Komulainen, Tuomas et al., �Russia: Growth prospects and policy debates�, Bofit Online, 3, 2003 (http://www.bof.fi/bofit/fin/7online/03abs/03pdf/bon0303.pdf)
Levine, Ross and David Renelt, �A sensitivity analysis of cross-country growth regressions�, American Economic Review, 1992
23
Mastepanov, Alexei, �Energy strategy of the Russian Federation to the year 2020� (http://europa.eu.int/comm/energy_transport/russia/energy-strategy2020_en.pdf)
Meditsinskii vestnik, 20 January 2003. Mikhailova, Tatiana, �Where Russians should live: A counterfactual alternative to
Organisation for Economic Co-operation and Development (OECD), Measuring the Non-Observed Economy: A Handbook, Paris: OECD, 2002 (http://www.oecd.org/pdf/ M00035000/M00035196.pdf)
� , Purchasing Power Parities and Real Expenditures, 1999 Benchmark Year, Paris: OECD, 2002 Putin, Vladimir, Rossiya na rubeshye tysyacheletiy [Russia at the turn of the
millennium], Nezavisimaia gazeta, 30 December 1999 Rautava, Jouko, �The role of oil prices and the real exchange rate in Russia�s economy�,
Helsinki: Bank of Finland Institute for Economies in Transition (BOFIT), 2003 (http://www.bof.fi/bofit/fin/6dp/abs/pdf/dp0302.pdf)
Starodubrovskii, V., �Krivaia doroga priamykh investitsii� [The crooked way of direct investment], Voprosy ekonomiki, 1, 2003, pp. 73�95
Statistical Yearbook of Russia, 2001, Part 5 Ukolov, Roman, �SPID meniaet orientatsiiu� [AIDS changes orientation], Izvestiia, 31
March 2003 United Nations, Economic Survey of Europe, 1, 2001 US Energy Information Administration, Russia: Environmental Issues, Country analysis
briefs, August 2001 (http://www.eia.doe.gov/emeu/cabs/russia.html) World Bank, World Development Indicators 2002 (http://www.worldbank.org/data/
wdi2002/tables/table1-1.pdf)
Media and Internet Interfax Statistical Report, 9/2003, 28 February 2003 could you add the URL? Interfax Statistical Report, 13/2003 could you add the URL? OECD, http://www.oecd.org/pdf/M00009000/M00009294.pdf Russian SME Resource Centre (http://www.rcsme.ru/stat) Russian State Committee on Statistics (Goskomstat), (http://www.gks.ru) US Census Bureau, International Data Base (IDB), Summary Demographic Data for
Russia, (http://blue.census.gov/cgi-bin/ipc/idbsum?cty=RS) ��, International Data Base, (http://blue.census.gov/cgi-bin/ipc/idbrank.pl) US Central Intelligence Agency (CIA), National Intelligence Council, �CIA: Russia,
China, India face HIV crisis�, September 2002 (http://www.mindfully.org/Health/ 2002/AIDS-HIV-Next-WaveCIASep02.htm)
World Bank, The Economic Consequences of HIV in Russia, 2002 (http://www.worldbank.org.ru/eng/statistics/hiv/default.htm)
��, �Country assistance strategy�, March 2003 (http://www.worldbank.org.ru/eng/group/strategy3/Annex_B7.pdf)
World Bank Group in Russia, Russian Economic Report, May 2002 (http://www. worldbank.org.ru/eng/statistics/ereports/05_02/RER3-English-05-30-02.pdf))
World Bank, Russia Country Office, �Interview with Christof Rühl�, August 2003 (http://www.worldbank.org.ru/eng/news/speeches)