THE STATE OF HIGHER EDUCATION IN AMERICA Looking Backward or Looking Forward? Exploring the Private Student Loan Market CENTER ON HIGHER EDUCATION REFORM A M E R I C A N E N T E R P R I S E I N S T I T U T E ANDREW P. KELLY AND KEVIN J. JAMES JUNE 2016
Transcript
THE STATE OF HIGHER EDUCATION IN AMERICA
Looking Backward or Looking Forward?Exploring the Private Student Loan Market
C E N T E R O N H I G H E R E D U C A T I O N R E F O R M
A M E R I C A N E N T E R P R I S E I N S T I T U T E
ANDREW P. KELLY AND KEVIN J. JAMESJUNE 2016
i
Executive Summary
Students have become increasingly reliant on stu-dent loans as college tuition continues to rise far
faster than inflation and family incomes. Much of this increased borrowing has taken place through the fed-eral student loan program, which was responsible for roughly 90 percent of student loans issued in 2015.
Although federal loans dominate student lending, a small private student loan market still exists, compris-ing roughly 9 percent of the student loans disbursed in 2015. With the rise in delinquencies and defaults on federal loans, along with continued concerns about tuition inflation, some have argued that private student loans should play a larger role in financing students. In theory, private lenders could underwrite loans on the basis of program value—the return stu-dents reap for the money they invest—thereby inject-ing greater market discipline than the federal loan programs, which lend to any accredited program at almost any price.
To assess the likelihood of these predicted benefits, it would be helpful to know more about the criteria that private lenders use today in making loans to students. Specifically, do lenders mainly use traditional under-writing criteria—such as credit scores—that look back-ward at a student’s prior (and often limited) experience with debt? Or do they look forward to consider how such an investment could transform a student’s earning potential in the future?
To shed light on these questions, this paper employs a mix of data analysis and qualitative interviews with private student lenders and other industry experts. We find that the current private loan market appears to be largely backward-looking, relying on traditional under-writing models to make loans. The likely result is that many students with high potential but a thin credit his-tory and no access to a creditworthy cosigner are not able to get a private loan.
To this point, we find that more than 90 percent of undergraduate loans are cosigned, and low-income borrowers are less likely to rely on private loans than their higher-income peers, even when they face simi-larly high net prices. Because lenders are underwriting on the basis of cosigner credit rather than student and program characteristics, they may not foster as much market discipline as policy makers might hope.
That said, a growing number of newer lenders—including MPower Financing, Skills Fund, Pave, Climb Credit, and others—are using a wider array of forward-looking criteria such as institutional quality and the likely return on investment of the student’s program of study. While growing quickly, however, these firms are still quite small when compared to exist-ing student lenders.
We identify several factors that discourage lenders from adopting innovative underwriting approaches. Some of these, such as the time it takes to develop investor confidence in new models, are intrinsic to the market. At the same time, there are steps policymak-ers can take to foster a wider array of forward-looking lending options for students. These include: investi-gating and clarifying the degree to which fair lending laws may inhibit forward-looking underwriting mod-els; providing additional data to increase transparency around student outcomes; and capping federal PLUS loans to limit risks to students and taxpayers while cre-ating additional space for innovative private lending options to emerge.
Finally, policymakers interested in a more expan-sive role for private loans should be wary of using generous federal guarantees as a means to achiev-ing that goal. Guarantees reinforce the most signif-icant flaw in the current system: loans are given out with little regard for whether students will be able to pay them back. In contrast, the promise of new
ii
forward-looking lenders is that by underwriting based on students’ potential—rather than their back-ground—these organizations can expand opportunity
while strengthening market discipline. Greater mar-ket discipline, in turn, can foster a system that is more affordable and higher quality.
1
Looking Backward or Looking Forward? Exploring the Private Student Loan Market
As the growth in college tuition has far outpaced inflation and family incomes, student loans have
become essential to financing higher education for the majority of American students. According to a 2015 analysis by Mark Kantrowitz, 70.9 percent of bachelor’s degree recipients now rely on student loans (federal or private) to help cover the cost of college attendance. This is up from 53.7 percent two decades earlier in 1994.1 The average debt load of graduates has also jumped markedly over that period, from $17,871 to $35,051 (in constant 2015 dollars), almost a twofold increase.2
Students have largely relied on federal student loans to meet their growing financing needs. Under the Fed-eral Direct Loan Program, the Department of Educa-tion made $85.7 billion in loans directly to students in 2015; $62.1 billion of those loan dollars went to undergraduates.3 Before 2010, the federal portfolio also included private student loans guaranteed under the now-defunct Federal Family Education Loan Pro-gram (FFELP).
Overall, the federal government disbursed $59.4 bil-lion (in 2014 dollars) in student loans in 2004. That total has increased almost 50 percent since then. Fed-eral loans now represent roughly 90 percent of student loan originations annually.4
Despite the dominance of federal loans in student lending, a private student loan market—where banks or other private firms make loans directly to students outside of the federal loan program—still exists. In 2014–15, private lenders issued $9 billion in new stu-dent loans, constituting roughly 9 percent of the overall student loan market that year.5
These loans are distinct from guaranteed loans made under FFELP, which were essentially federal loans made by private banks. Unlike FFELP loans, pri-vate student lenders have full control over terms and
are not insulated from default by any federal guaran-tee. Whereas the federal loan program operates as an entitlement, private lenders set their own lending and underwriting standards designed to maximize their portfolio’s performance.
In response to the explosion in federal student loan debt and consequent rise in default and delinquency rates, some policymakers and researchers on the right have argued that private student loans should play a larger role in financing students. Some make the case that taxpayers cannot continue to shoulder the risk of lending ever-larger amounts—often for programs of dubious educational value—as tuition levels rise at a rapid clip.6 Others have noted that because the federal loan programs lend money to any high school gradu-ate to attend any accredited college at almost any price, they likely contribute to tuition inflation and prop up low-quality colleges.7
Indeed, recent research suggests that increases in the availability of federal loans enable and perhaps encour-age colleges to raise their tuition.8 In theory, private lenders could limit the availability of credit based on program price, quality, and expected earnings. By only lending money to students attending programs where benefits are commensurate to their costs, these private lenders could inject a degree of market discipline that is sorely lacking under the status quo.9
These predictions about the benefits of private lend-ing sound great, especially compared to the existing federal student loan mess. But in debating the role of private loans, it is important to look more closely at how the market currently functions, particularly the criteria that private lenders use in making loans to students.
How much do students rely on private lenders in today’s higher education market, and who uses them? Do private lenders underwrite on the basis of traditional
2
LOOKING BACKWARD OR LOOKING FORWARD? ANDREW P. KELLY AND KEVIN J. JAMES
measures of creditworthiness—credit scores and the availability of a cosigner (someone who can cover the student’s obligation if he or she fails to repay it)? Or do they include other information about prospective bor-rowers, such as a student’s choice of institution, field of study, or academic performance? How might exist-ing policies and regulations affect lending behavior? The answers to these questions have implications for debates about how policymakers might create space for private financing to further public goals.
This paper examines these questions with a mix of data analysis and qualitative interviews with lenders and other industry experts. We provide a summary of the existing private student loan market, examine the status quo in underwriting, and take a look at lenders that are experimenting with new underwriting models. We go on to explore the constraints that shape lender behavior in the current market and how those con-straints might relate to current policy.
The paper proceeds as follows: the first section dis-cusses different models of underwriting that lenders might employ, importing lessons from other consumer lending sectors. The second section takes a look at the current private lending market using data from the National Postsecondary Student Aid Study (NPSAS) and MeasureOne, a firm that tracks the private stu-dent loan industry. The third section draws on a series of interviews with established and emerging lenders to outline current underwriting practices and the forces that shape lender behavior today. The final section con-cludes with some implications for policy and higher education reform.
Approaches to Underwriting: Looking Backward or Looking Forward?
Consumer lending markets typically rely on a consum-er’s credit score in determining his or her eligibility to borrow, the maximum amount of the loan, and the interest rate. A borrower’s credit score represents a sum-mation of his or her past experiences with credit and other financial obligations, and lenders tend to rely on it because of its predictive power vis-à-vis an applicant’s future repayment behavior. Research indicates that
baseline credit scores are highly correlated with subse-quent borrower behavior.10
Credit scores are also readily available and simple to understand, which lowers the cost of underwriting. Pri-vate firms track individuals’ credit usage, score them on a scale (usually from 300 to 850), and provide access to those scores for a fee. Perhaps most importantly, regula-tors have deemed credit scores to be a legally acceptable underwriting criterion.
Private student loans are markedly different from other consumer loans. Mortgages and car loans often feature collateral that a lender can seize in the event of default. In contrast, educational investments are unsecured—a lender cannot seize an individual’s diploma. In addition, investing in a house or car is unlikely to fundamentally change the individual’s abil-ity to repay the loan. But investing in education has, on average, a positive effect on a borrower’s risk profile; college-educated people are more likely to be employed and earn more than high school graduates.
As such, using credit scores—a summary of past financial history—as the basis for allocating student loans is actually quite peculiar.11 Many students, espe-cially those just graduating from high school, do not have any significant credit history that might enable them to get a loan on traditional terms. But most students want to invest in education on the rationale that it will increase their future earnings, among other potential benefits.
Therefore it could be more profitable for lenders to make credit available to students based on a wider array of factors than their credit history alone, particularly the likelihood that a student’s investment is likely to change his or her future circumstances. Put another way, look-ing to the past to assess the likelihood of repayment ignores important, but admittedly uncertain, informa-tion about the borrower’s ability to repay in the future.
Most students want to invest in
education on the rationale that it
will increase their future earnings.
3
LOOKING BACKWARD OR LOOKING FORWARD? ANDREW P. KELLY AND KEVIN J. JAMES
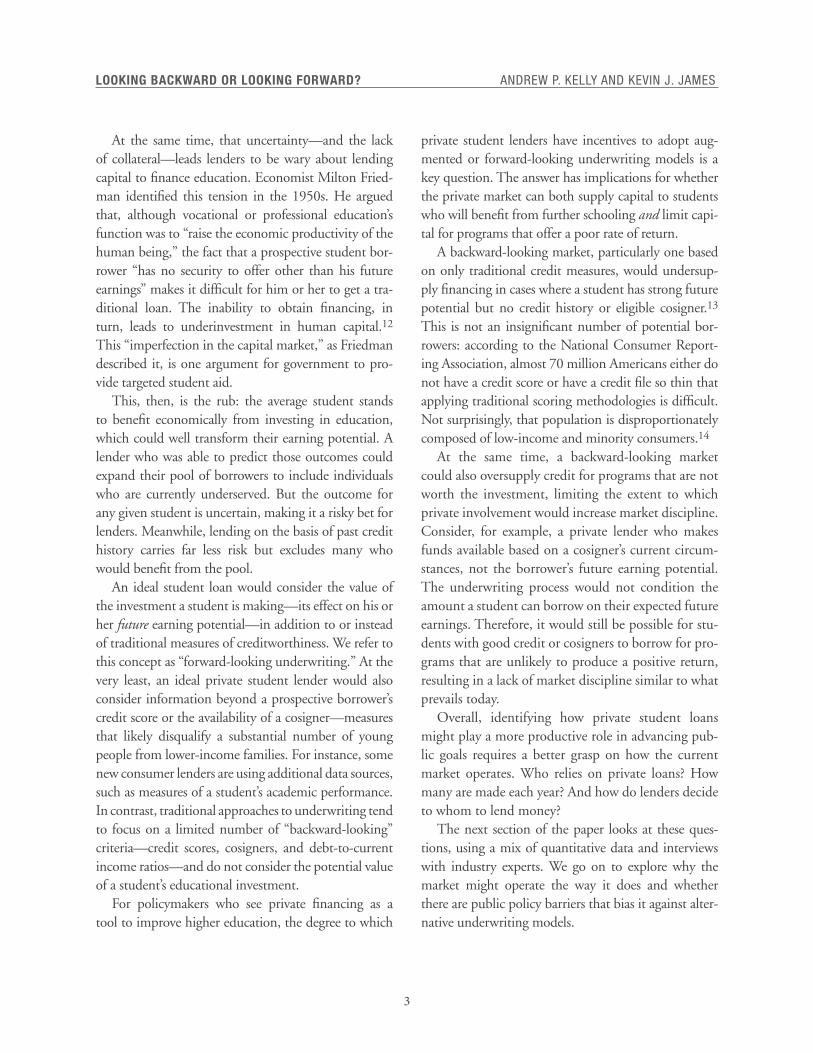
At the same time, that uncertainty—and the lack of collateral—leads lenders to be wary about lending capital to finance education. Economist Milton Fried-man identified this tension in the 1950s. He argued that, although vocational or professional education’s function was to “raise the economic productivity of the human being,” the fact that a prospective student bor-rower “has no security to offer other than his future earnings” makes it difficult for him or her to get a tra-ditional loan. The inability to obtain financing, in turn, leads to underinvestment in human capital.12 This “imperfection in the capital market,” as Friedman described it, is one argument for government to pro-vide targeted student aid.
This, then, is the rub: the average student stands to benefit economically from investing in education, which could well transform their earning potential. A lender who was able to predict those outcomes could expand their pool of borrowers to include individuals who are currently underserved. But the outcome for any given student is uncertain, making it a risky bet for lenders. Meanwhile, lending on the basis of past credit history carries far less risk but excludes many who would benefit from the pool.
An ideal student loan would consider the value of the investment a student is making—its effect on his or her future earning potential—in addition to or instead of traditional measures of creditworthiness. We refer to this concept as “forward-looking underwriting.” At the very least, an ideal private student lender would also consider information beyond a prospective borrower’s credit score or the availability of a cosigner—measures that likely disqualify a substantial number of young people from lower-income families. For instance, some new consumer lenders are using additional data sources, such as measures of a student’s academic performance. In contrast, traditional approaches to underwriting tend to focus on a limited number of “backward-looking” criteria—credit scores, cosigners, and debt-to-current income ratios—and do not consider the potential value of a student’s educational investment.
For policymakers who see private financing as a tool to improve higher education, the degree to which
private student lenders have incentives to adopt aug-mented or forward-looking underwriting models is a key question. The answer has implications for whether the private market can both supply capital to students who will benefit from further schooling and limit capi-tal for programs that offer a poor rate of return.
A backward-looking market, particularly one based on only traditional credit measures, would undersup-ply financing in cases where a student has strong future potential but no credit history or eligible cosigner.13 This is not an insignificant number of potential bor-rowers: according to the National Consumer Report-ing Association, almost 70 million Americans either do not have a credit score or have a credit file so thin that applying traditional scoring methodologies is difficult. Not surprisingly, that population is disproportionately composed of low-income and minority consumers.14
At the same time, a backward-looking market could also oversupply credit for programs that are not worth the investment, limiting the extent to which private involvement would increase market discipline. Consider, for example, a private lender who makes funds available based on a cosigner’s current circum-stances, not the borrower’s future earning potential. The underwriting process would not condition the amount a student can borrow on their expected future earnings. Therefore, it would still be possible for stu-dents with good credit or cosigners to borrow for pro-grams that are unlikely to produce a positive return, resulting in a lack of market discipline similar to what prevails today.
Overall, identifying how private student loans might play a more productive role in advancing pub-lic goals requires a better grasp on how the current market operates. Who relies on private loans? How many are made each year? And how do lenders decide to whom to lend money?
The next section of the paper looks at these ques-tions, using a mix of quantitative data and interviews with industry experts. We go on to explore why the market might operate the way it does and whether there are public policy barriers that bias it against alter-native underwriting models.
4
LOOKING BACKWARD OR LOOKING FORWARD? ANDREW P. KELLY AND KEVIN J. JAMES
The Current Private Student Loan Market
What does private student lending look like today, and how has it changed over the past decade? We leverage two data sources to explore the status quo: student-level data from the NPSAS and aggregate data on market share and market performance from MeasureOne. Both datasets tell a similar story: private student loans make up a small fraction of overall student borrowing, and that fraction has decreased since the period imme-diately preceding the recession.
Who Receives Private Student Loans, and How Much? Figure 1 uses data from the public-use NPSAS (computed via PowerStats) to display the percent-age of independent, dependent, and graduate student
borrowers who reported borrowing private student loans in 2004, 2008, and 2012, disaggregated by the amount of private loan debt.15 The denominator here counts all students who reported having accumulated some amount of student loan debt (federal or private) by the time of the survey. The overall patterns are sim-ilar if we include nonborrowers in the denominator (see Figure A1 in the appendix), although as you would imagine, reliance on private loans is even less frequent when nonborrowers are included.
Figure 1 indicates that private loan borrowing peaked in 2008, on the cusp of the financial crisis and the subsequent credit crunch. That year, 31 percent of dependent and 25 percent of independent borrowers reported a private loan balance. Among dependents, 8 percent reported balances of $10,000 or larger in
Figure 1. Percentage of Independent, Dependent, and Graduate Student Borrowers with Private Loans in 2004, 2008, and 2012, by Amount Borrowed
Source: US Department of Education, National Postsecondary Student Aid Study 2004, 2008, 2012, https://nces.ed.gov/surveys/npsas/. Note: Calculation based on respondents who reported any cumulative loan balance (variable name BORAMT1>=$1). Because the object of the analysis was to provide a picture of the market as a whole, we chose to combine full-time and part-time students. Disaggregated anal-ysis of these groups are available upon request.
0
5
10
15
20
25
30
35
40
45
50
2004 2008 2012
Year and Borrower Type
$10,000 or More$5,000–9,999$1–4,999
Perc
enta
ge
Ind. Dep. Grad. Ind. Dep. Grad. Ind. Dep. Grad.
4 7 6
15 137 5
83
22 3
7 10
6
23
2
13 5
38
7
13
2
5
LOOKING BACKWARD OR LOOKING FORWARD? ANDREW P. KELLY AND KEVIN J. JAMES
2008. Among those who reported a private loan, the median dependent borrower owed $5,500, and the median independent borrower owed $4,000.
By 2012, reliance on private loans had fallen pre-cipitously. Just 14 percent of dependent undergradu-ate borrowers reported that they had private loans, and more than half of them reported balances of less than $5,000. Private loans were even less prevalent among independent borrowers in 2012, with 8 percent report-ing any private loan balance at all and just over 1 per-cent reporting balances $10,000 or greater. Among those who reported a private loan, the median balance was $4,000 in both groups.
The 2004 numbers look much like 2012, except for graduate students. Graduate students were the most likely of the three groups to have borrowed private loans in 2004, but in 2008 and 2012 they were the least likely to do so. The likely explanation here is the intro-duction of the federal Graduate PLUS loan program in
2006, which allowed unlimited borrowing up to the cost of attendance. Before the PLUS program, federal loans for graduate students were capped, ostensibly leading more of those students to borrow in the private market than in the past.
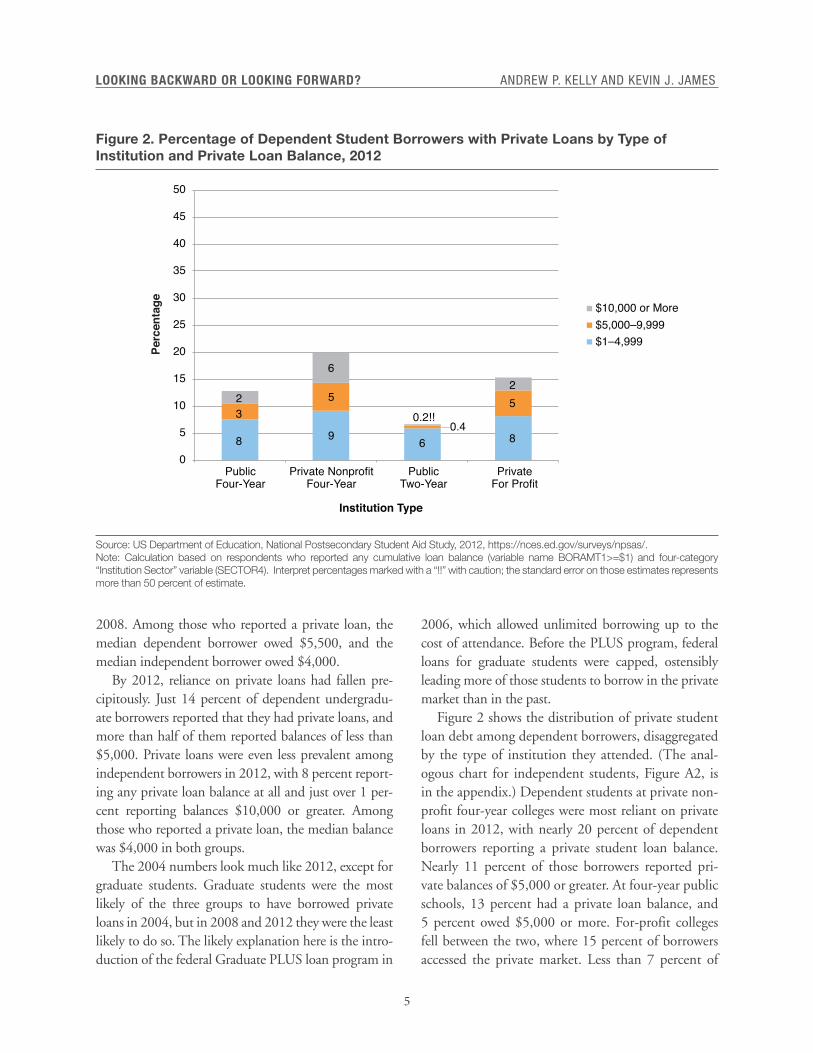
Figure 2 shows the distribution of private student loan debt among dependent borrowers, disaggregated by the type of institution they attended. (The anal-ogous chart for independent students, Figure A2, is in the appendix.) Dependent students at private non-profit four-year colleges were most reliant on private loans in 2012, with nearly 20 percent of dependent borrowers reporting a private student loan balance. Nearly 11 percent of those borrowers reported pri-vate balances of $5,000 or greater. At four-year public schools, 13 percent had a private loan balance, and 5 percent owed $5,000 or more. For-profit colleges fell between the two, where 15 percent of borrowers accessed the private market. Less than 7 percent of
Figure 2. Percentage of Dependent Student Borrowers with Private Loans by Type of Institution and Private Loan Balance, 2012
Source: US Department of Education, National Postsecondary Student Aid Study, 2012, https://nces.ed.gov/surveys/npsas/. Note: Calculation based on respondents who reported any cumulative loan balance (variable name BORAMT1>=$1) and four-category “Institution Sector” variable (SECTOR4). Interpret percentages marked with a “!!” with caution; the standard error on those estimates represents more than 50 percent of estimate.
8 9 6 8
35
0.4
52
6
0.2!!
2
0
5
10
15
20
25
30
35
40
45
50
PublicFour-Year
Private NonprofitFour-Year
PublicTwo-Year
PrivateFor Profit
Institution Type
$10,000 or More$5,000–9,999$1–4,999
Perc
enta
ge
6
LOOKING BACKWARD OR LOOKING FORWARD? ANDREW P. KELLY AND KEVIN J. JAMES
community college borrowers reported private loans in 2012.
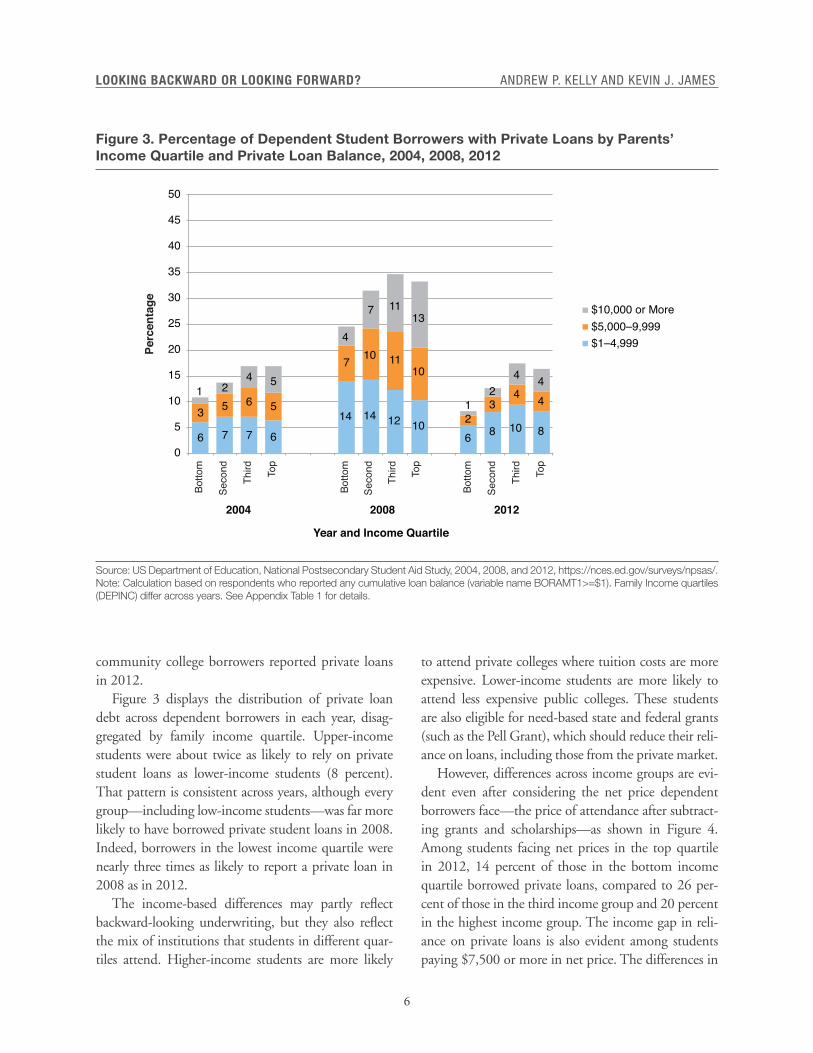
Figure 3 displays the distribution of private loan debt across dependent borrowers in each year, disag-gregated by family income quartile. Upper-income students were about twice as likely to rely on private student loans as lower-income students (8 percent). That pattern is consistent across years, although every group—including low-income students—was far more likely to have borrowed private student loans in 2008. Indeed, borrowers in the lowest income quartile were nearly three times as likely to report a private loan in 2008 as in 2012.
The income-based differences may partly reflect backward-looking underwriting, but they also reflect the mix of institutions that students in different quar-tiles attend. Higher-income students are more likely
to attend private colleges where tuition costs are more expensive. Lower-income students are more likely to attend less expensive public colleges. These students are also eligible for need-based state and federal grants (such as the Pell Grant), which should reduce their reli-ance on loans, including those from the private market.
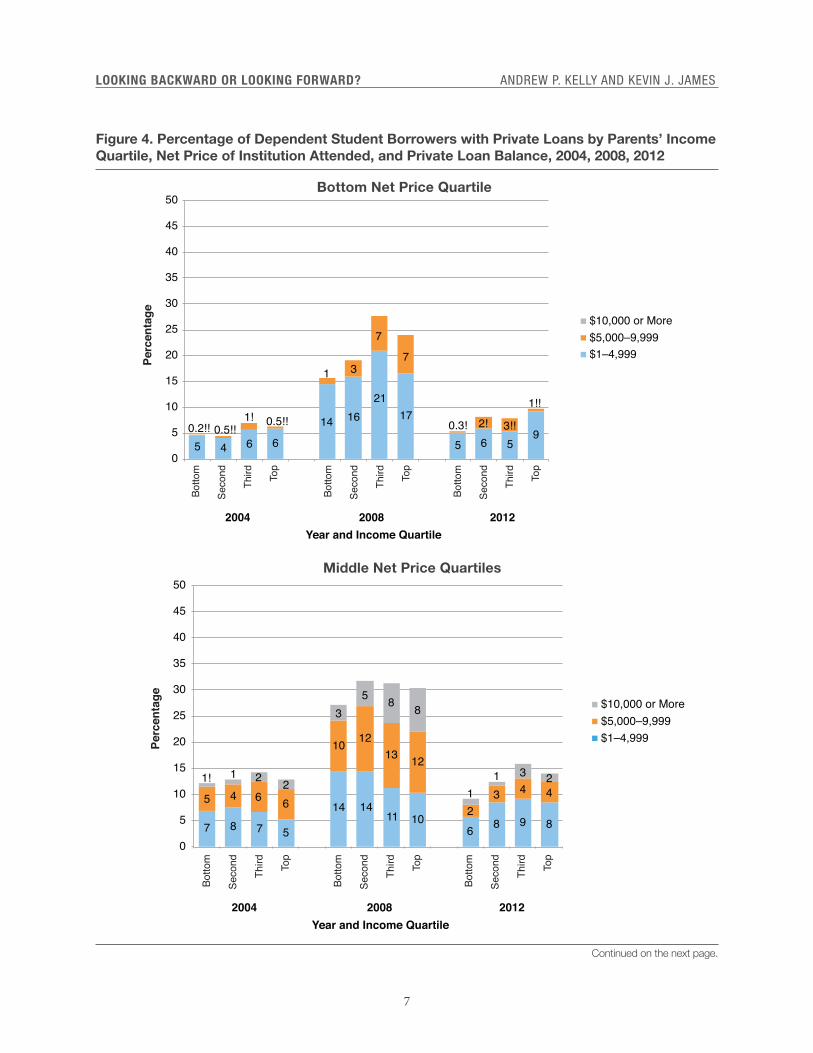
However, differences across income groups are evi-dent even after considering the net price dependent borrowers face—the price of attendance after subtract-ing grants and scholarships—as shown in Figure 4. Among students facing net prices in the top quartile in 2012, 14 percent of those in the bottom income quartile borrowed private loans, compared to 26 per-cent of those in the third income group and 20 percent in the highest income group. The income gap in reli-ance on private loans is also evident among students paying $7,500 or more in net price. The differences in
Figure 3. Percentage of Dependent Student Borrowers with Private Loans by Parents’ Income Quartile and Private Loan Balance, 2004, 2008, 2012
Source: US Department of Education, National Postsecondary Student Aid Study, 2004, 2008, and 2012, https://nces.ed.gov/surveys/npsas/. Note: Calculation based on respondents who reported any cumulative loan balance (variable name BORAMT1>=$1). Family Income quartiles (DEPINC) differ across years. See Appendix Table 1 for details.
Year and Income Quartile
0
5
10
15
20
25
30
35
40
45
50
$10,000 or More$5,000–9,999$1–4,999
2004
Botto
m
Seco
nd
Third Top
2008 2012
Botto
m
Seco
nd
Third Top
Botto
m
Seco
nd
Third Top
Perc
enta
ge
6 7 7 6
14 14 12 106 8 10 8
3 5 6 5
7 10 1110
23
4 41 2
4 5
4
7 1113
12
4 4
7
LOOKING BACKWARD OR LOOKING FORWARD? ANDREW P. KELLY AND KEVIN J. JAMES
Figure 4. Percentage of Dependent Student Borrowers with Private Loans by Parents’ Income Quartile, Net Price of Institution Attended, and Private Loan Balance, 2004, 2008, 2012
Continued on the next page.
0
5
10
15
20
25
30
35
40
45
50
Year and Income Quartile
$10,000 or More$5,000–9,999$1–4,999
2004
Botto
m
Seco
nd
Third Top
2008 2012
Botto
m
Seco
nd
Third Top
Botto
m
Seco
nd
Third Top
Perc
enta
ge
5 4 6 6
14 1621
17
5 6 590.2!! 0.5!!
1! 0.5!!
1 3
7
7
0.3! 2! 3!!
1!!
Bottom Net Price Quartile
0
5
10
15
20
25
30
35
40
45
50
Year and Income Quartile
$10,000 or More$5,000–9,999$1–4,999
2004
Botto
m
Seco
nd
Third Top
2008 2012
Botto
m
Seco
nd
Third Top
Botto
m
Seco
nd
Third Top
Perc
enta
ge
7 8 7 5
14 1411 10
6 8 9 8
5 4 6 6
10 1213 12
23 4 4
1! 1 2 2
35 8 8
11 3 2
Middle Net Price Quartiles
8
LOOKING BACKWARD OR LOOKING FORWARD? ANDREW P. KELLY AND KEVIN J. JAMES
private loan borrowing between the bottom income quartile and the third and fourth quartiles were statisti-cally significant in 2012.
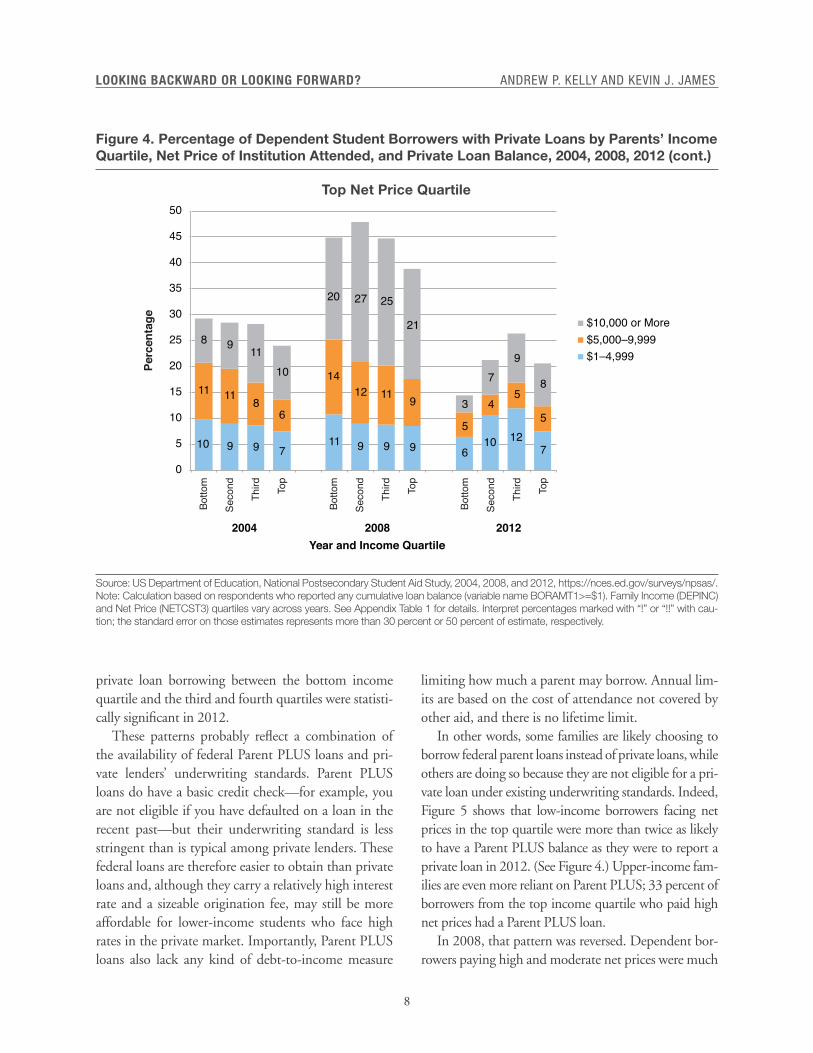
These patterns probably reflect a combination of the availability of federal Parent PLUS loans and pri-vate lenders’ underwriting standards. Parent PLUS loans do have a basic credit check—for example, you are not eligible if you have defaulted on a loan in the recent past—but their underwriting standard is less stringent than is typical among private lenders. These federal loans are therefore easier to obtain than private loans and, although they carry a relatively high interest rate and a sizeable origination fee, may still be more affordable for lower-income students who face high rates in the private market. Importantly, Parent PLUS loans also lack any kind of debt-to-income measure
limiting how much a parent may borrow. Annual lim-its are based on the cost of attendance not covered by other aid, and there is no lifetime limit.
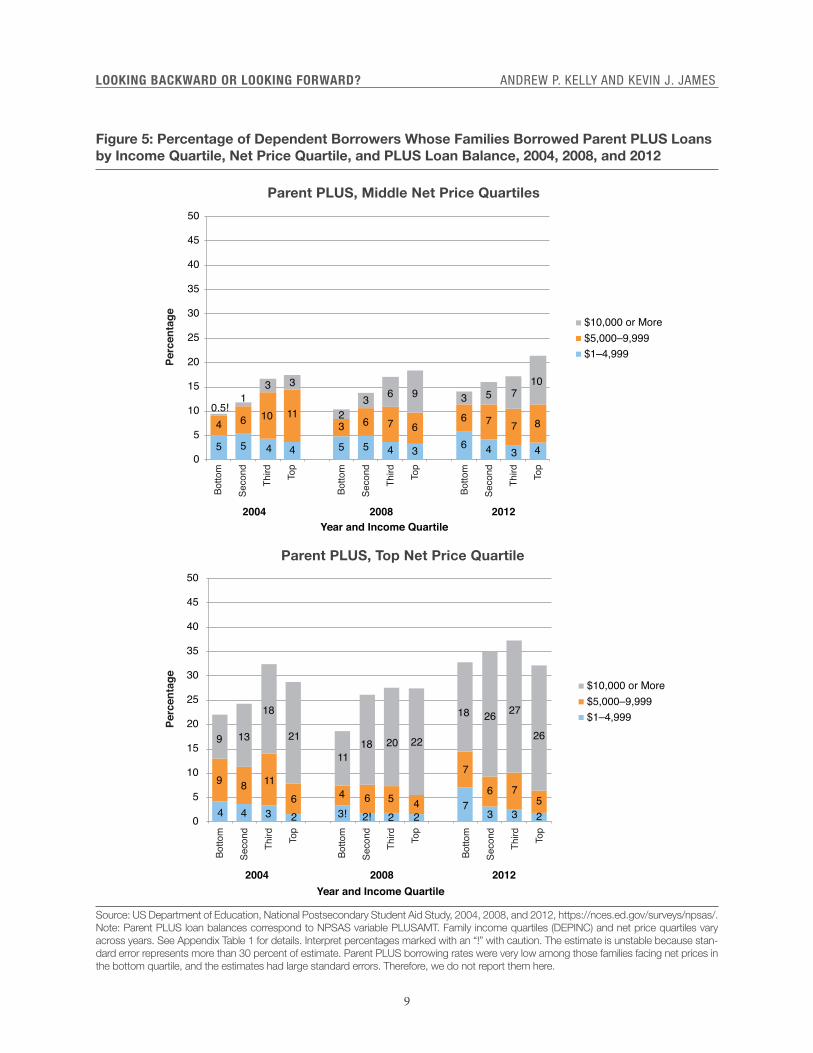
In other words, some families are likely choosing to borrow federal parent loans instead of private loans, while others are doing so because they are not eligible for a pri-vate loan under existing underwriting standards. Indeed, Figure 5 shows that low-income borrowers facing net prices in the top quartile were more than twice as likely to have a Parent PLUS balance as they were to report a private loan in 2012. (See Figure 4.) Upper-income fam-ilies are even more reliant on Parent PLUS; 33 percent of borrowers from the top income quartile who paid high net prices had a Parent PLUS loan.
In 2008, that pattern was reversed. Dependent bor-rowers paying high and moderate net prices were much
Figure 4. Percentage of Dependent Student Borrowers with Private Loans by Parents’ Income Quartile, Net Price of Institution Attended, and Private Loan Balance, 2004, 2008, 2012 (cont.)
Source: US Department of Education, National Postsecondary Student Aid Study, 2004, 2008, and 2012, https://nces.ed.gov/surveys/npsas/. Note: Calculation based on respondents who reported any cumulative loan balance (variable name BORAMT1>=$1). Family Income (DEPINC) and Net Price (NETCST3) quartiles vary across years. See Appendix Table 1 for details. Interpret percentages marked with “!” or “!!” with cau-tion; the standard error on those estimates represents more than 30 percent or 50 percent of estimate, respectively.
0
5
10
15
20
25
30
35
40
45
50
Year and Income Quartile
$10,000 or More$5,000–9,999$1–4,999
2004
Botto
m
Seco
nd
Third Top
2008 2012
Botto
m
Seco
nd
Third Top
Botto
m
Seco
nd
Third Top
Perc
enta
ge
10 9 9 711 9 9 9 6
10 127
11 11 86
1412 11 9
5
45
5
8 9 1110
20 27 25
21
3
79
8
Top Net Price Quartile
9
LOOKING BACKWARD OR LOOKING FORWARD? ANDREW P. KELLY AND KEVIN J. JAMES
Figure 5: Percentage of Dependent Borrowers Whose Families Borrowed Parent PLUS Loans by Income Quartile, Net Price Quartile, and PLUS Loan Balance, 2004, 2008, and 2012
Source: US Department of Education, National Postsecondary Student Aid Study, 2004, 2008, and 2012, https://nces.ed.gov/surveys/npsas/. Note: Parent PLUS loan balances correspond to NPSAS variable PLUSAMT. Family income quartiles (DEPINC) and net price quartiles vary across years. See Appendix Table 1 for details. Interpret percentages marked with an “!” with caution. The estimate is unstable because stan-dard error represents more than 30 percent of estimate. Parent PLUS borrowing rates were very low among those families facing net prices in the bottom quartile, and the estimates had large standard errors. Therefore, we do not report them here.
0
5
10
15
20
25
30
35
40
45
50
Year and Income Quartile
$10,000 or More$5,000–9,999$1–4,999
2004
Botto
m
Seco
nd
Third Top
2008 2012
Botto
m
Seco
nd
Third Top
Botto
m
Seco
nd
Third Top
Perc
enta
ge
5 5 4 4 5 5 4 3 6 4 3 4
4 6 10 113 6 7 6
6 7 7 80.5!
13 3
23 6 9 3 5 7
10
Parent PLUS, Middle Net Price Quartiles
0
5
10
15
20
25
30
35
40
45
50
Year and Income Quartile
$10,000 or More$5,000–9,999$1–4,999
2004
Botto
m
Seco
nd
Third Top
2008 2012
Botto
m
Seco
nd
Third Top
Botto
m
Seco
nd
Third Top
Perc
enta
ge
4 4 3 2 3! 2! 2 27
3 3 2
9 8 116 4 6 5 4
7
6 75
9 13
18
21
1118 20 22
18 26 27
26
Parent PLUS, Top Net Price Quartile
10
LOOKING BACKWARD OR LOOKING FORWARD? ANDREW P. KELLY AND KEVIN J. JAMES
more likely to have a private loan than a Parent PLUS loan. And the gaps in private loan borrowing across income groups evident in 2012 were less evident in 2008 and 2004. In fact, the pattern is nonexistent among students paying net prices in the top quar-tile, where families in the bottom and second income quartiles borrowed at rates comparable to their more affluent peers. In 2008, 45 percent of borrowers in the bottom income group who faced a high net price took on a private loan, about the same percentage as fami-lies in the third income quartile. (See Figure 4.) Private borrowing rates were lower overall in 2004, but families paying high net prices were about equally likely to rely on private loans regardless of their income.
Bear in mind that the composition of borrowers in each group was changing over time. Collectively, though, the figures tell a familiar story about the credit market in the first decade of the 2000s. The private loan numbers from 2008 reflect the credit boom of the pre-recession period. When the housing bubble burst and the secondary market for loan-backed securities shrank, private loan markets tightened up dramatically, and lenders raised underwriting standards. In the NPSAS data, we see that in the marked shift from private loans to Parent PLUS between 2008 and 2012. To be clear: even though private lenders extended credit to a wider array of students and families in 2008 than they do today, that does not necessarily mean that those loans encouraged responsible borrowing and market disci-pline—as the housing market of that era can attest to.
Aggregate data from other sources echo the changes we see in the individual-level data. MeasureOne’s data show that private student loan disbursements from the six largest private lenders hit $7 billion in 2008–09 and fell to $5.7 billion in 2010–11 and $6 billion in 2011–12.16 Recall though that those dollars were spread across more students, because the recession drove a boom in enrollments. The Con-sumer Financial Protection Bureau (CFPB) estimates that the private loan volume at large bank lend-ers went from $10.1 billion in 2008 to $5.6 billion in 2010.17 That same report also found a marked decline in student loan asset-backed securities, from a high of more than $16 billion in 2006 to about $3 billion in 2011.
These aggregate data also suggest that under- writing standards tightened post-crisis. According to MeasureOne, almost 94 percent of undergraduate loans had a cosigner in academic year 2014–15.18 That is up from 74 percent in 2008–09. The CFPB’s analysis of data from large lenders found that more than 90 per-cent of private loans had a cosigner in 2011, compared with just over 50 percent in 2005.19 The average FICO scores of private loan borrowers also increased post-crisis, from about 650 in 2007 to more than 700 by 2011.
These trends indicate that private loans are a small part of the higher education market and that their role shrunk over the past decade. This mainly reflects the financial crisis and the subsequent credit crunch, but also the expansion of federal loan limits for undergrad-uate and graduate students. To many advocates, this likely reads as a success story—fewer students are bor-rowing private loans with higher interest rates and no income-based protections. Many students and families probably see the expansion of federal programs as a win as well.
But there are still reasons to ask whether private lending could play a more productive role than it does today, especially in light of continued concerns about tuition inflation, college quality, and the performance of the federal loan portfolio. To answer that question, however, it is helpful to know more about the under-writing methodologies used by private lenders.
The Status Quo in Private Student Loan Under-writing. How do lenders decide who should get a pri-vate student loan and on what terms? The data seem to suggest that most private lenders have adopted tra-ditional underwriting standards. More than 9 in 10 private student loans have a cosigner. The individual- level analyses show that lower-income borrowers fac-ing higher net prices were less likely to borrow on the private market than higher-income peers facing similar prices in 2012. But do underwriting standards explain these patterns? And are lenders experimenting with new underwriting models?
To fill in these blanks, we conducted a series of inter-views with private lenders and industry experts to ask them about current underwriting practices. In all, we conducted 12 interviews, seven with lenders and five
11
LOOKING BACKWARD OR LOOKING FORWARD? ANDREW P. KELLY AND KEVIN J. JAMES
with industry experts. The lenders represented a mix of newer entrants to the marketplace and larger, more established players. MeasureOne estimates that the six leading private lenders are responsible for two-thirds of the outstanding private loan balances; we interviewed representatives at two of them.20 The industry experts come from a wide variety of backgrounds, including a former regulator, people with experience at private lenders, and student-aid analysts. While far from a rep-resentative sample, the mix of interviewees provided a variety of perspectives on the private lending industry.
Overall, the interviews confirmed our sense that most lenders have adopted a backward-looking and largely traditional underwriting model. Larry Lutz, senior vice president at USA Funds and an expert on the private student loan industry, summed up the sta-tus quo: “The vast preponderance of loans continue today to be based on traditional underwriting models that are some combination of borrower and cosigner credit scores and—in some cases—debt-to-income ratios.”21 In fact, most private student loans tend to be based primarily on the financial situation of the cosign-ers (usually parents), rather than on the students’ future situations.
Dan Feshbach, founder and CEO of MeasureOne, stated succinctly, “What’s going on in the private stu-dent market right now is family lending rather than stu-dent lending.”22 Financial aid expert Mark Kantrowitz agreed: “What you’re really doing is a traditional loan to a parent borrower based on the parent’s credit scores and the parent’s ability to repay. It’s almost like ignoring the student entirely.”23
New Underwriting Models. While traditional under-writing models are most common, a small but growing number of firms are lending to students on the basis of additional information, including estimates of future earnings. For example, a newer lender named MPower Financing opts against using traditional credit scores at all in its underwriting, a decision driven by part of its mission: to finance international students who typi-cally have no credit history in the United States. In lieu of credit scores, the firm considers an array of factors including the quality of the institution, internships the student has taken advantage of, and the likely return
on investment of the student’s program, with no one factor determining whether a student will get fund-ing.24 MPower is still relatively small, though; they are on track to originate $20–40 million in loans in 2016 out of an overall industry size of roughly $8 billion.25
Other new entrants rely on a mix of traditional credit scores and other factors. One example is Skills Fund, a new organization that lends only to students who attend boot camp programs that meet partic-ular benchmarks on student outcomes. Skills Fund Founder Rick O’Donnell told us, “We base our under-writing partly on the prospective income of the student after they’ve completed a program, and that’s how we are able to lend to many more students.”26
Skills Fund recently announced that it had decided not to partner with 25 percent of the schools the firm has evaluated. According to O’Donnell, the primary reasons Skills Fund passes on a provider are low return on investment or a sense that they are “not ready for prime time”—for example, they have not shown suffi-cient employer engagement or gone through the licen-sure process.27
Pave, which makes loans for education and other projects, has also adopted an augmented underwriting model. David Rosen, Pave’s chief credit officer, noted that the firm looks at factors such as program-level attrition rates, placement rates, and graduates’ starting salaries. Eventually, Pave hopes to be able to lend with-out requiring FICO scores from applicants.28
Climb Credit, founded in 2014, has established partnerships with more than 60 providers that it has determined provide students with a positive return on investment.29 By including factors beyond traditional credit measures, these lenders can identify prospects who may lack a credit history but would likely be able to repay a loan after school.
Most private student loans tend to be
based primarily on the financial situation
of the cosigners (usually parents), rather
than on the students’ future situations.
12
LOOKING BACKWARD OR LOOKING FORWARD? ANDREW P. KELLY AND KEVIN J. JAMES
Interestingly, some of these forward-looking lend-ers insist that partner institutions not only meet out-come benchmarks but also share in the risk of the loans made to their students. O’Donnell, for exam-ple, explained how institutions in Skills Fund’s port-folio are responsible for a portion of the losses that result from loan defaults. This practice, he says, helps to align the incentives for all parties involved.30 Climb Credit and Goal Structured Solutions (GS2), another lender experimenting with a forward-looking model, have established similar risk-sharing arrangements with partner institutions.31
While these innovative lenders are growing quickly, they represent a drop in the private lending bucket. The majority of private loans are made the old-fashioned way: credit scores and cosigners. As Ken Ruggiero, CEO of GS2, emphasized about current models, “The incumbent lenders provide much-needed liquidity to families, but in a significant majority of the cases, it’s the cosigner’s credit that helps the student get the loan.”32
That approach clearly excludes many students who face credit constraints. As Lutz explained, “There are certainly a lot of people out there today who cannot get a [private] student loan on their own credit and who are unable to produce a creditworthy cosigner.”33
Are there obstacles that stand in the way of greater experimentation with nontraditional underwriting models? The next section focuses on concerns that interviewees cited as constraints on the growth of forward-looking lending approaches.
Constraints on New Underwriting Models
It is not clear that the private student loan market must operate the way it does today. Indeed, our interview-ees identified several factors that seem to stack the deck against innovative underwriting. Some of these factors reflect the nature of higher education as an investment and the financial challenge of building a sustainable lending business based on new, untested models—aspects policymakers will be hard-pressed to change. But other obstacles reflect statute and regulation, which suggests that targeted reforms could help foster a wider array of private loan options for students.
Fair Lending Requirements of the Equal Credit Opportunity Act. Many interviewees felt that the fair lending requirements of the federal Equal Credit Opportunity Act (ECOA)—as well as similar state laws, where applicable—may unintentionally stunt the development of nontraditional student lending models. In general, the ECOA prohibits lenders from discrim-inating on the basis of protected characteristics, specif-ically “race, color, religion, national origin, sex, marital status, age, because an applicant receives income from a public assistance program, or because an applicant has in good faith exercised any right under the Con-sumer Credit Protection Act.”34 In its most basic form, the law prohibits lenders from intentionally discrimi-nating—in providing access to credit and pricing that credit—based on protected characteristics, a practice known as “disparate treatment.”
Our interviewees did not express concern about this law’s basic goal, which is namely to prevent discrimi-nation against particular groups that have historically encountered prejudice. Nor did the interviewees sug-gest that the disparate treatment standard was an obsta-cle to alternative underwriting methodologies.
But many did raise concerns about the potential application of the law’s “disparate impact” standard to new underwriting models.35 Under disparate impact, a lender’s practices may conflict with the ECOA even absent intentional discrimination if a factor used in the underwriting process results in lending decisions that have a discriminatory effect on a protected class of bor-rowers.36 For instance, in employment decisions—the origin of disparate impact—an employer could be lia-ble for disparate impact discrimination if a written test administered to all applicants impedes a protected class, unless there is a defensible business purpose for the test and there are no less discriminatory ways to achieve the same goal.37
In consumer lending, regulators have generally allowed the use of credit scores for underwriting pur-poses, despite their obvious correlation with key demo-graphic characteristics. But the emergence of alternative lending methodologies may make disparate impact issues more likely, and financial regulators have indi-cated that they are following the growing alternative lending industry carefully.38
13
LOOKING BACKWARD OR LOOKING FORWARD? ANDREW P. KELLY AND KEVIN J. JAMES
In the context of student lending, there appears to be little precedent regarding disparate impact. How-ever, a 2012 report by the CFPB explicitly mentioned concerns about whether lenders’ use of institutional Cohort Default Rates (CDR) in underwriting raised potential fair lending flags:
Private student lenders’ use of CDR at very low default levels may present fair lending concerns because, as discussed below, racial and ethnic minority students are disproportionately concentrated in schools with higher CDRs. Accordingly, use of CDR to determine loan eligibility, underwriting, and pricing may have a disparate impact on minority students by reducing their access to credit and requiring those minority stu-dents who meet the lenders’ eligibility thresholds to pay higher rates than are otherwise available to sim-ilarly creditworthy non-Hispanic White students at schools with lower CDRs.39
The report does not definitively state that lenders’ use of CDR as part of their underwriting criteria actu-ally violates fair lending prohibitions; as the authors note, the agency lacked the application-level data nec-essary to make those determinations. But the report makes clear that the bureau feels this practice may be a violation of fair lending requirements.
In light of statements such as these from regula-tors, interviewees felt that the disparate impact stan-dard could affect the availability of private loans that underwrite on a forward-looking basis. For example, one expert (who wished to remain anonymous) noted, “I would think it would be foolhardy to do [alternative underwriting] based on the current regulatory environ-ment and the state of the law.”40
O’Donnell suggested that a regulatory trigger would likely be inevitable: “I think it is highly likely some ambitious state attorney general will make a case out of lenders, in essence redlining and creating a disparate impact with new-fangled underwriting standards, regardless of whether those underwriting standards technically are valid. It’s a huge risk for all FinTech companies.”41 He argued that the smartest new firms have planned ahead for such regulatory challenges.
Others were more sanguine about reconciling alter-native underwriting methods and fair lending require-ments. Manu Smadja of MPower argued that, while fair lending laws pose a risk, he “wouldn’t go so far as to call them inhibiting.” He went on:
I think the laws are there for a reason. They’re based on the right intent, so companies that use these laws as an excuse not to innovate in this space I think are not being completely honest with themselves. Finan-cial institutions can apply forward-looking models and comply with existing regulation. In MPower’s case, we believe our forward-looking model is actu-ally a fairer system as, by definition, it doesn’t dis-criminate against one’s background and focuses on one’s potential.42
Some of these differences in perception likely hinge on the uncertainty and ambiguity that surrounds this area of law. As Rosen described, “I am not going to come out and say fair lending laws inhibit good risk management, but I am also not going to come out and say fair lending laws provide clear methods for demon-strating compliance.”43
On this point, it is important to note that a disparate impact finding would not necessarily violate the law. A lender can argue that even if a factor used in underwrit-ing creates a disparate impact, it is essential for business purposes and that there is no less discriminatory way to achieve the same end.44 In fact, such a defense will likely be crucial to the success of alternative underwrit-ing models because protected characteristics might cor-relate to other factors that lenders use in their model, such as the future earnings of graduates from a particu-lar school or program.
Mounting such a defense, however, might be diffi-cult and costly. And those costs might detract from—or outweigh—the potential benefit of adopting a forward-looking underwriting model. The anonymous industry expert pointed out that providing quantita-tive proof that a model is statistically valid—to the level that will satisfy a regulator—can be a time-consuming and expensive process. Many lenders may not have the incentive to risk adopting new underwriting techniques if doing so could lead to a protracted back-and-forth
14
LOOKING BACKWARD OR LOOKING FORWARD? ANDREW P. KELLY AND KEVIN J. JAMES
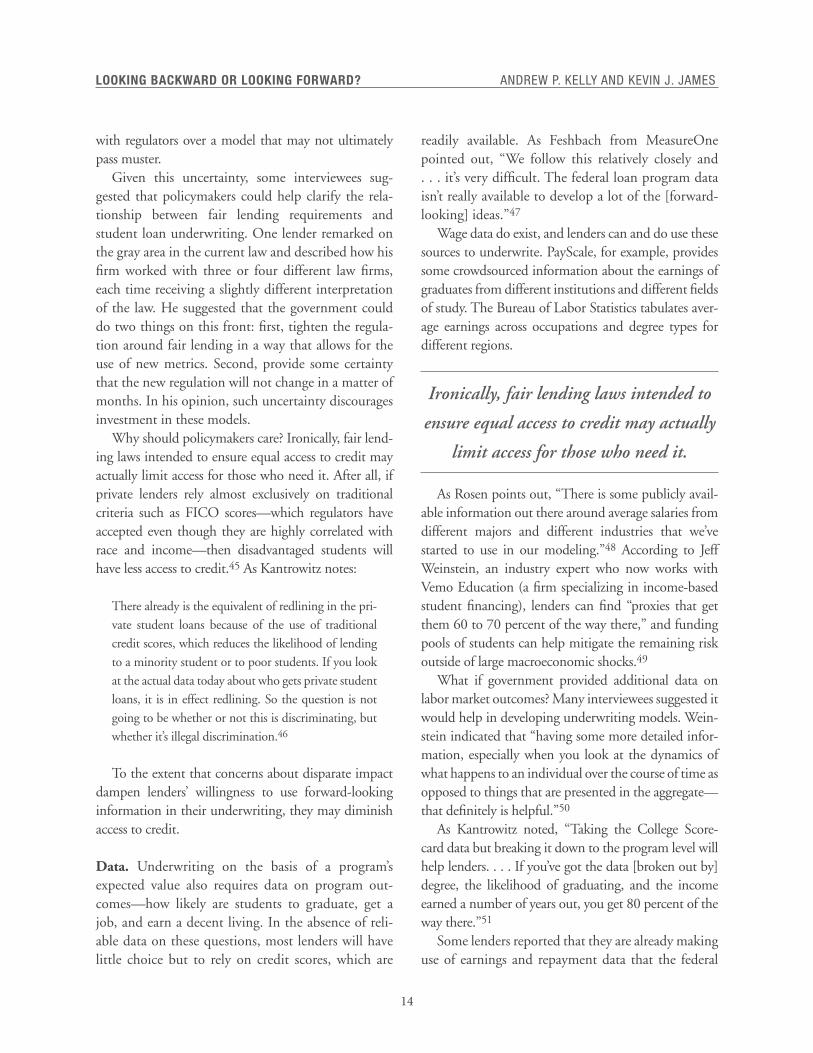
with regulators over a model that may not ultimately pass muster.
Given this uncertainty, some interviewees sug-gested that policymakers could help clarify the rela-tionship between fair lending requirements and student loan underwriting. One lender remarked on the gray area in the current law and described how his firm worked with three or four different law firms, each time receiving a slightly different interpretation of the law. He suggested that the government could do two things on this front: first, tighten the regula-tion around fair lending in a way that allows for the use of new metrics. Second, provide some certainty that the new regulation will not change in a matter of months. In his opinion, such uncertainty discourages investment in these models.
Why should policymakers care? Ironically, fair lend-ing laws intended to ensure equal access to credit may actually limit access for those who need it. After all, if private lenders rely almost exclusively on traditional criteria such as FICO scores—which regulators have accepted even though they are highly correlated with race and income—then disadvantaged students will have less access to credit.45 As Kantrowitz notes:
There already is the equivalent of redlining in the pri-vate student loans because of the use of traditional credit scores, which reduces the likelihood of lending to a minority student or to poor students. If you look at the actual data today about who gets private student loans, it is in effect redlining. So the question is not going to be whether or not this is discriminating, but whether it’s illegal discrimination.46
To the extent that concerns about disparate impact dampen lenders’ willingness to use forward-looking information in their underwriting, they may diminish access to credit.
Data. Underwriting on the basis of a program’s expected value also requires data on program out-comes—how likely are students to graduate, get a job, and earn a decent living. In the absence of reli-able data on these questions, most lenders will have little choice but to rely on credit scores, which are
readily available. As Feshbach from MeasureOne pointed out, “We follow this relatively closely and . . . it’s very difficult. The federal loan program data isn’t really available to develop a lot of the [forward- looking] ideas.”47
Wage data do exist, and lenders can and do use these sources to underwrite. PayScale, for example, provides some crowdsourced information about the earnings of graduates from different institutions and different fields of study. The Bureau of Labor Statistics tabulates aver-age earnings across occupations and degree types for different regions.
As Rosen points out, “There is some publicly avail-able information out there around average salaries from different majors and different industries that we’ve started to use in our modeling.”48 According to Jeff Weinstein, an industry expert who now works with Vemo Education (a firm specializing in income-based student financing), lenders can find “proxies that get them 60 to 70 percent of the way there,” and funding pools of students can help mitigate the remaining risk outside of large macroeconomic shocks.49
What if government provided additional data on labor market outcomes? Many interviewees suggested it would help in developing underwriting models. Wein-stein indicated that “having some more detailed infor-mation, especially when you look at the dynamics of what happens to an individual over the course of time as opposed to things that are presented in the aggregate— that definitely is helpful.”50
As Kantrowitz noted, “Taking the College Score-card data but breaking it down to the program level will help lenders. . . . If you’ve got the data [broken out by] degree, the likelihood of graduating, and the income earned a number of years out, you get 80 percent of the way there.”51
Some lenders reported that they are already making use of earnings and repayment data that the federal
Ironically, fair lending laws intended to
ensure equal access to credit may actually
limit access for those who need it.
15
LOOKING BACKWARD OR LOOKING FORWARD? ANDREW P. KELLY AND KEVIN J. JAMES
government released as part of the “gainful employ-ment” regulation and the revamped College Score-card. Ruggiero described how a nursing program that GS2 has partnered with is using federal data to facil-itate lending: “They have provided us with academic and gainful employment information so we can deter-mine and predict the quality of their graduates. The plan is to make the loan directly to the student with-out the need for a cosigner.”52
Smadja said that MPower Financing pounced on the newly available federal Scorecard data: “As soon as the new College Scorecard came out, we used that data in our models.”53 It follows that efforts to make addi-tional student-outcome data available would further enable forward-looking lending models.
Securitization. Securitization—the practice of pack-aging loans and selling them as an asset-backed secu-rity on the secondary market—is essential to lenders’ ability to raise capital on a large scale. But it can also dampen innovations in underwriting. Specifically, if potential investors see more risk than upside in using factors other than credit scores to make and price loans, then lenders who wish to experiment with new metrics will have difficulty raising capital. As Kan-trowitz notes:
The way the capital markets view these kinds of things is like a traditional loan. What is the interest rate on the loan? Is it fixed or variable? What is the repayment term, and what are the credit scores? They are very comfortable predicting the cash flows based on that.
The fact that this borrower might be a better bet—they ignore it. It’s not something that goes into the investor’s decision making because there isn’t enough historical data for them to say, “Well, this is going to influence the cash flows in this way.” And so they’re using what they know, what they’re comfortable with, to decide whether or not to invest.54
Others agreed. “People want to securitize these loans,” said Rosen. “So, to be able to package them and get rated by a rating agency, for some of the bigger companies it’s very easy to do if you have a standard measure like FICO. It’s a lot harder to do that if you
have a proprietary underwriting that doesn’t have years of history.”55
Lutz stated that “asset-backed securitization mar-kets—and the rating agencies upon which investors in those markets rely—will tell you that until you can show 10 years of regressive data on how these factors perform, you’re not going to get any credit for them. Until these data exist, the operating assumption is that you’re just handing out money.”56
This sets up something akin to a chicken-or-egg problem: investors are reluctant to purchase loans that deviate from traditional underwriting models unless lenders can demonstrate a track record with their cri-teria. However, investor reticence makes it difficult for lenders to raise the capital needed to test and prove those models. As a result, lenders attempting to offer these types of options may have to do so at a relatively small scale for quite a long time.
While Smadja agrees about the current appetite among investors, he and others were more bullish on the potential secondary market, arguing that “there is definitely the capability in [the investor] space. . . . We’re dealing with very sophisticated analysts who are used to working with a lot more data and who are just not given that option currently. I think there will be a lot of appetite in the secondary market.”57
Ruggiero also appeared optimistic, making his pitch to investors based on the outcomes achieved by his institutional partners: “Let’s talk about the quality of the institution, the quality of the program, and then the quality of the graduates.”58
It may help to look at trends in consumer credit markets more broadly. After all, as noted earlier, sev-eral new lenders are exploring alternative underwrit-ing approaches and growing rapidly in the process. For instance, SoFi, a lender founded in late 2011 and employing its own alternative underwriting approach, had completed $2.6 billion in student loan securities by December 2015.59 Thus, there is clearly some appe-tite among investors for consumer loans that deviate from traditional underwriting, although SoFi is mainly focused on refinancing federal loans to graduate stu-dents, a low-risk proposition. Loans made directly to undergraduates based on new criteria are obviously a very different product.
16
LOOKING BACKWARD OR LOOKING FORWARD? ANDREW P. KELLY AND KEVIN J. JAMES
In the end, it remains to be seen whether inves-tors will recognize and reward these new underwrit-ing models. Weinstein sees a “little bit of a slog” to get to the point where investors trust alternative educa-tion lenders: “I think there is a big upfront hurdle in developing that track record for some kind of finan-cial instrument that doesn’t have collateral and doesn’t have any kind of cosigner.”60
Market Size and Crowd Out. Finally, there is the ele-phant in the room: the impact of federal loans on the market for private loans. As mentioned earlier, because taxpayer subsidies provide very favorable terms, federal loans represent an overwhelming fraction of the student loan market, with private loans occupying a small niche.
Private loans are mostly used to “top off” students who run into federal loan limits or to finance programs that are not eligible for federal aid. They are comple-ments to federal loans, not substitutes. In fact, federal law requires that financial aid administrators encour-age students to exhaust their federal loans before going to the private market. Interviewees suggested that the dominance of federal loans makes it difficult for new, innovative lenders to reach the kind of scale necessary to build a profitable and sustainable business model. O’Donnell in particular emphasized the importance of scale to any lending enterprise:
In financing, scale is everything if you want to be profit-able without having to charge usurious rates. The fixed costs for a bank or any lender to originate a hundred million dollars of loans is almost the same as the cost to originate a billion dollars of loans. Markets where the total new loans issued in a year are under a billion dollars are generally considered to be a niche market.
The mortgage industry, the auto industry, and the credit card industry are tens of billions of dollars a year. If you are a bank, you’ve got to hire salespeople, develop underwriting expertise, invest in the technology, invest in the servicing, and invest in regulatory compliance, and the costs are too high to justify a small niche.61
Some of the additional costs—and risks—that come with forward-looking underwriting only reinforce these questions of scale. Some of these costs relate to the need to develop new models: investments in data, research, and analysts that could involve substantial time and money. Some costs relate to the establishment of part-nerships with institutions, such as those Skills Fund relies on when determining which schools to finance. Finally, some costs are regulatory. A former regulator (who also wished to remain anonymous) argued that the risks associated with these lending models might not be worth it given the limited size of the private stu-dent lending market:
How big is the private student loan market, $6 to $7 billion? If you’re a large bank, how much effort do you put into your private student loan business to buf-fer it against potential fair lending issues when, even if you garner 10 percent of the market, it’s $600 mil-lion per year? Look at that in comparison to what your mortgage and your auto book might be. It just may not be worth the effort in many ways.62
As a result, some interviewees argued that new pri-vate lending models would likely become more prev-alent if the industry had additional space to expand. Weinstein, for example, argued that “if the federal loan programs were more targeted to specific student popu-lations, more specific student circumstances, and more specific program types, then there would be more of an opportunity for this type of alternative funding.”63
Policy Implications
Some of the factors highlighted earlier represent intrinsic hurdles to adopting and expanding new, more forward-looking underwriting methods. For
Federal law requires that financial aid
administrators encourage students to
exhaust their federal loans before
going to the private market.
17
LOOKING BACKWARD OR LOOKING FORWARD? ANDREW P. KELLY AND KEVIN J. JAMES
example, it will take some time to develop enough of a track record to demonstrate the viability of a par-ticular model to third-party investors. That said, we highlight three steps that policymakers could take to facilitate the development of these models, as well as one note of caution.
Investigate and Clarify Fair Lending Laws’ Effect on Nontraditional Underwriting. Many interviewees felt that disparate impact concerns were dampening exper-imentation with alternative lending models. That said, it would be premature—and outside the scope of this paper—to argue for any particular changes to federal antidiscrimination laws. Instead, additional analysis and research regarding the degree to which these laws may—or may not—inhibit underwriting practices in student finance could benefit students and the system as a whole.
Given the potential benefits of underwriting meth-odologies that could extend credit to underserved groups and reward quality programs and institutions, policymakers and researchers should look more closely at the interaction of these two policy areas. If further research unearths particular barriers to innovation, pol-icymakers should identify opportunities to offer addi-tional clarity on what practices are acceptable while maintaining fair lending protections.
Make More Data Available About Programmatic and Institutional Performance. As we discussed ear-lier, forward-looking underwriting requires labor mar-ket data that enable lenders to predict future income. Some data are already available, such as various state-level longitudinal databases. The revised College Score-card, which included a wide range of performance information about institutions, is already in use by some lenders using a forward-looking approach.
But the federal government could go further in making student-outcome information—disaggregated by program and institution—available to the public and to third parties such as private lenders. Regret-tably, legislation passed in 2008 prohibits the federal government from collecting the kind of student-level data necessary to develop accurate completion and labor market metrics. Policymakers—particularly
conservatives—who wish to promote private lending activity in higher education should consider ways to provide the sort of data that would help new under-writing models take root while protecting privacy and preventing federal overreach.
Cap Federal PLUS Loans and Create More Space for Alternative and Forward-Looking Private-Sector Options. The federal PLUS loan program currently entitles graduate students and parents of dependent undergraduates to borrow up to the cost of attendance with no annual or lifetime limits. There are significant problems associated with this policy: graduate students and parents can easily borrow more than they will be able to repay, leaving taxpayers on the hook for collec-tion costs and unpaid balances. Lending without regard to an institution’s quality or price likely contributes to tuition inflation, exacerbating college affordability problems. Finally, such expansive access to federal credit likely crowds out some of the innovative private lend-ing models highlighted in this paper, models that could put greater market pressure on colleges to increase the value of their programs. In light of these issues, pol-icymakers and researchers from across the ideological spectrum have advocated for reforms to PLUS loans.
Policymakers might therefore consider moving from a federal lending program that makes unlimited credit available and has little private-sector participa-tion toward one that has stricter limits in place and space for innovative private options to fill resulting gaps. Borrowing limits would help protect students and taxpayers while mitigating the inflationary effects that federal loans have on tuition. Private underwrit-ing could also inject greater market discipline, espe-cially if they had the latitude and incentive to lend on a forward-looking basis.
Some critics may ask whether limiting PLUS would jeopardize access to credit for some students, especially since forward-looking private lending is still exception-ally rare. This is an important question, and there is a potential chicken-or-egg problem here. Federal crowd out limits the market for private lenders now, but it is unclear whether private lenders would expand access to credit immediately after caps were added to PLUS loans. Without better data and greater clarity on fair
18
LOOKING BACKWARD OR LOOKING FORWARD? ANDREW P. KELLY AND KEVIN J. JAMES
lending, it is not clear they would be able to even if they wanted to.
But it is worth considering a few responses. First, Parent PLUS is not a loan to students but rather to parents—thus traditional underwriting approaches employed by most lenders would likely ensure that parents who have a reasonable ability to repay a loan are able to get one. Second, graduate students repre-sent the least-risky segment of student borrowers and are often choosing programs with clear career paths, making it much more likely that forward-looking options will proliferate quickly absent unlimited federal borrowing. Indeed, some new lenders such as SoFi already originate loans for particular Mas-ters in Business Administration programs.64 Finally, even absent a quick expansion in private credit in the wake of PLUS reforms, policymakers should consider whether federal loans must ensure access to any pro-gram at any price—rather than access to a range of reasonably priced options—given all the attendant costs of such a policy.
Be Wary of Government Guarantees. Some policy-makers may be tempted to try to expand the role of private lending markets by restoring FFELP, the guar-anteed lending program that existed until 2010, or by implementing a reformed version of that program.65 However, policymakers should be skeptical of this approach.
FFELP was “private” and “market-based” in name only; lenders had little discretion over the terms of the loans they made and the students and institutions that were eligible. They also bore almost no risk should their loans default; the program guaranteed 97 percent of each loan’s principal and interest. Whether the bor-rower repaid or defaulted, the bank was paid almost in full. In other words, FFELP included essentially no underwriting, and banks had little incentive to do any, forward-looking or otherwise.
Private loans with massive government guarantees (such as those made under FFELP) bear little resem-blance to the types of forward-looking private loan models we discussed. And while some of these chal-lenges can be mitigated by providing lenders with only a partial guarantee that is much smaller, there is signifi-cant potential for such a system to unravel as Congress attempts to use additional guarantees and subsidies to expand access to credit. Given the promising devel-opments in the private lending market, policymakers would be better served trying to reduce legal and infor-mational obstacles to innovative, purely private lenders.
Concluding Remarks
The emerging revolution in consumer finance, in which startups are moving beyond credit scores to use new measures of creditworthiness, could reshape pri-vate student lending. This would be a good thing: clearly the traditional, backward-looking models that dominate the market today fall short of what the mar-ket needs. Under the status quo, many students who could benefit from additional financing likely lose out, and the system muddles along with lots of credit but little accountability.
In contrast, a private finance market built around a broader set of underwriting criteria has the poten-tial to expand opportunity while strengthening mar-ket discipline in the sector. As Smadja says of MPower’s approach, “[our model] is entirely dependent on the student’s potential. . . . We thought it wouldn’t be fair to judge students by who or how wealthy their parents are or where in the world they came from.”66
Predicting how the industry will ultimately evolve is difficult. However, policymakers and researchers who wish to see greater private involvement can work to identify obstacles to forward-looking underwriting while ensuring consumer protection.
19
LOOKING BACKWARD OR LOOKING FORWARD? ANDREW P. KELLY AND KEVIN J. JAMES
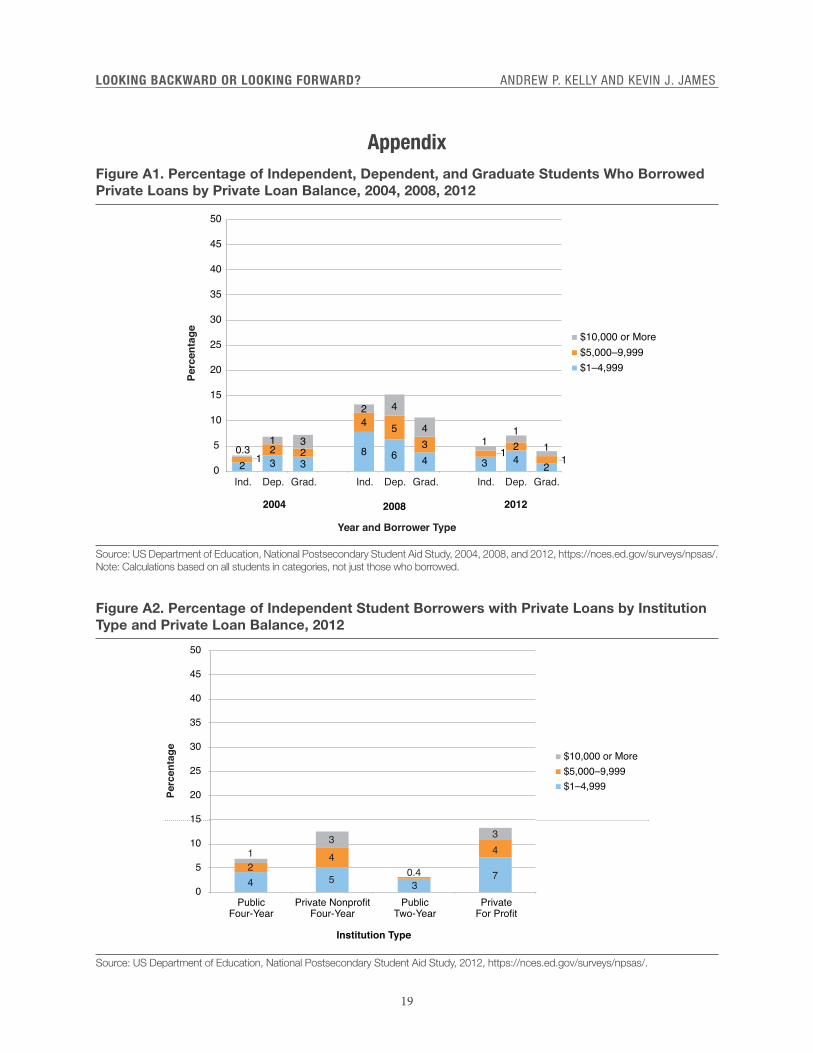
AppendixFigure A1. Percentage of Independent, Dependent, and Graduate Students Who Borrowed Private Loans by Private Loan Balance, 2004, 2008, 2012
Source: US Department of Education, National Postsecondary Student Aid Study, 2004, 2008, and 2012, https://nces.ed.gov/surveys/npsas/. Note: Calculations based on all students in categories, not just those who borrowed.
0
5
10
15
20
25
30
35
40
45
50
2004 2008 2012
$10,000 or More$5,000–9,999$1–4,999
Perc
enta
ge
Year and Borrower Type
Ind. Dep. Grad. Ind. Dep. Grad. Ind. Dep. Grad.2 3 3
8 6 4 3 42
12 2
4 53
1 21
0.31 3
2 4
41
11
Figure A2. Percentage of Independent Student Borrowers with Private Loans by Institution Type and Private Loan Balance, 2012
Source: US Department of Education, National Postsecondary Student Aid Study, 2012, https://nces.ed.gov/surveys/npsas/.
0
5
10
15
20
25
30
35
40
45
50
PublicFour-Year
Private NonprofitFour-Year
PublicTwo-Year
PrivateFor Profit
Institution Type
$10,000 or More$5,000–9,999$1–4,999
Perc
enta
ge
4 5 37
24
0.4
413 3
20
LOOKING BACKWARD OR LOOKING FORWARD? ANDREW P. KELLY AND KEVIN J. JAMES
Figure A3. Percentage of Independent Student Borrowers with Private Loans by Income Quartile and Private Loan Balance, 2004, 2008, 2012
Source: US Department of Education, National Postsecondary Student Aid Study, 2004, 2008, and 2012, https://nces.ed.gov/surveys/npsas/. Note: Income quartiles correspond to student and spousal income (INDEPINC); income and net price quartiles vary from year to year. See Appendix Table 1 for details. Interpret percentages marked with “!” caution; the standard error on those estimates represents more than 30 percent of estimate.
4 4 4 4
16 15 1512
5 4 5 52 2 2 2
7 7 77
2 2 2 21 1 1 0.5!
3 3 34
2 1 1 1
0
5
10
15
20
25
30
35
40
45
50
$10,000 or More$5,000–9,999$1–4,999
Year and Income Quartile2004
Botto
m
Seco
nd
Third Top
2008 2012
Botto
m
Seco
nd
Third Top
Botto
m
Seco
nd
Third Top
Perc
enta
ge
21
LOOKING BACKWARD OR LOOKING FORWARD? ANDREW P. KELLY AND KEVIN J. JAMES
Figure A4. Percentage of Independent Borrowers with Private Loans, by Income Quartile, Net Price Quartile, and Private Loan Balance, 2004, 2008, 2012
Continued on the next page
5
10
15
20
25
30
35
40
45
50
Perc
enta
ge
Year and Income Quartile
$10,000 or More$5,000–9,999$1–4,999
2004
Botto
m
Seco
nd
Third Top
2008 2012
Botto
m
Seco
nd
Third Top
Botto
m
Seco
nd
Third Top
0 3 2! 2! 2!
13 11 127
4 3 3 2
0.2!!0.2!! 0.1!!
1!0.1!! 1!!
Bottom Net Price Quartile
Net Price Less than $7,500
Middle Net Price Quartiles
0
5
10
15
20
25
30
35
40
45
50
Perc
enta
ge
Year and Income Quartile
$10,000 or More$5,000–9,999$1–4,999
2004
Botto
m
Seco
nd
Third Top
2008 2012
Botto
m
Seco
nd
Third Top
Botto
m
Seco
nd
Third Top
4 4 3 41 1 2 1!
0.1!! 0.3!! 15 16 15 13
6 6 67
1 1 1! 1
5 5 5 4
2 2 31
1! 1! 1!0.2!!
22
LOOKING BACKWARD OR LOOKING FORWARD? ANDREW P. KELLY AND KEVIN J. JAMES
0
5
10
15
20
25
30
35
40
45
50
Perc
enta
ge
Year and Income Quartile
$10,000 or More$5,000–9,999$1–4,999
2004
Botto
m
Seco
nd
Third Top
2008 2012
Botto
m
Seco
nd
Third Top
Botto
m
Seco
nd
Third Top
8 6 5 6
1915
18 16
5 5 6 8
76 6 5
16
13
1614
5 4 44
33 2 1!
10
12
913
6 4 4 3
Figure A4. Percentage of Independent Borrowers with Private Loans, by Income Quartile, Net Price Quartile, and Private Loan Balance, 2004, 2008, 2012 (continued)
Source: US Department of Education, National Postsecondary Student Aid Study, 2004, 2008, and 2012, https://nces.ed.gov/surveys/npsas/. Note: Income quartiles correspond to student and spousal income (INDEPINC); income and net price quartiles vary from year to year. See Appendix Table 1 for details. Interpret percentages marked with “!” or “!!” with caution; the standard error on those estimates represents more than 30 percent or 50 percent of estimate, respectively.
Top Net Price Quartile
23
LOOKING BACKWARD OR LOOKING FORWARD? ANDREW P. KELLY AND KEVIN J. JAMES
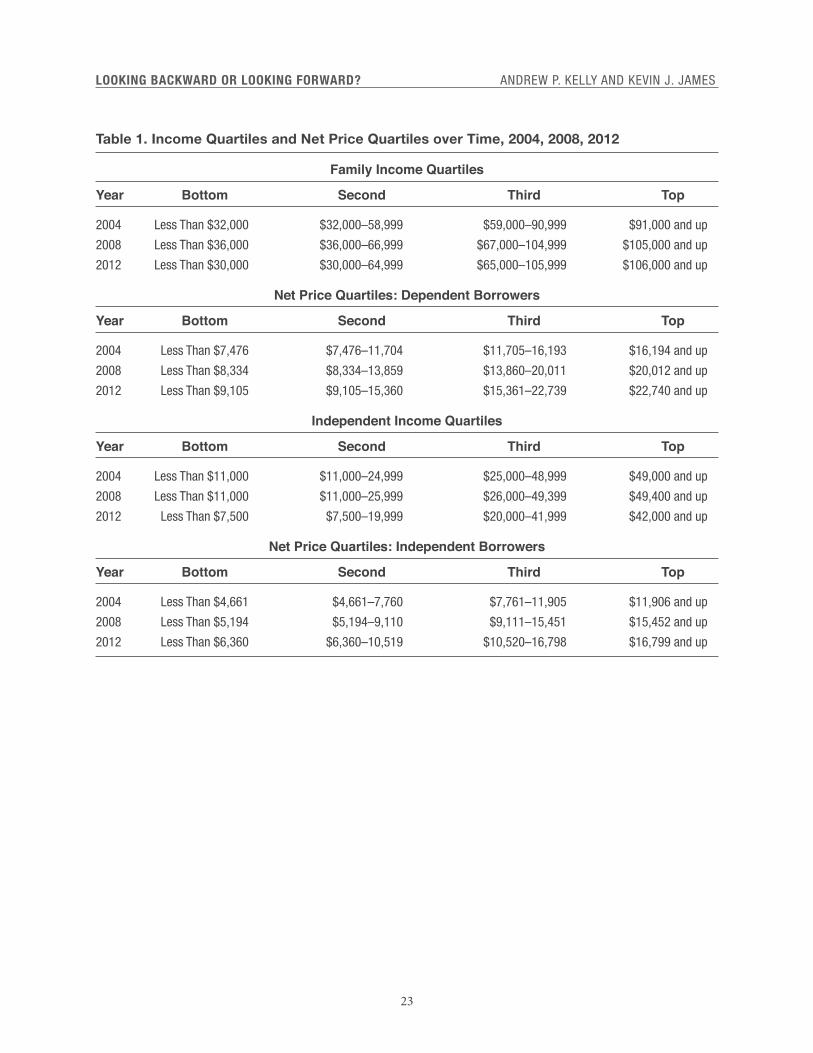
Table 1. Income Quartiles and Net Price Quartiles over Time, 2004, 2008, 2012
Family Income Quartiles
Year Bottom Second Third Top
2004 Less Than $32,000 $32,000–58,999 $59,000–90,999 $91,000 and up
2008 Less Than $36,000 $36,000–66,999 $67,000–104,999 $105,000 and up
2012 Less Than $30,000 $30,000–64,999 $65,000–105,999 $106,000 and up
Net Price Quartiles: Dependent Borrowers
Year Bottom Second Third Top
2004 Less Than $7,476 $7,476–11,704 $11,705–16,193 $16,194 and up
2008 Less Than $8,334 $8,334–13,859 $13,860–20,011 $20,012 and up
2012 Less Than $9,105 $9,105–15,360 $15,361–22,739 $22,740 and up
Independent Income Quartiles
Year Bottom Second Third Top
2004 Less Than $11,000 $11,000–24,999 $25,000–48,999 $49,000 and up
2008 Less Than $11,000 $11,000–25,999 $26,000–49,399 $49,400 and up
2012 Less Than $7,500 $7,500–19,999 $20,000–41,999 $42,000 and up
Net Price Quartiles: Independent Borrowers
Year Bottom Second Third Top
2004 Less Than $4,661 $4,661–7,760 $7,761–11,905 $11,906 and up
2008 Less Than $5,194 $5,194–9,110 $9,111–15,451 $15,452 and up
2012 Less Than $6,360 $6,360–10,519 $10,520–16,798 $16,799 and up
24
LOOKING BACKWARD OR LOOKING FORWARD? ANDREW P. KELLY AND KEVIN J. JAMES
Acknowledgments
We would like to thank our interviewees for their invaluable insights on the private student loan mar-ketplace: Dan Feshbach and Chris Keaveney of MeasureOne, Mark Kantrowitz of Cappex.com, Larry Lutz of USA Funds, Rick O’Donnell of Skills Fund, David Rosen of Pave, Ken Ruggiero of Goal Structured Solutions, Manu Smadja of MPower Financing, Jeff Weinstein of Vemo Education, and others.
About the Authors
Andrew P. Kelly is the director of AEI’s Center on Higher Education Reform. Kevin J. James is director of higher education at the Jain Family Institute and a former research fellow at AEI.
25
LOOKING BACKWARD OR LOOKING FORWARD? ANDREW P. KELLY AND KEVIN J. JAMES
Notes
1. Mark Kantrowitz, Who Graduates with Excessive Student Loan Debt?, MK Consulting Inc., December 14, 2015, http://