LOOKING THROUGH THE “GLASS CEILING”: A CONCEPTUAL FRAMEWORK FOR THE PROBLEMS OF SPECTRAL SIMILARITY Ioannis Karydis Dept. of Informatics Ionian University Greece [email protected]Miloˇ s Radovanovi´ c Faculty of Science University of Novi Sad Serbia [email protected]Alexandros Nanopoulos Inst. of Computer Science University of Hildesheim Germany [email protected]Mirjana Ivanovi´ c Faculty of Science University of Novi Sad Serbia [email protected]ABSTRACT Spectral similarity measures have been shown to exhibit good performance in several Music Information Retrieval (MIR) applications. They are also known, however, to pos- sess several undesirable properties, namely allowing the existence of hub songs (songs which frequently appear in nearest neighbor lists of other songs), “orphans” (songs which practically never appear), and difficulties in distin- guishing the farthest from the nearest neighbor due to the concentration effect caused by high dimensionality of data space. In this paper we develop a conceptual framework that allows connecting all three undesired properties. We show that hubs and “orphans” are expected to appear in high-dimensional data spaces, and relate the cause of their appearance with the concentration property of distance / similarity measures. We verify our conclusions on real mu- sic data, examining groups of frames generated by Gaus- sian Mixture Models (GMMs), considering two similar- ity measures: Earth Mover’s Distance (EMD) in combi- nation with Kullback-Leibler (KL) divergence, and Monte Carlo (MC) sampling. The proposed framework can be useful to MIR researchers to address problems of spectral similarity, understand their fundamental origins, and thus be able to develop more robust methods for their remedy. 1. INTRODUCTION The notion of audio-based music similarity is generally considered to be complex, subjective, and context depen- dent [13]. However, spectral similarity measures [2,10] are receiving a growing interest and have been shown to ex- hibit good performance in several Music Information Re- trieval (MIR) applications [14]. These measures describe aspects related to timbre and model the “global sound” of a musical signal based on features called Mel Frequency Cepstrum Coefficients (MFCCs). Despite the advantages of spectral similarity measures, related research has also reported a number of undesired properties, summarized as follows: Permission to make digital or hard copies of all or part of this work for personal or classroom use is granted without fee provided that copies are not made or distributed for profit or commercial advantage and that copies bear this notice and the full citation on the first page. c 2010 International Society for Music Information Retrieval. • The existence of hub songs (also called “always sim- ilar”) [2], which are close neighbors of many other pieces to which they hold no perceptual similarity, thus increasing the rate of false positives. • The existence of “orphans” (also called “never simi- lar”) [12], which are songs that rarely become close neighbors of any other piece (despite possibly hav- ing perceptual similarity to a large number of songs), increasing therefore the rate of true negatives. • Songs are represented in a feature space whose di- mensionality is determined by the number of fea- tures (MFCCs). As the dimensionality grows, it is becoming hard to identify meaningful nearest neigh- bors, since all songs tend to be at nearly the same distance from each other. This property was identi- fied in other research areas [1, 5, 8], but was also ex- amined in the contexts of MIR [6] and audio speech data (based on MFCCs) [18]. These undesired properties constitute some of the main causes for the empirically demonstrated upper limit for the performance of spectral similarity measures, referred to as the “glass ceiling” [2]. Recent research has focused mostly on the amelioration of hubness (the attribute of being a hub song), by proposing techniques for normalizing the dis- tances between songs in a way that reduces the influence of hubs [11,14,15], whereas other works [9,17,19] developed measures that try to avoid hubness. Our motivation is to develop a conceptual framework that allows for relating all three aforementioned undesired properties, and explains the mechanisms that create them. Aucouturier and Pachet [3] have focused on the analysis of hubness and concluded that the creation of homogenized models (i.e., models that ignore the least likely mixture components) are responsible for creating hubs. Despite this detailed conclusion, our emphasis is to disclose a more fundamental reason that causes all three undesired proper- ties, which is the high dimensionality of the feature space that originates from the need to use multiple MFCCs in order to capture the “global sound”. A conjecture about the role of high dimensionality has been stated by Berenzweig in his thesis [4]. This conjec- ture was drawn from two synthetic data sets that follow multivariate Gaussian distributions. In particular, a main conclusion of this thesis [4, page 99] was: “First, hubness 267 11th International Society for Music Information Retrieval Conference (ISMIR 2010)
Transcript
LOOKING THROUGH THE “GLASS CEILING”: A CONCEPTUALFRAMEWORK FOR THE PROBLEMS OF SPECTRAL SIMILARITY
• The existence of hub songs (also called “always sim-
ilar”) [2], which are close neighbors of many other
pieces to which they hold no perceptual similarity,
thus increasing the rate of false positives.
• The existence of “orphans” (also called “never simi-
lar”) [12], which are songs that rarely become close
neighbors of any other piece (despite possibly hav-
ing perceptual similarity to a large number of songs),
increasing therefore the rate of true negatives.
• Songs are represented in a feature space whose di-
mensionality is determined by the number of fea-
tures (MFCCs). As the dimensionality grows, it is
becoming hard to identify meaningful nearest neigh-
bors, since all songs tend to be at nearly the same
distance from each other. This property was identi-
fied in other research areas [1, 5, 8], but was also ex-
amined in the contexts of MIR [6] and audio speech
data (based on MFCCs) [18].
These undesired properties constitute some of the main
causes for the empirically demonstrated upper limit for the
performance of spectral similarity measures, referred to as
the “glass ceiling” [2]. Recent research has focused mostly
on the amelioration of hubness (the attribute of being a hub
song), by proposing techniques for normalizing the dis-
tances between songs in a way that reduces the influence of
hubs [11,14,15], whereas other works [9,17,19] developed
measures that try to avoid hubness.
Our motivation is to develop a conceptual framework
that allows for relating all three aforementioned undesired
properties, and explains the mechanisms that create them.
Aucouturier and Pachet [3] have focused on the analysis of
hubness and concluded that the creation of homogenized
models (i.e., models that ignore the least likely mixture
components) are responsible for creating hubs. Despite
this detailed conclusion, our emphasis is to disclose a more
fundamental reason that causes all three undesired proper-
ties, which is the high dimensionality of the feature space
that originates from the need to use multiple MFCCs in
order to capture the “global sound”.
A conjecture about the role of high dimensionality has
been stated by Berenzweig in his thesis [4]. This conjec-
ture was drawn from two synthetic data sets that follow
multivariate Gaussian distributions. In particular, a main
conclusion of this thesis [4, page 99] was: “First, hubness
267
11th International Society for Music Information Retrieval Conference (ISMIR 2010)
seems to be a natural consequence of the curse of dimen-
sionality, at least for the points distributed according to a
Gaussian in a space up to 32 dimensions. In high dimen-
sions these points tend to be spread around the shell of the
space with very few points near the center; this implies that
any points that do happen to remain near the center will
be extreme hubs.” However, this work neither generalized
the conclusion to real audio music data, nor even to other
settings besides simple synthetic data. More importantly,
it did not provide a clear explanation of the mechanism
that creates hubness, leaving this question unresolved [4,
question 1 on page 99]. A more thorough examination of
hubness has been performed by Radovanovic et al. [16],
wherein using real vector-space data the authors relate hub-
ness with the intrinsic dimensionality of data, and show
that in (intrinsically) high-dimensional data sets hubs tend
to appear in the proximity of cluster centers. However, [16]
focused primarily on general vector spaces and lp norms,
with the results not directly applicable for MIR purposes.
In this paper, we propose a conceptual framework to
provide a clear explanation of the mechanism that creates
hubness and show that hubs are expected to appear in high-
dimensional spaces (i.e., they are not points that just hap-
pen to remain near the center). Moreover, the framework
helps to understand the connection between all three un-
desired properties: hubs, “orphans” and the problem of
finding meaningful neighbors. Also, our conclusions are
verified with real audio music data. The proposed concep-
tual framework can be useful to MIR researchers to address
the problems of spectral similarity in relation to each other,
understand their fundamental reasons, and thus be able to
develop more robust methods for their remedy.
In the rest of this article, Section 2 reviews related work.
Section 3 presents the proposed framework, whereas Sec-
tion 4 provides empirical evidence for verifying the con-
clusions of the proposed framework in the MIR domain.
Finally, Section 5 concludes the paper.
2. RELATED WORK
Research by Aucouturier and Pachet [3] focuses on the na-
ture and causes of hub songs. They propose methods to de-
tect hubs and infer that hubs are distributed along a scale-
free distribution. Moreover, in their work they deduce that
hubs neither exist due to the spectral features, nor are they
a property of a feature representation or a given modeling
strategy but rather tend to occur with any type of model that
uses agglomeration of multiple frames of a sound texture.
Furthermore, they establish that hubness is not a charac-
teristic of certain songs, as different algorithms distribute
hubs differently in a database. In addition, they also es-
tablish that the class of algorithms studied is irrelevant to
hubs which appear only for data with a given amount of
heterogeneity. Finally, they conclude that hubness can be
localized to certain parts of the distribution of a song.
Berenzweig [4] offers insight as to the understanding of
hubs and arrives to the conclusion that their existence is a
natural result of the curse of dimensionality. Additionally,
in his work, the possibility of hubs being derived from sim-
ilarity to a universal background is proven invalid through
experimentation, that is by showing that the discriminating
power of specific frames is not ameliorated by weighting
based on their shared information.
As mentioned in Section 1, unlike Aucouturier and Pa-
chet [3] our motivation is to provide high dimensionality as
a more fundamental reason for hubness, and for the other
two undesired properties (see Section 1) as well. Differen-
tiating also from the work of Berenzweig [4], we develop
a thorough conceptual framework that links all three prop-
erties and clearly explains the mechanisms through which
they originate.
Other related work includes techniques to ameliorate or
try to avoid hubness [9, 11, 14, 15, 17, 19]. We hope that
our proposed framework will assist in this direction, by
allowing MIR researchers to further analyze the causes of
all examined undesired properties (not just hubness), and
develop solutions that take into account all of them.
3. PROPOSED CONCEPTUAL FRAMEWORK
We commence the description of the proposed conceptual
framework by demonstrating the property of concentra-
tion [8] that is exhibited by spectral similarity measures
due to the high dimensionality of their feature space. Next,
we examine how the generation of hubs and “orphans” can
be explained as a consequence of high dimensionality, in
relation with the concentration phenomenon. The conclu-
sions (in this and the following section) are verified with
real data. Since our description involves some empirical
measurements, we start by detailing the employed settings.
3.1 Settings for Empirical Measurements
We focus on two characteristic spectral similarity measures
that have been widely used in related research. The first
is proposed by Logan and Salomon [10], and uses Earth
Mover’s Distance (EMD) in combination with Kullback-
Leibler (KL) divergence to compute the distance between
groups of frames generated by a GMM approach. The sec-
ond is proposed by Aucouturier and Pachet [2], and uses
Monte Carlo (MC) sampling to measure the similarities of
GMMs. Henceforth, the first measure is denoted as EMD-
KL, whereas the second as GMM-MC. We based our im-
plementation of both measures on the MA toolbox [12].
The main parameter examined for both measures is the
number of MFCCs, denoted as d, which corresponds to the
dimensionality of the feature space, since each frame of the
audio signal is mapped to a point in a d-dimensional space.
The default value for the number of clusters used in
Gaussian mixture modeling performed by GMM-MC and
EMD-KL is equal to one, since measures like G1C [12]
have demonstrated the efficacy of this option. In our ex-
periments we also examined other values in order to ver-
ify that this factor does not have any impact on our con-
clusions. For brevity we therefore present results only for
the default number of clusters. Regarding other parameters
(sampling rate, frame size, etc.), empirical evidence in re-
lated work [3], and our experiments, indicates that they are
not related with the examined issues. For this reason, we
268
11th International Society for Music Information Retrieval Conference (ISMIR 2010)
keep the remaining parameters at the default values from
the MA toolbox, which correspond to commonly used val-
ues in most related works. The sampling frequency of the
input wav file is 11025, the FFT window size is 512 sam-
ples and the FFT window hop size is 256 samples. Finally,
we used the MIREX’04 audio collection for the reasons
that it is widely used by the MIR community, has been in-
volved in all related work (e.g., [3]), and is publicly avail-
able, allowing reproducibility of the presented results.
3.2 The Property of Concentration
The concentration property of a distance (similarity) mea-
sure refers to the tendency of all points in a high-dimen-
sional feature space to be almost equally distant from (sim-
ilar to) each other. Concentration has been studied in vec-
tor spaces for Euclidean distance and other lp norms (in-
cluding fractional distances) [1, 8], and was also analyzed
in the MIR context [6], but not explicitly for the spectral
similarity measures we are focusing on in this work.
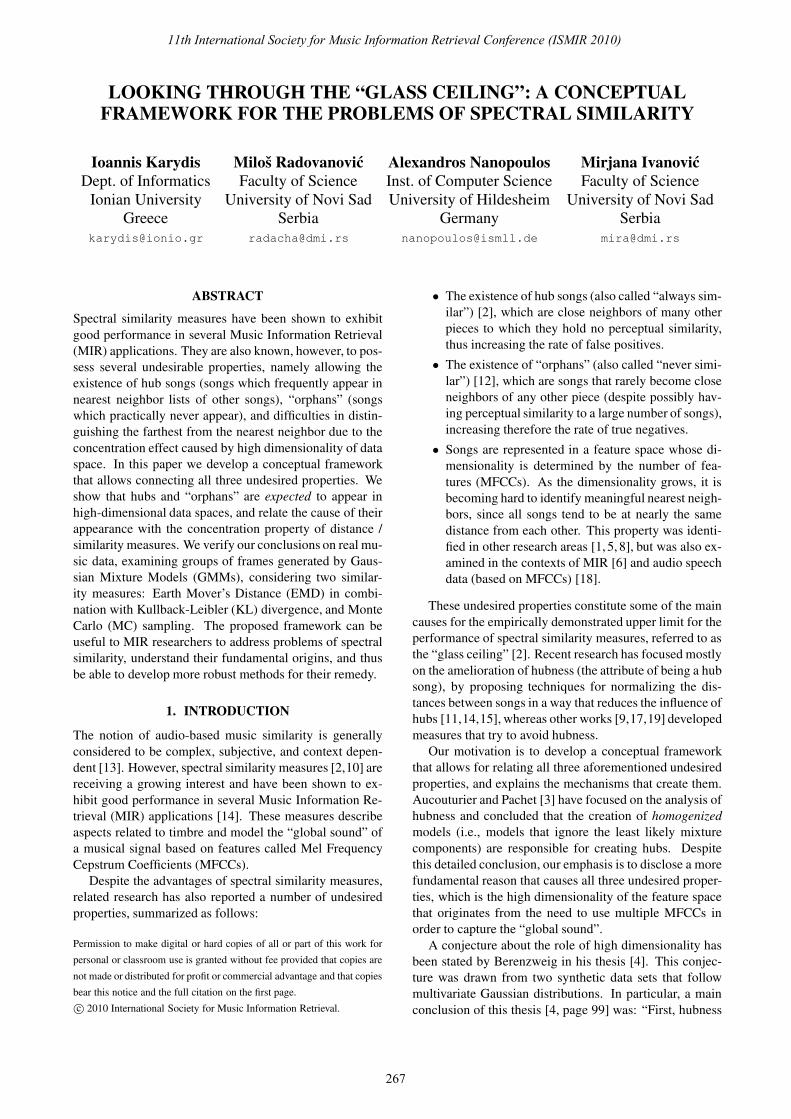
To ease comprehension, we first consider iid Gaussian
random data with d-dimensional points, the components
of which are independently drawn from N (0, 1). Figure 1
illustrates the concentration of Euclidean distance that in-
curs with high dimensionality. In particular, the figure de-
picts from top to bottom: the maximal observed value,
mean value plus one standard deviation, the mean value,
mean value minus one standard deviation, and minimal
observed value of distances of all data points to the ori-
gin. It can be seen that the mean value steadily increases
with increasing dimensionality, while the standard devia-
tion remains constant, and that the observed minimal and
maximal values become constrained to a narrow interval as
dimensionality increases. This means that distances of all
points to the origin (i.e., the norms) become very similar to
each other as dimensionality increases, with the same be-
havior also extending to all pairwise distances within a data
set [8], thus making it harder to distinguish between the
farthest and the nearest neighbor in high dimensions [1].
It is important to note that this property of distances was
proven to hold for any iid random data distribution [8].
0 20 40 60 80 1000
2
4
6
8
10
12
14
d
Eu
clid
ean
dis
tan
ce
Figure 1. Concentration of Euclidean distance for iid
Gaussian random data (n = 2000 points).
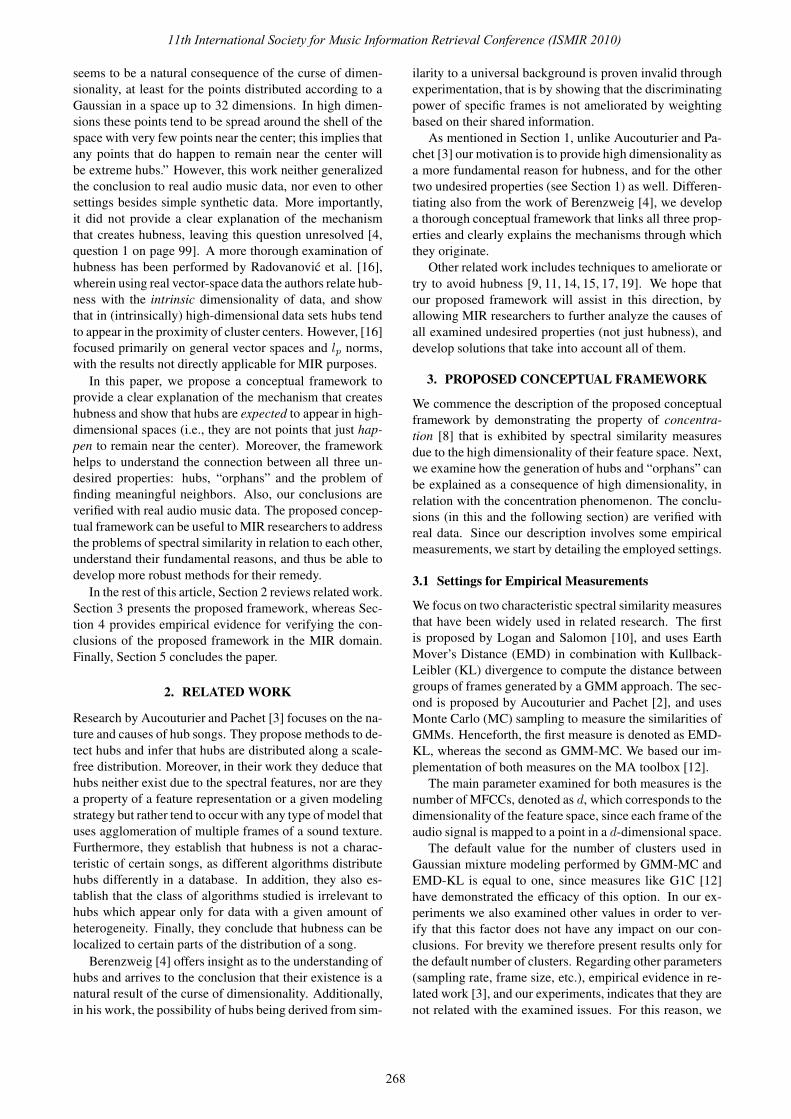
Concentration is usually expressed as the ratio between
some measure of spread, like the standard deviation, and
some measure of magnitude, like the mean value, of dis-
tances of all points in a data set to some arbitrary reference
point [1, 8]. If this ratio converges to 0 as dimensionality
goes to infinity, it is said that distances concentrate. Re-
garding the aforementioned synthetic data set, if the origin
is selected as the reference point, Fig. 2 illustrates the ra-
tio between the standard deviation (σdist) and mean value
(µdist) of distances of all points to the origin, showing that
it tends to 0 as dimensionality increases. Moreover, theo-
retical results by Francois et al. [8] indicate that the same
asymptotic behavior holds with any other point selected as
the reference, and also extends to all pairwise distances in a
data set. In the case of Euclidean distance, the mean value
µdist behaves asymptotically as√
d, whereas the standard
deviation σdist remains asymptotically constant.
0 20 40 60 80 1000
0.2
0.4
0.6
0.8
d
σd
ist /
µd
ist
Euclidean distance
Figure 2. Ratio between the standard deviation and mean
value of the distribution of distances to the origin, for iid
Gaussian random data.
The property of concentration can be used to explain the
generation of hubs and “orphans” as follows. Existing the-
oretical and empirical results [1, 5] specify that concentra-
tion can be viewed as causing points in a high-dimensional
data set to approximately lie on the surface of a hyper-
sphere centered at an arbitrary point. In addition, further
results [7, 8], as illustrated in Fig. 1, indicate that the dis-
tribution of distances to any reference point has a finite
variance for any given d. If the data distribution center is
taken to be the reference point (as, coincidentally, is the
case in the previously used random data example), it can
be said that it is expected for points closer to the data cen-
ter to exist in high dimensions, since for any finite d the
standard deviation of the distribution of distances to the
data set center is finite (in this case, constant). However, in
higher dimensions, the points closer to the center have the
tendency to become closer, on average, to all other points,
thus having increased probability of becoming hubs by be-
ing near neighbors of many remaining points. On the other
hand, it is also expected to have a non-negligible number of
points farther from the data set center. Consequently, these
points, which are the “orphans”, become farther from all
other points and more difficult to be near neighbors of any
other point. The aforementioned connection between con-
centration and hubs/“orphans” has been initially proposed
by Radovanovic et al. [16] using experimentation on iid
uniform random data, in contrast to Gaussian random data
which pertains to real musical data utilized in this paper.
Still, it is important to note that based on the results in [8],
the reasoning followed in [16] can be applied to any iid
random data distribution.
269
11th International Society for Music Information Retrieval Conference (ISMIR 2010)
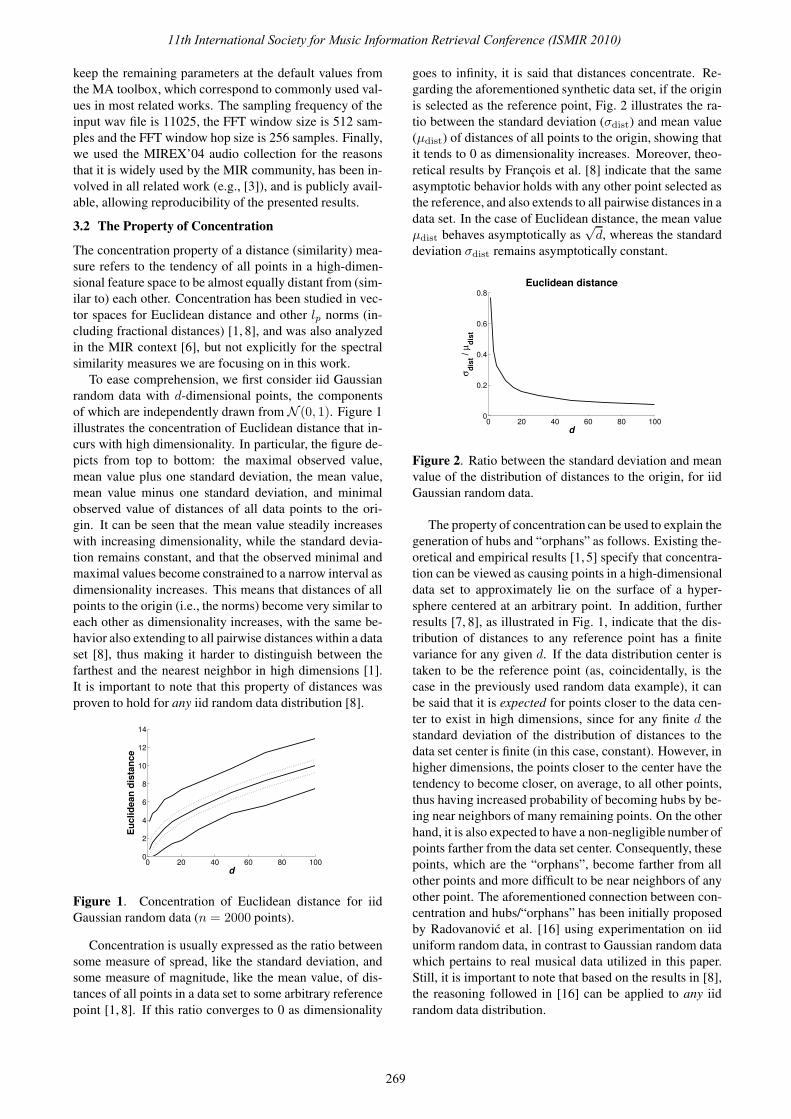
In order to clarify the mechanism through which the
“centrality” of a point close to the data center, i.e. its prox-
imity to all other points, becomes amplified in high di-
mensions, let us return to the iid Gaussian random data
example and observe as reference points (instead of the
origin) two points with the following properties: point x0,
which is at the expected distance from the data center for
a given dimensionality d, and point x2, which is two stan-
dard deviations closer to the center than x0. 1 Next, we
compute the distributions of distances of x0 and x2 to all
other points, and denote the means of these distributions
µx0and µx2
, respectively. Figure 3 plots the difference
between µx0and µx2
. It can be seen that this difference
increases with increasing dimensionality, meaning that x2
becomes closer, on average, to all other points, solely by
virtue of increasing dimensionality. According to the re-
sults by Francois et al. [8], verified by our empirical mea-
surements, both µx0and µx2
asymptotically behave as√
d.
However, convergence does not occur at the same speed,
giving rise to the differences shown in Fig. 3 which ulti-
mately result in the emergence of hubs. Similar arguments
hold when, for example, point x2 is taken to be two stan-
dard deviations farther from the center than x0, explaining
the formation of “orphans.”
0 20 40 60 80 1000.2
0.3
0.4
0.5
0.6
0.7
0.8
0.9
1
d
Dif
fere
nc
e b
etw
ee
n m
ea
ns
Figure 3. Difference between means of distance distribu-
tions to points at analogous positions wrt the data center,
for iid Gaussian random data.
3.3 Concentration in Real Audio Data
The preceding discussion suggests that concentration can
help explain the generation of hubs and “orphans” for au-
dio music data and spectral similarity measures. However,
the aforementioned conclusions were drawn with respect
to distances between single points, whereas spectral sim-
ilarities are computed between Gaussian Mixture Models
(GMMs). Moreover, in this case of spectral similarity, we
can only consider pairwise distances and not a point of
reference like the center. Therefore, to examine the con-
centration of spectral similarity, we perform the following
measurement. We vary the dimensionality of the feature
space (number of MFCCs). For each examined dimension-
ality, we define for each song in the examined collection its
neighbor-range by computing the difference between the
1 Roughly speaking, for every d point x0 has the same “probability” ofoccurrence with regards to the distance from the data distribution center,and the same can be said for x2.
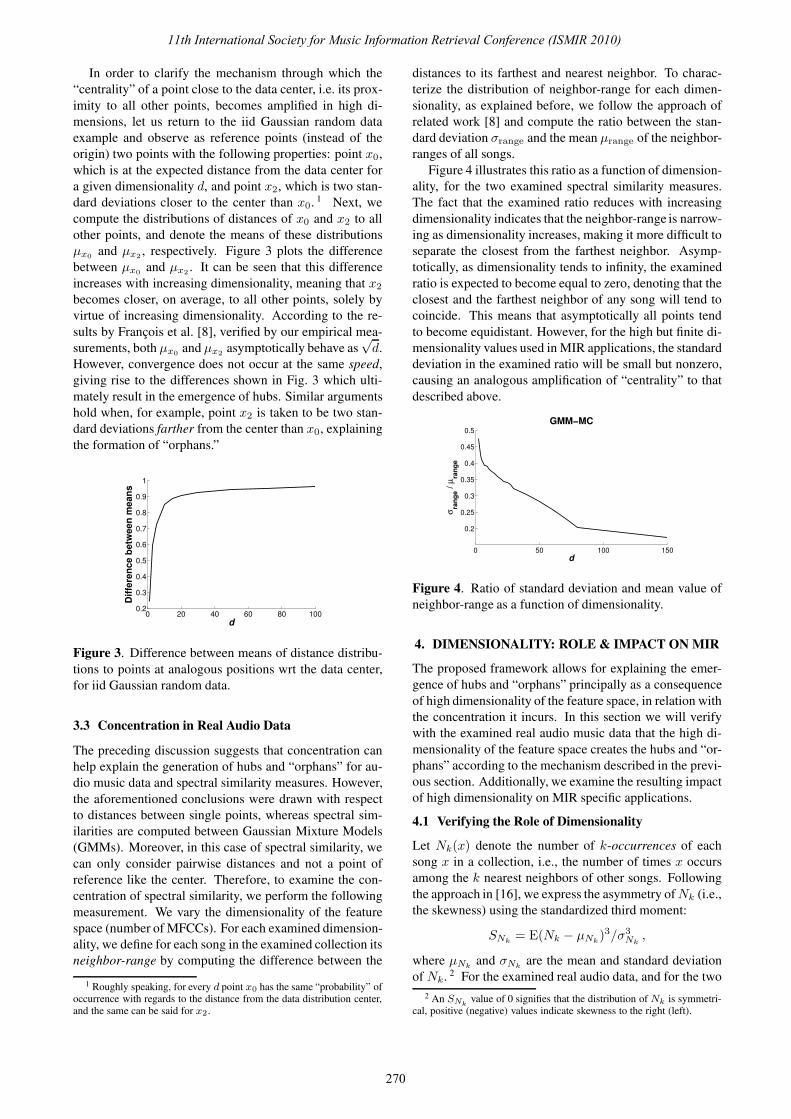
distances to its farthest and nearest neighbor. To charac-
terize the distribution of neighbor-range for each dimen-
sionality, as explained before, we follow the approach of
related work [8] and compute the ratio between the stan-
dard deviation σrange and the mean µrange of the neighbor-
ranges of all songs.
Figure 4 illustrates this ratio as a function of dimension-
ality, for the two examined spectral similarity measures.
The fact that the examined ratio reduces with increasing
dimensionality indicates that the neighbor-range is narrow-
ing as dimensionality increases, making it more difficult to
separate the closest from the farthest neighbor. Asymp-
totically, as dimensionality tends to infinity, the examined
ratio is expected to become equal to zero, denoting that the
closest and the farthest neighbor of any song will tend to
coincide. This means that asymptotically all points tend
to become equidistant. However, for the high but finite di-
mensionality values used in MIR applications, the standard
deviation in the examined ratio will be small but nonzero,
causing an analogous amplification of “centrality” to that
described above.
0 50 100 150
0.2
0.25
0.3
0.35
0.4
0.45
0.5
d
σra
ng
e /
µra
ng
e
GMM−MC
Figure 4. Ratio of standard deviation and mean value of
neighbor-range as a function of dimensionality.
4. DIMENSIONALITY: ROLE & IMPACT ON MIR
The proposed framework allows for explaining the emer-
gence of hubs and “orphans” principally as a consequence
of high dimensionality of the feature space, in relation with
the concentration it incurs. In this section we will verify
with the examined real audio music data that the high di-
mensionality of the feature space creates the hubs and “or-
phans” according to the mechanism described in the previ-
ous section. Additionally, we examine the resulting impact
of high dimensionality on MIR specific applications.
4.1 Verifying the Role of Dimensionality
Let Nk(x) denote the number of k-occurrences of each
song x in a collection, i.e., the number of times x occurs
among the k nearest neighbors of other songs. Following
the approach in [16], we express the asymmetry of Nk (i.e.,
the skewness) using the standardized third moment:
SNk= E(Nk − µNk
)3/σ3Nk
,
where µNkand σNk
are the mean and standard deviation
of Nk. 2 For the examined real audio data, and for the two
2 An SNkvalue of 0 signifies that the distribution of Nk is symmetri-
cal, positive (negative) values indicate skewness to the right (left).
270
11th International Society for Music Information Retrieval Conference (ISMIR 2010)
similarity measures GMM-MC and EMD-KL, Figures 5
and 6, respectively, depict skewness as a function of di-
mensionality (three different values of k are examined in
each case). As dimensionality increases, the increase of
skewness, for all values of k, indicates that the distribution
of Nk becomes considerably skewed to the right, resulting
in the emergence of hubs, i.e., points which appear in many
more k-nearest neighbor lists than other points.
5 10 15 20 25 30−0.2
0
0.2
0.4
0.6
0.8
1
1.2
1.4
1.6
1.8
2
d
SN
k
GMM−MC
k = 1
k = 10
k = 20
Figure 5. Skewness of Nk as a function of dimensionality
for the GMM-MC measure.
5 10 15 20 25 30−0.2
0
0.2
0.4
0.6
0.8
1
1.2
1.4
1.6
1.8
2
d
SN
k
EMD−KL
k = 1
k = 10
k = 20
Figure 6. Skewness of Nk as a function of dimensionality
for the EMD-KL measure.
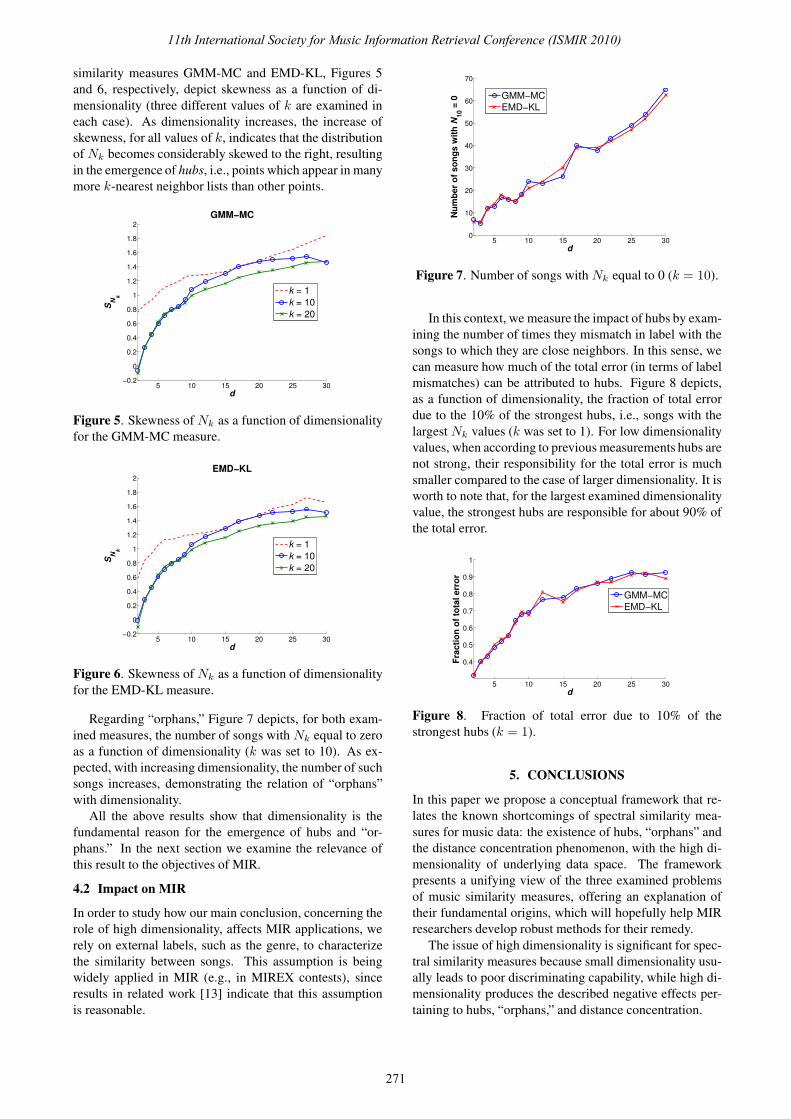
Regarding “orphans,” Figure 7 depicts, for both exam-
ined measures, the number of songs with Nk equal to zero
as a function of dimensionality (k was set to 10). As ex-
pected, with increasing dimensionality, the number of such
songs increases, demonstrating the relation of “orphans”
with dimensionality.
All the above results show that dimensionality is the
fundamental reason for the emergence of hubs and “or-
phans.” In the next section we examine the relevance of
this result to the objectives of MIR.
4.2 Impact on MIR
In order to study how our main conclusion, concerning the
role of high dimensionality, affects MIR applications, we
rely on external labels, such as the genre, to characterize
the similarity between songs. This assumption is being
widely applied in MIR (e.g., in MIREX contests), since
results in related work [13] indicate that this assumption
is reasonable.
5 10 15 20 25 300
10
20
30
40
50
60
70
d
Nu
mb
er
of
so
ng
s w
ith
N1
0 =
0
GMM−MC
EMD−KL
Figure 7. Number of songs with Nk equal to 0 (k = 10).
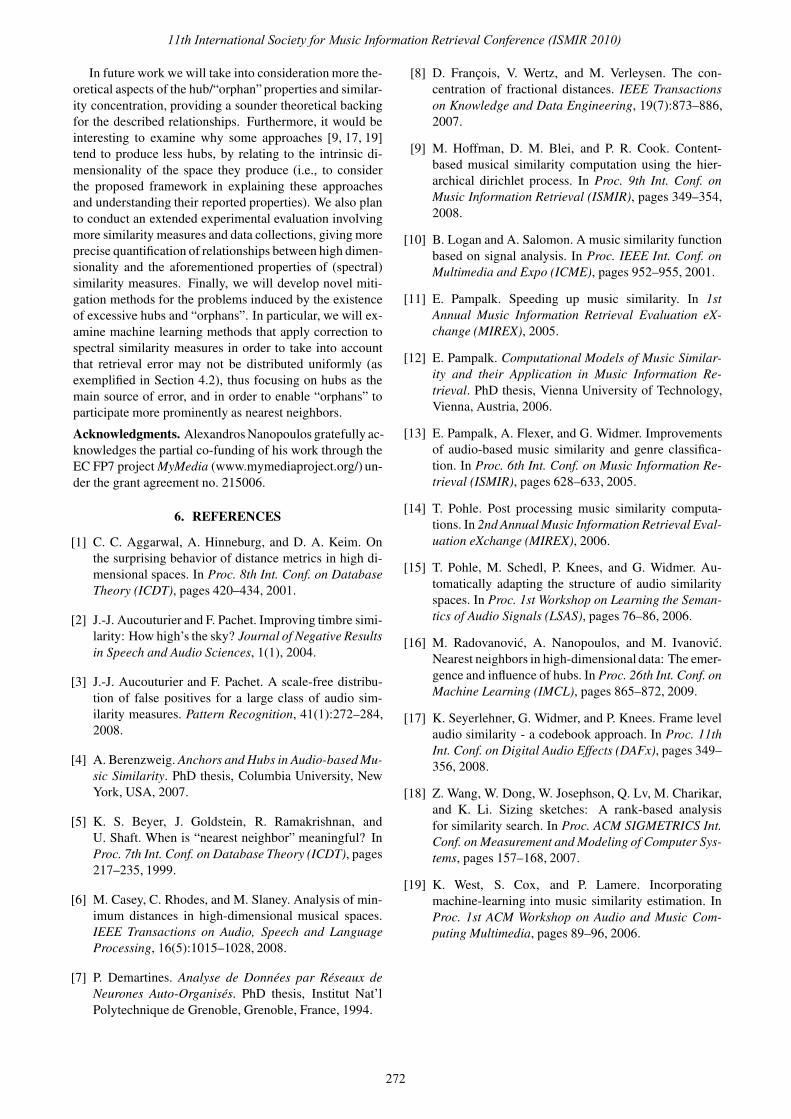
In this context, we measure the impact of hubs by exam-
ining the number of times they mismatch in label with the
songs to which they are close neighbors. In this sense, we
can measure how much of the total error (in terms of label
mismatches) can be attributed to hubs. Figure 8 depicts,
as a function of dimensionality, the fraction of total error
due to the 10% of the strongest hubs, i.e., songs with the
largest Nk values (k was set to 1). For low dimensionality
values, when according to previous measurements hubs are
not strong, their responsibility for the total error is much
smaller compared to the case of larger dimensionality. It is
worth to note that, for the largest examined dimensionality
value, the strongest hubs are responsible for about 90% of
the total error.
5 10 15 20 25 30
0.4
0.5
0.6
0.7
0.8
0.9
1
d
Fra
cti
on
of
tota
l e
rro
r
GMM−MC
EMD−KL
Figure 8. Fraction of total error due to 10% of the
strongest hubs (k = 1).
5. CONCLUSIONS
In this paper we propose a conceptual framework that re-
lates the known shortcomings of spectral similarity mea-
sures for music data: the existence of hubs, “orphans” and
the distance concentration phenomenon, with the high di-
mensionality of underlying data space. The framework
presents a unifying view of the three examined problems
of music similarity measures, offering an explanation of
their fundamental origins, which will hopefully help MIR
researchers develop robust methods for their remedy.
The issue of high dimensionality is significant for spec-
tral similarity measures because small dimensionality usu-
ally leads to poor discriminating capability, while high di-
mensionality produces the described negative effects per-
taining to hubs, “orphans,” and distance concentration.
271
11th International Society for Music Information Retrieval Conference (ISMIR 2010)
In future work we will take into consideration more the-
oretical aspects of the hub/“orphan” properties and similar-
ity concentration, providing a sounder theoretical backing
for the described relationships. Furthermore, it would be
interesting to examine why some approaches [9, 17, 19]
tend to produce less hubs, by relating to the intrinsic di-
mensionality of the space they produce (i.e., to consider
the proposed framework in explaining these approaches
and understanding their reported properties). We also plan
to conduct an extended experimental evaluation involving
more similarity measures and data collections, giving more
precise quantification of relationships between high dimen-
sionality and the aforementioned properties of (spectral)
similarity measures. Finally, we will develop novel miti-
gation methods for the problems induced by the existence
of excessive hubs and “orphans”. In particular, we will ex-
amine machine learning methods that apply correction to
spectral similarity measures in order to take into account
that retrieval error may not be distributed uniformly (as
exemplified in Section 4.2), thus focusing on hubs as the
main source of error, and in order to enable “orphans” to
participate more prominently as nearest neighbors.