Calibration and Accuracy .................................................................................................... 4 Notes on the Condar Method .............................................................................................. 5 Test Results ......................................................................................................................... 8
3.) Summary of 14 Masonry Heater Emissions Tests .................................................... 13
Calibration and Accuracy .................................................................................................. 13 Test Results ....................................................................................................................... 14
4.) Discussion ..................................................................... Error! Bookmark not defined. References ......................................................................................................................... 17
3
1.) EXECUTIVE SUMMARY
This report summarizes PM emissions testing on 3 masonry heaters, using Oregon Method 41 (OM-41, or Condar method). Data from OMNI-Test is provided, comparing OM-41 with ASTM E25215-09. The average PM emissions factor for 103 tests was 1.27 g/kg. The range was 0.48 – 4.61 g/kg over a wide range of operating and fueling conditions, which are discussed. PM emissions rates during the short burn cycles were in the range of 7.5 - 54.7 g/hr. They are not directly comparable to the emissions factors for reasons that are discussed. Additional data is presented comparing emissions factors and emission rates as tested in Fairbanks, Alaska for 3 categories of appliances.
A series of 87 test runs was performed on a single masonry heater, between 2008 and 2010. The HeatKit model heater is typical of the majority of heaters being built in North America today, with a Contraflow design and a large firebox designed to handle a wood charge of 60 lbs. Particulate emissions were sampled using Oregon Method 41 (OM-41 or Condar Method), which uses a portable emissions sampler that incorporates dilution. A wide variety of operating parameters was tested, as follows:
- Cordwood of various sizes, species and moisture contents. The majority of tests were conducted with white birch at 20% moisture content, with the bark left on and only loose bark removed.
- Fuel charges varied from 59% to 203% of the 60 lb design load. - Lumber fuel cribs of various configurations, including high and low moisture and
several loading factors and ignition methods. - Various ignition methods, such as bottom, side and top kindling. - Cold and warm fireboxes.
CALIBRATION AND ACCURACY
This was a low budget study done for in-house research purposes. Calibration gases were not used. 6” glass filters were used in the Condar sampler. Filter dessication was not used, since it was determined by testing that it did not make any appreciable difference. To allow comparability between tests and avoid inaccuracy, the following methods were used:
- A model Testo 330-2 commercial combustion analyzer, which is widely used in Europe. It has an auto-calibration routine and self-diagnostics for leaks, worn chemical cells, etc. Manufacturer’s stated accuracy for O2 is +/-0.2 Vol.%
- Extra run time for the combustion analyzer before and after a test to quantify any drift in the ambient (span) O2 value.
5
- The identical blank filter was weighed before and after each run, to detect drift in the calibration of the analytical balance, or moisture or static issues.
- Testing to determine that use of a dessicator for the 6” glass filters did not affect results significantly.
Notes on the Condar Method The main critique of the Condar method has been that it is a constant flow sampling method, as opposed to proportional flow in M-5H. There are some data to suggest that Condar results can still be useful, particularly for comparison testing of low emissions appliances with a well defined and repeatable burn cycle. There are two data points from OMNI-Test from July, 2006 tests on a Swedish masonry heater, comparing PM emission using Condar, ASTM and ESS methods as follows:
OMNI-Test Results
There was also a study on pellet stoves conducted in New Zealand in 2005 (Reference 1). A Condar sampler was used to conduct in-home field testing. As part of the study, comparison testing was done between the Condar and method AS/NZS 4012/3, which is a laboratory dilution tunnel method. The correlation was very good, as shown in Figure 1, below.
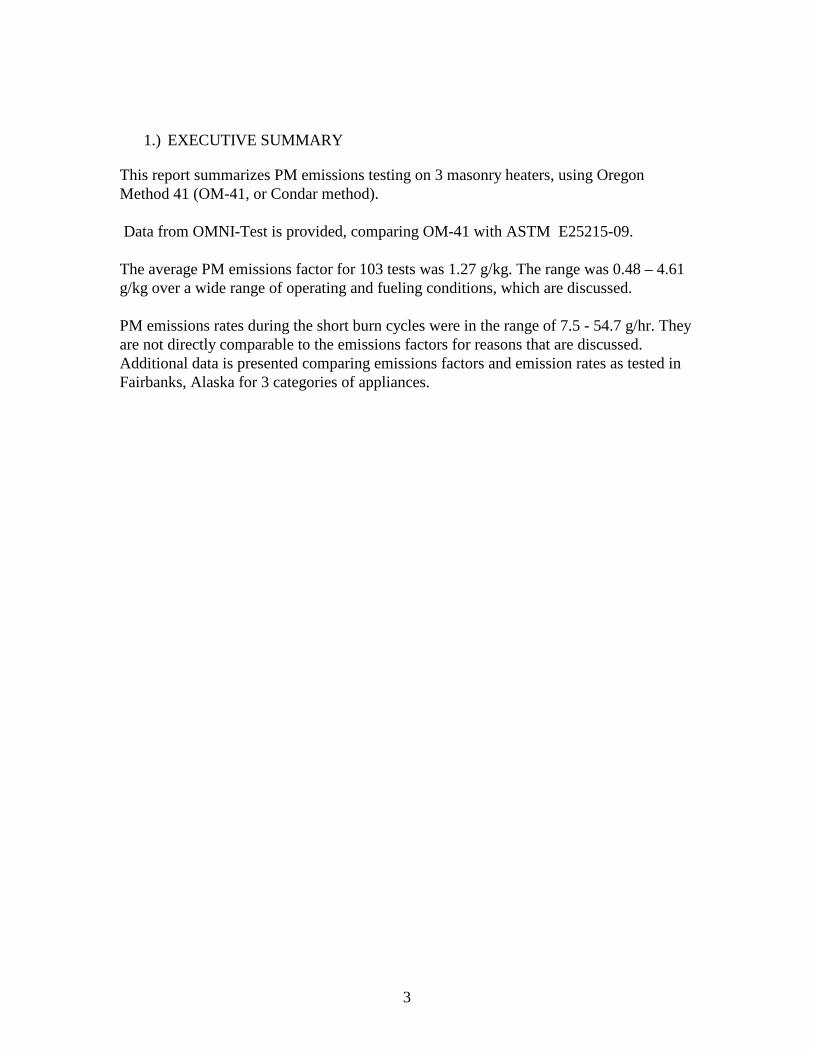
The Condar sampler used for our testing was part of a study conducted in 2007 at Cold Climate Housing Research Center in Alaska (Reference 2). Four samplers were run on the same heater. The filter catches between separate samplers were plus or minus 10%, as shown in Figure 2, below.
7
Figure 2. Four Condars sampling the same stove.
Masonry heaters burn in the same 1 g/kg PM range as pellet stoves. The filter catch is mainly soot, with little or no tar. This can be verified by a “smell test” on the filters. With only soot on the filters there is no smell, whereas the aromatics in woodsmoke are detectible by the human nose even at low concentrations. Soot is produced from flames, whereas tar is produced from smoldering (flameless) combustion. In theory, this may allow for simplified sampling trains for low emissions, non-smoldering appliances such as masonry heaters and pellet stoves.
8
TEST RESULTS
A summary of test results is presented in Table 2. Average PM factor for 87 tests was 1.29 g/kg. If we look only at “normal” conditions by eliminating cold starts, bottom ignition and cribs, the average PM Factor was 0.97 g/kg for 52 cordwood tests in a conditioned heater. The two largest separately observed operating variables leading to significantly higher PM emissions were cold start and bottom ignition. However, the combination of cold start with bottom ignition was relatively clean. This may be due to their opposing effects on burn rate. For bottom ignition in a cold heater, average PM factor was 1.31 g/kg for 5 tests. With bottom ignition in a warm heater, 1 cordwood test yielded 3.25 g/kg and 1 crib test yielded 3.63 g/kg. The highest PM factor recorded was 4.6 g/kg, using cold white birch cordwood in a cold heater with no chimney draft and a resulting slow, smoldering start. The highest PM factor in a crib test was 3.63 g/kg, with a large, very dry crib at 10% moisture in a warm heater, with a kindling crib stacked underneath. A repeat run with the kindling crib stacked on top resulted in 1.06 g/kg. This demonstrates the effect that ignition method can have in cold-to-cold testing. The average PM factor for 16 crib tests was 1.79 g/kg. The 52 “normal” runs, averaging 0.97 g/kg, had an average burn rate of 12.2 kg/hr and an average PM emissions rate of 11.81 g/hr. See “Discussion” section for a comparison of emissions rate and emissions factor for a masonry heater and an EPA stove. More detailed results, including raw data and detailed fueling data, are available online at heatkit.com/html/lopez.htm Also available online are various summary pages, such as crib repeatability testing. Calculations for the Condar Method were done according to Reference 3. The calculation spreadsheet is available online.
9
The column headings in Table 2 (next page) are as follows:
- PM g/kg: particulate emissions factor as determined by Oregon Method 41 (OM-41 or Condar method)
- CO emissions factor, using OM-41 - Eff: Overall efficiency, using OM-41 - Moisture: Wood moisture, % dry basis - Load : fuel load in lbs. Tests were single load with the following exceptions:
o L02 and L06 – L15 were reloads (2 loads) - Pieces #: Total number of fuel pieces - Sizing: some tests included a surface/volume factor for the fuel pieces - Kindl: weight of kindling in lbs (included in total fuel load) - Cold or warm heater/fuel: CC means cold heater and cold fuel, whereas WW
means warm heater (fired 24 hrs previously) and room termperature fuel. - Ignition/stacking: default is log cabin stacking with kindling from the side. Notes
if kindling was underneath, fuel was stacked front-to-back, or if crib fuel was used. Grate was left open for all tests except K01 – K05, where it was accidentally left closed.
- The last (unlabelled) column has additional fuel notes, such as species.
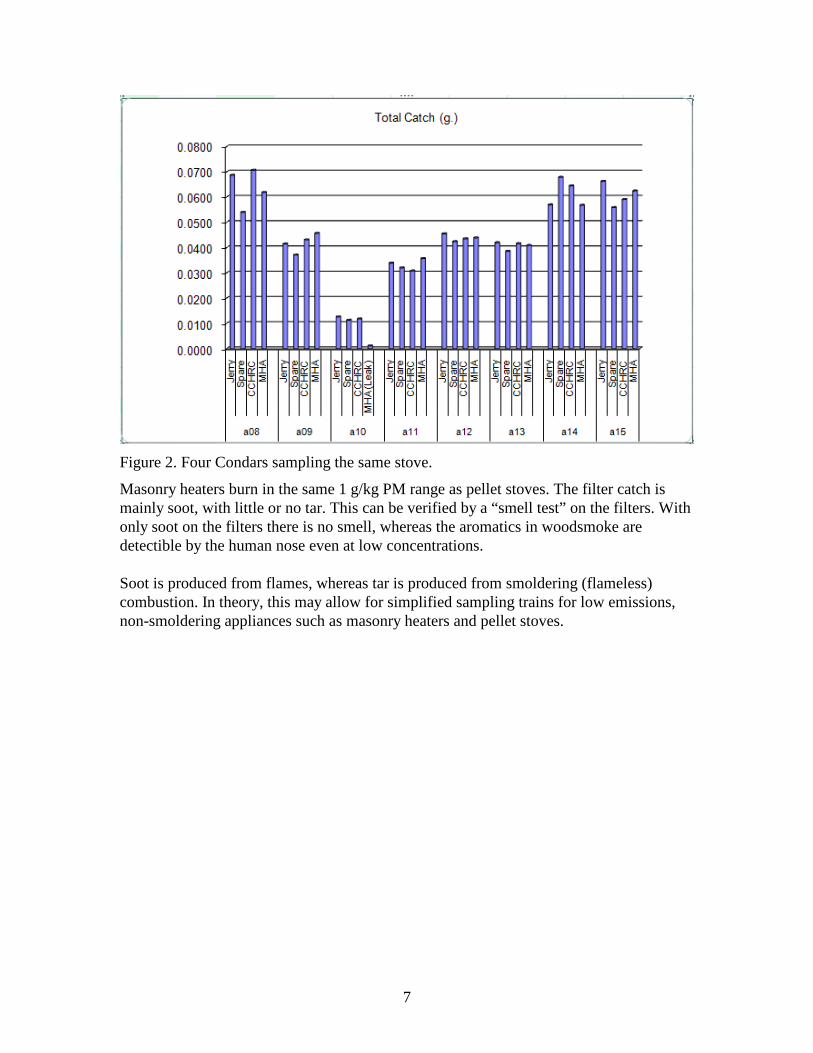
Table 2. DATA SUMMARY --Particulates, Carbon Monoxide and Efficiency for 87 contraflow heater tests
11
12
Key: PM factors less than 1 g/kg are highlighted in green PM factors between 1 – 2 g/kg are in white PM factors greater than 2 g/kg are highlighted in brown
3.) SUMMARY OF 14 MASONRY HEATER EMISSIONS TESTS
Alex Chernov STOVEMASTER 20655 Shaws Creek Rd Caledon, Ontario L7K 1L7 [email protected] www.stovemaster.com
INTRODUCTION
A series of 14 test runs was performed on a masonry heater in 2009 - 2010. The tested masonry heater is of the Double Bell design, with size and layout comparable to the majority of heaters being built in the North America today. The heater has a large firebox designed to handle a wood charge of 50 lbs. Particulate emissions were sampled using Oregon Method 41 (OM-41 or Condar Method), which uses a portable emissions sampler that incorporates dilution. Different firebox configurations and different ways for supplying primary and secondary combustion air where tested.
CALIBRATION AND ACCURACY
This was a low budget study done for in-house research purposes. Calibration gases were not used. 6” glass filters were used in the Condar sampler. Filter dessication was not used, since it was determined by testing that it did not make any appreciable difference. Filters were weighed immediately after test termination. To allow comparability between tests and avoid inaccuracy, the following methods were used:
- A model Testo 330-1 commercial combustion analyzer, which is widely used in Europe. Self-diagnostics was performed before each run.
- A sample weight was weighed before and after each run, to detect drift in the calibration of the analytical balance.
14
TEST RESULTS
A summary of test results is presented in Table 3. Average PM Factor for 12 cordwood tests was 1.01 g/kg. With exception of two tests, the tests were performed on a slightly warm heater (48hrs since the last burn). With this factor and all variations in firebox and air supply design, all tests fall in the range of 0.45-1.7g/kg. Two last tests were performed using a wet hardwood crib with individual pieces reaching moisture content up to 35% to simulate the worst case scenario. They generated the highest PM values recorded of 3.5g/kg and 3.8g/kg, in slow, smoldering starts. The average PM factor from all tests including two wet crib tests was 1.35 g/kg. More detailed results, including raw data and detailed fueling data are available upon request, and will be made available online at www.stovemaster.com soon. The column headings in Table 2 (next page) are as follows:
- PM g/kg: particulate emissions factor as determined by Oregon Method 41 (OM-41 or Condar method)
- CO emissions factor, using OM-41 - Eff: Overall efficiency, using OM-41 - Moisture: Wood moisture, % dry basis - Load : fuel load in lbs. Tests were single loads. - Pieces #: Total number of fuel pieces - Surf/Vol: some tests included a surface/volume factor for the fuel pieces - Kindling: weight of kindling in lbs (included in total fuel load) - Cold/Warm heater/fuel: CC means cold heater and cold fuel, whereas WW
means warm heater (fired 24 hrs previously) and room termperaturefuel. - Ignition: default is log cabin stacking with kindling from the side. - Species.
Table 3. DATA SUMMARY --Particulates, Carbon Monoxide and Efficiency for 14 Double Bell heater tests
Run PM CO Eff. Moisture Load Pieces Surf/Vol Kindling Cold/Warm Ignition Species
g/kg g/kg % % lbs lbs heater/fuel
Average 1.01 53.76 76.03 19.62 49.44 8.58 3.24 2.2
TL-001 1.11 43.25 73.13 20.50 48.40 8 3.02 2.2 s.warm/w side maple
TL-002 1.34 61.75 77.07 17.00 48.50 8 2.96 2.2 s.warm/w side maple
TL-004 1.67 74.47 73.99 18.00 49.40 9 3.29 2.2 s.warm/w side maple
TL-005 0.98 58.46 77.06 20.90 49.20 8 3.42 2.2 s.warm/w side maple
TL-006 0.62 47.85 78.53 20.00 51.00 9 3.29 2.2 warm/w side maple
TL-007 0.45 48.55 74.64 20.00 48.70 8 3.09 2.2 warm/w side maple
TL-008 0.60 57.80 78.87 20.00 49.00 9 3.45 2.2 s.warm/w side maple
TL-009 0.61 49.10 76.20 20.00 49.10 8 3.10 2.2 s.warm/w side maple
TL-010 1.35 57.97 75.88 20.00 49.60 10 3.37 2.2 s.warm/w side maple
TL-011 1.35 61.70 73.00 18.00 50.00 10 3.61 2.2 s.warm/w side maple
TL-012 1.36 48.14 78.00 20.50 50.90 8 2.94 2.2 s.warm/w side maple
TL-013 0.66 36.13 76.00 20.50 49.50 8 3.30 2.2 s.warm/w side maple
Wet hardwood crib runs (up to 35% moisture pieces):
Key: PM factors less than 1 g/kg are highlighted in green PM factors between 1 – 2 g/kg are in white PM factors greater than 2 g/kg are highlighted in brown
16
4.) DISCUSSION
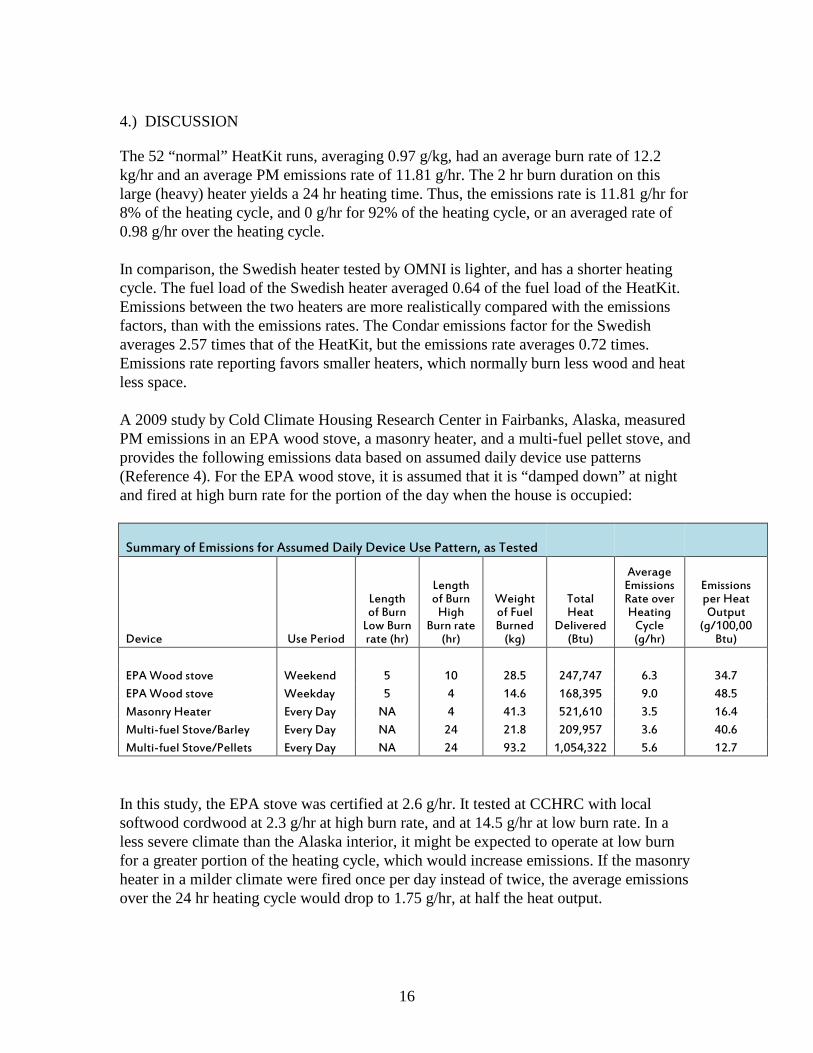
The 52 “normal” HeatKit runs, averaging 0.97 g/kg, had an average burn rate of 12.2 kg/hr and an average PM emissions rate of 11.81 g/hr. The 2 hr burn duration on this large (heavy) heater yields a 24 hr heating time. Thus, the emissions rate is 11.81 g/hr for 8% of the heating cycle, and 0 g/hr for 92% of the heating cycle, or an averaged rate of 0.98 g/hr over the heating cycle. In comparison, the Swedish heater tested by OMNI is lighter, and has a shorter heating cycle. The fuel load of the Swedish heater averaged 0.64 of the fuel load of the HeatKit. Emissions between the two heaters are more realistically compared with the emissions factors, than with the emissions rates. The Condar emissions factor for the Swedish averages 2.57 times that of the HeatKit, but the emissions rate averages 0.72 times. Emissions rate reporting favors smaller heaters, which normally burn less wood and heat less space. A 2009 study by Cold Climate Housing Research Center in Fairbanks, Alaska, measured PM emissions in an EPA wood stove, a masonry heater, and a multi-fuel pellet stove, and provides the following emissions data based on assumed daily device use patterns (Reference 4). For the EPA wood stove, it is assumed that it is “damped down” at night and fired at high burn rate for the portion of the day when the house is occupied:
Summary of Emissions for Assumed Daily Device Use Pattern, as Tested
Device Use Period
Length of Burn Low Burn rate (hr)
Length of Burn High
Burn rate (hr)
Weight of Fuel Burned (kg)
Total Heat
Delivered (Btu)
Average Emissions Rate over Heating Cycle (g/hr)
Emissions per Heat Output
(g/100,00 Btu)
EPA Wood stove Weekend 5 10 28.5 247,747 6.3 34.7
EPA Wood stove Weekday 5 4 14.6 168,395 9.0 48.5
Masonry Heater Every Day NA 4 41.3 521,610 3.5 16.4
Multi-fuel Stove/Barley Every Day NA 24 21.8 209,957 3.6 40.6
Multi-fuel Stove/Pellets Every Day NA 24 93.2 1,054,322 5.6 12.7
In this study, the EPA stove was certified at 2.6 g/hr. It tested at CCHRC with local softwood cordwood at 2.3 g/hr at high burn rate, and at 14.5 g/hr at low burn rate. In a less severe climate than the Alaska interior, it might be expected to operate at low burn for a greater portion of the heating cycle, which would increase emissions. If the masonry heater in a milder climate were fired once per day instead of twice, the average emissions over the 24 hr heating cycle would drop to 1.75 g/hr, at half the heat output.
17
Low output does not increase emissions as it does with the wood stove in this study. However, the emissions rate would not reflect this unless it is allowed to be averaged over the heating cycle. If EPA were required to set a reasonable g/hr limit for masonry heaters, these considerations should be taken into account.
REFERENCES
1.) “Warm Homes Technical Report: Real-life Emissions Testing of Pellet Burners in Tokoroa”, New Zealand Ministry for the Environment, 2005 www.mfe.govt.nz/publications/energy/emissions-testing-pellet-burners-tokoroa-jun07/html/index.html 2.) heatkit.com/research/lopezq.htm 3.) “Determination of Condensable Particulate Woodstove Emission Factors Using Condar’s Emissions Sampler”, Stockton Barnett, 1983 heatkit.com/docs/condar.PDF 4.) “Support for Developing a Sustainable Fire Load Reduction Program by Creating and Expanding Wood-Energy Enterprises”, Dave Misiuk, P.E., Cold Climate Housing Research Center, Fairbanks, Alaska, 2009.