26
Los Angeles County Department of Public Social Services DPSSTATS Project Evaluation Report October 2005
Los Angeles County Department of Public Social Services
DPSSTATS Project
Evaluation Report
October 2005
DPSSTATS: Achieving Accountability and Success in the Department of Public Social Services The Department of Public Social Services (DPSS) is the County department responsible for administering public aid programs. The Department serves an ethnically and culturally diverse community through programs designed to both alleviate hardship and promote health, personal responsibility, and economic independence. The Department provides the following benefits and services to low-income residents of Los Angeles County:
• Temporary financial assistance and employment services for families and individuals.
• Free and low-cost health care insurance for families with children, pregnant women and aged/blind/disabled adults;
• Food benefits for families and individuals;
• In-home services for elderly and disabled individuals; and
• Financial assistance and advocacy for federal disability benefits for disabled individuals.
These services are provided locally throughout the many communities that comprise Los Angeles County. The Department’s mission had been:
To enrich lives by providing accurate and timely benefits and effective services to individuals and families in need which both alleviate hardship and promote personal responsibility and economic independence; through effective and caring service, focusing on positive outcomes, quality, innovation and leadership; and maintain a high standard of excellence department wide.
With the adoption of the Los Angeles County Strategic Plan, DPSS simplified and aligned its mission statement with that of the County. The department’s mission is now to “Provide public social services that enrich lives through effective and caring service”.
Introduction In July of 2004, Bryce Yokomizo, Director of the LA County Department of Public Social Services was asked by David Janssen, LA County CAO, to be the pilot site for a program to test the efficacy of the “STATS” process, first introduced to fight crime in NYC under the name “COMPSTATS,” as a strategy for improving the performance of the County in its delivery of social services to its residents. This report is an evaluation of the results of that pilot project based on documentation, observation, data and interviews collected and conducted by Morley Winograd and Christina Altmayer as consultants to both the CAO and DPSS in the course of the pilot’s implementation. Specifically, this evaluation focused on three questions:
DPSSTATS Evaluation
Page 2 of 18
1. What has been the impact on DPSS from the STATS process? 2. What lessons can be learned from how DPSS approached its implementation? 3. How applicable is this process for other departments or County decision making
models? This report first summarizes and then analyzes the work that was done by DPSS to launch the DPSSTATS process, culminating in the first DPSSTATS meetings in April of 2005 and continuing through their initial expansion efforts to include administrative as well as line operations in August of 2005. Further expansion is planned through the remainder of 2005 to include information technology services and program and policy units. After making recommendations specific to the DPSS on how to further evolve the DPSSTATS process, part two of the report then evaluates the experience of the DPSS with the STATS process and makes recommendations for its potential expansion and use in other parts of the County. Summary Recommendation Based on our evaluation of the pilot, we believe that the management team of the DPSS should be commended for their exceptional performance in the rapid deployment of this process and that the CAO, in consultation with the Board of Supervisors, should actively seek new areas for applying the STATS process to improve the County’s performance in achieving its mission of “Enriching lives through effective and caring service.” The County Quality and Productivity Commission recently recognized this innovation with the Commissioners' Memorial Award at the 19th Annual Productivity and Quality Awards Program.
DPSSTATS Evaluation
Page 3 of 18
Part I: Implementing STATS at DPSS Background STATS impressive results in improving organizational performance, wherever it has been tried is achieved through the rapid organizational learning that occurs through the application of four key STATS tenets: 1. Accurate and timely data shared by everyone at the same time. 2. Regular and frequent meetings. 3. Relentless follow-up and assessment. 4. Adoption of a problem solving model that fits the culture and work of the
organization. DPSSTATS builds from the experiences of other jurisdictions, but is unique in that it is the first application in a large health and human services organization, creating cultural changes different from the application of STATS in law enforcement (NYC COMPSTAT) or the service delivery environment such as Baltimore’s CitiSTAT or the City of Los Angeles’ LASTATS. At the outset, the DPSS leadership set the expectation that implementation of STATS would facilitate a cultural change towards collaboration and team-building. While accountability for results is a major outcome of the STATS model, the DPSS did not want to promote the “gotcha” environment that is sometimes associated with STATS. The pilot has stayed true to this intent and fostered greater internal collaboration and as well as facilitated greater acceptance in the organization. Despite the differences in context, DPSSTATS has produced the same rapid learning and results improvement that the STATS process has created in other organizations. The leadership of the DPSS under the direction of Lisa Nuñez, Chief Deputy Director, appointed a DPSSTATS task force to apply the four STATS tenets to the work of the DPSS. Beginning in August of 2004, the group met to:
Review existing performance measurements and data, Observe the operation of “LASTATS,” which was using this process to improve
the delivery of municipal services in that city, Organize the logistics and frequency of what came to be called “DPSSTATS”
meetings, Communicate the purpose and plans for this initiative to the entire department, Organize the data and collection processes for the meetings, and Determine the tone and problem solving strategy that would be used at the
meetings. Following a work plan drafted by the consultants, the task force of eight DPSS managers and staff as well as a representative of the CAO, met every two weeks initially, and then monthly, to successfully accomplish the launch of DPSSTATS in April, 2005. Among the issues that the group addressed, data management and building the technology to support regular reporting turned out to be the most difficult. As discussed below, this
DPSSTATS Evaluation
Page 4 of 18
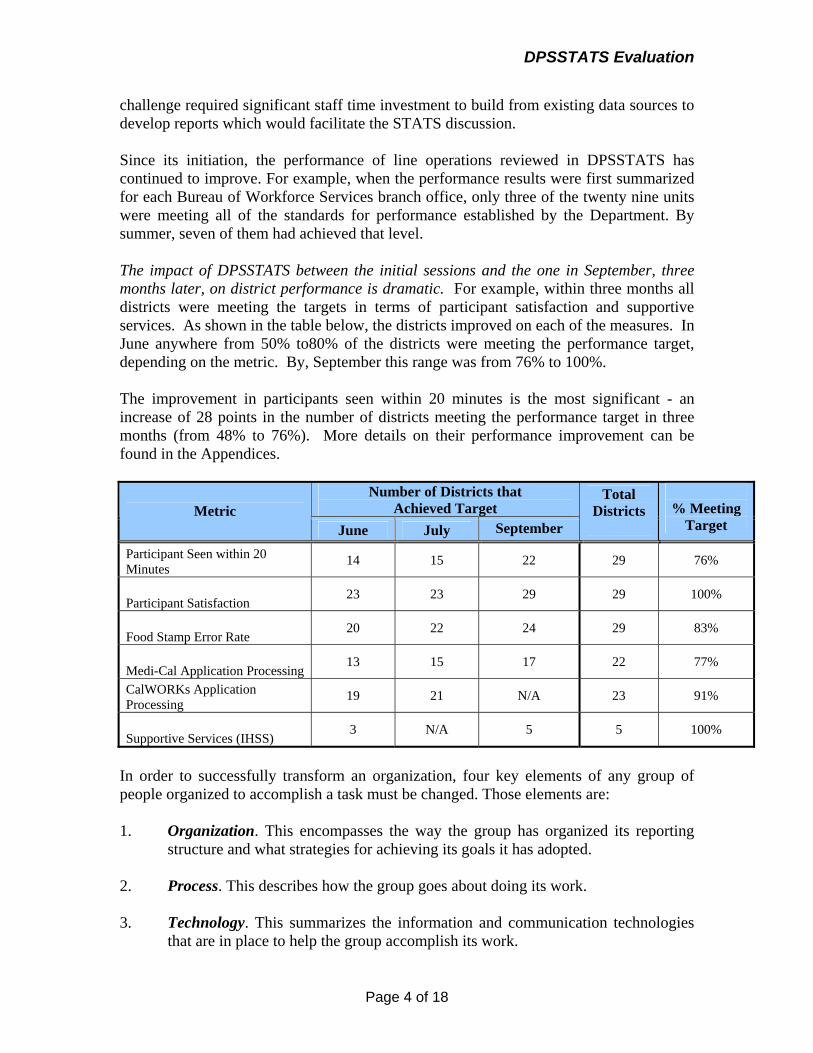
challenge required significant staff time investment to build from existing data sources to develop reports which would facilitate the STATS discussion. Since its initiation, the performance of line operations reviewed in DPSSTATS has continued to improve. For example, when the performance results were first summarized for each Bureau of Workforce Services branch office, only three of the twenty nine units were meeting all of the standards for performance established by the Department. By summer, seven of them had achieved that level. The impact of DPSSTATS between the initial sessions and the one in September, three months later, on district performance is dramatic. For example, within three months all districts were meeting the targets in terms of participant satisfaction and supportive services. As shown in the table below, the districts improved on each of the measures. In June anywhere from 50% to80% of the districts were meeting the performance target, depending on the metric. By, September this range was from 76% to 100%. The improvement in participants seen within 20 minutes is the most significant - an increase of 28 points in the number of districts meeting the performance target in three months (from 48% to 76%). More details on their performance improvement can be found in the Appendices.
Number of Districts that Achieved Target Metric
June July September
Total Districts
% Meeting
Target
Participant Seen within 20 Minutes
14 15 22 29 76%
Participant Satisfaction 23 23 29 29 100%
Food Stamp Error Rate 20 22 24 29 83%
Medi-Cal Application Processing 13 15 17 22 77%
CalWORKs Application Processing
19 21 N/A 23 91%
Supportive Services (IHSS) 3 N/A 5 5 100%
In order to successfully transform an organization, four key elements of any group of people organized to accomplish a task must be changed. Those elements are: 1. Organization. This encompasses the way the group has organized its reporting
structure and what strategies for achieving its goals it has adopted. 2. Process. This describes how the group goes about doing its work. 3. Technology. This summarizes the information and communication technologies
that are in place to help the group accomplish its work.
DPSSTATS Evaluation
Page 5 of 18
4. People. This includes all the members of the group and their knowledge, skills
and experiences. The STATS process is a powerful transformational process because it uses rapid feedback loops to simultaneously change all four of these elements, enabling the organization to continue its work without disruption, while moving the performance of the group much higher than it was able accomplish before. This report examines the impact that the DPSSTATS process had on each of these elements and the relationships between them. Organization The DPSS is organized into seven basic reporting layers. (see Appendix A for the complete organization chart.) The executive leadership team is made up of the Director, Chief Deputy Director, and (currently) four Assistant Directors or Bureau Chiefs (Administrative Services, Workforce Services, Special Operations, and Program and Policy) who meet each Monday morning to guide the Department’s operations. Seventeen Division Chiefs report to one of these four A.D.s, organized either geographically in terms of line operations, or by function in the case of administration and policy. The eighty one district managers, termed HSAs or ASMs or simply “IIIs,” who report to one of the Division Chiefs, meet monthly with the rest of the leadership of the DPSS to share progress and initiatives and maintain group cohesion. Each line district manager, in turn, has several deputy district managers to whom the supervisors of front line workers report. Thus, for an eligibility worker or an intake clerk, for example, at a DPSS office there are in fact three levels of supervision co-located within their office to whom they report “up the chain” and an additional three layers of management, not at their location, to whom their district manager reports. An early analysis of the meetings that the DPSS used to coordinate and organize the work of such a large and complex department, employing over 13,000 people in total, revealed a standing committee list of over 44 weekly, monthly or quarterly gatherings involving the time of anywhere from fifteen to fifty (in one case, 150) managers. To gain management support for the pilot, the Director of the DPSS suggested that this new process would reduce the time managers would have to spend in other meetings. However, this promise remains unfulfilled at the time of this report. While a few of the managers interviewed reported they were now able to make more efficient use of the time spent in meetings because of the data and common understandings that DPSSTATS has generated, none of them could cite any instances where particular types of meetings had been eliminated as a result of DPSSTATS. Instead the work of analyzing their particular DPSSTATS data and preparing for the meetings to discuss it had added as much as three days of work, often with the help of an almost full time dedicated administrative resource, to their already crowded calendars. Both the Director and Chief Deputy Director have committed to exercising their leadership in the reduction of meetings and time spent in meetings once they have completed a full cycle of DPSSTATS meetings for
DPSSTATS Evaluation
Page 6 of 18
the entire organization. A recent survey completed to support this effort identified a potential list of meetings that the department could consider eliminating or reducing in frequency. The Department Director has now mandated the “shedding” of activities and meetings that are no longer necessary or can be replaced by DPSSTATS meetings. One key to a successful governance process is the frequency and quality of interaction both across organizational lines between peers and within each work team. Here DPSSTATS has made a major, positive difference. The following table summarizes the comments of the top three layers of management who were interviewed for this report with regard to the amount of time they now spend discussing how to improve the performance of DPSS:
Interactions: Much More More Same Less Much Less Peers/Executive Leadership Team
1 2 1
Peers/Division Chiefs 4 5 1 Peers/District Directors
6 1
Team/Executive Leadership Team
2 2
Team/Division Chiefs 1 8 1 Team/District Directors
6 1
To a person, those interviewed reported that the quality of those interactions had also improved significantly. The most common comments were: • We are sharing best practices more easily • No more win/lose competition between us • Department is more integrated • Nothing has drawn us together more • Interactions are now positive and focused on problem solving • Training and tutoring down to supervisor and worker level has been enabled • My supervisors are more involved in idea generation and brainstorming These excellent results are due in part to the effectiveness of the implementation plan executed by the DPSSTATS taskforce. Before the pilot concept was introduced DPSSTATS had already undertaken an analysis of all the performance measurements identified as part of the County’s Performance Counts! (PC!) process to determine how best to align them with departmental and MAPP goals. This analysis was then used to sort out which measurements had sufficient and current data to be included in the DPSSTATS process. While the Department had used regular reviews of data and comparative performance in order to improve their food stamp error rate results, the use of this approach to manage the entire department’s performance was sufficiently ground breaking that it became a major topic for presentations at both the “IIIs” monthly meetings in the fall of 2004 and at the annual Management Conference with all managers in attendance in November of
DPSSTATS Evaluation
Page 7 of 18
2004. It was there that the taskforce first explained the meaning of the acronym, DPSSTATS, as standing for DPSS “Total Accountability, Total Success.” The task of collecting and organizing the data and the meetings proved to be larger than originally contemplated. The initial launch date was postponed from February of 2005 to April of that year. Before “going public” with the meetings, a dry run was conducted where the Chief Deputy Director herself played the part of presenter and allowed the ensuing questions and discussion to reveal how much more needed to be understood in order to conduct an effective STATS meeting. But with their courageous performance by two of the Division Chiefs in front of their peers and subordinates, as a “pilot of the pilot,” the rest of the team was sufficiently encouraged to give it a try. Several of them later reported that they were extremely nervous the first time they had to present, but that the atmosphere of “fear and apprehension” quickly disappeared because of the light touch and supportive environment that the Chief Deputy and Director established from the outset. This problem solving model of looking to each other to find solutions, avoiding “gotchas,” sharing best practices, and always looking to the data to find ways to improve was the most important and positive decision the taskforce made during the implementation phase. Organizational Recommendations 1. Cut Back Other Meetings. The results of the recently completed survey on which
meetings might be eliminated or cut back should be quickly analyzed and a list drawn up of those that will no longer be held or that will be held less frequently. This list should be a decision of the executive management team and communicated quickly to the organization. It should be part of the review of DPSSTATS on an ongoing basis. Nothing is more important to ensure the continuing support of DPSSTATS then redeeming this promise of meeting reductions that was made last year.
2. Examine Current Governance Structure. The new mode of transparency and
collegial collaboration established by the experience of attending DPSSTATS meetings is generating opportunities to make the overall governance and decision making process of DPSS more transparent and inclusive. A comprehensive approach to this issue would include examining which types of decisions really need to be made at the Executive Management Team level and which types could be made elsewhere. For instance, policy and program changes might be left at the senior leadership level but operational concerns or decisions might be delegated to the DPSSTATS gathering or a new structure made up of Division Chiefs.
DPSSTATS Evaluation
Page 8 of 18
Process Our review examined the processes within DPSSTATS from two dimensions:
DPSSTATS implementation process – How well did the DPSS manage the process of implementing STATS? What new processes were established to support DPSSTATS and how effective were they?
Impact on DPSS’s processes - What improvements in DPSS management
processes resulted from DPSSTATS? Implementation Process The overall rapid deployment of DPSSTATS is both notable and commendable. Within a year from the initial exploratory conversations, DPSSTATS has become fully operational. Regular monthly meetings are being held and the role of these meetings as a critical vehicle for reviewing performance has been institutionalized. The immediate formation of the implementation taskforce with assigned duties and responsibilities was a critical factor in this success. Executive management, under the direct leadership of the Chief Deputy, mobilized the resources necessary to address the logistical, administrative, data and technology issues required. Specific processes were developed for:
Collecting data Reporting and presenting data Analyzing data Distributing performance reports to all STATS presenters and participants.
The initial implementation focus was on the field line operations, Bureau of Workforce Services and the Bureau of Special Operations. The focus on these units was a successful strategy for several reasons: (1) operational entities have direct interaction with the customer and therefore can have the greatest impact on the participants in the short term; (2) their functions involve the greatest number of employees; and, (3) a focus on these units leveraged the extensive amount of work the Department had done in identifying key measures as part of their PC! implementation. Credibility and acceptance of both the measures and the reported data is an essential ingredient of the STATS process. Participants in the process on all sides must recognize and believe that the:
Measures are the right measures and are indicative of priorities of the department and that the
Data reported is “real” and accurate. With regard to the first issue, the DPSS began with some distinct advantages:
It has been involved in performance measurement for some time beginning with the work on Food Stamp compliance rates noted above.

DPSSTATS Evaluation
Page 9 of 18
PC! spurred an effort within the DPSS to refine and prioritize the critical measures of success for the Department in major program areas: In-Home Supportive Services; CalWORKs; Food Stamps; General Relief; and, Medi-Cal.
The department invested significant time and resources during fiscal year 2003/04 reviewing the performance measures that had been put in place and aligning them with Director and MAPP performance goals.
In sum, the DPSS had an existing body of information in terms of both measures from PC! and data from existing reporting systems, including those for federal and state compliance purposes, that it was able to leverage for the first roll-out of DPSSTATS. Secondly, centralized data management, including data consolidation, analysis and reporting were capacities that the Department already possessed. The combined efforts of the STATS team and Information and Statistical Services created reports and presentations which effectively facilitated the DPSSTATS conversation. These efforts created a departmental framework of the measures that were critical to the Department’s success and provided the basis for the STATS team to monitor results throughout the organization and down to individual district offices. District office performance could then be compared to one another within and across regions. Thus, the DPSS was able to bridge the gap that occurs in most performance measurement efforts between individual performance and organizational performance. The Department created an answer for all employees – “How does this apply to me and my job?” The impact of STATS was even greater than anticipated with regard to data accuracy. Seventy percent of the District Director’s interviewed felt that the quality of the information they had to manage their operations was “much better” than what existed before DPSSTATS. They held that opinion for a variety of reasons, all of which signaled that they now “owned” the data, rather than having the data come from staff without recourse to its accuracy. One division completely changed their monthly management report to align it completely with DPSSTATS metrics. District managers undertook to quickly learn the sources and process used to create the data so they could trace the results back to the original source material and challenge it where necessary. Many have adopted their own methodology for real time data tracking so they now felt the information was both more current and more accurate. Once they “owned” the data, they also “owned” the results. The executive team, noting this enhanced focus on the validity of the data by their district leadership, agreed with them, in the same relative percentage levels, that the quality of the information that was being used in the Department was of “much better” quality since DPSSTATS was introduced. Only the Division Chiefs, who needed to mediate between the increased demand for accuracy from their teams and organize their presentations based on the centrally generated data, felt less positively about the improvements in the quality of the information they had as a result of DPSSTATS; and, even the majority of managers at Division Chief level that were interviewed felt the quality was at least better, if not much better.
DPSSTATS Evaluation
Page 10 of 18
As many of those we interviewed stated, it wasn’t that the DPSS didn’t have data to manage their organization before DPSSTATS, it was that as a result of this new process, everyone, down to the clerks in a district office, were paying attention to the data both to ensure its accuracy and to be able to explain what they were doing to improve the results it documented. Impact on DPSS Management Processes DPSSTATS has had at least two major impacts on the internal management processes within the DPSS: 1. Real and measurable improvement in the performance of district offices as
measured by their improvement on key performance targets. In order to prepare for their presentations to DPSSTATS, most division chiefs have instituted a process of data review and idea brainstorming with their district directors. To get ready for those sessions, each district director interviewed said that they were going over the data and asking their teams to give them ideas on how to improve their results on a monthly if not weekly basis. The division chiefs then shared these ideas and/or best practices with the entire line operation, across the whole Department, not just within their own, during the DPSSTATS meetings. The result was a wave of innovation and focus that inevitably led to improved results as ideas that worked became part of the daily routine and those that didn’t were quickly discarded. One of the major tenets of the STATS process is “relentless follow-up and assessment”. Achievement of this was facilitated in part by the creation of the DPSSTATS Meeting Commitments. Discussion of improvement actions and next steps were documented as a meeting commitment at the end of discussions. Improvements range from technology investments and process redesigns to staffing reallocations. For example, redeployment of resources would be tested, results monitored and then replicated in other district offices. Appendix B has a list of the completed meeting and active meeting commitments as of September, 2005. Examples of the process improvements noted:
Creation of a caseload processing “Stop Light” chart by unit to monitor unit performance in meeting targets.
Working with Line Operations to redesign the training and field schedule. Based on input from the Line, new hire trainees will return to offices one day per week for the duration of their training.
Increasing access to real-time or current data in the major systems such as LEADER.
These and other improvement efforts provided the ingredients for district offices to increasingly achieve their performance targets.

DPSSTATS Evaluation
Page 11 of 18
2. Reduction in the cycle time for decision-making and deployment of resources.
Communication between the committees enumerated earlier as well as up and down the organizational chain of command could take weeks or months. The time it took to resolve issues that were raised via memos or meetings using this governance process was measured in quarters or, in some information technology cases, years. The cycle time for decision making after DPSSTATS gathered all the relevant players in the same room every month with due dates established for every action item committed to at the meetings quickly changed all that. Several interviewees noted the reduction in the time it took to get a decision from problem identification to solution as a result of the DPSSTATS meeting process. For instance, at an early meeting, presenters identified outdated equipment and technology that was contributing to delays in processing of timesheets for payments due for the IHSS programs. At the meeting, purchase of new office equipment was approved and staff from General Services was directed to proceed. By the next month, the equipment was already in the process of being installed. A second example was observed with regard to training on Food Stamp processing system (LEADER). District staff noted that one thing that was contributing to the error rate was a lack of understanding on the part of front line workers of how to compute food stamp eligibility amounts with fluctuating participant income. Training staff was at the meeting and agreed to immediately adjust the training agenda to accommodate this topic. The modified training was deployed within weeks.
Process Recommendations 3. Continue to build the measurement scorecard. As noted above, the development
of measures for DPSSTATS reflected the culmination of several previous efforts to identify what are the important metrics of success to achieve the Department’s desired outcomes. Now, two challenges remain:
(a) Continue to expand and refine the set of measures. Conversations are beginning to take place at DPSSTATS meetings, particularly in regards to measuring customer service, about whether the measure is the “right measure”. Additional measures are also scheduled to be included as part of the DPSSTATS agenda beginning in the fall 2005. These efforts should be encouraged and promoted. Interviewees noted that they would like to see the DPSSTATS effort evolve with more measures related to program and client outcomes, such as workforce development, sustained employment, usage of benefits, etc. Continued questioning of whether DPSSTATS is measuring “the right stuff” will enhance the credibility of the process and make sure that DPSSTATS is keeping the focus on what will make the difference in achieving departmental outcomes. Even within those measures that are accepted, continuing monitoring of the method for data collection or calculation will be important to better
DPSSTATS Evaluation
Page 12 of 18
leverage technology, increase accuracy and/or reduce the data collection burden. Technology and process solutions, for example, should continue to be considered to more accurately calculate client wait times.
(b) Invest resources to support developing measures for other functions within the DPSS. The department has recently focused on expanding the participation in the DPSSTATS process to internal support functions, such as Administration and Information Technology. The challenge for these bureaus is twofold: identifying the right measures; and developing the data sources to support measurement. Unlike the district office operations, the Department does not have a history of measurement in the internal support units. The conversation for these units on the right measures will be important and should be encouraged, recognizing that the data infrastructure is still being developed. The support department functions and corresponding measurements must reflect their alignment in supporting the strategic objectives of the line operations and the DPSS.
4. Centralize data management under Information and Statistical Services. The
Information and Statistical Services has provided resources to supplement the DPSSTATS team for report development and production. This Office has the knowledge, experience and resources for data collection and reporting. We recommend that the DPSSTATS Office come under Information and Statistical Services in order to:
Share and maximize resource Leverage the expertise on data residing within Information and Statistical
Services Continue to be the central source for all reporting Eliminate duplicative reporting of results now covered by the DPSSTATS
reports Ensure the integrity and reliability of the data.
5. Invest in broader process improvement initiatives. The initial roll-out created
progress and improvement just from focusing management attention on the results. A list of positive actions that results from the DPSSTATS meetings reported by management is included in Appendix B (Completed Commitments). The next stage of improvement will require looking at core management and operational processes to reach the next level of improvement. This will likely require looking across individual district office performance and breaking through operational and administrative barriers to identify changes in process and technology required to improve the results. Once again the Department can use their experience in doing just that to fix the food stamp error rate as the model for what will clearly be the next stage of DPSSTATS.

DPSSTATS Evaluation
Page 13 of 18
Technology The DPSS has made significant technology investments to support DPSSTATS including software investments and dedicating resources to be trained on how to utilize the technology. The Department was able to leverage the work completed by the County CIO to select Cognos as the County’s business intelligence software standard, which greatly contributed to the rapid start-up of DPSSTATS. Cognos provided a tool for an effective display of the metrics scorecard, bypassing what could have been a cumbersome and time intensive process for the selection and procurement of technology. However, the implementation of Cognos created challenges for DPSS, some which were technology-based and some which were resources-based. For example, the rapid deployment of DPSSTATS did not provide opportunity for comprehensive planning of the Cognos solution and its implementation. Short-term strategies were pursued that did not allow for full examination of the impacts and requirements of this solution. As a result utilization of this solution is cumbersome and interim solutions have had to be implemented. The department realized as they went through the process, that in order to maximize investment, further technology investments will be required such as a data warehouse. This is a project that had been put on the shelf earlier this decade which was brought back to life when the criticality of having such information to produce DPSSTATS reports became clear. Now the Department has established a team of about eight staff, charged with bringing the warehouse at least in its first phase, on line in 2006. A second technology challenge is the lack of automation outside of the core processes which support district offices and even in some cases within line operations. Internal administrative functions do not have the automation or sophistication to support the DPSSTATS process. In the field, clerks are still spending significant time collecting faxed time sheets or examining microfiche historical files. Front line workers working outside the office to reach their clients are hampered by their lack of mobile devices such as PDAs and high speed communication capabilities to avoid time wasted driving back to their office to “fill out the paperwork.” While previous “tight budgets” may have made it seem possible to delay or avoid investing in these kinds of technologies, the pressure for improving results that flows from DPSSTATS meetings will mean that these investments will no longer be able to be postponed. Technology Recommendations 6. Recognize and plan for increased automation needs. As the process
improvement discussions intensify, information technology will almost inevitably come up as a key enabler to improving process outcomes. Rather than trying to budget for each discrete project, the DPSS should anticipate this need as a continuing fact of life and establish a budgetary process that sets aside money each year to make such investments. In this way, when the need for a particular investment is identified, the funds can be used to make it without the need for painful discussions of trade offs and relative priorities.

DPSSTATS Evaluation
Page 14 of 18
7. Ensure the completion of the data warehouse project. If DPSSTATS had not been thrust upon the Department as an immediate request, a more logical approach to its implementation would have been the establishment of a data warehouse first, before attempting to “mine the data” for the results that needed to be displayed at the meetings. But now that the need has been clearly identified, the Department must make sure that the project proceeds with the necessary resources and support to ensure its timely completion. This type of data access will have the added benefit of reducing reliance on the central office for data and reports. Indeed, the Department’s recent experience with their financial results portal, based on Oracle technology, has demonstrated the interest for this type of easy data access as managers increasingly rely upon it to improve their results.
People Perhaps the largest impact that DPSSTATS has had on the Department is the cultural change it has caused throughout the organization. Like many other geographically deployed operational entities, the Department had many inbred attitudes towards the work it did and the people it worked with. Each district office competed for resources and attention with every other. All of them united in the traditional line hostility towards those in staff assignments who “had it easy” and “didn’t understand what we go through every day.” Staff continued to churn out policies and guidelines on how to comply with state or federal mandates or even Department-generated goals like Customer Service. Line operations explained away their performance results based on traditional, often anecdotal, justifications that were idiosyncratic with the given operation or office, making cross comparisons difficult and attempts to improve implicitly futile. Expectations that results could ever change in certain areas of the County were routinely dismissed as naïve at best and insensitive at worst. Working against this traditional culture was the Department’s earlier experience with fixing the food stamp error rate problem. When the County’s poor performance in this area threatened the County, and thereby the State, with huge financial penalties, a process of posting and comparing real results for each district office was put in place. At the time the Director of the Department was cautioned that this action could impact employee morale and lead to a flight from the department. Instead, the examination of data revealed ways to fix the problem by changing processes that made the individuals involved feel better, not worse, about themselves and their performance. In fact, it was this story or “myth” about how the Department fixed its food stamp error rate that became the basis upon which the DPSS was selected to be the County’s STATS pilot. And it was this first inkling of the cultural change that was possible that actually became the experience of the whole Department as DPSSTATS was rolled out. “Change the culture by changing the conversation” is the simple way to summarize what is in fact a very difficult and time consuming transformational process. Examining the cultural changes that have already occurred in six short months at the DPSS as a result of DPSSTATS is therefore all the more remarkable. A conversation is made up of four elements:
DPSSTATS Evaluation
Page 15 of 18
1. What people say. 2. What people don’t say. 3. What people hear. 4. What people don’t hear. All four of those elements have changed dramatically in the department as a result of DPSSTATS. By bringing all District Directors into the DPSSTATS meetings where their Division results are being discussed by their Chief in front of both the staff divisional leaders and the Executive Management Team, everyone started talking about the same thing, namely the specific DPSSTATS performance goals and how they were doing against them. Initially some of the Division Chiefs floated the old bromides about how “my area is different” or “X office always has those results” but the data blew that conversation away. Now the conversation is all about:
Ideas from other districts that have been or will be tried, The relevancy and accuracy of the data being reviewed, Relationship of staffing levels and hiring practices to customer service results Target levels of performance improvement that will be accomplished by a certain
date And people are hearing new values and incorporating them into their own local office cultures. Here are the main elements of the new culture in DPSS based on the interviews we did:
Being accountable, Focusing on data and ‘real issues’, Understanding the details of performance, Involving others in solving problems, and Anticipating problems and getting in front of them before they happen.
That’s what the management team heard during DPSSTATS meetings and those are the values they are adopting as a result. While everyone told us that they were working harder than ever before, very few of them expressed any dissatisfaction with this new way of working. Instead they took pride in the improvements in their performance they had been able to accomplish, their new levels of understanding and attention to the performance data that they now had available, and the way they were able to enact changes in their operations because “we have to meet our DPSSTATS targets.” These changes involved:
Introducing their own data tracking systems, one even self-automated, that would allow them to anticipate what the next DPSSTATS results for their operation would look like
Shifting resources to focus on improving results regardless of past staffing practices
Training front line workers and supervisors on the interrelationship between their work and the district’s results
Deciding what measurement goals would be included in future DPSSTATS meetings and starting to improve their results on these measurements even before they became a part of DPSSTATS
DPSSTATS Evaluation
Page 16 of 18
Finally, an entirely unanticipated consequence of introducing DPSSTATS into the Department’s culture was their ability to then chart how the work of each part of the organization, all the way down to the front line worker, impacted the Department’s overall results. This “balanced scorecard” result came from an interaction between the DPSSTATS taskforce and the consultant brought in by the report generation company, commonly referred to as Cognos. The result was a one page chart for each Bureau that definitively answered the question any worker might ask about the changes, namely, “what about me and my job?” (See appendix D). Correspondingly, STATS provides the vehicle for the objective evaluation of staff and managers. At the outset the leadership of the DPSS had wanted to achieve a greater alignment of goals and purpose in the Department as part of the DPSSTATS effort. While this chart presents this alignment graphically and persuasively, the comments from those interviewed demonstrates just how much alignment was actually achieved in even more dramatic terms:
“My team is now aligned on achieving our results.” “Division Chiefs react quickly and positively to ideas for improving our
numbers.” “Staff now understands the consequences of undersupplying my organization with
IT equipment and is doing something about it” “Everyone is working together” “DPSSTATS made it normative in the department to honestly confront truth
about programs and operations.” We have lessened the tendency to say “I can’t do” and increased the tendency to
say, “Here’s what I can do”. “It helped me smooth out labor/management discussions.” “We need to have contractors involved in this too.”
One interviewee said, “Nothing like this has ever happened before. We are together as a Department at last.” And all but four of those interviewed said that, as a result of the DPSSTATS meetings, their understanding of the challenges facing the Department had increased. Other specific comments about this broader understanding of the Department included:
It helps identify priorities Focuses us on our challenges and reveals what folks are doing about it Provides a chance to ask real strategic questions Lets me see how the public perceives us Reveals impact of other bureaus on me Makes me more comfortable about being rotated to other jobs Helps us see interrelationships between (MAPP) goals and measures.
There is no question that this level of cultural change would have been impossible without the strong personal commitment and leadership of the Director and his Chief Deputy. DPSSTATS went from being something they had to try on behalf of the County to something they were strongly committed to, living and breathing it every day. Their
DPSSTATS Evaluation
Page 17 of 18
ability to introduce the concept without “shoving it down our throats”, was extraordinary. By their own actions they demonstrated the new culture of “everyone is in this together” and by their constant good humor and indefatigable energy they made it a success. They were inclusive, opening the taskforce meetings and the DPSSTATS meetings to Lari Sheehan, representing both SIB and CAO offices, and to both of the consultants selected for them by the CAO. At every step of the way they included these “outside forces” in their decision making processes and their efforts to improve the process as it went along. Every one of their managers noticed, and every one of them is now exhibiting the same inclusive and collaborative behavior to improve their own operations. The success of the STATS process has been documented in other settings and in other governments, and the number one lesson learned there applies here as well—it won’t happen without the leadership and commitment of the most senior members of the organization. People Recommendations 8. Invite the World to the Meetings. DPSSTATS is now such a hot topic throughout
the DPSS that everyone wants to see what it is really like. While the room is already quite filled with all those presenting the results they are responsible for, some way to invite, on a rotational basis, other members of the organization, especially deputy district office directors, should be found. With mini-STATS meetings popping up in district and divisional settings and management learning occurring at a rapid pace, this kind of learning by observation can only help to accelerate the cultural change taking place.
9. Increase Data Analysis Training. The new practices within DPSS of challenging
every data report, determining its validity through source data examination, and determining what tracking is needed to anticipate the next round of results are marvelous to behold. Building off this new found interest, the Department should seize this “Teachable Moment” and hold special courses, preferably with the support of the LA County Academy, on how to analyze data, tell stories in charts, and present a cogent explanation of what the data is saying and what to do about it. Such an effort will greatly enhance the skill levels of the organization and simultaneously ingrain the new cultural focus on data forever.
10. Share the Knowledge. Companies who win the nation’s Baldrige award for
quality are obligated to set aside resources for a year to help other companies who want to learn from their experience. While that might be too big a burden to impose on the Department, it is clear that just as the Department’s leadership has already done at County executive strategic planning conferences, some of the department’s leadership time should be spent educating others on what was done, how it was done, and why it was done. Just as the initial observations of LASTATS helped to crystallize the implementation plan for the DPSSTATS taskforce, visits to DPSSTATS meetings and other inter-departmental interactions can help spread this best practice to other parts of LA County.
DPSSTATS Evaluation
Page 18 of 18
APPENDIX
A. DPSS Organization Chart
B. Completed and Pending Meeting Commitments
C. Sample STATS Report Card 1) Summary by District Office 2) Sample Results Display
D. Bureau Balanced Scorecards

Part II: Applying the Lessons from DPSSTATS to LA County The introduction of the STATS process at the Department of Public Social Services (DPSS) created a unified focus at all management levels in the DPSS on achieving performance targets. DPSSTATS provided the vehicle for all levels of the organization to understand the results the Department is working to achieve. As a result of this performance focus, many of the traits of a bureaucratic culture are beginning to be erased and the challenges required to breakdown barriers to performance are becoming readily apparent. Through this process, the DPSS is well-on its way to aligning line operations and internal support functions to better achieve its targeted results. While preliminary and based on a limited time, the specific operational improvements witnessed during the pilot implementation are compelling. The first roll-out of the STATS process tracked six key measures of front-line operations across four divisions and 29 district offices. The table below summarizes the improvement across these units. Performance was evaluated at three sessions in June, July and September (with the exception of CalWORKs application processing which was only evaluated in June and July because of the progress achieved on that target so quickly):
Number of Districts that Achieved Target Metric
June July September
Total Districts
% Meeting Target
Participant Seen within 20 Minutes 14 15 22 29 76%
Participant Satisfaction 23 23 29 29 100%
Food Stamp Error Rate 20 22 24 29 83%
Medi-Cal Application Processing 13 15 17 22 77%
CalWORKs Application Processing 19 21 N/A 23 91%
Supportive Services (IHSS) 3 N/A 5 5 100%
The impact of DPSSTATS between the initial sessions and the one in September, three months later, on district performance is dramatic. For example, within three months all districts were meeting the targets in terms of participant satisfaction and supportive services. As shown in the table below, the districts improved on each of the measures. In June anywhere from 50% to80% of the districts were meeting the performance target, depending on the metric. By, September this range was from 76% to 100%. The improvement in participants seen within 20 minutes is the most significant - an increase of 28 points in the number of districts meeting the performance target in three months (from 48% to 76%). More details on their performance improvement can be found in the Appendices.

DPSSTATS Part II
Page 2 of 7
The second major area of impact was in the cultural changes that the DPSSTATS process enabled. As documented in the management interviews, communication across the organization as well as up and down the management chain immediately increased. Resolution of issues that were surfaced during DPSSTATS meetings were resolved either immediately at the meeting or in conversations between meetings, so that the former cultural response of linear problem solving ( memo writing, extensive committee meetings and slow deliberation ) was replaced with one that moved at the speed of high performance organizations. In fact, every element of the Condition B cultural change direction that the leadership of LA County is committed to achieving was accelerated by the introduction of the STATS process into the operations of the DPSS as summarized in the following chart:
Cultural Element: Condition A
Cultural Element: Condition B DPSSTATS Impact
Personal Power Model Collaboration Vastly increased levels of collaboration per interview data noted among managers and executives throughout DPSS
Silo Thinking Systems Thinking Problem solving approach used in DPSSTATS meetings requires integrated thinking and allows all vested interests to contribute to solution; tangible problems surfaced and discussed
Reactive Proactive Managers now anticipating impact of decisions on results
Needs-Based Strengths-Based Pride and purpose at manager level for performance improvements; discussions focusing on leveraging and sharing successful practices
Logical Creative Idea sharing and change initiatives enabled by DPSSTATS process
Past Referenced Future-Oriented Old myths died. Next month’s numbers became focus of conversation; discussion moving to “what can” be done from “what can’t”.
Independent Interdependent Peer team meetings at division and district level created to deal with DPSSTATS meeting prep. DPSSTATS assignments require support units to assist line units in improving results. Overall improved alignment of department energies to improve results.
Inputs/Outputs Results/Outcomes Discussions at DPSSTATS keeps focus on results. Managers reported new focus on impact on outcomes of suggested activities.
Mechanistic Learning Organization Rapid Learning with monthly, all hands DPSSTATS meetings. Departments achieving targets are encouraged to share “promising practices” which can be replicated throughout the organization.
DPSSTATS Part II
Page 3 of 7
To be sure, these changes were not accomplished without some anxiety and they are not yet completely in place today. One of the barriers to the cultural change is the existing level of skill and experience in understanding the “root causes” and solutions to improve results within the management ranks of the DPSS. Making public presentations that explain the stories that the objective data is telling is not something most of their managers had experience with. Yet, within the first two months of the process, those making presentations had met with each other, shared ideas on how to handle this new responsibility and were quickly practicing their new skills with confidence. Analyzing data and using it to develop action plans to improve results was also not something all members of the organization felt comfortable doing, despite their early success with this approach to fix the food stamp error rate. But now, District Directors are holding meetings with their own deputies and supervisors to do just that in order to improve their numbers before the next DPSSTATS meeting. Ideas and insights on how to improve performance are flowing rapidly within and between district offices as a result. So while these types of skills may not be present in other County departments or at all levels of management, there isn’t any reason to think that everyone will need to be trained on them before embarking on additional STATS projects. Instead, the DPSS experience suggests the learning will occur during the process, and is not necessary as a pre-condition to its implementation. While there are many aspects of the DPSSTATS pilot that are both remarkable and commendable, perhaps the most amazing aspect was the development of a complete balanced scorecard picture of the DPSS operations that linked everyone’s job back to the measurements that were being discussed at the DPSSTATS meetings. As shown in the four charts (one for each Bureau in DPSS) in Appendix D, the DPSS can now draw the relationships between stakeholder expectations and their internal department processes, including showing the impact of enablers and financial controls, in ways that document for each front line worker their particular contribution to the achievement of the overall departmental goals. The Department’s executive management built on the work completed as part of Performance Counts!, as well as training linked from the technology implementation, to create a map linking individual and unit performance to key metrics of DPSS success. This kind of analysis, which would normally take months if not years of effort, was enabled using the organizational priorities identified through the Performance Counts! process as the starting point for the DPSSTATS performance metrics agenda, and then generating the specific data for discussion of specific unit performance, required under a STATS process. Getting all departments to the point where they can easily answer the question all front line workers have about organizational change, “what about me and my job?” is a key goal of the County’s strategic planning efforts. The role, however coincidental, of DPSSTATS in getting at least the DPSS to that point, also advocates for its further adoption in other parts of the County.
DPSSTATS Part II
Page 4 of 7
Cultural Recommendations
1. Use STATS to move toward Condition B. In order to further accelerate the
movement from Condition A to Condition B in LA County, additional opportunities to introduce the STATS process should be found with the support and encouragement of the Guiding Coalition. Opportunities exist within other departments who can model and tailor the DPSSTATS approach as well as interdepartmental task forces that are working on cross-department program integration.
In thinking about where to attempt to introduce this process next however, it is clear that not all County departments currently have the capacity to undertake such an effort immediately. Based on the experience with the DPSS, there are three critical pre-conditions that must be in place in order for a department to move towards a “STATS” implementation:
I. Strong commitment from executive management – As with any major cultural change initiative, leadership is an essential ingredient. The leadership and investment from executive management set the clear expectation that “failure” was not an option and that this was a clear path on which the organization was setting. The challenge became not whether the pilot could work, but how could the pilot be effectively designed to further move the DPSS to a performance-based culture.
II. Understanding of the organization’s key results – As several interviewees noted,
“Performance Counts!” is what made DPSSTATS possible. The time invested in identifying and defining the priority results through Performance Counts! enabled the DPSS to move to the next stage of performance-based management; i.e. the DPSS was able to build from what the organization has already determined was “good performance”. Moreover, the DPSS had over the previous two years reinforced its mission-driven orientation through extensive training and outreach to multiple layers within the organization. As one interviewee commented, “what’s measured is not substantially different, but the way it’s presented and how it’s used is”.
III. Data and information management for credible reporting – In order for the
process to be effective, the department must start with an initial scorecard of measures backed by timely, frequent, and credible data. The STATS process may trigger re-evaluation of the measures or definitions, or methods for reporting the data, which is effective and valuable; but credible data must be available to facilitate meaningful conversations on performance deficiencies and improvement actions.
Indeed, the difficulties that the DPSS experienced in mining the data needed for DPSSTATS meetings demonstrates that certain key IT infrastructure systems should be in place before a Department without the extensive and capable resources that the DPSS possesses should make such an effort. While the data system needs will vary depending on the size of the department, it is clear that some kind of central repository of
DPSSTATS Part II
Page 5 of 7
performance data needs to be in place, even before the department adds on report generating capacity, such as the Cognos tool successfully used by the DPSS. Finally, as both the Director and the Chief Deputy Director made clear, no department who does not have a leader completely and personally committed to instituting this kind of far reaching change, should even think about “doing STATS.” As the Department Director of the DPSS, Bryce Yokomizo, said, ‘This isn’t something you can delegate. You have to treat it the same as you would a commitment to your family. It’s personal.” Technology Recommendations
2. The CIO, working with the CAO, should provide guidance to departments on the business cases in which the County business intelligence standard of Cognos can be effectively applied. The County selected Cognos as the County’s business intelligence standard solution through a process led by the CIO. Since that time, applications of this software have been implemented at DPSS, DHS, Auditor-Controller and are being explored at other County departments. Based on these diverse experiences, the CIO should provide guidance to departments on business cases in which it has been effectively deployed and under what conditions.
As witnessed by the response at the recent June 2005 Executive Conference convened by the CAO, interest in DPSSTATS will likely trigger interest in employing Cognos as a business solution to support performance reporting. Cognos was selected as the County’s standard for business intelligence in 2004 and has been implemented by departments to address diverse reporting needs. Cognos has been an effective contributor to the DPSSTATS project implementation in providing the capacity for the effective demonstration of results, but it has required an intensive level of staff support. If DPSS had a more complete understanding of the system functionality and limitations at the project onset, different implementation strategies may have been pursued. Consistent with the County Strategic Plan emphasis in creating a “learning organization” the CIO, working with CAO, should prepare an analysis of the first two years implementation experience with Cognos so that departments can understand how this tool can be effectively used to support their own business strategies. Process Recommendations This report provides a vehicle to facilitate the “learning organization” embedded in the Strategic Plan, but continued learning is critical. DPSSTATS marks an important milestone in the County’s implementation of Performance Counts!. It is the first large-scale effort in which the County is transitioning from performance reporting to performance based management, which marks a change from treating reporting as an external function or compliance effort to an internal effort that uses performance measures to manage the achievement of results.
3. Continue to provide and invest in opportunities for creating learning around performance-based management. The knowledge and understanding
DPSSTATS Part II
Page 6 of 7
in performance based management has to continue to be shared and discussed throughout the County. STATS is not the only performance based management tool, but since it has shown to be effective within the County it should be promoted and departments encouraged to adapt it in ways that support their own service model, structure, and processes.
Organizational Recommendations
4. Survey Departments for STATS readiness. The CAO should ask all
department heads if they are at all interested in attempting a STATS process based on what they learn from Director Yokomizo. For those leaders interested, the CAO’s office should develop a survey of their technological, organizational and human resource capabilities to handle such a task. Particular focus should be placed on how complete their existing PC! program is, the existence of performance data and a data system to collect and track the data, and the skills and experiences of its management team in using data to make decisions. At least two additional Departments should be selected from among those surveyed so that it can be determined if the impact the process had on DPSS was unique or a replicable phenomenon.
County Departments are not the only organizational entity that might benefit from the use of a STATS approach. The most common use of the process is currently within municipal governments who have expanded their initial CompStat approach for fighting crime to one that encompasses most of their service delivery operations. Certainly, departments with similar services such as the County Department of Public Works, might be candidates for STATS; but, so too might the “virtual municipalities” created by the Goal 6 team on unincorporated areas. There is no reason why the Goal 6 team could not develop a set of measurements for their delivery of services in a given geographical entity and then organize a STATS process with all departments involved to meet regularly to review their performance and develop ideas for how to improve it. Other programmatic goal teams, including health, public safety, and even Children and Families, possibly under the leadership of NDTF or IOG, might also consider such an approach for their own performance measurements and outcomes. Furthermore, other teams or clusters with a common goal, like cultural enrichment or revenue collection could self-organize into a STATS process. Finally, the STATS process might be considered as a way to ensure an effective and credible governance process for those departments involved in the shared services project. Clearly the discussion of performance that it generates will ensure that their interests will be protected and performance against the service level agreements monitored. None of this would require any initial changes in organizational strategies or design at the County level.
5. Test other venues for STATS process. Use the Guiding Coalition to
determine if there is any interest in using STATS to improve performance for their specific goal, starting with Goal Six. Also use the GC to examine the possible application of STATS to other County processes and/or shared services pilots.
DPSSTATS Part II
Page 7 of 7
Conclusion The DPSSTATS pilot has been successfully proven to be an effective tool for improving departmental performance and achieving the Strategic Plan’s purpose of moving the County’s culture from Condition A to Condition B. Its success demands that the County expand the learning from the pilot to other departments and cross-departments functions within the County. Secondly, DPSSTATS provides the best promise among the County investments to date of moving from performance reporting to managing for performance. The recent survey of departments conducted as part of the Performance Counts! Phase II evaluation found that less than 20% of the departments were using Performance Counts! indicators and operational measures to drive decision-making processes. Similarly, it is not surprising that approximately 40% of the departments surveyed also responded that would require support in establishing performance-based decision-making models. The need is apparent. The efforts of the DPSS in taking on this leading edge initiative should be commended and recognized, and provide the launch pad for further initiatives.


