106
LOS ANGELES COUNTYWIDE COMPREHENSIVE PARKS & RECREATION NEEDS ASSESSMENT MAY 9, 2016 Los Angeles County Department of Parks & Recreation

LOS ANGELES COUNTYWIDE COMPREHENSIVE PARKS & RECREATION NEEDS ASSESSMENT
MAY 9, 2016
Los Angeles CountyDepartment of Parks & Recreation
LOS ANGELES COUNTYWIDE COMPREHENSIVE PARKS & RECREATION
NEEDS ASSESSMENTMAY 9, 2016
This document was prepared by:

TECHNICAL ADVISORY COMMITTEE
» Javier Aguilar » Lee Butterfield » Nick Franchino » Mark Greninger » Su Jin Lee » Weimin Li » Douglas Morales » Viktor Patiño
» Patricia Pendleton
INCORPORATED CITIES OF LOS ANGELES COUNTY
» Over 175 staff members in 86 cities
RESIDENTS OF LOS ANGELES COUNTY
» Thousands of County residents shared their thoughts about parks in Los Angeles County
CONSULTANT TEAM »
ACKNOWLEDGMENTSMany individuals and organizations contributed to the successful completion of the Los Angeles Countywide Parks and Recreation Needs Assessment. The efforts of those noted below are especially appreciated; please refer to the main report for more detailed acknowledgments.
LOS ANGELES COUNTY BOARD OF SUPERVISORS
» Hilda L. Solis, 1st District » Mark Ridley-Thomas, 2nd District » Sheila Kuehl, 3rd District » Don Knabe, 4th District
» Michael D. Antonovich, 5th District
SUPERVISORIAL DISTRICT STAFF
» Javier Hernandez, 1st District » Teresa Villegas, 1st District » Lacey Johnson, 2nd District » Karly Katona, 2nd District » Maria Chong-Castillo, 3rd District » Erin Stibal, 4th District » Sussy Nemer, 5th District
» David Perry, 5th District
LOS ANGELES COUNTY PARKS AND RECREATION COMMISSION
» Ed P. Reyes, 1st District » Mayisha Akbar, 2nd District » Bettina Duval, 3rd District » John Hsu, 4th District
» William J. Korek, 5th District
LOS ANGELES COUNTY DEPARTMENT OF PARKS AND RECREATION STAFF
» John Wicker, Director of Parks and Recreation
» Norma E. Garcia, Deputy Director, Planning and Development Agency
» Rita Robinson, Project Director » Clement Lau, Departmental Facilities
Planner ll » Sheela Kleinknecht, Park Planner
» Over 100 staff members
LOS ANGELES COUNTY REGIONAL PARK AND OPEN SPACE DISTRICT
» Jane Beesley, District Administrator » Warren Ontiveros, Administration
Section Manager
STEERING COMMITTEEIn memoriam: Steering Committee member Mary Kaufman, avid trail supporter and enthusiast.
» Greg Alaniz » Jane I. Beesley » Alina Bokde » Brad Bolger » William Warren Brien » John Bwarie » Scott Chan » Maria Chong-Castillo
» Kimel Conway » Cheryl Davis » Reyna Diaz » Bettina Duval » Belinda V. Faustinos » Norma E. Garcia » Phil Hester » Michael Hughes » Lacey Johnson » John Jones » Amy Lethbridge » James Lott » Linda Lowry » Michael McCaa » Sandra McNeill » Martha Molina-Aviles » Veronica Padilla » Ronda Perez » David Perry » Adriana Pinedo » Jennifer Pippard » Ed P. Reyes » Barbara Romero » Jeff Rubin » Bruce Saito » Harry Saltzgaver » Dr. Paul Simon, MD » Keri Smith » Christopher Solek » Erin Stibal » Teresa Villegas
» GreenInfo Network » DakeLuna Consultants » David Taussig & Associates » MIG » Prevention Institute
iii Countywide Comprehensive Parks and Recreation Needs Assessment

ivCountywide Comprehensive Parks and Recreation Needs Assessment
CONTENTSEXECUTIVE SUMMARY ..................................................................................................... I-X
1.0 INTRODUCTION............................................................................................................ 1
1.1 Purpose of the Parks Needs Assessment ................................................................... 2
1.2 Who Was Involved ...................................................................................................... 4
1.3 Process of Completing the Parks Needs Assessment ................................................ 8
2.0 EXISTING ASSETS/CONDITIONS ANALYSIS .......................................................... 37
2.1 Data Analysis & Inventory Summary .......................................................................... 38
2.2 Population ................................................................................................................... 44
2.3 Park Metrics Summary Countywide ........................................................................... 45
2.4 Park Metrics - Regional Recreation Parks .................................................................. 51
2.5 Community Profile Summary ...................................................................................... 54
2.6 Potential Park Land Opportunities .............................................................................. 61
3.0 PARK NEEDS FRAMEWORK ....................................................................................... 63
3.1 Countywide Assessment of Park Need ...................................................................... 64
4.0 POTENTIAL PARK PROJECTS & COST ESTIMATES .............................................. 73
4.1 Potential Park Projects ................................................................................................ 74
4.2 Cost Estimates: Countywide Trends ........................................................................... 80
5.0 NEXT STEPS.................................................................................................................. 83
5.1 Where Do We Go From Here? .................................................................................... 84
ACKNOWLEDGMENTS ..................................................................................................... 86
LIST OF FIGURESFigure 1. Components of the Parks Needs Assessment.................................................... 3
Figure 2. Organizational Chart ........................................................................................... 4
Figure 3. Steering Committee Meetings Summary ........................................................... 5
Figure 4. Parks Needs Assessment Milestones ................................................................ 8
Figure 5. Study Area Development Process ..................................................................... 11
Figure 6. Study Area Map: Los Angeles County, North ..................................................... 12
Figure 7. Study Area Map: Los Angels County, South ...................................................... 13
Figure 8. Sample Condition Definitions ............................................................................. 22
Figure 9. Education and Awareness Reach ....................................................................... 23
Figure 10. LA Times Advertisement ................................................................................. 23
Figure 11. Sample Facebook Advertisement .................................................................... 24
Figure 12. Homepage for Project Website........................................................................ 25
Figure 13. Interactive Map for Locating Workshops ........................................................ 25
Figure 14. Location of High Priority Areas ........................................................................ 26
Figure 15. Tweets for Community Workshops .................................................................. 27
Figure 16. Customized Flyer, Unincorporated Sunrise Village - South San Gabriel - Whittier Narrows .............................................................................................................. 28
Figure 17. Customized Flyer, City of El Monte .................................................................. 28
Figure 18. English Language Flyer, City of Bell Gardens .................................................. 29
Figure 19. Eventbrite Invitation, Boyle Heights ................................................................ 29
Figure 20. Countywide Workshop Locations .................................................................... 30
Figure 21. Sample Facilitator Toolkit ................................................................................ 32
Figure 22. Number of Study Areas Meeting Criteria for Translation Recommendation .. 33
Figure 23. Fact Sheet, Spanish and Chinese .................................................................... 33

v Countywide Comprehensive Parks and Recreation Needs Assessment
Figure 24. Sample Survey Results .................................................................................... 35
Figure 25. Los Angeles County Parks and Open Space Inventory .................................... 39
Figure 26. Existing Parks and Open Space in Los Angeles County, North ....................... 40
Figure 27. Existing Parks and Open Space in Los Angeles County, South ....................... 41
Figure 28. Summary of Inventoried Amenities ................................................................. 43
Figure 29. Population Distribution Examples .................................................................... 44
Figure 30. Park Land Countywide ..................................................................................... 45
Figure 31. Park Access Countywide .................................................................................. 45
Figure 32. Areas of Los Angeles County Within 1/2 Mile of a Park ................................ 46
Figure 34. Sample Parkshed Map ..................................................................................... 47
Figure 33. Park Pressure Countywide ............................................................................... 47
Figure 35. Where Are Parks Most Needed? ..................................................................... 48
Figure 36. Park Amenities (per 1,000 persons) ................................................................. 49
Figure 37. Park Conditions ................................................................................................ 50
Figure 38. Regional Recreation Park Access: Areas within 25 Miles of a Regional Recreation Park ................................................................................................................. 52
Figure 39. Conditions at Regional Recreation Parks ........................................................ 53
Figure 40. Population Distribution by Age ........................................................................ 54
Figure 41. Population Distribution by Race/Ethnicity ....................................................... 54
Figure 42. Populations at or below 200% Poverty Level .................................................. 54
Figure 43. Populations without Vehicle Access ................................................................ 54
Figure 44. Populations in Linguistic Isolation ................................................................... 54
Figure 45. Countywide Bike/Pedestrian Collisions Map .................................................. 55
Figure 46. Obesity Among 5th Graders ............................................................................. 56
Figure 47. Asthma ............................................................................................................. 57
Figure 48. Ozone Concentration ........................................................................................ 58
Figure 49. PM 2.5 .............................................................................................................. 59
Figure 50. Diesel Particulate Matter Emissions ............................................................... 60
Figure 51. Sample Map of Park Land Opportunities ......................................................... 61
Figure 52. Comparison of “Where are Parks Most Needed” map from East Los Angeles Northwest Study Area and Summarized Map of Need for Entire Study Area ................. 64
Figure 53. Comparison of “Where Are Parks Most Needed” map (top) from Unincorporated Willowbrook Study Area and Summarized Map of Need for Entire Unincorporated Willowbrook Study Area (bottom) .......................................................... 65
Figure 54. Percentage of Countywide Population in Each Park Need Category .............. 66
Figure 55. Average Acres Per 1,000 in Each Park Need Category.................................... 66
Figure 56. Additional Acres Needed ................................................................................. 66
Figure 57. Park Need by Study Area Los Angeles County, North ..................................... 67
Figure 58. Park Need by Study Area Los Angeles County, South ..................................... 68
Figure 59. Point-Based Project Criteria ............................................................................. 754
Figure 60. Community Workshop Flowchart ..................................................................... 75
Figure 61. Sample Project Prioritization Forms ................................................................. 76
Figure 62. Most Frequently Prioritized Park Projects, by Project Type ............................. 77
Figure 63. Study Areas Prioritizing a New Park ................................................................ 77
Figure 64. Regional Recreation Park Projects by Type...................................................... 78
Figure 65. Sample Regional Recreation Park Projects ..................................................... 78
Figure 66. Specialized Facility Projects by Type ............................................................... 79
Figure 67. Sample Specialized Facility Projects ............................................................... 79
Figure 68. Deferred Maintenance Costs at All Inventoried Local Parks, Regional Recreation Parks, and Regional Open Spaces .................................................................. 81
Figure 69. Countywide Cost Estimates ............................................................................. 82
LIST OF TABLESTable 1. Study Area Map Key ........................................................................................... 14
Table 2. Newspaper Publications ..................................................................................... 24
Table 3. Regional Recreation Parks - Park Pressure......................................................... 53
Table 4. Park Need By Study Area.................................................................................... 69
Table 5. Potential Park Project Submittal Criteria ............................................................ 74
LIST OF APPENDICESAppendix A - Study Area Profiles
Each Study Area Profile contains a base map, park metrics, map of where parks are most needed, amenity quantities and conditions, park need framework, project cost estimates, submitted project reporting forms and community engagement form.
Appendix B – Regional Recreation Park Projects
Project lists and cost estimates submitted by the managing agency of each regional recreation park.
Appendix C – Specialized Facilities Projects
Project lists and cost estimates as submitted by the managing agencies of specialized facilities such as open space, beaches, hiking trails, arboreta, amphitheaters, golf courses, and equestrian facilities.
Appendix D – Resources Provided to Partners
» Web Portal User Guide and Amenity Condition Definitions
» Sample Toolkit (includes facilitator training manual)
» Survey Results
Appendix E – Technical Resources
» Data Sources
» Mapping and Analysis Information
» Cost Estimate Assumptions
viCountywide Comprehensive Parks and Recreation Needs Assessment

This page intentionally left blank.
vii Countywide Comprehensive Parks and Recreation Needs Assessment

I
EXECUTIVE SUMMARYIn March 2015, the Los Angeles County Board of Supervisors approved a motion to initiate the Countywide Comprehensive Parks and Recreation Needs Assessment. This represents an unprecedented effort to document existing parks and recreation facilities in cities and unincorporated communities and to use these data to determine the scope, scale, and location of park need in Los Angeles County.
The Parks Needs Assessment will help local officials, park agencies, and residents understand the future steps that need to be taken to ensure all communities have adequate access to thriving parks.
Park projects in Los Angeles County are currently funded in part by Proposition A, the Safe Neighborhoods Park Tax that is set to expire in 2019. Once this tax sunsets, funding for park projects will be greatly reduced. The results of the Parks Needs Assessment will help inform planning and decision-making regarding future funding.
In initiating the Parks Needs Assessment, the Board of Supervisors has affirmed the importance of parks as essential infrastructure in the County. Healthy, safe communities have thriving parks that contribute to public health and well-being, create a sense of place, increase community cohesion, improve the environment, and boost the economy.
A NEW PARADIGMThe Parks Needs Assessment proposes a new way to understand and think about parks, recreation, and open space by:
Considering parks as key infrastructure needed to maintain and improve the quality of life for all County residents
Using a new series of metrics to determine park need
Supporting a need-based allocation of funding for parks and recreation
Emphasizing both community priorities and deferred maintenance projects
PUB
LIC
HEALTH & WELL-BEING
COM
MUNITY COHESION
ECON
OMIC DEVELOPMEN
T
SENSE OF PLACE
PARKS
ENVIRONMENT

II
INITIATION The Board of Supervisors launched the Parks Needs Assessment in March 2015, giving the County Department of Parks and Recreation 16 months to complete the task. The work was guided by both a Steering Committee and a Technical Advisory Committee (TAC). The Steering Committee’s 40 members were appointed by the Board offices and included representatives from cities, advocacy groups, and community-based organizations; subject matter experts; and community members at large. The Steering Committee provided insight on key issues, including dividing the County into Study Areas, and the 188 approved Study Areas were used for many of the analyses. The TAC provided review of GIS and mapping methodology at key points of the project.
INVENTORY Accurate data about the size and location of all existing parks in the county were critical to completing the Parks Needs Assessment. These data were not available in a single database; therefore, the Department of Parks and Recreation collaborated with 86 cities to complete the first ever Countywide inventory of existing parks.
3,023PARKS INVENTORIED
9,472AMENITIES INVENTORIED

III
PARKS & OPEN SPACE INVENTORYFour types of parks and open spaces were identified as means to categorize the facilities inventoried during the Parks Needs Assessment. This uniform categorization system ensured an “apples to apples” comparison among facilities and Study Areas. The four categories are specific to the Parks Needs Assessment, and differ from the categories used in cities and by other agencies in the County. For the inventory, specialized facilities serving the entire County or specific sub-regions, such as arboreta, amphitheaters, and wilderness parks were included in the category that covered their specific characteristics, and only if they were part of a park or open space area.
LOCAL PARKS are under 100 acres and contain active amenities such as athletic courts and fields, playgrounds, and swimming pools. Local parks identified in the inventory are sometimes called community parks or regional parks by the agencies that operate them. These parks are included in the analysis of all park metrics. 1,602 INVENTORIED
REGIONAL RECREATION PARKS are over 100 acres and contain active amenities such as athletic courts and fields, playgrounds, and swimming pools. Locally administered “regional parks” under 100 acres in size are not included in this category, and are included as local parks in the inventory instead. Regional Recreation Parks are included in the analysis of all park metrics, and were subject to a separate facility review process due to their large size and regional importance. 17 INVENTORIED
REGIONAL OPEN SPACE includes facilities that are more than 5 acres and generally contain only passive amenities such as visitor centers, trails, picnic shelters, or restrooms. These facilities are not included in the analysis of any individual park metric, but are included in the analysis of park need. 329 INVENTORIED
NATURAL AREAS are generally larger than 100 acres and contain no reported amenities. These facilities are not included in any of the needs analyses of the Parks Needs Assessment. 1,075 INVENTORIED
367 Unique Amenities*
* Unique amenities include equestrian arenas, volleyball courts, amphitheaters, community gardens, concession stands, gazebos, etc.
940Basketball Courts
1,022Tennis Courts
1,068Baseball Fields
424 Soccer Fields
510 Multipurpose Fields
1,251 Picnic Shelters
1,190Restrooms
187 Gymnasiums
373Fitness Zones
96 Skate Parks
1,452 Playgrounds
218 Swimming Pools
90 Community Rec Centers
518 Senior Centers
51 Dog Parks
82Splash Pads
LOCAL PARKS15,723 acres
REGIONAL RECREATION PARKS18,248 acres
REGIONAL OPEN SPACE98,977 acres
NATURAL AREAS768,699 acres
IV
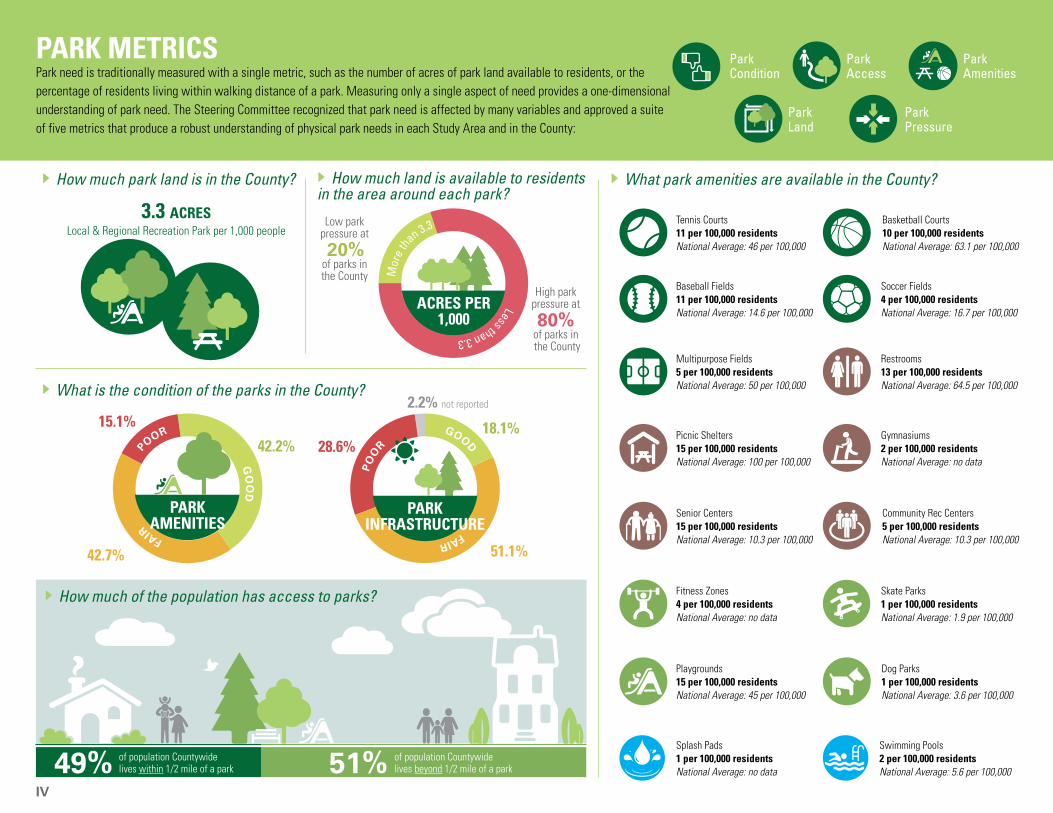
PARK METRICSPark need is traditionally measured with a single metric, such as the number of acres of park land available to residents, or the percentage of residents living within walking distance of a park. Measuring only a single aspect of need provides a one-dimensional understanding of park need. The Steering Committee recognized that park need is affected by many variables and approved a suite of five metrics that produce a robust understanding of physical park needs in each Study Area and in the County:
3.3 acresLocal & Regional Recreation Park per 1,000 people
of population Countywidelives within 1/2 mile of a park
of population Countywidelives beyond 1/2 mile of a park 49% 51%
Tennis Courts 11 per 100,000 residentsNational Average: 46 per 100,000
Basketball Courts 10 per 100,000 residentsNational Average: 63.1 per 100,000
Baseball Fields 11 per 100,000 residentsNational Average: 14.6 per 100,000
Soccer Fields 4 per 100,000 residentsNational Average: 16.7 per 100,000
Multipurpose Fields 5 per 100,000 residentsNational Average: 50 per 100,000
Restrooms 13 per 100,000 residentsNational Average: 64.5 per 100,000
Picnic Shelters 15 per 100,000 residentsNational Average: 100 per 100,000
Gymnasiums 2 per 100,000 residentsNational Average: no data
Senior Centers 15 per 100,000 residentsNational Average: 10.3 per 100,000
Community Rec Centers 5 per 100,000 residentsNational Average: 10.3 per 100,000
Fitness Zones 4 per 100,000 residentsNational Average: no data
Skate Parks1 per 100,000 residentsNational Average: 1.9 per 100,000
Playgrounds 15 per 100,000 residentsNational Average: 45 per 100,000
Dog Parks 1 per 100,000 residentsNational Average: 3.6 per 100,000
Splash Pads 1 per 100,000 residentsNational Average: no data
Swimming Pools 2 per 100,000 residentsNational Average: 5.6 per 100,000
15.1%
28.6%
42.7% 51.1%
42.2%18.1%
2.2% not reported
GOOD FAIR
P
OO
R
PARK INFRASTRUCTURE
GO
OD
FAIR
POOR
PARKAMENITIES
Low park pressure at
20% of parks in the County
High park pressure at
80% of parks in the County
Mor
e tha
n 3.3 Less than 3.3
ACRES PER 1,000
ParkLand
ParkPressure
ParkCondition
ParkAccess
ParkAmenities
� How much of the population has access to parks?
� What is the condition of the parks in the County?
� How much park land is in the County? � What park amenities are available in the County?� How much land is available to residents in the area around each park?

V
PARK NEEDThe results of the analysis of the park metrics were combined to determine an overall park need level for each Study Area. This approach creates a framework for assessing park need from a Countywide perspective.
Very High
3.3County
Average
0.7
High
1.6
Moderate
11.5
Low
12.5
Very Low
52.0
� Population in Each Need Category*
� Average Acres per 1,000 Residents in Each Need Category
26.2%Moderate
4.6%Very Low
20.4%High
16.5%Low
32.2%Very High
*0.1% Not Participating
POPULATION

VI
COMMUNITY PROFILEA community profile summarizing demographic, health, and environmental information was completed in each Study Area to supplement park metrics. *Data sources for demographic information: 2014 Los Angles County Age/Race/Gender Population Estimates; US EPA Smart Location Database; Los Angeles County Poverty Estimates, 2013; and the US Census American Community Survey 5 Year Estimates, 2013
48%Latino
14%Asian
9%African-
American
28%Caucasian
0.2%Native American
0.2%Pacific Islander
POPULATION
� Population by Race/Ethnicity*
*Total is less than 100% due to rounding
� Population Distribution by Age
� Population at or below 200% Poverty Level
4% 81%
40% COUNTYWIDE AVERAGE
Lowest percentage reported in a single Study Area
Highest percentage reported in a single Study Area
0–9 yrs 10–17 yrs 18–24 yrs 25–54 yrs 55–65 yrs 65+ yrs
13% 10%
8% 41% 16% 12%
0% 87%
10% COUNTYWIDE AVERAGE
� Population without Vehicle Access
1% 56%
26% COUNTYWIDE AVERAGE
� Population in Linguistic Isolation

VII
OZONEVarying levels of ozone concentration throughout the County. *Data source: CalEnviroScreen 2.0, 2013.
PM 2.5Concentration of particulate matter 2.5 micrometers or less in diameter (PM 2.5) throughout the County. *Data source: CalEnviroScreen 2.0, 2013.
OBESITYPercentage of obese fifth graders throughout the County. *Data source: Los Angeles County Department of Public Health, 2015.
ASTHMANumber of emergency room visits for asthma treatments per 10,000 people per year. *Data source: CalEnviroScreen 2.0, 2013.
DIESEL EMISSIONSRates of diesel particulate matter emissions in Los Angeles County.*Data source: CalEnviroScreen 2.0, 2013.
DIABETESDiabetes death rate per 100,000 residents in the County.*Data source: CalEnviroScreen 2.0, 2013.
POLLUTION BURDENPollution scores, based on 12 pollution burden indicators. *Data source: CalEnviroScreen 2.0, 2013.
BICYCLE/PED. COLLISIONSAll collisions between automobiles/bicycles and automobiles/pedestrians. *Data source: Transportation Injury Mapping System SWITRS Collision Raw Data, 2003–2012
VIII
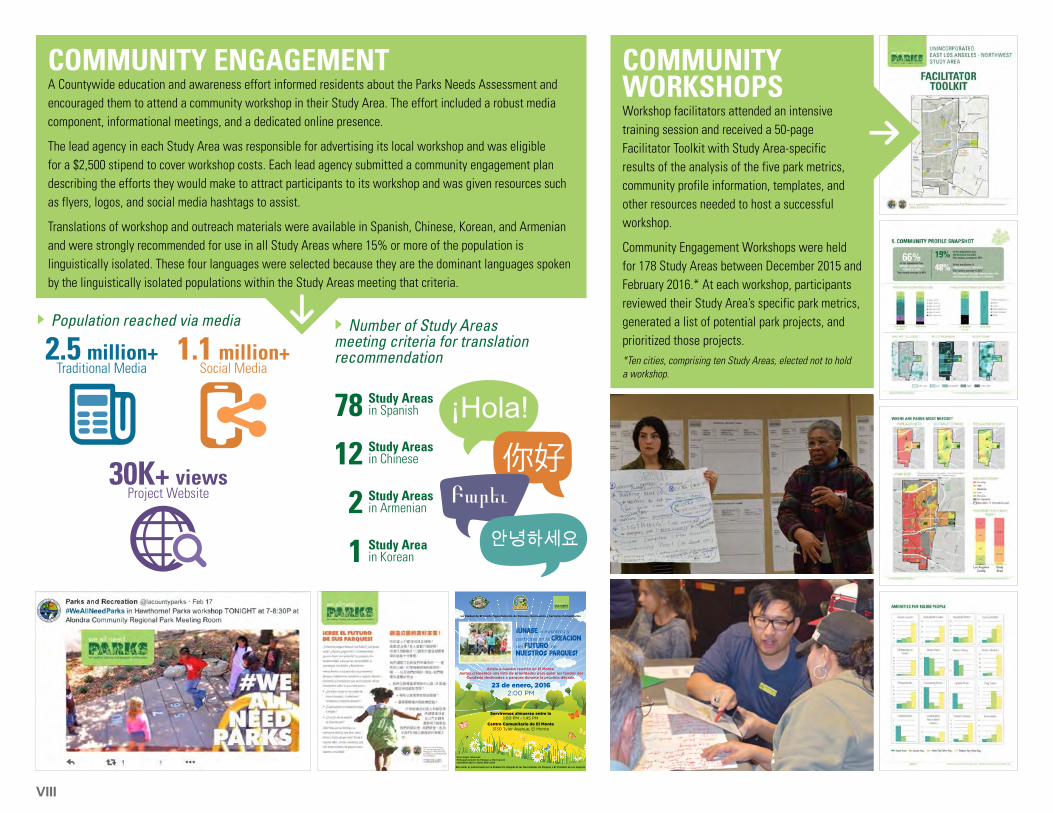
30K+ viewsProject Website
1.1 million+ Social Media
2.5 million+ Traditional Media
23 de enero, 20162:00 PM
La Ciudad de El Monte Departamento de Parques, Recreación y Servicios Comunitarios
Este taller es patrocinado por la Evaluación Integral de las Necesidades de Parques y El Condado de Los Angeles.
Centro Comunitario de El Monte3130 Tyler Avenue, El Monte
Asista a nuestra reunión en El Monte. Juntos crearemos una lista de prioridades para guiar los fondos del
Condado destinados a parques durante la próxima década.
Para mayor informes:El Departamento de Parques y Recreación(626)580-2261 o (626) 580-2200
Serviremos almuerzo entre la1:00 PM - 1:45 PM
UNASE a nosotros y
participe en la CREACIONdel FUTURO de
NUESTROS PARQUES!
!
COMMUNITY ENGAGEMENTA Countywide education and awareness effort informed residents about the Parks Needs Assessment and encouraged them to attend a community workshop in their Study Area. The effort included a robust media component, informational meetings, and a dedicated online presence.
The lead agency in each Study Area was responsible for advertising its local workshop and was eligible for a $2,500 stipend to cover workshop costs. Each lead agency submitted a community engagement plan describing the efforts they would make to attract participants to its workshop and was given resources such as flyers, logos, and social media hashtags to assist.
Translations of workshop and outreach materials were available in Spanish, Chinese, Korean, and Armenian and were strongly recommended for use in all Study Areas where 15% or more of the population is linguistically isolated. These four languages were selected because they are the dominant languages spoken by the linguistically isolated populations within the Study Areas meeting that criteria.
COMMUNITY WORKSHOPSWorkshop facilitators attended an intensive training session and received a 50-page Facilitator Toolkit with Study Area-specific results of the analysis of the five park metrics, community profile information, templates, and other resources needed to host a successful workshop.
Community Engagement Workshops were held for 178 Study Areas between December 2015 and February 2016.* At each workshop, participants reviewed their Study Area’s specific park metrics, generated a list of potential park projects, and prioritized those projects.*Ten cities, comprising ten Study Areas, elected not to hold a workshop.
� Population reached via media � Number of Study Areas meeting criteria for translation recommendation
7812
2
1
Study Areas in Spanish
Study Areas in Chinese
Study Areas in Armenian
Study Area in Korean
IX
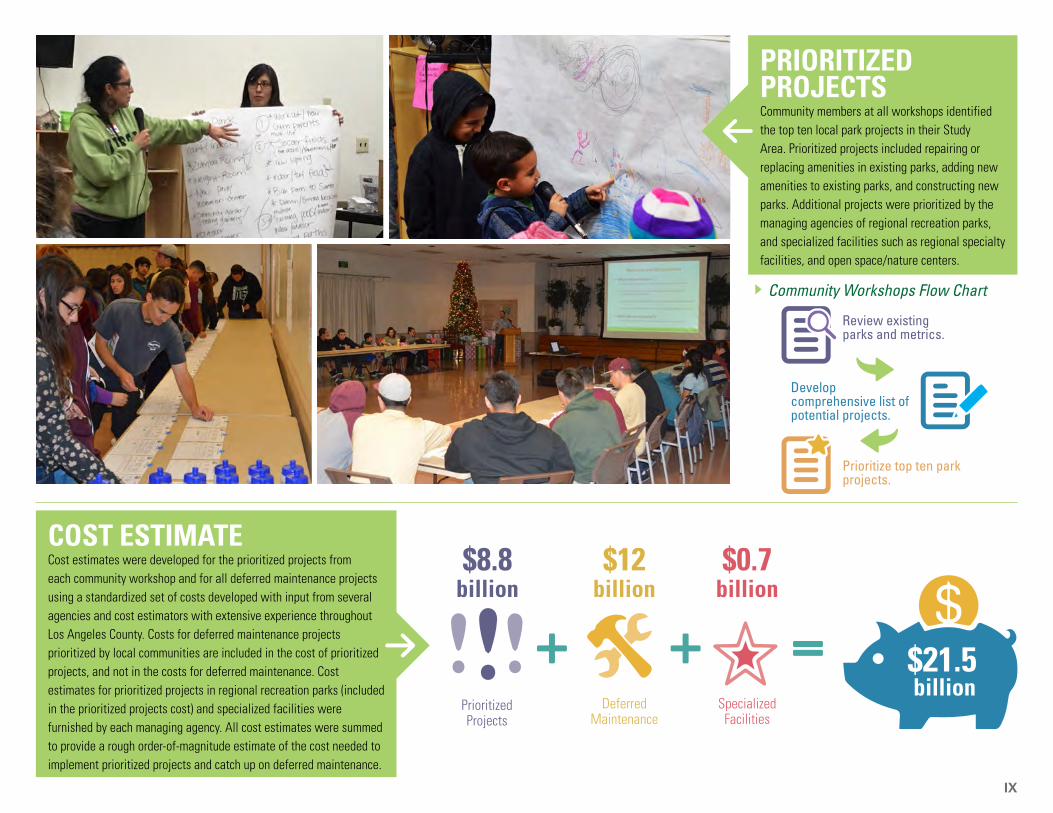
Review existing parks and metrics.
Develop comprehensive list of potential projects.
Prioritize top ten park projects.
PRIORITIZED PROJECTS Community members at all workshops identified the top ten local park projects in their Study Area. Prioritized projects included repairing or replacing amenities in existing parks, adding new amenities to existing parks, and constructing new parks. Additional projects were prioritized by the managing agencies of regional recreation parks, and specialized facilities such as regional specialty facilities, and open space/nature centers.
COST ESTIMATE Cost estimates were developed for the prioritized projects from each community workshop and for all deferred maintenance projects using a standardized set of costs developed with input from several agencies and cost estimators with extensive experience throughout Los Angeles County. Costs for deferred maintenance projects prioritized by local communities are included in the cost of prioritized projects, and not in the costs for deferred maintenance. Cost estimates for prioritized projects in regional recreation parks (included in the prioritized projects cost) and specialized facilities were furnished by each managing agency. All cost estimates were summed to provide a rough order-of-magnitude estimate of the cost needed to implement prioritized projects and catch up on deferred maintenance.
� Community Workshops Flow Chart
$21.5 billion
$8.8 billion $0.7
billion
Specialized Facilities
$12 billion
Deferred Maintenance
Prioritized Projects
X
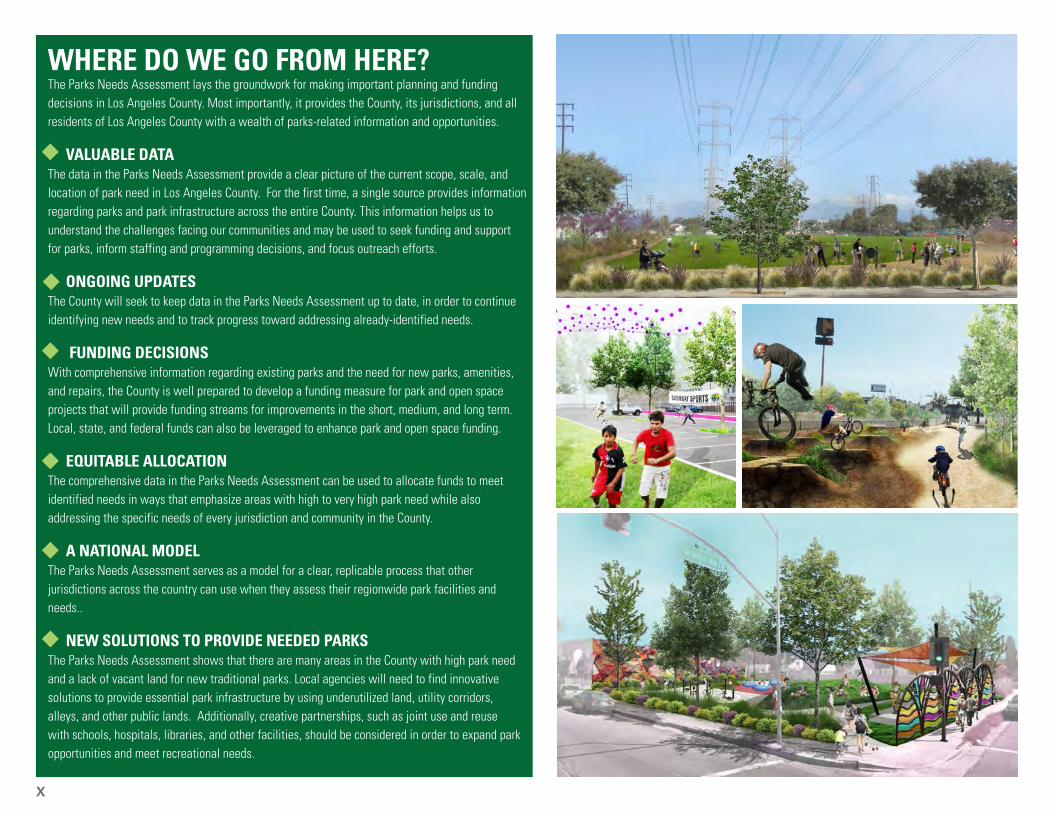
WHERE DO WE GO FROM HERE?The Parks Needs Assessment lays the groundwork for making important planning and funding decisions in Los Angeles County. Most importantly, it provides the County, its jurisdictions, and all residents of Los Angeles County with a wealth of parks-related information and opportunities.
VALUABLE DATAThe data in the Parks Needs Assessment provide a clear picture of the current scope, scale, and location of park need in Los Angeles County. For the first time, a single source provides information regarding parks and park infrastructure across the entire County. This information helps us to understand the challenges facing our communities and may be used to seek funding and support for parks, inform staffing and programming decisions, and focus outreach efforts.
ONGOING UPDATESThe County will seek to keep data in the Parks Needs Assessment up to date, in order to continue identifying new needs and to track progress toward addressing already-identified needs.
FUNDING DECISIONS With comprehensive information regarding existing parks and the need for new parks, amenities, and repairs, the County is well prepared to develop a funding measure for park and open space projects that will provide funding streams for improvements in the short, medium, and long term. Local, state, and federal funds can also be leveraged to enhance park and open space funding.
EQUITABLE ALLOCATIONThe comprehensive data in the Parks Needs Assessment can be used to allocate funds to meet identified needs in ways that emphasize areas with high to very high park need while also addressing the specific needs of every jurisdiction and community in the County.
A NATIONAL MODELThe Parks Needs Assessment serves as a model for a clear, replicable process that other jurisdictions across the country can use when they assess their regionwide park facilities and needs..
NEW SOLUTIONS TO PROVIDE NEEDED PARKSThe Parks Needs Assessment shows that there are many areas in the County with high park need and a lack of vacant land for new traditional parks. Local agencies will need to find innovative solutions to provide essential park infrastructure by using underutilized land, utility corridors, alleys, and other public lands. Additionally, creative partnerships, such as joint use and reuse with schools, hospitals, libraries, and other facilities, should be considered in order to expand park opportunities and meet recreational needs.
1.0 Introduction 11.1 Purpose of the Parks Needs Assessment 21.2 Who Was Involved 41.3 Process of Completing the Parks Needs Assessment 82.0 Existing Assets/Conditions Analysis 372.1 Data Analysis & Inventory Summary 382.2 Population 442.3 Park Metrics Summary Countywide 452.4 Park Metrics - Regional Recreation Parks 512.5 Community Profile Summary 542.6 Potential Park Land Opportunities 613.0 Park Needs Framework 633.1 Countywide Assessment of Park Need 644.0 Potential Park Projects & Cost Estimates 734.1 Potential Park Projects 744.2 Cost Estimates: Countywide Trends 805.0 Next Steps 835.1 Where Do We Go From Here? 84Acknowledgments 86

1.0 Introduction
1-2 Countywide Comprehensive Parks and Recreation Needs Assessment
Unprecedented in scope and scale, the Countywide Parks Needs Assessment (Parks Needs Assessment) was designed to quantify the need for parks and recreational resources and the potential costs of meeting that need. To achieve this goal, the Parks Needs Assessment incorporated the following objectives:
» Conduct a comprehensive assessment of the park, infrastructure, and recreational needs and opportunities in Los Angeles County
» Establish a list of priority projects for each study area
» Outline costs for future project opportunities
» Establish a transparent and best-practices approach
» Engage the County, cities, and communities in a collaborative and shared process
» Build support and understanding of the park, infrastructure, and recreational needs and opportunities
» Inform future decision-making regarding funding for parks and recreation in the County
1.1.1 HISTORY OF PARKS AND RECREATION FUNDING IN LOS ANGELES COUNTYParks and recreational facilities in Los Angeles County are supported in part by funds generated from the Safe Neighborhood Parks Tax Measure (Proposition A), which was initially approved by voters in 1992 and provided a total of $540 million in grant funds for the
acquisition, restoration, and rehabilitation of property for parks, recreation, and natural lands. An additional $319 million in funding was obtained after voters approved a second measure in 1996. The 1992 tax expired in 2015, and the 1996 tax will end in 2019. Since its passage, Proposition A has granted more than $1 billion to cities, County departments, state and local agencies, and non-profit organizations for the development, acquisition, improvement, restoration, and rehabilitation of parks, recreational, cultural, and community facilities, as well as open space lands throughout Los Angeles County.
Anticipating the loss in 2019 of this critical source of funding, the County Board of Supervisors placed Proposition P Safe Neighborhood Parks Tax Measure, on the ballot for the November 2014 general election. Although a majority of voters supported the measure (62 percent), Proposition P required two-thirds (66.6 percent) approval, and did not pass. The process that led to the placement of Measure P on the ballot had several shortcomings, including: a short time frame for the Board of Supervisors’ (Board) approval of the ballot measure for education of and consideration by the voters; and the absence of a substantial analysis of the needs that the additional revenue would address.
1.1 PURPOSE OF THE PARKS NEEDS ASSESSMENT
Robert E. Lundigan Park, City of Burbank

1-3Countywide Comprehensive Parks and Recreation Needs Assessment
1.0 Introduction
1.1.2 MOTION FROM BOARD OF SUPERVISORSUnderstanding the critical importance of park and recreation funding in the County, the Board of Supervisors passed a motion in November 2014 directing the Chief Executive Office and Department of Parks and Recreation to report back to the Board in 30 days with a plan to produce a Countywide Comprehensive Parks and Recreation Parks Needs Assessment. The subsequent plan was approved by the Board in February 2015, with a 16-month time frame for completion and a $3.5 million budget. The schedule was later compressed to 14-months.
As outlined in the approved motion, the Parks Needs Assessment includes the following components:
» Establishment of 188 Study Areas within the County
» An inventory of existing park and recreation assets in the County, in all unincorporated and incorporated communities
» GIS-based spatial analysis of existing park and recreation assets
» Community-led outreach process of sharing inventory and analysis results to help identify and prioritize needed improvements
» Cost estimates for priority park projects developed in community workshops
La Puente Park, City of La Puente
Figure 1. Components of the Parks Needs Assessment
$
PROJECT INITIATION
INVENTORY ANALYSIS COMMUNITY ENGAGEMENT
PARK NEEDS FRAMEWORK
COST ESTIMATES
FINAL REPORT
The information in the Parks Needs Assessment summarizes a data-driven analysis of the existing recreational assets and park need in the County. This information can be used by cities and unincorporated
communities to inform future park planning and funding efforts, as well as to leverage federal, state, and private resources.

1.0 Introduction
1-4 Countywide Comprehensive Parks and Recreation Needs Assessment
The scope, scale, and timeline of the Parks Needs Assessment required collaboration among many different agencies Countywide and included input from experts in fields ranging from data management to community engagement.
1.2.1 BOARD OF SUPERVISORS The Board’s recognition of the importance of parks and recreation in Los Angeles County led to their unanimous approval of the development of the Parks Needs Assessment. This unprecedented effort would not have been possible without the full support of the Board and their desire to expand the rich legacy of park and recreational resources established over the past few decades. The Board and their staff have provided support and guidance throughout the duration of the project.
District 1, Hilda L. Solis
District 2, Mark Ridley-Thomas
District 3, Sheila Kuehl
District 4, Don Knabe
District 5, Michael D. Antonovich
1.2 WHO WAS INVOLVEDFigure 2. Organizational Chart
COUNTYWIDE COMPREHENSIVE PARKS AND RECREATION PARKS NEEDS ASSESSMENT
Technical Advisory Committee
PlaceWorks
Key Facilitators/Project ManagementParks Needs Assessment
GIS/Mapping
DakeLuna ConsultantsOutreach, Engagement
and Training
David Taussig & AssociatesEconomics, Real Estate
Acquistion
Green Info NetworkOnline GIS Mapping
Steering Committee
Board of Supervisors County of Los Angeles
Department of Parks and RecreationOutreach
Partners

1-5Countywide Comprehensive Parks and Recreation Needs Assessment
1.0 Introduction
1.2.2 DEPARTMENT OF PARKS AND RECREATIONThe Department of Parks and Recreation (DPR) provided consistent project leadership while coordinating their own participation in the Parks Needs Assessment. Led first by former Director, Russ Guiney and then by current Director John Wicker, DPR staff worked closely with the project consultants for the duration of the Assessment, ensuring adherence to the Assessment’s objectives, the department’s standards, and the stringent 16-month timeline. DPR staff also participated in the inventory of all County parks, the community engagement process, and the development of a prioritized project list in each of the 47 unincorporated Study Areas.
1.2.3 STEERING COMMITTEE Acting independently of the Board and DPR, the Steering Committee oversaw the project approach and provided insight and direction based on experience as members of the community-at-large and various formal and informal organizations. Steering Committee members were tasked with three main functions:
» To provide feedback and direction to DPR staff and the project consultants during the preparation of the Parks Needs Assessment, with the goal of creating a document that is responsive to neighborhood and community goals, conditions, and aspirations.
» To make recommendations to the DPR and project consultants at key project milestones.
» To communicate information about the Parks Needs Assessment to Los Angeles County residents and to encourage their colleagues, friends, and neighbors to participate in the process.
The Steering Committee included 40 members and offered a diversity of viewpoints that were broadly representative of Los Angeles County. Steering Committee members were selected as follows:
» From each Supervisorial District:
– One staff representative
– Two representatives from community-based organizations working on park and recreation issues in the District
– Two community-at-large representatives
– A representative from each Council of Government (COG), including Los Angeles, Lancaster, and Palmdale
» Representatives from the following County Departments: Department of Parks and Recreation, Department of Public Health, the Chief Executive Office (CEO), and Department of Community & Senior Services
» A representative from the Regional Park and Open Space District
» A representative from First 5 LA
» A representative from the Youth Conservation Corps
Members of the Steering Committee attended six meetings over the course of the Parks Needs Assessment and provided invaluable input at each meeting. Their careful consideration of the issues brought forth by the Parks Needs Assessment greatly improved the final product. Their dedication is deeply appreciated.
MEETING 1 April 30, 2015
• Reviewed potential park metrics• Reviewed potential Study Area
boundaries• Suggested need for community profile
MEETING 2 June 4, 2015
• Approved five park metrics• Approved Study Area boundaries• Approved content of community profile• Suggested need for regional approach
MEETING 3 July 9, 2015
• Requested greater awareness & education effort countywide
• Reviewed inventory items• Refined data to be used in park metrics
and community profile
MEETING 4 September 9, 2015
• Reviewed comprehensive plan for countywide education and awareness
• Reviewed draft Study Area facilitator toolkit
• Reviewed facilitator training materials
MEETING 5 October 29, 2015
• Reviewed regional approach• Reviewed preliminary analysis of
existing conditions
MEETING 6 March 24, 2016
• Reviewed results of Community Engagement Workshops, including preliminary project lists
• Reviewed parks needs framework
Figure 3. Steering Committee Meetings Summary

1.0 Introduction
1-6 Countywide Comprehensive Parks and Recreation Needs Assessment
1.2.4 TECHNICAL ADVISORY COMMITTEE The Technical Advisory Committee (TAC) provided expert guidance on technical aspects of the project at key phases, including the inventory of Countywide recreational assets, existing conditions analysis and baseline establishment, and land inventory and opportunity analysis. Specifically, the TAC was charged with providing review of GIS and mapping methodology. Three TAC meetings were held with County staff and project consultants to review key milestones, particularly during the inventory and analysis phases of the project.
1.2.5 CITIESParticipation of the incorporated cities within Los Angeles County was a critical component of the Parks Needs Assessment. Recognizing the significance of the Parks Needs Assessment, 86 of the 88 incorporated cities committed to collaborating on the project. These cities dedicated considerable staff time and resources to verifying and updating existing conditions of their parks and amenities during the inventory phase of the project; organizing, advertising, and facilitating community engagement workshops; and reviewing and submitting community feedback to the Parks Needs Assessment team.
Steering Committee Meeting, Exposition Park
The detailed and highly accurate data contributed by each city were critical to the accurate analysis of park need and the representation of community needs throughout the County. Participating cities are listed alphabetically.
» Agoura Hills
» Alhambra
» Arcadia
» Artesia
» Avalon
» Azusa
» Baldwin Park
» Bell
» Bell Gardens
» Bellflower
» Beverly Hills
» Bradbury
» Burbank
» Calabasas
» Carson
» Cerritos
» Claremont
» Commerce
» Compton
» Covina
» Cudahy
» Culver City
1-7Countywide Comprehensive Parks and Recreation Needs Assessment
1.0 Introduction
» Diamond Bar
» Downey
» Duarte
» El Monte
» El Segundo
» Gardena
» Glendale
» Glendora
» Hawaiian Gardens
» Hawthorne
» Hermosa Beach
» Huntington Park
» Industry
» Inglewood
» Irwindale
» La Cañada Flintridge
» La Habra Heights
» La Mirada
» La Puente
» La Verne
» Lakewood
» Lancaster
» Lawndale
» Lomita
» Long Beach
» Los Angeles
» Lynwood
» Malibu
» Manhattan Beach
» Maywood
» Monrovia
» Montebello
» Monterey Park
» Norwalk
» Palmdale
» Palos Verdes Estates
» Paramount
» Pasadena
» Pico Rivera
» Pomona
» Rancho Palos Verdes
» Redondo Beach
» Rolling Hills Estates
» Rosemead
» San Dimas
» San Fernando
» San Gabriel
» San Marino
» Santa Clarita
» Santa Fe Springs
» Santa Monica
» Sierra Madre
» Signal Hill
» South El Monte
» South Gate
» South Pasadena
» Temple City
» Torrance
» Vernon
» Walnut
» West Covina
» West Hollywood
» Westlake Village
» Whittier
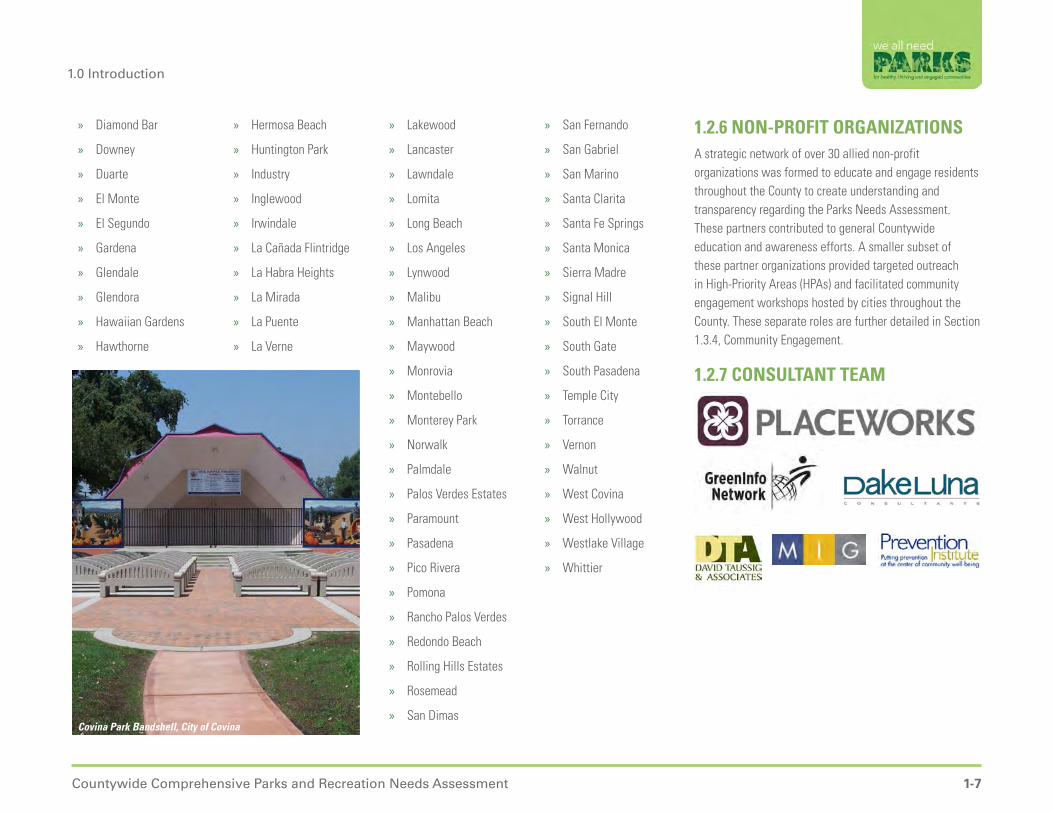
1.2.6 NON-PROFIT ORGANIZATIONS A strategic network of over 30 allied non-profit organizations was formed to educate and engage residents throughout the County to create understanding and transparency regarding the Parks Needs Assessment. These partners contributed to general Countywide education and awareness efforts. A smaller subset of these partner organizations provided targeted outreach in High-Priority Areas (HPAs) and facilitated community engagement workshops hosted by cities throughout the County. These separate roles are further detailed in Section 1.3.4, Community Engagement.
1.2.7 CONSULTANT TEAM
Covina Park Bandshell, City of Covina
1.0 Introduction
1-8 Countywide Comprehensive Parks and Recreation Needs Assessment
1.3 PROCESS OF COMPLETING THE PARKS NEEDS ASSESSMENT
Figure 4. Parks Needs Assessment Milestones
PROJECT INITIATION
APRIL 2015
INVENTORY ANALYSIS COMMUNITY ENGAGEMENT
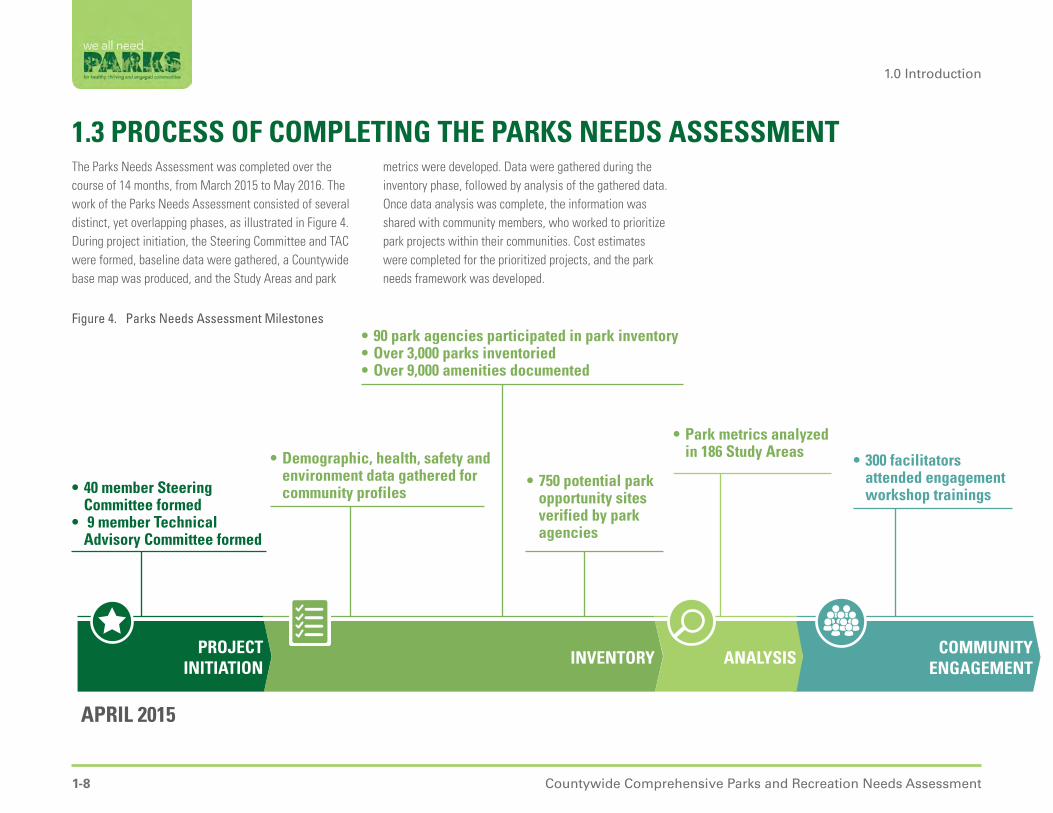
• 40 member Steering Committee formed
• 9 member Technical Advisory Committee formed
• Demographic, health, safety and environment data gathered for community profiles
• 90 park agencies participated in park inventory• Over 3,000 parks inventoried• Over 9,000 amenities documented
• 750 potential park opportunity sites verified by park agencies
• Park metrics analyzed in 186 Study Areas • 300 facilitators
attended engagement workshop trainings
The Parks Needs Assessment was completed over the course of 14 months, from March 2015 to May 2016. The work of the Parks Needs Assessment consisted of several distinct, yet overlapping phases, as illustrated in Figure 4. During project initiation, the Steering Committee and TAC were formed, baseline data were gathered, a Countywide base map was produced, and the Study Areas and park
metrics were developed. Data were gathered during the inventory phase, followed by analysis of the gathered data. Once data analysis was complete, the information was shared with community members, who worked to prioritize park projects within their communities. Cost estimates were completed for the prioritized projects, and the park needs framework was developed.

1-9Countywide Comprehensive Parks and Recreation Needs Assessment
1.0 Introduction
FINAL REPORT
• Health Equity Workshops attended by over 200 people
• Facilitator toolkits with customized data created for 186 Study Areas
• Facebook ads had over 1 million views
• Print media ads and articles reached over 2.5 million readers
• Project website received over 30,000 page views
• Community Engagement Workshops conducted for 178 Study Areas
• Attended by over 5,000 people• Over 1,700 projects prioritized
• Cost estimates developed for over 1,700 projects
• Cost estimates developed for Countywide deferred maintenance needs
• Los Angeles County Comprehensive Parks and Recreation Parks Needs Assessment presented to the County Board of Supervisors
• Park Needs Framework developed
MAY 2016
$COST
ESTIMATES
COMMUNITY ENGAGEMENT
(cont’d)
PARK NEEDS FRAMEWORK
1.0 Introduction
1-10 Countywide Comprehensive Parks and Recreation Needs Assessment
» City of Santa Clarita: 2 Study Areas
» City of Lancaster: 2 Study Areas
» City of Palmdale: 2 Study Areas
» City of Pomona: 2 Study Areas
» City of Torrance: 2 Study Areas
» City of Pasadena: 2 Study Areas
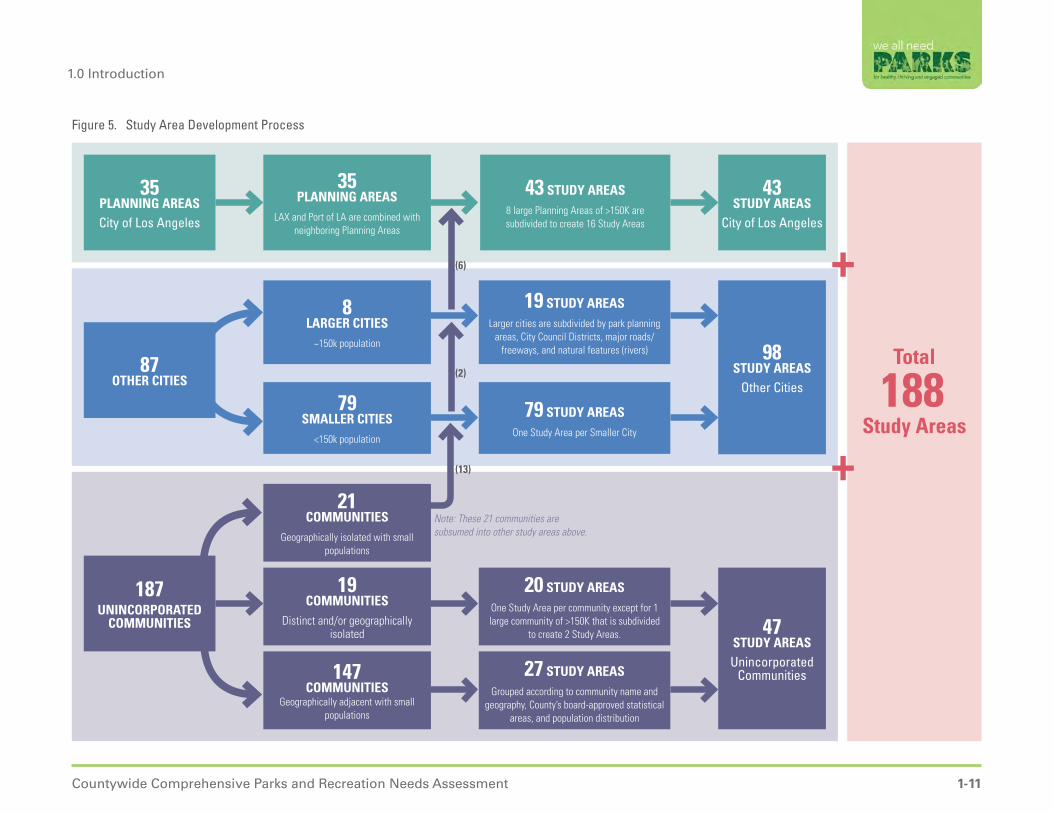
For each of these cities, project consultants suggested internal Study Area boundaries based on input from city staff, geographic barriers such as major roadways, City-developed boundaries such as council districts or planning areas, and population distribution. Final determination of the internal boundaries of the Study Areas was at the discretion of city staff.
Unincorporated communities in the County were evaluated based on population size and geographic location. Each of the 187 incorporated communities was addressed as follows:
» Geographically isolated communities with small populations were added to the Study Area of the adjacent, like-named city. A total of 18 cities agreed to include an adjacent unincorporated community within their Study Area boundaries.
» Distinct and/or geographically isolated communities with larger populations each became an individual Study Area. Any of these communities with more than 150,000 people was split into two Study Areas, similar to what was done for large cities.
» Geographically adjacent communities with small populations were grouped according to community name and geography, population distribution, and statistical areas.
» Each Study Area was assigned a unique identification number, illustrated in Figure 6, Figure 7, and Table 1.
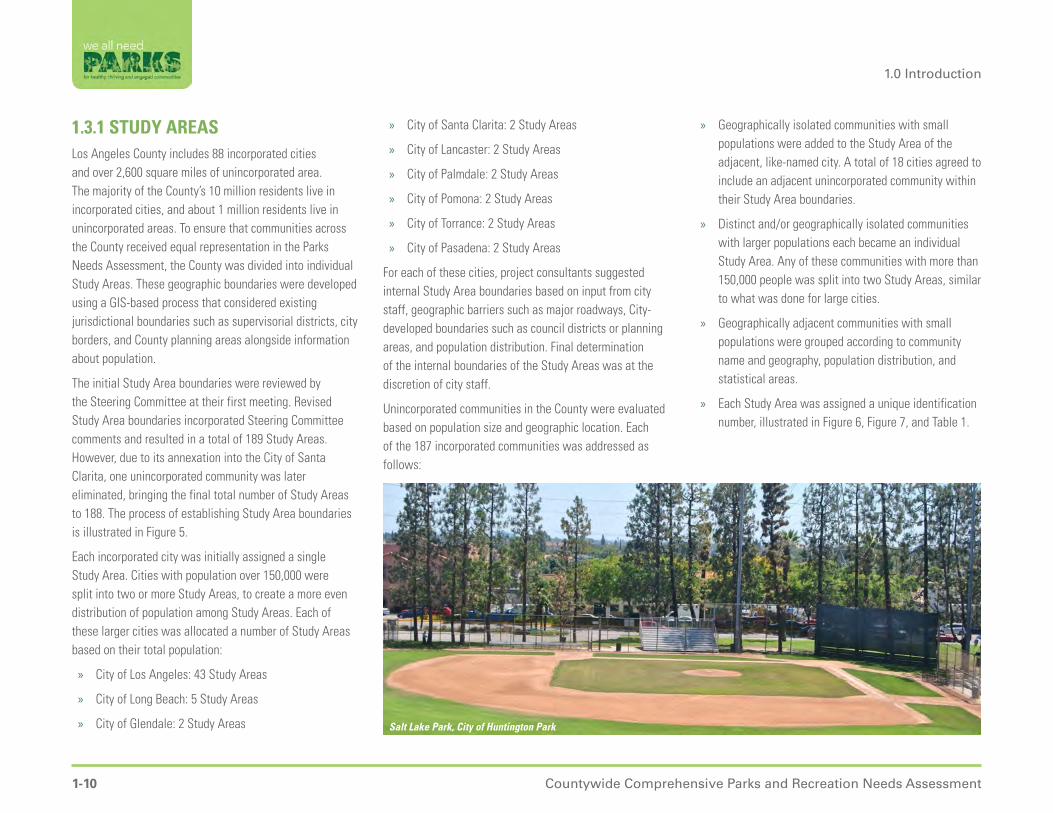
Salt Lake Park, City of Huntington Park
1.3.1 STUDY AREAS Los Angeles County includes 88 incorporated cities and over 2,600 square miles of unincorporated area. The majority of the County’s 10 million residents live in incorporated cities, and about 1 million residents live in unincorporated areas. To ensure that communities across the County received equal representation in the Parks Needs Assessment, the County was divided into individual Study Areas. These geographic boundaries were developed using a GIS-based process that considered existing jurisdictional boundaries such as supervisorial districts, city borders, and County planning areas alongside information about population.
The initial Study Area boundaries were reviewed by the Steering Committee at their first meeting. Revised Study Area boundaries incorporated Steering Committee comments and resulted in a total of 189 Study Areas. However, due to its annexation into the City of Santa Clarita, one unincorporated community was later eliminated, bringing the final total number of Study Areas to 188. The process of establishing Study Area boundaries is illustrated in Figure 5.
Each incorporated city was initially assigned a single Study Area. Cities with population over 150,000 were split into two or more Study Areas, to create a more even distribution of population among Study Areas. Each of these larger cities was allocated a number of Study Areas based on their total population:
» City of Los Angeles: 43 Study Areas
» City of Long Beach: 5 Study Areas
» City of Glendale: 2 Study Areas
1-11Countywide Comprehensive Parks and Recreation Needs Assessment
1.0 Introduction
Figure 5. Study Area Development Process
Total
Study Areas
87 OTHER CITIES
35 PLANNING AREASCity of Los Angeles
98 STUDY AREAS
Other Cities
47 STUDY AREASUnincorporated
Communities
8 LARGER CITIES
~150k population
79 SMALLER CITIES
<150k population
21 COMMUNITIES
Geographically isolated with small populations
Note: These 21 communities are subsumed into other study areas above.
19 COMMUNITIES
Distinct and/or geographically isolated
147 COMMUNITIES
Geographically adjacent with small populations
27 STUDY AREASGrouped according to community name and
geography, County’s board-approved statistical areas, and population distribution
20 STUDY AREASOne Study Area per community except for 1 large community of >150K that is subdivided
to create 2 Study Areas.
79 STUDY AREASOne Study Area per Smaller City
19 STUDY AREASLarger cities are subdivided by park planning
areas, City Council Districts, major roads/freeways, and natural features (rivers)
43 STUDY AREAS
City of Los Angeles
35 PLANNING AREAS
LAX and Port of LA are combined with neighboring Planning Areas
43 STUDY AREAS8 large Planning Areas of >150K are subdivided to create 16 Study Areas
187UNINCORPORATED
COMMUNITIES
(6)
(2)
(13)
188
+
+

1.0 Introduction
1-12 Countywide Comprehensive Parks and Recreation Needs Assessment
Figure 6. Study Area Map: Los Angeles County, North

1-13Countywide Comprehensive Parks and Recreation Needs Assessment
1.0 Introduction
Figure 7. Study Area Map: Los Angels County, South

1.0 Introduction
1-14 Countywide Comprehensive Parks and Recreation Needs Assessment
Table 1. Study Area Map Key
ID # STUDY AREA NAME
1 City of Hidden Hills
2 City of Rolling Hills
3 City of Vernon/ Unincorporated Vernon
4 Unincorporated Covina-San Dimas
5 Unincorporated Covina Islands
6 Unincorporated Leona Valley/ Unincorporated Lake Hughes
7 City of Bradbury/ Unincorporated Bradbury
8 City of San Marino
9 Unincorporated Acton/ Unincorporated South Antelope Valley
10 Unincorporated Agua Dulce-Angeles National Forest-Canyon Country
11 Unincorporated Charter Oak Islands
12 Unincorporated Compton
13 Unincorporated Del Aire
14 Unincorporated La Crescenta - Montrose
15 Unincorporated Lennox
16 Unincorporated Malibu
17 Unincorporated Northeast Antelope Valley
18 Unincorporated Northwest Antelope Valley
19 Unincorporated Quartz Hill-Lancaster
20 Unincorporated San Jose Hills
21 Unincorporated Walnut Park
22 Unincorporated West Athens-Westmont
ID # STUDY AREA NAME
23 Unincorporated West Carson
24 Unincorporated West Rancho Dominguez
25 City of Industry
26 City of LA - Bel Air - Beverly Crest/ Unincorporated Hollywood Hills
27 City of La Puente
28 City of Temple City
29 Unincorporated Angeles National Forest
30 Unincorporated East Los Angeles - Southeast
31 Unincorporated East Rancho Dominguez
32 Unincorporated East San Gabriel/ Unincorporated Arcadia
33 Unincorporated Monrovia
34 Unincorporated Hawthorne/ Unincorporated Alondra Park
35 Unincorporated Lake Los Angeles/ Uninc Pearblossom/ Uninc Liano/ Uninc Valyermo
36 Unincorporated Littlerock
37 Unincorporated San Pasqual/ Unincorporated East Pasadena
38 Unincorporated Santa Monica Mountains/ Unincorporated Triunfo Canyon
39 Unincorporated Valinda
40 City of Artesia
41 City of Hawaiian Gardens
42 City of La Habra Heights
43 City of LA - Harbor Gateway
ID # STUDY AREA NAME
44 City of LA - Van Nuys - North Sherman Oaks
45 City of LA - Westwood/ Unincorporated Sawtelle VA Center
46 City of Palos Verdes Estates
47 Unincorporated Altadena
48 Unincorporated Ladera Heights/ View Park - Windsor Hills
49 Unincorporated Stevenson/Newhall Ranch
50 Unincorporated Bassett-West Puente Valley
51 Unincorporated Pellissier Village-Avocado Heights
52 Unincorporated Sunrise Village-South San Gabriel-Whittier Narrows
53 City of Avalon/ Unincorporated Channel Islands North
54 City of Baldwin Park
55 City of Commerce
56 City of Cudahy
57 City of Irwindale
58 City of LA - Canoga Park - Winnetka
59 City of LA - Central City North
60 City of LA - Northridge
61 City of LA - Valley Glen - North Sherman Oaks
62 City of Lomita
63 Unincorporated Marina del Rey
64 Unincorporated Topanga Canyon/ Topanga

1-15Countywide Comprehensive Parks and Recreation Needs Assessment
1.0 Introduction
ID # STUDY AREA NAME
65 Unincorporated West Whittier - Los Nietos
66 City of La Canada Flintridge
67 City of LA - Westchester - Playa del Rey/ City of LA Los Angeles International Airport
68 City of LA - Wilshire - Koreatown
69 City of Lancaster - Eastside
70 Unincorporated East Los Angeles - Northwest
71 City of Bell
72 City of Huntington Park
73 City of LA - Granada Hills - Knollwood
74 City of Lawndale
75 City of Malibu
76 City of Maywood
77 City of Monrovia
78 City of South El Monte/ Unincorporated El Monte/ Unincorporated Whittier Narrows
79 City of Westlake Village
80 Unincorporated Florence-Firestone
81 City of Agoura Hills
82 City of Alhambra
83 City of LA - Baldwin Hills - Leimert - Hyde Park
84 City of LA - Sherman Oaks - Studio City - Toluca Lake - Cahuenga Pass/ Uninc Universal City
85 City of LA - West Los Angeles
86 City of Rolling Hills Estates/ Unincorporated Westfield
ID # STUDY AREA NAME
87 City of San Fernando
88 City of South Gate
89 City of South Pasadena
90 City of West Hollywood
91 Unincorporated Castaic
92 Unincorporated Rowland Heights
93 City of Covina
94 City of LA - North Hollywood - Valley Village
95 City of LA - Reseda - West Van Nuys
96 City of LA - Sylmar
97 City of Long Beach Central
98 City of Rosemead
99 Unincorporated Hacienda Heights-Whittier
100 City of Bellflower
101 City of Calabasas
102 City of Gardena
103 City of LA - Hollywood - North
104 City of LA - Hollywood - South
105 City of LA - Palms - Mar Vista - Del Rey
106 City of LA - Venice
107 City of LA - West Adams
108 City of LA - Wilshire - West
109 City of Lynwood/ Unincorporated Lynwood
110 City of Pico Rivera
ID # STUDY AREA NAME
111 City of San Gabriel
112 City of Sierra Madre
113 Unincorporated Willowbrook
114 City of Bell Gardens
115 City of El Monte
116 City of Inglewood
117 City of LA - Arleta - Pacoima
118 City of LA - Central City
119 City of LA - South Los Angeles
120 City of LA - Sun Valley - La Tuna Canyon
121 City of LA - Wilmington - Harbor City/ City of LA Port of Los Angeles
122 City of Lancaster - Westside
123 City of Long Beach North
124 City of Palmdale - Eastside/ Unincorporated South Antelope Valley
125 City of Palmdale - Westside
126 City of Santa Fe Springs
127 Unincorporated Azusa
128 City of Hermosa Beach
129 City of LA - Brentwood - Pacific Palisades
130 City of LA - Mission Hills - Panorama City - North Hills
131 City of Montebello
132 City of Pasadena - Eastside/ Unincorporated Kinneloa Mesa

1.0 Introduction
1-16 Countywide Comprehensive Parks and Recreation Needs Assessment
ID # STUDY AREA NAME
133 City of Walnut
134 Unincorporated South Whittier/ Unincorporated East La Mirada
135 City of LA - Boyle Heights
136 City of LA - Encino - Tarzana
137 City of La Mirada
138 City of LA - Silver Lake - Echo Park - Elysian Valley
139 City of LA - Sunland - Tujunga - Lake View Terrace - Shadow Hills
140 City of Paramount
141 City of Signal Hill
142 City of Compton
143 City of Duarte
144 City of Glendora/ Unincorporated Glendora
145 City of Hawthorne
146 City of LA - West Hills - Woodland Hills/ Uninc Conoga Park - West Hills
147 City of LA - Westlake
148 City of Monterey Park
149 City of Norwalk
150 City of Pomona - Southside
151 Santa Clarita - South
152 City of LA - Chatsworth - Porter Ranch/ Uninc Chatsworth/ Uninc Northridge/ Uninc Conoga Park/ Uninc Porter Ranch-Oat Mountain
153 City of Lakewood/ Unincorporated Lakewood
ID # STUDY AREA NAME
154 City of Long Beach West
155 City of Pomona - Northside
156 City of San Dimas/ Unincorporated San Dimas
157 City of Diamond Bar
158 City of El Segundo
159 City of La Verne/ Unincorporated La Verne/ Unincorporated Claremont
160 City of West Covina
161 City of Carson
162 City of Downey
163 City of LA - Southeast Los Angeles
164 City of LA - Exposition Park - University Park - Vermont Square
165 City of Long Beach East/ Unincorporated Long Beach
166 City of Arcadia
167 City of Beverly Hills
168 City of Glendale - Southside
169 City of LA - Southeast Los Angeles - North
170 City of Rancho Palos Verdes
171 City of Claremont/ Unincorporated Claremont
172 City of Culver City
173 City of Pasadena - Westside
174 City of Torrance - North
175 City of Azusa
176 City of Burbank
ID # STUDY AREA NAME
177 City of LA - Northeast Los Angeles - South
178 City of Manhattan Beach
179 Santa Clarita - North
180 City of Glendale - Northside
181 City of Torrance - South
182 City of Santa Monica
183 City of LA - Northeast Los Angeles - North
184 City of Cerritos/ Unincorporated Cerritos
185 City of LA - San Pedro/ City of LA Port of Los Angeles/ Unincorporated La Rambla
186 City of Redondo Beach
187 City of Whittier
188 City of Long Beach South
Big Dalton Wilderness Park, City of GlendoraVerdugo Park Aquatic Center, City of Burbank

1-17Countywide Comprehensive Parks and Recreation Needs Assessment
1.0 Introduction
1.3.2 PARK METRICS Park need is affected by a variety of factors, from historical development patterns to population density, and thus can be measured in a variety of ways. Traditionally, measures such as the number of acres of park land available to residents or the percentage of residents living within walking distance of a park have been used to understand park need within an area. However, using a single indicator, which provides information on just one aspect of park need, does not lead to a complete understanding of the level and variety of park need. For example, an evaluation of park need based on the number of acres of park land available per 1,000 residents may show that an area is providing an adequate amount of park land. However, if the majority of the population cannot access that park land because it is too far away, park need likely still exists.
Recognizing that park need is affected by more than just park availability and accessibility, the Steering Committee approved a suite of five park metrics for analysis in the Parks Needs Assessment. Taken together, these five metrics produce a robust understanding of physical park needs in each Study Area in the County.
The five park metrics ensure that the need measured in one Study Area is comparable to the need measured in any other Study Area across the County. Additionally, with the exception of “Park Condition,” the metrics are based on quantitative features of parks and the neighborhoods surrounding them. As such, they can be easily re-evaluated in the future as a way of gauging progress toward the goal of meeting park need in Los Angeles County.
i. The Five Park Metrics
Park Land: How many acres of park are there per 1,000 people in the Study Area?
Because this metric accounts for population size, it can be used across diverse geographic areas to give an understanding of how much park land is available to residents in any given area.
A single standard for what is considered sufficient park land does not exist. However, the County’s recently approved General Plan establishes a goal of 4 acres of local parkland per 1,000 residents. Within Los Angeles County, many incorporated cities have set their own standards for this metric. For cities with a documented standard for this metric, it ranges from less than 1 acre per 1,000 to over 8 acres per 1,000.
Park Access: What percentage of the population lives within a half mile of a park?
This metric evaluates the distribution of park land within each Study Area and whether residents can easily access it. The closer someone lives to a park, the more likely they will visit it regularly.1 Research from several studies, as summarized by the Trust for Public Land,2 notes that most pedestrians are willing to walk a half mile or approximately ten minutes, to a access a destination, including parks and recreation facilities.
1 NRPA. (2014). Safe Routes to Parks: Improving access to Parks through Walkability.
2 The Trust for Public Land. (2015). ParkScore 2015. Close-to-Home Parks: A Half-Mile or Less. Veterans Park, City of Bell

1.0 Introduction
1-18 Countywide Comprehensive Parks and Recreation Needs Assessment
This distance has been widely adopted as a standard for providing nearby access to parks and open space. Of the 100 largest cities in the United States that have explicit park distance goals, over 60 percent use a half mile.
Park Pressure: How much park land is available to residents in the area around each park?
Park pressure examines how population density affects parks by capturing the potential demand if each resident of the County were to use the park closest to them. Various studies report that people are more likely to visit the park closest to them than any other park, and that they will visit that park repeatedly rather than exploring other parks, located further from their homes.3 If the majority of people in a Study Area live within a half-mile of a park, but the population density surrounding that park is high or the number of acres of the park are low, there is likely to be park need that would escape detection using only the park land and park access metrics. Park pressure assesses the potential number of nearby users for each park in the County by analyzing population density in conjunction with park size. Parks with a small number of acres per 1,000 nearby residents are likely to be more heavily used than parks with a larger number of acres per 1,000 nearby residents.
3 Sister, C., Wolch, J., & Wilson, J. (June 01, 2010). Got green? addressing environmental justice in park provision. Geojournal: Spatially Integrated Social Sciences and Humanities, 75, 3, 229-248.
Park Amenities: What amenities are available in each park in the Study Area?
The types of amenities available in a park can also affect park need. If parks do not offer a variety of amenities to meet the needs of all residents of the Study Area, the quality of individuals’ park experience may be diminished. By collecting information on the quantity and type of amenities available in each park in the County, this metric provides information on the type of park experience that may be lacking in a given Study Area.
Amenity data presented for each Study Area was captured during the inventory web portal phase of the Parks Needs Assessment. Each of the participating cities; the County of Los Angeles; and other state, regional, and local agencies reviewed their parks and reported their amenity information. Park amenities were reported by park staff during the inventory phase of the Parks Needs Assessment. Specifically, respondents were asked to report the number of each of 16 common amenities in each of their parks. These 16 amenities were agreed upon by the Steering Committee:
» Baseball Fields
» Basketball Courts
» Community/Rec Centers
» Dog Parks
» Fitness Zones
» Gymnasiums
» Multipurpose Fields
» Picnic Shelters
» Playgrounds
» Restrooms
» Senior Centers
» Skate Parks
» Soccer Fields
» Splash Pads
» Swimming Pools
» Tennis Courts
In addition to these 16 amenities, data were collected on trails, open space/turf areas, and general park infrastructure (defined as signage, parking lots, walkways, security lighting, park furniture, irrigation, vegetation/landscaping, and fencing). Users of the Web Portal also had the opportunity to enter any specialty amenities in their parks, such as volleyball courts, equestrian centers, amphitheaters, etc.
Park Condition: Is the park in good, fair, or poor condition?
A park visitor’s experience is also affected by the condition of the park and the amenities within it. Regardless of the quantity and variety of amenities available, community members may be less likely to visit parks with amenities or general park infrastructure in poor condition. This could result in underutilized parks as well as overcrowding in parks with better conditioned amenities and infrastructure.
Park condition was assessed as part of the Park Assets Inventory Web Portal, by each agency reporting the condition of their amenities and general park infrastructure. Agencies could choose between three conditions for each
1-19Countywide Comprehensive Parks and Recreation Needs Assessment
1.0 Introduction
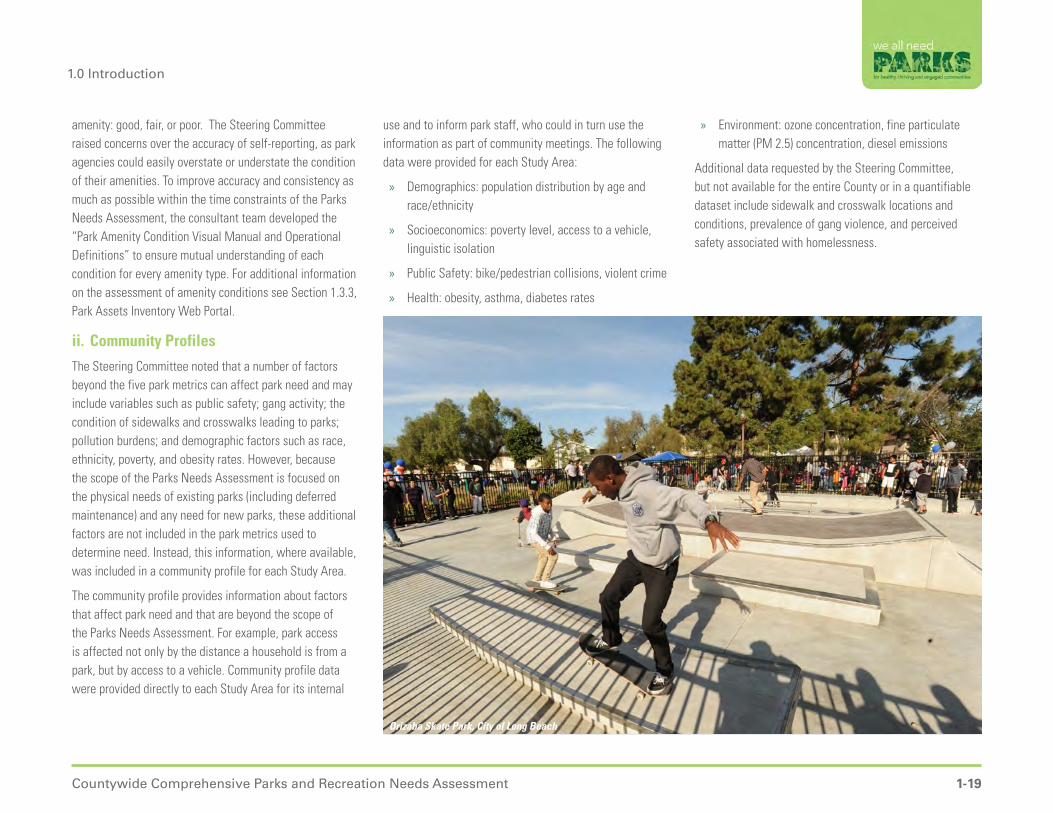
use and to inform park staff, who could in turn use the information as part of community meetings. The following data were provided for each Study Area:
» Demographics: population distribution by age and race/ethnicity
» Socioeconomics: poverty level, access to a vehicle, linguistic isolation
» Public Safety: bike/pedestrian collisions, violent crime
» Health: obesity, asthma, diabetes rates
» Environment: ozone concentration, fine particulate matter (PM 2.5) concentration, diesel emissions
Additional data requested by the Steering Committee, but not available for the entire County or in a quantifiable dataset include sidewalk and crosswalk locations and conditions, prevalence of gang violence, and perceived safety associated with homelessness.
amenity: good, fair, or poor. The Steering Committee raised concerns over the accuracy of self-reporting, as park agencies could easily overstate or understate the condition of their amenities. To improve accuracy and consistency as much as possible within the time constraints of the Parks Needs Assessment, the consultant team developed the “Park Amenity Condition Visual Manual and Operational Definitions” to ensure mutual understanding of each condition for every amenity type. For additional information on the assessment of amenity conditions see Section 1.3.3, Park Assets Inventory Web Portal.
ii. Community Profiles
The Steering Committee noted that a number of factors beyond the five park metrics can affect park need and may include variables such as public safety; gang activity; the condition of sidewalks and crosswalks leading to parks; pollution burdens; and demographic factors such as race, ethnicity, poverty, and obesity rates. However, because the scope of the Parks Needs Assessment is focused on the physical needs of existing parks (including deferred maintenance) and any need for new parks, these additional factors are not included in the park metrics used to determine need. Instead, this information, where available, was included in a community profile for each Study Area.
The community profile provides information about factors that affect park need and that are beyond the scope of the Parks Needs Assessment. For example, park access is affected not only by the distance a household is from a park, but by access to a vehicle. Community profile data were provided directly to each Study Area for its internal
Orizaba Skate Park, City of Long Beach

1.0 Introduction
1-20 Countywide Comprehensive Parks and Recreation Needs Assessment
iii. Multi-Benefit Parks
The Steering Committee also noted that all parks built or renovated in Los Angles County in the future should be multi-benefit parks. As outlined in the motion from the Board, the Parks Needs Assessment focuses on individual Study Areas and local park need within each of those Study Areas. Because of this local focus, the Parks Needs Assessment does not address regional issues such as water conservation, green infrastructure, or climate adaptation. However, as Los Angeles County moves to address park need, there is an opportunity to address these regional issues at the same time. By designing multi-benefit parks that contribute to stormwater capture, provide ecosystem services, use water responsibly, and enhance regional sustainability, local parks can contribute positively to the entire region.

1-21Countywide Comprehensive Parks and Recreation Needs Assessment
1.0 Introduction
1.3.3 PARK ASSETS INVENTORY WEB PORTAL An accurate and reliable source of baseline data on the existing parks and recreation amenities in Los Angeles County is the foundation of the Parks Needs Assessment. Prior to the Parks Needs Assessment, this data did not exist in a single database. Instead, each jurisdiction maintained its own records in its own system. Gathering this dispersed information into a single GIS-based database was accomplished via an interactive online web portal that greatly expedited the collection of accurate and complete data from over 90 park and open space-owning agencies in the County. Each of these agencies was invited to contribute data to the Park Assets Inventory Web Portal.
Building on data from the California Protected Areas Database (CPAD) developed by GreenInfo Network, the interactive Web Portal allowed participating agencies to:
» Verify and refine existing parks and open space data
– Each agency reviewed the CPAD data displayed as a base layer in the Web Portal and was able to update and edit this information as needed
» Add missing parks and open space facilities
– Each agency was able to upload GIS shapefiles to the Web Portal or locate the missing facility on the interactive map and manually outline the boundaries, name the facility, and indicate the owner/operating agency
» Add amenity information to each park and open space facility
– Each agency recorded the quantity and condition of each amenity type in every facility in their Study Area. A standardized system of ranking amenity condition as “good,” fair,” or “poor” was employed.
» Place general notes
– Agencies could record additional information about each facility in this section of the Web Portal
» Upload photos of existing conditions
– Agencies could share pictures to show the condition of facilities in the Study Area
i. Training
To ensure the accuracy of the data inputs, the project consultants conducted extensive training sessions with users. Over 30 on-site trainings were held with city staff at their offices, and a technical assistance workshop was
held during the Quarterly Parks Summit on August 6, 2015, at the Hacienda Heights Community Center. The workshop was attended by nearly 80 City and County staff members and included an extensive demonstration of the Web Portal’s functionality, in-depth explanation of tools available to users, and a question-and-answer session.
Training materials developed by the project consultants were provided digitally to all participating cities, and phone-based training was available to those who could not attend the technical assistance workshop or on-site training. The project consultants also provided ongoing technical assistance to all agencies using the Web Portal during the seven weeks it was open.
The training materials provided to Web Portal users included a Quick Start Guide, an index of frequently asked questions, and the “Park Amenity Condition Visual Manual and Operational Definitions” booklet (See Appendix D), which provided visual guides and operational definitions.
Gallant Park, City of Bell Gardens
park agencies participated in the inventory
90

1.0 Introduction
1-22 Countywide Comprehensive Parks and Recreation Needs Assessment
ii. Amenity Condition Definitions
The rating of amenity conditions was the responsibility of each park-owning agency. To increase the consistency of these self-reported ratings, all users were instructed to adhere to the definitions in the “Park Amenity Condition Visual Manual and Operational Definitions” guide that was provided to all users. This guide included a written description and sample photo of each condition (good, fair, and poor) for each amenity type.
In general, amenities in “good” condition offer full functionality and do not need repairs. “Good” condition amenities have playable sports surfaces and equipment, working fixtures, and fully intact safety features such as railings and fences. “Good” amenities may have minor cosmetic defects that can be repaired as part of a regular maintenance regime. “Good” amenities encourage area residents to use the park.
In general, amenities in “fair” condition are functional but need minor or moderate repairs. “Fair” amenities have play surfaces, equipment, fixtures, and safety features that are operational and allow play, but have deficiencies or time periods where they are unusable. “Fair” amenities remain important amenities for the neighborhood but may slightly discourage use of the park by residents.
In general, amenities in “poor” condition are largely or completely unusable. They need major repairs to be functional or cannot be repaired. “Poor” amenities discourage residents from using the park.
Figure 8. Sample Condition Definitions
Play Equipment is fully intact and generally compliant with safety standards. Equipment may have minor cosmetic flaws that do not affect use. Safety Surfacing is installed where recommended and well maintained. Surfacing meets safety standards. Edging and borders successfully contain sand, wood chips, or other loose material. Drainage is functional and the playground is generally usable the day after rain.
Play Equipment is damaged in parts or missing minor pieces, but the majority of the equipment is usable and compliant with safety standards. Safety Surfacing is installed where recommended but may need repair or replenishment to meet safety standards. Edging and borders only partially contain loose materials. Drainage issues create muddy areas or pooled water after a rain, but use is rarely affected.
Play Equipment needs major repairs or replacement to be compliant with safety standards. Damaged or missing components limit play opportunities. Safety Surfacing is absent or damaged beyond repair in multiple areas. Loose material is not contained and requires frequent replenishment. Drainage is poor and regularly affects use. Rain and/or irrigation create large areas of pooled water or mud that limits use and damages safety surfacing.
POOR
FAIR
GOOD
PLAYGROUNDS
Los Angeles County | Park Amenity Rating System
The Web Portal opened on July 16, 2015, and closed on September 4, 2015, allowing agencies seven weeks to enter data. Of the 88 incorporated cities in the County, 86 provided data for the Web Portal. The Web Portal was also used by DPR staff, state and federal agencies, and
other park and open space-owning agencies. The lead agency in each Study Area had the opportunity to review their submitted inventory data in mid November, 2015, after receiving the information at the facilitator training sessions.

1-23Countywide Comprehensive Parks and Recreation Needs Assessment
1.0 Introduction
1.3.4 COMMUNITY ENGAGEMENTThe motion passed by the Board of Supervisors to launch the Parks Needs Assessment emphasized the importance of a community-led engagement process to share analysis results and gather community input on park needs. The sharing of analysis data and gathering of input occurred in a series of community workshops that were held in nearly every Study Area between December 2015 and February 2016.
To ensure that community members were aware of the opportunity to learn about the parks in their community and share their input on park need, the Parks Needs Assessment launched a significant community engagement effort two months before the first community workshop. Engagement efforts occurred at two levels: a Countywide education and awareness campaign, and efforts within each Study Area to draw residents to the community workshop for that Study Area.
i. Countywide Education and Awareness
The goal of the Countywide education and awareness effort was to inform County residents of the Parks Needs Assessment and encourage them to attend a community workshop in their Study Area. During the outreach portion of the project, the DPR collaborated with project consultants PlaceWorks and MIG to develop a comprehensive outreach strategy. The strategy included a robust media component, public meetings and workshops, extra efforts in high priority areas, and a dedicated online presence. The goal of the education and awareness effort was to promote the Parks Needs Assessment on a Countywide scale and to encourage attendance at
community workshops, where stakeholder feedback would help to inform future priorities for parks and recreation throughout the County.
Media Component
Social Media. In keeping with the current popularity of online communities and their influence over local-level engagement, DPR developed an active social media strategy aimed at reaching stakeholders across all geographic regions of the County. The primary purpose of this effort was to drive people to the Parks Needs Assessment website, where viewers could use the interactive map to find workshops in their local communities.
Figure 9. Education and Awareness Reach Figure 10. LA Times Advertisement
30K+ viewsProject Website
1.1 million+ Social Media
2.5 million+ Traditional Media
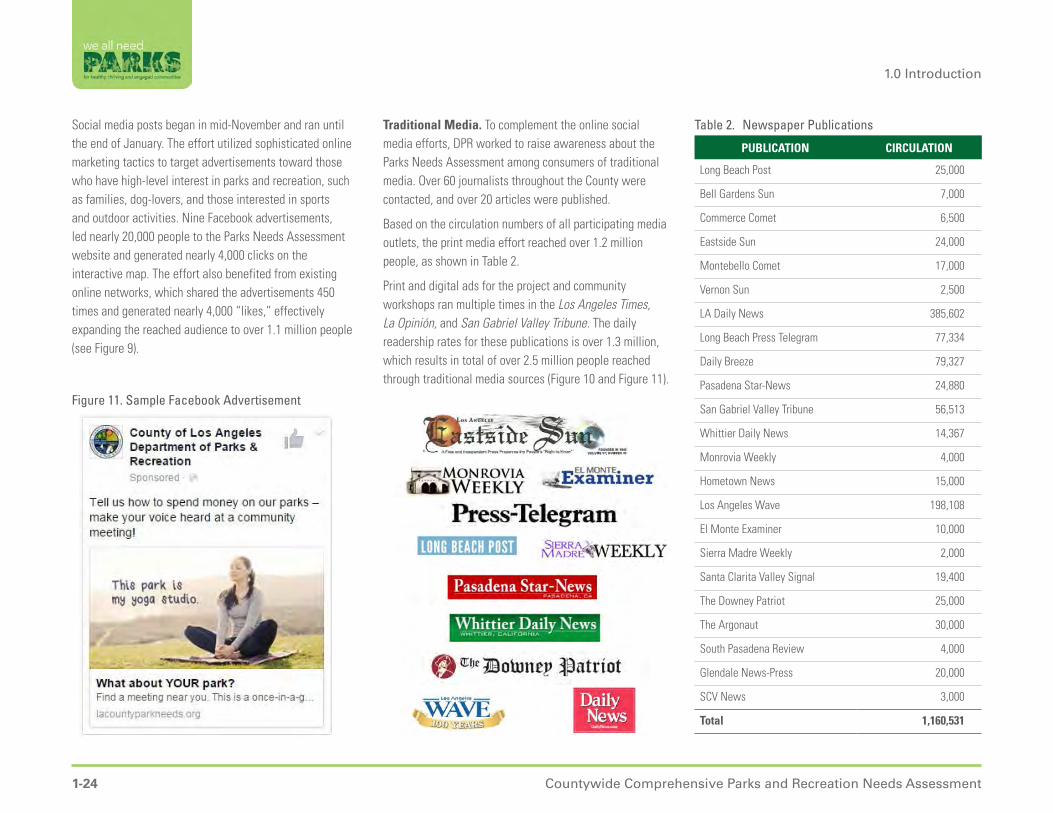
1.0 Introduction
1-24 Countywide Comprehensive Parks and Recreation Needs Assessment
Social media posts began in mid-November and ran until the end of January. The effort utilized sophisticated online marketing tactics to target advertisements toward those who have high-level interest in parks and recreation, such as families, dog-lovers, and those interested in sports and outdoor activities. Nine Facebook advertisements, led nearly 20,000 people to the Parks Needs Assessment website and generated nearly 4,000 clicks on the interactive map. The effort also benefited from existing online networks, which shared the advertisements 450 times and generated nearly 4,000 “likes,” effectively expanding the reached audience to over 1.1 million people (see Figure 9).
Table 2. Newspaper Publications
PUBLICATION CIRCULATION
Long Beach Post 25,000
Bell Gardens Sun 7,000
Commerce Comet 6,500
Eastside Sun 24,000
Montebello Comet 17,000
Vernon Sun 2,500
LA Daily News 385,602
Long Beach Press Telegram 77,334
Daily Breeze 79,327
Pasadena Star-News 24,880
San Gabriel Valley Tribune 56,513
Whittier Daily News 14,367
Monrovia Weekly 4,000
Hometown News 15,000
Los Angeles Wave 198,108
El Monte Examiner 10,000
Sierra Madre Weekly 2,000
Santa Clarita Valley Signal 19,400
The Downey Patriot 25,000
The Argonaut 30,000
South Pasadena Review 4,000
Glendale News-Press 20,000
SCV News 3,000
Total 1,160,531
January: County to Host 12 Public Meetings on ‘Park Needs’ By EGP Staff Report http://egpnews.com/2015/12/january-county-to-host-12-public-meetings-on-park-needs/ Does your family play basketball or soccer? Tennis or swim? Are there enough parks and recreation facilities in your neighborhood? Do they need repairs? Do we need more park facilities or more open space? These are just a few of the questions the Los Angeles Countywide Comprehensive Park & Recreation Needs Assessment study hopes to answer with input from residents in local cities and unincorporated areas. To that end, the county is conducting 200 public meetings to gather information on where park facilities can be improved. The County began its assessment of “189 Study Areas” countywide in March 2015, with meetings continuing through June 2016. During January 2016 alone, more than a dozen meetings will be held in east, northeast and southeast Los Angeles cities and neighborhoods. All will be conducted at area parks and recreation facilities. Why is the County conducting the meetings? Because, according to a County news release, “Parks provide countless health, social, environmental and economic benefits to communities.” Study leaders say adults and children are more likely to increase physical activity and teens are 30% more likely to get recommended exercise if they have access to well-maintained parks. “Physical activity improves general health, prevents obesity and diabetes, reduces the risk of hypertension, reduces the levels of attention deficit in children, improves cognitive ability and reduces aggressive behavior,” according to the County. Therefore, the goal of the extensive, 15 months-long assessment study is to better understand what residents think can be done to “improve, expand and make parks more accessible” to all area of the county. The following are some of the meetings taking place in January. For a complete list of dates, times and locations, call (213) 202-2681 or visit lacountyparkneeds.org.
Traditional Media. To complement the online social media efforts, DPR worked to raise awareness about the Parks Needs Assessment among consumers of traditional media. Over 60 journalists throughout the County were contacted, and over 20 articles were published.
Based on the circulation numbers of all participating media outlets, the print media effort reached over 1.2 million people, as shown in Table 2.
Print and digital ads for the project and community workshops ran multiple times in the Los Angeles Times, La Opinión, and San Gabriel Valley Tribune. The daily readership rates for these publications is over 1.3 million, which results in total of over 2.5 million people reached through traditional media sources (Figure 10 and Figure 11).
Figure 11. Sample Facebook Advertisement

1-25Countywide Comprehensive Parks and Recreation Needs Assessment
1.0 Introduction
In addition to local newspaper publications, project director Rita Robinson was interviewed by KPCC/Southern California Public Radio and the Los Angeles Times.
Web-Based Component: LAcountyparkneeds.org
The social media, traditional media, and additional efforts in high priority areas directed interested residents to the Parks Needs Assessment website, a vibrant and user-friendly resource designed to connect the general public with information about the Parks Needs Assessment. With 186 Study Areas participating in the Parks Needs Assessment, the website required a user-interface design that was functional, graphically engaging, and logically organized so that users could easily obtain and/or provide information without visiting numerous pages or lists.
During the community engagement phase of the Parks Needs Assessment, the website’s primary function was to assist users in finding the location and date of the community workshop in their Study Area. An interactive map allowed users to pinpoint their location; a single click on the map then activated a pop-up window that provided workshop information and links for downloading maps and data for each Study Area. The workshop information and Study Area-specific downloads were also available on the website in a chart format for those who preferred to search by Study Area name.
In addition to allowing users to quickly and easily find information about their Study Area, the website included a complete chronology of the Parks Needs Assessment; information about the Steering Committee meetings, including presentations and summary meeting notes; a listing of the TAC members; project fact sheets and
Figure 12. Homepage for Project Website
Figure 13. Interactive Map for Locating Workshopsbackground information in seven languages, contact information for reach County staff involved in the Parks Needs Assessment; and a platform for providing feedback. This brief survey was designed to engage stakeholders who were unable to attend a workshop in person.
The website also included a sign-up list for users to submit their email address and receive updates and news as the project moved forward. More than 250 people signed up for the project mailing list.

1.0 Introduction
1-26 Countywide Comprehensive Parks and Recreation Needs Assessment
High Priority Areas
In an effort to reach communities that are typically underrepresented in civic engagement initiatives and planning processes, the County identified areas of high need that could benefit from additional approaches to outreach. Nine High-Priority Areas (HPAs), consisting of 35 study areas, were established and are shown on Figure 14.
The County recognized that community-based organizations (CBOs) with an established rapport with community members are often more successful in engaging them than public agencies. Taking that into consideration, seven CBOs were contracted to provide increased local outreach in the HPAs. Collaborating with CBOs that are well known and respected provided the opportunity to connect with other community organizations, schools, local businesses, and political leaders.
Health Equity Workshops
To invite these community leaders to collaborate, the County conducted three “Health Equity” workshops, which provided a space for community leaders to network and unify efforts. The workshops were also dedicated to explaining the positive impacts parks and recreation services can have on public health. Lastly, the workshops called on the organizations in attendance to help spread the word of the Parks Needs Assessment and to actively engage community members and encourage them to attend their local workshop, aimed at prioritizing park needs. The seven contracted CBOs organized outreach efforts to complement the Countywide efforts. By reaching out to their existing mailing list of subscribers, CBOs were able to reach over 6,500 people, and another 34,708 people through their social media networks.
19
2
5
6
8
4
7
3
1. City of LA/Unincorporated LA Southeast LA – 04310; South LA – 04373; Uninc. West Athens/Westmont – 03279
2. City of LA Sun Valley – 01354; Van Nuys – 04315; Valley Glen – 04379
3. City of LA Westlake – 01348; Hollywood – 04376; Wilshire East – 04371
4. Unincorporated East LA Northwest – 06167; Southwest – 06380; Boyle Heights – 01366
5. San Gabriel Valley South El Monte – 11161; El Monte – 02136; Baldwin Park – 02124
6. San Gabriel Valley La Puente – 02171; Uninc. West La Puente – 07178; Uninc. Hacienda Heights – 07215; Uninc. Valinda – 07169; Uninc. Avocado Heights/Bassett – 07183
7. Southeast Cities Maywood – 02255; Bell – 02254; Huntington Park – 02206; South Gate – 02276; Cudahy – 02275
8. Southeast Cities Paramount – 02297; Compton – 02237; Uninc. Compton – 03258; Uninc. E.R.D. – 07242; Lynwood – 11226; Bellflower – 02300; North Long Beach – 05366
9. Southwest Cities Inglewood – 02265; Hawthorne – 03266; Uninc. Lennox - 02229; Lawndale – 02248
Figure 14. Location of High Priority Areas

1-27Countywide Comprehensive Parks and Recreation Needs Assessment
1.0 Introduction
In order to reach community members who might not be active on web-based platforms, the CBOs distributed flyers and other print materials to various points of interest in the community, including: churches, parks, residences, businesses, and community meetings. Through their collaboration efforts, several council members, assembly members, and even senators used their public voice to share the news of the Parks Needs Assessment and upcoming workshops with their constituents. By engaging the HPAs at a local level, the CBOs were able reach a wider audience and noticeably improve workshop attendance.
ii. Study Area-Specific Outreach
In contrast to the Countywide education and awareness campaign, which delivered general information about the Parks Needs Assessment, Study Area specific-outreach focused on advertising individual community workshops. The lead agency in each Study Area was responsible for
Figure 15. Tweets for Community Workshops
advertising the workshop it would host, and was given resources such as flyers, logos, and social media hashtags to assist in the effort. Each agency crafted and executed its own outreach plan for advertising its workshop, using the provided resources or developing materials tailored to the Study Area’s population.
Unincorporated Study Areas
Nearly 100 DPR employees and several community-based organizations worked together to inform community members in unincorporated Los Angeles County about opportunities to participate in the Parks Needs Assessment in each of the 47 unincorporated Study Areas.
The DPR and its collaborators operated an active social media campaign, published print and digital ads in local newspapers, distributed flyers through schools and other organizations, posted signs in parks, and made announcements at community events in order to attract participants to each of the workshops held by the DPR.
Facebook posts and Twitter “tweets” promoted the Parks Needs Assessment and provided specific meeting dates, times, and locations. To reach those who follow park-related news through social media outlets, DPR used popular hashtags (#weallneedparks and #boostmyparks) in all of their related posts. To encourage organic leads and shares, Facebook posts were further amplified by using the service’s “boost” function, an advertising feature that allowed the DPR to target posts to key demographics based on user location, age, interests, and other metrics. Facebook “boosts” were a key part of the outreach effort, and targeted posts reached an average audience of
Health Equity Workshops
held
3between 3,000 and 4,000 people per meeting. In total, DPR’s Facebook and Twitter efforts received more than 120,000 views.

1.0 Introduction
1-28 Countywide Comprehensive Parks and Recreation Needs Assessment
To further increase attendance at workshops, the County aimed to make it easier for working families to attend their local workshops by providing dinner or refreshments for evening meetings, childcare, and give-aways such as umbrellas and gift cards.
23 de enero, 20162:00 PM
La Ciudad de El Monte Departamento de Parques, Recreación y Servicios Comunitarios
Este taller es patrocinado por la Evaluación Integral de las Necesidades de Parques y El Condado de Los Angeles.
Centro Comunitario de El Monte3130 Tyler Avenue, El Monte
Asista a nuestra reunión en El Monte. Juntos crearemos una lista de prioridades para guiar los fondos del
Condado destinados a parques durante la próxima década.
Para mayor informes:El Departamento de Parques y Recreación(626)580-2261 o (626) 580-2200
Serviremos almuerzo entre la1:00 PM - 1:45 PM
UNASE a nosotros y
participe en la CREACIONdel FUTURO de
NUESTROS PARQUES!
!
Figure 16. Customized Flyer, Unincorporated Sunrise Village - South San Gabriel - Whittier Narrows
City Study Areas
Each city was responsible for advertising its own community workshop. Although resources such as flyer templates and logos were provided by the Parks Needs Assessment, staff in each City was encouraged to use their prior experience to develop and implement outreach tactics known to work best in their communities. Cities posted workshop information on their websites, engaged with social media, distributed flyers, partnered with schools and local organizations, and made announcements at local events. Highlighted below are summaries of the efforts made by several cities to attract participants to their meetings.
Workshop Banner Advertisement, City of La Puente
The City of El Monte displayed large signage at the local aquatic center, senior center, city council meetings, and other special events. In addition to signage, banners were hung in local parks, flyers were posted on the city webpage, and an article was blasted to all residents and subscribers of the city e-Newsletter. The City also collaborated with local school districts, the Chamber of Commerce, and organizations like Meals on Wheels, to distribute customized flyers to their respective members and subscribers. Over 150 people attended the workshop.
Figure 17. Customized Flyer, City of El Monte

1-29Countywide Comprehensive Parks and Recreation Needs Assessment
1.0 Introduction
The City of Los Angeles collaborated with Los Angeles Neighborhood Land Trust to conduct outreach in the Boyle Heights study area. Organizers held in-person meetings with community groups and partnered with local churches and council members to have announcements placed in their respective newsletters. Organizers also held advocacy training sessions to inform the community of the importance of the Parks Needs Assessment for park-poor communities such as Boyle Heights. The Boyle Heights workshop attracted the largest number of participants, approximately 350 people.
Figure 19. Eventbrite Invitation, Boyle HeightsFigure 18. English Language Flyer, City of Bell Gardens
The City of Bell Gardens attracted approximately 65 people to their workshop by announcing the event on the city website, utilizing social media platforms, and distributing flyers in multiple languages. In addition, workshop facilitators partnered with city recreation supervisors and program coordinators to reach out to participants of all city programs; the majority of their turnout was in response to this effort.

1.0 Introduction
1-30 Countywide Comprehensive Parks and Recreation Needs Assessment
1.3.5 COMMUNITY WORKSHOPSThe primary method of collecting community input for the Parks Needs Assessment was the series of community workshops held throughout the County between December 2015 and February 2016 (see Figure 20). As a result of the extensive Countywide and study area-specific outreach efforts, community workshops were attended by over 5,100 participants across the County. Attendance at individual workshops varied widely, with low attendance attributed to the busy, end-of-the-year holiday season; tight time frame for completing outreach for meetings; and varied levels of effort to advertise the workshops. In a few instances, workshops with exceptionally low attendance were supplemented by an additional workshop in an attempt to collect accurate community input.
Figure 20. Countywide Workshop Locations
Workshop in Unincorporated Charter Oaks

1-31Countywide Comprehensive Parks and Recreation Needs Assessment
1.0 Introduction
Community workshops were facilitated by the lead agency in each Study Area, either the County or an individual city. Every community workshop had three goals:
» Share the results of the analysis of existing park assets and needs within the Study Area with workshop participants.
» Develop a list of potential park projects, guided by the results of the analysis and workshop participants’ insights.
» Prioritize the top ten park projects for the Study Area.
Facilitators were provided with many resources for accomplishing these goals and had broad leeway to conduct the workshop in a manner they thought would be most effective within their community. The resources provided to every Study Area included a group training session, print and digital Facilitator Toolkit, and a $2,500 stipend to cover workshop expenses.
i. Facilitator Training
Facilitator trainings took place in mid-November 2015 and were held at three different locations to accommodate attendees. In addition, an online training was held for anyone unable to attend in person. At least one facilitator from every Study Area was required to attend one of the training sessions. In total, the training sessions were attended by over 300 people. Each two-hour training session covered the following topics:
» Goals of the community workshop
» Tips for marketing and outreach
» Guidance on preparing and customizing a workshop using the provided standard templates and Study Area-specific data
» Direction for interpreting, presenting, and explaining analysis data
Facilitator Training Session, San Fernando Regional Park Pool
Review existing parks and metrics.
Develop comprehensive list of potential projects.
Prioritize top ten park projects.
» Recommendations for identifying and presenting potential projects
» Suggestions for incorporating community feedback into prioritization exercise
» Guidance on conducting participatory prioritization exercise
» Instructions for preparing and submitting prioritized project lists
» Facilitation tools to improve participation during the meeting and effectively meet challenges
Over
facilitators trained
300
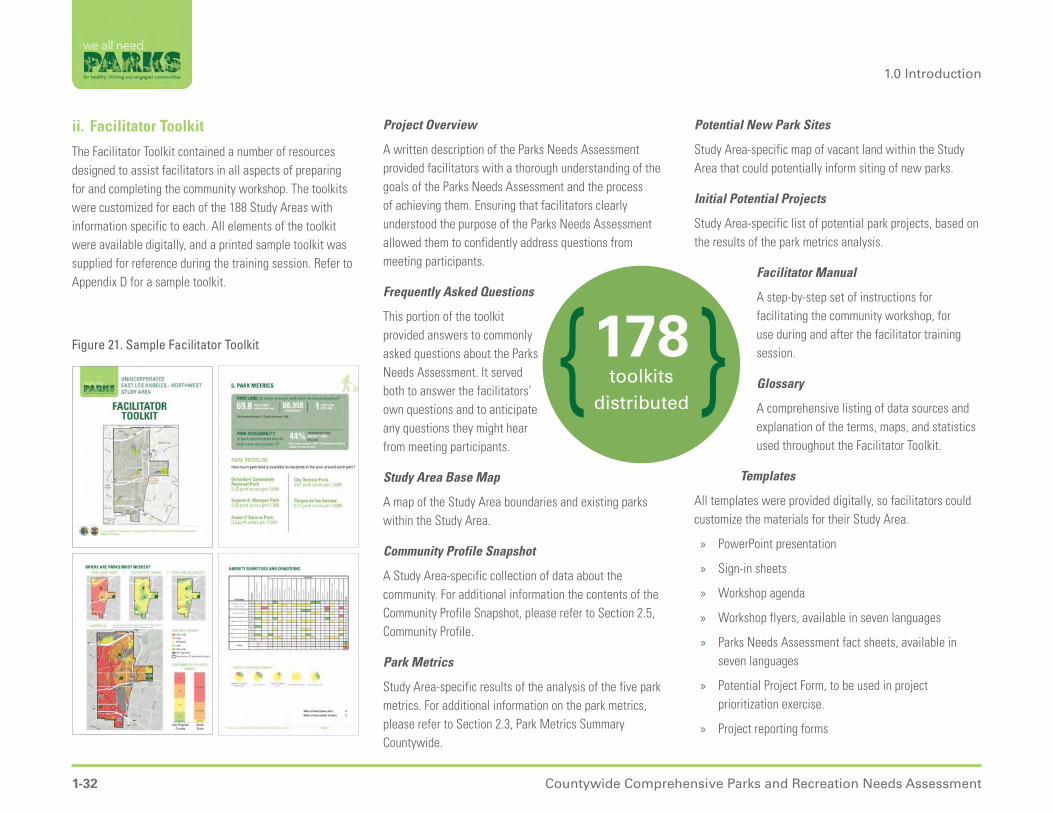
1.0 Introduction
1-32 Countywide Comprehensive Parks and Recreation Needs Assessment
ii. Facilitator Toolkit
The Facilitator Toolkit contained a number of resources designed to assist facilitators in all aspects of preparing for and completing the community workshop. The toolkits were customized for each of the 188 Study Areas with information specific to each. All elements of the toolkit were available digitally, and a printed sample toolkit was supplied for reference during the training session. Refer to Appendix D for a sample toolkit.
Project Overview
A written description of the Parks Needs Assessment provided facilitators with a thorough understanding of the goals of the Parks Needs Assessment and the process of achieving them. Ensuring that facilitators clearly understood the purpose of the Parks Needs Assessment allowed them to confidently address questions from meeting participants.
Frequently Asked Questions
This portion of the toolkit provided answers to commonly asked questions about the Parks Needs Assessment. It served both to answer the facilitators’ own questions and to anticipate any questions they might hear from meeting participants.
Study Area Base Map
A map of the Study Area boundaries and existing parks within the Study Area.
Community Profile Snapshot
A Study Area-specific collection of data about the community. For additional information the contents of the Community Profile Snapshot, please refer to Section 2.5, Community Profile.
Park Metrics
Study Area-specific results of the analysis of the five park metrics. For additional information on the park metrics, please refer to Section 2.3, Park Metrics Summary Countywide.
Figure 21. Sample Facilitator Toolkit
toolkits distributed
178
Potential New Park Sites
Study Area-specific map of vacant land within the Study Area that could potentially inform siting of new parks.
Initial Potential Projects
Study Area-specific list of potential park projects, based on the results of the park metrics analysis.
Facilitator Manual
A step-by-step set of instructions for facilitating the community workshop, for use during and after the facilitator training session.
Glossary
A comprehensive listing of data sources and explanation of the terms, maps, and statistics used throughout the Facilitator Toolkit.
Templates
All templates were provided digitally, so facilitators could customize the materials for their Study Area.
» PowerPoint presentation
» Sign-in sheets
» Workshop agenda
» Workshop flyers, available in seven languages
» Parks Needs Assessment fact sheets, available in seven languages
» Potential Project Form, to be used in project prioritization exercise.
» Project reporting forms

1-33Countywide Comprehensive Parks and Recreation Needs Assessment
1.0 Introduction
Large Format Prints
Poster size prints (24” x 36”) of the Study Area base map and park metrics were available for each Study Area. Workshop facilitators were given printed proofs of these posters at the training session and asked to provide corrections. Once the base map and list of parks in the Study Area were corrected to the lead agency’s satisfaction, the prints were delivered to facilitators prior to their workshop. This process allowed every agency to review the information that had been documented during the inventory phase of the project and resulted in several corrections to that database.
Translations
Translations of workshop and outreach materials were available in Spanish, Chinese, Korean, and Armenian and were strongly recommended for use in all Study Areas where 15% or more of the population is linguistically isolated. These four languages were selected because they are the dominant languages spoken by the linguistically isolated populations within the Study Areas meeting that criteria.
Although Vietnamese and Japanese did not meet the criteria for translation recommendations, translations were available in these languages as well. Translated versions of the larger format prints were also available, although each Study Area could only receive one set of large format prints. Facilitators were urged to use some of their stipend funds to print copies in additional languages as needed.
Figure 22. Number of Study Areas Meeting Criteria for Translation Recommendation
Workshop Facilitator Explaining Large Format Prints, Unincorporated Topanga Canyon
Figure 23. Fact Sheet, Spanish and Chinese
78 12
2 1
Study Areas in Spanish
Study Areas in Chinese
Study Areas in Armenian
Study Area in Korean
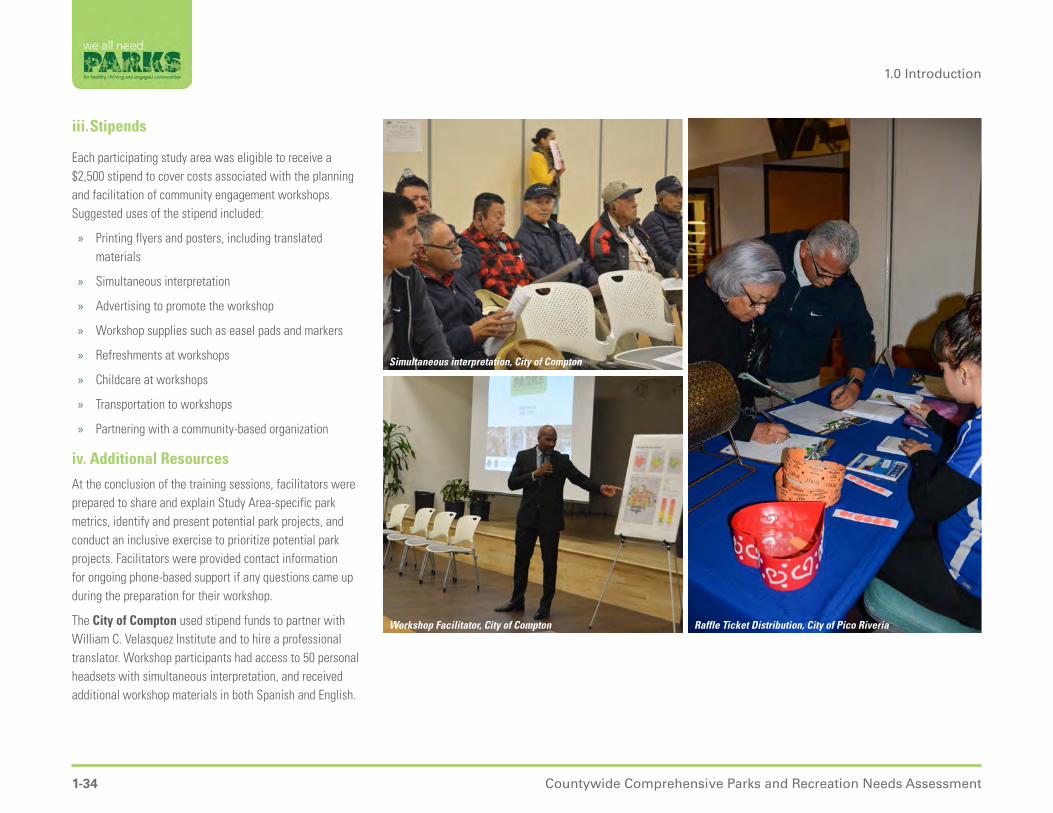
1.0 Introduction
1-34 Countywide Comprehensive Parks and Recreation Needs Assessment
iii. Stipends
Each participating study area was eligible to receive a $2,500 stipend to cover costs associated with the planning and facilitation of community engagement workshops. Suggested uses of the stipend included:
» Printing flyers and posters, including translated materials
» Simultaneous interpretation
» Advertising to promote the workshop
» Workshop supplies such as easel pads and markers
» Refreshments at workshops
» Childcare at workshops
» Transportation to workshops
» Partnering with a community-based organization
iv. Additional Resources
At the conclusion of the training sessions, facilitators were prepared to share and explain Study Area-specific park metrics, identify and present potential park projects, and conduct an inclusive exercise to prioritize potential park projects. Facilitators were provided contact information for ongoing phone-based support if any questions came up during the preparation for their workshop.
The City of Compton used stipend funds to partner with William C. Velasquez Institute and to hire a professional translator. Workshop participants had access to 50 personal headsets with simultaneous interpretation, and received additional workshop materials in both Spanish and English.
Simultaneous interpretation, City of Compton
Workshop Facilitator, City of Compton Raffle Ticket Distribution, City of Pico Riveria
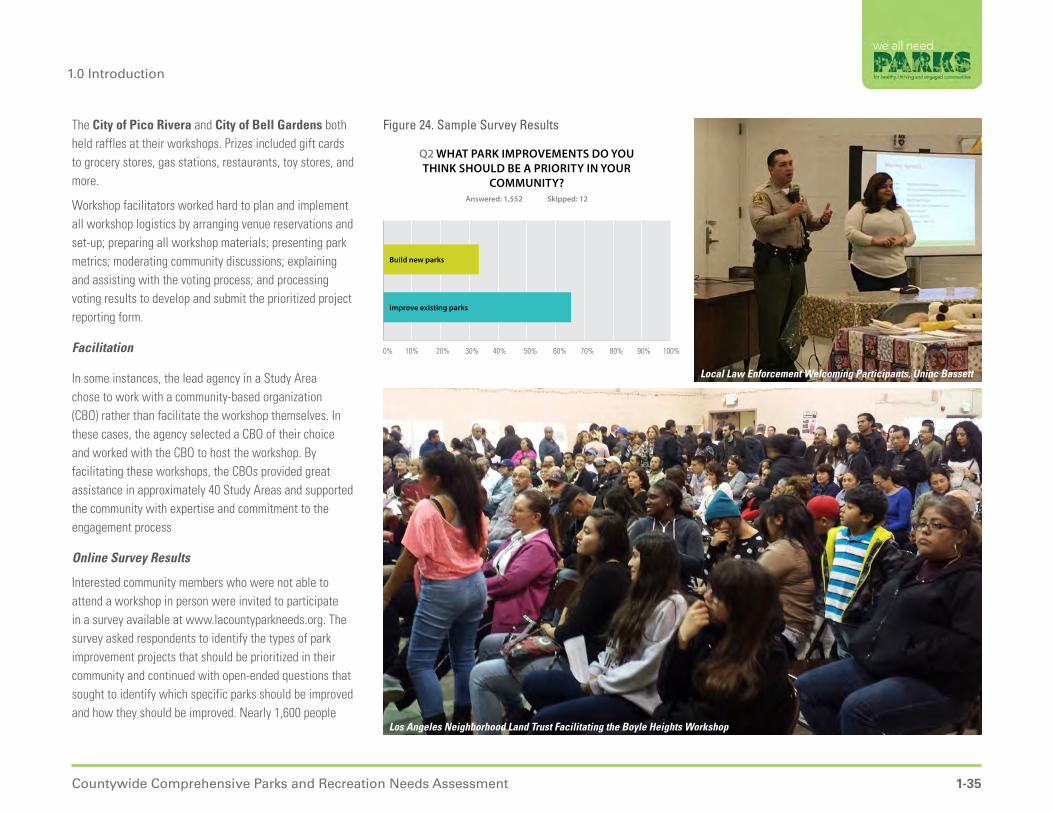
1-35Countywide Comprehensive Parks and Recreation Needs Assessment
1.0 Introduction
0% 10% 20% 30% 40% 50% 60% 70% 80% 90% 100%
The City of Pico Rivera and City of Bell Gardens both held raffles at their workshops. Prizes included gift cards to grocery stores, gas stations, restaurants, toy stores, and more.
Workshop facilitators worked hard to plan and implement all workshop logistics by arranging venue reservations and set-up; preparing all workshop materials; presenting park metrics; moderating community discussions; explaining and assisting with the voting process; and processing voting results to develop and submit the prioritized project reporting form.
Facilitation
In some instances, the lead agency in a Study Area chose to work with a community-based organization (CBO) rather than facilitate the workshop themselves. In these cases, the agency selected a CBO of their choice and worked with the CBO to host the workshop. By facilitating these workshops, the CBOs provided great assistance in approximately 40 Study Areas and supported the community with expertise and commitment to the engagement process
Online Survey Results
Interested community members who were not able to attend a workshop in person were invited to participate in a survey available at www.lacountyparkneeds.org. The survey asked respondents to identify the types of park improvement projects that should be prioritized in their community and continued with open-ended questions that sought to identify which specific parks should be improved and how they should be improved. Nearly 1,600 people
Figure 24. Sample Survey Results
Los Angeles Neighborhood Land Trust Facilitating the Boyle Heights Workshop
Local Law Enforcement Welcoming Participants, Uninc Bassett
Q2 WHAT PARK IMPROVEMENTS DO YOU THINK SHOULD BE A PRIORITY IN YOUR
COMMUNITY?Answered: 1,552 Skipped: 12
Build new parks
Improve existing parks
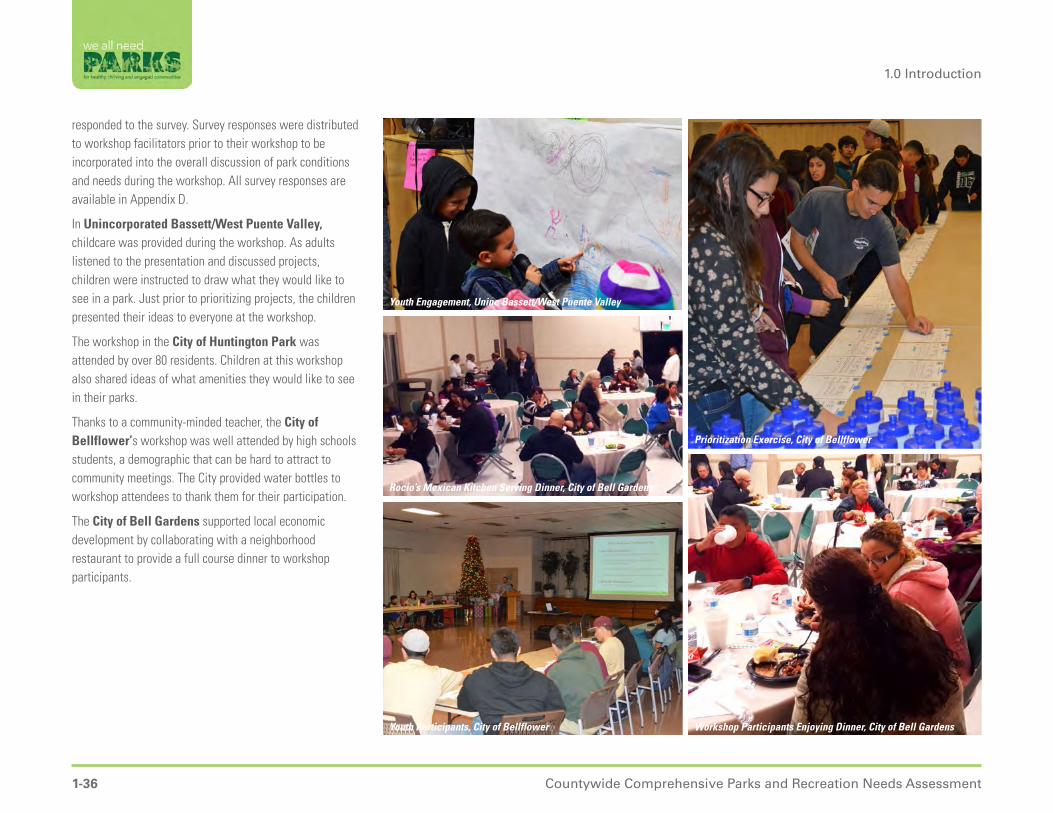
1.0 Introduction
1-36 Countywide Comprehensive Parks and Recreation Needs Assessment
responded to the survey. Survey responses were distributed to workshop facilitators prior to their workshop to be incorporated into the overall discussion of park conditions and needs during the workshop. All survey responses are available in Appendix D.
In Unincorporated Bassett/West Puente Valley, childcare was provided during the workshop. As adults listened to the presentation and discussed projects, children were instructed to draw what they would like to see in a park. Just prior to prioritizing projects, the children presented their ideas to everyone at the workshop.
The workshop in the City of Huntington Park was attended by over 80 residents. Children at this workshop also shared ideas of what amenities they would like to see in their parks.
Thanks to a community-minded teacher, the City of Bellflower’s workshop was well attended by high schools students, a demographic that can be hard to attract to community meetings. The City provided water bottles to workshop attendees to thank them for their participation.
The City of Bell Gardens supported local economic development by collaborating with a neighborhood restaurant to provide a full course dinner to workshop participants.
Youth Engagement, Uninc Bassett/West Puente Valley
Prioritization Exercise, City of Bellflower
Youth Participants, City of Bellflower
Rocio’s Mexican Kitchen Serving Dinner, City of Bell Gardens
Workshop Participants Enjoying Dinner, City of Bell Gardens

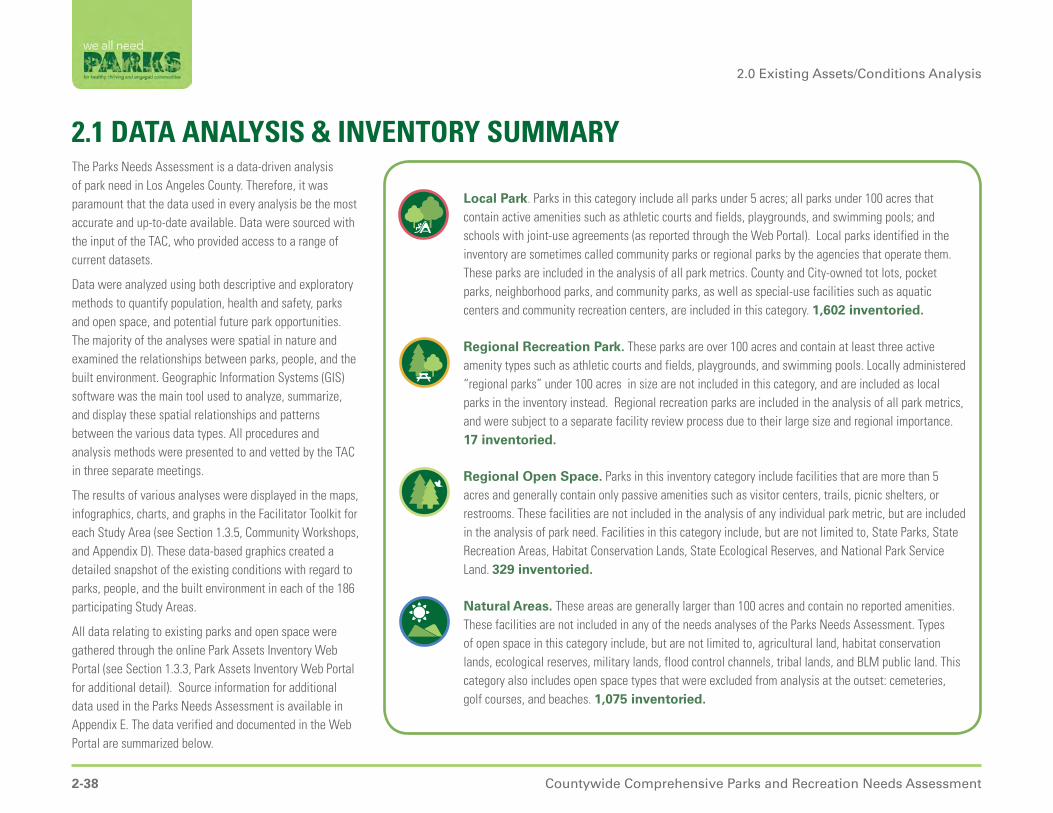
2.0 Existing Assets/Conditions Analysis
2-38 Countywide Comprehensive Parks and Recreation Needs Assessment
Local Park. Parks in this category include all parks under 5 acres; all parks under 100 acres that contain active amenities such as athletic courts and fields, playgrounds, and swimming pools; and schools with joint-use agreements (as reported through the Web Portal). Local parks identified in the inventory are sometimes called community parks or regional parks by the agencies that operate them. These parks are included in the analysis of all park metrics. County and City-owned tot lots, pocket parks, neighborhood parks, and community parks, as well as special-use facilities such as aquatic centers and community recreation centers, are included in this category. 1,602 inventoried.
Regional Recreation Park. These parks are over 100 acres and contain at least three active amenity types such as athletic courts and fields, playgrounds, and swimming pools. Locally administered “regional parks” under 100 acres in size are not included in this category, and are included as local parks in the inventory instead. Regional recreation parks are included in the analysis of all park metrics, and were subject to a separate facility review process due to their large size and regional importance. 17 inventoried.
Regional Open Space. Parks in this inventory category include facilities that are more than 5 acres and generally contain only passive amenities such as visitor centers, trails, picnic shelters, or restrooms. These facilities are not included in the analysis of any individual park metric, but are included in the analysis of park need. Facilities in this category include, but are not limited to, State Parks, State Recreation Areas, Habitat Conservation Lands, State Ecological Reserves, and National Park Service Land. 329 inventoried.
Natural Areas. These areas are generally larger than 100 acres and contain no reported amenities. These facilities are not included in any of the needs analyses of the Parks Needs Assessment. Types of open space in this category include, but are not limited to, agricultural land, habitat conservation lands, ecological reserves, military lands, flood control channels, tribal lands, and BLM public land. This category also includes open space types that were excluded from analysis at the outset: cemeteries, golf courses, and beaches. 1,075 inventoried.
The Parks Needs Assessment is a data-driven analysis of park need in Los Angeles County. Therefore, it was paramount that the data used in every analysis be the most accurate and up-to-date available. Data were sourced with the input of the TAC, who provided access to a range of current datasets.
Data were analyzed using both descriptive and exploratory methods to quantify population, health and safety, parks and open space, and potential future park opportunities. The majority of the analyses were spatial in nature and examined the relationships between parks, people, and the built environment. Geographic Information Systems (GIS) software was the main tool used to analyze, summarize, and display these spatial relationships and patterns between the various data types. All procedures and analysis methods were presented to and vetted by the TAC in three separate meetings.
The results of various analyses were displayed in the maps, infographics, charts, and graphs in the Facilitator Toolkit for each Study Area (see Section 1.3.5, Community Workshops, and Appendix D). These data-based graphics created a detailed snapshot of the existing conditions with regard to parks, people, and the built environment in each of the 186 participating Study Areas.
All data relating to existing parks and open space were gathered through the online Park Assets Inventory Web Portal (see Section 1.3.3, Park Assets Inventory Web Portal for additional detail). Source information for additional data used in the Parks Needs Assessment is available in Appendix E. The data verified and documented in the Web Portal are summarized below.
2.1 DATA ANALYSIS & INVENTORY SUMMARY

2-39Countywide Comprehensive Parks and Recreation Needs Assessment
2.0 Existing Assets/Conditions Analysis
2.1.1 PARK AND OPEN SPACE FACILITIES INVENTORYOver 3,000 park and open space facilities were inventoried through the Web Portal. Each facility was reviewed in detail and reconciled against aerial and GIS data for location and acreage.
Four types of parks and open spaces were identified as a means to categorize the facilities inventoried during the Parks Needs Assessment: local parks, regional recreation parks, regional open space, and natural areas (refer to definitions on page 2-38). This uniform categorization system ensured an “apples to apples” comparison among facilities and Study Areas. The four categories are specific
Figure 25. Los Angeles County Park and Open Space Inventory
Regional Recreation Park: Whittier Narrows
Regional Open Space: Arroyo Woodland and Nature Park
Local Park: Chaparral Park in the City of Claremont
to the Parks Needs Assessment, and differ from categories used in cities and by other agencies in the County. For the inventory, specialized facilities serving the entire County or specific sub-regions, such as arboreta, amphitheaters, and wilderness parks were included in the category that covered their specific characteristics, and only if they were part of a park or open space facility.
As seen in Figure 25, the inventory of park assets in the County shows that local parks account for the less than two percent of the park land available. Regional recreation parks account for two percent of park land; 11 percent of park land is classified as regional open space. Natural areas account for the remaining 85 percent of the park land in the County.
LOCAL PARK15,723 acres
REGIONAL RECREATION PARK18,248 acres
REGIONAL OPEN SPACE98,977 acres
NATURAL AREAS768,699 acres
1,602 local parks
17 regional recreation parks 1,075
natural areas
329 regional open spaces
1.7% 2.0%
11.0%85.3%
901,647 ACRES
INVENTORIED
3,023 FACILITIES INVENTORIED:
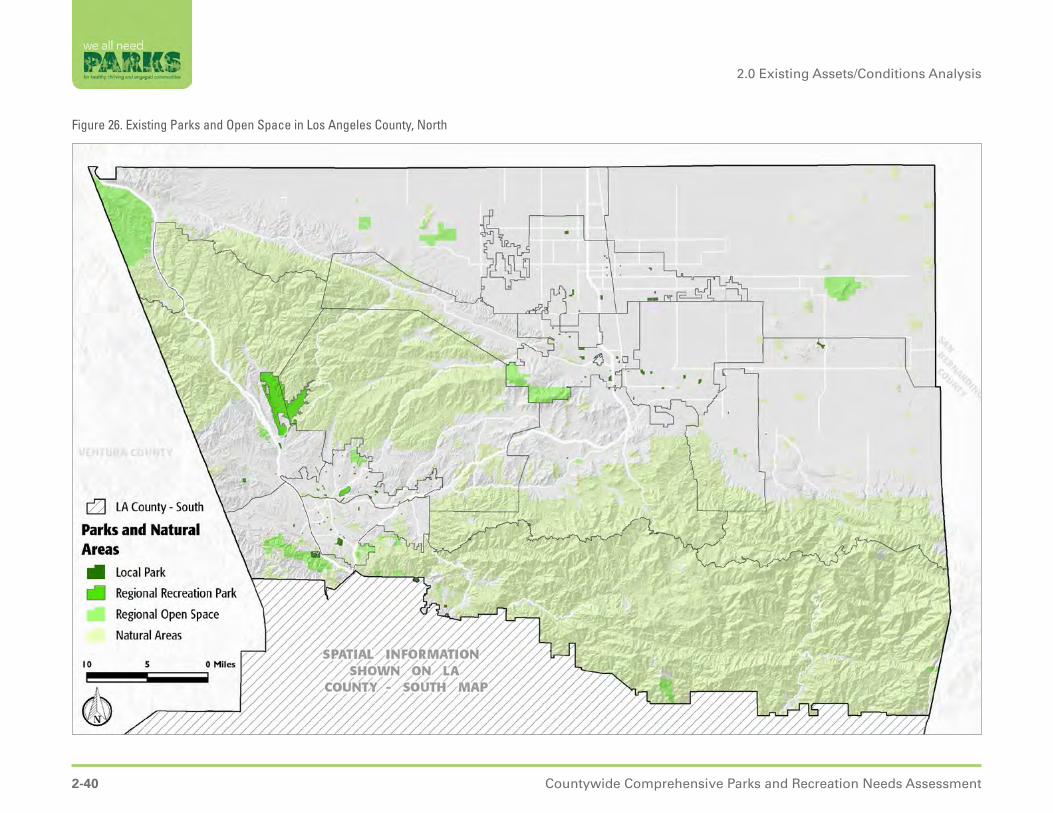
2.0 Existing Assets/Conditions Analysis
2-40 Countywide Comprehensive Parks and Recreation Needs Assessment
Figure 26. Existing Parks and Open Space in Los Angeles County, North
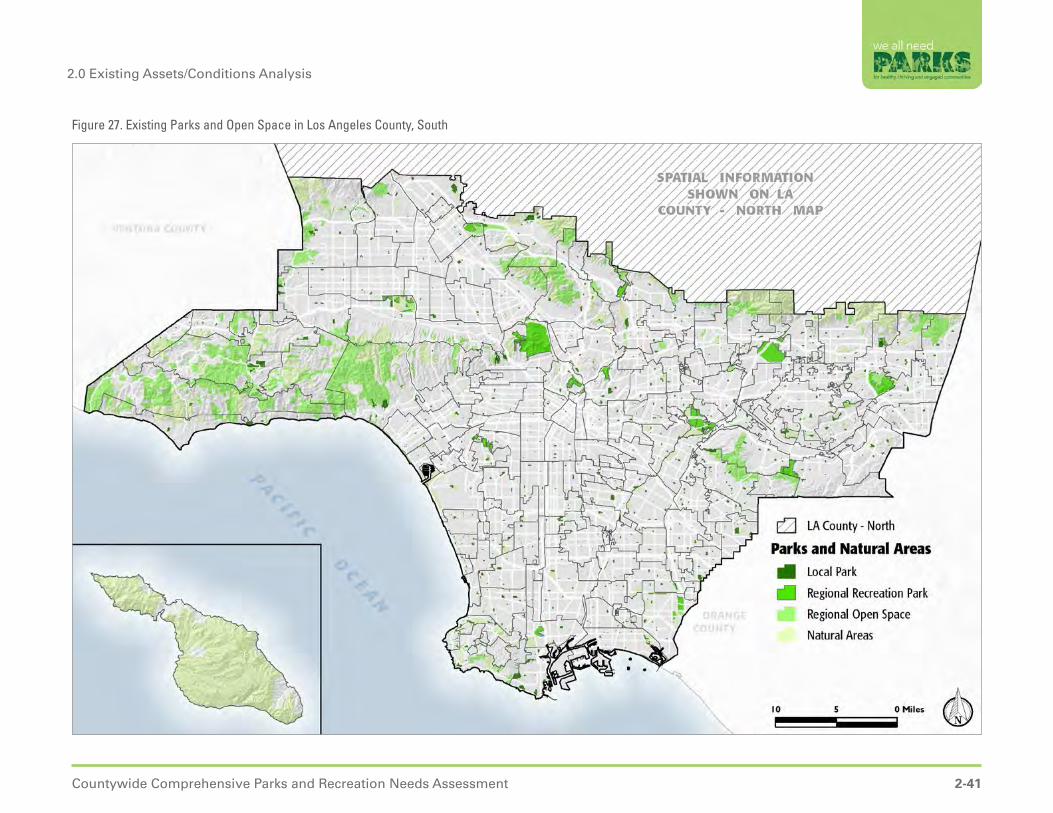
2-41Countywide Comprehensive Parks and Recreation Needs Assessment
2.0 Existing Assets/Conditions Analysis
Figure 27. Existing Parks and Open Space in Los Angeles County, South

2.0 Existing Assets/Conditions Analysis
2-42 Countywide Comprehensive Parks and Recreation Needs Assessment
2.1.2 AMENITY INVENTORYThe Park Needs Assessment included an unprecedented effort to create a comprehensive database of park amenities in every park in the County. It is snapshot in time of the quantity and condition of the amenities in each park in the summer of 2015. The 16 amenities, plus trails and infrastructure data, cataloged in the Web Portal were determined in collaboration with the Steering Committee and TAC. Each park agency also had the opportunity to document unique amenities in their parks beyond the standard 16. Over 9,000 amenities were cataloged in the Web Portal. The amenity data received during the inventory is summarized in Figure 28. Participating agencies were given the opportunity to review these data for accuracy upon receipt of the Study Area’s Facilitator Toolkit. Accuracy of data for trails may be affected by lack of participation from agencies owning these types of amenities.

2-43Countywide Comprehensive Parks and Recreation Needs Assessment
2.0 Existing Assets/Conditions Analysis
Figure 28. Summary of Inventoried Amenities
9,472Total Number of Amenities Inventoried
1,022Tennis Courts
940Basketball Courts
1,068Baseball Fields
424 Soccer Fields
510 Multipurpose Fields
373Fitness Zones
96 Skate Parks
1,251 Picnic Shelters
1,452 Playgrounds
218 Swimming Pools
82Splash Pads
51 Dog Parks
1,190Restrooms
187 Gymnasiums
367 Unique Amenities
518 Senior Centers
90 Community Rec Centers
Note: Unique amenities include equestrian arenas, volleyball courts, amphitheaters, community gardens, concession stands, gazebos, etc.
Countywide Trails948 miles
Trails Within Parks 287 miles Trails Outside Parks 661 miles

2.0 Existing Assets/Conditions Analysis
2-44 Countywide Comprehensive Parks and Recreation Needs Assessment
2.2 POPULATIONAccurately documenting the number of residents and the location of households in Los Angeles County was critical for many of the spatial analyses completed as part of the Needs Assessment. The most accurate population data available at the time of the Needs Assessment were the 2014 Los Angeles County Age/Race/Gender Population Estimates from the U.S. Census Bureau. These estimates are adjusted annually by both the County and the California State Department of Finance to improve accuracy. These data are provided at a census tract level.
To improve the accuracy of the spatial analyses completed for the Needs Assessment, a probable distribution of population within each census tract was developed. This was accomplished by dividing the entire County into one-acre hexagons. Population was distributed among the grid
cells within each census tract based on the underlying Los Angeles County Assessor’s parcel land use type. This technique pushed the population to the areas where people are most likely to live in an attempt to more accurately summarize the spatial location of the population within specific analysis areas. For example, in a census tract with a golf course, the total population of the census tract was distributed only among hexagons that are not on the golf
Figure 29. Population Distribution Examples
course. Likewise, if a census tract has undeveloped land or industrial parcels, the population was not distributed to hexagons in those areas.
Once the population was distributed, the data were used in all subsequent analyses involving population, including density and park access and park pressure, among others. The accuracy of each of these spatial analyses was improved by the use of these finely detailed data on the location of population. However, it should be noted that a known weakness of Census-based population data is the potential of an undercount. In Los Angeles County, undercounts are most likely in low-income and predominantly minority neighborhoods. Nevertheless, in consultation with the Technical Advisory Committee, it was decided that the 2014 Los Angeles County Age/Race/Gender Population Estimates should be used, as these were the most accurate data available.
10,069,397LA COUNTY POPULATION
Golf Course Non-Residential Land Use Non-Residential Land Use

2-45Countywide Comprehensive Parks and Recreation Needs Assessment
2.0 Existing Assets/Conditions Analysis
2.3 PARK METRICS SUMMARY COUNTYWIDEEach of the five park metrics was determined in collaboration with the Steering Committee, as summarized in Section 1.3.2, Park Metrics. Each metric was analyzed and reported for each Study Area in the County, using park and amenity data submitted through the Web Portal. Several metrics were also analyzed at a Countywide scale. The results of the Countywide analysis are presented below; refer to Appendix A for the results of the park metrics analyses for each individual Study Area. For additional information about the technical aspects of the analyses, refer to Appendix E.
2.3.1 PARK LAND
How many acres of park are there per 1,000 people?
Within each Study Area, the number of local park acres per 1,000 is reported separately from the number of regional recreation parks acres per 1,000. Additionally, in Study Areas with adjacent regional open space, the number of acres of this type of park per 1,000 is reported.
Open space and natural area acreages are addressed using an approach guided by input from cities, organizations working on open space issues, and the project Steering Committee. This approach recognizes that: 1) open space and natural areas are regional resources that serve the recreation needs of the entire County; 2) the distribution of these areas throughout the County is uneven due to a variety of factors; and 3) it is not feasible to create open space and natural areas across the County, especially in built-out urban areas. Thus, in an effort to facilitate
Figure 30. Park Land Countywide
Figure 31. Park Access Countywide
of population Countywidelives within 1/2 mile of a park
of population Countywidelives beyond 1/2 mile of a park 49% 51%
countywide comparison, the calculation of park acres per 1,000 people in each Study Area only included acreages in local parks and regional recreation parks. Including regional open space and natural area acreages in this calculation would have greatly impacted the assessment of park need in those Study Areas adjacent to large open spaces and natural areas by inflating the amount of parkland in these Study Areas and failing to highlight their need for local parks and regional recreation parks.
Countywide, there are 3.3 acres of local and regional recreation park per 1,000 residents, which is less than the 4.0 acres per 1,000 goal included in the Los Angeles County General Plan (Figure 30). This ratio was determined by totaling the acres of local and regional parks, dividing this the total by the County’s total population, and then multiplying that value by 1,000. Among individual Study Areas, this value ranges from a low of 0 acres per 1,000 residents to a high of 1,295 acres per 1,000 residents.
3.3 ACRES Local Parks &
Regional Recreation Parks per 1,000 people
86.2 ACRESRegional Open Space &
Natural Areas per 1,000 people
Los Angeles County General Plan standard is 6.0 acres per 1,000
Los Angeles County General Plan standard is 4.0 acres per 1,000
Countywide, there are 86.2 acres of regional open space & natural areas per 1,000 people. This amount highly exceeds the standard of 6 acres per 1,000 documented in the Los Angeles County General Plan.
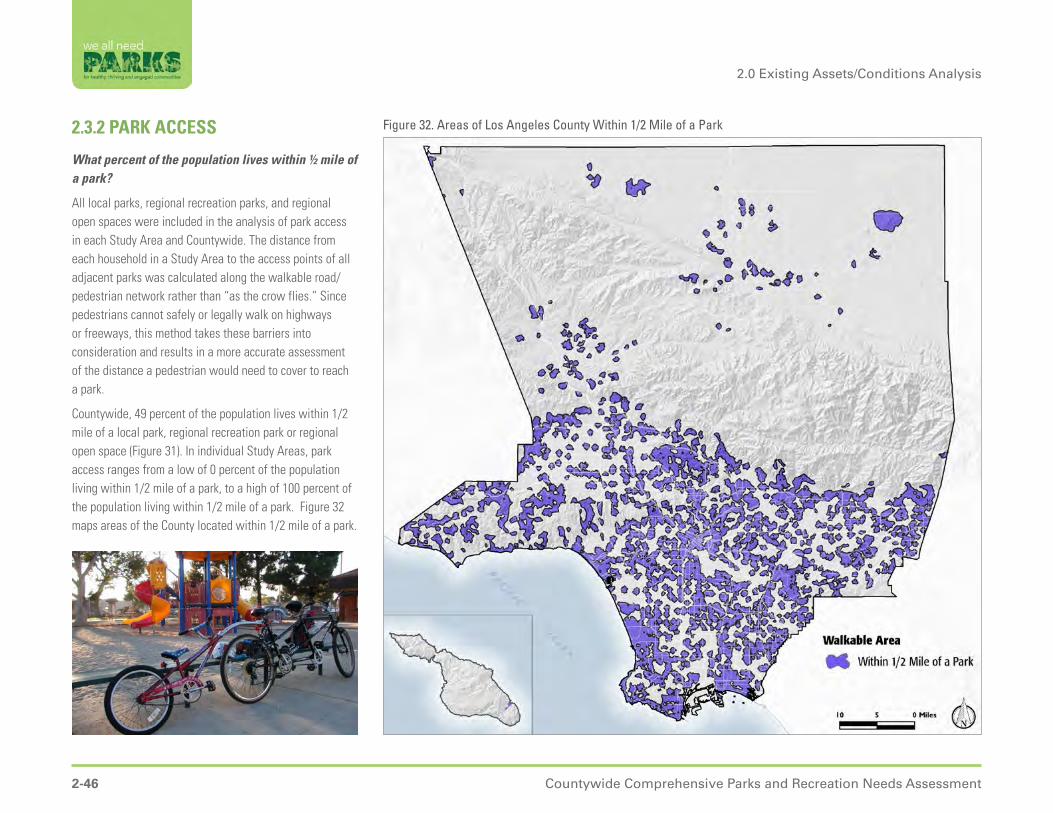
2.0 Existing Assets/Conditions Analysis
2-46 Countywide Comprehensive Parks and Recreation Needs Assessment
Figure 32. Areas of Los Angeles County Within 1/2 Mile of a Park2.3.2 PARK ACCESS
What percent of the population lives within ½ mile of a park?
All local parks, regional recreation parks, and regional open spaces were included in the analysis of park access in each Study Area and Countywide. The distance from each household in a Study Area to the access points of all adjacent parks was calculated along the walkable road/pedestrian network rather than “as the crow flies.” Since pedestrians cannot safely or legally walk on highways or freeways, this method takes these barriers into consideration and results in a more accurate assessment of the distance a pedestrian would need to cover to reach a park.
Countywide, 49 percent of the population lives within 1/2 mile of a local park, regional recreation park or regional open space (Figure 31). In individual Study Areas, park access ranges from a low of 0 percent of the population living within 1/2 mile of a park, to a high of 100 percent of the population living within 1/2 mile of a park. Figure 32 maps areas of the County located within 1/2 mile of a park.

2-47Countywide Comprehensive Parks and Recreation Needs Assessment
2.0 Existing Assets/Conditions Analysis
polygon defines the boundary of each park’s parkshed. The population within the parkshed is assumed to be the population most likely to use that park. The population within each parkshed was calculated to estimate the number of potential park users within each parkshed. The acreage of the park was then used to calculate the number of park acres available per 1,000 people within the parkshed.
Parks with fewer park acres available per 1,000 people within the parkshed are more likely to experience heavy use, while those with more park acres available per 1,000 residents may be used less heavily. Population density can greatly affect park pressure; for example, if a 1 acre park has 10,000 people in its parkshed, it is likely to be more heavily used than a 1 acre park with 1,000 people in its parkshed.
Low Park Pressure at 20%
of parks in the County
High Park Pressure at
80% of parks in the
County
Mor
e th
an
3.3
Less than 3.3
ACRES PER 1,000 PEOPLE
Figure 33. Park Pressure Countywide
2.3.3 PARK PRESSURE
How much park land is available to residents in the area around each park?
Park pressure examines park size in relation to population density and quantifies how population density affects parks by capturing the potential demand if each resident of the County were to use the park closest to them. Park pressure was calculated by defining a “parkshed” around every local park and regional recreation park in the County. The parkshed is defined by a polygon containing all the households for whom a given park is their closest park, as shown in Figure 34. In this figure, each colored
Figure 34. Sample Parkshed Map
Countywide, 80 percent of parks have less than 3.3 acres of land available to residents in the surrounding parkshed. These parks have high park pressure, as they offer less park land per 1,000 residents than the County average of 3.3 acres per 1,000. Twenty percent of parks have low park pressure, offering more than 3.3 acres per 1,000 residents in the surrounding parkshed.
At individual parks, park pressure ranges from a low pressure of 16,851 acres per 1,000 residents to a high pressure of 0.004 acres per 1,000 residents.
2.3.4 PARK NEED
Where are parks most needed?
The three metrics analyzing park land, park access, and park pressure have spatial components and were mapped in every Study Area as park acre need, distance from a park, and population density.
Combining the information from these three maps creates a new map that identifies geographic locations within each Study Area where parks are most needed. Locations with a combination of few available park acres, far from existing parks, and a high population density have a greater need for parks than areas with many available park acres, close to existing parks, and with low population density.
Park Acre Need. The spatial analysis of park land included all local parks, regional recreation parks, and regional open space. Need was calculated by assigning a park service area to each existing park, based on the acres of the park and using the DPR’s service area standards as a guide. Populations in the service area of a park are considered to have all those park acres available to them.

2.0 Existing Assets/Conditions Analysis
2-48 Countywide Comprehensive Parks and Recreation Needs Assessment
The park service areas used were quarter-mile service area for 3 acre or smaller park, half mile service area for 3 to 10 acre parks, two-mile service area for parks with more than 10 acres or specialized facilities. Populated areas located two or more miles from a park are deemed to have zero park acres available to them.
For example, if a household is within a quarter mile of Park A (5 acres) and a half mile of Park B (2.4 acres), it is considered to have access to 7.4 acres of park land. This analysis is not confined to political or Study Area boundaries, so park acreage in adjacent Study Areas can be considered available to any population within the park’s service area. Populations with the fewest available acres of park have the highest park acre need; conversely, those populations with the most available acres of park have the lowest park acre need.
Distance From a Park. The spatial analysis of park access included local parks, regional recreation parks, and regional open space and is mapped in each Study Area as distance from a park. Data were classified into six categories based on the following distance thresholds: ¼ mile, ½ mile, 1 mile, 1½ miles, 2 miles, and more than 2 miles. Households the greatest distance from a park have the least park access, and those closest to a park have the most park access.
Population Density. The spatial analysis of park pressure focused on the population density component of this metric, since park acres and distance from a park (both components of park pressure) were already accounted for in the mapping of park acre need and distance from a park. Population density was measured as people per acre, and ranges from very low to very high.
Weighted overlay
To create the map of where parks are most needed, the three layers of spatial information were weighted and overlaid, with population density assigned the most weight (60 percent). Population density greatly affects the number of acres of park available per 1,000 people in any given area and is unaffected by the creation of new parks. New parks can be built to decrease park acre need and the
distance people live from parks, thus these two layers of information were given less weight. This weighting of layers was reviewed by the Steering Committee.
Using the weighted overlay method, a map of where parks are most needed was generated for each Study Area and is presented in Appendix A. These maps provide a highly detailed analysis of the geographical variation of park need within each Study Area and are useful on a local level for understanding how park need varies within a single community.
Figure 35. Where Are Parks Most Needed?
Park Acre Need (20%)
Distance From a Park (20%)
Population Density (60%)
Very HighHighModerateLowVery LowNo Population
Area within 1/2 mile walk of a park
PARK NEED CATEGORY
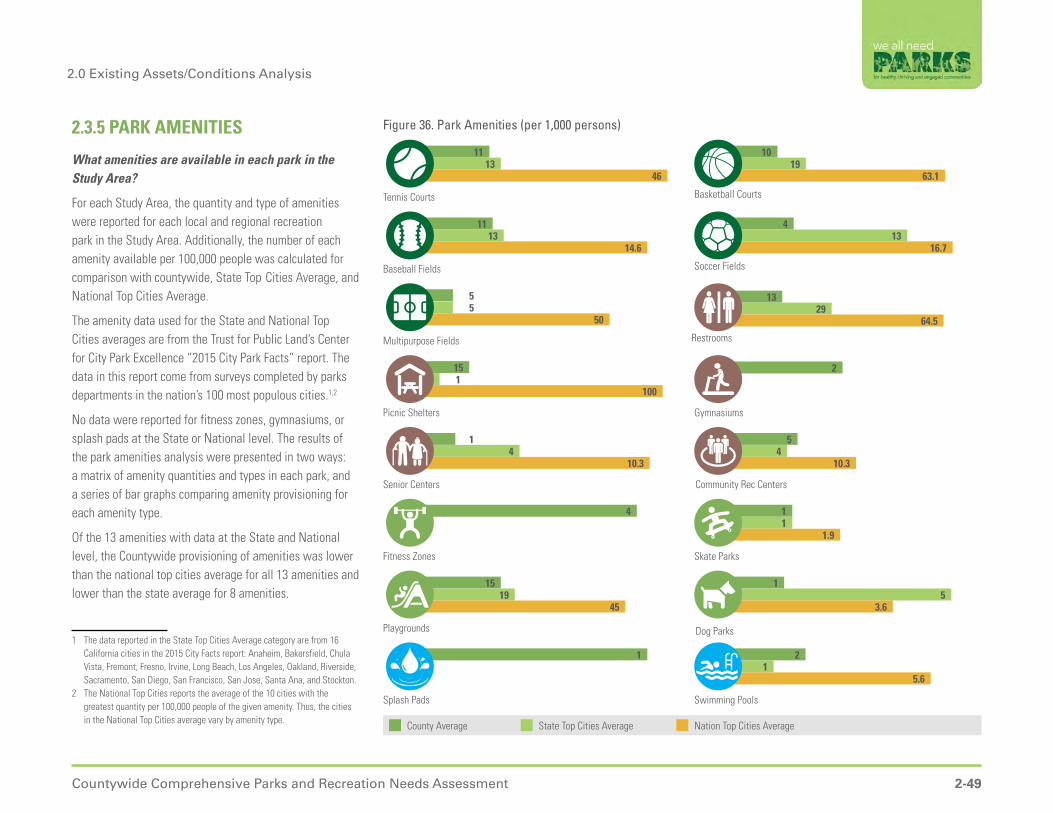
2-49Countywide Comprehensive Parks and Recreation Needs Assessment
2.0 Existing Assets/Conditions Analysis
Figure 36. Park Amenities (per 1,000 persons)
Tennis Courts Basketball Courts
Baseball Fields Soccer Fields
Multipurpose Fields
Fitness Zones Skate Parks
Picnic Shelters
Playgrounds
Swimming PoolsSplash Pads
County Average State Top Cities Average Nation Top Cities Average
Dog Parks
Restrooms
Gymnasiums
Senior Centers Community Rec Centers
11 10
4
13
2
5
1
1
21
15
4
1
15
5
11
13 19
13
29
4
1
5
1
19
4
1
5
13
46 63.1
16.7
64.5
10.3
1.9
3.6
5.6
45
10.3
100
50
14.6
2.3.5 PARK AMENITIES
What amenities are available in each park in the Study Area?
For each Study Area, the quantity and type of amenities were reported for each local and regional recreation park in the Study Area. Additionally, the number of each amenity available per 100,000 people was calculated for comparison with countywide, State Top Cities Average, and National Top Cities Average.
The amenity data used for the State and National Top Cities averages are from the Trust for Public Land’s Center for City Park Excellence “2015 City Park Facts” report. The data in this report come from surveys completed by parks departments in the nation’s 100 most populous cities.1,2
No data were reported for fitness zones, gymnasiums, or splash pads at the State or National level. The results of the park amenities analysis were presented in two ways: a matrix of amenity quantities and types in each park, and a series of bar graphs comparing amenity provisioning for each amenity type.
Of the 13 amenities with data at the State and National level, the Countywide provisioning of amenities was lower than the national top cities average for all 13 amenities and lower than the state average for 8 amenities.
1 The data reported in the State Top Cities Average category are from 16 California cities in the 2015 City Facts report: Anaheim, Bakersfield, Chula Vista, Fremont, Fresno, Irvine, Long Beach, Los Angeles, Oakland, Riverside, Sacramento, San Diego, San Francisco, San Jose, Santa Ana, and Stockton.
2 The National Top Cities reports the average of the 10 cities with the greatest quantity per 100,000 people of the given amenity. Thus, the cities in the National Top Cities average vary by amenity type.

2.0 Existing Assets/Conditions Analysis
2-50 Countywide Comprehensive Parks and Recreation Needs Assessment
GO
OD
FAIR
POOR GOOD FAIR
PO
OR
2.3.6 PARK CONDITION
Is the park in good, fair, or poor condition?
The condition of every amenity in each local park and regional recreation park was reported in a matrix for each Study Area. The percentage of amenities in each category was calculated for each park, providing a sense of the overall condition of each park. Of the 9,472 amenities reported, a majority of the amenities were reported in “good” and “fair” condition. Amenities in “good” condition made up about 42 percent of all amenities, and amenities in “fair” condition made up about 43 percent of all amenities—both led by playgrounds in good and fair condition. The remaining 15 percent of amenities were reported in “poor” condition, which was led by restrooms in poor condition.
A majority of parks have general park infrastructure3 that was reported to be in “fair” condition. About 51 percent of the total park acreage has general park infrastructure reported to be in “fair” condition, 29 percent of park acreage has infrastructure in “poor” condition, and only 18 percent of park acres have infrastructure reported to be in “good” condition. The condition of the general park infrastructure of the remaining 2 percent of park acres was unreported. These data only include the general park infrastructure conditions of local and regional parks. A majority of infrastructure conditions were not reported for open space, therefore these data only include the park conditions of local and regional parks to minimize the percentage of conditions not reported.
3 General park infrastructure includes: restrooms, signage, parking lot, walkways, security lighting, park furniture, irrigation, vegetation/landscaping, and fencing.
Figure 37. Park Conditions
15.1%
28.6%
42.7% 51.1%
42.2%
18.1%2.2% unreported
PARK INFRASTRUCTURE
PARK AMENITIES

2-51Countywide Comprehensive Parks and Recreation Needs Assessment
2.0 Existing Assets/Conditions Analysis
Seventeen regional recreation parks were identified during the inventory of the Parks Needs Assessment. These 17 parks are each over 100 acres and contain at least three active amenity types such as athletic courts and fields, playgrounds, and swimming pools.
Regional recreation parks draw users from an area much larger than a single Study Area, due to their large size and the types of recreation they offer. These parks are destinations for a regional population, drawing people from as far as 25 or more miles away. Residents living near a regional recreation park may use the park for their daily recreation needs, while park users from farther away may visit the park to meet more specialized recreation needs.
Because of their size, use levels, and variety of amenities, maintenance and operation demands at these parks can differ significantly from those at local parks. The managing agencies responsible for operation of regional recreation parks are usually different than agencies managing adjacent local parks, and the users of regional recreation parks include many more people than those in the adjacent Study Area(s). Given these distinctions in scale, use, and management, the Parks Needs Assessment team, with the support of the Steering Committee, developed a separate methodology for assessing the need of the 17 regional recreational parks identified in the Parks Needs Assessment and listed below.
Need in regional recreation parks was assessed by analyzing the five park metrics in all regional recreation parks, and in consultation with the managing agency of each park, based on their knowledge of local usage patterns and trends.
2.4 PARK METRICS - REGIONAL RECREATION PARKSRegional Recreation Parks
» Castaic Lake State Recreation Area, County of Los Angeles
» Central Park, City of Santa Clarita
» El Dorado Regional Park (East and West), Long Beach
» Elysian Park, City of Los Angeles
» Ernest E. Debs Regional Park, City of Los Angeles
» Frank Bonelli Regional Park, County of Los Angeles
» Griffith Park, City of Los Angeles
» Hahamonga Watershed Park, City of Pasadena
» Hansen Dam Park, City of Los Angeles
» Heartwell Park, City of Long Beach
» Ken Malloy Harbor Regional Park, City of Los Angeles
» Kenneth Hahn State Recreation Area, County of Los Angeles
» Peter F. Schabarum Regional County Park, County of Los Angeles
» San Dimas Canyon Community Regional Park, County of Los Angeles
» Santa Fe Dam Recreation Area, County of Los Angeles
» Sepulveda Basin Recreation Area (incl. Woodley Ave. Park and Lake Balboa Park), City of Los Angeles
» Whittier Narrows Recreation Area, County of Los Angeles
2.4.1 PARK LAND - REGIONAL RECREATION PARKSRegional recreation parks occupy a total of 18,248 acres of land and provide 1.81 acres of park land per 1,000 people Countywide.
2.4.2 PARK ACCESS - REGIONAL RECREATION PARKSDue to their large size, regional recreation parks have a large service radius, drawing users from as far away as 25 miles. In Los Angeles County, nearly 9.7 million people (96.2 percent of the total population) live within the service area of a regional recreational park.
1.8 acresRegional Recreation Park per 1,000 people

2.0 Existing Assets/Conditions Analysis
2-52 Countywide Comprehensive Parks and Recreation Needs Assessment
Figure 38. Regional Recreation Park Access: Areas within 25 Miles of a Regional Recreation Park2.4.3 PARK PRESSURE - REGIONAL RECREATION PARKSPark pressure for each regional recreation park was evaluated in the same manner as for local parks (refer to Section 2.3.3, Park Pressure). Park pressure at the regional recreation parks varies from a high of 0.11 acres per 1,000 people to a low of 166.87 acres per 1,000 people. Park pressure is high at 13 regional recreation parks, as they offer fewer than 3.3 acres per 1,000 people. See Table 3.
Griffith Park
Kenneth Hahn State Recreation Area

2-53Countywide Comprehensive Parks and Recreation Needs Assessment
2.0 Existing Assets/Conditions Analysis
FAIR
PO
OR
Figure 39. Conditions at Regional Recreation Parks
Park Conditions
33.7%
42.8%
23.5%
47.7%
47.1%
GOOD 5.2%
Table 3. Regional Recreation Parks - Park Pressure
PARK NAME ACRES/1,000
Heartwell Park 0.11
Kenneth Hahn State Recreation Area 0.22
Ken Malloy Harbor Regional Park 0.37
Sepulveda Basin Recreation Area 0.47
Ernest E Debs Regional Park 0.65
Elysian Park 0.75
Hansen Dam Park 0.85
Central Park 0.90
San Dimas Canyon Community Regional Park 1.08
Hahamongna Watershed Park 1.14
Peter F Schabarum Regional County Park 1.48
Whittier Narrows Recreation Area 1.90
El Dorado Park West 3.11
Santa Fe Dam Recreation Area 4.36
Frank G Bonelli Regional Park 4.42
Griffith Park 6.91
Castaic Lake State Recreation Area 166.87
2.4.4 PARK AMENITIES - REGIONAL RECREATION PARKS
Amenities in the regional recreation parks were inventoried by the managing agency. The 17 regional recreational parks feature over 700 individual amenities, with an average of over 40 individual amenities available to users at each park.
2.4.5 PARK CONDITION - REGIONAL RECREATION PARKS
Within the regional recreation parks, the majority of amenities are reported to be in fair condition. General park infrastructure was reported to be in good condition for only five percent of the regional recreation park acres, with the remaining acres almost equally split between poor and fair condition.
PARK INFRASTRUCTURE
GO
OD
FAIR
PO
O
R
PARK AMENITIES

2.0 Existing Assets/Conditions Analysis
2-54 Countywide Comprehensive Parks and Recreation Needs Assessment
The data in the Community Profile provide information about factors that affect park need, beyond the scope of the Parks Needs Assessment. This information was requested by the Steering Committee to supplement the park metrics data. Demographic, socioeconomic, public safety, health, and environmental data were gathered and compiled. No analysis was done on these data because the Parks Needs Assessment is focused on the physical needs of existing parks and the need for new parks. Rather, this information was presented as a collection of data that could be used in each Study Area to supplement knowledge of park need.
Data used in the Community Profile for each Study Area came from a variety of sources, and all were vetted by the Technical Advisory Committee. Countywide summaries of these data are presented below.
2.5 COMMUNITY PROFILE SUMMARY
Figure 40. Population Distribution by Age
Figure 41. Population Distribution by Race/Ethnicity
Figure 43. Populations without Vehicle Access
Figure 42. Populations at or below 200% Poverty Level
Figure 44. Populations in Linguistic Isolation
4% 81%
40%
Lowest percentage reported in a single
Study Area
Lowest percentage reported in a single
Study Area
Lowest percentage reported in a single
Study Area
Highest percentage reported in a single
Study Area
Highest percentage reported in a single
Study Area
Highest percentage reported in a single
Study Area
0% 87%
10%
26%
1% 56%
48%Latino
14%Asian
9%African-
American
28%Caucasian
0.2%Native American
0.2%Pacific Islander
POPULATION
Note: Total is less than 100% due to rounding
0–9 yrs 10–17 yrs 18–24 yrs 25–54 yrs 55–65 yrs 65+ yrs
13% 10%
8% 41% 16% 12%
COUNTYWIDE AVERAGE
COUNTYWIDE AVERAGE
COUNTYWIDE AVERAGE

2-55Countywide Comprehensive Parks and Recreation Needs Assessment
2.0 Existing Assets/Conditions Analysis
Figure 45. Countywide Bike/Pedestrian Collisions Map2.5.1 BICYCLE/PEDESTRIAN COLLISIONSThis map summarizes all collisions between automobiles and bicycles or pedestrians. The data was collected between 2003 and 2012. During this time, there were approximately 55,000 bicycle/pedestrian collisions in Los Angeles County.
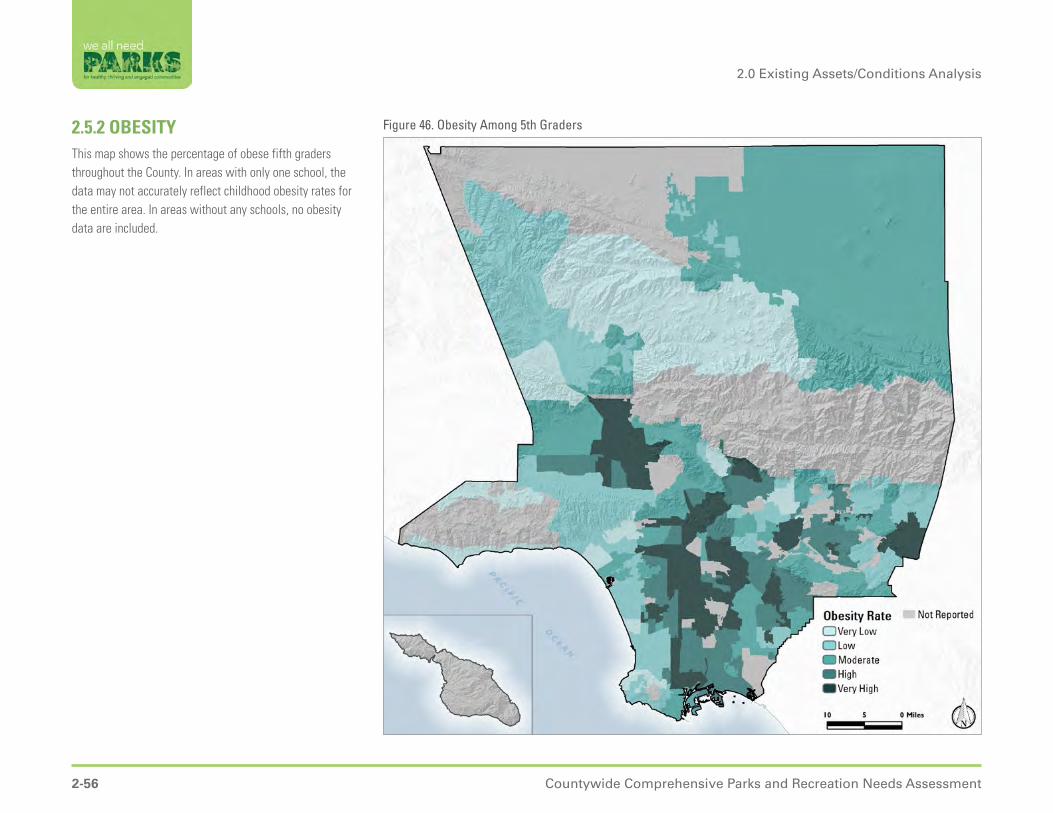
2.0 Existing Assets/Conditions Analysis
2-56 Countywide Comprehensive Parks and Recreation Needs Assessment
Figure 46. Obesity Among 5th Graders2.5.2 OBESITYThis map shows the percentage of obese fifth graders throughout the County. In areas with only one school, the data may not accurately reflect childhood obesity rates for the entire area. In areas without any schools, no obesity data are included.

2-57Countywide Comprehensive Parks and Recreation Needs Assessment
2.0 Existing Assets/Conditions Analysis
Figure 47. Asthma2.5.3 ASTHMAThis map shows the number of emergency room visits for asthma treatments, per 10,000 people per year. Outdoor air pollution, such as diesel particulate matter and ozone, is a well-known trigger of asthma attacks. Emergency room visits do not capture the full burden of asthma in a community, but are used as an indicator of overall disease burden for lack of better data.
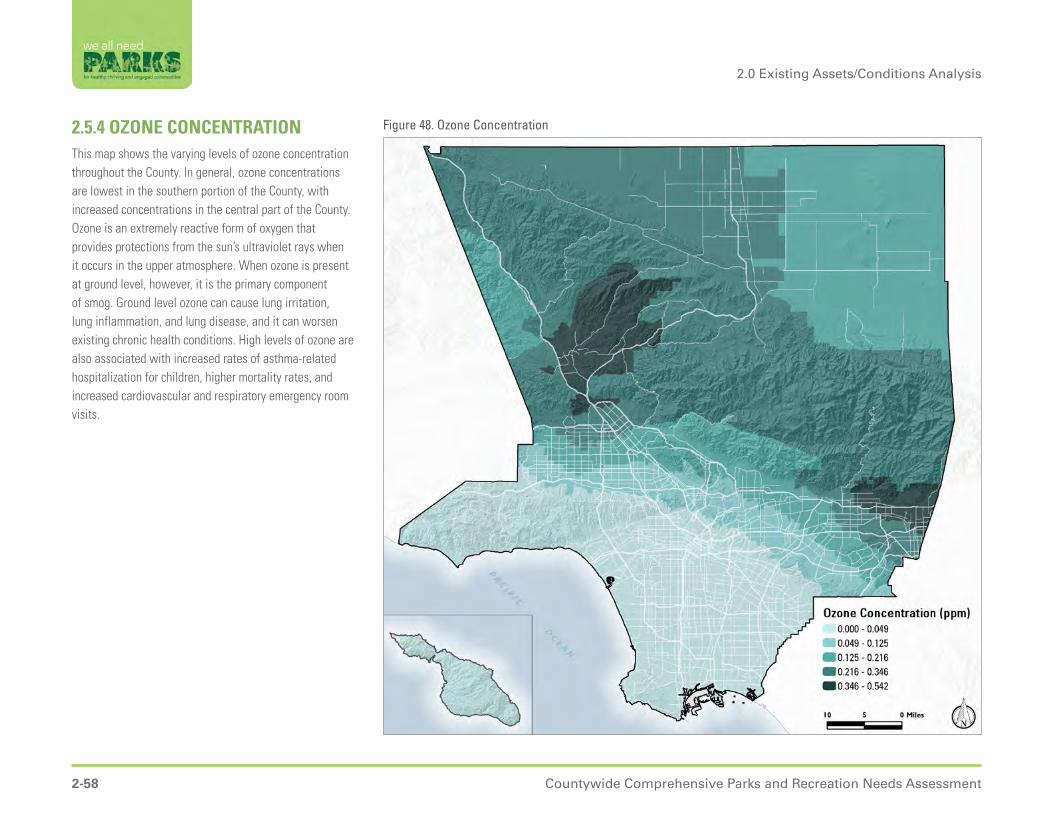
2.0 Existing Assets/Conditions Analysis
2-58 Countywide Comprehensive Parks and Recreation Needs Assessment
Figure 48. Ozone Concentration2.5.4 OZONE CONCENTRATIONThis map shows the varying levels of ozone concentration throughout the County. In general, ozone concentrations are lowest in the southern portion of the County, with increased concentrations in the central part of the County. Ozone is an extremely reactive form of oxygen that provides protections from the sun’s ultraviolet rays when it occurs in the upper atmosphere. When ozone is present at ground level, however, it is the primary component of smog. Ground level ozone can cause lung irritation, lung inflammation, and lung disease, and it can worsen existing chronic health conditions. High levels of ozone are also associated with increased rates of asthma-related hospitalization for children, higher mortality rates, and increased cardiovascular and respiratory emergency room visits.
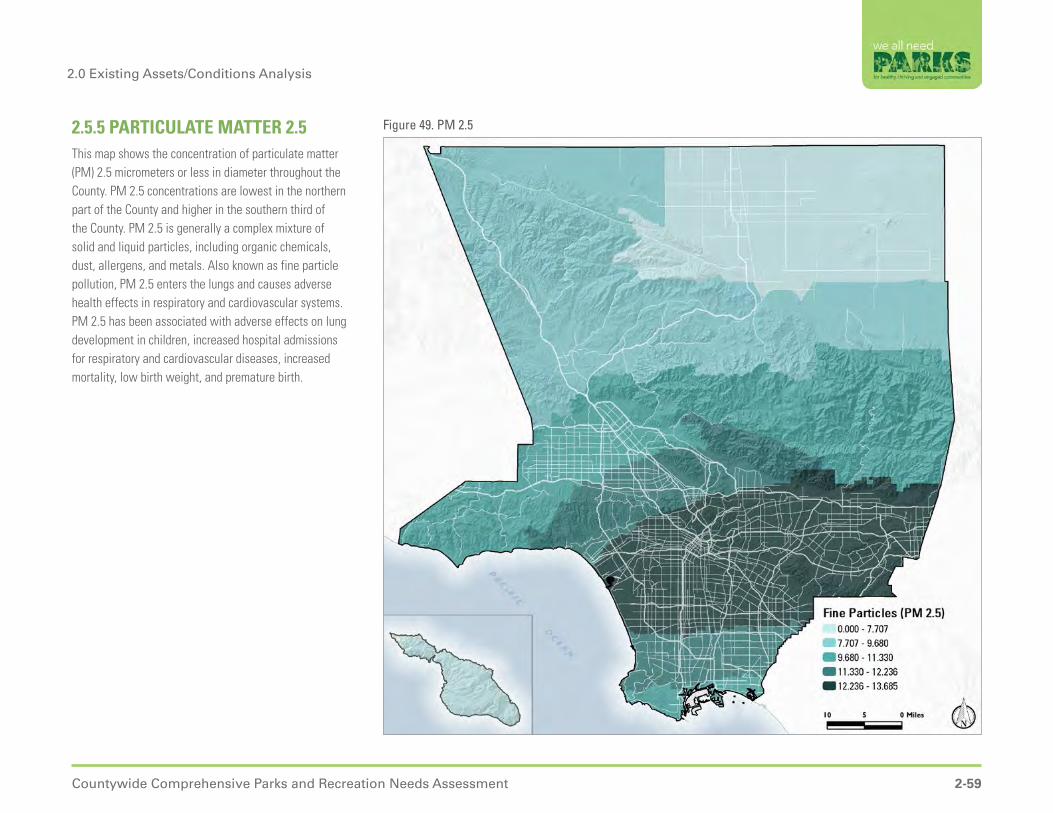
2-59Countywide Comprehensive Parks and Recreation Needs Assessment
2.0 Existing Assets/Conditions Analysis
Figure 49. PM 2.52.5.5 PARTICULATE MATTER 2.5This map shows the concentration of particulate matter (PM) 2.5 micrometers or less in diameter throughout the County. PM 2.5 concentrations are lowest in the northern part of the County and higher in the southern third of the County. PM 2.5 is generally a complex mixture of solid and liquid particles, including organic chemicals, dust, allergens, and metals. Also known as fine particle pollution, PM 2.5 enters the lungs and causes adverse health effects in respiratory and cardiovascular systems. PM 2.5 has been associated with adverse effects on lung development in children, increased hospital admissions for respiratory and cardiovascular diseases, increased mortality, low birth weight, and premature birth.
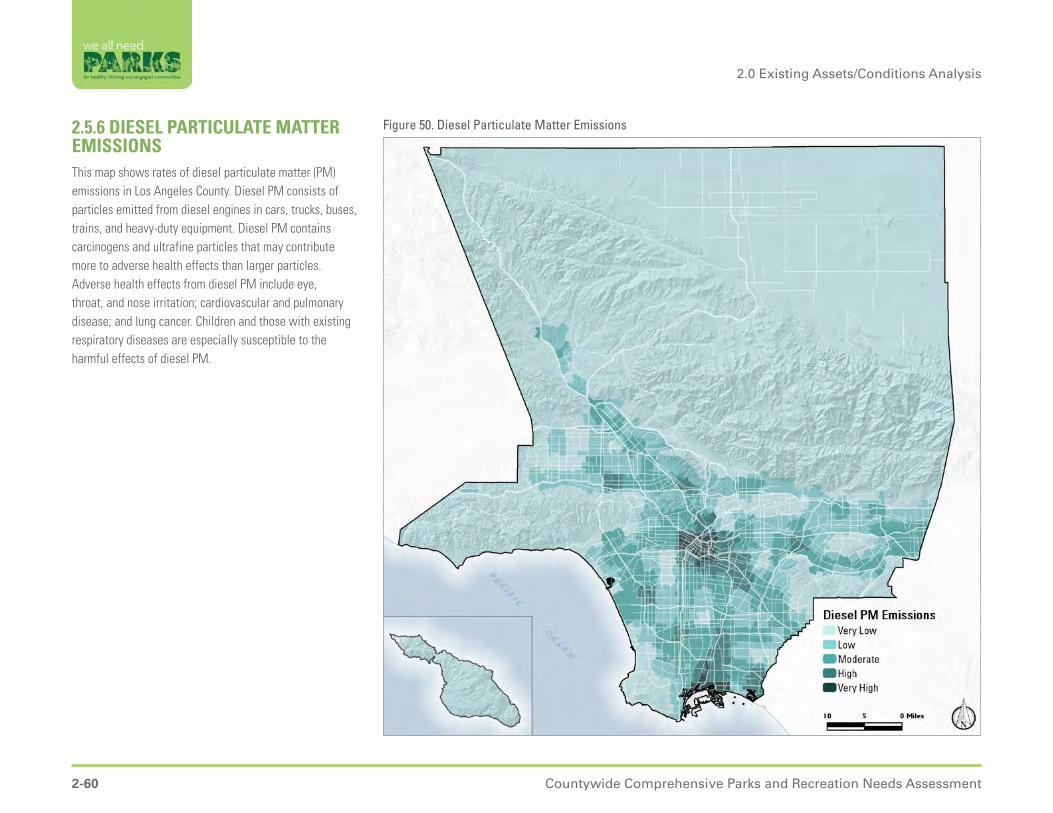
2.0 Existing Assets/Conditions Analysis
2-60 Countywide Comprehensive Parks and Recreation Needs Assessment
Figure 50. Diesel Particulate Matter Emissions2.5.6 DIESEL PARTICULATE MATTER EMISSIONSThis map shows rates of diesel particulate matter (PM) emissions in Los Angeles County. Diesel PM consists of particles emitted from diesel engines in cars, trucks, buses, trains, and heavy-duty equipment. Diesel PM contains carcinogens and ultrafine particles that may contribute more to adverse health effects than larger particles. Adverse health effects from diesel PM include eye, throat, and nose irritation; cardiovascular and pulmonary disease; and lung cancer. Children and those with existing respiratory diseases are especially susceptible to the harmful effects of diesel PM.

2-61Countywide Comprehensive Parks and Recreation Needs Assessment
2.0 Existing Assets/Conditions Analysis
Densely populated and built-out urban areas are typically the most park poor and have very limited land available for development. Under these constrained conditions, it is important to look at all the land resources available for development. The first step to doing this is to analyze the data developed and managed by the Los Angeles County Assessor.
All City-owned, County-owned, and other publicly owned vacant parcels throughout the County were selected from the Assessor’s data and overlaid on the final park need map. The map was provided as part of the Facilitator Toolkit, affording each Study Area the opportunity to verify existing potential park sites and note other potential future opportunity sites in their Study Area.
Using an interactive online mapping tool, participating agencies verified that 725 of these vacant parcels were potential future park opportunity sites.
2.6 POTENTIAL PARK LAND OPPORTUNITIESFigure 51. Sample Map of Park Land Opportunities
East Los Angeles Northwest Study Area

2.0 Existing Assets/Conditions Analysis
2-62 Countywide Comprehensive Parks and Recreation Needs Assessment
This page intentionally left blank.


3.0 Park Needs Framework
3-64 Countywide Comprehensive Parks and Recreation Needs Assessment
The analysis of the five park metrics in each Study Area produced highly detailed information about park need in each Study Area. In particular, the “Where Are Parks Most Needed?” map illustrated the location and magnitude of need in each Study Area.
Many Study Areas have three or more levels of park need. A multi-colored map that reflects that complexity is useful at the local level to help agencies understand need within their jurisdiction. However, because individual jurisdictions and unincorporated communities are often treated as single entities for large-scale planning and funding efforts, it was also important to assign a single need category to each Study Area in the County.
Building on the analysis completed for each Study Area, the Parks Needs Framework uses the park metrics to determine a single level of park need for each Study Area (see figure 52).
3.1.1 METHODOLOGYFour steps were used to calculate a single level of park need for each Study Area.
First, the percentages of the population in “high” and “very high” need areas were added. Each Study Area was then classified into one of five initial park need categories, based on the total percentage of population in “high” and “very high” need areas in that Study Area.
After this initial sorting, a layer of information about amenities, park access, and population was added and used to modify the initial park need level.
3.1 COUNTYWIDE ASSESSMENT OF PARK NEEDFigure 52. Comparison of “Where are Parks Most Needed” map from East Los Angeles Northwest Study Area and Summarized Map of Need for Entire Study Area
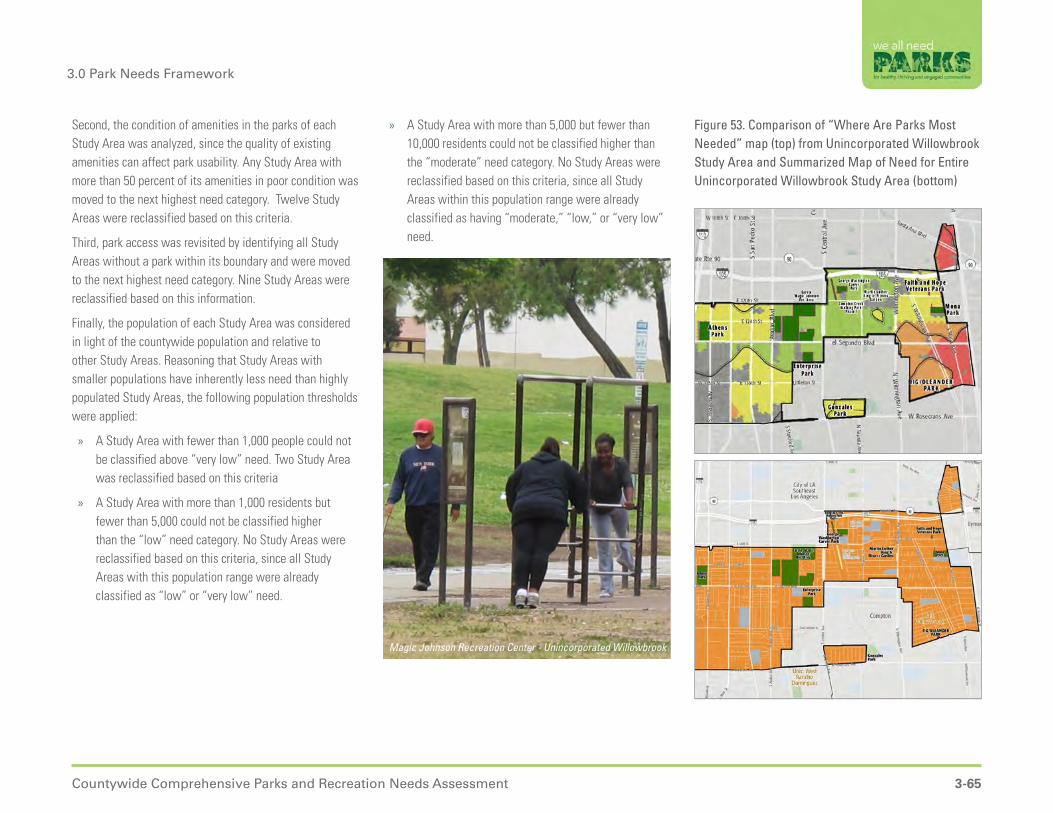
3-65Countywide Comprehensive Parks and Recreation Needs Assessment
3.0 Park Needs Framework
Second, the condition of amenities in the parks of each Study Area was analyzed, since the quality of existing amenities can affect park usability. Any Study Area with more than 50 percent of its amenities in poor condition was moved to the next highest need category. Twelve Study Areas were reclassified based on this criteria.
Third, park access was revisited by identifying all Study Areas without a park within its boundary and were moved to the next highest need category. Nine Study Areas were reclassified based on this information.
Finally, the population of each Study Area was considered in light of the countywide population and relative to other Study Areas. Reasoning that Study Areas with smaller populations have inherently less need than highly populated Study Areas, the following population thresholds were applied:
» A Study Area with fewer than 1,000 people could not be classified above “very low” need. Two Study Area was reclassified based on this criteria
» A Study Area with more than 1,000 residents but fewer than 5,000 could not be classified higher than the “low” need category. No Study Areas were reclassified based on this criteria, since all Study Areas with this population range were already classified as “low” or “very low” need.
Figure 53. Comparison of “Where Are Parks Most Needed” map (top) from Unincorporated Willowbrook Study Area and Summarized Map of Need for Entire Unincorporated Willowbrook Study Area (bottom)
» A Study Area with more than 5,000 but fewer than 10,000 residents could not be classified higher than the “moderate” need category. No Study Areas were reclassified based on this criteria, since all Study Areas within this population range were already classified as having “moderate,” “low,” or “very low” need.
Magic Johnson Recreation Center - Unincorporated Willowbrook

3.0 Park Needs Framework
3-66 Countywide Comprehensive Parks and Recreation Needs Assessment
3.1.2 RESULTSThe Park Need Framework analysis shows that more than 50 percent of the County’s population lives in areas of high or very high park need (see Figure 54). Study Areas with high park need have an average of 1.6 acres of park land, while Study Areas with very high need have less than an acre of park land per 1,000 (see Figure 55).
Study Areas in high park need would have to add a combined total of more than 3,250 acres of new park land in order to provide the County average of 3.3 acres per 1,000 residents. Study Areas with very high need would need to add a combined total of more than 8,600 acres of new park land in order to provide 3.3 acres per 1,000 residents, as shown in Figure 56.
The maps in Figure 57 and 58, along with the information in Table 4, show how park need varies in magnitude across the County.
Very High Need (43 Study Areas)
County Average:
3.3acres per
1,000
0.7
High Need (29 Study Areas)
1.6
Moderate Need (44 Study Areas)
11.5
Low Need (37 Study Areas)
12.5
Very Low Need (33 Study Areas)
52.0
Figure 54. Percentage of Countywide Population in Each Park Need Category
Figure 56. Additional Acres Needed
Figure 55. Average Acres Per 1,000 in Each Park Need Category
26.2%Moderate Need
4.6%Very Low Need
20.4%High Need
16.5%Low Need
32.2%Very High Need
Note: 0.1% Not Participating
POPULATION
Very High Need (43 Study Areas)
County Average:
3.3acres per
1,000
0.7acres per
1,000
1.6acres per
1,000
High Need (29 Study Areas)
2,058 acres existing park
3,521 acres existing park
8,600 acres additional
park land needed to provide
3.3 acres per 1,000
3,250 acres additional
park land needed to provide
3.3 acres per 1,000

3-67Countywide Comprehensive Parks and Recreation Needs Assessment
3.0 Park Needs Framework
Figure 57. Park Need by Study Area Los Angeles County, North

3.0 Park Needs Framework
3-68 Countywide Comprehensive Parks and Recreation Needs Assessment
Figure 58. Park Need by Study Area Los Angeles County, South

3-69Countywide Comprehensive Parks and Recreation Needs Assessment
3.0 Park Needs Framework
Table 4. Park Need By Study Area
ID # STUDY AREA NAMEPARK NEED CATEGORY
1 City of Hidden Hills Not Participating
2 City of Rolling Hills Not Participating
3 City of Vernon / Uninc. Vernon Very Low
4 Unincorporated Covina - San Dimas Low
5 Unincorporated Covina Islands Moderate
6 Unincorporated Leona Valley-Lake Hughes Low
7 City of Bradbury / Uninc. Bradbury Very Low
8 City of San Marino Very Low
9 Unincorporated Acton/ Uninc. South Antelope Valley Very Low
10 Unincorporated Agua Dulce - Angeles National Forest- Canyon Country Low
11 Unincorporated Charter Oak Islands High
12 Unincorporated Compton Low
13 Unincorporated Del Aire High
14 Unincorporated La Crescenta - Montrose Very Low
15 Unincorporated Lennox Very High
16 Unincorporated Malibu Low
17 Unincorporated Northeast Antelope Valley Very Low
18 Unincorporated Northwest Antelope Valley Low
19 Unincorporated Quartz Hill -Lancaster Moderate
20 Unincorporated San Jose Hills Moderate
21 Unincorporated Walnut Park Very High
22 Unincorporated West Athens-Westmont Very High
23 Unincorporated West Carson High
ID # STUDY AREA NAMEPARK NEED CATEGORY
24 Unincorporated West Rancho Dominguez Very Low
25 City of Industry Very Low
26 City of LA - Bel Air - Beverly Crest/ Uninc. Hollywood Hills Very Low
27 City of La Puente High
28 City of Temple City High
29 Unincorporated Angeles National Forest Low
30 Unincorporated East Los Angeles - Southeast Very High
31 Unincorporated East Rancho Dominguez Very High
32 Unincorporated East San Gabriel - Arcadia Very High
33 Unincorporated Monrovia Low
34 Unincorporated Hawthorne - Alondra Park Very High
35 Unincorporated Lake Los Angeles - Pearblossom - Liano - Valyermo Very Low
36 Unincorporated Littlerock Very Low
37 Unincorporated San Pasqual - East Pasadena Very Low
38 Unincorporated Santa Monica Mountains - Triunfo Canyon Very Low
39 Unincorporated Valinda Moderate
40 City of Artesia High
41 City of Hawaiian Gardens Moderate
42 City of La Habra Heights Very Low
43 City of LA - Harbor Gateway High
44 City of LA - Van Nuys - North Sherman Oaks Very High
45 City of LA - Westwood / Unincorporated Sawtelle VA Center Very High
46 City of Palos Verdes Estates Very Low

3.0 Park Needs Framework
3-70 Countywide Comprehensive Parks and Recreation Needs Assessment
ID # STUDY AREA NAMEPARK NEED CATEGORY
47 Unincorporated Altadena Low
48 Unincorporated Ladera Heights / View Park - Windsor Hills Very Low
49 Unincorporated Stevenson - Newhall Ranch Very Low
50 Unincorporated Bassett - West Puente Valley Very High
51 Unincorporated Pellissier Village - Avocado Heights Very Low
52 Unincorporated Sunrise Village - South San Gabriel - Whittier Narrows Low
53 City of Avalon - Channel Islands North Very Low
54 City of Baldwin Park Very High
55 City of Commerce Moderate
56 City of Cudahy Very High
57 City of Irwindale Very Low
58 City of LA - Canoga Park - Winnetka Very High
59 City of LA - Central City North High
60 City of LA - Northridge High
61 City of LA - Valley Glen - North Sherman Oaks High
62 City of Lomita Moderate
63 Unincorporated Marina del Rey Moderate
64 Unincorporated Topanga Canyon - Topanga Very Low
65 Unincorporated West Whittier - Los Nietos Low
66 City of La Canada Flintridge Very Low
67 City of LA - Westchester - Playa del Rey - Los Angeles International Airport
High
68 City of LA - Wilshire - Koreatown Very High
69 City of Lancaster - Eastside Moderate
70 Unincorporated East Los Angeles - Northwest Very High
ID # STUDY AREA NAMEPARK NEED CATEGORY
71 City of Bell Very High
72 City of Huntington Park Very High
73 City of LA - Granada Hills - Knollwood Moderate
74 City of Lawndale Very High
75 City of Malibu Very Low
76 City of Maywood Very High
77 City of Monrovia Low
78 City of South El Monte/ Uninc. El Monte - Whittier Narrows Low
79 City of Westlake Village Very Low
80 Unincorporated Florence-Firestone Very High
81 City of Agoura Hills Very Low
82 City of Alhambra High
83 City of LA - Baldwin Hills - Leimert - Hyde Park High
84 City of LA - Sherman Oaks - Studio City - Toluca Lake - Cahuenga Pass / Uninc. Universal City
Low
85 City of LA - West Los Angeles High
86 City of Rolling Hills Estates / Unincorporated Westfield Very Low
87 City of San Fernando High
88 City of South Gate Very High
89 City of South Pasadena Low
90 City of West Hollywood Very High
91 Unincorporated Castaic Moderate
92 Unincorporated Rowland Heights Moderate
93 City of Covina Moderate
94 City of LA - North Hollywood - Valley Village Very High

3-71Countywide Comprehensive Parks and Recreation Needs Assessment
3.0 Park Needs Framework
ID # STUDY AREA NAMEPARK NEED CATEGORY
95 City of LA - Reseda - West Van Nuys High
96 City of LA - Sylmar Moderate
97 City of Long Beach Central Low
98 City of Rosemead Moderate
99 Unincorporated - Hacienda Heights - Whittier Low
100 City of Bellflower Very High
101 City of Calabasas Very Low
102 City of Gardena High
103 City of LA - Hollywood - North Moderate
104 City of LA - Hollywood - South Very High
105 City of LA - Palms - Mar Vista - Del Rey Very High
106 City of LA - Venice Very High
107 City of LA - West Adams Very High
108 City of LA - Wilshire - West High
109 City of Lynwood - Uninc. Lynwood High
110 City of Pico Rivera Low
111 City of San Gabriel Moderate
112 City of Sierra Madre Very Low
113 Unincorporated Willowbrook High
114 City of Bell Gardens Very High
115 City of El Monte Very High
116 City of Inglewood Very High
117 City of LA - Arleta - Pacoima High
118 City of LA - Central City Very High
ID # STUDY AREA NAMEPARK NEED CATEGORY
119 City of LA - South Los Angeles Very High
120 City of LA - Sun Valley - La Tuna Canyon High
121 City of LA - Wilmington - Harbor City / City of LA Port of Los Angeles Moderate
122 City of Lancaster - Westside Moderate
123 City of Long Beach North High
124 City of Palmdale - Eastside / Uninc. South Antelope Valley Low
125 City of Palmdale - Westside Low
126 City of Santa Fe Springs Low
127 Unincorporated Azusa Moderate
128 City of Hermosa Beach Moderate
129 City of LA - Brentwood - Pacific Palisades Moderate
130 City of LA - Mission Hills - Panorama City - North Hills Very High
131 City of Montebello Moderate
132 City of Pasadena - Eastside / Uninc. Kinneloa Mesa Moderate
133 City of Walnut Very Low
134 Unincorporated South Whittier - East La Mirada Moderate
135 City of LA - Boyle Heights Very High
136 City of LA - Encino - Tarzana Moderate
137 City of La Mirada Moderate
138 City of LA - Silver Lake - Echo Park - Elysian Valley Moderate
139 City of LA - Sunland - Tujunga - Lake View Terrace - Shadow Hills Low
140 City of Paramount Very High
141 City of Signal Hill Very Low
142 City of Compton High
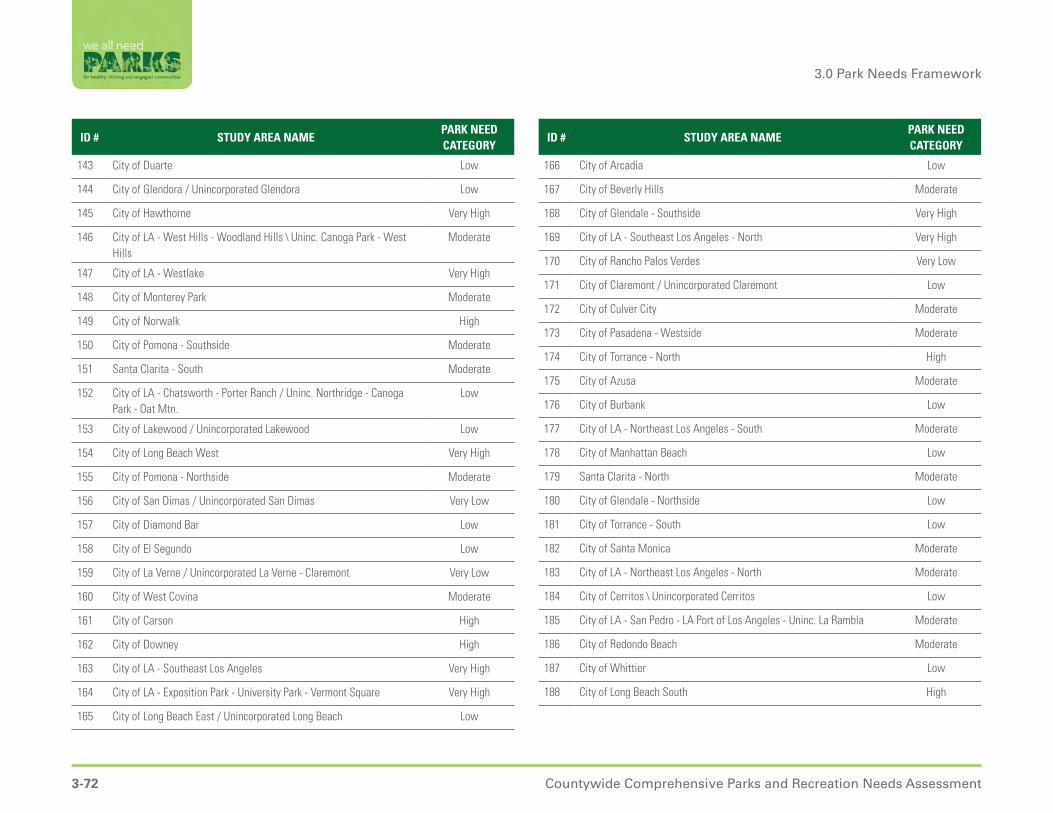
3.0 Park Needs Framework
3-72 Countywide Comprehensive Parks and Recreation Needs Assessment
ID # STUDY AREA NAMEPARK NEED CATEGORY
143 City of Duarte Low
144 City of Glendora / Unincorporated Glendora Low
145 City of Hawthorne Very High
146 City of LA - West Hills - Woodland Hills \ Uninc. Canoga Park - West Hills
Moderate
147 City of LA - Westlake Very High
148 City of Monterey Park Moderate
149 City of Norwalk High
150 City of Pomona - Southside Moderate
151 Santa Clarita - South Moderate
152 City of LA - Chatsworth - Porter Ranch / Uninc. Northridge - Canoga Park - Oat Mtn.
Low
153 City of Lakewood / Unincorporated Lakewood Low
154 City of Long Beach West Very High
155 City of Pomona - Northside Moderate
156 City of San Dimas / Unincorporated San Dimas Very Low
157 City of Diamond Bar Low
158 City of El Segundo Low
159 City of La Verne / Unincorporated La Verne - Claremont Very Low
160 City of West Covina Moderate
161 City of Carson High
162 City of Downey High
163 City of LA - Southeast Los Angeles Very High
164 City of LA - Exposition Park - University Park - Vermont Square Very High
165 City of Long Beach East / Unincorporated Long Beach Low
ID # STUDY AREA NAMEPARK NEED CATEGORY
166 City of Arcadia Low
167 City of Beverly Hills Moderate
168 City of Glendale - Southside Very High
169 City of LA - Southeast Los Angeles - North Very High
170 City of Rancho Palos Verdes Very Low
171 City of Claremont / Unincorporated Claremont Low
172 City of Culver City Moderate
173 City of Pasadena - Westside Moderate
174 City of Torrance - North High
175 City of Azusa Moderate
176 City of Burbank Low
177 City of LA - Northeast Los Angeles - South Moderate
178 City of Manhattan Beach Low
179 Santa Clarita - North Moderate
180 City of Glendale - Northside Low
181 City of Torrance - South Low
182 City of Santa Monica Moderate
183 City of LA - Northeast Los Angeles - North Moderate
184 City of Cerritos \ Unincorporated Cerritos Low
185 City of LA - San Pedro - LA Port of Los Angeles - Uninc. La Rambla Moderate
186 City of Redondo Beach Moderate
187 City of Whittier Low
188 City of Long Beach South High


4.0 Potential Park Projects & Cost Estimates
4-74 Countywide Comprehensive Parks and Recreation Needs Assessment
The Parks Needs Assessment invited input from all communities in the County regarding desired park projects, and reports potential park projects from three sources: projects prioritized at community workshops in each Study Area; projects submitted by the managing agency of a regional recreation park; and projects submitted by the managing agencies of specialized facilities. As outlined in Table 5, the locations of projects, engagement process, and number of projects submitted varied by project source. These criteria were reviewed by the Steering Committee.
These potential park project lists are not intended to supersede or replace any planning documents, nor to obligate any agency to implement the included projects. Project lists simply provide a snapshot in time of potential projects agreed upon by workshop participants or agency staff to best meet park and recreational needs at the time of the Parks Needs Assessment
4.1.1 PRIORITIZED PARK PROJECTS
i. Project Definition
The Parks Needs Assessment developed a narrow definition of a potential park project. Limiting the scope of what could be considered a single project helped ensure that prioritized projects were of a similar magnitude across all Study Areas, assisted communities in clarifying their project priorities, and increased the consistency of cost estimates.
To qualify as a project within the Parks Needs Assessment, two criteria had to be met for any potential project:
4.1 POTENTIAL PARK PROJECTS
» Site Specific - each project had to be located at a single physical location within the Study Area boundary. The location could be an existing local park, regional recreation park, regional open space, or natural area; or it could be an unspecified location if the project was the construction of a new park.
» Amenity Specific - each project could only address a single amenity type. Multiple installations of the given amenity were considered a single project.
PROJECT SOURCE PROJECT LOCATIONSENGAGEMENT PROCESS
NUMBER OF PROJECTS
Community Workshops conducted by Lead Agency of each Study Area
Local ParksRegional Recreation ParksRegional Open Space FacilitiesNatural AreasNew Park Locations
Workshops in Participating Study Areas
Up to 10 per Study Area
Regional Recreation Park Agencies Regional Recreation ParksRegional Open Space Facilities
Optional Park User Meeting
Up to 5 per park
Specialized Facilities: Agencies Operating Open Space & Nature Centers Note: Only local public agencies were eligible to submit projects
Local Parks (if Nature Center)Regional Recreation Parks (if Nature Center)Regional Open Space FacilitiesNatural Areas
Self Assessment of Need Completed by Agency
Maximum of 3 per facility, 5 per Agency per Study Area. Total max. of 20 per Agency
Specialized Facilities: Agencies Operating Regional Specialty Facilities Note: Only local public agencies were eligible to submit projects
Local ParksRegional Recreation ParksRegional Open Space FacilitiesNatural Areas
Self Assessment of Need Completed by Agency
Maximum of 3 per facility, 5 per Agency per Study Area. Total max. of 20 per Agency
For those projects focused solely on infrastructure (restrooms, signage, parking lots, walkways, security lighting, park furniture, irrigation, vegetation/landscaping and fencing) these two criteria were interpreted as follows:
» Site Specific - all infrastructure systems in a single physical location could be addressed as a single project.
» Amenity Specific - a single type of infrastructure could be addressed at all parks within the Study Area.
Table 5. Potential Park Project Submittal Criteria

4-75Countywide Comprehensive Parks and Recreation Needs Assessment
4.0 Potential Park Projects & Cost Estimates
Because the purpose of the Parks Needs Assessment was to gain an understanding of the physical needs of parks and recreational facilities, projects involving improvements to programming, traffic signals, crosswalks, ongoing maintenance, and public safety—although important and often needed—were determined to be outside of the scope of the Parks Needs Assessment and were not included in the final project lists.
In addition to a strict definition of what constituted a project, the Parks Needs Assessment also established a point-based structure and assigned points based on the specific type of improvement to further ensure consistency in project magnitude from Study Area to Study Area. For example, a project consisting of the replacement of all tennis courts at a park was assigned a single point, while a project consisting of constructing an entire new park was assigned three points. For further explanation of the point-based criteria, please refer to Figure 59. Project lists for each Study Area could not exceed ten points, regardless of how many individual projects were submitted. For this reason, some project lists contained fewer than ten projects but in fact total ten points.
Every project was classified into one of the following categories: add or replace an amenity type at an existing park; repair an existing amenity type at an existing park; or construct a new park or specialty facility.
ii. Project Lists
The map and overview of existing parks and the results of the park metrics analysis were shared with participants at each Study Area’s community workshop (Figure 60). Workshop facilitators were trained to use the data to guide a participatory discussion about park need in the Study Area and to identify park projects that could potentially meet the documented park need. Facilitators were encouraged to acknowledge and discuss any suggestions for projects that did not meet the Parks Needs Assessment project criteria (such as requests for crosswalks), and to share such feedback with the agencies and departments responsible for those types of improvements.
At each workshop, the result of this discussion was a comprehensive list of potential park projects for the Study Area, including projects in local parks, regional recreation parks, regional open space, and natural areas.
Figure 59. Point-Based Project Criteria
Review existing parks and metrics.
Develop comprehensive list of potential projects.
Prioritize list of top ten park projects.
1-Point Project Examples
+ Repair or replace a single amenity type at one existing park
+ Add a single amenity type at an existing park
+ Add a single amenity type at a proposed/new park
+ Repair, replace, or add a single type of general infrastructure at all parks within the study area
+ Repair or replace all general infrastructure at one existing park
+ Add or repair multi-purpose recreational trails within one existing park
+ Construct a new multi-purpose recreational trail outside of an existing park (where no land acquisition, general infrastructure, or amenities are required)
2-Point Project Examples
+ Construct a new park or specialty facility—including all general infrastructure and 2 amenity types (where no land acquisition is required);
+ Construct a new multi-purpose recreational trail outside of an existing park—where either (but not both) land acquisition or general infrastructure is needed
3-Point Project Examples
+ Construct a new park, specialty facility, or multi-purpose recreational trail outside of an existing park—including land acquisition, all general infrastructure, and 2 amenity types
1-Point Project Examples
2-Point Project Examples
3-Point Project Examples
Figure 60. Community Workshops Flowchart

4.0 Potential Park Projects & Cost Estimates
4-76 Countywide Comprehensive Parks and Recreation Needs Assessment
After the list of all potential projects was complete, workshop participants engaged in a participatory prioritization exercise to identify the top ten projects in their Study Area (Figure 61). In most cases, this list of ten prioritized projects was reviewed internally by each lead agency prior to being submitted to the Parks Needs Assessment team. Facilitators were trained to inform workshop participants about any review or adjustment processes that the list of priority projects would undergo.
Figure 61. Sample Project Prioritization FormsIn some cases, the projects were reviewed by lead agency staff to ensure that they were feasible in light of site and other constraints and that they did not conflict with local policies. Additionally, smaller-scale projects with existing plans and established funding streams may have been removed from the list of prioritized projects in order to create room for other projects with a greater need for funding.
Facilitators were also trained to communicate that a project’s inclusion on the list was not a promise to complete that project. Facilitators informed participants that the list of prioritized projects would be used to:
» Let the County know which park projects were most important in their community
» Generate a cost estimate of park need in the County
» Inform potential future Countywide park funding decisions
» Contribute to future Countywide park planning decisions
The list of ten prioritized projects was submitted to the Parks Needs Assessment team by the lead agency for each Study Area. The consultant team reviewed each list for adherence to project criteria and in some cases made modifications to the lists to ensure that projects conformed to the established project definitions. Consultants worked closely with lead agencies to help them understand project definitions and make any necessary modifications prior to submission. Every attempt was made to uphold the integrity of the community’s prioritized selections.
As shown in Figure 62, workshop participants prioritized the repair of existing park amenities more frequently than other types of projects. Among repair projects, the most frequently prioritized address general infrastructure, restrooms, and community centers.
Projects to add new amenities to exiting parks were prioritized more frequently than projects to construct new parks, but less frequently than projects to repair or replace existing amenities.

4-77Countywide Comprehensive Parks and Recreation Needs Assessment
4.0 Potential Park Projects & Cost Estimates
Figure 62. Most Frequently Prioritized Park Projects, by Project Type
The majority of Study Areas prioritized at least one new park among their projects. A total of 200 new park projects were prioritized in 138 Study Areas, as shown in Figure 63. Several Study Areas prioritized more than one new park.
For the list of projects prioritized in each Study Area, refer to Appendix A.
Figure 63. Study Areas Prioritizing a New Park
Projects to Add New Amenities to Existing Parks
Dog ParkProjects
Walking Path/Trail Projects
Community Center Projects
34%
80 75 60
Projects to Repair or Replace Existing Amenities
Community Center Projects
RestroomProjects
Infrastructure Projects
46%
155 60 25
Projects for Constructing New Parks
New Park Projects
20%
200
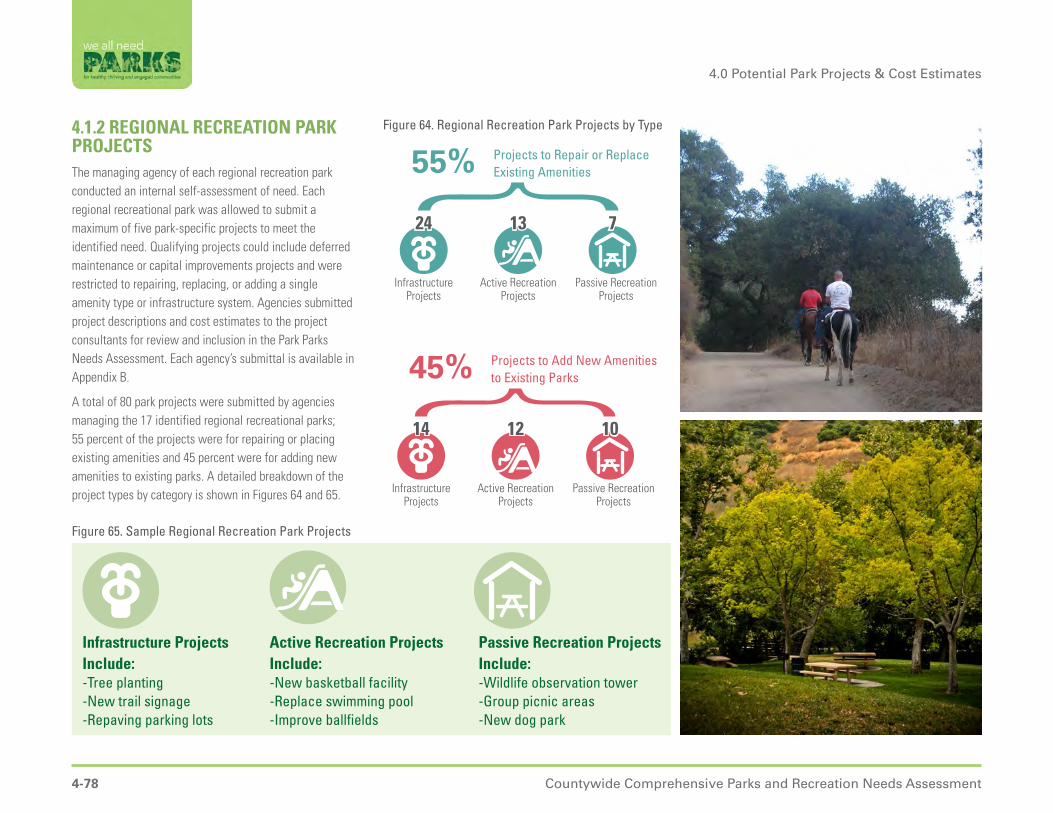
4.0 Potential Park Projects & Cost Estimates
4-78 Countywide Comprehensive Parks and Recreation Needs Assessment
4.1.2 REGIONAL RECREATION PARK PROJECTSThe managing agency of each regional recreation park conducted an internal self-assessment of need. Each regional recreational park was allowed to submit a maximum of five park-specific projects to meet the identified need. Qualifying projects could include deferred maintenance or capital improvements projects and were restricted to repairing, replacing, or adding a single amenity type or infrastructure system. Agencies submitted project descriptions and cost estimates to the project consultants for review and inclusion in the Park Parks Needs Assessment. Each agency’s submittal is available in Appendix B.
A total of 80 park projects were submitted by agencies managing the 17 identified regional recreational parks; 55 percent of the projects were for repairing or placing existing amenities and 45 percent were for adding new amenities to existing parks. A detailed breakdown of the project types by category is shown in Figures 64 and 65.
Figure 64. Regional Recreation Park Projects by Type
Figure 65. Sample Regional Recreation Park Projects
Projects to Repair or Replace Existing Amenities
Projects to Add New Amenities to Existing Parks
Passive Recreation Projects
Passive Recreation Projects
Active RecreationProjects
Active Recreation Projects
Infrastructure Projects
Infrastructure Projects
55%
45%
24
14
13
12
7
10
Active Recreation Projects Include:-New basketball facility-Replace swimming pool-Improve ballfields
Infrastructure Projects Include:-Tree planting-New trail signage-Repaving parking lots
Passive Recreation Projects Include:-Wildlife observation tower-Group picnic areas-New dog park
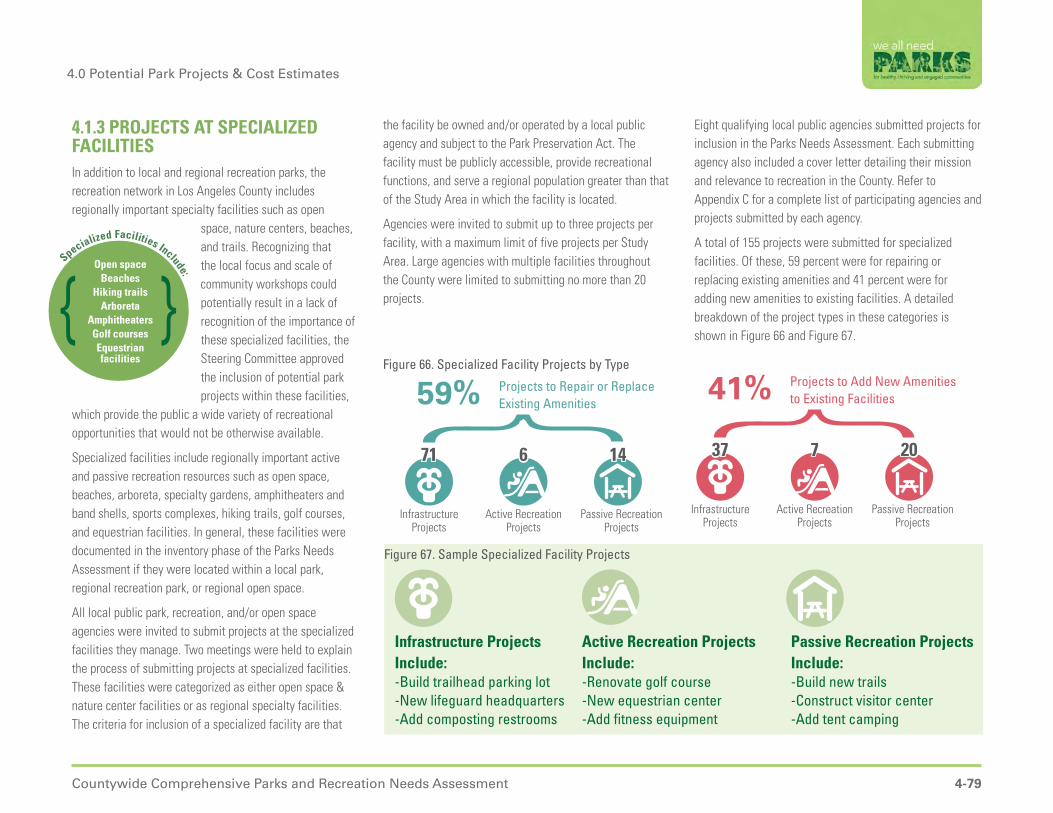
4-79Countywide Comprehensive Parks and Recreation Needs Assessment
4.0 Potential Park Projects & Cost Estimates
4.1.3 PROJECTS AT SPECIALIZED FACILITIESIn addition to local and regional recreation parks, the recreation network in Los Angeles County includes regionally important specialty facilities such as open
space, nature centers, beaches, and trails. Recognizing that the local focus and scale of community workshops could potentially result in a lack of recognition of the importance of these specialized facilities, the Steering Committee approved the inclusion of potential park projects within these facilities,
which provide the public a wide variety of recreational opportunities that would not be otherwise available.
Specialized facilities include regionally important active and passive recreation resources such as open space, beaches, arboreta, specialty gardens, amphitheaters and band shells, sports complexes, hiking trails, golf courses, and equestrian facilities. In general, these facilities were documented in the inventory phase of the Parks Needs Assessment if they were located within a local park, regional recreation park, or regional open space.
All local public park, recreation, and/or open space agencies were invited to submit projects at the specialized facilities they manage. Two meetings were held to explain the process of submitting projects at specialized facilities. These facilities were categorized as either open space & nature center facilities or as regional specialty facilities. The criteria for inclusion of a specialized facility are that
Figure 66. Specialized Facility Projects by Type
Projects to Repair or Replace Existing Amenities
Passive Recreation Projects
Active RecreationProjects
Infrastructure Projects
59%
71 6 14
Projects to Add New Amenities to Existing Facilities
Passive Recreation Projects
Active Recreation Projects
Infrastructure Projects
41%
37 7 20
Specialized Facilities Include:
Open space Beaches
Hiking trailsArboreta
Amphitheaters Golf coursesEquestrian facilities
Figure 67. Sample Specialized Facility Projects
Active Recreation Projects Include:-Renovate golf course-New equestrian center-Add fitness equipment
Infrastructure Projects Include:-Build trailhead parking lot-New lifeguard headquarters-Add composting restrooms
Passive Recreation Projects Include:-Build new trails-Construct visitor center-Add tent camping
the facility be owned and/or operated by a local public agency and subject to the Park Preservation Act. The facility must be publicly accessible, provide recreational functions, and serve a regional population greater than that of the Study Area in which the facility is located.
Agencies were invited to submit up to three projects per facility, with a maximum limit of five projects per Study Area. Large agencies with multiple facilities throughout the County were limited to submitting no more than 20 projects.
Eight qualifying local public agencies submitted projects for inclusion in the Parks Needs Assessment. Each submitting agency also included a cover letter detailing their mission and relevance to recreation in the County. Refer to Appendix C for a complete list of participating agencies and projects submitted by each agency.
A total of 155 projects were submitted for specialized facilities. Of these, 59 percent were for repairing or replacing existing amenities and 41 percent were for adding new amenities to existing facilities. A detailed breakdown of the project types in these categories is shown in Figure 66 and Figure 67.

4.0 Potential Park Projects & Cost Estimates
4-80 Countywide Comprehensive Parks and Recreation Needs Assessment
Planning-level cost estimates were developed to provide a rough order-of-magnitude estimate of the dollar amount needed to implement identified projects and complete deferred maintenance work Countywide. Cost estimates for prioritized projects and deferred maintenance were developed by the Parks Needs Assessment team and apply a standardized set of cost estimates to each project. Due to the unique needs of both regional recreation parks and specialized facilities, cost estimates for projects at these facilities were submitted by the managing agency of each facility.
4.2.1 METHODOLOGY Standardized cost estimates were developed for land acquisition, projects to construct new amenities or completely replace existing amenities, and projects to repair existing amenities.
These costs were developed by the consultant team and DPR staff using a number of sources:
» Recently completed work by the County of Los Angeles, City of Los Angeles, other public agencies in the State, and landscape architectural staff from the consultant team
» Commercial construction and real estate datasets
» Third-party cost estimators with experience in park construction cost estimation in the County of Los Angeles
4.2 COST ESTIMATES: COUNTYWIDE TRENDSi. Land Acquisition Costs
Land acquisition costs were developed for each Study Area for use in estimating the cost of projects requiring land acquisition. Data from two commercial real estate analytics sources (CoStar and LoopNet) were used to estimate these costs. When available, average sales price per acre for vacant land was used. If no vacant land sales data were available, the land value component of average sales price per acre for residential and nonresidential property sales was used. If no sales were reported in a Study Area, the average asking price per acre was used.
ii. New Construction/Amenity Replacement Costs
A set of standard construction costs for new construction/ amenity replacement was developed for the 16 amenities inventoried in the Web Portal, individual park infrastructure components, and unique amenities prioritized at community workshops. Starting with cost information from a commercial construction database (RSMeans), these numbers were modified by landscape architectural staff from the consultant team. The estimates were then reviewed and further fine-tuned by staff from DPR, the City of Los Angeles, and third-party cost estimators.
These standardized costs were used as a template to calculate costs for all priority projects identified Countywide that involved constructing new parks, adding new amenities or infrastructure to an existing park, or completely replacing an existing amenity or type
of infrastructure. They were also used for all deferred maintenance projects that required replacing existing amenities or infrastructure.
iii. Repair Cost Estimates
The methodology for developing standardized repair costs was based on field survey and assessment of amenities that jurisdictions had rated “fair.” A sample of parks was selected across the County to ensure that the field-inspected parks represented a fair cross-section of the region’s income levels, as a proxy for the fiscal resources available to the jurisdiction. Five income brackets were identified and five randomly selected parks were inspected in each income bracket. Only parks with amenities rated “fair” were inspected.
Field inspectors examined amenities rated “fair” to determine the cost of repairing them to bring them up to “good” condition. Needed repairs were identified and summarized for these amenities. As an example, a baseball
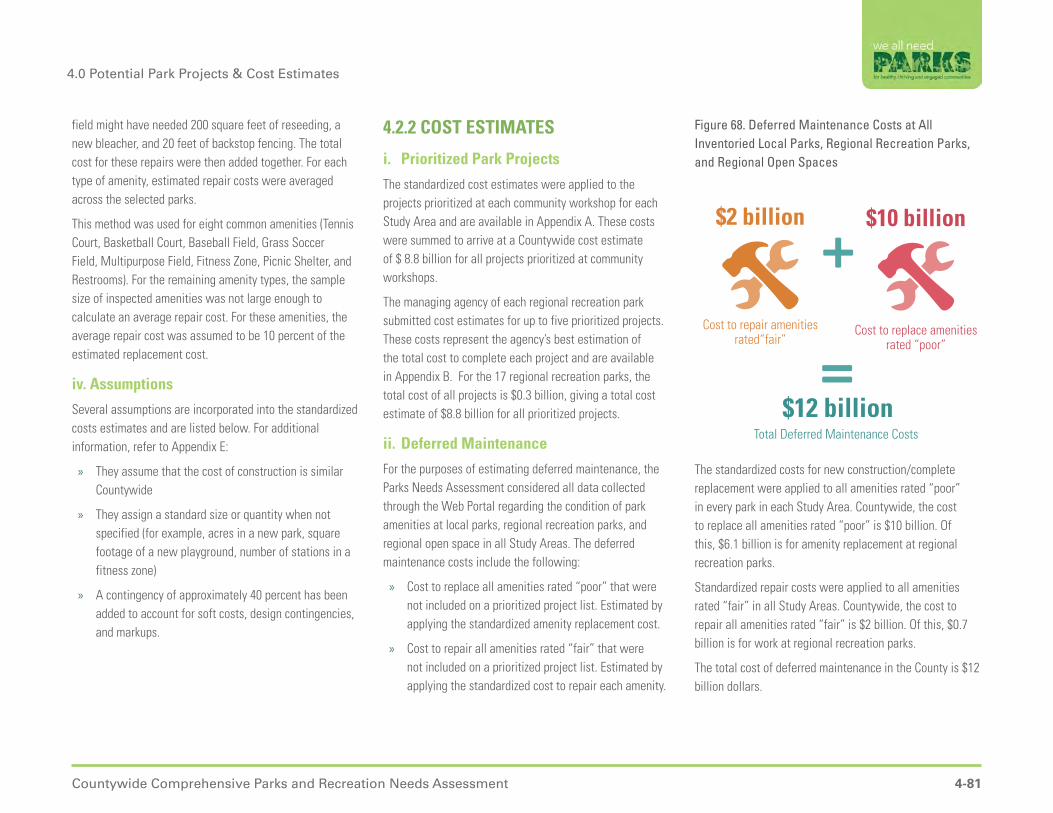
4-81Countywide Comprehensive Parks and Recreation Needs Assessment
4.0 Potential Park Projects & Cost Estimates
field might have needed 200 square feet of reseeding, a new bleacher, and 20 feet of backstop fencing. The total cost for these repairs were then added together. For each type of amenity, estimated repair costs were averaged across the selected parks.
This method was used for eight common amenities (Tennis Court, Basketball Court, Baseball Field, Grass Soccer Field, Multipurpose Field, Fitness Zone, Picnic Shelter, and Restrooms). For the remaining amenity types, the sample size of inspected amenities was not large enough to calculate an average repair cost. For these amenities, the average repair cost was assumed to be 10 percent of the estimated replacement cost.
iv. Assumptions
Several assumptions are incorporated into the standardized costs estimates and are listed below. For additional information, refer to Appendix E:
» They assume that the cost of construction is similar Countywide
» They assign a standard size or quantity when not specified (for example, acres in a new park, square footage of a new playground, number of stations in a fitness zone)
» A contingency of approximately 40 percent has been added to account for soft costs, design contingencies, and markups.
4.2.2 COST ESTIMATES
i. Prioritized Park Projects
The standardized cost estimates were applied to the projects prioritized at each community workshop for each Study Area and are available in Appendix A. These costs were summed to arrive at a Countywide cost estimate of $ 8.8 billion for all projects prioritized at community workshops.
The managing agency of each regional recreation park submitted cost estimates for up to five prioritized projects. These costs represent the agency’s best estimation of the total cost to complete each project and are available in Appendix B. For the 17 regional recreation parks, the total cost of all projects is $0.3 billion, giving a total cost estimate of $8.8 billion for all prioritized projects.
ii. Deferred Maintenance
For the purposes of estimating deferred maintenance, the Parks Needs Assessment considered all data collected through the Web Portal regarding the condition of park amenities at local parks, regional recreation parks, and regional open space in all Study Areas. The deferred maintenance costs include the following:
» Cost to replace all amenities rated “poor” that were not included on a prioritized project list. Estimated by applying the standardized amenity replacement cost.
» Cost to repair all amenities rated “fair” that were not included on a prioritized project list. Estimated by applying the standardized cost to repair each amenity.
$10 billion
Cost to replace amenities rated “poor”
$2 billion
Cost to repair amenities rated“fair”
$12 billionTotal Deferred Maintenance Costs
Figure 68. Deferred Maintenance Costs at All Inventoried Local Parks, Regional Recreation Parks, and Regional Open Spaces
The standardized costs for new construction/complete replacement were applied to all amenities rated “poor” in every park in each Study Area. Countywide, the cost to replace all amenities rated “poor” is $10 billion. Of this, $6.1 billion is for amenity replacement at regional recreation parks.
Standardized repair costs were applied to all amenities rated “fair” in all Study Areas. Countywide, the cost to repair all amenities rated “fair” is $2 billion. Of this, $0.7 billion is for work at regional recreation parks.
The total cost of deferred maintenance in the County is $12 billion dollars.

4.0 Potential Park Projects & Cost Estimates
4-82 Countywide Comprehensive Parks and Recreation Needs Assessment
iii. Specialized Facilities Projects
The Parks Needs Assessment recognized the importance of specialty facilities which attract community members across the region. Specialty facilities provide vital resources such as open space, arboreta, specialty gardens, amphitheaters and band shells, sports complexes, hiking trails, golf courses, and equestrian facilities. All cities within the County of Los Angeles plus managing agencies of specialty facilities that met the criteria set forth in Section 4.1.3, Projects at Specialized Facilities, were invited to submit projects for their respective specialty facilities. The managing agency of each specialized facility submitted cost estimates for up to three projects per facility. These costs represent the agency’s best estimation of the total cost to complete each project and are available in Appendix C. The total cost of these projects is $0.7 billion.
iv. Total Cost Estimate
The total rough order-of-magnitude cost to implement projects identified by communities and managing agencies, as well as differed maintenance, is $21.5 billion dollars.
$8.8 billion
Prioritized Projects at
Local Parks Regional Recreation Parks
Regional Open Space and
Natural Areas
$21.5 billion
Figure 69. Countywide Cost Estimates
$12 billion
Deferred Maintenanceat
Local Parks Regional Recreation Parks
Regional Open Space
$0.7 billion
Specialized Facilitiesat
Local Parks Regional Recreation Parks
Regional Open Space and
Natural Areas

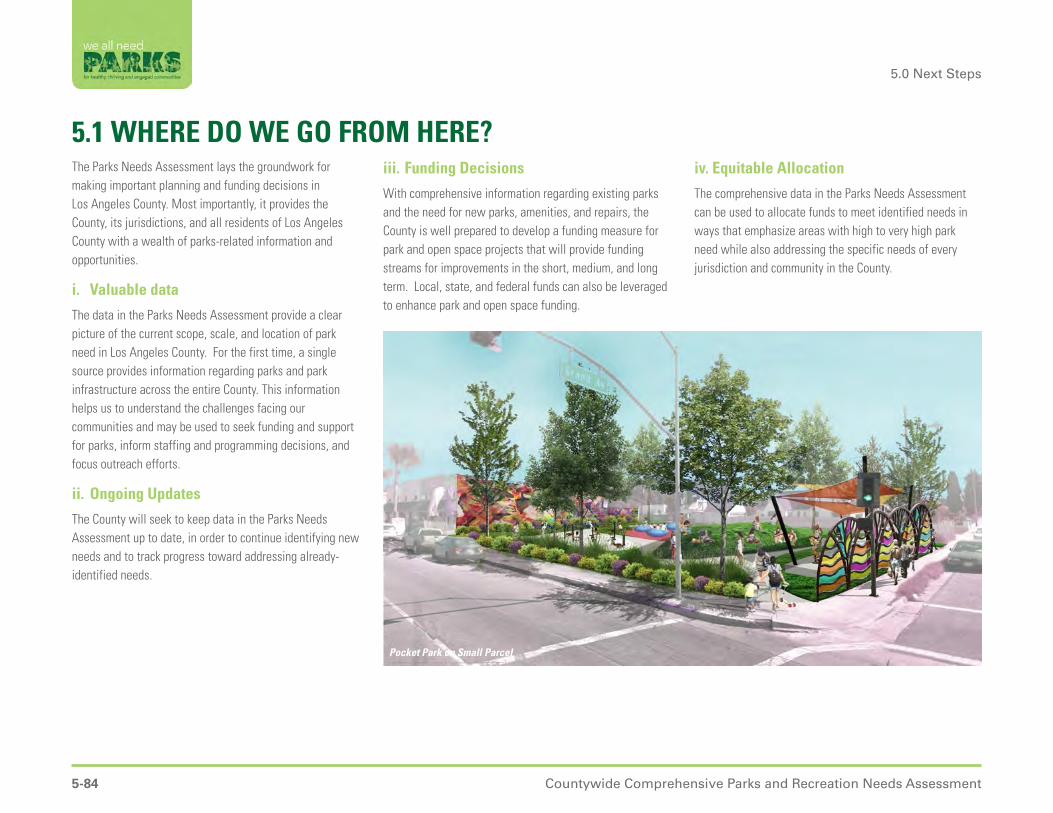
5.0 Next Steps
5-84 Countywide Comprehensive Parks and Recreation Needs Assessment
The Parks Needs Assessment lays the groundwork for making important planning and funding decisions in Los Angeles County. Most importantly, it provides the County, its jurisdictions, and all residents of Los Angeles County with a wealth of parks-related information and opportunities.
i. Valuable data
The data in the Parks Needs Assessment provide a clear picture of the current scope, scale, and location of park need in Los Angeles County. For the first time, a single source provides information regarding parks and park infrastructure across the entire County. This information helps us to understand the challenges facing our communities and may be used to seek funding and support for parks, inform staffing and programming decisions, and focus outreach efforts.
ii. Ongoing Updates
The County will seek to keep data in the Parks Needs Assessment up to date, in order to continue identifying new needs and to track progress toward addressing already-identified needs.
5.1 WHERE DO WE GO FROM HERE?iii. Funding Decisions
With comprehensive information regarding existing parks and the need for new parks, amenities, and repairs, the County is well prepared to develop a funding measure for park and open space projects that will provide funding streams for improvements in the short, medium, and long term. Local, state, and federal funds can also be leveraged to enhance park and open space funding.
Pocket Park on Small Parcel
iv. Equitable Allocation
The comprehensive data in the Parks Needs Assessment can be used to allocate funds to meet identified needs in ways that emphasize areas with high to very high park need while also addressing the specific needs of every jurisdiction and community in the County.

5-85Countywide Comprehensive Parks and Recreation Needs Assessment
5.0 Next Steps
v. National Model
The Parks Needs Assessment serves as a model for a clear, replicable process that other jurisdictions across the country can use when they assess their regionwide park facilities and needs.
vi. New Solutions to Provide Needed Parks
The Parks Needs Assessment shows that high park need exists in many areas of the County. Local agencies will need to find innovative solutions to provide essential park infrastructure in these communities, as many are densely populated and lack vacant land. Underutilized land, utility corridors, alleys, and other public lands should all be considered as potential locations for new parks. Additionally, creative partnerships, such as joint use and reuse with schools, hospitals, libraries, and other facilities should be considered in order to expand park opportunities and meet recreational needs.
Parks and open spaces make significant impacts on the everyday lives of residents, providing valuable spaces for active and passive recreation, social engagement, and community connectivity. They can also provide important ecological services, including enhancing and protecting waterways, reducing the urban heat island effect, conserving water, and reducing energy consumption.
The construction of new parks and enhancement of existing parks that will occur as the cities and unincorporated communities of the County move to address high levels of park need creates an opportunity to build the types of thriving multi-benefit parks that will contribute to public health and well-being, create a sense of place, increase community cohesion, improve the environment, and boost the economy in every community in Los Angeles County.
Park Located in Utility Easement
Active Linear Park Joint-use Park
5.0 Next Steps
5-86 Countywide Comprehensive Parks and Recreation Needs Assessment
LOS ANGELES COUNTY DEPARTMENT OF PARKS AND RECREATION STAFF
» John Wicker, Director of Parks and Recreation
» Norma E. Garcia, Deputy Director, Planning and Development Agency
» Rita Robinson, Project Director
» Clement Lau, Departmental Facilities Planner ll
» Sheela Kleinknecht, Park Planner
» Over 100 staff members who helped facilitate community workshops, evaluated amenity conditions, reviewed costs, and determined projects for regional recreation parks and specialized facilities
LOS ANGELES COUNTY REGIONAL PARK AND OPEN SPACE DISTRICT
» Jane I. Beesley, District Administrator
» Warren Ontiveros, Administration Section Manager
INCORPORATED CITIES OF LOS ANGELES COUNTY
» Over 175 staff members in 86 cities who entered data into the Park Assets Inventory Web Portal, attended trainings, reached out to their communities, facilitated workshops, and coordinated with the consultant team
RESIDENTS OF LOS ANGELES COUNTY
» Thousands of County residents shared their thoughts about parks in Los Angeles County
LOS ANGELES COUNTY BOARD OF SUPERVISORS
» Hilda L. Solis, 1st District
» Mark Ridley-Thomas, 2nd District
» Sheila Kuehl, 3rd District
» Don Knabe, 4th District
» Michael D. Antonovich, 5th District
SUPERVISORIAL DISTRICT STAFF » Javier Hernandez, 1st District
» Teresa Villegas, 1st District
» Lacey Johnson, 2nd District
» Karly Katona, 2nd District
» Maria Chong-Castillo, 3rd District
» Erin Stibal, 4th District
» Sussy Nemer, 5th District
» David Perry, 5th District
LOS ANGELES COUNTY PARKS AND RECREATION COMMISSION
» Ed P. Reyes, 1st District
» Mayisha Akbar, 2nd District
» Bettina Duval, 3rd District
» John Hsu, 4th District » William J. Korek, 5th District
ACKNOWLEDGMENTS CONSULTANT TEAM »
– David Early, Principal; Isabelle Minn, Principal; C.C. LaGrange, Project Manager; Rob Mazur, Project GIS Manager
» GreenInfo Network
» DakeLuna Consultants
» David Taussig & Associates
» MIG
» Prevention Institute
STEERING COMMITTEE MEMBERSIn memoriam: Steering Committee member Mary Kaufman, avid trail supporter and enthusiast.
» Greg Alaniz, Community Services Manager, City of Whittier, Gateway Cities Council of Governments Representative
» Jane I. Beesley, Regional Operations Manager, Los Angeles County Regional Park and Open Space District
» Alina Bokde, Executive Director, Los Angeles Neighborhood Land Trust, Community Based Organization Representative
» Brad Bolger, Senior Manager, Los Angeles County Chief Executive Office (CEO)
» William Warren Brien, Councilmember, City of Beverly Hills, Westside Cities Council of Governments Representative
5-87Countywide Comprehensive Parks and Recreation Needs Assessment
5.0 Next Steps
STEERING COMMITTEE MEMBERS, CONT’D
» John Bwarie, Executive Director, San Fernando Valley Council of Governments Representative
» Scott Chan, Program Director, Asian Pacific Islander Obesity Prevention Alliance (APIOPA), Community Based Organization Representative
» Maria Chong-Castillo, Deputy, Supervisorial District 3
» Kimel Conway, South Coast Botanic Gardens Foundation, Community-at-Large Representative
» Cheryl Davis, Recording Secretary, Crescenta Valley Town Council, Community-at-Large Representative
» Reyna Diaz, Duarte Unified School District, Community-at-Large Representative
» Bettina Duval, Los Angeles County Parks and Recreation Commissioner, Community-at-Large Representative
» Belinda V. Faustinos, San Gabriel Mountains Forever, Community Based Organization Representative
» Norma E. Garcia, Deputy Director, Los Angeles County Department of Parks and Recreation
» Phil Hester, Campfire Angels Council, Community Based Organization Representative
» Michael Hughes, Hacienda Heights Improvement Association, Community-at-Large Representative
» Lacey Johnson, Deputy, Supervisorial District 2
» John Jones, Community Service Director, City of Torrance, South Bay Cities Council of Governments Representative
» Amy Lethbridge, Deputy Executive Officer, Mountains Recreation and Conservation Authority, Community-at-Large Representative
» James Lott, Community-at-Large Representative
» Linda Lowry, City Manager, City of Pomona, San Gabriel Valley Council of Governments Representative
» Michael McCaa, Chief Financial Officer, MBA, Drew League Foundation, Community Based Organization Representative
» Sandra McNeill, Executive Director, T.R.U.S.T South LA, Community Based Organization Representative
» Martha Molina-Aviles, Program Manager, Community Centers, Los Angeles County Department of Community and Senior Services
» Veronica Padilla, Executive Director, Pacoima Beautiful, Community Based Organization Representative
» Ronda Perez, Parks, Recreation and Arts Director, City of Lancaster
» David Perry, Deputy, Supervisorial District 5
» Adriana Pinedo, Health Policy Coordinator, Day One, Community Based Organization Representative
» Jennifer Pippard, Interim Director of Community Investments, First 5 LA
» Ed P. Reyes, LA County Parks Commissioner, Community-at-Large Representative
» Barbara Romero, Deputy Mayor, City of Los Angeles
» Jeff Rubin, Director of Community Services, City of Calabasas, Las Virgenes Malibu Council of Governments Representative
» Bruce Saito, Director, California Conservation Corps
» Harry Saltzgaver, City of Long Beach Water Commissioner, Community-at-Large Representative
» Dr. Paul Simon, MD, Los Angeles County Department of Public Health
» Keri Smith, Recreation and Culture Director, City of Palmdale
» Christopher Solek, Programs Director, Council for Watershed Health, Community-at-Large Representative
» Erin Stibal, Deputy, Supervisorial District 4
» Teresa Villegas, Deputy, Supervisorial District 1

5.0 Next Steps
5-88 Countywide Comprehensive Parks and Recreation Needs Assessment
TECHNICAL ADVISORY COMMITTEE MEMBERS
» Javier Aguilar, Senior Regional Planner, Southern California Association of Governments
» Lee Butterfield, Policy Development Manager, Office of Grants and Local Services, California State Parks
» Nick Franchino, GIS Manager, Geographic Information Systems Section, Los Angeles County Department of Regional Planning
» Mark Greninger, Geographic Information Officer, Los Angeles County Chief Information Office
» Su Jin Lee, Lecturer, Spatial Science Institute, University of Southern California
» Weimin Li, Associate Professor, Department of Landscape Architecture, California State Polytechnic University, Pomona
» Douglas Morales, Epidemiologist/GIS Coordinator, Los Angeles County Department of Public Health
» Viktor Patiño, Manager, Office of Grants and Local Service, California State Parks
» Patricia Pendleton, Project Manager, Center for Geographical Studies, California State University, Northridge
NON-PROFIT ORGANIZATIONS » Amigos de Los Rios
» Bike San Gabriel Valley
» From Lot to Spot
» Go Day One
» Korean Youth and Community Center
» Los Angeles Neighborhood Land Trust
» Mujeres de la Tierra
» William C. Velasquez Institute

5.0 Next Steps
5-89 Countywide Comprehensive Parks and Recreation Needs Assessment
APPENDICESAppendices can be viewed and downloaded from the project website: http://lacountyparkneeds.org/final-report/
Appendix A - Study Area Profiles
Each Study Area Profile contains a base map, park metrics, map of where parks are most needed, amenity quantities and conditions, park need framework, project cost estimates, submitted project reporting forms and community engagement form.
Appendix B – Regional Recreation Park Projects
Project lists and cost estimates submitted by the managing agency of each regional recreation park.
Appendix C – Specialized Facilities Projects
Project lists and cost estimates as submitted by the managing agencies of specialized facilities such as open space, beaches, hiking trails, arboreta, amphitheaters, golf courses, and equestrian facilities.
Appendix D – Resources Provided to Partners
» Web Portal User Guide and Amenity Condition Definitions
» Sample Toolkit (includes facilitator training manual)
» Survey Results
Appendix E – Technical Resources
» Data Sources
» Mapping and Analysis Information
» Cost Estimate Assumptions


